Embed Size (px)
Citation preview
Quantification of Risk Profiles for Atmosphere and Groundwater
25 January 2013
Office of Fossil Energy
NRAP-TRS-III-003-2013
Disclaimer
This report was prepared as an account of work sponsored by an agency of the
United States Government. Neither the United States Government nor any agency
thereof, nor any of their employees, makes any warranty, express or implied, or
assumes any legal liability or responsibility for the accuracy, completeness, or
usefulness of any information, apparatus, product, or process disclosed, or
represents that its use would not infringe privately owned rights. Reference
therein to any specific commercial product, process, or service by trade name,
trademark, manufacturer, or otherwise does not necessarily constitute or imply its
endorsement, recommendation, or favoring by the United States Government or
any agency thereof. The views and opinions of authors expressed therein do not
necessarily state or reflect those of the United States Government or any agency
thereof.
This report (LA-UR-13-20483) has been reviewed by Los Alamos National
Laboratory and approved for public release.
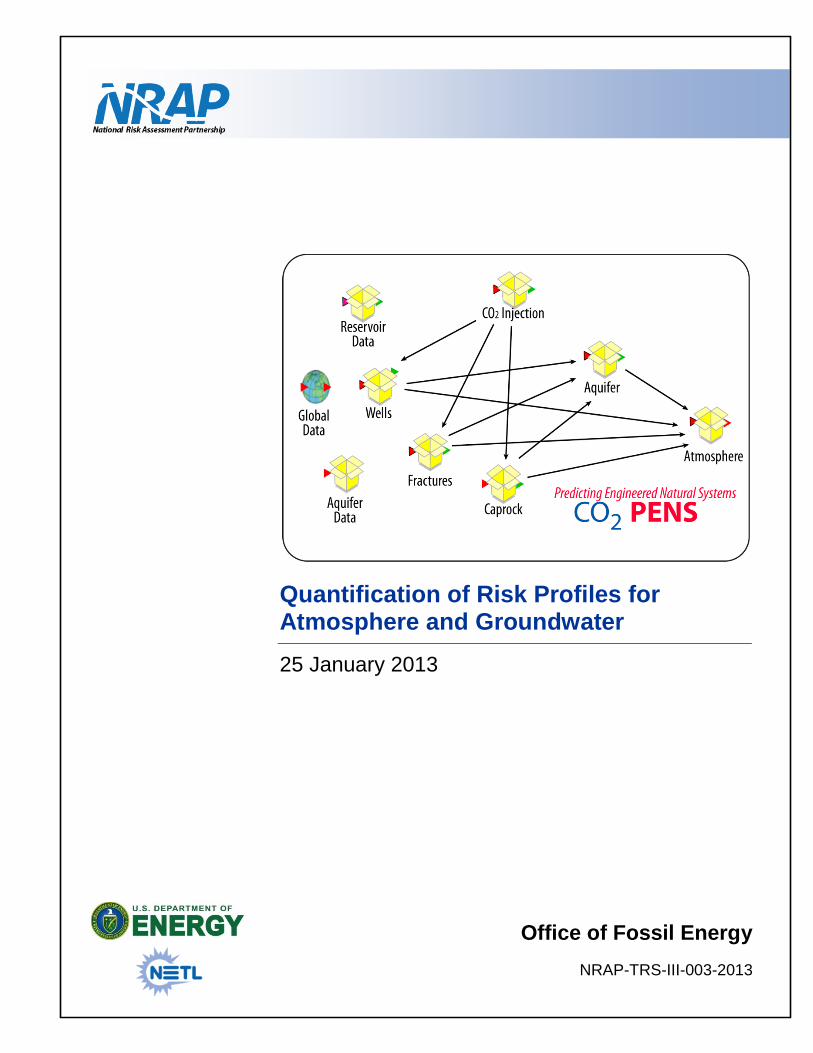
Cover Illustration: Schematic diagram of the CO2-PENS system architecture.
Suggested Citation: Pawar, R.; Bromhal, G.; Dilmore, R.; Foxall, B.; Jones, E.;
Oldenburg, C.; Stauffer, P.; Unwin, S.; Guthrie, G. Quantification of Risk Profiles for
Atmospheres and Groundwater; NRAP-TRS-III-003-2013; NRAP Technical Report
Series; U.S. Department of Energy, National Energy Technology Laboratory:
Morgantown, WV, 2013; p 28.
An electronic version of this report can be found at: www.netl.doe.gov/nrap
Quantification of Risk Profiles for Atmospheres and
Groundwater
Rajesh Pawar1, Grant Bromhal
2, Robert Dilmore
3, Bill Foxall
4, Edwin Jones
4,
Curtis Oldenburg5, Philip Stauffer
1, Stephen Unwin
6, and George Guthrie
3
1Earth and Environmental Sciences Division, Los Alamos National
Laboratory, 4200 W Jemez Road #300, Los Alamos, NM 87545 2Office of Research and Development, National Energy Technology
Laboratory, 3610 Collins Ferry Road, Morgantown, WV 26507 3Office of Research and Development, National Energy Technology
Laboratory, 626 Cochrans Mill Road, Pittsburgh, PA 15236
4Lawrence Livermore National Laboratory, 7000 East Avenue, Livermore,
CA 94550 5Earth Sciences Division, Lawrence Berkeley National Laboratory, 1
Cyclotron Road, Berkeley, CA 94720 6Pacific Northwest National Laboratory, 902 Battelle Boulevard, Richland,
WA 99352
NRAP-TRS-III-003-2013
Level III Technical Report Series
25 January 2013

This page intentionally left blank.

Quantification of Risk Profiles for Atmospheres and Groundwater
I
Table of Contents
1. EXECUTIVE SUMMARY ....................................................................................................1
2. INTRODUCTION...................................................................................................................3
3. INTEGRATED ASSESSMENT MODEL ............................................................................5
4. IAM COMPONENT MODELS.............................................................................................7 4.1 STORAGE RESERVOIR ................................................................................................7 4.2 WELLBORES..................................................................................................................7
4.3 FAULTS ..........................................................................................................................8 4.4 CAPROCK .......................................................................................................................8 4.5 SHALLOW AQUIFERS .................................................................................................8
4.6 ATMOSPHERE ...............................................................................................................9
5. CO2-PENS ..............................................................................................................................11 5.1 ARCHITECTURE .........................................................................................................11 5.2 INTERFACE..................................................................................................................12
5.3 OUTPUT ........................................................................................................................13
6. EXAMPLE RISK-PROFILE CALCULATION ................................................................15 6.1 UNCERTAINTY QUANTIFICATION CALCULATIONS ........................................17
7. CONCLUSIONS ...................................................................................................................19 7.1 IAM LIMITATIONS .....................................................................................................19 7.2 PLANS FOR SECOND-GENERATION TOOLSET ...................................................19
8. REFERENCES ......................................................................................................................21
Quantification of Risk Profiles for Atmospheres and Groundwater
II
List of Figures Figure 1: Sub-systems within IAM structure being developed by NRAP. ......................................5
Figure 2: System Model Structure for CO2-PENS. .......................................................................11
Figure 3: A schematic diagram showing an example of the order of various ROMs used
to calculate CO2 leakage impacts in CO2-PENS. ...................................................................12
Figure 4: Two of the dashboards used to provide inputs to CO2-PENS. a) Main input
dashboard. b) Dashboard for providing reservoir related inputs. ..........................................13
Figure 5: Example for outputs in CO2-PENS. a) Main output dashboard. b) An example
results graph. ..........................................................................................................................13
Figure 6: Example leakage rate curves and average leak rate. ......................................................16
Figure 7: Sub-systems within IAM structure being developed by NRAP. ....................................17
List of Tables Table 1: Correlation coefficients for uncertainty analysis of atmospheric CO2 leak rate. ............17

Quantification of Risk Profiles for Atmospheres and Groundwater
III
Acronyms and Abbreviations Term Description
CCS CO2 capture and storage
CO2-PENS CO2-Predicting Engineered Natural Systems
CSLF Carbon Sequestration Leadership Forum
DLL Dynamic link library
FEHM Finite Element Heat and Mass transport code
IAM Integrated Assessment Model
IPCC Intergovernmental Panel on Climate Change
LANL Los Alamos National Laboratory
LBNL Lawrence Berkeley National Laboratory
LHS Latin Hypercube Sampling
LLNL Lawrence Livermore National Laboratory
LUT Look-up table
MARS Multi-variate adaptive regression spline
NRAP National Risk Assessment Partnership
NETL National Energy Technology Laboratory
NUFT Nonisothermal, Unsaturated Flow and Transport with Chemistry
code
PNNL Pacific Northwest National Laboratory
ppm Parts per million
PSUADE Problem Solving environment for Uncertainty Analysis and
Design Exploration
ROM Reduced-order model
STOMP Subsurface Transport Over Multiple Phases
TDS Total dissolved solids
TOUGH2 Transport Of Unsaturated Groundwater and Heat
UQ Uncertainty quantification

Quantification of Risk Profiles for Atmospheres and Groundwater
IV
Acknowledgments This work was completed as part of National Risk Assessment Partnership (NRAP) project.
Support for this project came from the Department of Energy’s (DOE) Office of Fossil Energy’s
Crosscutting Research program. The authors wish to acknowledge Robert Romanosky (NETL
Strategic Center for Coal) and Regis Conrad (DOE Office of Fossil Energy) for programmatic
guidance, direction, and support.
The authors would like to acknowledge contributions from Robert Dilmore (NETL), Grant
Bromhal (NETL), George Guthrie (NETL), Philip Stauffer (LANL), Bruce Letellier (LANL),
Curt Oldenburg (LBNL), Lihua Pan (LBNL), Ed Jones (LLNL), Bill Foxall (LLNL) and Stephen
Unwin (PNNL). In addition contributions from NRAP working group members whose models
were used to develop the IAM are also appreciated. The working groups include Groundwater
Protection Working Group, Natural Seals Working Group, Wellbore Integrity Working Group,
and Reservoir Performance Working Group.
Quantification of Risk Profiles for Atmospheres and Groundwater
1
1. EXECUTIVE SUMMARY
This report summarizes National Risk Assessment Partnership (NRAP) efforts to develop an
approach to quantify risk profiles for atmospheres and aquifers at a CO2 storage site. We have
used a science-based prediction approach for computation of time-dependent profiles for leakage
risks at a CO2 storage site. The approach requires prediction of a storage site performance over
long time. We used an Integrated Assessment Model (IAM) in order to implement a system
modeling approach for predicting long term site behavior. The systems modeling approach treats
a storage site as a system made up of sub-systems such as storage reservoir, overlying seal,
wellbores, faults or other transport pathways, and shallow permeable zones including
groundwater systems, etc. The behavior of each of the components in the storage-site system is
predicted using reduced-order models (ROMs) based on detailed process-level simulations.
Different approaches were used to develop ROMs. A look-up table approach, which directly
incorporated reservoir simulation results, was used for the storage reservoir; a high-resolution
look-up table developed using Lawrence Livermore National Laboratory’s (LLNL) PSUADE
(Problem Solving environment for Uncertainty Analysis and Design Exploration) package and
based on Los Alamos National Laboratory’s (LANL) FEHM (Finite Element Heat and Mass
transport code) simulation results was used for leakage through cemented wellbores; a look-up
table, which directly incorporated simulation results performed using Lawrence Berkeley
National Laboratory’s (LBNL) TOUGH2 (Transport Of Unsaturated Groundwater and Heat
simulator) was used for leakage through open wellbores; high-order polynomial ROMs
developed using LLNL’s PSUADE package and based on detailed numerical simulations using
LANL’s FEHM code and Pacific Northwest National Laboratory’s (PNNL) STOMP (Subsurface
Transport Over Multiple Phases) code were used for shallow aquifers. The IAM was used for
first-generation risk profile calculation was built using LANL’s CO2-PENS (CO2-Predicting
Engineered Natural Systems) system model.
A hypothetical storage site consisting of a storage reservoir, wellbores, and a shallow aquifer was
used to develop risk profiles for three leakage metrics. The three metrics included volume of a
plume of pH<6.5 in shallow aquifer, volume of a plume of TDS > 500 ppm in shallow aquifer
and leakage of CO2 to atmosphere exceeding a cutoff. We performed Monte-Carlo simulations
with 1000 realizations, each sampling from multiple stochastic variables. Results of the Monte-
Carlo simulations were used to calculate the risk profiles for the metrics mentioned above as
probability of exceeding a given cutoff. The first-generation risk profiles are being used to
explore various questions related to long-term performance of a storage site such as what impact
does spatial density of wellbores have on whether a site can meet a 99 percent retention criterion.
We also performed uncertainty analysis to determine the relative impact of various stochastic
variables on the calculated risk profiles.

Quantification of Risk Profiles for Atmospheres and Groundwater
2
This page intentionally left blank.
Quantification of Risk Profiles for Atmospheres and Groundwater
3
2. INTRODUCTION
Deployment of carbon sequestration at large scale requires an efficient, comprehensive scientific
approach for assessing both the short- and long-term performance of natural and engineered
geologic systems spanning a range of geologic environments. CO2 storage operations may utilize
deep saline formations and will require prediction of CO2 movement/reactivity over large areas
and long periods of time. A range of ongoing field-scale efforts suggest that geologic sites can be
exploited to retain large volumes of injected CO2, although the long-term performance of these
systems needs to be assessed confidently with predictive models. To facilitate successful large-
scale deployment within the next decade or so, a robust, science-based risk assessment approach
is needed for potential uncertainties at specific storage sites to be well enough understood so that
data collection and monitoring are optimal and risks minimized.
Ensuring that large-scale CO2 storage is safe and effective requires predicting the long-term
integrity of storage sites as well as demonstrating the comprehensive consideration of potential
site-specific risks. The scale of storage sites makes science-based prediction challenging, and the
complexity and heterogeneity of natural systems imparts a degree of uncertainty to any
predictions, necessitating a stochastic component to the methodology. Most efforts to date have
relied on qualitative assessment of risks based on FEPs analysis, which relies on a catalogue of
Features of an engineered geologic system that impact its behavior, discrete Events that can
impact behavior, and other Processes that can influence its behavior (Cranwell and Guzowski,
1982; Chapman et al., 1995; Nirex, 1998). Quintessa has developed a detailed database of FEPs
that has been adapted for geologic storage of CO2 (Savage et al., 2004; Maul et al., 2005).
A quantitative methodology for predicting a site’s long-term performance—going beyond FEPs
analysis—is essential to the successful deployment of CO2 capture and storage (CCS) at a
commercial scale, where each storage project will represent significant capital investment and
will require sound, quantitative assessments of potential long-term liabilities. Calculation of risk
profiles is an approach to assessing the predicted performance of large-scale projects, serving as
an important tool for:
Comparison of potential site options
Quantification of long-term project costs and potential liabilities
Providing a basis for both operators and regulators to ensure that sites are characterized
and operated in a manner that minimizes key uncertainties and maximizes performance
Quantitative approaches to site performance can range from the process level numerical reservoir
simulators to the system level models such as CO2-PENS (CO2-Predicting Engineered Natural
Systems) (Stauffer et al., 2009). For both types of approaches, accurate quantification of the
parameters and process models that describe the engineered geologic system is fundamental to
the quality of the simulation and prediction. For geologic systems, the parameters describing a
system have uncertainty associated with them. Consequently, uncertainty quantification (UQ) is
a critical element of environmental risk assessments. Refsgaard, van der Sluijs, and coworkers
(van der Sluijs, 2007; Refsgaard et al., 2006; Refsgaard et al., 2007) present detailed assessments
of uncertainties and methodologies for natural systems.
The National Risk Assessment Partnership (NRAP) is developing an approach that relies on the
use of integrated assessment models (IAMs) to quantify storage-site performance through

Quantification of Risk Profiles for Atmospheres and Groundwater
4
calculation of risk profiles. The concept of risk profiles for using risk assessment to quantify
potential long-term liabilities was introduced by Benson (2007). Risk profiles provide a time
evolution of the probability of a particular risk, thereby allowing an assessment of the risk
integrated over a period of time (for example, post closure). Benson noted that potential risks
associated with CO2 storage will be time dependent, largely tracking the evolution of reservoir
pressure in response to injection and post-injection recovery and trapping mechanisms.
Consequently, Benson predicted that environmental risks will peak with injection and decline as
the storage reservoir pressures recover and various near-term and long-term trapping
mechanisms come into play. The risk-profile concept has proven very useful in conveying the
predicted qualitative evolution of risks. However, the validity of these profiles across a wide
range of sites has yet to be confirmed. Quantification of risk profiles is a necessary component in
the context of a technical basis for long-term liability. However, no defensible, robust
methodology has been developed for quantification of risk profiles for CO2 storage.
NRAP is utilizing an IAM approach, because it allows treatment of the storage site’s geologic
complexity, from the reservoir to the potential receptors. With IAMs, the site’s behavior is
predicted stochastically at the system level using reduced-order models (ROMs). The ROMs are
developed using a variety of process-level simulators and/or analytical expressions that represent
abstractions (when appropriate) and are based on detailed physical and chemical descriptions of
key subsystems at the sites. This approach provides the necessary science-basis to the risk
quantification approach. The IAM is used to assess long-term performance of a storage system in
order to predict the potential for a specific event or condition to occur, which can then be
coupled with a quantification of the event’s consequence/impact to derive the risk. .
There is broad international consensus on the main types of risks and adverse impacts that could
be associated with the long-term storage of CO2 (e.g., CSLF, 2009). NRAP is initially focusing
on risk profiles associated with several key potential impacts, including:
Return of CO2 to the atmosphere
Groundwater quality
Reservoir stress that could have adverse impacts on the geosphere

Quantification of Risk Profiles for Atmospheres and Groundwater
5
3. INTEGRATED ASSESSMENT MODEL
Development of science-based predictive tools for risk assessment is challenging given the scale
and complexity of storage sites. An individual storage site may have a CO2 plume footprint on
the order of 100s of km2, and the need to consider the behavior of the site’s system from the
storage reservoir to potential receptors results in a large volume (>103 km
3) that must be
addressed in the predictions that may depend on processes occurring at the nano-scale. Given
this scale its challenging to use a single model to predict site-scale behavior based on key
processes even at the continuum-scale. Additionally, predicting behavior of multiple
heterogeneous natural systems based on a single, site-scale deterministic model is not possible.
Consequently, a standard approach in quantitative environmental risk assessment is to treat the
overall site as a group of coupled subsystems, each of which embodies a unique set of physical
and chemical characteristics and processes. This approach assumes that these subsystems can be
treated without implicit coupling (i.e., they can be treated independently, addressing subsystem
coupling explicitly in the integrated assessment model). Such models are analogous to predicting
the behavior of an industrial facility by independently predicting the behavior of individual
components that are linked via an engineering system model. For quantifying risk profiles,
NRAP is exploiting an integrated-assessment-modeling approach based on breaking the storage
site into subsystems as illustrated in Figure 1: storage reservoir; potential release mechanisms
through wellbores or natural seals; potential receptors (or impact categories).
We are using the CO2-PENS model (Stauffer et al., 2009), developed with the Goldsim®
software package, for building the IAM. GoldSim is a commercially available system modeling
package which has been tailored with the unique needs of engineered geologic systems in mind,
particularly, uncertainty and heterogeneity. Various approaches can be used to build and
implement models for system components using Goldsim. These include analytical expressions,
lookup tables, and dynamic link libraries (DLLs) for external executables including process-level
models.
Figure 1: Sub-systems within IAM structure being developed by NRAP.
In order to address uncertainty, the system component models can be executed within a Goldsim
model using a Monte Carlo approach, in which parameters are sampled randomly from pre-

Quantification of Risk Profiles for Atmospheres and Groundwater
6
defined distributions. Within an IAM, the system components are connected so as to capture the
various inter-component interactions at a CO2 storage site. For example, the component model
for the storage reservoir is connected to the component model for a wellbore and the component
model for the wellbore is connected to the one for the shallow aquifer, and so on. The inter-
component connections are used to capture the mass transfer or pressure transfer between
components.
The IAM described here has been developed to assess potential risks due to leakage, including
the risk of CO2 returning to the atmosphere and risks associated with potential impacts to
groundwater due to introduction of CO2 and/or brine. Quantification of these risks requires an
IAM that can be used to predict CO2/brine movement at a storage site over a time period of
interest. We used various approaches to build models to describe behavior of storage site sub-
system components mentioned above, including, storage reservoir, wellbores and aquifers. Our
approach to this IAM is briefly described below.

Quantification of Risk Profiles for Atmospheres and Groundwater
7
4. IAM COMPONENT MODELS
The objective of developing the component models is to capture the physical and chemical
interactions that will take place as a result of CO2 injection or migration within the components.
In an IAM these models are used to predict how the individual component will behave over a
time period of interest. Various approaches can be used to develop component models ranging
from abstractions based on detailed process-level simulations to direct incorporation of process
simulation results. Our approaches to develop these component models are described below.
4.1 STORAGE RESERVOIR
The reduced order model (ROM) for the storage reservoir is used to predict time-dependent
changes in reservoir pressure and saturation (at the reservoir-seal interface) as the result of CO2
injection. Currently, we are using a look-up table approach in which results of detailed reservoir
simulations (from TOUGH2 [Transport Of Unsaturated Groundwater and Heat simulator]) were
directly linked as look-up tables. Ultimately, NRAP’s goal is to develop a set of options for
reduced-order models that allow pressures and saturations to be input from any reservoir
simulator; this flexibility will be built into future generations of the NRAP toolset. Our current
toolset, however, has a specific reservoir model built in to the CO2-PENS model.
The reservoir ROM was based on detailed simulations of the Kimberlina reservoir in southern
San Joaquin basin in California (Wainwright et al., 2012). It is a saline reservoir that is currently
being studied as a potential carbon storage site. The target reservoir is a sandstone formation. A
detailed geologic model was developed for the reservoir and was subsequently used to build a
numerical simulation model in Lawrence Berkeley National Laboratory’s (LBNL) TOUGH2
reservoir simulator. The numerical model was used to perform multiple simulations of large-
scale CO2 injection for 50 years at a rate of 5 million tons/year. Each of the simulation runs was
performed for 200 years including 150 years of post-injection relaxation. In all 300 simulation
runs were performed to capture the effect of variability in three reservoir parameters including
porosity and permeability of target reservoir and permeability of caprock. Sensitivity analysis on
these parameters was used to further reduce the 300 runs in 54 representative runs that captured
the effect of variability in the reservoir parameters. The time and space-dependent reservoir
pressure and saturation results for these 54 runs were brought in the IAM as look-up tables. Each
one of the runs was associated with the representative reservoir permeability and porosity and
caprock permeability values, such that during the Monte-Carlo calculations a reservoir
simulation run can be selected based on a set of the values of uncertain parameters selected for a
realization.
4.2 WELLBORES
The ROMs for wellbores are used to calculate the CO2/brine flow rate through wellbores as a
function of the wellbore properties and the pressure and saturation at the reservoir-wellbore
boundary. Detailed models were built for two end-member types of wellbores (cemented and
open), and these were used to develop the wellbore ROMs.
For cemented wellbores, we used Los Alamos National Laboratory’s (LANL) FEHM simulator
for the detailed models to predict CO2 and brine flow up a10-cm diameter wellbore, initially
containing pore-space saturated with brine, for 1500 cases over a range of wellbore depth,
wellbore cement permeability, and pressure and saturation at the reservoir-wellbore interface.
Quantification of Risk Profiles for Atmospheres and Groundwater
8
We assumed that wellbore cement extended over the entire length of wellbore. Input parameter
distributions were generated using a Latin Hypercube Sampling (LHS) scheme in Lawrence
Livermore National Laboratory’s (LLNL) PSUADE (Problem Solving environment for
Uncertainty Analysis and Design Exploration). For the ROM, the results of 1500 FEHM leakage
simulation runs were used in PSUADE to generate higher resolution response surfaces for CO2
and brine leak rate using a MARS (multi-variate adaptive regression spline) fitting scheme. The
response surfaces were converted into a multi-dimensional lookup table that was input into the
IAM.
For open wellbores, we used the drift-flux model in LBNL’s TOUGH2 simulator for the detailed
model to predict CO2 flux through open wellbores. In all, 250 simulation runs were performed by
varying wellbore-reservoir boundary pressure, saturation and wellbore depth. The simulated CO2
and brine leak rates from these runs were converted into a 3-dimensional lookup table for IAM.
It should be noted that both the FEHM and TOUGH2 simulations took into account the
complexities of CO2 phase change during leakage from deeper reservoirs (where CO2 typically
exists in super-critical state) to shallow aquifer or atmosphere (where CO2 typically exists in
gaseous state).
4.3 FAULTS
The ROM for faults/fractures is used to calculate the CO2/brine flow rate through faults as a
function of the fault properties and the pressure and saturation at the reservoir-seal interface.
The model was developed by using results of detailed numerical simulations of CO2/brine flow
along a 2-dimensional fault connecting a storage reservoir and a shallow aquifer. The simulations
were performed using LLNL’s NUFT (Nonisothermal, Unsaturated Flow and Transport with
Chemistry code) simulator. Approximately 900 successful simulation runs were performed by
varying pressure and saturation at the intersection of fault with reservoir as well as physical
properties of fault (porosity, permeability and thickness), caprock (permeability) and shallow
aquifer (permeability & porosity). Similar to the wellbore leakage simulations, the fault
simulation models took into account the complexities of phase change during leakage. A
sensitivity analysis of the simulation results was used to further reduce the number of variables.
Ultimately, the simulation results and the reduced variable set were used in LLNL’s PSUADE
package to develop ROM for leakage through fault.
The fault ROM was in form of high-order polynomial functions of the primary variables
mentioned above.
4.4 CAPROCK
For the first-generation risk-profile toolset, we assumed that the leakage through the caprock was
negligible and did not develop a ROM for caprock leakage.
4.5 SHALLOW AQUIFERS
The IAM shallow aquifer model is used to calculate changes in the pH and concentration of total
dissolved solids (TDS) in shallow aquifer due to CO2 and brine leakage. We developed ROMs
using LLNL’s PSUADE package coupled with results of detailed simulations using process-level
models including LANL’s FEHM, LLNL’s NUFT and Pacific Northwest National Laboratory’s
(PNNL) STOMP. We developed two reduced-order-models, one for a confined sandstone
Quantification of Risk Profiles for Atmospheres and Groundwater
9
aquifer and the second for an unconfined carbonate aquifer. For the sandstone aquifer, a
numerical simulation model based on the data for High Plains Aquifer in the United States was
developed using LLNL’s NUFT simulator. For the carbonate aquifers, numerical simulation
models based on the data for Edwards’ Aquifer in United States were developed using LANL’s
FEHM and PNNL’s STOMP simulators. These numerical models were used to simulate changes
in the pH and TDS in the aquifers due to CO2 and brine leakage in the aquifers.
A set of Monte-Carlo runs were performed by varying values of multiple uncertain parameters,
including, aquifer hydraulic properties and geochemical properties. Results of the Monte-Carlo
simulations were used to develop ROMs for various quantities of interest using LLNL’s
PSUADE package. These included dimensions of pH and TDS plumes in shallow aquifer and
CO2 leakage rate out of the aquifer. The ROMs had forms of higher-order polynomial functions
of the uncertain parameters. These ROMs were linked using DLLs that can plug in to the IAM
developed in Goldsim.
4.6 ATMOSPHERE
For the first-generation risk-profile toolset, we have only focused on CO2 leak rate to the
atmosphere. We did not consider any atmospheric processes post CO2 leakage that could impact
CO2 concentration in atmosphere directly above the storage reservoir.

Quantification of Risk Profiles for Atmospheres and Groundwater
10
This page intentionally left blank.
Quantification of Risk Profiles for Atmospheres and Groundwater
11
5. CO2-PENS
5.1 ARCHITECTURE
CO2-PENS is developed using the GoldSim®
system modeling and Monte-Carlo simulation
software package. GoldSim has been used extensively in environmental risk assessment
applications.1
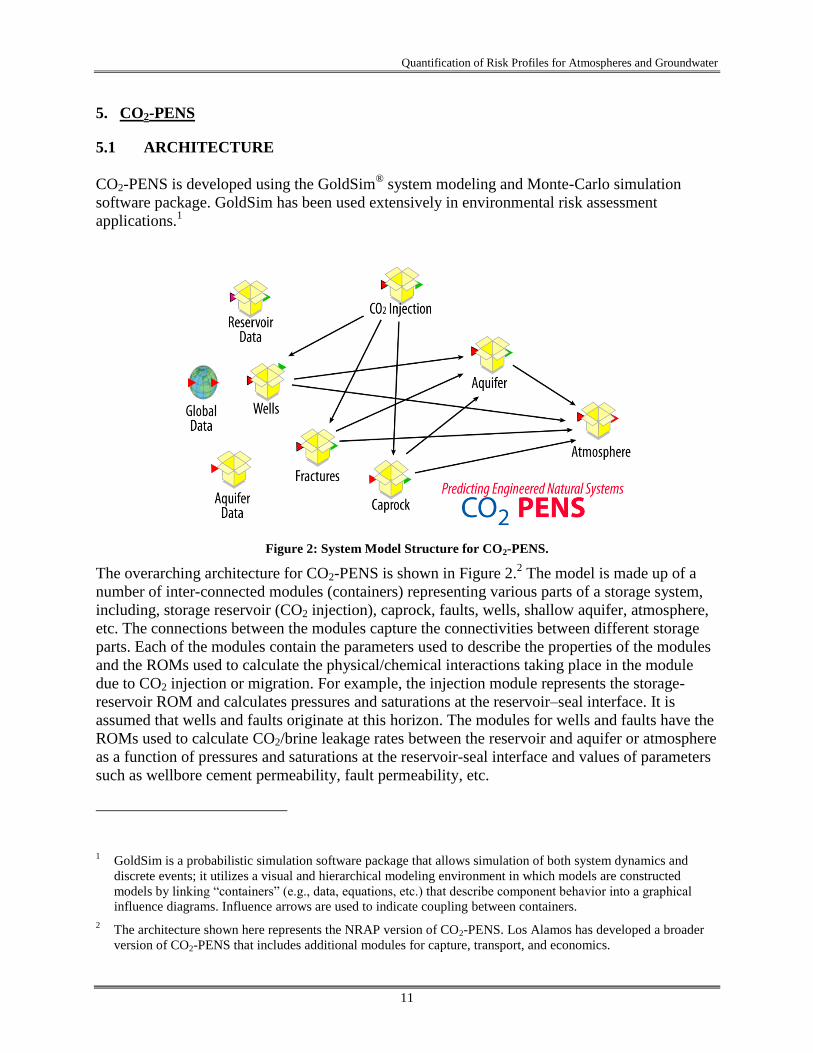
Figure 2: System Model Structure for CO2-PENS.
The overarching architecture for CO2-PENS is shown in Figure 2.2 The model is made up of a
number of inter-connected modules (containers) representing various parts of a storage system,
including, storage reservoir (CO2 injection), caprock, faults, wells, shallow aquifer, atmosphere,
etc. The connections between the modules capture the connectivities between different storage
parts. Each of the modules contain the parameters used to describe the properties of the modules
and the ROMs used to calculate the physical/chemical interactions taking place in the module
due to CO2 injection or migration. For example, the injection module represents the storage-
reservoir ROM and calculates pressures and saturations at the reservoir–seal interface. It is
assumed that wells and faults originate at this horizon. The modules for wells and faults have the
ROMs used to calculate CO2/brine leakage rates between the reservoir and aquifer or atmosphere
as a function of pressures and saturations at the reservoir-seal interface and values of parameters
such as wellbore cement permeability, fault permeability, etc.
1 GoldSim is a probabilistic simulation software package that allows simulation of both system dynamics and
discrete events; it utilizes a visual and hierarchical modeling environment in which models are constructed
models by linking “containers” (e.g., data, equations, etc.) that describe component behavior into a graphical
influence diagrams. Influence arrows are used to indicate coupling between containers.
2 The architecture shown here represents the NRAP version of CO2-PENS. Los Alamos has developed a broader
version of CO2-PENS that includes additional modules for capture, transport, and economics.
Quantification of Risk Profiles for Atmospheres and Groundwater
12
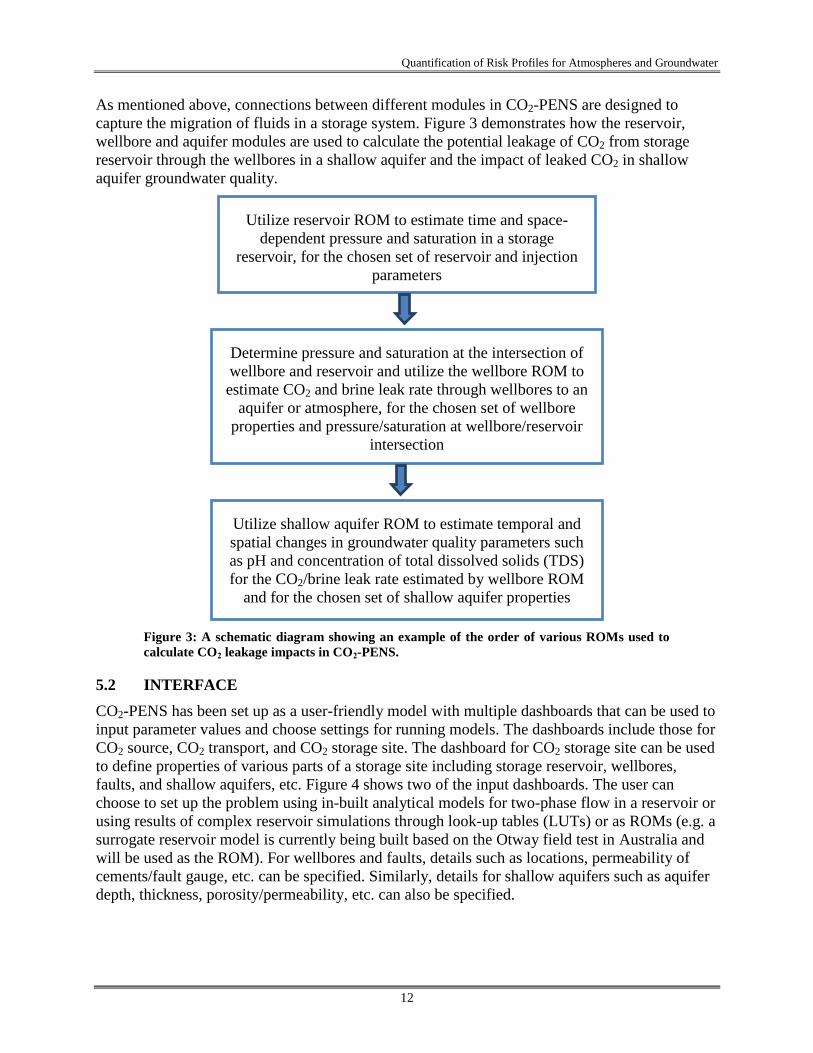
As mentioned above, connections between different modules in CO2-PENS are designed to
capture the migration of fluids in a storage system. Figure 3 demonstrates how the reservoir,
wellbore and aquifer modules are used to calculate the potential leakage of CO2 from storage
reservoir through the wellbores in a shallow aquifer and the impact of leaked CO2 in shallow
aquifer groundwater quality.
Figure 3: A schematic diagram showing an example of the order of various ROMs used to
calculate CO2 leakage impacts in CO2-PENS.
5.2 INTERFACE
CO2-PENS has been set up as a user-friendly model with multiple dashboards that can be used to
input parameter values and choose settings for running models. The dashboards include those for
CO2 source, CO2 transport, and CO2 storage site. The dashboard for CO2 storage site can be used
to define properties of various parts of a storage site including storage reservoir, wellbores,
faults, and shallow aquifers, etc. Figure 4 shows two of the input dashboards. The user can
choose to set up the problem using in-built analytical models for two-phase flow in a reservoir or
using results of complex reservoir simulations through look-up tables (LUTs) or as ROMs (e.g. a
surrogate reservoir model is currently being built based on the Otway field test in Australia and
will be used as the ROM). For wellbores and faults, details such as locations, permeability of
cements/fault gauge, etc. can be specified. Similarly, details for shallow aquifers such as aquifer
depth, thickness, porosity/permeability, etc. can also be specified.
Utilize shallow aquifer ROM to estimate temporal and
spatial changes in groundwater quality parameters such
as pH and concentration of total dissolved solids (TDS)
for the CO2/brine leak rate estimated by wellbore ROM
and for the chosen set of shallow aquifer properties
Determine pressure and saturation at the intersection of
wellbore and reservoir and utilize the wellbore ROM to
estimate CO2 and brine leak rate through wellbores to an
aquifer or atmosphere, for the chosen set of wellbore
properties and pressure/saturation at wellbore/reservoir
intersection
Utilize reservoir ROM to estimate time and space-
dependent pressure and saturation in a storage
reservoir, for the chosen set of reservoir and injection
parameters

Quantification of Risk Profiles for Atmospheres and Groundwater
13
5.3 OUTPUT
Similar to providing inputs, the results of CO2-PENS calculations are made available through the
results dashboard. The results are available either as graphs or tables of computed quantities such
as time-dependent leakage rate. Figure 5 shows the main dashboard for accessing various
leakage results and an example result.
a) b)
Figure 4: Two of the dashboards used to provide inputs to CO2-PENS. a) Main input
dashboard. b) Dashboard for providing reservoir related inputs.
a) b) Figure 5: Example for outputs in CO2-PENS. a) Main output dashboard. b) An example
results graph.

Quantification of Risk Profiles for Atmospheres and Groundwater
14
Both the graphical and tabular outputs in CO2-PENS provide statistical measures for Monte-
Carlo simulation results, including, mean, standard deviation, confidence intervals, etc. In
addition results for all of the individual realizations are available as well. These results can be
subsequently used to calculate the probabilities related to failing or exceeding certain
performance criteria.

Quantification of Risk Profiles for Atmospheres and Groundwater
15
6. EXAMPLE RISK-PROFILE CALCULATION
NRAP’s first-generation CO2-PENS IAM toolset can be used to calculate three leakage related
impacts over time, including,
1. Leakage to the atmosphere
2. Change in pH of groundwater
3. Change in concentration of TDS in groundwater
In order to demonstrate one applicability of the first-generation toolset, we provide an example
assessment of CO2 containment in relation to pre-existing wellbores at a site. In this scenario, a
key question might be: How does the risk of loss of CO2 credits vary as a function of wellbores
present at site (e.g., wellbore number, wellbore integrity, etc.)?
The risk profiles were calculated using the IAM to perform Monte-Carlo simulations of CO2
release to the atmosphere. We assumed a hypothetical CO2 storage site with a target reservoir
similar to the Kimberlina reservoir but using a set of leakage pathways that are not applicable to
the real site. Specifically, our primary leakage scenario included leakage through hypothetical
cemented wellbores that penetrated the storage reservoir, using various numbers, distributions,
and permeabilities of the wellbores that represented a range of potential storage site scenarios.
Each of the Monte-Carlo realizations simulated performance of a CO2 storage site over 200
years, which included 50 years of CO2 injection at 5 million tons/year followed by 150 years
post-injection relaxation. Each Monte-Carlo run included 750–1000 realizations, sampling a
number of uncertain parameters including:
Storage reservoir permeability and porosity, caprock permeability
Wellbore cement permeability, wellbore location, wellbore spatial density
We used multiple different distributions of wellbore cement permeabilities. These distributions
were generated based on various sources of data including the sustained casing vent flow and
sustained casing pressure data reported for wells in Alberta and Gulf of Mexico, and two
permeability distributions based on the low and high wellbore leakage probabilities used in the
EIS for FutureGen application. For each of the distributions we performed a separate set of
Monte-Carlo runs. The wellbore spatial density was varied between the densities observed at
typical oil/gas fields (~ 6–10 wells/km2) to a density consistent with a saline formation in an area
where no prior oil/gas production activity has taken place (1well/100 km2).
Figure 6 shows example results for calculated CO2 leak rates for several individual realizations
in one of the Monte Carlo simulations. The scenario includes wellbores with cement
permeabilities sampled from a distribution derived from ranges reported in an Environmental
Impact Statement developed for a potential storage site and wellbore spatial density similar to
that of a mature oil/gas field (10 wells/km2).
The results show that the CO2 leak rate is dominated by leak characteristics from individual
wells, with rate increasing as the reservoir plume intersects a well either during injection or
following injection. The net effect is an average probabilistic stochastic leak rate (shown as a red
curve on Figure 6) that rises during the injection period and levels off (at least through the 150
years of relaxation that is considered in the simulations). (Although only four realizations are
shown on the figure, this red curve reflects the average from 750 realizations.)

Quantification of Risk Profiles for Atmospheres and Groundwater
16
Figure 6: Example leakage rate curves and average leak rate.
The topology of an individual realization for leakage to the atmosphere differs from the topology
of the notional risk profile presented by Benson (2007). Specifically, the peak ties more strongly
to the timing of when the plume intersects a high permeability wellbore as opposed to tying to
the evolution of reservoir pressure. This is to be expected because leakage of CO2 is driven by
CO2 saturation (plume movement), which evolves at a significantly slower time scale (over
multiple decades, depending on reservoir permeability, thickness and depth) compared to
pressure front in a saline reservoir (over few years). The evolution of pressure front is inversely
proportional to compressibility and since water is very incompressible the pressure effects are
felt quicker at farther distance. The net effect is that (1) the leakage peak may occur before or
after injection ceases, and (2) the decay of the leakage profile is prolonged relative to the decay
of a pressure profile (see Wainwright et al., 2012, Figure 2 a and b for a comparison of the
evolution of CO2 saturation and pressure).
Results of the Monte-Carlo simulations were used to calculate the risk profiles by calculating the
probability that the cumulative leak rate exceeds certain cutoffs which will result in failing
various CO2 retention goals such as the IPCC storage goal.
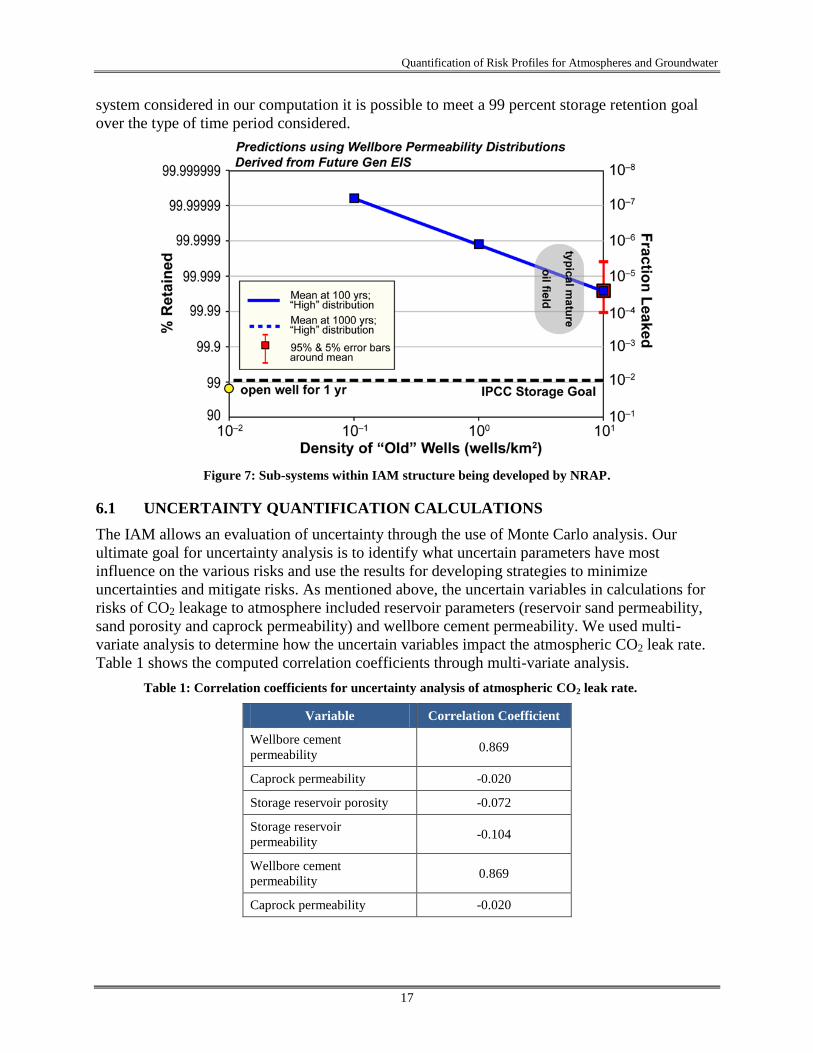
Figure 7 shows an example of the utility of the computed risk profiles. The example
demonstrates effect of wellbore spatial density on the percent of CO2 retained in a storage
reservoir over 100 years. The wellbore spatial density was varied between that for typical mature
oil/gas fields and very low spatial density. The figure also shows the IPCC storage goal of 99
percent retention for reference. In addition, the figure shows result of the calculation of 1 year of
leakage through an open well for reference. (It should be noted that the open well calculation
was performed using a different wellbore model that is applicable to the flow conditions in a
non-cemented well.) A continuously leaking open well for one year is an unlikely scenario
because it could be readily detected and repaired. However, the data point is shown to provide a
comparison to an extreme, end-member scenario; further, the calculations are expected to
represent a worst-case, in that the reservoir model did not account for trapping mechanisms
(which would limit flow over time). Results on Figure 7 demonstrate that for the type of storage
Quantification of Risk Profiles for Atmospheres and Groundwater
17
system considered in our computation it is possible to meet a 99 percent storage retention goal
over the type of time period considered.
Figure 7: Sub-systems within IAM structure being developed by NRAP.
6.1 UNCERTAINTY QUANTIFICATION CALCULATIONS
The IAM allows an evaluation of uncertainty through the use of Monte Carlo analysis. Our
ultimate goal for uncertainty analysis is to identify what uncertain parameters have most
influence on the various risks and use the results for developing strategies to minimize
uncertainties and mitigate risks. As mentioned above, the uncertain variables in calculations for
risks of CO2 leakage to atmosphere included reservoir parameters (reservoir sand permeability,
sand porosity and caprock permeability) and wellbore cement permeability. We used multi-
variate analysis to determine how the uncertain variables impact the atmospheric CO2 leak rate.
Table 1 shows the computed correlation coefficients through multi-variate analysis.
Table 1: Correlation coefficients for uncertainty analysis of atmospheric CO2 leak rate.
Variable Correlation Coefficient
Wellbore cement
permeability 0.869
Caprock permeability -0.020
Storage reservoir porosity -0.072
Storage reservoir
permeability -0.104
Wellbore cement
permeability 0.869
Caprock permeability -0.020
Quantification of Risk Profiles for Atmospheres and Groundwater
18
As can be seen from Table 1, wellbore cement permeability has a strong influence on the CO2
leak rate for the sites considered. This is not a surprising result, given that the primary leakage
pathway is wellbore and the leak rate through wellbore is strongly influenced by cement
permeability. It should also be noted that we assumed that the wellbores are directly connected
between storage reservoir and the atmosphere and there are no other intermediate formations
where leaked CO2 can be retained preventing it from going to the atmosphere.

Quantification of Risk Profiles for Atmospheres and Groundwater
19
7. CONCLUSIONS
We have developed an IAM to compute risk profiles at a CO2 storage site. The IAM is built
using a system modeling approach and is based on LANL’s CO2-PENS model. The IAM has
first-generation ROMs for storage reservoir, wellbores, faults, and shallow aquifer.
We used the IAM to compute risk profiles for impacts due to CO2 and brine leakage from a
storage reservoir through wellbores. The risk profiles have been used to address questions such
as effect of wellbore density on CO2 containment.
The IAM is currently being beta-tested among NRAP partner labs. We intend to share the IAM
and associated ROMs with the broader CCS community once the beta-testing is completed.
7.1 IAM LIMITATIONS
We are taking a multi-step approach to developing the ROMs and IAM. We will be developing
three generations of ROMs and IAM, where the complexities of the models will increase going
from first-generation to third-generation.
The ROM for storage reservoir was built using results of detailed numerical simulations
of CO2 injection and subsequent flow in a sandstone reservoir. The ROM is limited to a
sloping, sandstone reservoir with an open boundary. The CO2 injection rate is limited to 5
MT/year.
Two ROMs were built for wellbores, one for open wellbore and second for cemented
wellbores. The details of wellbore completions including presence of casing, cement or
bridge plugs were ignored. For open wellbore it was assumed that the wellbore is like an
open pipe extending from the reservoir to atmosphere or shallow aquifer. For cemented
wellbores it was assumed that flow is only through wellbore cement and the cement
extends from reservoir to surface. The cement permeability was assumed to be constant
with time and the effects of geo-chemical or geo-mechanical interactions due to CO2
injection or CO2 migration. We assumed that the residual saturation in cement is zero.
Finally, we also assumed that there is no feed-back between wellbore and reservoir due to
leakage through wellbore, including, changes in pressure and saturation in the near
wellbore region of the reservoir.
Two ROMs were built for aquifers, one was based on model for a sandstone aquifer and
another based on model for a carbonate aquifer. Both the models assumed open aquifer
boundaries. The models did not take into account geochemical reactions and were limited
to single leakage point (either wellbore or fault). For multiple leak points it was assumed
that the principle of superposition can be applied and used it to add results from single
leak points.
7.2 PLANS FOR SECOND-GENERATION TOOLSET
As mentioned in previous section, we have developed first generation ROMs and IAM. We are
currently in the middle of developing the second-generation ROMs. These ROMs are developed
using process-level simulations with increased complexities of underlying processes as described
below.

Quantification of Risk Profiles for Atmospheres and Groundwater
20
Reservoir: In addition to the look-up tables based on Kimberlina reservoir simulation
runs we will are developing ROMs for two additional types of storage reservoirs. The
first one is based on the Otway field test in Australia. We have developed a model for
Otway in Schlumberger’s Eclipse simulator and are using results of simulations to
develop a surrogate reservoir model using a neural network approach. The second type of
storage reservoir we are considering is an oil reservoir. We are using an Eclipse
simulation model for the SACROC oil reservoir in the Permian basin. While we are using
a model for an oil reservoir, our leakage calculations will not have oil as one of the fluids.
Wellbore: The wellbore ROM for cemented wellbores is being rebuilt for second-
generation calculations. We are developing a higher order polynomial function to replace
the look-up table used in first-generation. In addition, we are also taking into account the
effect of geomechanical processes on cement permeability.
Aquifer: For second-generation, the aquifer ROMs are being extended to include effect of
geochemical reactions as well as leakage through multiple points. In addition to
providing the outputs for volumes of pH and TDS plumes, the aquifer ROMs are being
developed to provide outputs for volumes of plumes of cadmium, arsenic and lead.
Quantification of Risk Profiles for Atmospheres and Groundwater
21
8. REFERENCES
Benson, S. Addressing Long-term Liability of Carbon Dioxide Capture and Geological
Sequestration. World Resource Institute (WRI) Long-term liability Workshop,
Washington, DC, June 7, 2007. Available: http://www.iepa.com/ETAAC/ETAAC
Handouts 8-8-07/2007 June 5 liability workshop summary final K Davis.pdf
Chapman, N. A.; Andersson, J.; Robinson P. Systems analysis, scenario construction and
consequence analysis definition for SITE-94; Swedish Nuclear Power Inspectorate Report
No. 95:26; Stockholm, Sweden, 1995.
Cranwell, R. M.; Guzowski, R. V. Risk methodology for geologic disposal of radioactive waste:
scenario selection procedure; Report of US Nuclear Regulatory Commission
NUREG/CR-1667 (SAND80-1429); NRC: Washington, DC, 1982.
CSLF. Phase I Final Report from CSLF Risk Assessment Task Force; CSLF-T-2009-04; Carbon
Sequestration Leadership Forum, 2009, p 53.
Maul, P. R.; Savage, D.; Benbow, S. J.; Walke R. C.; Bruin, R. Development of a FEP database
for the geological storage of carbon dioxide. Wilson, M., Morris, T., Gale, J.,
Thambimithu, K. (Eds.), Proceedings of the Seventh International Conference on
Greenhouse Gas Control Technologies, Vancouver, Canada, 2005; p 701–710.
Nirex. Overview of the FEP analysis approach to model development; UK Nirex Report
S/98/009; 1998.
Refsgaard, J. C.; van der Sluijs, J. P.; Brown, J.; van der Keur, P. A framework for dealing with
uncertainty due to model structure error. Advances in Water Resources 2006, 29, 1586–
1597.
Refsgaard, J. C.; van der Sluijs, J. P.; Hojberg, A. L.; Vanrolleghem, P. A. Uncertainty in the
environmental modelling process—A framework and guidance. Environmental
Modelling & Software 2007, 22, 1543–1556.
Savage, D.; Maul, P. R.; Benbow, S.; Walke, R. C. A generic FEP database for the assessment
of long-term performance and safety of the geological storage of CO2; Quintessa Report
QRS-1060A-1; 2004; p 73.
Stauffer, P. H.; Viswanathan, H. S.; Pawar, R. J.; Guthrie, G. D. A system model for geologic
sequestration of carbon dioxide. Environmental Science & Technology 2009, 43, 565–
570.
van der Sluijs, J. P. Uncertainty and precaution in environmental management: Insights from the
UPEM conference. Environmental Modelling & Software 2007, 22, 590–598.
Wainwright, H.; Finsterle, S.; Zhou, Q.; Birkholzer, J. Modeling the Performance of Large-Scale
CO2 Storage Systems: A Comparison of Different Sensitivity Analysis Methods; NRAP-
TRS-III-002-2012; NRAP Technical Report Series; U.S. Department of Energy, National
Energy Technology Laboratory: Morgantown, WV, 2012; p 24.

Quantification of Risk Profiles for Atmospheres and Groundwater
22
This page intentionally left blank.

NRAP is an initiative within DOE’s Office of Fossil Energy and is led by the National Energy Technology
Laboratory (NETL). It is a multi-national-lab effort that leverages broad technical capabilities across the DOE
complex to develop an integrated science base that can be applied to risk assessment for long-term storage of carbon
dioxide (CO2). NRAP involves five DOE national laboratories: NETL Regional University Alliance (NETL-RUA),
Lawrence Berkeley National Laboratory (LBNL), Lawrence Livermore National Laboratory (LLNL), Los Alamos
National Laboratory (LANL), and Pacific Northwest National Laboratory (PNNL). The NETL-RUA is an applied
research collaboration that combines NETL’s energy research expertise in the Office of Research and Development
(ORD) with the broad capabilities of five nationally recognized, regional universities—Carnegie Mellon University
(CMU), The Pennsylvania State University (PSU), University of Pittsburgh (Pitt), Virginia Polytechnic Institute and
State University (VT), and West Virginia University (WVU)—and the engineering and construction expertise of an
industry partner (URS Corporation).
Technical Leadership Team
Jens Birkholzer LBNL Technical Coordinator
Lawrence Berkeley National Laboratory
Berkeley, CA
Grant Bromhal NETL Technical Coordinator
Lead, Reservoir Performance Working Group
Office of Research and Development
National Energy Technology Laboratory
Morgantown, WV
Chris Brown PNNL Technical Coordinator
Pacific Northwest National Laboratory
Richmond, WA
Susan Carroll LLNL Technical Coordinator
Lawrence Livermore National Laboratory
Livermore, CA
William Foxall Lead, Induced Seismicity Working Group
Lawrence Livermore National Laboratory
Livermore, CA
Diana Bacon Lead, Groundwater Protection Working Group
Pacific Northwest National Laboratory
Richmond, WA
Tom Daley Lead, Strategic Monitoring Working Group
Lawrence Berkeley National Laboratory
Berkeley, CA
George Guthrie Technical Director, NRAP
Office of Research and Development
National Energy Technology Laboratory
Pittsburgh, PA
Rajesh Pawar LANL Technical Coordinator
Lead, Systems/Risk Modeling Working Group
Los Alamos National Laboratory
Los Alamos, NM
Tom Richard Deputy Technical Director, NRAP
The Pennsylvania State University
NETL-Regional University Alliance
State College, PA
Brian Strazisar Lead, Migration Pathways Working Group
Office of Research and Development
National Energy Technology Laboratory
Pittsburgh, PA

NRAP Technical Report Series
Sean Plasynski Deputy Director
Strategic Center for Coal
National Energy Technology Laboratory
U.S. Department of Energy
Jared Ciferno Director
Office of Coal and Power R&D
National Energy Technology Laboratory
U.S. Department of Energy
Robert Romanosky
Technology Manager
Crosscutting Research
National Energy Technology Laboratory
U.S. Department of Energy
Regis Conrad
Director
Division of Cross-cutting Research
Office of Fossil Energy
U.S. Department of Energy
NRAP Executive Committee
Cynthia Powell
Director
Office of Research and Development
National Energy Technology Laboratory
U.S. Department of Energy
Alain Bonneville
Laboratory Fellow
Pacific Northwest National Laboratory
Donald DePaolo
Associate Laboratory Director
Energy and Environmental Sciences
Lawrence Berkeley National Laboratory
Melissa Fox
Chair, NRAP Executive Committee
Program Manager
Applied Energy Programs
Los Alamos National Laboratory
Julio Friedmann
Chief Energy Technologist
Lawrence Livermore National
Laboratory
George Guthrie
Technical Director, NRAP
Office of Research and Development
National Energy Technology Laboratory