Embed Size (px)
Citation preview
Performance Outcomes System Initial ReportsReport run on October 11, 2017
Background
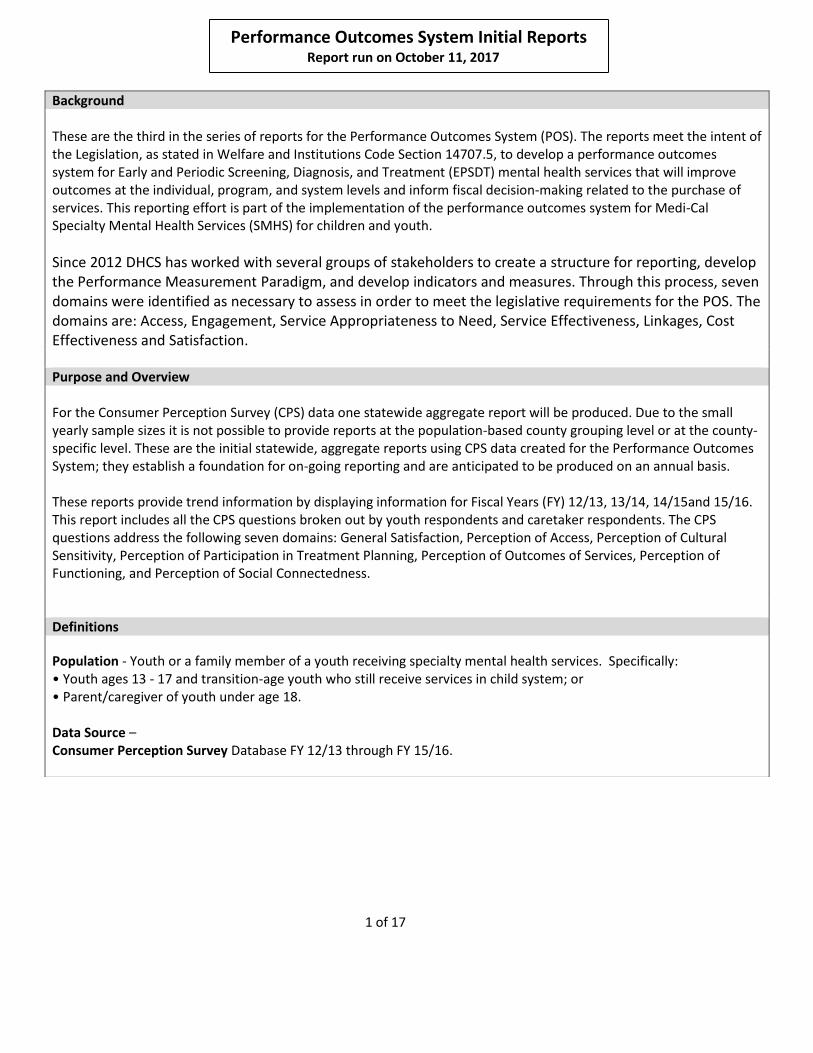
These are the third in the series of reports for the Performance Outcomes System (POS). The reports meet the intent of the Legislation, as stated in Welfare and Institutions Code Section 14707.5, to develop a performance outcomes system for Early and Periodic Screening, Diagnosis, and Treatment (EPSDT) mental health services that will improve outcomes at the individual, program, and system levels and inform fiscal decision-making related to the purchase of services. This reporting effort is part of the implementation of the performance outcomes system for Medi-Cal Specialty Mental Health Services (SMHS) for children and youth.
Since 2012 DHCS has worked with several groups of stakeholders to create a structure for reporting, develop the Performance Measurement Paradigm, and develop indicators and measures. Through this process, seven domains were identified as necessary to assess in order to meet the legislative requirements for the POS. The domains are: Access, Engagement, Service Appropriateness to Need, Service Effectiveness, Linkages, Cost Effectiveness and Satisfaction.
Purpose and Overview
For the Consumer Perception Survey (CPS) data one statewide aggregate report will be produced. Due to the small yearly sample sizes it is not possible to provide reports at the population-based county grouping level or at the county-specific level. These are the initial statewide, aggregate reports using CPS data created for the Performance Outcomes System; they establish a foundation for on-going reporting and are anticipated to be produced on an annual basis.
These reports provide trend information by displaying information for Fiscal Years (FY) 12/13, 13/14, 14/15and 15/16. This report includes all the CPS questions broken out by youth respondents and caretaker respondents. The CPS questions address the following seven domains: General Satisfaction, Perception of Access, Perception of Cultural Sensitivity, Perception of Participation in Treatment Planning, Perception of Outcomes of Services, Perception of Functioning, and Perception of Social Connectedness.
Definitions
Population - Youth or a family member of a youth receiving specialty mental health services. Specifically:• Youth ages 13 - 17 and transition-age youth who still receive services in child system; or• Parent/caregiver of youth under age 18.
Data Source –Consumer Perception Survey Database FY 12/13 through FY 15/16.
1 of 17
Performance Outcomes System Initial ReportsReport run on October 11, 2017
Additional Information
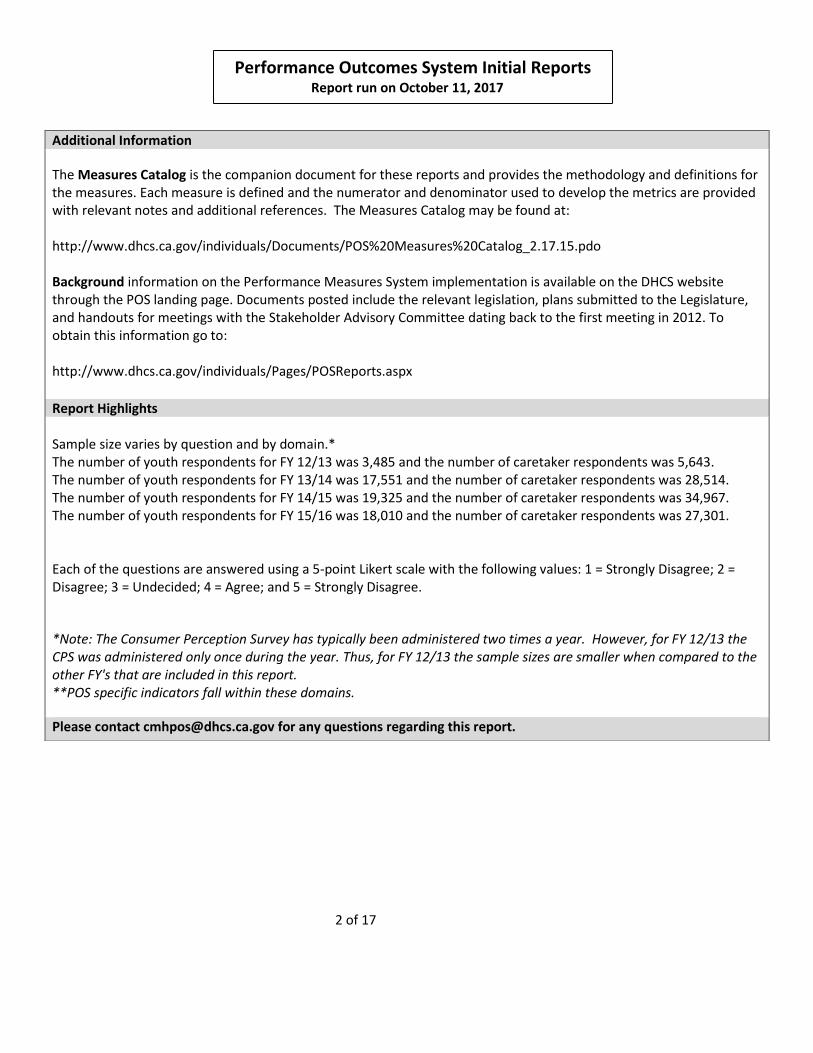
The Measures Catalog is the companion document for these reports and provides the methodology and definitions for the measures. Each measure is defined and the numerator and denominator used to develop the metrics are provided with relevant notes and additional references. The Measures Catalog may be found at:
http://www.dhcs.ca.gov/individuals/Documents/POS%20Measures%20Catalog_2.17.15.pdo
Background information on the Performance Measures System implementation is available on the DHCS website through the POS landing page. Documents posted include the relevant legislation, plans submitted to the Legislature, and handouts for meetings with the Stakeholder Advisory Committee dating back to the first meeting in 2012. To obtain this information go to:
http://www.dhcs.ca.gov/individuals/Pages/POSReports.aspx
Report Highlights
Sample size varies by question and by domain.*The number of youth respondents for FY 12/13 was 3,485 and the number of caretaker respondents was 5,643.The number of youth respondents for FY 13/14 was 17,551 and the number of caretaker respondents was 28,514.The number of youth respondents for FY 14/15 was 19,325 and the number of caretaker respondents was 34,967.The number of youth respondents for FY 15/16 was 18,010 and the number of caretaker respondents was 27,301.
Each of the questions are answered using a 5-point Likert scale with the following values: 1 = Strongly Disagree; 2 = Disagree; 3 = Undecided; 4 = Agree; and 5 = Strongly Disagree.
*Note: The Consumer Perception Survey has typically been administered two times a year. However, for FY 12/13 theCPS was administered only once during the year. Thus, for FY 12/13 the sample sizes are smaller when compared to theother FY's that are included in this report.**POS specific indicators fall within these domains.
Please contact [email protected] for any questions regarding this report.
2 of 17
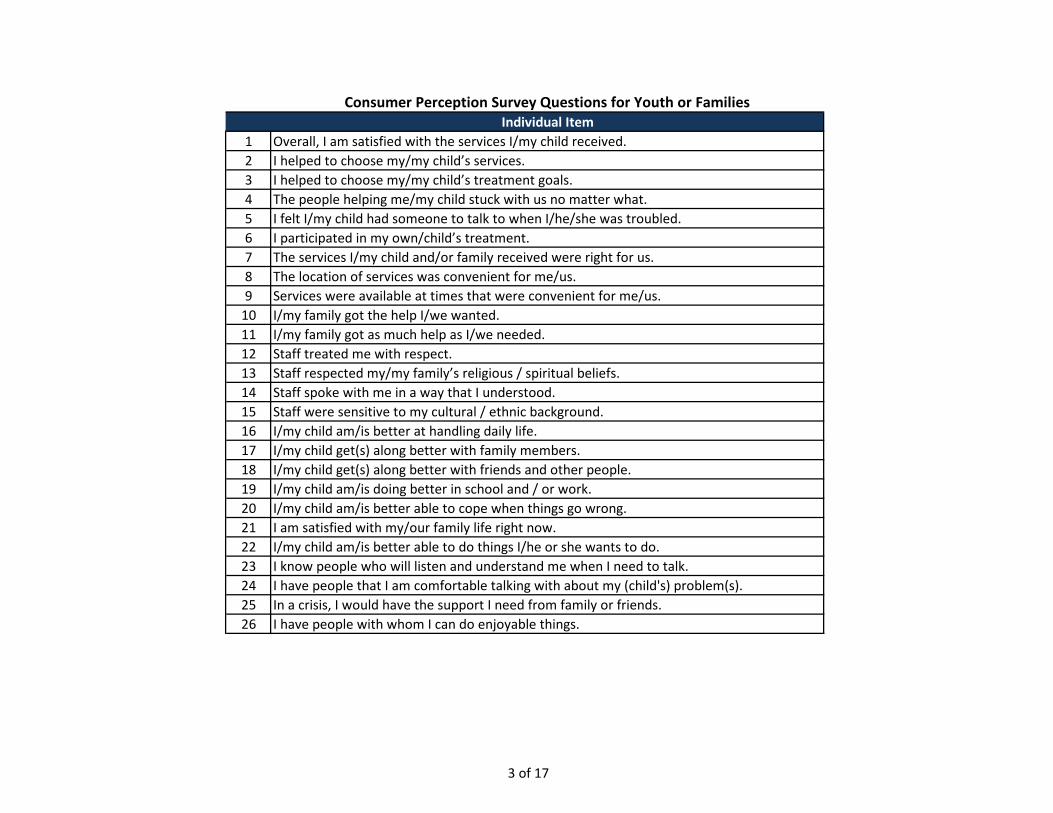
Consumer Perception Survey Questions for Youth or FamiliesIndividual Item
1 Overall, I am satisfied with the services I/my child received.2 I helped to choose my/my child’s services.3 I helped to choose my/my child’s treatment goals.4 The people helping me/my child stuck with us no matter what.5 I felt I/my child had someone to talk to when I/he/she was troubled.6 I participated in my own/child’s treatment.7 The services I/my child and/or family received were right for us.8 The location of services was convenient for me/us.9 Services were available at times that were convenient for me/us.
10 I/my family got the help I/we wanted.11 I/my family got as much help as I/we needed.12 Staff treated me with respect.13 Staff respected my/my family’s religious / spiritual beliefs.14 Staff spoke with me in a way that I understood.15 Staff were sensitive to my cultural / ethnic background.16 I/my child am/is better at handling daily life.17 I/my child get(s) along better with family members.18 I/my child get(s) along better with friends and other people.19 I/my child am/is doing better in school and / or work.20 I/my child am/is better able to cope when things go wrong.21 I am satisfied with my/our family life right now.22 I/my child am/is better able to do things I/he or she wants to do.23 I know people who will listen and understand me when I need to talk.24 I have people that I am comfortable talking with about my (child's) problem(s).25 In a crisis, I would have the support I need from family or friends.26 I have people with whom I can do enjoyable things.
3 of 17

Table A1: Youth Respondent Domain Averages for the Youth Services Surveyin the Consumer Perception Survey
DOMAIN FY 2012-13 FY 2013-14 FY 2014-15 FY 2015-16General Satisfaction 4.1 4.1 4.2 4.2Perception of Participation in Treatment Planning 3.9 4.0 4.0 4.0Perception of Access 4.1 4.1 4.1 4.2Perception of Cultural Sensitivity 4.3 4.3 4.3 4.4Perception of Outcomes of Services 3.9 3.9 3.8 3.9Perception of Functioning 3.9 3.9 3.9 3.9Perception of Social Connectedness 4.1 4.1 4.1 4.1
3 of 17
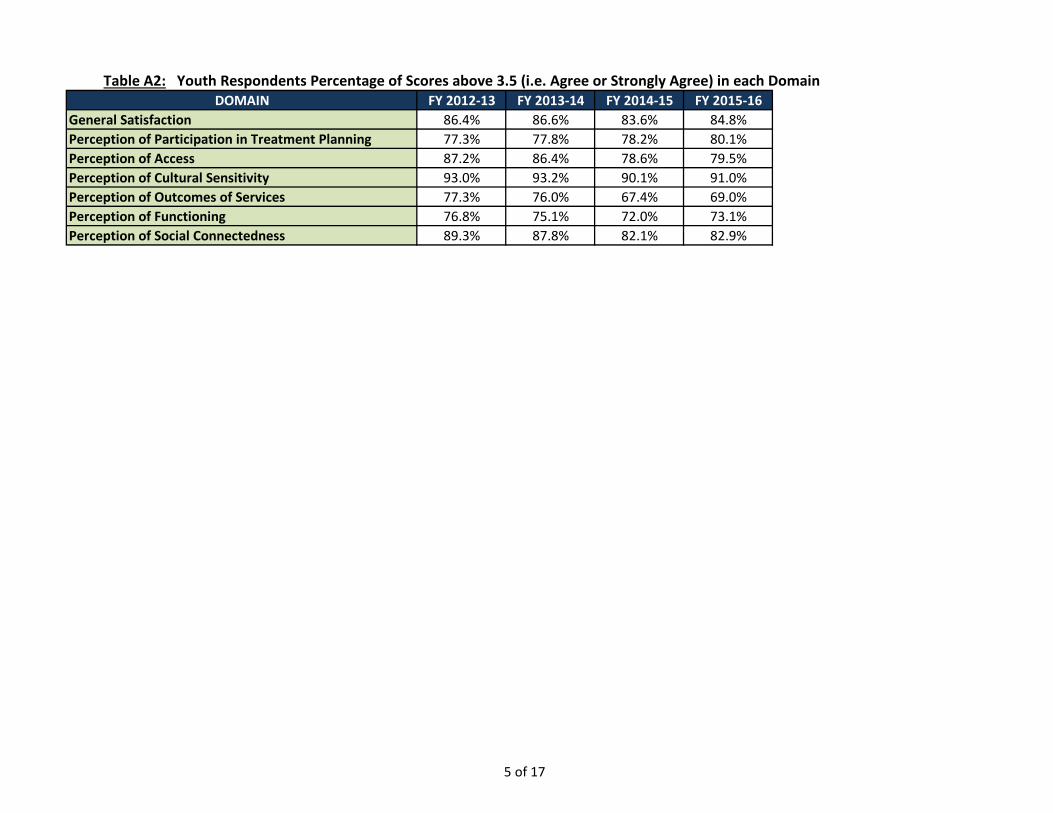
Table A2: Youth Respondents Percentage of Scores above 3.5 (i.e. Agree or Strongly Agree) in each DomainDOMAIN FY 2012-13 FY 2013-14 FY 2014-15 FY 2015-16
General Satisfaction 86.4% 86.6% 83.6% 84.8%Perception of Participation in Treatment Planning 77.3% 77.8% 78.2% 80.1%Perception of Access 87.2% 86.4% 78.6% 79.5%Perception of Cultural Sensitivity 93.0% 93.2% 90.1% 91.0%Perception of Outcomes of Services 77.3% 76.0% 67.4% 69.0%Perception of Functioning 76.8% 75.1% 72.0% 73.1%Perception of Social Connectedness 89.3% 87.8% 82.1% 82.9%
5 of 17
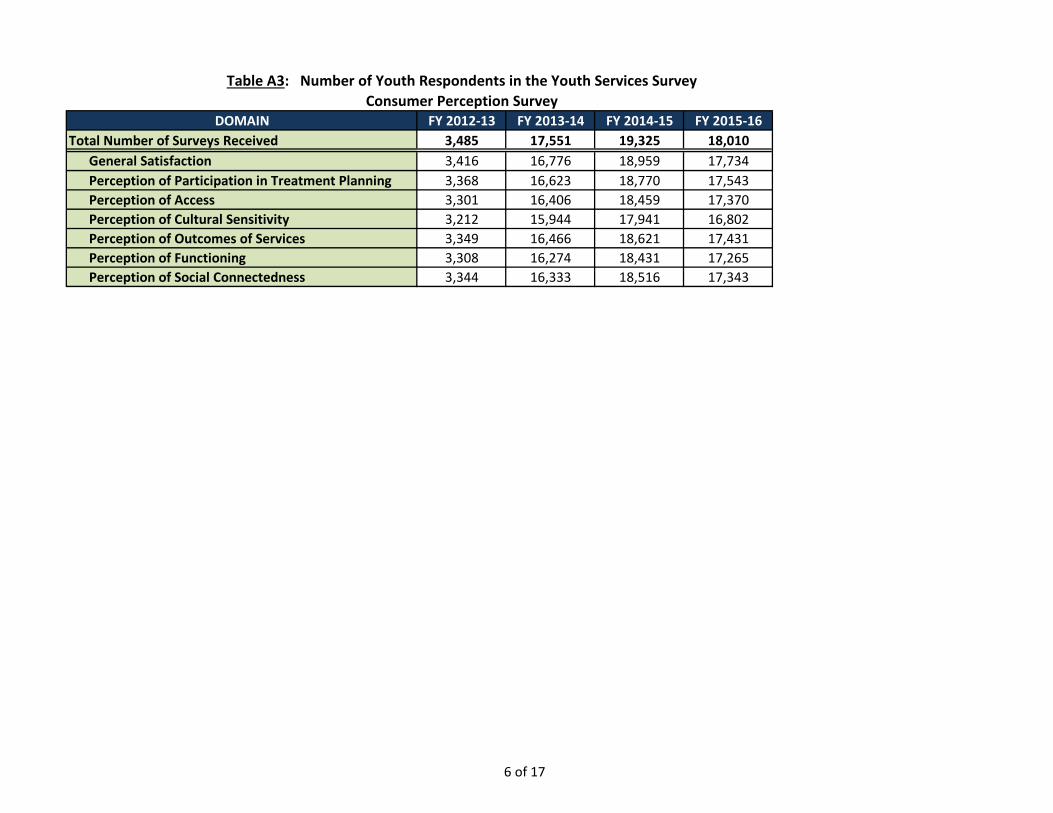
Table A3: Number of Youth Respondents in the Youth Services SurveyConsumer Perception Survey
DOMAIN FY 2012-13 FY 2013-14 FY 2014-15 FY 2015-16Total Number of Surveys Received 3,485 17,551 19,325 18,010
General Satisfaction 3,416 16,776 18,959 17,734Perception of Participation in Treatment Planning 3,368 16,623 18,770 17,543Perception of Access 3,301 16,406 18,459 17,370Perception of Cultural Sensitivity 3,212 15,944 17,941 16,802Perception of Outcomes of Services 3,349 16,466 18,621 17,431Perception of Functioning 3,308 16,274 18,431 17,265Perception of Social Connectedness 3,344 16,333 18,516 17,343
6 of 17
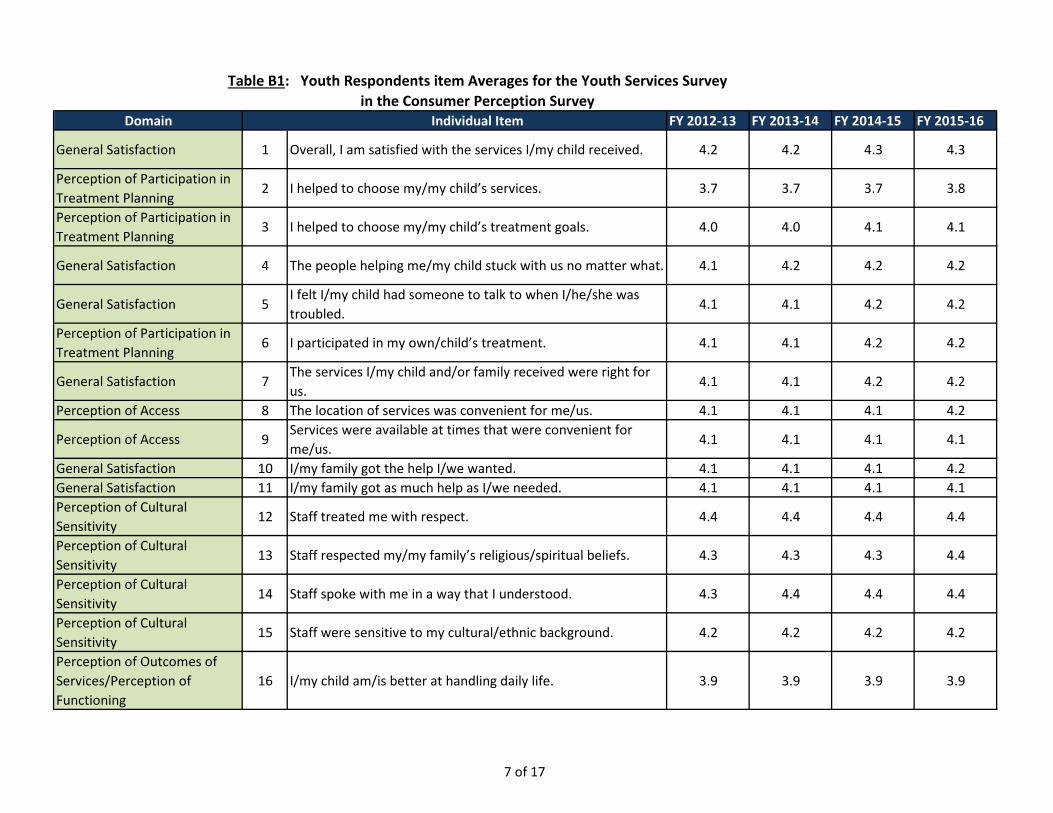
Table B1: Youth Respondents item Averages for the Youth Services Surveyin the Consumer Perception Survey
Domain Individual Item FY 2012-13 FY 2013-14 FY 2014-15 FY 2015-16
General Satisfaction 1 Overall, I am satisfied with the services I/my child received. 4.2 4.2 4.3 4.3
Perception of Participation in Treatment Planning
2 I helped to choose my/my child’s services. 3.7 3.7 3.7 3.8
Perception of Participation in Treatment Planning
3 I helped to choose my/my child’s treatment goals. 4.0 4.0 4.1 4.1
General Satisfaction 4 The people helping me/my child stuck with us no matter what. 4.1 4.2 4.2 4.2
General Satisfaction 5I felt I/my child had someone to talk to when I/he/she was troubled.
4.1 4.1 4.2 4.2
Perception of Participation in Treatment Planning
6 I participated in my own/child’s treatment. 4.1 4.1 4.2 4.2
General Satisfaction 7The services I/my child and/or family received were right for us.
4.1 4.1 4.2 4.2
Perception of Access 8 The location of services was convenient for me/us. 4.1 4.1 4.1 4.2
Perception of Access 9Services were available at times that were convenient for me/us.
4.1 4.1 4.1 4.1
General Satisfaction 10 I/my family got the help I/we wanted. 4.1 4.1 4.1 4.2General Satisfaction 11 I/my family got as much help as I/we needed. 4.1 4.1 4.1 4.1Perception of Cultural Sensitivity
12 Staff treated me with respect. 4.4 4.4 4.4 4.4
Perception of Cultural Sensitivity
13 Staff respected my/my family’s religious/spiritual beliefs. 4.3 4.3 4.3 4.4
Perception of Cultural Sensitivity
14 Staff spoke with me in a way that I understood. 4.3 4.4 4.4 4.4
Perception of Cultural Sensitivity
15 Staff were sensitive to my cultural/ethnic background. 4.2 4.2 4.2 4.2
Perception of Outcomes of Services/Perception of Functioning
16 I/my child am/is better at handling daily life. 3.9 3.9 3.9 3.9
7 of 17
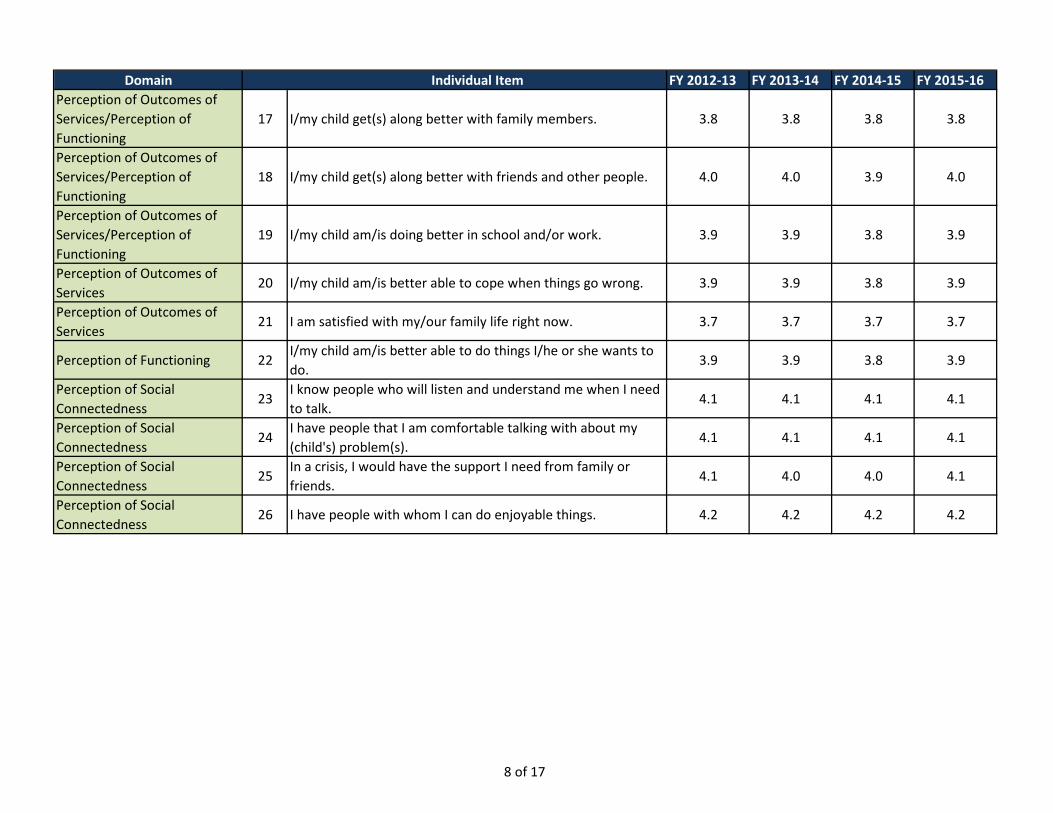
Domain Individual Item FY 2012-13 FY 2013-14 FY 2014-15 FY 2015-16Perception of Outcomes of Services/Perception of Functioning
17 I/my child get(s) along better with family members. 3.8 3.8 3.8 3.8
Perception of Outcomes of Services/Perception of Functioning
18 I/my child get(s) along better with friends and other people. 4.0 4.0 3.9 4.0
Perception of Outcomes of Services/Perception of Functioning
19 I/my child am/is doing better in school and/or work. 3.9 3.9 3.8 3.9
Perception of Outcomes of Services
20 I/my child am/is better able to cope when things go wrong. 3.9 3.9 3.8 3.9
Perception of Outcomes of Services
21 I am satisfied with my/our family life right now. 3.7 3.7 3.7 3.7
Perception of Functioning 22I/my child am/is better able to do things I/he or she wants to do.
3.9 3.9 3.8 3.9
Perception of Social Connectedness
23I know people who will listen and understand me when I need to talk.
4.1 4.1 4.1 4.1
Perception of Social Connectedness
24I have people that I am comfortable talking with about my (child's) problem(s).
4.1 4.1 4.1 4.1
Perception of Social Connectedness
25In a crisis, I would have the support I need from family or friends.
4.1 4.0 4.0 4.1
Perception of Social Connectedness
26 I have people with whom I can do enjoyable things. 4.2 4.2 4.2 4.2
8 of 17
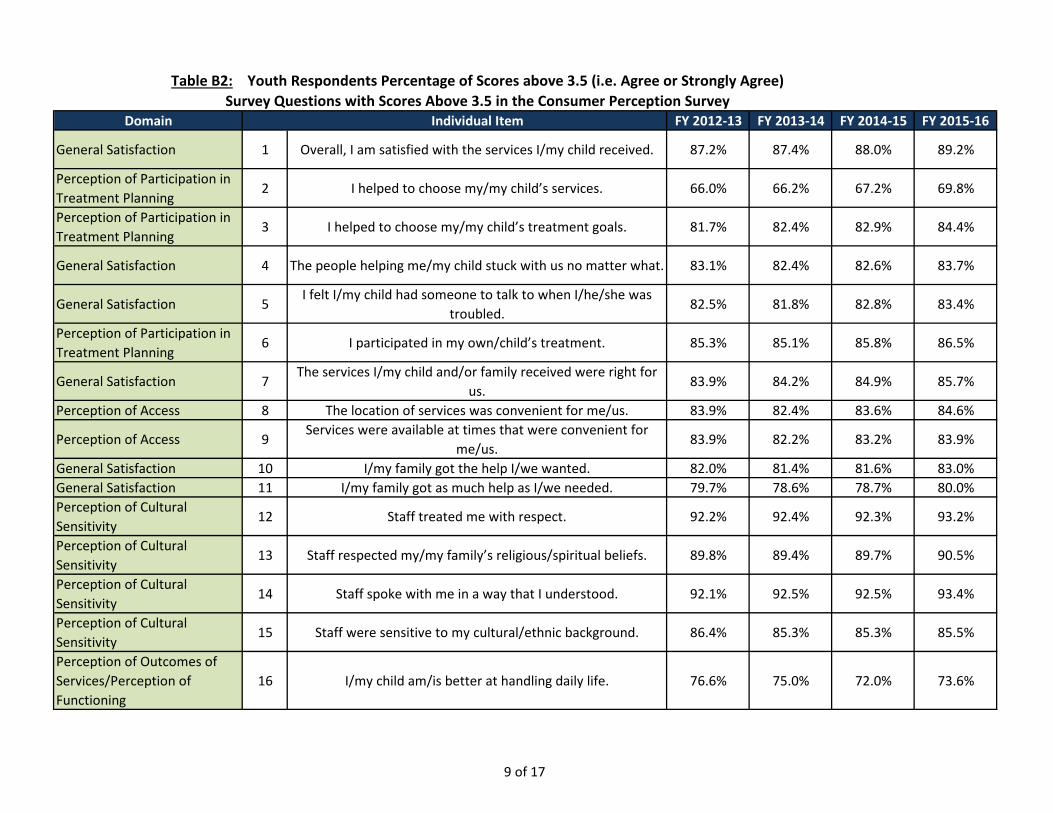
Table B2: Youth Respondents Percentage of Scores above 3.5 (i.e. Agree or Strongly Agree)Survey Questions with Scores Above 3.5 in the Consumer Perception Survey
Domain Individual Item FY 2012-13 FY 2013-14 FY 2014-15 FY 2015-16
General Satisfaction 1 Overall, I am satisfied with the services I/my child received. 87.2% 87.4% 88.0% 89.2%
Perception of Participation in Treatment Planning
2 I helped to choose my/my child’s services. 66.0% 66.2% 67.2% 69.8%
Perception of Participation in Treatment Planning
3 I helped to choose my/my child’s treatment goals. 81.7% 82.4% 82.9% 84.4%
General Satisfaction 4 The people helping me/my child stuck with us no matter what. 83.1% 82.4% 82.6% 83.7%
General Satisfaction 5I felt I/my child had someone to talk to when I/he/she was
troubled.82.5% 81.8% 82.8% 83.4%
Perception of Participation in Treatment Planning
6 I participated in my own/child’s treatment. 85.3% 85.1% 85.8% 86.5%
General Satisfaction 7The services I/my child and/or family received were right for
us.83.9% 84.2% 84.9% 85.7%
Perception of Access 8 The location of services was convenient for me/us. 83.9% 82.4% 83.6% 84.6%
Perception of Access 9Services were available at times that were convenient for
me/us.83.9% 82.2% 83.2% 83.9%
General Satisfaction 10 I/my family got the help I/we wanted. 82.0% 81.4% 81.6% 83.0%General Satisfaction 11 I/my family got as much help as I/we needed. 79.7% 78.6% 78.7% 80.0%Perception of Cultural Sensitivity
12 Staff treated me with respect. 92.2% 92.4% 92.3% 93.2%
Perception of Cultural Sensitivity
13 Staff respected my/my family’s religious/spiritual beliefs. 89.8% 89.4% 89.7% 90.5%
Perception of Cultural Sensitivity
14 Staff spoke with me in a way that I understood. 92.1% 92.5% 92.5% 93.4%
Perception of Cultural Sensitivity
15 Staff were sensitive to my cultural/ethnic background. 86.4% 85.3% 85.3% 85.5%
Perception of Outcomes of Services/Perception of Functioning
16 I/my child am/is better at handling daily life. 76.6% 75.0% 72.0% 73.6%
9 of 17
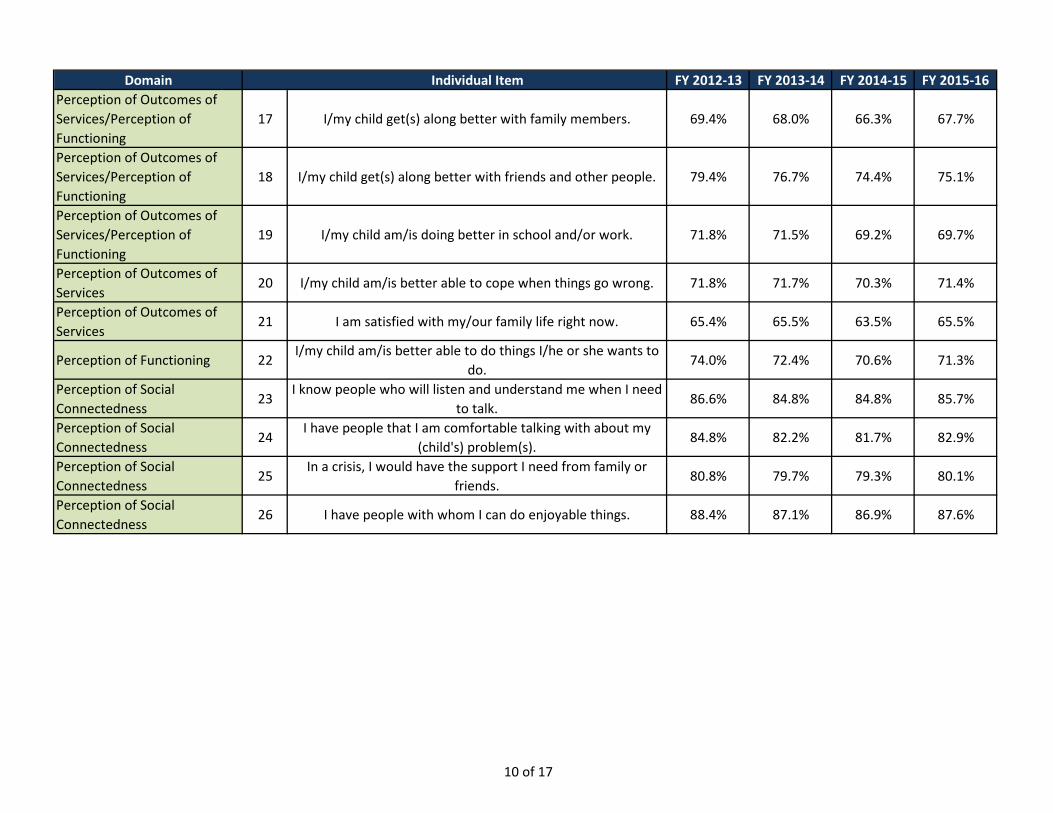
Domain Individual Item FY 2012-13 FY 2013-14 FY 2014-15 FY 2015-16Perception of Outcomes of Services/Perception of Functioning
17 I/my child get(s) along better with family members. 69.4% 68.0% 66.3% 67.7%
Perception of Outcomes of Services/Perception of Functioning
18 I/my child get(s) along better with friends and other people. 79.4% 76.7% 74.4% 75.1%
Perception of Outcomes of Services/Perception of Functioning
19 I/my child am/is doing better in school and/or work. 71.8% 71.5% 69.2% 69.7%
Perception of Outcomes of Services
20 I/my child am/is better able to cope when things go wrong. 71.8% 71.7% 70.3% 71.4%
Perception of Outcomes of Services
21 I am satisfied with my/our family life right now. 65.4% 65.5% 63.5% 65.5%
Perception of Functioning 22I/my child am/is better able to do things I/he or she wants to
do.74.0% 72.4% 70.6% 71.3%
Perception of Social Connectedness
23I know people who will listen and understand me when I need
to talk.86.6% 84.8% 84.8% 85.7%
Perception of Social Connectedness
24I have people that I am comfortable talking with about my
(child's) problem(s).84.8% 82.2% 81.7% 82.9%
Perception of Social Connectedness
25In a crisis, I would have the support I need from family or
friends.80.8% 79.7% 79.3% 80.1%
Perception of Social Connectedness
26 I have people with whom I can do enjoyable things. 88.4% 87.1% 86.9% 87.6%
10 of 17
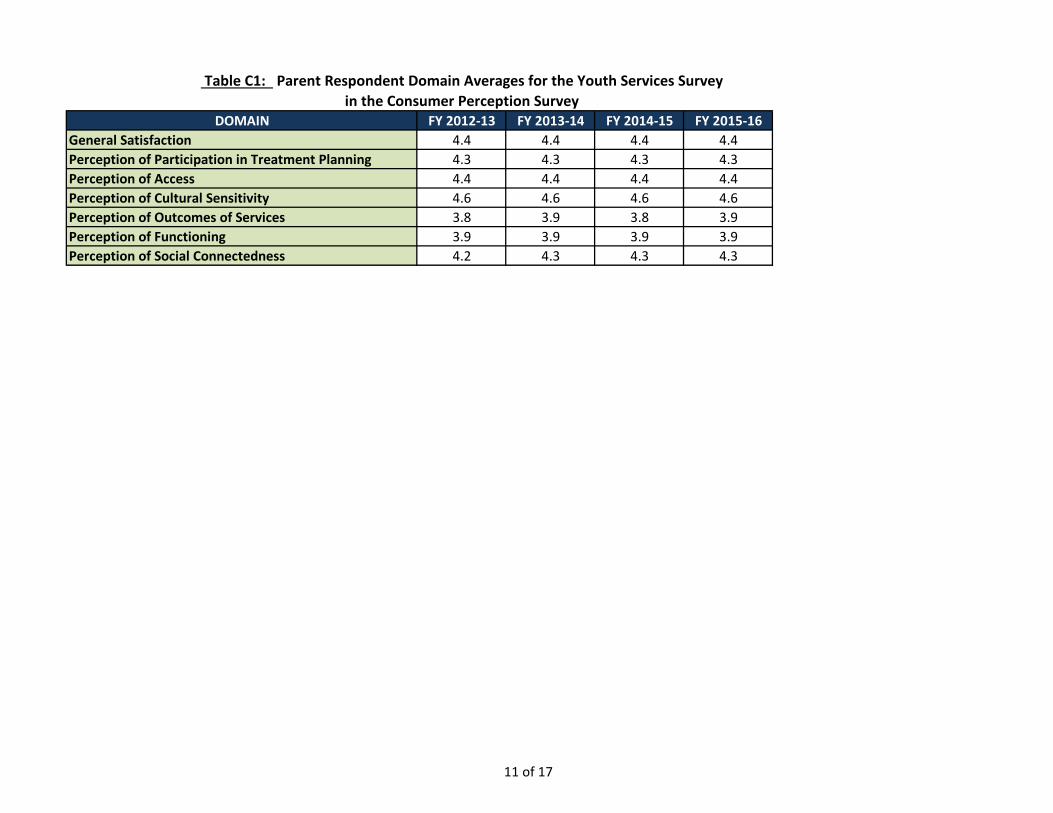
Table C1: Parent Respondent Domain Averages for the Youth Services Surveyin the Consumer Perception Survey
DOMAIN FY 2012-13 FY 2013-14 FY 2014-15 FY 2015-16General Satisfaction 4.4 4.4 4.4 4.4Perception of Participation in Treatment Planning 4.3 4.3 4.3 4.3Perception of Access 4.4 4.4 4.4 4.4Perception of Cultural Sensitivity 4.6 4.6 4.6 4.6Perception of Outcomes of Services 3.8 3.9 3.8 3.9Perception of Functioning 3.9 3.9 3.9 3.9Perception of Social Connectedness 4.2 4.3 4.3 4.3
11 of 17
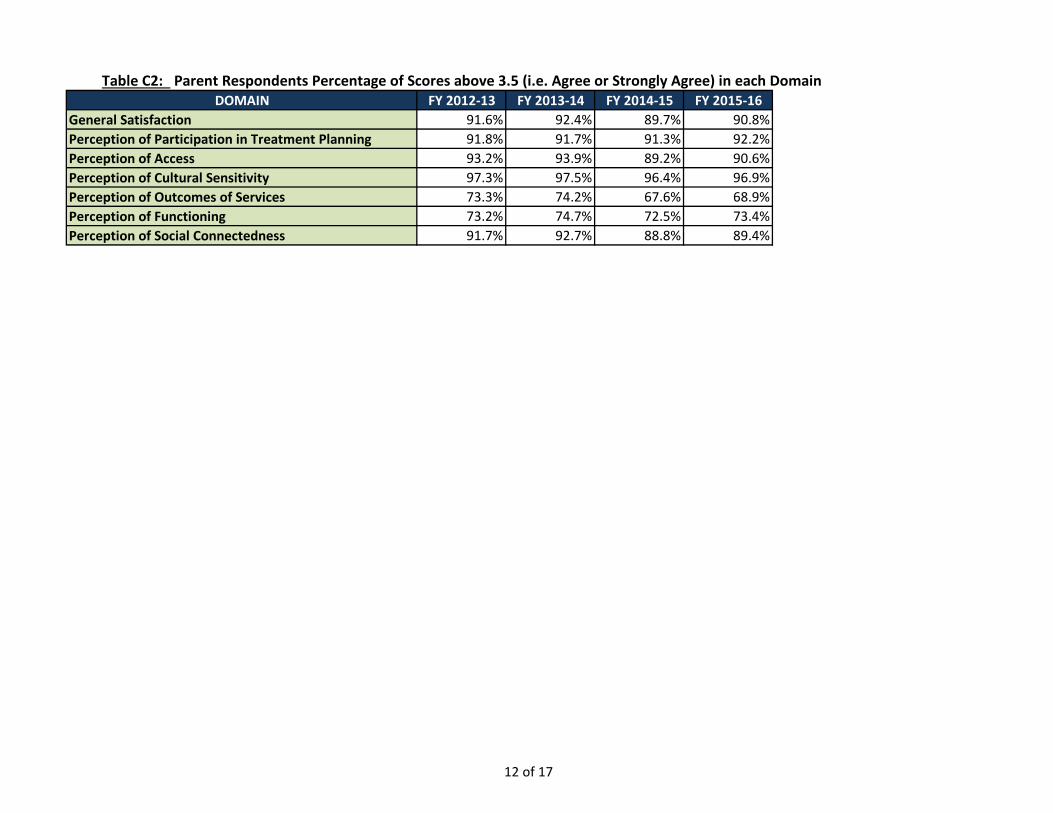
Table C2: Parent Respondents Percentage of Scores above 3.5 (i.e. Agree or Strongly Agree) in each DomainDOMAIN FY 2012-13 FY 2013-14 FY 2014-15 FY 2015-16
General Satisfaction 91.6% 92.4% 89.7% 90.8%Perception of Participation in Treatment Planning 91.8% 91.7% 91.3% 92.2%Perception of Access 93.2% 93.9% 89.2% 90.6%Perception of Cultural Sensitivity 97.3% 97.5% 96.4% 96.9%Perception of Outcomes of Services 73.3% 74.2% 67.6% 68.9%Perception of Functioning 73.2% 74.7% 72.5% 73.4%Perception of Social Connectedness 91.7% 92.7% 88.8% 89.4%
12 of 17

Table C3: Number of Parent Respondents in the Youth Services SurveyConsumer Perception Survey
DOMAIN FY 2012-13 FY 2013-14 FY 2014-15 FY 2015-16Total Number of Surveys Received 5,643 28,514 34,967 27,301
General Satisfaction 5,474 26,540 28,490 26,639Perception of Participation in Treatment Planning 5,396 26,108 28,073 26,291Perception of Access 5,431 26,495 28,399 26,596Perception of Cultural Sensitivity 5,090 24,900 26,654 24,853Perception of Outcomes of Services 5,257 25,676 27,512 25,670Perception of Functioning 5,154 25,288 27,086 25,293Perception of Social Connectedness 5,346 25,770 27,821 26,026
13 of 17
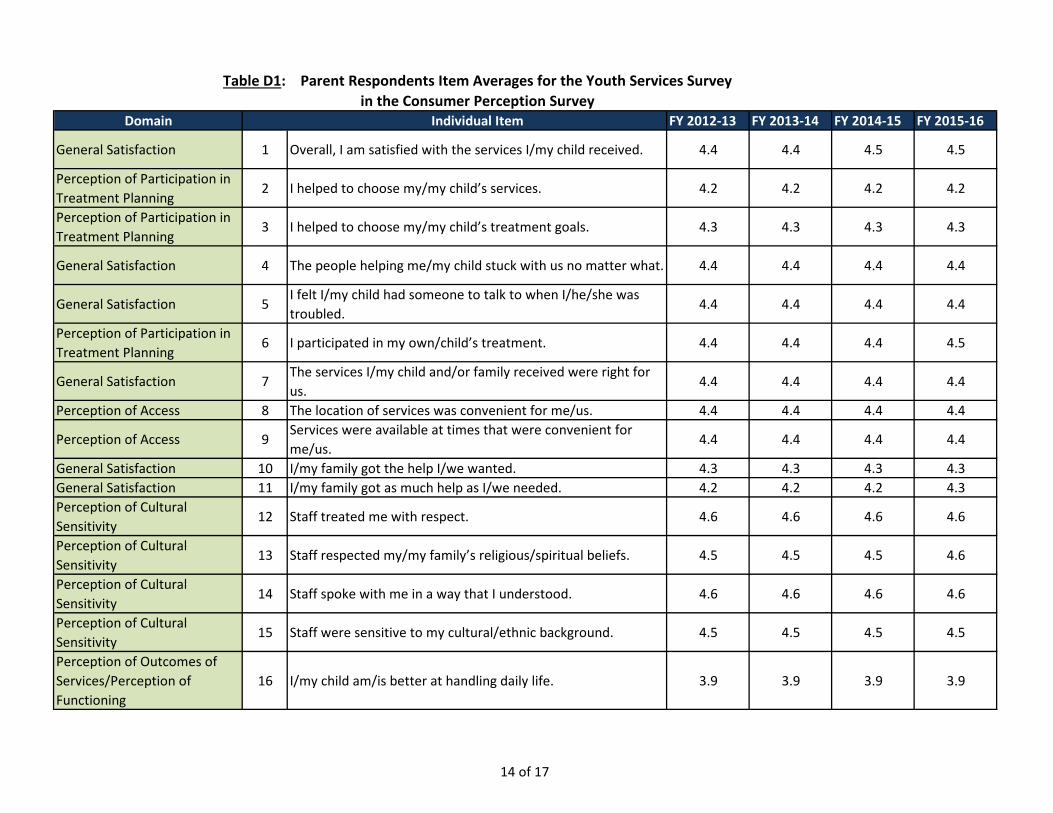
Table D1: Parent Respondents Item Averages for the Youth Services Surveyin the Consumer Perception Survey
Domain Individual Item FY 2012-13 FY 2013-14 FY 2014-15 FY 2015-16
General Satisfaction 1 Overall, I am satisfied with the services I/my child received. 4.4 4.4 4.5 4.5
Perception of Participation in Treatment Planning
2 I helped to choose my/my child’s services. 4.2 4.2 4.2 4.2
Perception of Participation in Treatment Planning
3 I helped to choose my/my child’s treatment goals. 4.3 4.3 4.3 4.3
General Satisfaction 4 The people helping me/my child stuck with us no matter what. 4.4 4.4 4.4 4.4
General Satisfaction 5I felt I/my child had someone to talk to when I/he/she was troubled.
4.4 4.4 4.4 4.4
Perception of Participation in Treatment Planning
6 I participated in my own/child’s treatment. 4.4 4.4 4.4 4.5
General Satisfaction 7The services I/my child and/or family received were right for us.
4.4 4.4 4.4 4.4
Perception of Access 8 The location of services was convenient for me/us. 4.4 4.4 4.4 4.4
Perception of Access 9Services were available at times that were convenient for me/us.
4.4 4.4 4.4 4.4
General Satisfaction 10 I/my family got the help I/we wanted. 4.3 4.3 4.3 4.3General Satisfaction 11 I/my family got as much help as I/we needed. 4.2 4.2 4.2 4.3Perception of Cultural Sensitivity
12 Staff treated me with respect. 4.6 4.6 4.6 4.6
Perception of Cultural Sensitivity
13 Staff respected my/my family’s religious/spiritual beliefs. 4.5 4.5 4.5 4.6
Perception of Cultural Sensitivity
14 Staff spoke with me in a way that I understood. 4.6 4.6 4.6 4.6
Perception of Cultural Sensitivity
15 Staff were sensitive to my cultural/ethnic background. 4.5 4.5 4.5 4.5
Perception of Outcomes of Services/Perception of Functioning
16 I/my child am/is better at handling daily life. 3.9 3.9 3.9 3.9
14 of 17

Domain Individual Item FY 2012-13 FY 2013-14 FY 2014-15 FY 2015-16Perception of Outcomes of Services/Perception of Functioning
17 I/my child get(s) along better with family members. 3.9 3.9 3.9 3.9
Perception of Outcomes of Services/Perception of Functioning
18 I/my child get(s) along better with friends and other people. 3.9 3.9 3.9 3.9
Perception of Outcomes of Services/Perception of Functioning
19 I/my child am/is doing better in school and/or work. 3.8 3.9 3.8 3.9
Perception of Outcomes of Services
20 I/my child am/is better able to cope when things go wrong. 3.7 3.8 3.7 3.8
Perception of Outcomes of Services
21 I am satisfied with my/our family life right now. 3.8 3.8 3.8 3.8
Perception of Functioning 22I/my child am/is better able to do things I/he or she wants to do.
3.9 3.9 3.9 3.9
Perception of Social Connectedness
23I know people who will listen and understand me when I need to talk.
4.2 4.3 4.2 4.3
Perception of Social Connectedness
24I have people that I am comfortable talking with about my (child's) problem(s).
4.3 4.3 4.3 4.3
Perception of Social Connectedness
25In a crisis, I would have the support I need from family or friends.
4.2 4.2 4.2 4.2
Perception of Social Connectedness
26 I have people with whom I can do enjoyable things. 4.2 4.3 4.3 4.3
15 of 17
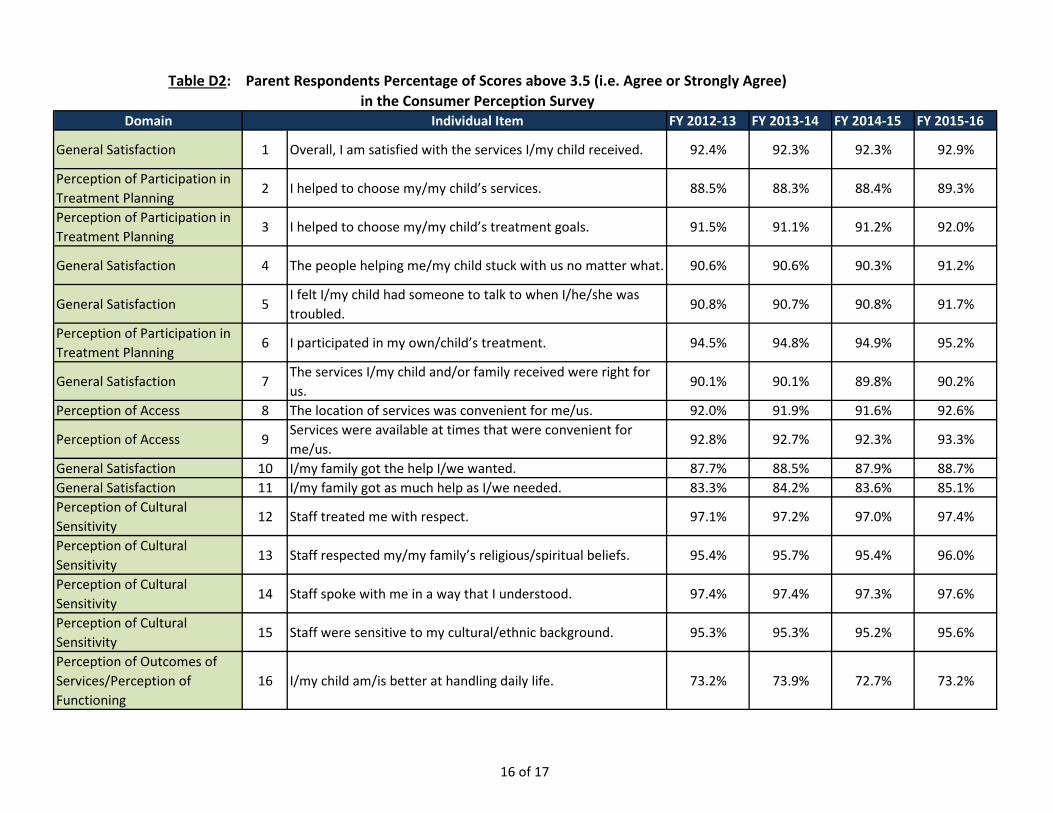
Table D2: Parent Respondents Percentage of Scores above 3.5 (i.e. Agree or Strongly Agree)in the Consumer Perception Survey
Domain Individual Item FY 2012-13 FY 2013-14 FY 2014-15 FY 2015-16
General Satisfaction 1 Overall, I am satisfied with the services I/my child received. 92.4% 92.3% 92.3% 92.9%
Perception of Participation in Treatment Planning
2 I helped to choose my/my child’s services. 88.5% 88.3% 88.4% 89.3%
Perception of Participation in Treatment Planning
3 I helped to choose my/my child’s treatment goals. 91.5% 91.1% 91.2% 92.0%
General Satisfaction 4 The people helping me/my child stuck with us no matter what. 90.6% 90.6% 90.3% 91.2%
General Satisfaction 5I felt I/my child had someone to talk to when I/he/she was troubled.
90.8% 90.7% 90.8% 91.7%
Perception of Participation in Treatment Planning
6 I participated in my own/child’s treatment. 94.5% 94.8% 94.9% 95.2%
General Satisfaction 7The services I/my child and/or family received were right for us.
90.1% 90.1% 89.8% 90.2%
Perception of Access 8 The location of services was convenient for me/us. 92.0% 91.9% 91.6% 92.6%
Perception of Access 9Services were available at times that were convenient for me/us.
92.8% 92.7% 92.3% 93.3%
General Satisfaction 10 I/my family got the help I/we wanted. 87.7% 88.5% 87.9% 88.7%General Satisfaction 11 I/my family got as much help as I/we needed. 83.3% 84.2% 83.6% 85.1%Perception of Cultural Sensitivity
12 Staff treated me with respect. 97.1% 97.2% 97.0% 97.4%
Perception of Cultural Sensitivity
13 Staff respected my/my family’s religious/spiritual beliefs. 95.4% 95.7% 95.4% 96.0%
Perception of Cultural Sensitivity
14 Staff spoke with me in a way that I understood. 97.4% 97.4% 97.3% 97.6%
Perception of Cultural Sensitivity
15 Staff were sensitive to my cultural/ethnic background. 95.3% 95.3% 95.2% 95.6%
Perception of Outcomes of Services/Perception of Functioning
16 I/my child am/is better at handling daily life. 73.2% 73.9% 72.7% 73.2%
16 of 17
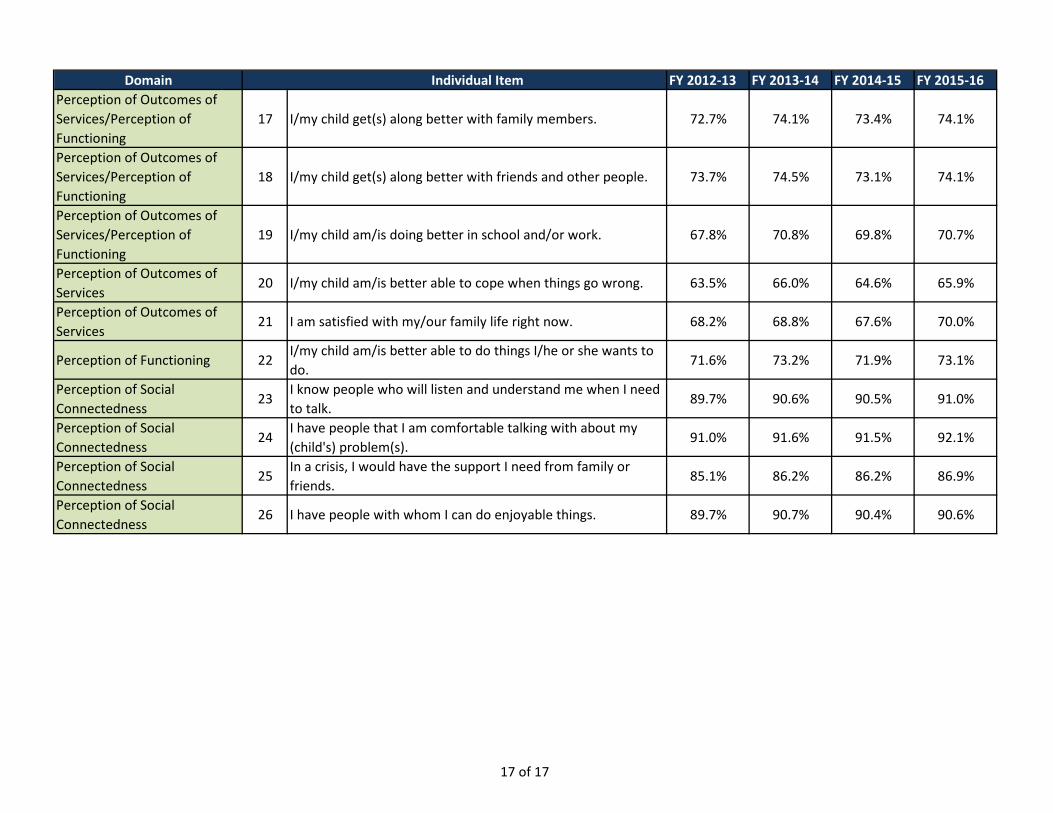
Domain Individual Item FY 2012-13 FY 2013-14 FY 2014-15 FY 2015-16Perception of Outcomes of Services/Perception of Functioning
17 I/my child get(s) along better with family members. 72.7% 74.1% 73.4% 74.1%
Perception of Outcomes of Services/Perception of Functioning
18 I/my child get(s) along better with friends and other people. 73.7% 74.5% 73.1% 74.1%
Perception of Outcomes of Services/Perception of Functioning
19 I/my child am/is doing better in school and/or work. 67.8% 70.8% 69.8% 70.7%
Perception of Outcomes of Services
20 I/my child am/is better able to cope when things go wrong. 63.5% 66.0% 64.6% 65.9%
Perception of Outcomes of Services
21 I am satisfied with my/our family life right now. 68.2% 68.8% 67.6% 70.0%
Perception of Functioning 22I/my child am/is better able to do things I/he or she wants to do.
71.6% 73.2% 71.9% 73.1%
Perception of Social Connectedness
23I know people who will listen and understand me when I need to talk.
89.7% 90.6% 90.5% 91.0%
Perception of Social Connectedness
24I have people that I am comfortable talking with about my (child's) problem(s).
91.0% 91.6% 91.5% 92.1%
Perception of Social Connectedness
25In a crisis, I would have the support I need from family or friends.
85.1% 86.2% 86.2% 86.9%
Perception of Social Connectedness
26 I have people with whom I can do enjoyable things. 89.7% 90.7% 90.4% 90.6%
17 of 17