Embed Size (px)
Citation preview
lable at ScienceDirect
Renewable Energy 164 (2021) 362e374
Contents lists avai
Renewable Energy
journal homepage: www.elsevier .com/locate/renene
Performance optimization of a solar adsorption chiller by dynamicallyadjusting the half-cycle time
Thanasis Basdanis , Alexandros Tsimpoukis *, Dimitris ValougeorgisDepartment of Mechanical Engineering, University of Thessaly, 38334, Volos, Greece
a r t i c l e i n f o
Article history:Received 1 May 2020Received in revised form13 September 2020Accepted 15 September 2020Available online 17 September 2020
Keywords:Solar coolingAdsorption chillerConstant cycle timeAdjusted cycle timeSilica gelewater
* Corresponding author.E-mail address: [email protected] (A. Tsimp
https://doi.org/10.1016/j.renene.2020.09.0720960-1481/© 2020 Elsevier Ltd. All rights reserved.
a b s t r a c t
The half-cycle time effect on the performance of a solar single-stage dual-bed adsorption chiller, inAthens, Greece, in July, is investigated. The adsorption chiller coupled with the solar system is simulated,in real time, during the day for a) constant and b) adjusted half-cycle times and the system performanceis monitored. In the former case, the half-cycle time is fixed, while in the latter one is dynamicallyadjusted according to the varying solar radiation intensity. Using a wide range of constant half-cycletimes it is found that the maximum daily cooling capacity is obtained at some constant half-cycletime, which is larger than the optimum one of a single adsorption cycle. Similarly, using a wide rangeof adjusted half-cycle times, the one, providing the maximum cooling capacity is defined. The analysis isperformed in a systematic manner through a proposed algebraic expression. It is found that thedynamically optimized adjusted half-cycle time operation mode provides about 12% higher daily andmonthly cooling capacities than the corresponding maximum constant ones. This significant increase hasbeen also confirmed for various incident solar radiation intensities.
© 2020 Elsevier Ltd. All rights reserved.
1. Introduction
Adsorption chillers powered by solar energy are considered asone of the most promising renewable technologies to significantlyreduce refrigeration and air-conditioning energy consumptiongenerated by excessive use of conventional vapor compressionsystems [1e4]. The main benefits of solar adsorption chillers,typically consisting of the solar thermal and adsorption chillersubsystems include the utilization of low-grade heat and naturalrefrigerants along with the relatively low operating costs. Based onthe adsorption cycle, several designs have been proposed. Amongthem, in the case of air-conditioning applications, the single-stagedual-bed adsorption chiller design, using, in parallel, one bed foradsorption and the other one for desorption, has several advan-tages and has received considerable attention [3,5e11]. In thisdesign, various working pairs with good performances and stabilitymay be used, the operation of the chiller is almost continuous, theoperating temperatures are relatively low and the chiller may becombined with either flat plate or evacuated tube collectors[10,12,13]. In particular, the performance of the silica gel-water
oukis).
single-stage dual-bed adsorption chiller, due to its suitability tolow-grade heat source, has been extensively parametrized, withlumped and elaborated models in Refs. [5,8e10,13e19] and[7,11,20e23] respectively.
Various improvements have been proposed to upgrade theperformance of the solar adsorption chillers, using advancedadsorption cycles or testing material properties, enhancing massand heat transfer. The integration of heat [24] and mass [25,26]recovery cycles, as well as of thermal [27] and convective thermalwave [28] cycles in the adsorption cycle, have been considered. Adetailed explanation of the different cycles and their performancemay be found in Refs. [1,2,4,29]. New composite adsorbents havebeen also considered [21,30], while more complex designs (e.g.three-stage adsorption cycle, multi-bed chillers, etc.) are emerging[31e34].
An important parameter that significantly affects the overallperformance of the chiller is the adsorption cycle time [4]. Theinfluence of the variation of the adsorption/desorption and pre-heating/precooling cycle times on the performance of the chillerhas been thoroughly examined, by implementing various ap-proaches to optimize the cycle time in order to maximize the sys-tem performance [7,10,35e39]. It has been clearly demonstratedthat by properly adapting the cycle times the chiller performancewill be enhanced. In all cases however, the system is parametrized
T. Basdanis, A. Tsimpoukis and D. Valougeorgis Renewable Energy 164 (2021) 362e374
by specifying each time a fixed cycle time, assuming that therequired heat source remains almost constant during the desig-nated course of the system operation. Thus, the cycle time is notdynamically adjusted based on the inlet hot water temperature,which may vary during the day, as in the case of solar poweredchillers. A performance comparison between the fixed cycle timeoperation and the corresponding variable cycle time one, takinginto consideration the data of an actual solar system, has beenexamined in Ref. [11]. It has been shown that the operation strategywith variable adsorption cycle time may improve the efficiency ofthe system, without integrating however in the model the solarthermal system (collectors and storage tank) which may affect theoverall performance. Based on all above, it is interesting to inves-tigate the effect of the cycle time on the overall systemperformancetaking into consideration the availability of the heat source underreal time conditions. The only attempt to computationally comparethe performance of an integrated solar powered two-bed silica gel-water adsorption chiller with fixed and adaptive cycle times is re-ported, very recently, in Ref. [40]. Based on an iterative optimiza-tion procedure, the optimal adaptive cycle times of the adsorption/desorption and preheating/precooling processes are obtained andthen, they are introduced as input to maximize the fixed cyclesystem performance.
In this context, the present work is focused on the detailedparametric analysis of the effect of the cycle time in a typical solarthermal single-stage dual-bed silica gel-water adsorption system.The integrated model consists of the adsorption chiller, which issimulated according to the mathematical model applied inRefs. [13,17e19,22] and the solar thermal system, which is based onflat plate collectors in the city of Athens, Greece in July. Two timecycle scenarios are considered: one with constant cycle time andanother one with dynamically adjusted cycle time according to thevariation of the solar radiation intensity and the available heat inthe thermal storage tank during the day. In both scenarios thestorage temperature, the heat supply, the cooling capacity and thecoefficient of performance of the solar adsorption chiller over thewhole day in real time are monitored. In the dynamically adjustedcycle time scenario, a methodology to easily estimate the optimumadjusted cycle times is presented.
2. Solar adsorption chiller modeling
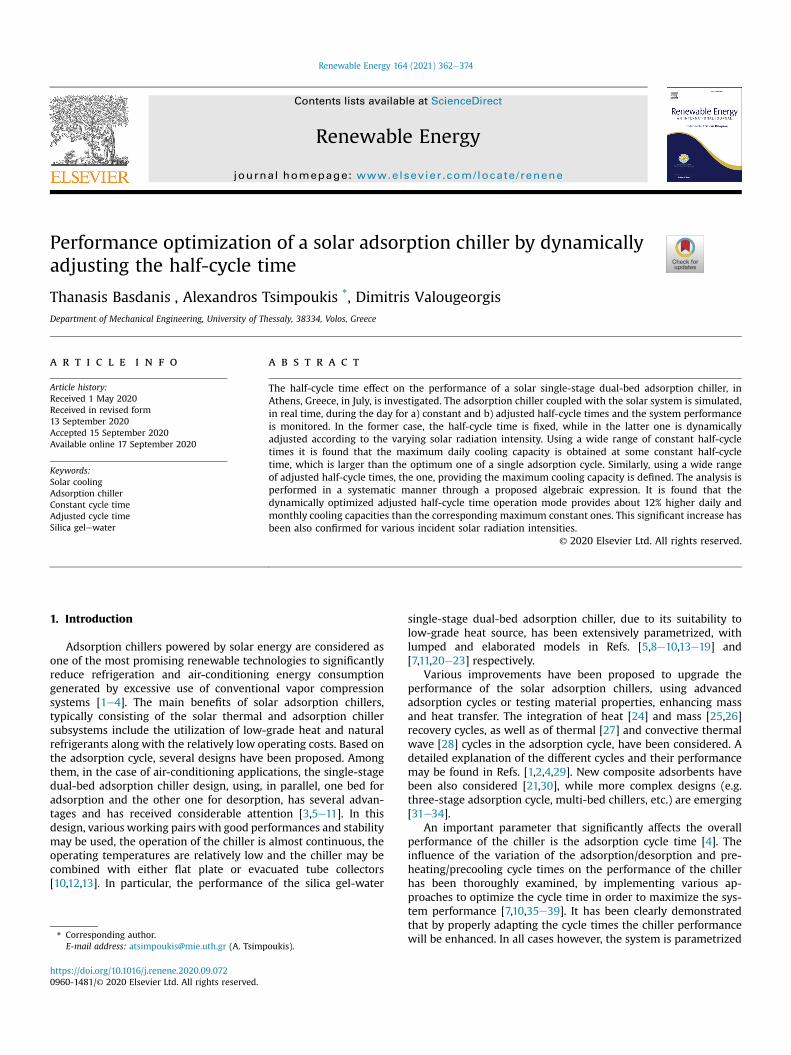
The parametrized solar adsorption chiller consists of the solarthermal system and the adsorption chiller and its schematic dia-gram is shown in Fig. 1. The solar collectors provide the hot water tothe storage tank, which is then supplied to the single-stage two-bed adsorption chiller to produce the chilled water. The description
Fig. 1. Schematic diagram of a
363
and the formulation of the solar and chiller subsystems are pro-vided in Sections 2.1 and 2.2 respectively.
2.1. Description and formulation of solar thermal system
The main components of the considered solar thermal systemare the flat solar collectors and the thermal storage tank (Fig.1). Theuseful thermal energy Qu collected by the solar collectors is givenby
Qu ¼ AcolFRhqsðtaÞeff � ULðTst � TambÞ
i: (1)
Furthermore, the storage temperature Tst is linked to the energybalance in the thermal storage tank, written as
mstcp;wdTstdt
¼Qu � QH : (2)
Here, QH is the heat supply from the solar thermal system to theadsorption chiller and it is proportional to the difference betweenthe temperatures of the hot water from the storage tank to thedesorption bed Thw;in and from the desorption bed back to thestorage tank Thw;out , both shown in Fig. 1, accordingly integratedover time. The heat losses along the interconnecting pipe elementsand from the storage tank to the surroundings are not considered.
Equations (1) and (2) modeling the solar thermal system arecoupled with the governing equations of the adsorption coolingsystem by the heat supply (or demand) QH and the associated hotwater inlet and outlet temperatures Thw;in and Thw;out , which areincluded in the energy balance of the desorption bed, presented inthe next subsection. It is noted that the storage and hot water inlettemperatures are considered to be the same at each time step, i.e.,Thw;in≡Tst .
In the present work, the implemented solar radiation andweather data plotted in Fig. 2, are for the city of Athens, Greece, inJuly [41]. The daily data are for mid-July (15/7), where themaximum solar radiation is 974W/m2, while the sunrise and sunsetare at 06:15 and 20:45 respectively. The ambient temperature maybe also approximated by the closed form expression [19].
Tamb ¼�Tmax þ Tmin
2
���Tmax � Tmin
2
�cos� p
12ðt� f Þ
�; (3)
where the daily maximum and minimum temperatures areTmax ¼ 31:9�C and Tmin ¼ 22:9�C respectively, while f ¼ 1 is thetime difference (in hours) between the time of maximum tem-perature and 12:00pm.
solar adsorption chiller.

Fig. 2. Solar radiation qS and ambient temperature Tamb in Athens, Greece, in July: a) daily data for 15/07/16 and b) monthly data for 01/07e31/07/16 [41].
T. Basdanis, A. Tsimpoukis and D. Valougeorgis Renewable Energy 164 (2021) 362e374
2.2. Description and formulation of adsorption system
The considered adsorption system is a typical single-stage dual-bed adsorption chiller, working without mass and heat recoveryand consisting of two beds, one evaporator and one condenser,interconnected with on-off valves V1eV4 and expansion valve EV,as shown in Fig. 1. Each bed is filled with silica gel and water actingas adsorbent material and refrigerant respectively. The specificworking pair is widely usedmainly due to the silica gel suitability tolow grade heat source as well as to its high adsorption capacity inwater, which is non-toxic, with large latent heat of vaporization andabundant in nature.
The operating procedure and the mathematical modeling of thisadsorption system are well-known in the solar adsorption coolingcommunity and have been recently analyzed [13]. However, a briefdescription and the mathematical formulation are repeated herefor completeness purposes, facilitating the presentation of the in-tegrated solar adsorption cooling model (Section 3) and the cor-responding results (Section 4).
Each cooling cycle consists of four phases, namely Phases A, B, Cand D and the corresponding phase times are denoted by tA, tB, tCand tD. In phase A (switching mode), all valves are closed and thepressure of one bed is increased to the condenser pressure, whilethe pressure of the other one is reduced to the evaporator pressure.Without loss of generality, it is assumed that the pressure of bed 1 isincreased and the pressure of bed 2 is decreased. Then, in phase B(adsorption/desorption mode), valves V2 and V4 remain closed,while valves V1 and V3 are opened to connect bed 2 with theevaporator and bed 1 with the condenser, operating in parallel, atthe adsorption-evaporation and desorption-condensation pro-cesses respectively (Fig. 1). In the former one, water boils at lowpressure in the evaporator, receiving heat from the chilled watercircuit and water vapor is adsorbed in bed 2, while the releasedheat is received by the coolingwater circuit. In the latter one, heat issupplied from the solar thermal system to bed 1, wherewater vaporis desorbed and condensed in the condenser, while the heat ofcondensation is received by the cooling water circuit. Phases C andD are identical to phases A and B respectively, except that, theprocess duties of beds 1 and 2 are reversed. The main objective ofthe present work is to compute the optimum half-cycle time
tHC ¼ tA þ tB (4)
in order to maximize the cooling capacity of the system taking intoconsideration in real time the available heat supply from the solarthermal system to the adsorption chiller.
The implemented mathematical modeling is based on a lumpedparameter model with silica gel and water being the working pair
364
and it has been widely applied [13,17e19,22]. The energy balanceequations and the outlet temperature using the logarithmic meantemperature difference at each main component of the adsorptionchiller read as follows:
Adsorption bed
�mscp;s þmsqacp;w þmb;cucp;cu þmb;alcp;al
� dTadt
¼fQstmsdqadt
þfmscp;vdqadt
ðTe � TaÞ þ _mcw;bcp;w�Tcw;in� Tcw;a;out
�(5)
Tcw;a;out ¼ Ta þ�Tcw;in � Ta
�exp
� UbAb
_mcw;bcp;w
!(6)
Desorption bed
�mscp;s þmsqdcp;wþmb;cucp;cu þmb;alcp;al
� dTddt
¼fQstmsdqddt
þ _mhwcp;w�Thw;in � Thw;out
�(7)
Thw;out ¼ Td þ�Thw;in � Td
�exp
�� UbAb
_mhwcp;w
�(8)
Condenser
�mc;cucp;cu þmc;wcp;w
� dTcdt
¼ �fLmsdqddt
þ _mcw;ccp;w�Tcw;in � Tcw;c;out
�� fcp;vðTd � TcÞmsdqddt
(9)
Tcw;c;out ¼ Tc þ�Tcw;in � Tc
�exp
�� UcAc
_mcw;ccp;w
�(10)
Evaporator

T. Basdanis, A. Tsimpoukis and D. Valougeorgis Renewable Energy 164 (2021) 362e374
�me;cucp;cu þme;wcp;w
� dTedt
¼ �fLmsdqadt
þ _mchwcp;w�Tchw;in � Tchw;c;out
�� fcp;wðTc � TeÞmsdqddt
(11)
Tchw;out ¼ Te þ�Tchw;in � Te
�exp
�� UeAe
_mchwcp;w
�: (12)
Also, the mass balance of the refrigerant in the evaporator isgiven by
dme;w
dt¼ �ms
�dqadt
þ dqddt
�: (13)
In Eqs. (5-13) the subscripts a, d, c, e, s, cu, al, v, cw, hw, chw, inand out refer to adsorption bed, desorption bed, condenser, evap-orator, silica gel, copper part, aluminum part, vapor, cooling water,hot water, chilled water, inlet and outlet of a stream, respectively.
Finally, the rates of adsorption and desorption are given by [42].
dqbdt
¼ 15Ds exp½ � Eact=ðRTÞ �ðq* � qbÞ�
R2p; (14)
where qb, with b ¼ a;d, is thewater content of the adsorbent and q*
is the corresponding quantity at equilibrium, computed from themodified Freundlich equation [13,19,43].
The characteristics and operating data of the adsorption coolingsystem considered in the present work, utilizing silica gel as adsor-bent and water as refrigerant, are the same as in Ref. [13] and arepresented in Table 1. Also, the solar thermal system consists of flatcollectors with FRðtaÞeff ¼ 0:75, FRUL ¼ 6W/K/m2 and Acol ¼ 70m2,while the water mass in the thermal storage tank is mst ¼ 500kg.The whole chiller is parameterized in terms of its half-cycle time inorder to maximize its cooling capacity.
3. Integrated model of the solar adsorption chiller
The solar thermal and the adsorption chiller are defined by Eqs.(1-2) and Eqs. (5-14) respectively, yielding a total system of 13coupled equations (Eq. (14) counts for two equations since it standsfor both adsorption and desorption rates). The system is consistingof first order ordinary differential equations (ODEs) and algebraicexpressions. The corresponding number of unknowns include theuseful thermal energy Qu, the storage temperature Tst (note thatTst≡Thw;in), the temperatures Ta, Td, Te, Tc and the associated outletwater temperatures Thw;out , Tcw;b;out , Tcw;c;out , Tchw;out of the fourmain components, the water contents of the adsorbent qa, qd and
Table 1Characteristics and operating data of the adsorption chiller [13].
Symbol Value Unit Symbol Value Unit
UbAb 4241:38 W=K cp;al 905 J=ðkg ,KÞUcAc 15249:8 W=K Ds 2:54� 10�4 m2=sUeAe 4884:9 W=K R 8:314 J=ðkg ,KÞmc;cu 24:28 kg Rp 1:74� 10�4 mme;cu 12:45 kg Qst 2:8� 106 J=kgms 47 kg L 2:5� 106 J=kgmb;cu 51:2 kg Ea 4:2� 104 J=molmb;al 64:04 kg _mcw;b 1:52 kg=smc;w 20 kg _mcw;c 1:37 kg=sme;w 50 kg _mhw 1:28 kg=scp;w 4186 J=ðkg ,KÞ _mchw 0:7 kg=scp;s 924 J=ðkg ,KÞ Tcw;in 30 �Ccp;cu 386 J=ðkg ,KÞ Tchw;in 14:8 �Ccp;v 1866 J=ðkg ,KÞ
365
the water mass in the evaporator me;w. All unknown quantitiesdepend on time. The first order ODEs are approximated by Euler’smethod and the whole system (ODEs and algebraic expressions) isevolved in time.
The flow chart of the implemented algorithm, shown in Fig. 3,has a main inner loop simulating the adsorption chiller, which isincluded in the outer loop simulating the solar thermal system.Once the weather data and the initial values, including Tst≡Thw;in, aswell as the time duration tA of Phase A, tB of Phase B and tHC ¼ tA þtB of the half-cycle time, are provided, the code in the inner loop iscomputing the time evolution of all unknown quantities of theadsorption chiller during t2½0; tHC �, with time step Dt < < tHC , ac-cording to Eqs. (5-14). At the end of the half-cycle time all quan-tities, including the outlet hot and chilled water temperaturesThw;out and Tchw;out respectively, are known. In addition, the half-cycle-average heat supply QH delivered to the adsorption chillerduring the desorption process, the half-cycle-average cooling ca-pacity QC delivered by the adsorption chiller and the coefficient ofperformance (COP) over the half-cycle time are computed accord-ing to
QH ¼ 1tHC
ðtHC0
_mhwcp;w�Thw;in � Thw;out
�dt; (15)
QC ¼1tHC
ðtHC0
_mchwcp;w�Tchw;in � Tchw;out
�dt (16)
and
COP¼ QC
QH: (17)
At the end of each half-cycle, the computed hot water outlettemperature Thw;out is provided to the outer loop to find, via Eqs. (1)and (2), the updated temperature of the storage tank Tst at the timetþ tHC , which then is given back to the inner loop, as input, for thesecond half of the cycle, i.e., Tstðt þ tHCÞ≡Thw;inðt þ tHCÞ, while theduties of the two beds have been reversed. Obviously, the couplingbetween the inner and outer loops occurs every half-cycle time andthe time step of the outer loop is tHC . The described procedure isrepeated to simulate a whole day (24 h). Integrating the heat de-mand, the cooling capacity and the coefficient of performance overa day, the daily cooling capacity and heat load QC;day and QH;dayrespectively, as well as the daily average COPday, may be obtained.Similarly, the associated monthly quantities may be obtained.
The performance of a solar adsorption chiller depends both onthe cooling capacity and coefficient of performance, which bothdepend on the adsorption half-cycle time tHC [5,10,11,14,18]. Basedon the developed algorithm, the performance of the solar adsorp-tion chiller may be optimized according to the availability of theheat supply to the adsorption chiller. This is achieved by accord-ingly adapting the duration of the half-cycle time to the hot waterinlet temperature, which will vary with the daytime and theweather conditions.
Here, two scenarios for the half-cycle time are considered,namely the constant and the adjusted ones. In the constant half-cycle time scenario, the system performance is parametrized interms of tHC until the half-cycle time with the largest cooling ca-pacity is obtained. Thus, although the hot water inlet temperatureis computed, it is not taken into account to change tHC . On thecontrary, in the adjusted half-cycle time scenario, the time of eachhalf adsorption cycle is altered in order to obtain the largest cooling

Fig. 3. Flow diagram of the inner and outer loop of the code simulating the solar adsorption chiller.
T. Basdanis, A. Tsimpoukis and D. Valougeorgis Renewable Energy 164 (2021) 362e374
capacity according to the specific hot water inlet temperature andthe overall system conditions. Thus, tHC is adjusted, during the day,according to the output of the solar thermal system. Elaboratedcycle time scenarios are investigated by considering the coolingcapacity, as well as the coefficient of performance in order tomaximize the daily and monthly cooling capacities.
Closing the description of the flow chart algorithm, it may beuseful to note that only for the initiation of the evolution processthe values of qa, qd, Ta, Td, Te, Tc are obtained through an iterativeprocedure, satisfying all energy balances. The developed code hasbeen written in MATLAB and the CPU time of a typical run, withDt ¼ 1s, is negligible.
The implemented algorithm and deduced computational resultsare validated by performing a comparison with available results inRef. [13,17]. More specifically, by fixing tA ¼ 30s, tB ¼ 420s andTcw;in ¼ 31:1oC and using all other data of the adsorption chilleraccording to Table 1, the computed half-cycle-average cooling ca-pacity and coefficient of performance are provided in Table 2 for
Table 2Half-cycle-average cooling capacity QC and COP in terms of hot water inlet tem-perature Thw;in with tA ¼ 30s and tB ¼ 420s.
Thw;in[oC] 65 70 75 80 85 90 95
QC [W] 7.2 9.3 11.2 12.9 14.3 15.6 16.6COP 0.406 0.435 0.451 0.458 0.459 0.456 0.450
366
various hot water inlet temperatures Thw;in, while the detailedvariation of all outlet temperatures during the fixed half-cycle timeis viewed in Fig. 4a for Thw;in ¼ 85:7oC. Comparing these resultswith the corresponding ones in Ref. [17] (see Figs. 2 and 3a inRefs. [17]) an excellent agreement is observed. Furthermore,simulating the whole solar adsorption system, the half-cycle-average cooling capacity and coefficient of performance duringthe course of a day (24 h) are plotted in Fig. 4b. The applied solarradiation intensity andweather data are the ones in Ref. [13]. Again,very good agreement in both quantities is observed with the cor-responding ones in Refs. [13] (see Fig. 4a in Ref. [13]).
4. Results and discussion
Both scenarios of constant and adjusted adsorption cycle timesare investigated by simulating in real time the adsorption chillercoupledwith the solar thermal system. The inlet temperature of thehot water from the storage tank to the desorption bed Thw;in isassumed to remain constant during the half-cycle. This is readilyjustified since the half-cycle time is too short compared to the 24-hambient temperature variation. Of course, the corresponding hotwater outlet temperature Thw;out varies with time during the half-cycle time.
The present section includes three subsections: In Section 4.1,the half-cycle time parametrization is performed only for theadsorption chiller, with specified hot water inlet temperatures. InSection 4.2, the whole solar adsorption chiller on a daily basis is

Fig. 4. Algorithm validation: a) Outlet temperatures of the four main chiller components during half a cycle for Thw;in ¼ 85:7oC; b) Cooling capacity QC and COP of the solaradsorption system during a day (in all cases tA ¼ 30s, tB ¼ 420s).
T. Basdanis, A. Tsimpoukis and D. Valougeorgis Renewable Energy 164 (2021) 362e374
modeled, using constant half-cycle time. The optimum half-cycletimes, providing the maximum half-cycle and daily average cool-ing capacities are defined. In Section 4.3 the dynamically optimizedadjusted half-cycle time operation mode is properly implementedin the whole solar adsorption chiller on a daily basis, improvingfurther the delivered maximum constant half-cycle cooling ca-pacities. A methodology of estimating the optimum half-cycletimes, in a computationally efficient manner, is provided.
4.1. Optimum half-cycle time in terms of hot water inlettemperature for a single adsorption cycle
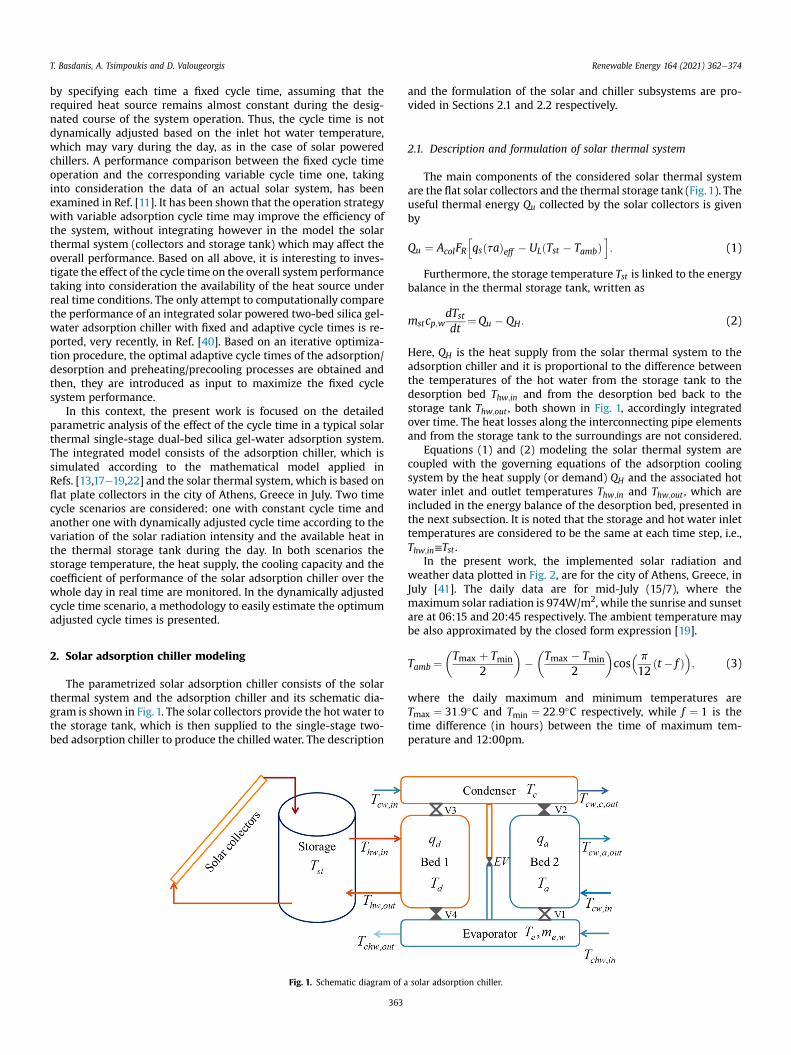
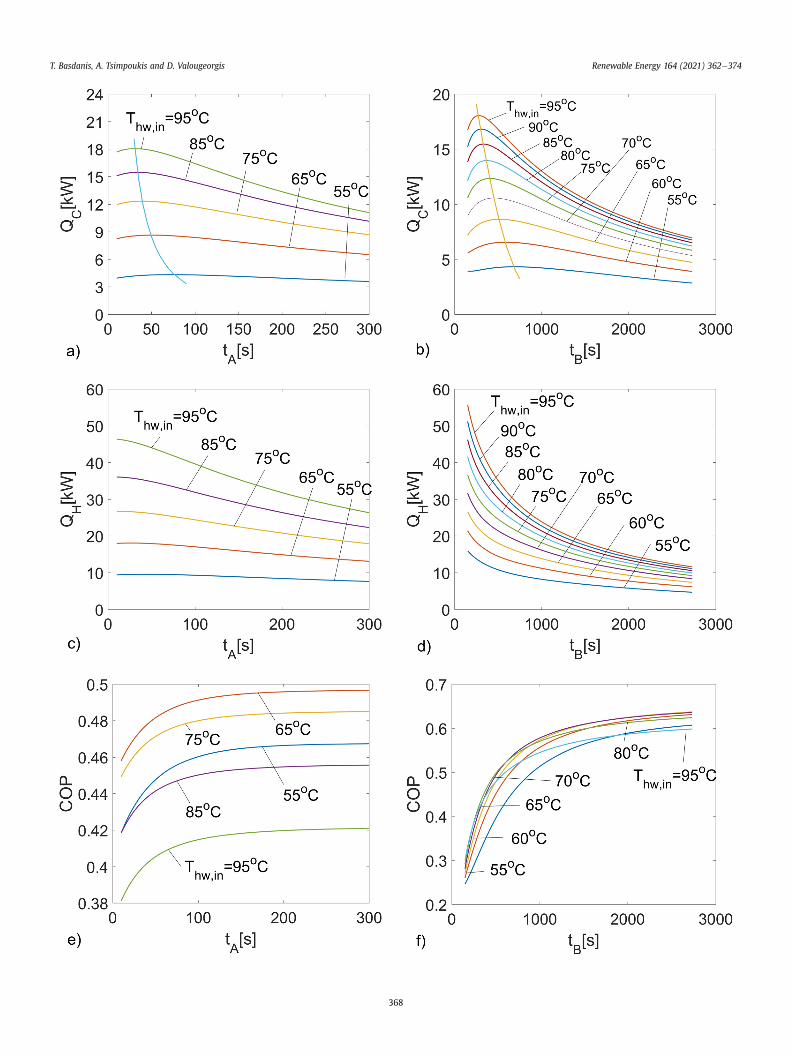
The adsorption chiller, as defined above, is simulated during ahalf-cycle time t2½0; tHC �, in a wide range of specified hot waterinlet temperatures Thw;in from 55oC up to 95oC, computing the half-cycle-average cooling capacity QC, heat supply QH and coefficient ofperformance COP. The effect of the half-cycle time tHC ¼ tAþ tB isinvestigated by varying the time duration tA and tB of Phases A andB respectively and computing for each time pair (tA; tB) the outputquantities. The pair resulting in the maximum half-cycle-averagecooling capacity QC;max is the optimum one and the correspond-ing times are denoted by tA;opt and tB;opt . This procedure is repeatedfor each Thw;in. Phases C and D are not examined since they aresimilar to A and B respectively. It is noted that the dependency ofQC , QH and COP on the cycle time for a single adsorption cycle hasbeen previously reported in several studies [5,11,18,38,39,43].However, it is also examined here, in order to have a better insightin the behavior of the chiller coupled with the solar thermal sub-system, as well as to the search of the optimum adjusted half-cycletime maximizing the cooling capacity of the whole system.
In Table 3, the optimum times tA;opt , tB;opt and the correspondingmaximum half-cycle-average cooling capacity QC;max, with theassociated heat supply QH and coefficient of performance COP are
Table 3Optimum times tA;opt and tB;opt of phases A and B respectively, corresponding tomaximum half-cycle-average cooling capacity QC;max, with associated heat demandQH and COP in terms of hot water inlet temperature Thw;in .
Thw;in[oC] tA;opt [s] tB;opt[s] QC;max[kW] QH[kW] COP
55 75 700 4.32 9.47 0.45660 60 600 6.55 13.58 0.48265 50 510 8.63 17.90 0.48270 45 450 10.56 22.18 0.47675 40 410 12.34 26.35 0.46880 35 370 13.96 30.82 0.45385 35 330 15.46 35.46 0.43690 30 310 16.81 39.83 0.42295 30 270 18.05 45.47 0.397
367
tabulated for various values of Thw;in from 55oC up to 95oC. As Thw;inis increased, tA;opt and tB;opt are monotonically decreased, whileQC;max and QH are monotonically increased. On the contrary, COP isinitially increased and then is decreased, with its maximum valueoccurring at about Thw;in ¼ 65oC. This behavior, described for theoptimum time pairs ðtA;opt ;tB;optÞ, remains qualitatively the same forany time pair ðtA;tBÞ, with the maximum COP occurring at differentThw;in. This is readily explained, since as Thw;in is increased, theamount of water that can be desorbed and adsorbed is alsoincreased, accelerating the adsorption/desorption processes andresulting, in general, in shorter times tA and tB, as well as to largerQC [42]. It is noted that the increase of Thw;in affects only thedesorption bed temperature, while the adsorption bed temperatureis maintained approximately constant due to the constant coolingwater temperature. Obviously, QH is also increased with Thw;in.Concerning the coefficient of performance, at small Thw;in, QC in-creases faster than QH , while at large Thw;in this trend is reversed,resulting in the observed non-monotonic behavior of COP.Comparing the optimum time of Phases A and B it is noted that forthe specific adsorption chiller, tB;opt is always about one order ofmagnitude larger than tA;opt .
A detailed graphical view of the effect of the time duration ofPhases A and B is shown in Fig. 5, where the output quantities QC ,QH and COP are plotted in terms of tA and tB respectively, for variousvalues of Thw;in. The effect of tA is investigated by setting tB ¼ tB;optand similarly, the effect of tB by setting tA ¼ tA;opt . The optimumtimes for each Thw;in are obtained from Table 3. Therefore, the half-cycle times are in the former case tHC ¼ tA þ tB;opt and in the latterone tHC ¼ tA;opt þ tB. The investigated range of phase duration timesare tA � 300s and tB � 2700s, while larger values have no techno-logical interest. The dependency of QC and QH on the hotwater inlettemperature remains the same, i.e., they are both monotonicallyincreased with Thw;in. For each Thw;in, as either tA or tB are increased,QC is also increased up to some maximum value QC;max corre-sponding to the time pair (tA;opttB;opt), also provided in Table 3, andthen, it is steadily decreased. As Thw;in is increased, both tA;opt andtB;opt , are decreased. This is clearly demonstrated by drawing a lineconnecting the maximum cooling capacities at different Thw;in.Furthermore, the heat supply QH is monotonically decreased, aseither tA or tB is increased. Also, as the phase duration times areincreased the effect of Thw;in onQH is drastically reduced. This is alsotrue for QC provided that tA and tB are larger than their optimumvalues. Obviously, the daily cooling capacity of a solar adsorptionchiller may be improved by adjusting the half-cycle time accordingto Thw;in, which of course is changing along the day.
Continuing with the COP, it is seen that it is monotonicallyincreased with either tA or tB, which implies that as the phaseduration times are increased, the reduction in QC is always smaller
T. Basdanis, A. Tsimpoukis and D. Valougeorgis Renewable Energy 164 (2021) 362e374
368
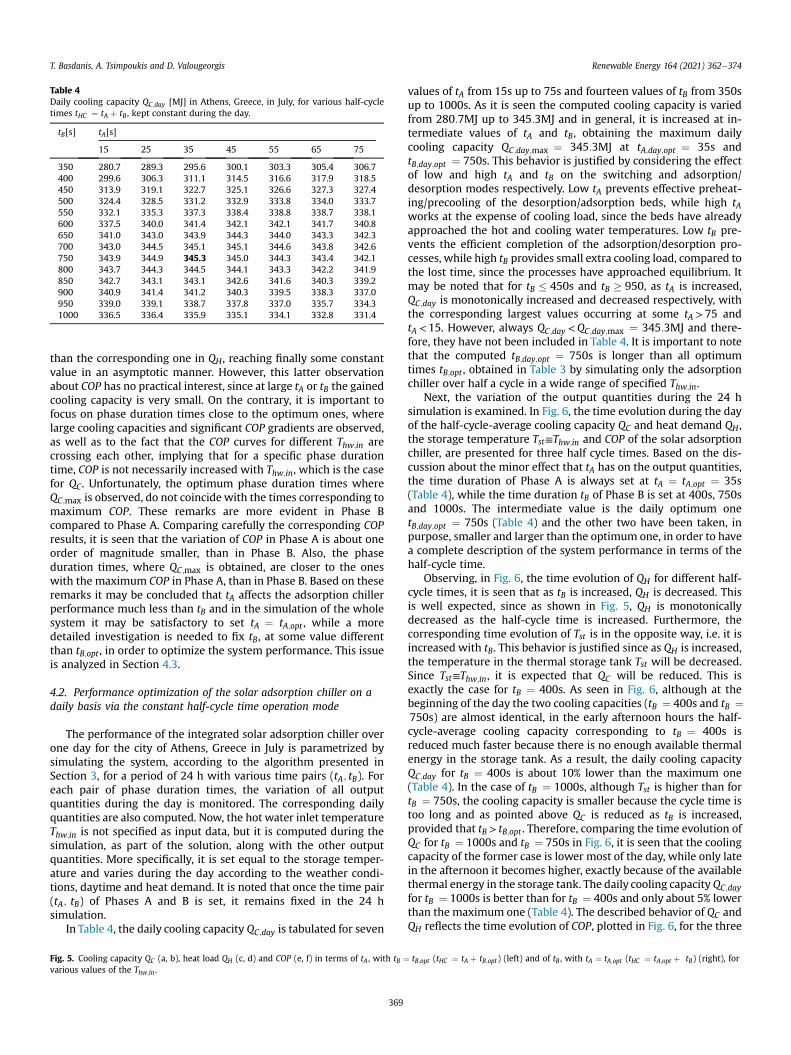
Table 4Daily cooling capacity QC;day [MJ] in Athens, Greece, in July, for various half-cycletimes tHC ¼ tA þ tB , kept constant during the day.
tB[s] tA[s]
15 25 35 45 55 65 75
350 280.7 289.3 295.6 300.1 303.3 305.4 306.7400 299.6 306.3 311.1 314.5 316.6 317.9 318.5450 313.9 319.1 322.7 325.1 326.6 327.3 327.4500 324.4 328.5 331.2 332.9 333.8 334.0 333.7550 332.1 335.3 337.3 338.4 338.8 338.7 338.1600 337.5 340.0 341.4 342.1 342.1 341.7 340.8650 341.0 343.0 343.9 344.3 344.0 343.3 342.3700 343.0 344.5 345.1 345.1 344.6 343.8 342.6750 343.9 344.9 345.3 345.0 344.3 343.4 342.1800 343.7 344.3 344.5 344.1 343.3 342.2 341.9850 342.7 343.1 343.1 342.6 341.6 340.3 339.2900 340.9 341.4 341.2 340.3 339.5 338.3 337.0950 339.0 339.1 338.7 337.8 337.0 335.7 334.31000 336.5 336.4 335.9 335.1 334.1 332.8 331.4
T. Basdanis, A. Tsimpoukis and D. Valougeorgis Renewable Energy 164 (2021) 362e374
than the corresponding one in QH , reaching finally some constantvalue in an asymptotic manner. However, this latter observationabout COP has no practical interest, since at large tA or tB the gainedcooling capacity is very small. On the contrary, it is important tofocus on phase duration times close to the optimum ones, wherelarge cooling capacities and significant COP gradients are observed,as well as to the fact that the COP curves for different Thw;in arecrossing each other, implying that for a specific phase durationtime, COP is not necessarily increased with Thw;in, which is the casefor QC. Unfortunately, the optimum phase duration times whereQC;max is observed, do not coincide with the times corresponding tomaximum COP. These remarks are more evident in Phase Bcompared to Phase A. Comparing carefully the corresponding COPresults, it is seen that the variation of COP in Phase A is about oneorder of magnitude smaller, than in Phase B. Also, the phaseduration times, where QC;max is obtained, are closer to the oneswith the maximum COP in Phase A, than in Phase B. Based on theseremarks it may be concluded that tA affects the adsorption chillerperformance much less than tB and in the simulation of the wholesystem it may be satisfactory to set tA ¼ tA;opt , while a moredetailed investigation is needed to fix tB, at some value differentthan tB;opt , in order to optimize the system performance. This issueis analyzed in Section 4.3.
4.2. Performance optimization of the solar adsorption chiller on adaily basis via the constant half-cycle time operation mode
The performance of the integrated solar adsorption chiller overone day for the city of Athens, Greece in July is parametrized bysimulating the system, according to the algorithm presented inSection 3, for a period of 24 h with various time pairs (tA; tB). Foreach pair of phase duration times, the variation of all outputquantities during the day is monitored. The corresponding dailyquantities are also computed. Now, the hot water inlet temperatureThw;in is not specified as input data, but it is computed during thesimulation, as part of the solution, along with the other outputquantities. More specifically, it is set equal to the storage temper-ature and varies during the day according to the weather condi-tions, daytime and heat demand. It is noted that once the time pair(tA; tB) of Phases A and B is set, it remains fixed in the 24 hsimulation.
In Table 4, the daily cooling capacity QC;day is tabulated for seven
Fig. 5. Cooling capacity QC (a, b), heat load QH (c, d) and COP (e, f) in terms of tA , with tB ¼various values of the Thw;in .
369
values of tA from 15s up to 75s and fourteen values of tB from 350sup to 1000s. As it is seen the computed cooling capacity is variedfrom 280:7MJ up to 345:3MJ and in general, it is increased at in-termediate values of tA and tB, obtaining the maximum dailycooling capacity QC;day;max ¼ 345:3MJ at tA;day;opt ¼ 35s andtB;day;opt ¼ 750s. This behavior is justified by considering the effectof low and high tA and tB on the switching and adsorption/desorption modes respectively. Low tA prevents effective preheat-ing/precooling of the desorption/adsorption beds, while high tAworks at the expense of cooling load, since the beds have alreadyapproached the hot and cooling water temperatures. Low tB pre-vents the efficient completion of the adsorption/desorption pro-cesses, while high tB provides small extra cooling load, compared tothe lost time, since the processes have approached equilibrium. Itmay be noted that for tB � 450s and tB � 950, as tA is increased,QC;day is monotonically increased and decreased respectively, withthe corresponding largest values occurring at some tA >75 andtA <15. However, always QC;day <QC;day;max ¼ 345:3MJ and there-fore, they have not been included in Table 4. It is important to notethat the computed tB;day;opt ¼ 750s is longer than all optimumtimes tB;opt , obtained in Table 3 by simulating only the adsorptionchiller over half a cycle in a wide range of specified Thw;in.
Next, the variation of the output quantities during the 24 hsimulation is examined. In Fig. 6, the time evolution during the dayof the half-cycle-average cooling capacity QC and heat demand QH ,the storage temperature Tst≡Thw;in and COP of the solar adsorptionchiller, are presented for three half cycle times. Based on the dis-cussion about the minor effect that tA has on the output quantities,the time duration of Phase A is always set at tA ¼ tA;opt ¼ 35s(Table 4), while the time duration tB of Phase B is set at 400s, 750sand 1000s. The intermediate value is the daily optimum onetB;day;opt ¼ 750s (Table 4) and the other two have been taken, inpurpose, smaller and larger than the optimum one, in order to havea complete description of the system performance in terms of thehalf-cycle time.
Observing, in Fig. 6, the time evolution of QH for different half-cycle times, it is seen that as tB is increased, QH is decreased. Thisis well expected, since as shown in Fig. 5, QH is monotonicallydecreased as the half-cycle time is increased. Furthermore, thecorresponding time evolution of Tst is in the opposite way, i.e. it isincreased with tB. This behavior is justified since as QH is increased,the temperature in the thermal storage tank Tst will be decreased.Since Tst≡Thw;in, it is expected that QC will be reduced. This isexactly the case for tB ¼ 400s. As seen in Fig. 6, although at thebeginning of the day the two cooling capacities (tB ¼ 400s and tB ¼750s) are almost identical, in the early afternoon hours the half-cycle-average cooling capacity corresponding to tB ¼ 400s isreduced much faster because there is no enough available thermalenergy in the storage tank. As a result, the daily cooling capacityQC;day for tB ¼ 400s is about 10% lower than the maximum one(Table 4). In the case of tB ¼ 1000s, although Tst is higher than fortB ¼ 750s, the cooling capacity is smaller because the cycle time istoo long and as pointed above QC is reduced as tB is increased,provided that tB > tB;opt . Therefore, comparing the time evolution ofQC for tB ¼ 1000s and tB ¼ 750s in Fig. 6, it is seen that the coolingcapacity of the former case is lower most of the day, while only latein the afternoon it becomes higher, exactly because of the availablethermal energy in the storage tank. The daily cooling capacityQC;dayfor tB ¼ 1000s is better than for tB ¼ 400s and only about 5% lowerthan the maximum one (Table 4). The described behavior of QC andQH reflects the time evolution of COP, plotted in Fig. 6, for the three
tB;opt (tHC ¼ tA þ tB;opt ) (left) and of tB , with tA ¼ tA;opt (tHC ¼ tA;opt þ tB) (right), for

Fig. 6. Time evolution of half-cycle-average heat demand QH (a), storage temperature Tst (b), half-cycle-average cooling capacity QC (c) and COP (d) over a day for tA ¼ tA;opt and tB ¼½400;750;1000�s.
T. Basdanis, A. Tsimpoukis and D. Valougeorgis Renewable Energy 164 (2021) 362e374
half-cycle times. The COP results for tB ¼ 750s and tB ¼ 1000salmost coincide, with the latter ones being slightly larger, althoughthe corresponding QC and QH are smaller. The rapid increase of COPat the end of the day is due to the fact that QC >QH and has nopractical impact because at that late times during the day both QCand QH are very small. The results of COP for tB ¼ 400s are muchsmaller than the other ones, indicating that although QC is aboutthe same, the required QH , in this case, is much larger.
Overall, it may be stated that the maximum daily cooling ca-pacity for each solar adsorption chiller is obtained at some constanthalf-cycle time, which is larger than the optimum half-cycle timeobtained by modeling only the adsorption chiller over half a cycleand for specified hot water inlet temperatures. This is explained bythe fact that by properly increasing the half-cycle time above itsoptimum value, deduces larger COP resulting in higher coolingcapacity. Therefore, the variable half-cycle time operation mode isanalyzed in the next subsection, by introducing a dynamicallyadjusted half-cycle time methodology in order to further improvethe cooling capacity of the system.
4.3. Performance optimization of the solar adsorption chiller on adaily basis via the optimized adjusted half-cycle time operationmode
In a typical solar thermal system, the storage temperature Tstand consequently, the inlet temperature of the hot water Thw;in tothe adsorption chiller are varying during the day. It has beendemonstrated that the half-cycle-average cooling capacity QC de-pends strongly on Thw;in and it is maximized at some specific half-cycle time, which however is varied, along with Thw;in, during theday. Thus, a methodology by properly adjusting the cycle timeduring the day in order to increase the daily cooling capacity,
370
compared to the constant optimum cycle time approach previouslypresented, is here explored.
It has been shown that in order to maximize the performance insolar adsorption chillers operating on a daily basis, it is satisfactoryto set tA ¼ tA;opt , while the choice of tB is not straightforward, but inany case, it should be larger than tB;opt , where the optimum timesare the ones obtained by simulating only the adsorption chiller overhalf a cycle (Section 4.1). It has been also shown that tB should notbe too long because then the cooling capacity is significantlyreduced. It is expected that by properly adjusting the optimumhalf-cycle time during the day, the small reduction in the cooling ca-pacity will be compensated with the large increase in COP andcould increase the total daily cooling load.
It is proposed to define the adjusted half-cycle time (AHCT)operation mode, with the associated half-cycle times as
tAHCðqÞ¼ t*A;opt þ tB;AHCðqÞ; (18)
where
tB;AHCðqÞ¼ t*B;optð1þ qÞ: (19)
Here t*A;opt and t*B;opt are the optimal half-cycle times of Phases A and
B respectively, provided by the inner loop of the algorithm (Section3) and they vary during the day according to the specific input data.The values of t*A;opt and t*B;opt are, in general, close to but not equal to
the corresponding ones tA;opt and tB;opt (Section 4.1), since theydepend mainly on Thw;in but also on other quantities (qa, qd, Ta, Td,Tc, Te). Furthermore, the parameter q � 0, indicates the relativeincrease of the optimum time of Phase B (for q ¼ 0, tB;AHC ¼ t*B;opt).
On the contrary, since the half-cycle on phase A is much shorter

T. Basdanis, A. Tsimpoukis and D. Valougeorgis Renewable Energy 164 (2021) 362e374
than the one of phase B, no relative increase of t*A;opt is applied. The
system performance is parametrized in terms of q in order todeduce the maximum daily cooling capacity.
More specifically, the algorithm described in Section 3, based onthe AHCT mode, works as follows: The parameter q is specified andremains constant the whole day. During the day, at each time step,the parameter q, along with the other varying parameters,including Thw;in, are provided as input data in the inner loop, whichis executed for various half-cycle times of phases A and B until theoptimum t*A;opt and t*B;optðqÞ, as well as the associated tAHCðqÞ are
obtained. Based on the corresponding optimized half-cycle outputquantities of the inner loop the outer loop is executed to providethe updated input data in the next inner loop. This procedure isapplied throughout the day and it is repeated for various q, until themaximum daily cooling capacity is obtained.
The effectiveness of the proposed approach is demonstrated bysimulating the considered solar adsorption chiller during the day,based on the AHCT mode for q equal to 0, 0.5, 1 and 1.5. The mainreported output quantities include the half-cycle-average coolingcapacity QC and heat supply QH, storage temperature Tst≡ Thw;in andCOP. The solar radiation andweather data are the ones presented inSection 2.1. The overall daily quantities are tabulated in Table 5 andtheir time evolution, during the day, is plotted in Fig. 7. In addition,for comparison purposes, the constant half-cycle results (CHCT)with the maximum daily cooling capacity QC;day;max ¼ 345:3MJ attA ¼ 35and tB ¼ 750s, presented in Section 4.2, are also included.The associated adjusted half-cycle times tAHCðqÞ during the day areshown in Fig. 8.
In Table 5, it is seen that as q is increased the daily cooling ca-pacity is increased up to q ¼ 1 and then it is decreased, while thedaily heat supply is monotonically decreased. Also, the averagedaily COP is monotonically increased with q, since for q> 1 thereduction in the heat supply is larger than in the cooling capacity. Itis concluded that the best choice, maximizing the daily coolingcapacity is by setting the adjusted half-cycle time equal to tAHC ¼t*A;opt þ 2t*B;opt , (q ¼ 1). It is also seen that the maximum daily
cooling capacity with the AHCTmode is equal to 388:5MJ, while thecorresponding one with the constant half-cycle time is 345:3MJ, i.e.the former one is 12:5% higher. It is also useful to note that allcooling capacities for 0:5 � q � 1:5 are larger than the maximizedconstant one. As expected, the lowest cooling capacity with theAHCT operation mode is at q ¼ 0.
In Fig. 7, the time evolution of the output quantities during theday is shown for all AHCT scenarios and the optimized CHCT. TheAHCT scenario, with q ¼ 1, is the superior one, providing the largesthalf-cycle-average cooling capacity during most of the day. It is alsocharacterized by low heat supply (very close to the lowest one,which is at q ¼ 1:5) and high storage temperature, as well as byhigh COP (very close to the highest one, which is at q ¼ 1:5). TheAHCT operation mode scenario, with q ¼ 1:5 is the second best.However, compared to the one with q ¼ 1, its adjusted half-cycletime is too long and its cooling capacity has been reduced.
Table 5Daily cooling capacity QC;day, heat supply QH;day and average COPday based onadjusted half-cycle time (AHCT) and comparison with the optimized constant one(CHCT) in Athens, Greece, in July.
Quantity AHCT CHCT
q ¼ 0 q ¼ 0:5 q ¼ 1 q ¼ 1:5 ð35;750ÞQC;day [MJ] 305.7 369.2 388.5 383.5 345.3QH;day [MJ] 762.0 684.1 627.8 584.2 676.7COPday 0.401 0.540 0.619 0.656 0.510
371
Obviously, with q ¼ 1, the half-cycle time is optimally extended andthe small reduction in the half-cycle cooling capacity, combinedwith the larger increase in COP, provides the maximum coolingcapacity.
In Fig. 8, the corresponding adjusted half-cycle timestAHCðqÞ ¼ t*A;opt þ t*B;optð1þqÞ during the day for q equal to 0, 0.5, 1
and 1.5 are shown. The constant half-cycle time of 785s associatedwith the maximum cooling capacity for CHCT operation mode isalso included. In all cases, the half-cycle times take large valuesearly in the morning and late in the evening, while their minimumvalues are in the midday, approximately between 14:00e16:00,where they are almost constant. Also, the half-cycle times in themorning compared to the corresponding ones in the afternoon arelonger for q ¼ 1:5 and shorter for q ¼ 0;0:5, while they are aboutthe same for q ¼ 1, which as earlier specified, is the optimum AHCTscenario providing the maximum daily cooling capacity for theinvestigated system.
The above one-day simulations have been also performed forthe whole month of July in order to check the sensitivity of theresults on the detailed solar radiation and weather data over anextended time period. It has been found that the AHCT scenariowith q ¼ 1 remains the optimum one compared to the other AHCTones, as well as to the optimized constant half-cycle time one. Morespecifically, the monthly cooling capacities of the AHCT with q ¼ 1and of the optimized CHCT scenarios are 12:3GJ and 10:9GJrespectively.
It is noted that so-far, all reported results, including the ones forthe optimum value of q are based on the specific solar radiationintensity data provided in Section 2.1. Since these input data arevery important for solar powered adsorption chillers, it is useful toinvestigate the effect of solar radiation intensity on q. Therefore,simulations have been performed based on solar radiation given by
qs ¼ qs;max sin�p
t � trisetsunset � trise
�; (20)
where qs;max is equal to 700; 800; 900 and 1000 W/m2 while thesunrise and sunset times, the ambient temperature, as well as allother parameters, are kept the same. Tabulated results of the dailycooling capacities for all qs;max and various AHCT scenarios with0:8 � q � 1:5 are given in Table 6. The associated maximum coolingcapacities for the CHCToperation mode is also included. As qS;max isincreased, the optimum value of q, providing the maximum dailycooling capacity QC;day, is decreased, varying from q ¼ 1:4 down toq ¼ 1:0. However, for values of q close to the optimum ones, thecorresponding cooling capacities are very close to the maximumones. In general, half-cycle times which are about two times thecorresponding optimized half-cycle times deduced by the innerloop of the algorithm are always very close to the optimum ones.Compared to themaximum cooling capacity for the CHCToperationmode, the corresponding maximum AHCT ones, depending on thespecific value of qS;max, are higher about 12� 16%.
Overall, it is seen that the proposed simple expression (19) forthe dynamically adjusted half-cycle time is effective, provided thatthe relative increase of the optimum half-cycle is properly esti-mated. More elaborated approaches, involving directly Thw;in in thederived expression may be considered, resulting probably to evenhigher cooling capacities.
5. Concluding remarks
The effect of the half-cycle time tHC on the performance of atypical solar single-stage dual-bed adsorption chiller is computa-tionally investigated. The weather and radiation data are for the

Fig. 7. Time evolution of half-cycle-average cooling capacity QC (a), half-cycle-average heat demand QH (b), storage temperature Tst (c) and COP (d) over a day for adjusted half-cycletime (AHCT) and comparison with the optimized constant one (CHCT).
T. Basdanis, A. Tsimpoukis and D. Valougeorgis Renewable Energy 164 (2021) 362e374
city of Athens, Greece, in July.Simulating first only the adsorption chiller over half a cycle, the
optimum half-cycle times tHC;opt , maximizing the half-cycle averagecooling capacity QC in terms of the specified hot water inlet tem-peratures Thw;in from 55oC up to 95oC, are defined. It is found that astHC is increased, the peaks of QC and COP appear at different half-cycle times.
Next, simulating the adsorption chiller coupled with the solarthermal system, during the day for a wide range of constant half-cycle times, the maximum daily cooling capacity, with the associ-ated optimum daily half-cycles are obtained. Now, the hot waterinlet temperature Thw;in is computed during the simulation, along
Fig. 8. Adjusted half-cycle times tAHC during the day of various AHCT scenarios (theoptimized constant one is also included).
372
with the other output quantities. It has been found that themaximum daily cooling capacity is obtained at some half-cycletime, which is larger than tHC;opt . This behavior is readilyexplained by observing the time evolution of the output quantitiesduring the day. More specifically, it is seen that by increasing theoptimum half-cycle time, the small reduction in the half-cycle-average cooling capacity combined with the large increase inCOP, increase the daily cooling capacity of the system. It is notedthat in this parametric analysis, tHC remains fixed during the 24 hsimulation.
Finally, the dynamically optimized adjusted half-cycle timemodel tAHC is introduced. Again the solar adsorption chiller issimulated for 24 h, but the half-cycle time is accordingly updated,depending on the computed Thw;in during the day. A parameterq � 0, indicating the relative increase of tHC;opt , is introduced and itsoptimal value is estimated. It has been found that the maximumdaily cooling capacity with the adjusted half-cycle operation modeis significantly higher than the corresponding constant half-cycleone. More specifically by setting tAHCx2tHC;opt , with tHC;opt vary-ing during the day according to Thw;in and the other varying pa-rameters, the daily cooling capacity, compared to the maximumone of the constant half-cycle time, is increased more than 12%.This result has been confirmed by computing the correspondingmonthly cooling capacities and for various solar radiationintensities.
A simple methodology of defining for each solar adsorptionchiller the optimum half-cycle time in order to maximize thecooling capacity of the system is presented and its effectiveness is

Table 6Daily cooling capacity QC;day based on adjusted half-cycle time (AHCT) with various qfor several maximum solar irradiations qS;max(the optimized CHTC one is alsoincluded).
qS;max[W/m2]
AHCT CHCT
q ¼0:8
q ¼0:9
q ¼ 1 q ¼1:1
q ¼1:2
q ¼1:3
q ¼1:4
q ¼1:5
700 350.4 351.8 356.4 359.6 361.1 361.2 363.9 361.9 313.1800 408.0 411.1 415.1 415.9 419.3 419.2 418.1 415.8 365.9900 464.8 469.5 471.4 471.6 469.8 469.1 467.2 464.5 415.41000 513.8 514.8 515.4 514.8 511.8 510.7 508.2 504.6 461.9
T. Basdanis, A. Tsimpoukis and D. Valougeorgis Renewable Energy 164 (2021) 362e374
demonstrated by simulating in real time the adsorption chillercoupled with the solar system. The developed model may beapplied to upgrade the performance of adsorption-type coolingfacilities utilizing low-grade heat and considering various workingpairs.
CRediT authorship contribution statement
Thanasis Basdanis: Methodology, Software, Formal analysis,Writing - original draft, Visualization. Alexandros Tsimpoukis:Conceptualization, Investigation, Writing - original draft, Writing -review & editing. Dimitris Valougeorgis: Conceptualization,Writing - review & editing, Supervision, Project administration.
Declaration of competing interest
The authors declare that they have no known competingfinancial interests or personal relationships that could haveappeared to influence the work reported in this paper.
Appendix A. Supplementary data
Supplementary data to this article can be found online athttps://doi.org/10.1016/j.renene.2020.09.072.
References
[1] D. Wang, J. Zhang, X. Tian, D. Liu, K. Sumathy, Progress in silica gelewateradsorption refrigeration technology, Renew. Sustain. Energy Rev. 30 (2014)85e104.
[2] P. Goyal, P. Baredar, A. Mittal, A.R. Siddiqui, Adsorption refrigeration tech-nology - an overview of theory and its solar energy applications, Renew.Sustain. Energy Rev. 53 (2016) 1389e1410.
[3] R.P. Sah, B. Choudhury, R.K. Das, A. Sur, An overview of modelling techniquesemployed for performance simulation of lowegrade heat operated adsorptioncooling systems, Renew. Sustain. Energy Rev. 74 (2017) 364e376.
[4] A. Alahmer, S. Ajib, X. Wang, Comprehensive strategies for performanceimprovement of adsorption air conditioning systems: a review, Renew. Sus-tain. Energy Rev. 99 (2019) 138e158.
[5] H.T. Chua, K.C. Ng, A. Malek, T. Kashiwagi, A. Akisawa, B.B. Saha, Modeling theperformance of two-bed, silica gel-water adsorption chillers, Int. J. Refrig. 22(1999) 194e204.
[6] B. Saha, A. Akisawa, T. Kashiwagi, Solar/waste heat driven two-stageadsorption chiller: the prototype, Renew. Energy 23 (2001) 93e101.
[7] H.T. Chua, K.C. Ng, W. Wang, C. Yap, X.L. Wang, Transient modeling of a two-bed silica gelewater adsorption chiller, Int. J. Heat Mass Tran. 47 (2004)659e669.
[8] D.C. Wang, Z.Z. Xia, J.Y. Wu, R.Z. Wang, H. Zhai, W.D. Dou, Study of a novelsilica gelewater adsorption chiller. Part I. Design and performance prediction,Int. J. Refrig. 28 (2005) 1073e1083.
[9] X. Wang, H.T. Chua, Two bed silica gelewater adsorption chillers: an effectuallumped parameter model, Int. J. Refrig. 30 (2007) 1417e1426.
[10] A.K. Jaiswal, S. Mitra, P. Dutta, K. Srinivasan, S. Srinivasa Murthy, Influence ofcycle time and collector area on solar driven adsorption chillers, Sol. Energy136 (2016) 450e459.
[11] Q.W. Pan, R.Z. Wang, Study on operation strategy of a silica gel-wateradsorption chiller in solar cooling application, Sol. Energy 172 (2018) 24e31.
[12] A. Mahesh, Solar collectors and adsorption materials aspects of cooling sys-tem, Renew. Sustain. Energy Rev. 73 (2017) 1300e1312.
[13] I.P. Koronaki, E.G. Papoutsis, V.D. Papaefthimiou, Thermodynamic modeling
373
and exergy analysis of a solar adsorption cooling system with cooling tower inMediterranean conditions, Appl. Therm. Eng. 99 (2016) 1027e1038.
[14] G. Zhang, D.C. Wang, J.P. Zhang, Y.P. Han, W. Sun, Simulation of operatingcharacteristics of the silica gelewater adsorption chiller powered by solarenergy, Sol. Energy 85 (2011) 1469e1478.
[15] S. Mitra, P. Kumar, K. Srinivasan, P. Dutta, Simulation study of a two-stageadsorber system, Appl. Therm. Eng. 72 (2014) 283e288.
[16] I.I. El-Sharkawy, H. AbdelMeguid, B.B. Saha, Potential application of solarpowered adsorption cooling systems in the Middle East, Appl. Energy 126(2014) 235e245.
[17] E.G. Papoutsis, I.P. Koronaki, V.D. Papaefthimiou, Parametric study of a single-stage two-bed adsorption chiller, J. Energy Eng. 143 (2016), 04016068.
[18] I.P. Koronaki, E.G. Papoutsis, M.T. Nitsas, Analysis of an adsorption chillercooling system for various types of solar collectors using the F-chart coolingmethod, in: Energy, vol. 6A, American Society of Mechanical Engineers, 2016,V06AT08A015.
[19] E.G. Papoutsis, I.P. Koronaki, V.D. Papaefthimiou, Numerical simulation andparametric study of different types of solar cooling systems under Mediter-ranean climatic conditions, Energy Build. 138 (2017) 601e611.
[20] K.C.A. Alam, B.B. Saha, Y.T. Kang, A. Akisawa, T. Kashiwagi, Heat exchangerdesign effect on the system performance of silica gel adsorption refrigerationsystems, Int. J. Heat Mass Tran. 43 (2000) 4419e4431.
[21] A. Freni, A. Sapienza, I.S. Glaznev, Y.I. Aristov, G. Restuccia, Experimentaltesting of a lab-scale adsorption chiller using a novel selective water sorbent“silica modified by calcium nitrate, Int. J. Refrig. 35 (2012) 518e524.
[22] I.P. Koronaki, M.T. Nitsas, E.G. Papoutsis, V.D. Papaefthimiou, Performanceanalysis of a silica gel-water adsorption cooler: impact of nanofluids on coolerperformance and size, in: Heat Transf. Therm. Eng., vol. 8A, American Societyof Mechanical Engineers, 2015.
[23] A. Allouhi, T. Kousksou, A. Jamil, Y. Zeraouli, Modeling of a thermal adsorberpowered by solar energy for refrigeration applications, Energy 75 (2014)589e596.
[24] X. Wang, H.T. Chua, A comparative evaluation of two different heat-recoveryschemes as applied to a two-bed adsorption chiller, Int. J. Heat Mass Tran. 50(2007) 433e443.
[25] M. Pons, F. Poyelle, Adsorptive machines with advanced cycles for heatpumping or cooling applications: cycles �a adsorption pour pompes �a chaleurou machines frigor: figues, Int. J. Refrig. 22 (1999) 27e37.
[26] M.Z.I. Khan, B.B. Saha, K.C.A. Alam, A. Akisawa, T. Kashiwagi, Study on solar/waste heat driven multi-bed adsorption chiller with mass recovery, Renew.Energy 32 (2007) 365e381.
[27] S.V. Shelton, W.J. Wepfer, D.J. Miles, Ramp wave analysis of the solid/vaporheat pump, J. Energy Resour. Technol. 112 (1990) 69e78.
[28] R.E. Critoph, Performance estimation of convective thermal wave adsorptioncycles, Appl. Therm. Eng. 16 (1996) 429e437.
[29] Y.Z. Xia, J.P. Zhang, D. Li, D.C. Wang, Y.H. Li, A review on adsorption refrig-eration technology and adsorption deterioration in physical adsorption sys-tems, Renew. Sustain. Energy Rev. 14 (2009) 344e353.
[30] N. ul Qadir, S.A.M. Said, R. Ben Mansour, Modeling the performance of a two-bed solar adsorption chiller using a multi-walled carbon nanotube/MIL-100(Fe) composite adsorbent, Renew. Energy 109 (2017) 602e612.
[31] B.B. Saha, S. Koyama, J.B. Lee, K. Kuwahara, K.C.A. Alam, Y. Hamamoto,A. Akisawa, T. Kashiwagi, Performance evaluation of a low-temperature wasteheat driven multi-bed adsorption chiller, Int. J. Multiphas. Flow 29 (2003)1249e1263.
[32] B.B. Saha, S. Koyama, K. Choon Ng, Y. Hamamoto, A. Akisawa, T. Kashiwagi,Study on a dual-mode, multi-stage, multi-bed regenerative adsorption chiller,Renew. Energy 31 (2006) 2076e2090.
[33] B. Zajaczkowski, Optimizing performance of a three-bed adsorption chillerusing new cycle time allocation and mass recovery, Appl. Therm. Eng. 100(2016) 744e752.
[34] A. Sapienza, G. Gullì, L. Calabrese, V. Palomba, A. Frazzica, V. Brancato, D. LaRosa, S. Vasta, A. Freni, L. Bonaccorsi, G. Cacciola, An innovative adsorptivechiller prototype based on 3 hybrid coated/granular adsorbers, Appl. Energy179 (2016) 929e938.
[35] K.C.A. Alam, Y.T. Kang, B.B. Saha, A. Akisawa, T. Kashiwagi, A novel approach todetermine optimum switching frequency of a conventional adsorption chiller,Energy 28 (2003) 1021e1037.
[36] K. Habib, B.B. Saha, A. Chakraborty, S. Koyama, K. Srinivasan, Performanceevaluation of combined adsorption refrigeration cycles, Int. J. Refrig. 34 (2011)129e137.
[37] A.R.M. Rezk, R.K. Al-Dadah, Physical and operating conditions effects on silicagel/water adsorption chiller performance, Appl. Energy 89 (2012) 142e149.
[38] M. Szyc, W. Nowak, Operation of an adsorption chiller in different cycle timeconditions, Chemical and Process Engineering - Inzynieria Chemiczna iProcesowa 35 (2014) 109e119.
[39] R.P. Sah, B. Choudhury, R.K. Das, Study of a two-bed silica gelewateradsorption chiller: performance analysis, Int. J. Sustain. Energy 37 (2018)30e46.
[40] N. ul Qadir, S.A.M. Said, R.B. Mansour, H. Imran, M. Khan, Performance com-parison of a two-bed solar-driven adsorption chiller with optimal fixed andadaptive cycle times using a silica gel/water working pair, Renew. Energy 149(2020) 1000e1017.
[41] T. Huld, PVMAPS: Software tools and data for the estimation of solar radiationand photovoltaic module performance over large geographical areas, Sol.

T. Basdanis, A. Tsimpoukis and D. Valougeorgis Renewable Energy 164 (2021) 362e374
Energy 142 (2017) 171e181.[42] A. Sokada, M. Suzuki, Fundamental study on solar powered adsorption,
J. Chem. Eng. Jpn. 17 (1984) 52e57.[43] B.B. Saha, E.C. Boelman, T. Kashiwagi, Computational analysis of an advanced
adsorption-refrigeration cycle, Energy 20 (1995) 983e994.
Nomenclature
A: Area ðm2ÞAHCT: Adjusted half cycle timeCHCT: Constant half cycle timeCOP: Coefficient of performance ð � Þcp: Specific heat capacity ðJ =kg KÞDs: Surface diffusivity ðm2 =sÞEact : Activation energy ðJ =molÞFR: Heat removal factor ð � ÞL: Latent heat of vaporization ðJ =kgÞm: Mass ðkgÞ_m: Mass flow rate ðkg =sÞQH: Half-cycle-average heat supply delivered to the adsorption chiller during the
desorption process ðWÞQC: Half-cycle-average cooling capacity delivered by the adsorption chiller ðWÞQst : Isosteric heat of adsorption ðJ =kgÞQu: Useful energy rate ðWÞq: Water content of the adsorbent ðkg =kgÞq*: Water content at the adsorption equilibrium ðkg =kgÞqs: Solar radiation ðW =m2ÞR: Universal gas constant ðJ =kg KÞRp: Adsorption particle radius ðmÞT: Temperature ðKÞt: Time ðsÞt*: Time of a phase (A or B) calculated from the inner loop ðsÞU: Heat transfer coefficient ðW =m2KÞUL: Heat transfer coefficient between storage and ambient ðW =m2KÞ
Greek symbols
374
q: Parameter which indicates the relatively increase of the optimum time of phase BðtaÞeff : Fraction of the radiation absorbed by the collector ð � Þf: Parameter which is zerowhen the chiller is in Phase A and one when it is in Phase
B
Subscripts
A: Phase AAHC: Adjusted half cyclea: Adsorptional: Aluminum partamb: AmbientB: Phase Bb: BedC: Phase Cc: Condenserchw: Chilled watercol: Collectorcu: Copper partcw: Cooling waterD: Phase Dd: Desorptionday: Dailye: EvaporationHC: Half cyclehw: Hot waterin: Inletmax: Maximummin: Minimumopt: Optimumout: Outlets: Silica gelst: Storagev: Vaporw: Water