Embed Size (px)
Citation preview
PERFORMANCE OF THE ENHANCED VEGETATION INDEX TO DETECTINNER-ANNUAL DRY SEASON AND DROUGHT IMPACTS ON AMAZON FOREST
CANOPIES
Benjamin Brede∗, Jan Verbesselt, Loïc P. Dutrieux, Martin Herold
Laboratory of Geo-Information Science and Remote Sensing, Wageningen University,Droevendaalsesteeg 3, 6708PB, Wageningen, The Netherlands –
(Benjamin.Brede, Jan.Verbesselt, Loic.Dutrieux, Martin.Herold)@wur.nl
KEY WORDS: Amazon rainforests, Enhanced Vegetation Index, dry season leaf flush, sun-sensor geometry effects, drought impact
ABSTRACT:
The Amazon rainforests represent the largest connected forested area in the tropics and play an integral role in the global carbon cycle.In the last years the discussion about their phenology and response to drought has intensified. A recent study argued that seasonality ingreenness expressed as Enhanced Vegetation Index (EVI) is an artifact of variations in sun-sensor geometry throughout the year. Weaimed to reproduce these results with the Moderate-Resolution Imaging Spectroradiometer (MODIS) MCD43 product suite, whichallows modeling the Bidirectional Reflectance Distribution Function (BRDF) and keeping sun-sensor geometry constant. The derivedBRDF-adjusted EVI was spatially aggregated over large areas of central Amazon forests. The resulting time series of EVI spanning the2000-2013 period contained distinct seasonal patterns with peak values at the onset of the dry season, but also followed the same patternof sun geometry expressed as Solar Zenith Angle (SZA). Additionally, we assessed EVI’s sensitivity to precipitation anomalies. For thatwe compared BRDF-adjusted EVI dry season anomalies to two drought indices (Maximum Cumulative Water Deficit, StandardizedPrecipitation Index). This analysis covered the whole of Amazonia and data from the years 2000 to 2013. The results showed nomeaningful connection between EVI anomalies and drought. This is in contrast to other studies that investigate the drought impacton EVI and forest photosynthetic capacity. The results from both sub-analyses question the predictive power of EVI for large scaleassessments of forest ecosystem functioning in Amazonia. Based on the presented results, we recommend a careful evaluation of theEVI for applications in tropical forests, including rigorous validation supported by ground plots.
1. INTRODUCTION
The Amazon rainforests represent the largest connected forestedarea in the tropics. They play an integral role in the global carboncycle and store ~93±23 Pg C in above-ground living biomass alone(Malhi et al., 2006). In recent years the discussion about theirresilience against transition to other stable ecosystem states hasbecome more intense. Climate change and deforestation put pres-sure on the forests (Malhi et al., 2008) and the question appearedif they may partly, but abruptly transform into savannahs (Whiteet al., 1999; Cox et al., 2004; Hirota et al., 2010).
The discussion of drought impacts has been vivid in the pastyears partially due to the severe droughts in 2005 and 2010 andits implications. In a fast response survey Phillips et al. (2009)assessed the impact of the 2005 drought on tree biomass in long-term forest census plots and found major biomass losses, whichended a long-term trend in tree carbon assimilation. Phillips etal. (2010) refined this analysis. They found evidence for elevatedmortality rates 2 years after the meteorological event. Furthermore,large trees had a disproportionately high mortality during thedrought. This is supported by de Toledo et al. (2013).
On the other hand, Schwalm et al. (2010) found a positive responseof Net Primary Productivity (NPP) to relative drought. Actually,some studies found higher rates of carbon uptake during the drycompared to the wet season (Saleska et al., 2003; Hutyra et al.,2007). Instead of precipitation regimes, carbon uptake was con-trolled by phenology and light conditions (Hutyra et al., 2007).This does not contradict the aforementioned studies. The ideawould be that water shortage as it occurs regularly in dry seasonsdoes not necessarily lead to water shortage for the trees as some
∗Corresponding author
have access to soil water via deep roots (Nepstad et al., 1994).However, prolonged dryness depletes the soil water storage andeventually shows effects in tree health and carbon uptake. Thismeans that regular dry seasons may first lead to increased carbonuptake, but the effect turns when the dry season turns into drought.
Besides ground plots, satellite remote sensing delivers informa-tion about spatial and temporal patterns of drought impacts. Thedry season resilience was observed with optical remote sensingdata and especially Moderate-Resolution Imaging Spectroradiome-ter (MODIS) Enhanced Vegetation Index (EVI). An increase inEnhanced Vegetation Index (EVI) during the dry months was ex-plained with flushing of new leafs (Myneni et al., 2007; Samantaet al., 2012). This would be a combined effect of an increase inLeaf Area Index (LAI) and a change in leaf optical properties.However, other studies raise concern about sun and viewing geom-etry effects in EVI (Sims et al., 2011; Galvão et al., 2011; Mouraet al., 2012). Galvão et al. (2011) studied a seasonal evergreenforest in the tropical forest savannah transition zone and foundthe highest EVI at the end of the dry season, when Solar ZenithAngle (SZA) was smallest. Morton et al. (2014) corrected MODISEVI for sun and viewing geometry effects with the help of a ker-nel based Bidirectional Reflectance Distribution Function (BRDF)model for MODIS tiles h11v09 and h12v09, which are situatedover the central parts of the Amazon rainforests. Analysis of thisdata showed no remaining seasonality.
The objective of this study was to use a data set independentfrom Morton et al. (2014), but with the same study area, andcheck the consistency of the results. Additionally, the intra-annualeffect of dry season strength expressed with drought indices wasinvestigated for the whole of the Amazon rainforests.
2. METHOD
2.1 Study Area
We identified tropical forests in the Amazon basin with theMODIS MCD12Q1 Land Cover Type product V051 with 500 mspatial resolution. In order to focus on mostly undisturbed forests,we set the requirement for each pixel that at least two thirds of allland cover observations in the temporal domain have to be ever-green broadleaf forest according to the International Geosphere-Biosphere Programme (IGBP) classification scheme. Additionally,only pixels within the hydrological Amazon river basin (Mayorgaet al., 2012) were considered. The resulting landcover mask canbe seen in Figure 1.
2.2 Data
A major aim of this study was to correct Bidirectional ReflectanceFactors (BRFs) for sun sensor geometry effects. The MCD43product suite provides unique opportunities for this purpose. Itcontains results of fitting pixel- and band-wise reflectance observa-tions of 16 days to a semi-empirical BRDF model, the RossThick-LiSparse-Reciprocal (RTLSR) model (Schaaf et al., 2002, 2011).This kernel based model describes the surface BRDF as the sumof isotropic, volumetric and geometric scattering. The volumetrickernel assumes a dense canopy of randomly oriented facets, whilethe geometric kernel is based on non-overlapping shadows castby randomly distributed objects (Roujean et al., 1992; Strahler etal., 1999; Lucht et al., 2000). With the three parameters for theisotropic fiso, volumetric fvol and geometric fgeo kernels BRFsat any given SZA and View Zenith Angle (VZA) can be modeled.The statistical fitting of the model to observations requires severalmeasurements. Therefore, both Aqua and Terra MODIS instru-ments deliver input to the inversion process (Strahler et al., 1999;Lucht et al., 2000). A back-up algorithm offers model inversionswhen only few observations are available. This algorithm makesuse of the BRDF properties of previous full inversions and scalesthese shapes to new measurements. This back-up algorithm istermed magnitude inversion.
For this study we downloaded MCD43A1 (inversion parameters),MCD43A2 (quality and auxiliary data) and MCD43A4 (BRFsmodeled at nadir and local solar noon, Nadir BRDF-AdjustedReflectance (NBAR) product) data from the MODIS data pool(https://lpdaac.usgs.gov/) from between February 18, 2000 andNovember 25, 2013 and spatial tiles with horizontal numbers 10to 12 and vertical numbers 8 to 9 (9 tiles in total), which cover
50°W60°W70°W80°W
0°
10°S
20°S
Amazon basinEvergreenbroadleaf forest Projection:
MODIS Sinusoidal
Figure 1: Study Area (land boundaries based on data set of BjornSandvik www.thematicmapping.org).
northern South America. The temporal resolution is quasi 8 daily,as the production is temporally overlapping.
For spatial analysis of precipitation we used the Tropical RainfallMeasuring Mission Multisatellite Precipitation Analysis (TMPA)3B42 V7 daily accumulated precipitation product at 0.25° spatialresolution (Huffman et al., 2010). We downloaded data with thesame time span as for the MODIS BRDF products.
2.3 EVI Seasonality
Based on the MCD43 products we produced 7 time series for thewhole of the study period. These time series represent spatialaverages over MODIS tiles h11v09 and h12v09. Morton et al.(2014) also focused on these two tiles. All products were filteredwith the landcover information and with the MCD43A2 qualityflags to allow only full BRDF inversions. The time series producedwere:
• NBAR Near Infrared Reflectance (NIR) reflectance, Normal-ized Difference Vegetation Index (NDVI) and EVI;
• BRDF-adjusted NIR reflectance, NDVI and EVI modeled atVZA = 0° and SZA = 30°;
• SZA at local solar noon.
The seasonal behavior of these time series were analyzed witha special focus on green-up phenomenon during the dry seasonas found by other studies (Huete et al., 2006; Xiao et al., 2006;Myneni et al., 2007; Samanta et al., 2012).
2.4 Impact of Drought on EVI
For the comparison of MODIS derived products with droughtmetrics based on TMPA the MODIS products were first spatiallyaggregated to the TMPA resolution of 0.25° (~30 km at equator).For the landcover mask the requirement for a pixel to be validin the aggregated map was that at least 90% of the underlyingMODIS pixels were evergreen broadleaf forest. The MODISreflectance products were quality filtered (only full inversions)and averaged. On the other hand, TMPA daily precipitation wastemporally averaged to the quasi 8-day periods of the MCD43products. In this way both datasets were synchronized to 0.25°spatial and 8-day temporal resolution for the whole Amazon basin.
Based on the aggregated MODIS products we derived BRDF-adjusted EVI standardized anomalies over the temporal domain,which means standardized anomalies per pixel time series. Thisis a useful approach as the anomaly describes the deviation ofEVI in relation to its mean for each pixel. Furthermore, anoma-lies were derived only for data from Septembers. This is the lastmonth in the Amazon dry season, commonly defined as July toSeptember (Samanta et al., 2012). September should show highestimpact of precipitation related impact on greenness. The TMPAwas further processed to drought indices, namely StandardizedPrecipitation Index (SPI) (McKee et al., 1993) and MaximumCumulative Water Deficit (MCWD) (Aragão et al., 2007). TheSPI behaves similar as seasonal anomalies with values oscillatingaround 0 and deviations meaning more or less precipitation thanusual. The MCWD assumes an evapotranspirational demand of100 mm month-1 of tropical forests and holds the available precipi-tation against this. Subsequent months with less precipitation than100 mm month-1 let the MCWD build up, which typically happensin the dry season.
The connection between greenness anomalies and drought was ana-lyzed with pixel-based linear regression models, where September
greenness anomaly was the dependent and the respective droughtindex the independent variable. Per 0.25° pixel this producedslope estimates for the statistical relationship and how likely green-ness was dependent on the drought index, i. e. its significance.These values were analyzed as maps. Additionally, the green-ness anomaly-drought index pairs were analyzed on a MODIS tilebasis. This means all greenness anomaly values were regressedagainst all drought index values per MODIS tile.
3. RESULTS
3.1 EVI Seasonality
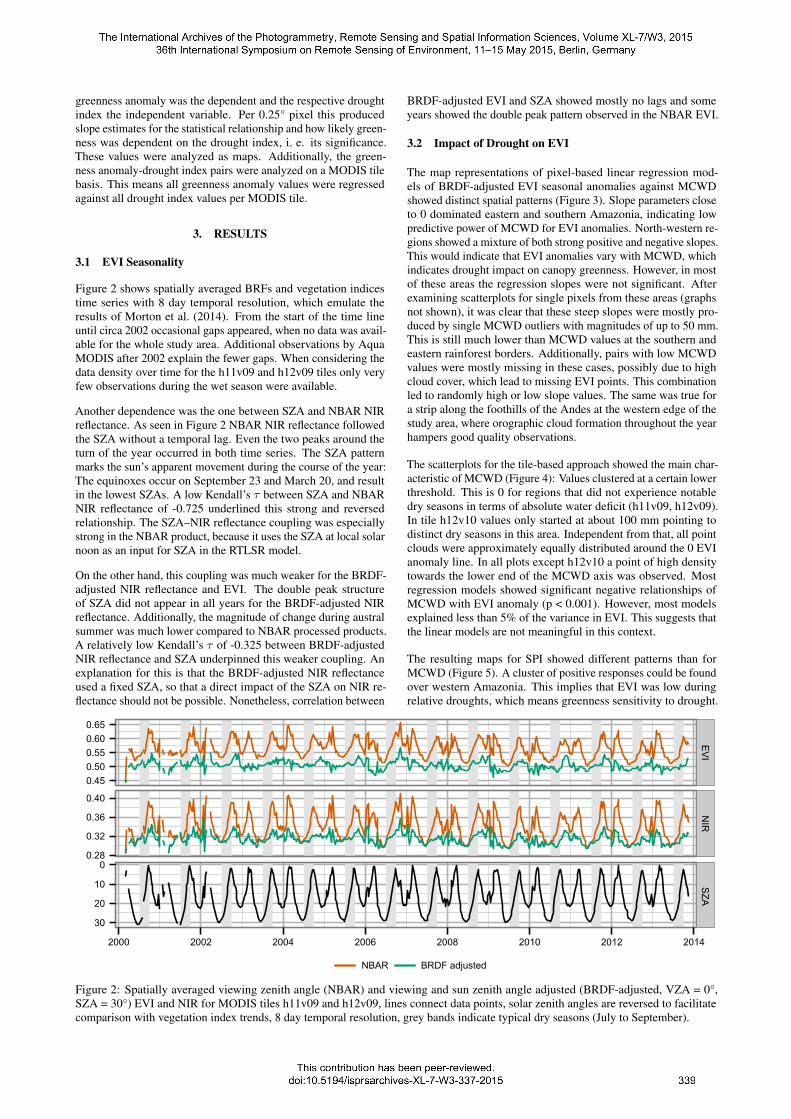
Figure 2 shows spatially averaged BRFs and vegetation indicestime series with 8 day temporal resolution, which emulate theresults of Morton et al. (2014). From the start of the time lineuntil circa 2002 occasional gaps appeared, when no data was avail-able for the whole study area. Additional observations by AquaMODIS after 2002 explain the fewer gaps. When considering thedata density over time for the h11v09 and h12v09 tiles only veryfew observations during the wet season were available.
Another dependence was the one between SZA and NBAR NIRreflectance. As seen in Figure 2 NBAR NIR reflectance followedthe SZA without a temporal lag. Even the two peaks around theturn of the year occurred in both time series. The SZA patternmarks the sun’s apparent movement during the course of the year:The equinoxes occur on September 23 and March 20, and resultin the lowest SZAs. A low Kendall’s τ between SZA and NBARNIR reflectance of -0.725 underlined this strong and reversedrelationship. The SZA–NIR reflectance coupling was especiallystrong in the NBAR product, because it uses the SZA at local solarnoon as an input for SZA in the RTLSR model.
On the other hand, this coupling was much weaker for the BRDF-adjusted NIR reflectance and EVI. The double peak structureof SZA did not appear in all years for the BRDF-adjusted NIRreflectance. Additionally, the magnitude of change during australsummer was much lower compared to NBAR processed products.A relatively low Kendall’s τ of -0.325 between BRDF-adjustedNIR reflectance and SZA underpinned this weaker coupling. Anexplanation for this is that the BRDF-adjusted NIR reflectanceused a fixed SZA, so that a direct impact of the SZA on NIR re-flectance should not be possible. Nonetheless, correlation between
BRDF-adjusted EVI and SZA showed mostly no lags and someyears showed the double peak pattern observed in the NBAR EVI.
3.2 Impact of Drought on EVI
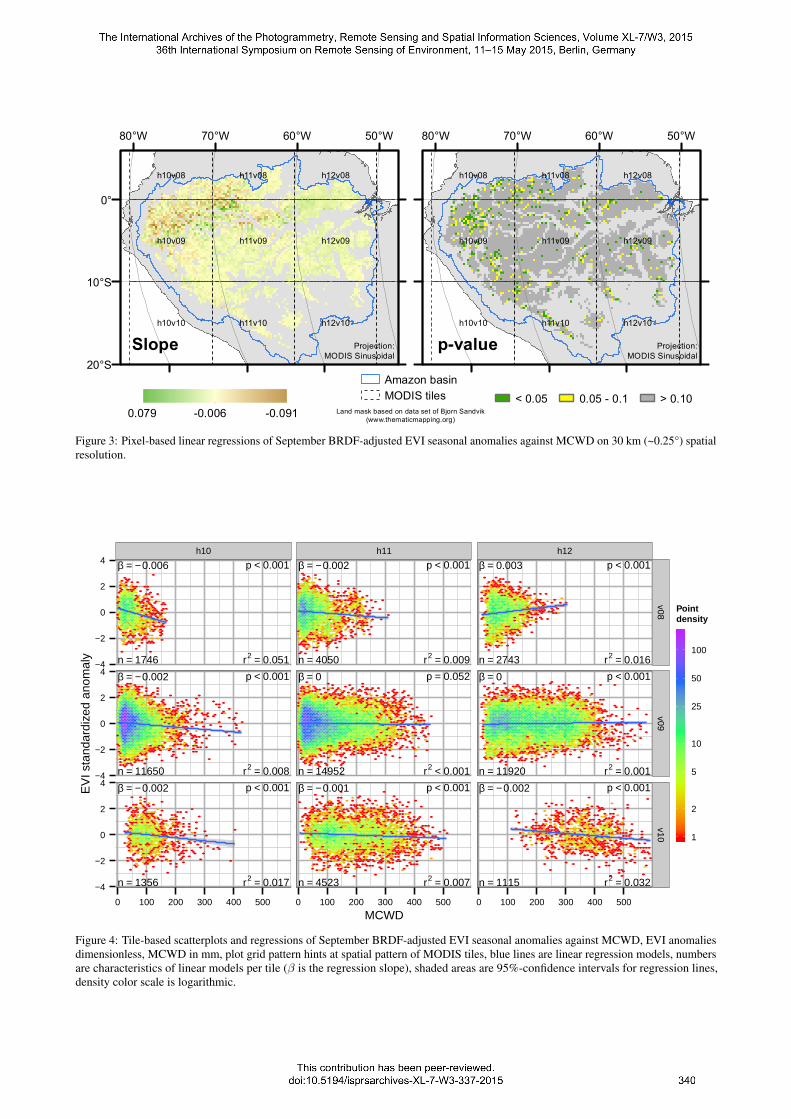
The map representations of pixel-based linear regression mod-els of BRDF-adjusted EVI seasonal anomalies against MCWDshowed distinct spatial patterns (Figure 3). Slope parameters closeto 0 dominated eastern and southern Amazonia, indicating lowpredictive power of MCWD for EVI anomalies. North-western re-gions showed a mixture of both strong positive and negative slopes.This would indicate that EVI anomalies vary with MCWD, whichindicates drought impact on canopy greenness. However, in mostof these areas the regression slopes were not significant. Afterexamining scatterplots for single pixels from these areas (graphsnot shown), it was clear that these steep slopes were mostly pro-duced by single MCWD outliers with magnitudes of up to 50 mm.This is still much lower than MCWD values at the southern andeastern rainforest borders. Additionally, pairs with low MCWDvalues were mostly missing in these cases, possibly due to highcloud cover, which lead to missing EVI points. This combinationled to randomly high or low slope values. The same was true fora strip along the foothills of the Andes at the western edge of thestudy area, where orographic cloud formation throughout the yearhampers good quality observations.
The scatterplots for the tile-based approach showed the main char-acteristic of MCWD (Figure 4): Values clustered at a certain lowerthreshold. This is 0 for regions that did not experience notabledry seasons in terms of absolute water deficit (h11v09, h12v09).In tile h12v10 values only started at about 100 mm pointing todistinct dry seasons in this area. Independent from that, all pointclouds were approximately equally distributed around the 0 EVIanomaly line. In all plots except h12v10 a point of high densitytowards the lower end of the MCWD axis was observed. Mostregression models showed significant negative relationships ofMCWD with EVI anomaly (p < 0.001). However, most modelsexplained less than 5% of the variance in EVI. This suggests thatthe linear models are not meaningful in this context.
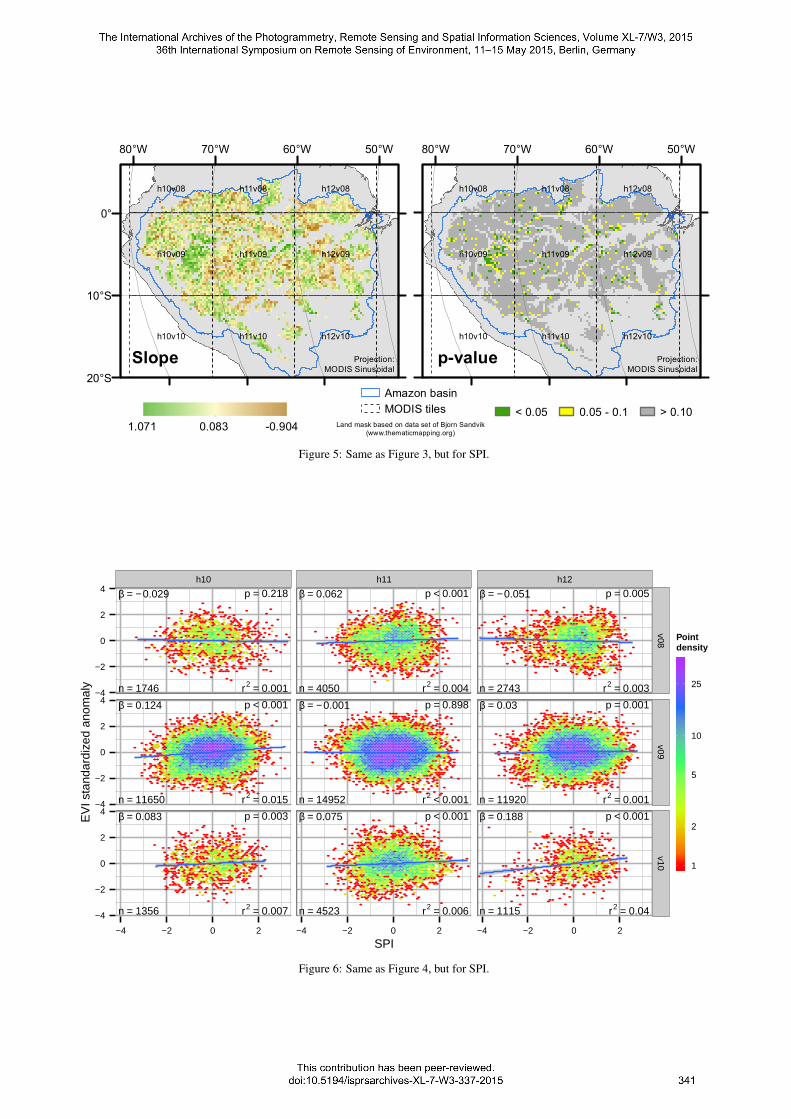
The resulting maps for SPI showed different patterns than forMCWD (Figure 5). A cluster of positive responses could be foundover western Amazonia. This implies that EVI was low duringrelative droughts, which means greenness sensitivity to drought.
Figure 2: Spatially averaged viewing zenith angle (NBAR) and viewing and sun zenith angle adjusted (BRDF-adjusted, VZA = 0°,SZA = 30°) EVI and NIR for MODIS tiles h11v09 and h12v09, lines connect data points, solar zenith angles are reversed to facilitatecomparison with vegetation index trends, 8 day temporal resolution, grey bands indicate typical dry seasons (July to September).
h11v10
h11v09
h10v10
h12v09
h12v10
h10v09
h11v08h10v08 h12v08
50°W60°W70°W80°W
Amazon basinMODIS tiles
h11v10
h11v09
h10v10
h12v09
h12v10
h10v09
h11v08h10v08 h12v08
50°W60°W70°W80°W
0°
10°S
20°SSlope p-value Projection:
MODIS SinusoidalProjection:
MODIS Sinusoidal
< 0.05 0.05 - 0.1 > 0.100.079 -0.006 -0.091 Land mask based on data set of Bjorn Sandvik
(www.thematicmapping.org)
Figure 3: Pixel-based linear regressions of September BRDF-adjusted EVI seasonal anomalies against MCWD on 30 km (~0.25°) spatialresolution.
h10 h11 h12
r2 = 0.051
p < 0.001
n = 1746
β = − 0.006
r2 = 0.008
p < 0.001
n = 11650
β = − 0.002
r2 = 0.017
p < 0.001
n = 1356
β = − 0.002
r2 = 0.009
p < 0.001
n = 4050
β = − 0.002
r2 < 0.001
p = 0.052
n = 14952
β = 0
r2 = 0.007
p < 0.001
n = 4523
β = − 0.001
r2 = 0.016
p < 0.001
n = 2743
β = 0.003
r2 = 0.001
p < 0.001
n = 11920
β = 0
r2 = 0.032
p < 0.001
n = 1115
β = − 0.002
−4
−2
0
2
4
−4
−2
0
2
4
−4
−2
0
2
4
v08v09
v10
0 100 200 300 400 500 0 100 200 300 400 500 0 100 200 300 400 500
MCWD
EV
I sta
ndar
dize
d an
omal
y
1
2
5
10
25
50
100
Pointdensity
Figure 4: Tile-based scatterplots and regressions of September BRDF-adjusted EVI seasonal anomalies against MCWD, EVI anomaliesdimensionless, MCWD in mm, plot grid pattern hints at spatial pattern of MODIS tiles, blue lines are linear regression models, numbersare characteristics of linear models per tile (β is the regression slope), shaded areas are 95%-confidence intervals for regression lines,density color scale is logarithmic.
h11v10
h11v09
h10v10
h12v09
h12v10
h10v09
h11v08h10v08 h12v08
50°W60°W70°W80°W
Amazon basinMODIS tiles
h11v10
h11v09
h10v10
h12v09
h12v10
h10v09
h11v08h10v08 h12v08
50°W60°W70°W80°W
0°
10°S
20°SSlope p-value Projection:
MODIS SinusoidalProjection:
MODIS Sinusoidal
< 0.05 0.05 - 0.1 > 0.101.071 0.083 -0.904 Land mask based on data set of Bjorn Sandvik
(www.thematicmapping.org)
Figure 5: Same as Figure 3, but for SPI.
h10 h11 h12
r2 = 0.001
p = 0.218
n = 1746
β = − 0.029
r2 = 0.015
p < 0.001
n = 11650
β = 0.124
r2 = 0.007
p = 0.003
n = 1356
β = 0.083
r2 = 0.004
p < 0.001
n = 4050
β = 0.062
r2 < 0.001
p = 0.898
n = 14952
β = − 0.001
r2 = 0.006
p < 0.001
n = 4523
β = 0.075
r2 = 0.003
p = 0.005
n = 2743
β = − 0.051
r2 = 0.001
p = 0.001
n = 11920
β = 0.03
r2 = 0.04
p < 0.001
n = 1115
β = 0.188
−4
−2
0
2
4
−4
−2
0
2
4
−4
−2
0
2
4
v08v09
v10
−4 −2 0 2 −4 −2 0 2 −4 −2 0 2
SPI
EV
I sta
ndar
dize
d an
omal
y
1
2
5
10
25
Pointdensity
Figure 6: Same as Figure 4, but for SPI.
Some of these pixel-based regressions were statistically significant(p < 0.1). Other positive responding regions were located at theAndean foothills in the South, but no significant relationshipscould be found for them. This was also true for smaller patchesof negative relationships in the eastern basin. Otherwise no broadscale spatial patterns could be identified. The relationship wasrather patchy with high variation on short ranges. Additionally,the total number of significant cells at the 0.05 level was 4.1% ofall valid pixels and the histogram of p-values for whole Amazoniashowed a nearly uniform distribution. This points to a randomprocess that produced significant slopes only by chance.
All point clouds for the EVI anomaly-SPI relationship were clus-tered at the point of origin for the respective scatterplots (Figure 6).This is typical for anomalies, as the observations are distributedaround the overall mean. The linear models were significant(p < 0.01) for all tiles but h10v08 and h11v09. However, allmodels explained less than 5% of the variance in EVI anomaliesexpressed as r2. Considering the point clouds it becomes clearthat any model would have problems to fit the EVI anomaly-SPIrelationship.
4. DISCUSSION
In this study, we investigated the performance of EVI to studyinner-annual dry season and drought impacts on the canopy ofundisturbed Amazon forests. We focused on recently discussedsun sensor geometry effects, which contaminate the temporal EVIsignals. Correcting for these effects with the MODIS MCD43A1product, we found distinct seasonal dynamics of EVI. However,these patterns were suspiciously correlated to SZA patterns. Ad-ditionally, EVI was not sensitive to canopy moisture stress repre-sented by two moisture stress indices, although droughts have thepotential to alter forest canopy functioning (Brando et al., 2008)and structure (Phillips et al., 2010).
From the results the question arises why BRDF-adjusted EVI de-rived with the MCD43 product suite and EVI derived by Morton etal. (2014) showed different temporal patterns while both productsare modeled for the same viewing and sun geometries and coverroughly the same area. This might be explained by the aggregationperiod for the BRDF modeling approaches. While MCD43 uses16 day, Morton et al. (2014) used monthly intervals. De Abelleyraand Verón (2014) showed that shorter aggregation intervals re-sult in better noise reduction in NDVI time series for agriculturalcrops. Taking into account possible rapid changes in Amazon fo-liage (Doughty and Goulden, 2008), a monthly aggregation periodmight not take up fast changes, so that EVI time series are overlystrong smoothed.
Anomalies of BRDF-adjusted EVI showed no clear response todrought expressed as MCWD and SPI. These results have par-ticular significance, because they were derived on both coarseand medium spatial scales. Moreover, they did not only focuson drought years like 2005 or 2010, but were based on a generalassessment over all years when data was available. In this waypositive and negative anomalies were assessed in a broader con-text; chances were lower to interpret spatial or temporal noisein EVI as a response to drought. This can happen if only singledrought events are considered for analysis. Furthermore, usingseasonal anomalies to analyze EVI sensitivity is robust againstseasonal patterns. Anomalies are more robust against seasonalpatterns such as viewing and sun geometries and highlight dis-similarities between the years. However, this analysis focused ondirect impacts, which occur in the same year as the drought event.Impacts on longer time scales as found by Saatchi et al. (2013)were beyond the scope of this study and cannot be excluded.
Moreover, the static evapotranspirational demand of100 mm month-1 in the formulation of MCWD is only acoarse approximation that excludes adaptations of trees to drierconditions and the spatial distribution of these adaptations, whichis only poorly understood for the Amazon forests (Aragão et al.,2007). This static threshold adds to the explanation for spatialpatterns in the NW in Figure 3. These areas lie in the innerAmazon regions and likely experience no water stress, so that thepatterns are rather artifacts produced by errors in TMPA retrievalsand the assumption of a static evapotranspirational demand.
The question remains why BRDF-adjusted EVI showed no over-all sensitivity to the drought indices. On the one hand, this canbe caused by a bad representativeness of the drought indices asdiscussed above. On the other hand, the overall canopy spectralresponse to drought might be lower than anticipated in earlier stud-ies. For instance, NDVI shows much higher seasonal stability inthe study of Samanta et al. (2012). This is usually explained withthe saturation of NDVI over dense canopies (Huete et al., 2002).However, NDVI is more robust against sun and viewing angleeffects than EVI (Sims et al., 2011). In this sense NDVI mightpoint to the stability of canopy greenness, while EVI is mostlyaffected by angular effects. Taking into account that drought hadfundamental impacts on forest functioning and structure as foundin ground studies (Nepstad et al., 2002; Brando et al., 2008), green-ness might not be an appropriate proxy for ecosystem functioningin tropical forests.
5. CONCLUSIONS
Morton et al. (2014) questioned changes in Amazon rainforestgreenness expressed as EVI as a response to dry season anddrought conditions. This conclusion was not supported by BRDF-adjusted EVI derived with the MODIS MCD43 product. However,seasonal patterns still weakly followed the course of SZA over theyear. This might be caused by actual changes in canopy green-ness or result from problems in the BRDF modeling process. Onthe other hand, BRDF-adjusted EVI was mostly insensitive todrought expressed with two drought indices. This could mean thatAmazonian forest canopies are resilient against drought impacts.However, studies on forest plots suggest otherwise, so that it israther EVI’s sensitivity for canopy processes that is questionable.Based on these findings, we suggest a careful assessment of EVIas a proxy for tropical rainforest functioning.
References
Aragão, L. E. O. C., Malhi, Y., Roman-Cuesta, R. M., Saatchi, S.,Anderson, L. O. and Shimabukuro, Y. E., 2007. Spatial patternsand fire response of recent Amazonian droughts. GeophysicalResearch Letters 34(7), pp. L07701.
Brando, P. M., Nepstad, D. C., Davidson, E. A., Trumbore, S. E.,Ray, D. and Camargo, P., 2008. Drought effects on litterfall,wood production and belowground carbon cycling in an Ama-zon forest: results of a throughfall reduction experiment. Philo-sophical transactions of the Royal Society of London. Series B,Biological sciences 363(1498), pp. 1839–1848.
Cox, P. M., Betts, R. A., Collins, M., Harris, P. P., Huntingford,C. and Jones, C. D., 2004. Amazonian forest dieback underclimate-carbon cycle projections for the 21st century. Theoreti-cal and Applied Climatology 78(1-3), pp. 137–156.
de Abelleyra, D. and Verón, S. R., 2014. Comparison of differentBRDF correction methods to generate daily normalized MODIS250m time series. Remote Sensing of Environment 140, pp. 46–59.
de Toledo, J. J., Magnusson, W. E. and Castilho, C. V., 2013.Competition, exogenous disturbances and senescence shapetree size distribution in tropical forest: Evidence from treemode of death in Central Amazonia. Journal of VegetationScience 24(4), pp. 651–663.
Doughty, C. E. and Goulden, M. L., 2008. Seasonal patterns oftropical forest leaf area index and CO2 exchange. Journal ofGeophysical Research 113, pp. G00B06.
Galvão, L. S., dos Santos, J. R., Roberts, D. A., Breunig, F. M.,Toomey, M. and de Moura, Y. M., 2011. On intra-annualEVI variability in the dry season of tropical forest: A casestudy with MODIS and hyperspectral data. Remote Sensing ofEnvironment 115(9), pp. 2350–2359.
Hirota, M., Nobre, C., Oyama, M. D. and Bustamante, M. M. C.,2010. The climatic sensitivity of the forest, savanna and forest-savanna transition in tropical South America. The New Phytol-ogist 187(3), pp. 707–719.
Huete, A., Didan, K., Miura, T., Rodriguez, E., Gao, X. andFerreira, L., 2002. Overview of the radiometric and biophysicalperformance of the MODIS vegetation indices. Remote Sensingof Environment 83(1-2), pp. 195–213.
Huete, A. R., Didan, K., Shimabukuro, Y. E., Ratana, P., Saleska,S. R., Hutyra, L. R., Yang, W., Nemani, R. R. and Myneni, R.,2006. Amazon rainforests green-up with sunlight in dry season.Geophysical Research Letters 33(6), pp. L06405.
Huffman, G. J., Adler, R. F., Bolvin, D. T. and Nelkin, E. J., 2010.The TRMM Multi-Satellite Precipitation Analysis (TMPA).In: M. Gebremichael and F. Hossain (eds), Satellite RainfallApplications for Surface Hydrology, Springer Netherlands, Dor-drecht, pp. 3–22.
Hutyra, L. R., Munger, J. W., Saleska, S. R., Gottlieb, E., Daube,B. C., Dunn, A. L., Amaral, D. F., de Camargo, P. B. and Wofsy,S. C., 2007. Seasonal controls on the exchange of carbon andwater in an Amazonian rain forest. Journal of GeophysicalResearch 112(G3), pp. G03008.
Lucht, W., Schaaf, C. and Strahler, A., 2000. An algorithm forthe retrieval of albedo from space using semiempirical BRDFmodels. IEEE Transactions on Geoscience and Remote Sensing38(2), pp. 977–998.
Malhi, Y., Roberts, J. T., Betts, R. A., Killeen, T. J., Li, W. andNobre, C. A., 2008. Climate change, deforestation, and the fateof the Amazon. Science 319(5860), pp. 169–172.
Malhi, Y., Wood, D., Baker, T. R., Wright, J., Phillips, O. L.,Cochrane, T., Meir, P., Chave, J., Almeida, S., Arroyo, L.,Higuchi, N., Killeen, T. J., Laurance, S. G., Laurance, W. F.,Lewis, S. L., Monteagudo, A., Neill, D. A., Vargas, P., NunezPitman, N. C. A., Quesada, C., Alberto Salomao, R., Silva, J.N. M., Lezama, A. T., Terborgh, J., Martinez, R. and VasquezVinceti, B., 2006. The regional variation of aboveground livebiomass in old-growth Amazonian forests. Global ChangeBiology 12(7), pp. 1107–1138.
Mayorga, E., Logsdon, M., Ballester, M. and Richey, J., 2012. BA-ECO CD-06 Amazon River Basin Land and Stream DrainageDirection Maps. http://dx.doi.org/10.3334/ORNLDAAC/1086.
McKee, T. B., Doesken, N. J. and Kleist, J., 1993. The relationshipof drought frequency and duration to time scales. In: EighthConference on Applied Climatology, 17-22 January 1993, Ana-heim, California, pp. 17–22.
Morton, D. C., Nagol, J., Carabajal, C. C., Rosette, J., Palace, M.,Cook, B. D., Vermote, E. F., Harding, D. J. and North, P. R. J.,2014. Amazon forests maintain consistent canopy structure andgreenness during the dry season. Nature 506, pp. 221–224.
Moura, Y. M., Galvão, L. S., dos Santos, J. R., Roberts, D. A. andBreunig, F. M., 2012. Use of MISR/Terra data to study intra-and inter-annual EVI variations in the dry season of tropicalforest. Remote Sensing of Environment 127, pp. 260–270.
Myneni, R. B., Yang, W., Nemani, R. R., Huete, A. R., Dickinson,R. E., Knyazikhin, Y., Didan, K., Fu, R., Negrón Juárez, R. I.,Saatchi, S. S., Hashimoto, H., Ichii, K., Shabanov, N. V., Tan,B., Ratana, P., Privette, J. L., Morisette, J. T., Vermote, E. F.,Roy, D. P., Wolfe, R. E., Friedl, M. A., Running, S. W., Votava,P., El-Saleous, N., Devadiga, S., Su, Y. and Salomonson, V. V.,2007. Large seasonal swings in leaf area of Amazon rainforests.Proceedings of the National Academy of Sciences of the UnitedStates of America 104(12), pp. 4820–4823.
Nepstad, D. C., de Carvalho, C. R., Davidson, E. A., Jipp, P. H.,Lefebvre, P. A., Negreiros, G. H., da Silva, E. D., Stone, T. A.,Trumbore, S. E. and Vieira, S., 1994. The role of deep roots inthe hydrological and carbon cycles of Amazonian forests andpastures. Nature 372(6507), pp. 666–669.
Nepstad, D. C., Moutinho, P., Dias-Filho, M. B., Davidson, E.,Cardinot, G., Markewitz, D., Figueiredo, R., Vianna, N., Cham-bers, J., Ray, D., Guerreiros, J. B., Lefebvre, P., Sternberg, L.,Moreira, M., Barros, L., Ishida, F. Y., Tohlver, I., Belk, E., Kalif,K. and Schwalbe, K., 2002. The effects of partial throughfallexclusion on canopy processes, aboveground production, andbiogeochemistry of an Amazon forest. Journal of GeophysicalResearch 107(D20), pp. 8085.
Phillips, O. L., Aragão, L. E. O. C., Lewis, S. L., Fisher, J. B.,Lloyd, J., López-González, G., Malhi, Y., Monteagudo, A.,Peacock, J., Quesada, C. A., van der Heijden, G., Almeida,S., Amaral, I., Arroyo, L., Aymard, G., Baker, T. R., Bánki,O., Blanc, L., Bonal, D., Brando, P., Chave, J., de Oliveira,A. C. A., Cardozo, N. D., Czimczik, C. I., Feldpausch, T. R.,Freitas, M. A., Gloor, E., Higuchi, N., Jiménez, E., Lloyd, G.,Meir, P., Mendoza, C., Morel, A., Neill, D. A., Nepstad, D.,Patiño, S., Peñuela, M. C., Prieto, A., Ramírez, F., Schwarz, M.,Silva, J., Silveira, M., Thomas, A. S., Steege, H. T., Stropp, J.,Vásquez, R., Zelazowski, P., Alvarez Dávila, E., Andelman, S.,Andrade, A., Chao, K.-j., Erwin, T., Di Fiore, A., Honorio C,E., Keeling, H., Killeen, T. J., Laurance, W. F., Peña Cruz, A.,Pitman, N. C. A., Núñez Vargas, P., Ramírez-Angulo, H., Rudas,A., Salamão, R., Silva, N., Terborgh, J. and Torres-Lezama, A.,2009. Drought sensitivity of the Amazon rainforest. Science323(5919), pp. 1344–1347.
Phillips, O. L., van der Heijden, G., Lewis, S. L., López-González,G., Aragão, L. E. O. C., Lloyd, J., Malhi, Y., Monteagudo, A.,Almeida, S., Dávila, E. A., Amaral, I., Andelman, S., Andrade,A., Arroyo, L., Aymard, G., Baker, T. R., Blanc, L., Bonal, D.,de Oliveira, A. C. A., Chao, K.-J., Cardozo, N. D., da Costa, L.,Feldpausch, T. R., Fisher, J. B., Fyllas, N. M., Freitas, M. A.,Galbraith, D., Gloor, E., Higuchi, N., Honorio, E., Jiménez,E., Keeling, H., Killeen, T. J., Lovett, J. C., Meir, P., Mendoza,C., Morel, A., Vargas, P. N. n., Patiño, S., Peh, K. S.-H., Cruz,A. P. n., Prieto, A., Quesada, C. A., Ramírez, F., Ramírez, H.,Rudas, A., Salamão, R., Schwarz, M., Silva, J., Silveira, M.,Slik, J. W. F., Sonké, B., Thomas, A. S., Stropp, J., Taplin, J.R. D., Vásquez, R. and Vilanova, E., 2010. Drought-mortalityrelationships for tropical forests. The New Phytologist 187(3),pp. 631–646.
Roujean, J.-L., Leroy, M. and Deschamps, P.-Y., 1992. A bidirec-tional reflectance model of the Earth’s surface for the correc-tion of remote sensing data. Journal of Geophysical Research97(D18), pp. 20455.
Saatchi, S., Asefi-Najafabady, S., Malhi, Y., Aragão, L. E. O. C.,Anderson, L. O., Myneni, R. B. and Nemani, R., 2013. Persis-tent effects of a severe drought on Amazonian forest canopy.
Proceedings of the National Academy of Sciences of the UnitedStates of America 110(2), pp. 565–570.
Saleska, S. R., Miller, S. D., Matross, D. M., Goulden, M. L.,Wofsy, S. C., da Rocha, H. R., de Camargo, P. B., Crill, P.,Daube, B. C., de Freitas, H. C., Hutyra, L., Keller, M., Kirch-hoff, V., Menton, M., Munger, J. W., Pyle, E. H., Rice, A. H.and Silva, H., 2003. Carbon in Amazon forests: unexpected sea-sonal fluxes and disturbance-induced losses. Science 302(5650),pp. 1554–1557.
Samanta, A., Knyazikhin, Y., Xu, L., Dickinson, R. E., Fu, R.,Costa, M. H., Saatchi, S. S., Nemani, R. R. and Myneni, R. B.,2012. Seasonal changes in leaf area of Amazon forests fromleaf flushing and abscission. Journal of Geophysical Research117(G1), pp. G01015.
Schaaf, C. B., Gao, F., Strahler, A. H., Lucht, W., Li, X., Tsang,T., Strugnell, N. C., Zhang, X., Jin, Y., Muller, J.-P., Lewis, P.,Barnsley, M., Hobson, P., Disney, M., Roberts, G., Dunderdale,M., Doll, C., D’Entremont, R. P., Hu, B., Liang, S., Privette,J. L. and Roy, D., 2002. First operational BRDF, albedo nadirreflectance products from MODIS. Remote Sensing of Envi-ronment 83(1-2), pp. 135–148.
Schaaf, C. B., Liu, J., Gao, F. and Strahler, A. H., 2011. Aquaand Terra MODIS albedo and reflectance anisotropy products.In: B. Ramachandran, C. O. Justice and M. J. Abrams (eds),Land Remote Sensing and Global Environmental Change –NASA’s Earth Observing System and the Science of ASTERand MODIS, Springer, New York, Dordrecht, Heidelberg, Lon-don, chapter 23, pp. 579–602.
Schwalm, C. R., Williams, C. A., Schaefer, K., Arneth, A., Bonal,D., Buchmann, N., Chen, J., Law, B. E., Lindroth, A., Luyssaert,S., Reichstein, M. and Richardson, A. D., 2010. Assimilationexceeds respiration sensitivity to drought: A FLUXNET syn-thesis. Global Change Biology 16(2), pp. 657–670.
Sims, D. A., Rahman, A. F., Vermote, E. F. and Jiang, Z., 2011.Seasonal and inter-annual variation in view angle effects onMODIS vegetation indices at three forest sites. Remote Sensingof Environment 115(12), pp. 3112–3120.
Strahler, A. H., Muller, J.-P. and MODIS Science TeamMembers, 1999. MODIS BRDF/Albedo Product:Algorithm theoretical basis document version 5.0.http://modis.gsfc.nasa.gov/data/atbd/atbd_mod09.pdf.
White, A., Cannell, M. and Friend, A., 1999. Climate changeimpacts on ecosystems and the terrestrial carbon sink: A newassessment. Global Environmental Change 9, pp. S21–S30.
Xiao, X., Hagen, S., Zhang, Q., Keller, M. and Moore, B., 2006.Detecting leaf phenology of seasonally moist tropical forests inSouth America with multi-temporal MODIS images. RemoteSensing of Environment 103(4), pp. 465–473.


![[Vegetation and Remote Sensing] Vegetation](https://img.pdfslide.us/doc/110x75/577cdfd71a28ab9e78b21a32/vegetation-and-remote-sensing-vegetation.jpg)