Embed Size (px)
Citation preview
Performance of Pervious Concrete Pavements Marty Wanielista, Manoj Chopra, Matt Offenberg Joshua Spence and Craig Ballock
Stormwater Management AcademyUniversity of Central FloridaOrlando, FL [email protected]

Outline of Presentation
Overview Background and Current State Objectives of this On-going Project Research Plan Progress to Date
UCF Test Site Field Tests
Discussion
Overview
Pervious or No-fines Concrete – mixture of coarse aggregate, Portland Cement, admixtures and water
Increased Porosity due to limited fines and 15-20% air voids
Strong need for Current and Updated Assessment of Pervious Pavements due to new regulations pending for Stormwater Management
Overview Issues to be addressed –
Design Section Construction Methods Acceptance Criteria Infiltration Rate Performance Credit for Replacement of Impervious Area
Our research will initially address – Design Section Infiltration Rate Performance Credit for Replacement of Impervious Areas
Background and Current State
Replacement of Impervious Areas with Properly Designed and Constructed Pervious Paving Surfaces is Desirable
Treating pervious concrete as a system with pavement and sub soil
ACI Committee 522 has been formed to develop Guidelines for the use of Portland Cement Pervious Concrete
Historical and Literature Review PC Pervious Pavements have been used for
past 20 years in Areas of Lower Traffic Loads (parking lots, shoulders, airport taxiways, some state and local roads).
Must have suitable Subsoil Conditions Groundwater Locations
Historical and Literature Review Field et al (1982) Water Resources Bulletin –
detailed information on PP. Florida Concrete and Products Association
(FCPA) – Portland Cement Pervious Pavement Manual (No. 605)
EPA (1999) – Stormwater Technology Fact Sheet on Porous Pavements
Several recent articles from USC and Purdue, as well as UK, Japan and China.
FDOT Interests
Need for a permit, or credit (partial or total) for substituting pervious surfaces
Based on Volume of water that can be Stored and allowed to Replenish the Aquifer
Want answers to – What is design – materials, dimensions, GWT? What are proper construction methods? What is the infiltration rate for the system?
Advantages and Disadvantages(EPA, 1999) Advantages -
Recharge to Local Aquifer Water budget retention and pollution removal Less need for Storm Sewers
Disadvantages – Lack of Construction Experience and Expertise Clogging Cold Weather Problems

Construction Specifications
Specifications for contractor certification, materials and mix design, construction practices, and post construction care
Sources from EPA, California-Nevada Cement Promotions Council PC Specs, and PCI Systems, LLC. PC Specs
Construction Specifications
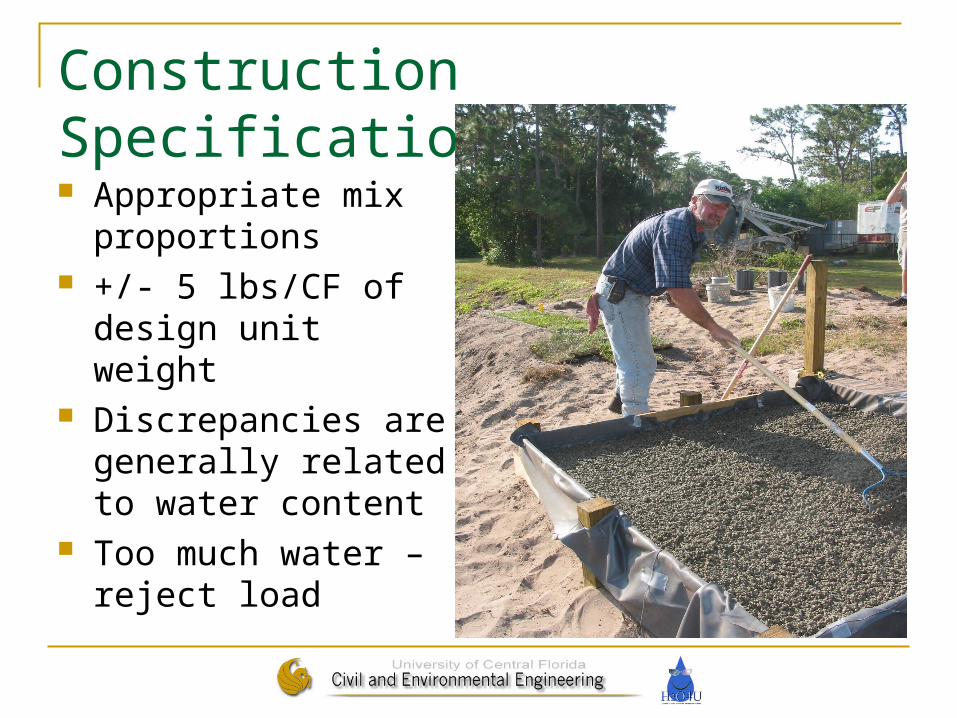
Appropriate mix proportions
+/- 5 lbs/CF of design unit weight
Discrepancies are generally related to water content
Too much water – reject load
Construction Specifications
Concrete should be stricken off ¼ to ½ of an inch about the form boards and compacted to level
Compaction – roll with a 10-inch schedule 40 steel pipe
Curing Time – pavement should be covered a minimum of 7 days
Construction Specifications
Limit frequency of heavy traffic – e.g. construction vehicles, garbage trucks, etc.
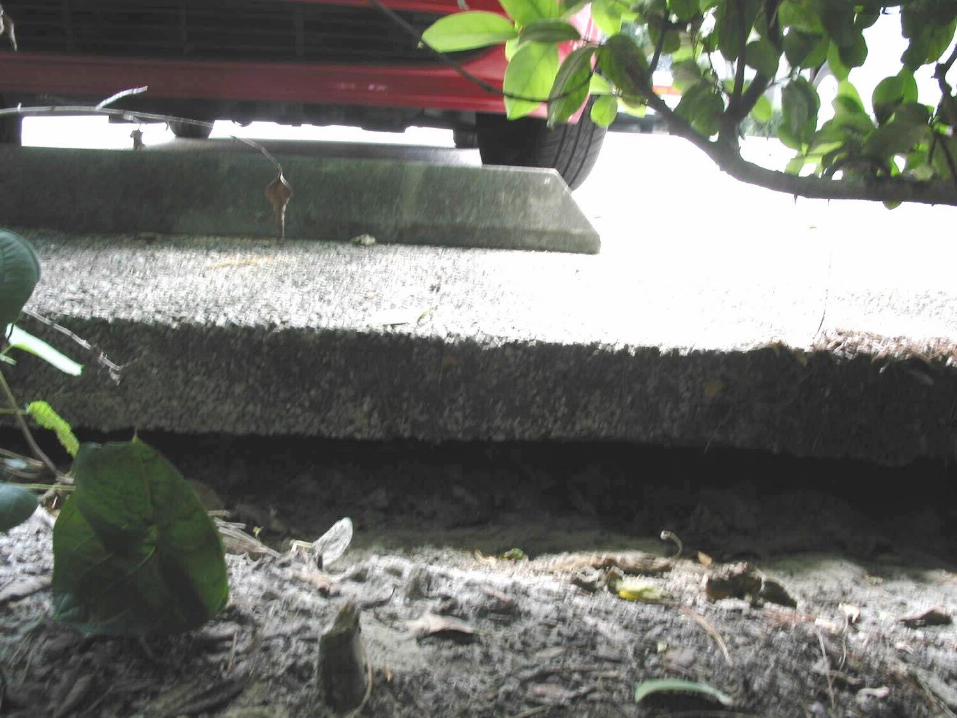
Remove or Limit sources of sediment Signage such as “ADOPT A LOT” Curbing should be used to direct infiltrating
water downward and to prevent erosion at the edges of pervious concrete slabs.
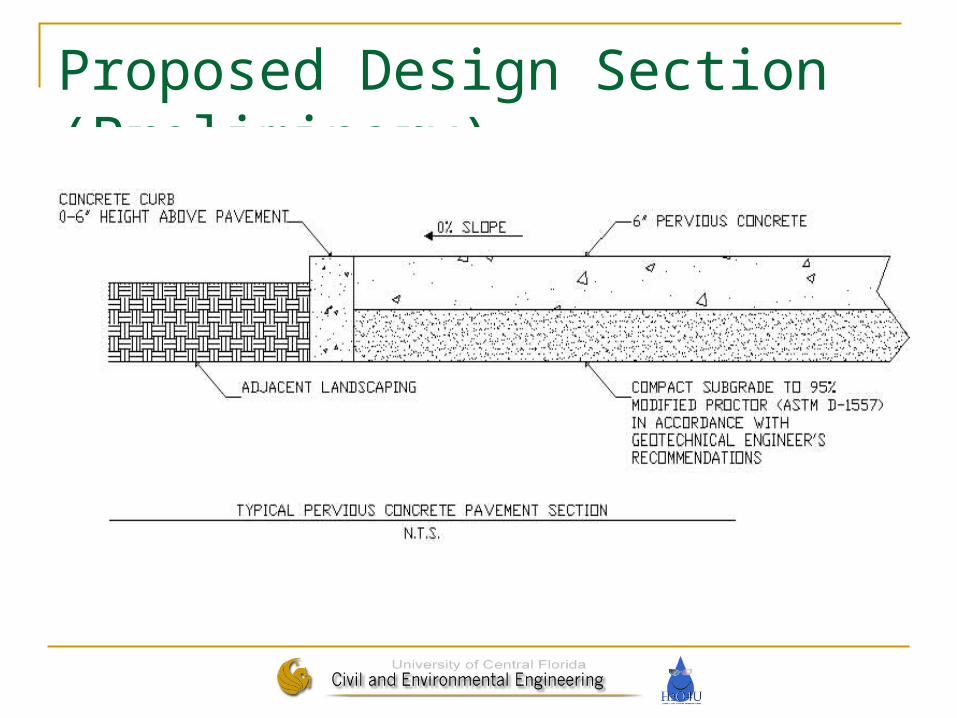
Proposed Design Section (Preliminary)

Design and Construction Specifications Cities of Stuart, Zephyr Hills, Winter Park, and
Titusville and the Counties of Citrus, Hernando, Pasco, and Hillsborough have adopted specifications.
Credit is being determined for use by other Cities and WMDs.
A goal is to have 24 cities and counties with pervious concrete code language for pervious concrete.
Contractor Certification will be an Important Factor Soil Preparation, Curbing, Field Infiltration Tests and
Inspections will be Important.
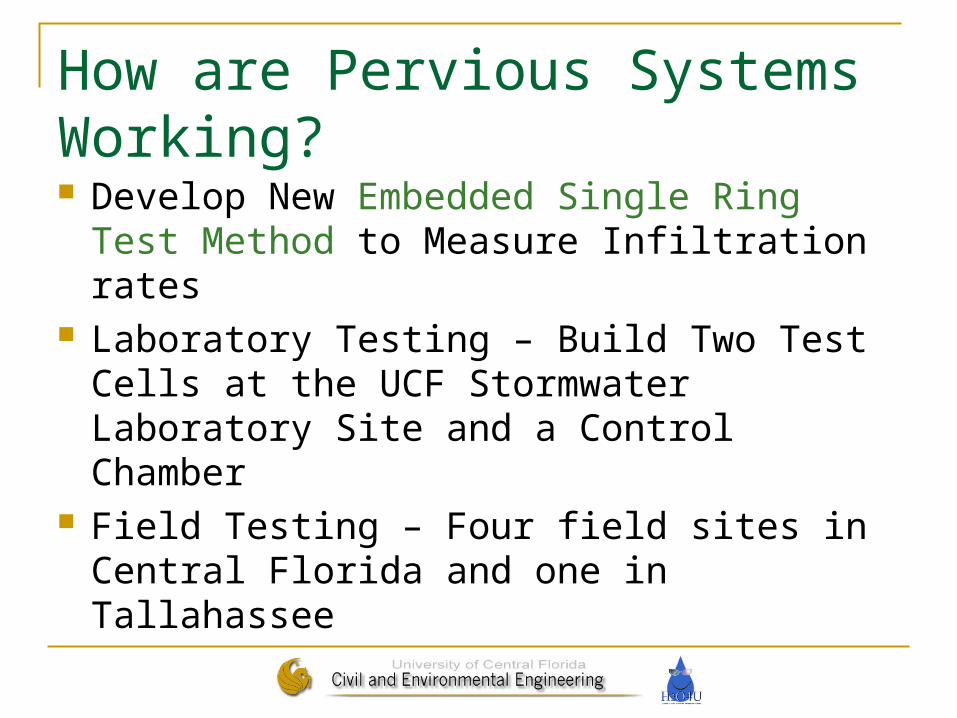
How are Pervious Systems Working? Develop New Embedded Single Ring Test
Method to Measure Infiltration rates Laboratory Testing – Build Two Test Cells at
the UCF Stormwater Laboratory Site and a Control Chamber
Field Testing – Four field sites in Central Florida and one in Tallahassee
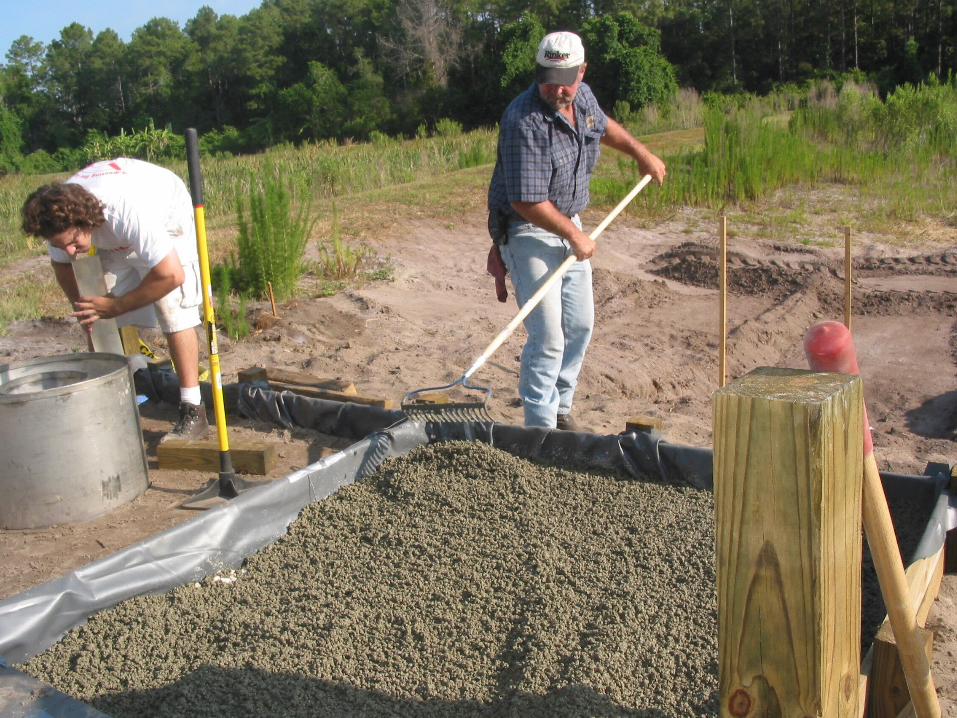
Preparation of Test Cells
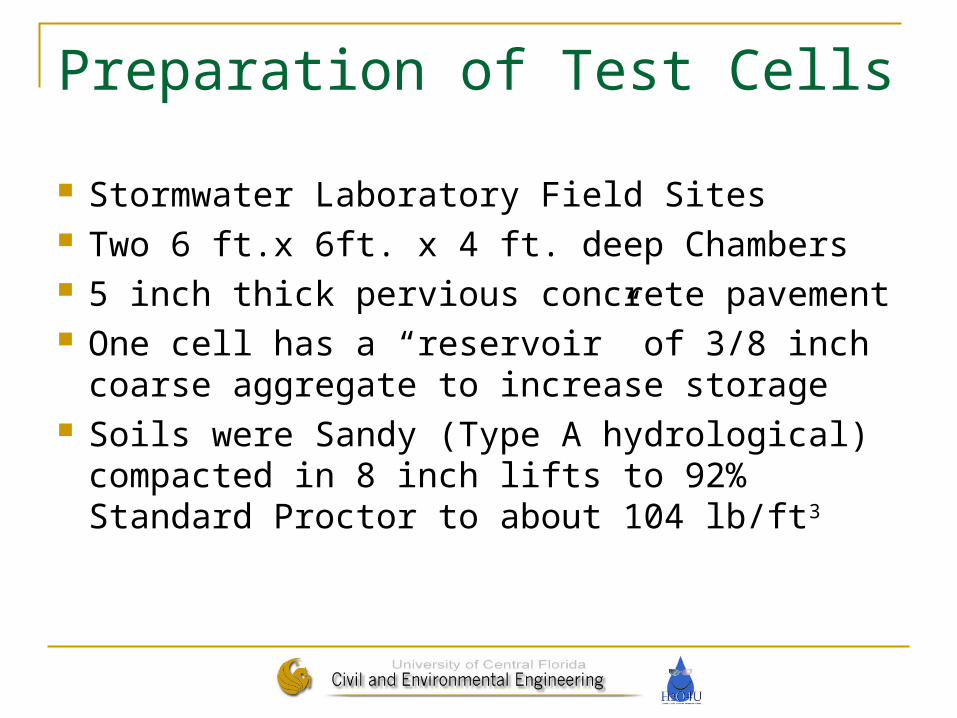
Stormwater Laboratory Field Sites Two 6 ft.x 6ft. x 4 ft. deep Chambers 5 inch thick pervious concrete pavement One cell has a “reservoir” of 3/8 inch coarse
aggregate to increase storage Soils were Sandy (Type A hydrological)
compacted in 8 inch lifts to 92% Standard Proctor to about 104 lb/ft3
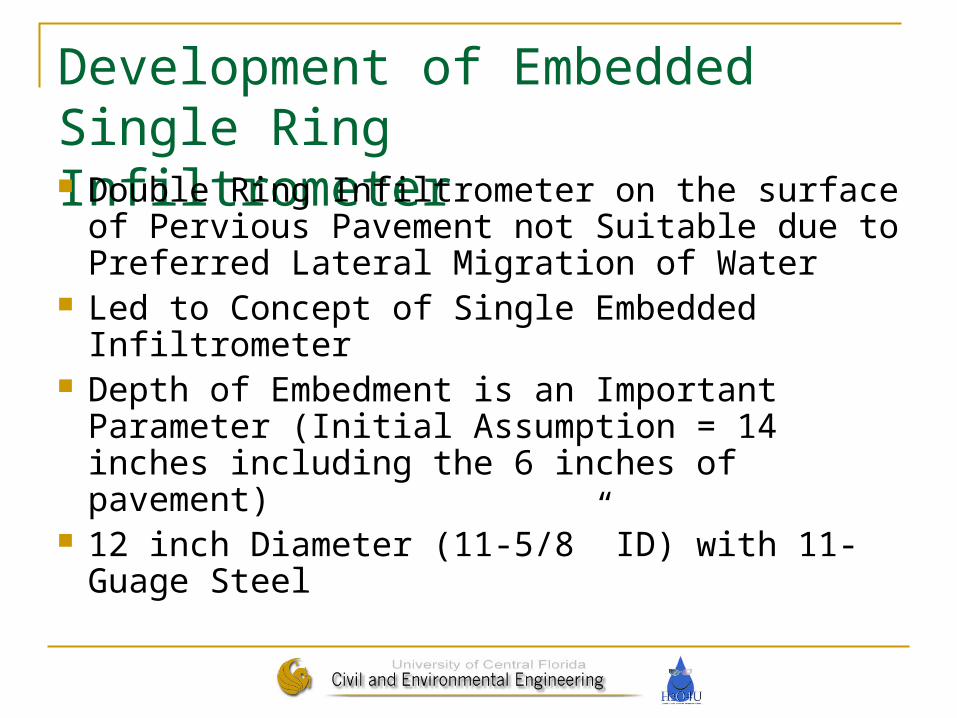
Development of Embedded Single Ring Infiltrometer Double Ring Infiltrometer on the surface of
Pervious Pavement not Suitable due to Preferred Lateral Migration of Water
Led to Concept of Single Embedded Infiltrometer
Depth of Embedment is an Important Parameter (Initial Assumption = 14 inches including the 6 inches of pavement)
12 inch Diameter (11-5/8” ID) with 11-Guage Steel
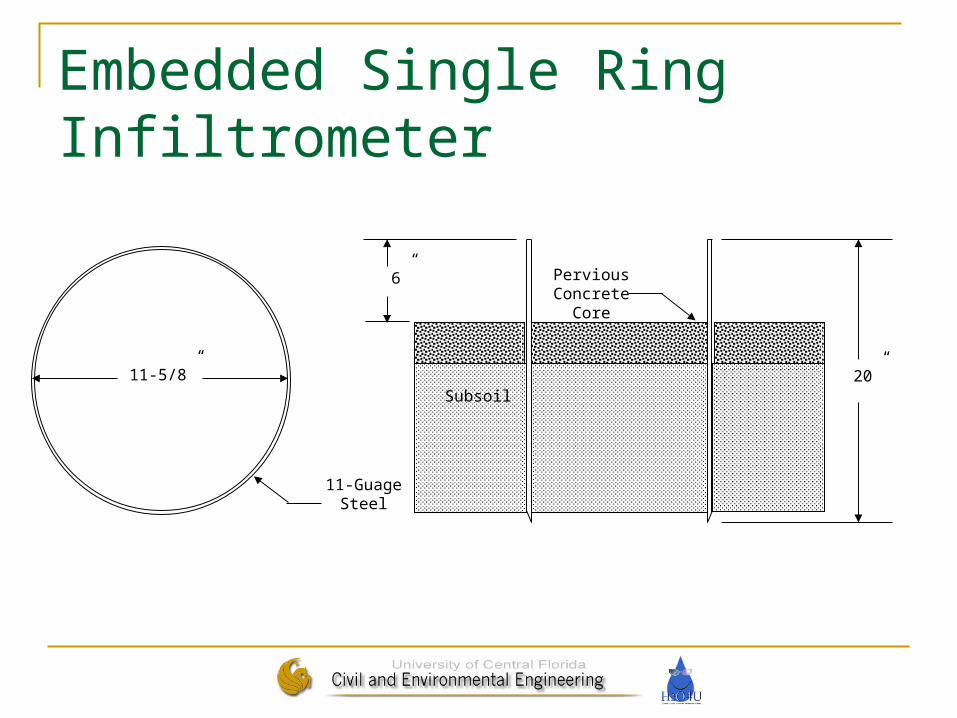
Embedded Single Ring Infiltrometer
11-5/8”
11-Guage Steel
Subsoil
Pervious Concrete
Core
20”
6”
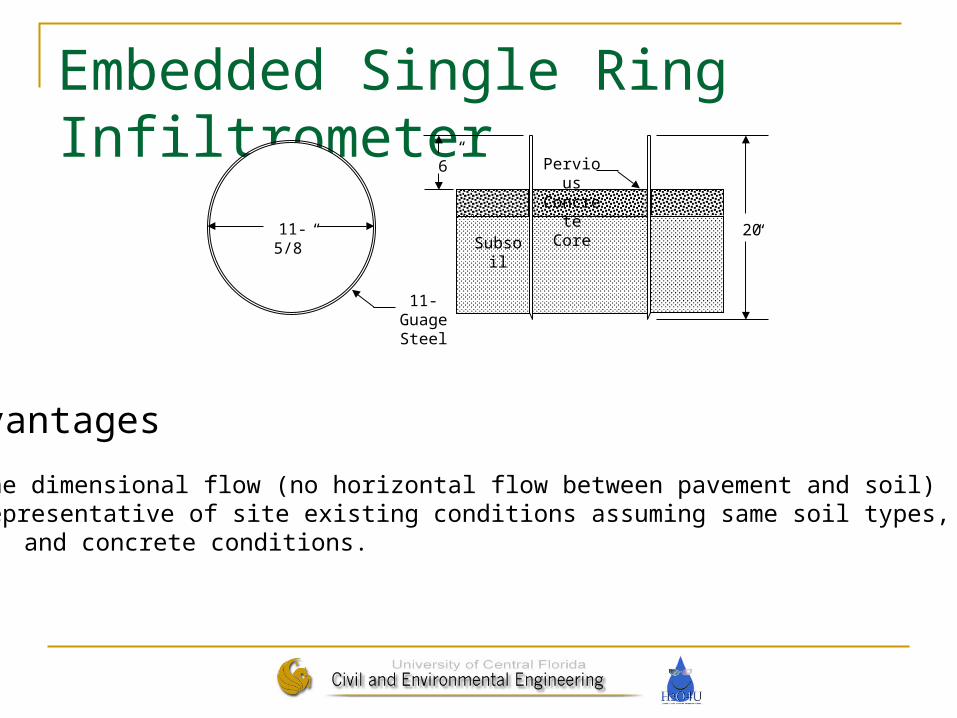
Embedded Single Ring Infiltrometer
11-5/8”
11-Guage Steel
Subsoil
Pervious
Concrete
Core20”
6”
Advantages
1. One dimensional flow (no horizontal flow between pavement and soil)2. Representative of site existing conditions assuming same soil types, and concrete conditions.
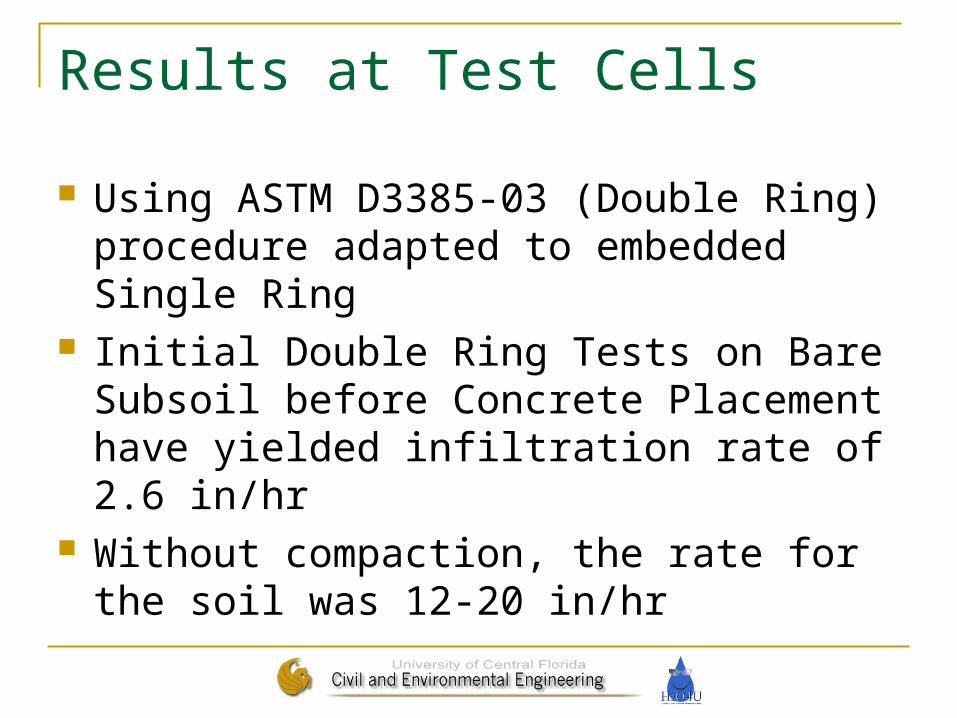
Results at Test Cells
Using ASTM D3385-03 (Double Ring) procedure adapted to embedded Single Ring
Initial Double Ring Tests on Bare Subsoil before Concrete Placement have yielded infiltration rate of 2.6 in/hr
Without compaction, the rate for the soil was 12-20 in/hr
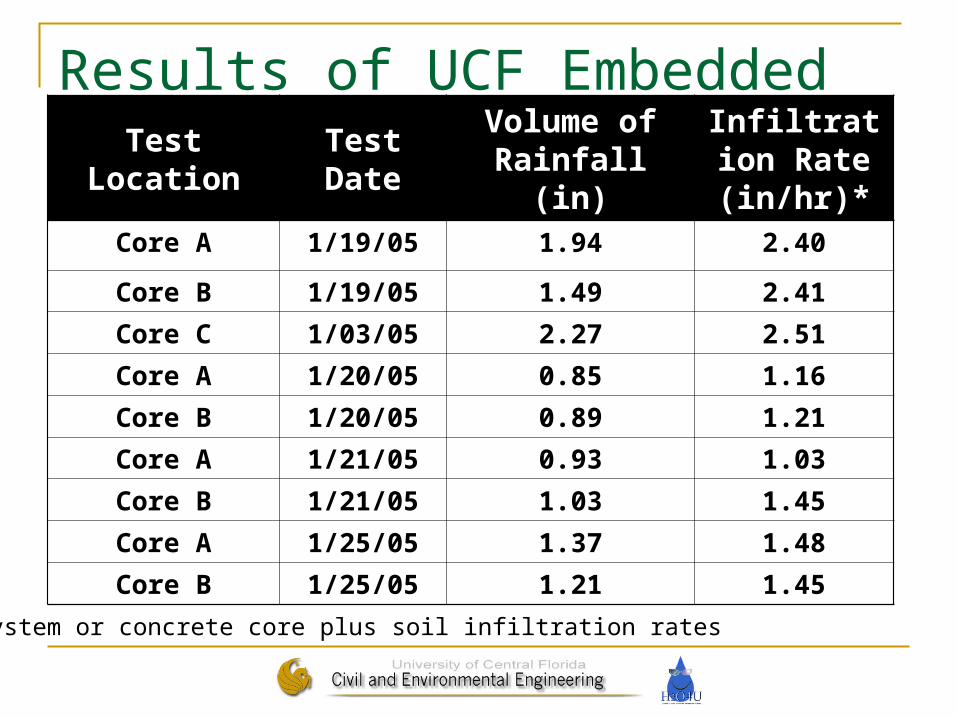
Results of UCF Embedded Ring TestsTest Location Test Date
Volume of Rainfall (in)
Infiltration Rate
(in/hr)*Core A 1/19/05 1.94 2.40
Core B 1/19/05 1.49 2.41
Core C 1/03/05 2.27 2.51
Core A 1/20/05 0.85 1.16
Core B 1/20/05 0.89 1.21
Core A 1/21/05 0.93 1.03
Core B 1/21/05 1.03 1.45
Core A 1/25/05 1.37 1.48
Core B 1/25/05 1.21 1.45
* System or concrete core plus soil infiltration rates
Preliminary Observations from UCF Test Chambers
Pervious Concrete Pavement and Subsoil System displays Infiltration Rates nearly equal to Subsoil Alone
Infiltration rates of the system are greater than the minimum rates of 1 in/hr used for the design of FDOT retention areas.
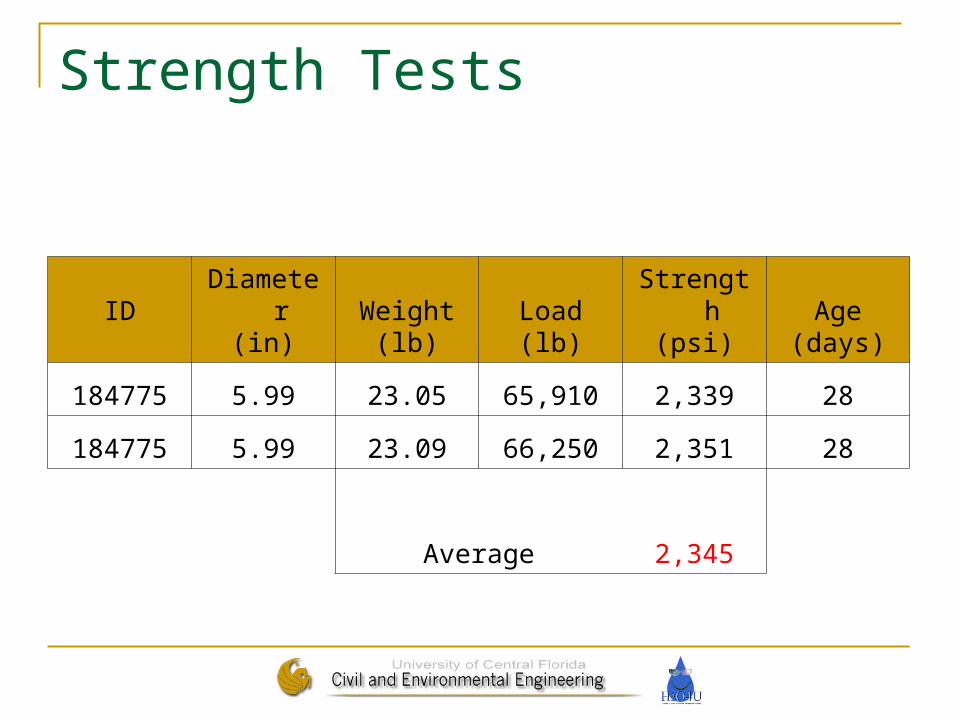
Strength Tests
ID Diameter(in)
Weight(lb)
Load(lb)
Strength(psi)
Age(days)
184775 5.99 23.05 65,910 2,339 28
184775 5.99 23.09 66,250 2,351 28
Average 2,345
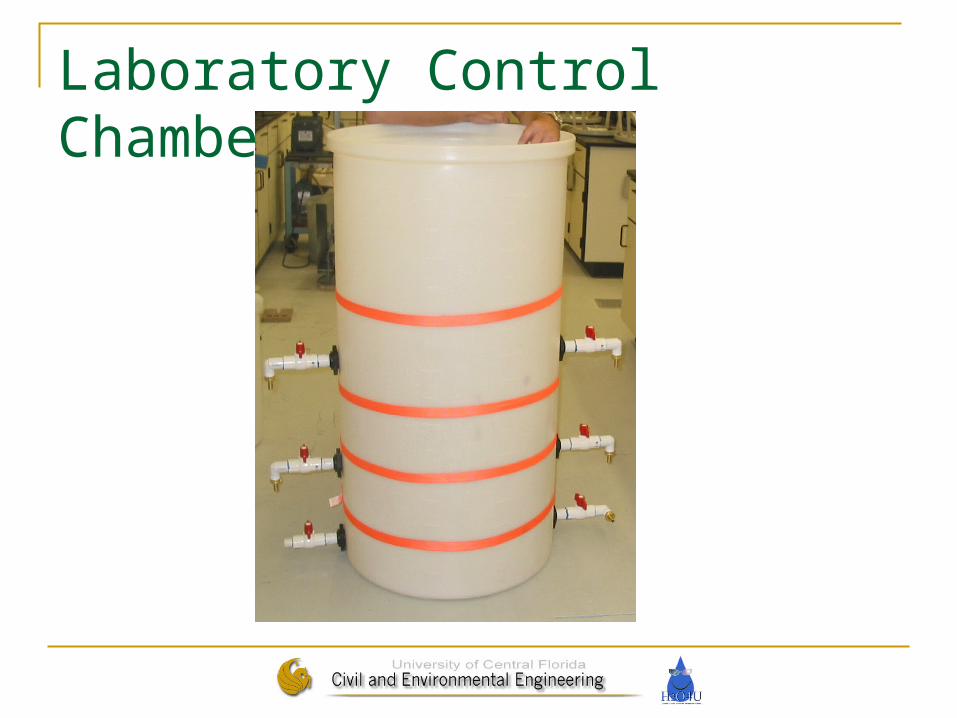
Laboratory Control Chamber
Better “Control” Address issues such as Clogging and Water
Table Impact The Chamber was Filled with Sandy Soils
from UCF Stormwater Lab. (Type A Hydrologic Group )
Filled in 8” lifts to 92% Standard Proctor
Laboratory Control Chamber
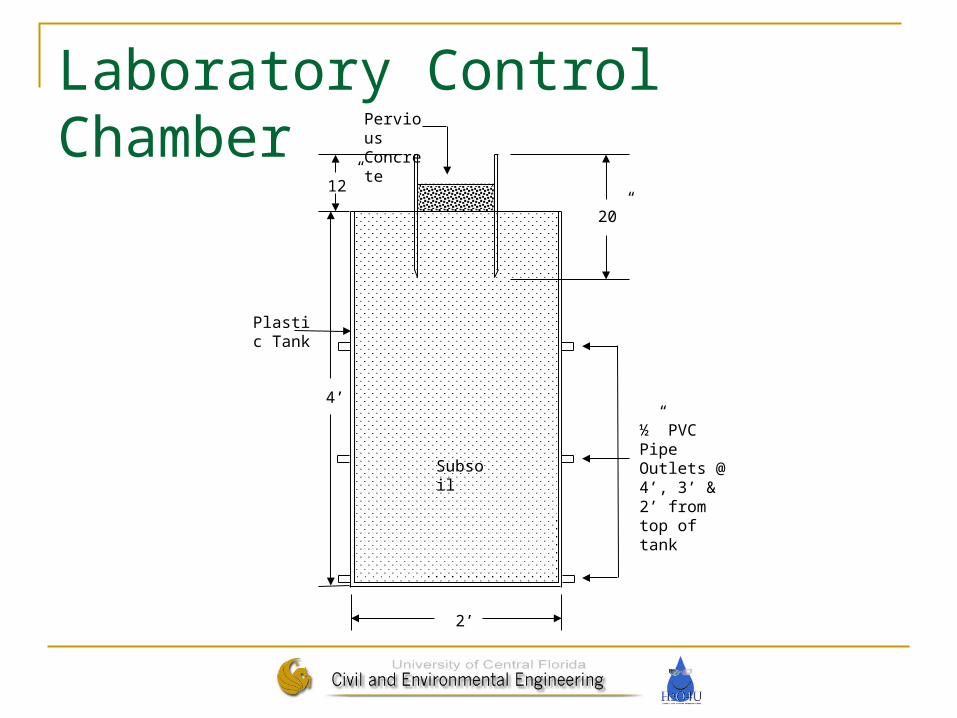
Laboratory Control ChamberPervious Concrete
20”
Plastic Tank
12”
½” PVC Pipe Outlets @ 4’, 3’ & 2’ from top of tank
4’
Subsoil
2’
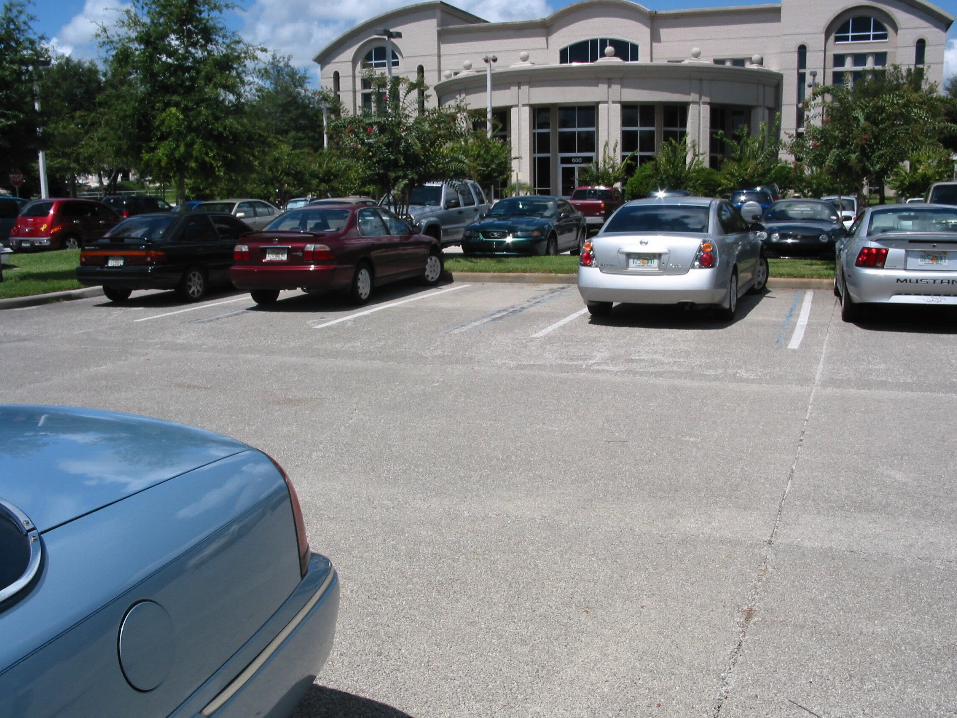
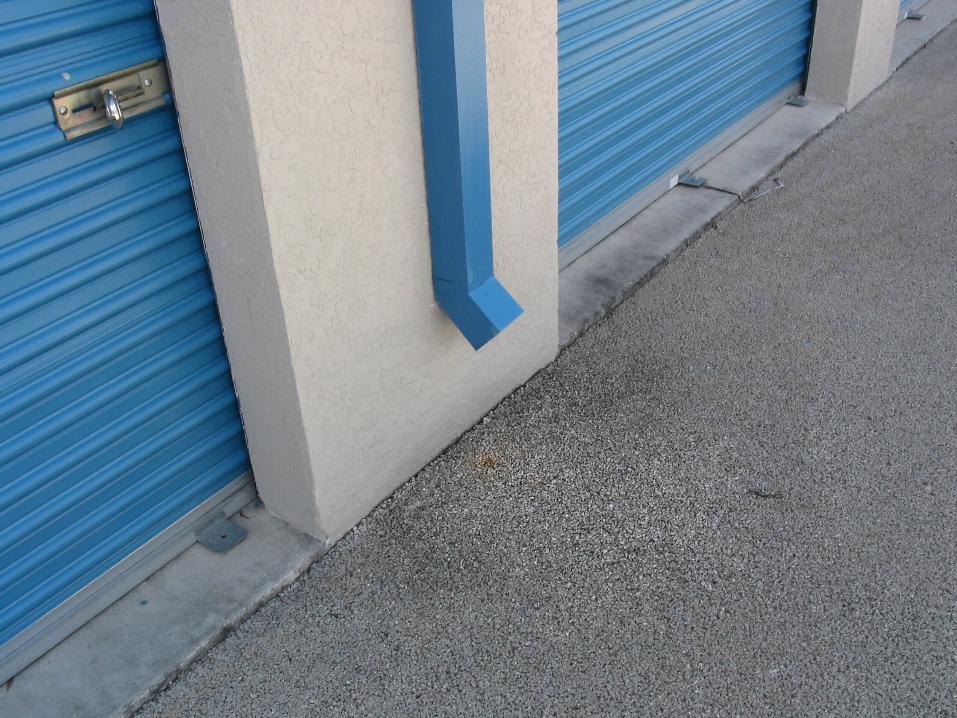
Field Site Reconnaissance
Vet Office in Sanford FCPA Office in Orlando Sunray StoreAway – Lake Mary Strang Communications – Lake Mary FDEP Office - Tallahassee
Field Testing Progress
Six cores at Sunray Storaway, Three at Strang Communications, Three at FCPA, Six in Tallahassee, and Three at Murphy Vet Clinic.
Field infiltration tests completed at all locations
Laboratory tests using Control Chamber on-going
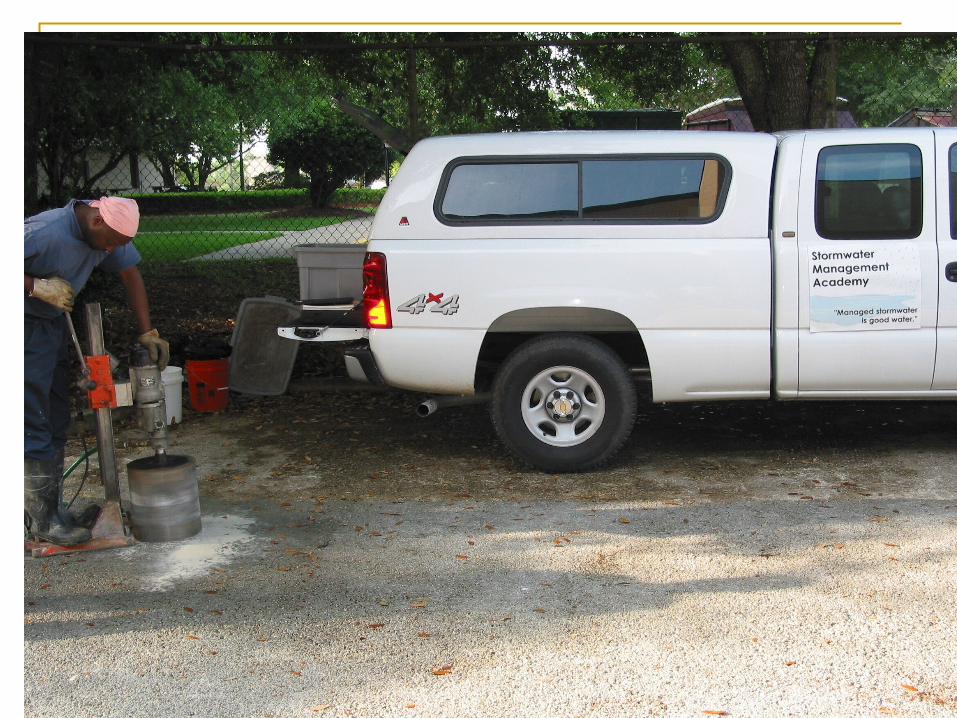
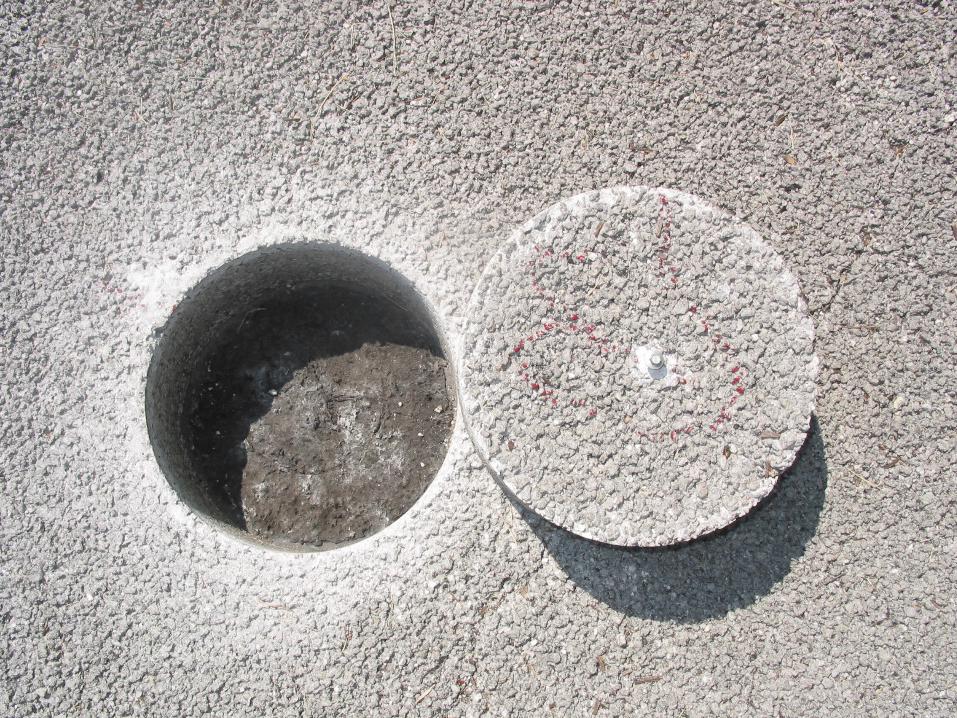
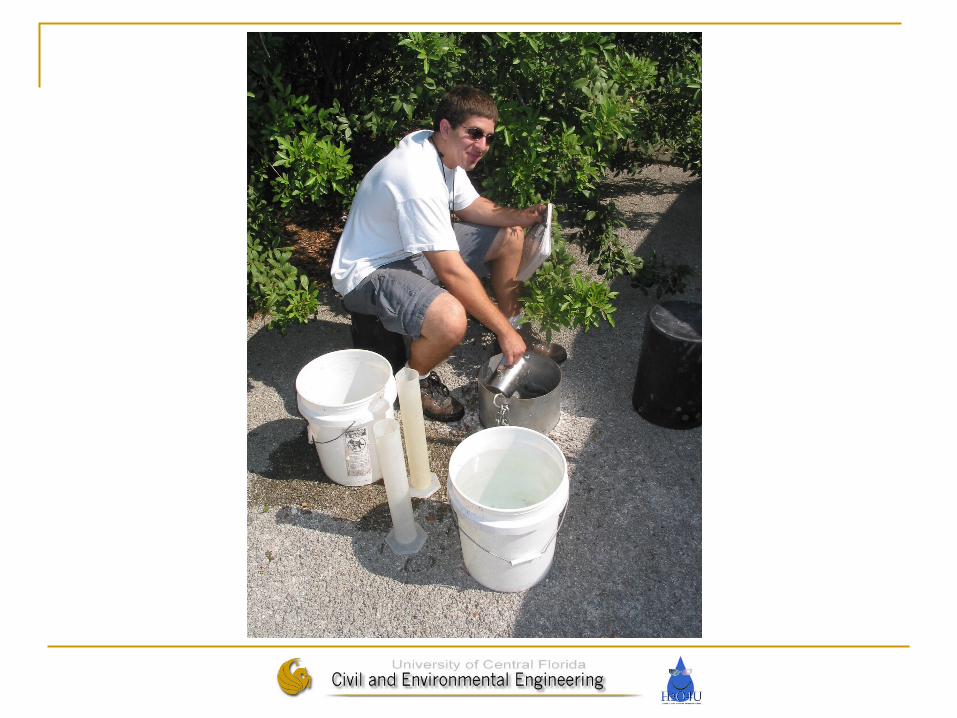
Field Testing Process
12-in diameter cores Run field tests Collect soil samples Lab work on soil samples Lab test on core infiltration rates
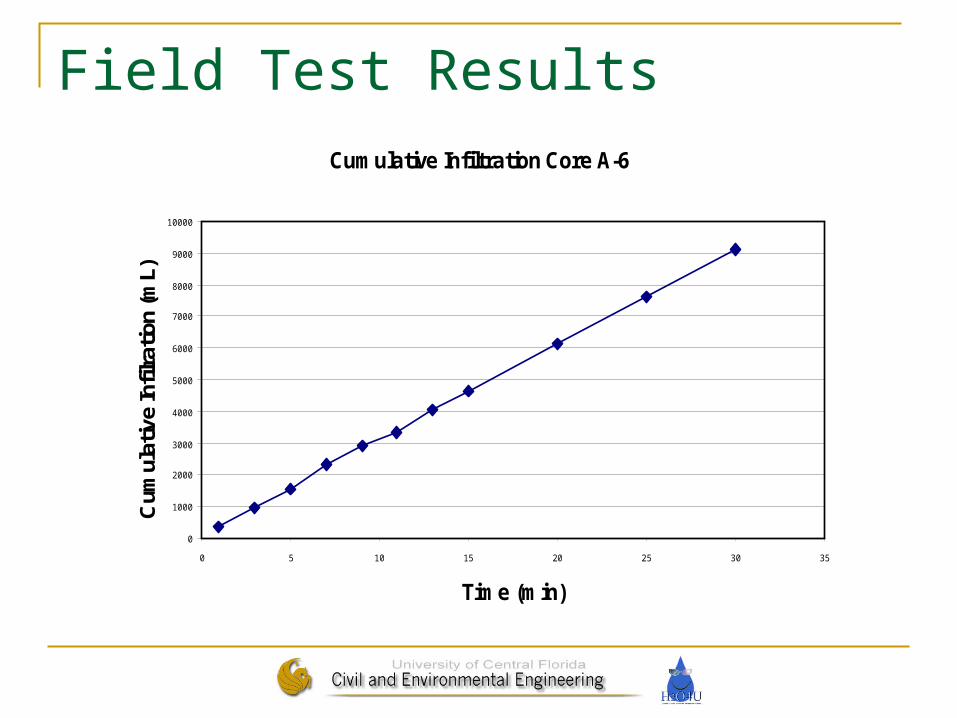
Field Test ResultsCumulative Infiltration Core A-6
0
1000
2000
3000
4000
5000
6000
7000
8000
9000
10000
0 5 10 15 20 25 30 35
Time (min)
Cum
ulat
ive
Infil
ratio
n (m
L)
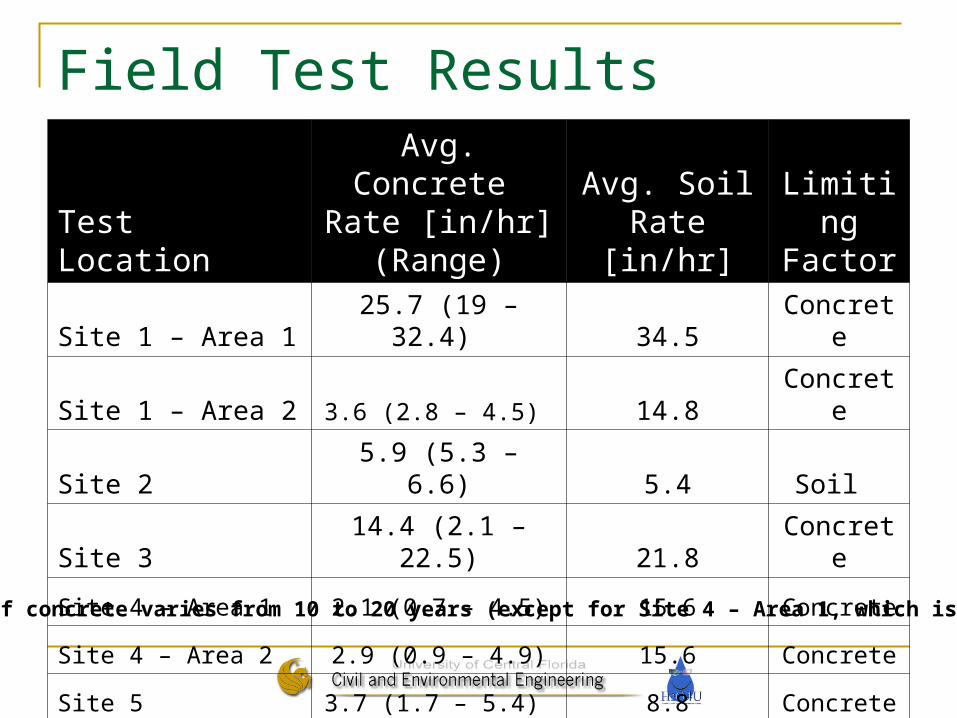
Field Test Results
Test Location
Avg. Concrete Rate [in/hr]
(Range)Avg. Soil
Rate [in/hr]Limiting Factor
Site 1 – Area 1 25.7 (19 – 32.4) 34.5 Concrete
Site 1 – Area 2 3.6 (2.8 – 4.5) 14.8 Concrete
Site 2 5.9 (5.3 – 6.6) 5.4 Soil
Site 3 14.4 (2.1 – 22.5) 21.8 Concrete
Site 4 – Area 1 2.1 (0.7 – 4.5) 15.6 Concrete
Site 4 – Area 2 2.9 (0.9 – 4.9) 15.6 Concrete
Site 5 3.7 (1.7 – 5.4) 8.8 Concrete
*Age of concrete varies from 10 to 20 years (except for Site 4 – Area 1, which is 1 yr).
Conclusions
Proper construction is important (water in mix, curing); Certification program is needed.
Specifications need to be followed for design and construction; Good design practices (curbing, pavement thickness).
Pavement and Subsoil must be treated as a SYSTEM.
Conclusions
Infiltration rates are comparable to Stormwater Retention Ponds.
Water storage is directly proportional to the porosity and the depth to the water table. Modeling efforts currently underway

Thank You!For additional information:Please see www.stormwater.ucf.eduor call 407.823.4143
Questions?