Embed Size (px)
Citation preview

1
Performance Evaluation of Airframe-Integrated Aerospike
Propulsion Systems in Off-Design Flight Conditions
Hidemi Takahashi1
Japan Aerospace Exploration Agency (JAXA), Kakuda, Miyagi, 981-1525, Japan
The thrust performance of airframe-integrated linear aerospike propulsion systems for high-speed
aircraft operated under off-design in-flight conditions was evaluated, based on performance
prediction models established for linear aerospike nozzles by accounting for the freestream effect.
The airframe configuration, equipped with a boattail appearing to the right upstream of the primary
cell nozzle exit, enabled the freestream effect to be utilized for increasing the spike surface pressure.
Performances of each thrust component were predicted by using the physics-based models
established in separately performed studies. First, a parametric study was conducted on a rocket
primary thruster with various design parameters. Then, an advanced concept with an airbreathing
primary propulsion system was evaluated for its feasibility by comparing its thrust performance with
that of a conventional rocket primary thruster. The benefit of the aerospike nozzle integrated into the
airframe was also evaluated by comparing its thrust to a configuration without the aerospike nozzle.
Results showed that the employment of the aerospike nozzle offered improved performance from
takeoff to cruise phases. The advanced concept using the bypass airbreathing system for the primary
thruster followed by the aerospike configuration exhibited further improvement in thrust by
compensating for the boattail drag.
Nomenclature
A = area, m2
CF = thrust coefficient
D = drag, N
M = Mach number
1 Researcher, Engine System Research and Development Group, Space Transportation Mission Directorate, 1
Kimigaya-Aza-Koganezawa, Kakuda, Member AIAA.
This document is provided by JAXA.

2
m = mass flow rate, kg/s
P = pressure, kPa
P0r = total pressure of the cell nozzle flow, kPa
Pr = static pressure at the cell nozzle exit, kPa
Pw = static pressure on the nozzle surface, kPa
Re = Reynolds number
T = temperature, K
V = velocity, m/s
W = wet area, m2
x = coordinate in streamwise direction
y = coordinate in vertical direction
z = coordinate in spanwise direction
= specific heat ratio
= expansion ratio
= angle, rad
Subscripts
0 = stagnation condition
a = freestream condition
b = ambient condition
boattail = boattail
bypass = bypass flow
c = combustion chamber
cell = cell nozzle
cb = cell base
cell_exit = cell nozzle exit
core = core flow
LE = leading edge
This document is provided by JAXA.

3
local = local contour
r = cell nozzle exit condition
r2 = bypass flow condition
sb = spike base
sf = skin friction force
spike = spike surface
straight = straight section
throat = throat
total = total
I. Introduction
Long-range hypersonic air transportation systems cruise over a wide range of altitudes and distances in the dense
atmosphere after taking off horizontally from the ground; therefore, their flight envelopes involve off-design conditions for
the propulsive nozzle, which is exposed to the supersonic external flow at various Mach numbers. The external flow
surrounding the vehicle aftbody during flight considerably affects the performance of the nozzle owing to local changes in the
ambient pressure and the resultant changes in flow properties of cell nozzle exhausts.
The linear aerospike nozzle is one of the most promising nozzle configurations for this kind of hypersonic vehicle because
of its altitude compensating feature [1–3]. An engine employing an aerospike nozzle is capable of maintaining nearly optimal
thrust performance from sea level to orbit, unlike that using a conventional bell-shaped nozzle, which reaches maximum
performance only at one specific altitude (design altitude). Considering the needs of the vehicle during operation, such as
thrust vectoring [4], and configurations that efficiently utilize the entire back area of a rectangular vehicle body to minimize
the base drag, a clustered linear aerospike nozzle concept is beneficial.
When the aerospike nozzle concept is considered for deployment, it is necessary for mission feasibility to evaluate the
thrust performance for given configurations. To date, numerous studies have been conducted to establish a performance
prediction model, including a multidisciplinary optimization and feasibility study accounting for both aerodynamic and
structural designs [1], and thrust performance and flowfield modelings based on experimental [5–7] and numerical simulation
results [8-11]. Here, the overall thrust performance of a clustered linear aerospike nozzle composed with a rocket primary
This document is provided by JAXA.

4
thruster in the still-air condition (i.e., at sea level or in near-vacuum) can be expressed in terms of the aerodynamics with
possible drags as follows [12]:
c
b
spike
tc
sf
tc
sbsb
tc
spike
tc
cbcb
c
exitcell
cellcelltotalP
PW
AP
PaD
AP
AP
AP
WdzP
AP
AP
P
PCCF
][_
The left-hand side indicates the thrust coefficient, where the thrust value is normalized by the throat area and the combustion
chamber pressure. On the right-hand side, the first two terms in parentheses represent the cell nozzle characteristics. The third
term represents the cell base wake characteristics, which appear when a primary thruster comprises clustered cell nozzles.
The fourth term is the thrust generated by the spike surface pressure, and the fifth term represents the spike base wake
characteristics. Finally, the sixth and seventh terms are skin frictional drag and ambient pressure drag, respectively. The
thrust equation can be divided into two portions: the primary inner thrust, comprising the first three terms, and the outer
thrust comprising the remaining terms, including drags. The engine, which provides the primary inner thrust, can be either a
rocket or an airbreathing propulsion system, depending on the mission and vehicle configurations. For the case of a vehicle
during in-flight conditions, the thrust performance prediction model has to be modified by accounting for the influence of the
external flow on each term.
To date, many insights on the influence of external flow have been provided through numerous studies examining the
freestream effect [3,6,13–15], the mechanism of closed/open wake conditions [7], and clustering effects [8] in ground tests
before flight experiments. It should be noted that actual flight experiments, including the Linear Aerospike SR-71
Experiment as a part of the X-33 program [16–17], have been conducted to investigate the interactions between the engine
plume and external flow and to evaluate the methodologies to reduce base drags. Although the actual in-flight hot-flow test
was not performed because of the concern of oxygen leakage in the test apparatus, airborne cryogenic gas flow pluming tests
have been conducted, and the expected data as well as the data for the aerodynamic flight performance were obtained [18].
Nasuti et al. [3] suggested that the shroud base pressure governs the main mechanism of flow expansion and base wake
transition characteristics. In addition to this insight, previous studies [12,14-15] investigated the mechanism behind the spike
surface pressure generated by the external flow coupled with clustered cell jet flows, base characteristics of the cell and spike,
and skin friction characteristics in the presence of the external flow. The results showed that the thrust performance can be
significantly improved under off-design in-flight conditions in the presence of external flow with a certain aftbody
configuration, which appears as an integrated segment in the airframe. This insight is particularly important because the flight
This document is provided by JAXA.

5
performance was expected to decrease under transonic flight conditions [13,16] and off-design flight conditions [19] because
of locally decreased flow static pressure acting on the nozzle surface and flow instabilities [16]. Additionally, a large angle of
the boattail may lead to pressure reduction on its surface, and thus, generate drag. To account for these insights and concerns,
it is important to evaluate the performance of the aerospike nozzle in the presence of external flow and to evaluate the
effectiveness of the boattail configuration. To this end, it is vital to update the thrust performance prediction model for
application to in-flight conditions. Additionally, it is beneficial to demonstrate the supersonic cruise efficiency by evaluating
an airframe-integrated propulsion system equipped with an aerospike nozzle for a hypersonic air transportation system.
This study had two major goals: to evaluate the aerodynamic performance of a clustered linear aerospike nozzle operated
under off-design in-flight conditions, and to conduct a conceptual study evaluating the effectiveness of an advanced
airframe-integrated propulsion. While the thrust generated by the linear aerospike nozzle portion was considered as the outer
thrust, the primary inner thrust was evaluated for the cases of a rocket or an airbreathing propulsion system (e.g., a ramjet).
The performance evaluation for the baseline concept was based on the quasi-one-dimensional analytical models established
in previous studies [12,14,15], which predict thrust value for each thrust component. Here, an analytical model denotes a
physics-based model established without involving any empirical approximation. Although the quasi-one-dimensional
analysis would limit the applicability of its results because the flowfield would be highly two- or three-dimensional, the
analysis is useful for addressing the trend of performance for a new configuration. Additionally, it is worth noting that the
analytical model established in the previous studies [14,15] indicated that it can predict the spike surface pressure for
three-dimensional cases as well as two-dimensional cases with an uncertainty less than 5%. Since this study emphasizes the
conceptual analysis of the airframe-integrated aerospike propulsion system and evaluating its feasibility, the vehicle aftbody
was mainly considered. Additionally, based on the performance prediction models, advanced propulsion concepts that
involve the bypass ramjet concept were evaluated for their thrust performance. Since this study focused on the performance
evaluation, structural and weight impacts on the system feasibility was not discussed in this study.
II. Baseline Airframe and Nozzle Configurations and Flight Conditions
A. Airframe Configuration
Figure 1 illustrates an example configuration of the center cut of the vehicle body under supersonic flight condition with
installation of the aerospike nozzle. Although Figure 1 illustrates the baseline case in which a rocket propulsion system is
This document is provided by JAXA.

6
considered for its primary thruster [12,14,15], this study emphasizes a cruise vehicle with an aerospike nozzle. The airframe
has a leading edge, the angle of which will be varied, and the dimensions were determined by other design parameters as
discussed below. A boattail appears to the right upstream of the primary thruster exit. Because the boattail portion is inclined
at a certain angle relative to the center axis of the airframe, the Mach number of the boattail can be different from that of the
flight; it can be greater than that of the external flow because of flow expansion. Additional design parameters, which will be
described in a later section, were consistent with those in previous studies. For the advanced propulsion concept, the primary
thruster portion would be replaced with an airbreathing propulsion system. These details will be discussed in a later section,
along with an evaluation of the thrust performance. The overall airframe geometry and dimensions were referred from a
precursor study [20], and some modifications were considered in the aftbody portion to install the aerospike nozzle with a
rocket primary thruster. The overall airframe length was considered to be 40 m [20].
B. Linear Aerospike Nozzle Configuration (Airframe External Nozzle)
The aerospike nozzle portion comprises a nonclustered two-dimensional cell nozzle (designated as 2-D nozzle) or
clustered cell nozzles with a designed Mach number of 3.5 [12,14,15], followed by a straight planar section and a contoured
spike section. In the case that the cell nozzle is clustered, the cell base appears between two neighboring cell nozzle jets. The
straight section appears because the Mach number of the cell nozzle is 3.5 rather than unity, and therefore, the Mach wave
emanating from the cell nozzle lip impinges on the nozzle wall; behind the Mach wave impingement point (the end point of
the straight section), the contour was designed using the method of characteristics with given parameters, which will be
described below, to eliminate reflected expansion waves. In the case that the spike nozzle is truncated, the spike base appears.
This feature is shown on the right side of Figure 1 as an end-view of the back surface of the rectangular vehicle. The width of
the projected airframe back area was fixed at 6.0 m, and the height was determined according to the boattail angle and
resultant spike geometry: the total height was first assumed to be 3.0 m, but the actual height was determined according to the
given boattail angle and length, and resultant spike contour. The specific heat ratio (r) of the cell nozzle exhaust gas was
assumed to be 1.2, which is the approximate value of the specific heat ratio in the real engine exhaust gas flow, instead of the
value of 1.4 for air. Note that the analytical model has been validated for the specific heat ratio of 1.4 by comparing the spike
surface pressure to that obtained by the corresponding cold-flow experiment [12,14,15]. The analytical models used in this
study were assumed to be applicable in the case of a specific heat ratio of 1.2 as well.
This document is provided by JAXA.

7
Geometries of the cell and spike nozzles were designed by using the method of characteristics depending on the given
airframe geometries, cell nozzle exit Mach number (which determines the length of the straight section), specific heat ratio of
the cell nozzle exhaust gas, and angle and length of the boattail. The baseline contour geometry of the spike is presented in
Figure 2, which was calculated for the case of the inclination angle of the cell nozzle axis of 25, boattail length of 2.0 m, and
cell nozzle exit height of 0.48 m. The angle and dimension were chosen to match the experiment [15]. The boattail angle will
be discussed in detail below. The length of the straight section is 1.61 m, the total length of the spike is 7.31 m, and the height
is 1.69 m. The ideally expanded cell nozzle flow would have a Mach number of 4.7 at the end of the spike nozzle.
Figure 1 Illustration of baseline airframe configuration with boattail and aerospike nozzle.
Figure 2 Baseline geometry of spike nozzle.
C. Flight Conditions
Figure 3 shows the flight conditions simulated in this study. The flight conditions were determined by using the nozzle
pressure ratio (NPR), P0r/Pb, which was defined as the pressure ratio between the cell nozzle total pressure (P0r) and the
environmental pressure (Pb). The NPR identified the jet expansion condition and simulated the flight altitude condition: a
higher flight altitude condition corresponded to a larger NPR condition by assuming a constant combustion chamber pressure
(P0r) with varying environmental pressures (Pb). The designed NPR of the cell nozzle, which corresponded to its optimal
expansion condition, was 121.3. Note that the specific heat ratio () used for the cell nozzle exhaust gas was 1.2 as
aforementioned. The flow structure of the cell nozzle exhaust flow formed downstream of the cell nozzle exit changed
according to a given NPR condition. The relationship between the flow structure and NPR range is summarized in Table 1.
LE
External Flow
(M>1)
Leading Edge Oblique Shock
OSW
boattail
Flight Direction
(M>1)
External Flow
Expansion WavesExpansion Waves
Expansion Waves
Spike Nozzle
BoattailCell Nozzles
Cell Flows
0 1 2 3 4 5 6 7 80
0.5
1
1.5
2
x, m
y,
m
Straight Section
Full-Length
Cell Nozzle Flow
25%-Length
50%-Length
Spike Section
This document is provided by JAXA.

8
The nozzle flow separation condition was obtained by using the criterion suggested by Stark [21]. The expansion condition is
summarized in terms of the cell nozzle NPR. The optimal expansion condition for the spike nozzle, which had the exit Mach
number of 4.7 at the end of the spike nozzle, with the parameters described here is 1131.0. The simulated flight altitude for
the cruise conditions is up to 24 km above sea level. This altitude condition may likely involve off-design flight conditions.
The atmospheric pressure was calculated based on the U.S. Standard Atmosphere [22].
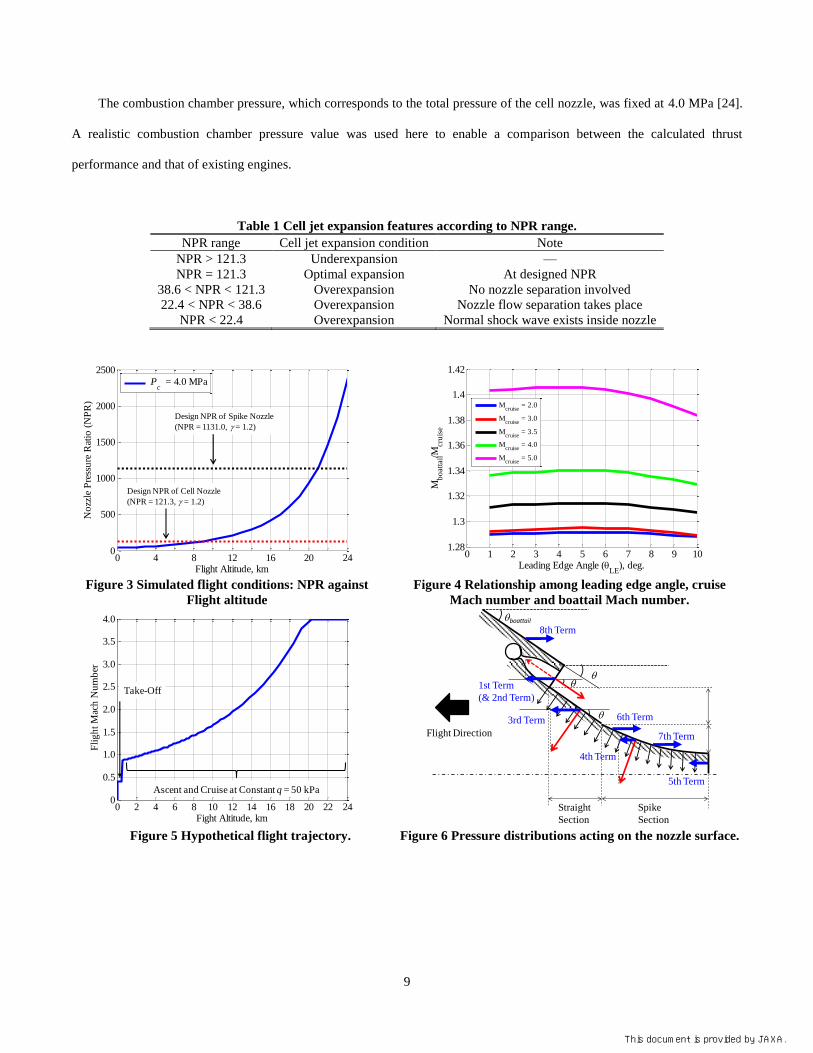
Figure 4 shows the relationship between the cruise Mach number, boattail Mach number, and leading edge angle. The
vertical axis is the ratio between the calculated boattail Mach number and cruise Mach number for each value of the leading
edge angle. The Mach number ratio (Mboattail/Mcruise) appears to be insensitive to the leading edge angle; for instance, its
variation for the calculated leading edge angles is less than 0.7% at the cruise Mach number of 2.0.
Since the maximum boattail angle that limits the separation of the external flow on the boattail is not accurately known
because of the viscous effects, the separation limit was determined by using the separation criterion [21] and the following
relationship:
separationcruise
separation
cruise
boattail
MP
P
P
P
3
(1)
where Pseparation and Mseparation are the wall pressure and Mach number, respectively, where the flow separation starts. The
calculated maximum boattail angle was approximately 15 up to the flight Mach number 4.7. This angle was also considered
as the baseline boattail angle.
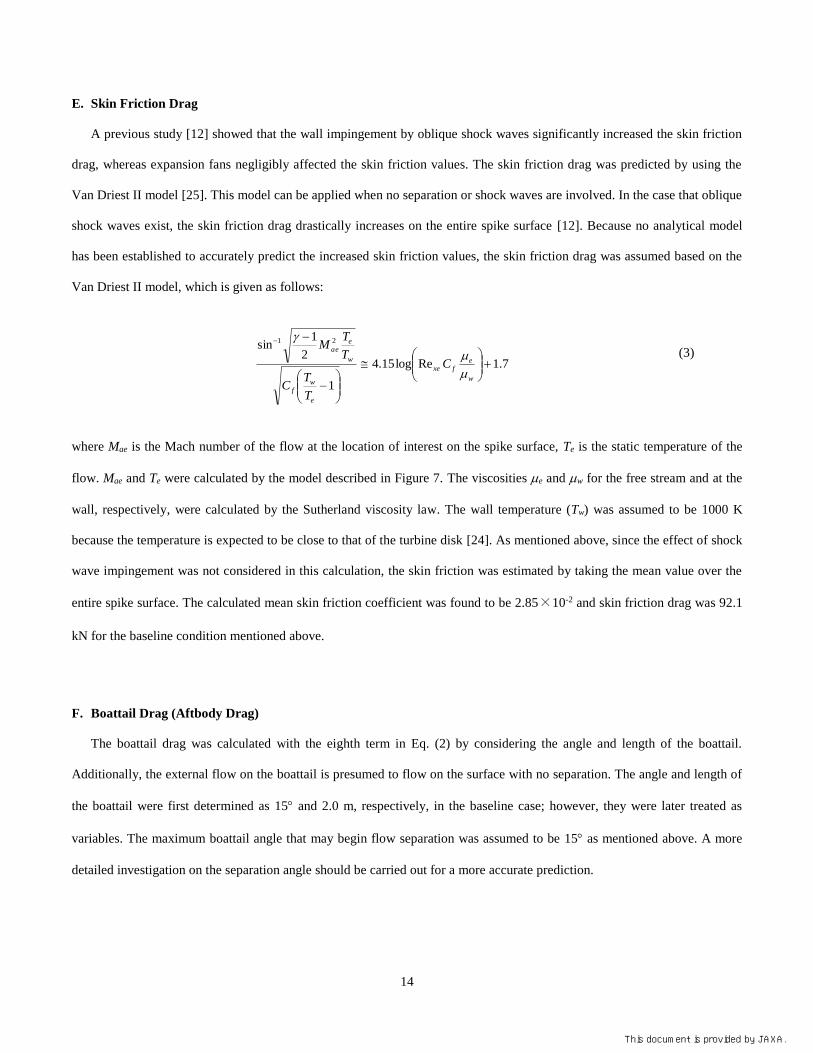
The assumed flight trajectory is presented in Figure 5. The flight profile considered here was a one-way flight path, which
was divided into three phases: take-off, ascent, and cruise. The assumed flight Mach number required for take-off was 0.4.
During the acceleration in the ascent to cruise phases, the flight Mach number was calculated by a fixed dynamic pressure (q)
condition at 50 kPa [23]. The flight Mach number was considered up to 4.0, and therefore, the Mach number ceiling occurs at
4.0. For the baseline analysis, only the cruise condition was evaluated in detail to match the experiment [15] with the altitude
of 13 km above sea level and flight Mach number of 2.0. The associated Reynolds number based on the airframe length is
2.6×10⁹ for the flight condition of Mach number 2.0 and the altitude of 13 km, where the ambient temperature and pressure
are 216.6 K and 15 kPa, respectively [22]. Calculating the Reynolds number for the other flight conditions indicates that the
flow around the airframe and on the spike surface is clearly in the turbulent regime, and therefore, the boundary layer
condition around the airframe was considered to be turbulent.
This document is provided by JAXA.
9
The combustion chamber pressure, which corresponds to the total pressure of the cell nozzle, was fixed at 4.0 MPa [24].
A realistic combustion chamber pressure value was used here to enable a comparison between the calculated thrust
performance and that of existing engines.
Table 1 Cell jet expansion features according to NPR range.
NPR range Cell jet expansion condition Note
NPR > 121.3 Underexpansion —
NPR = 121.3 Optimal expansion At designed NPR
38.6 < NPR < 121.3 Overexpansion No nozzle separation involved
22.4 < NPR < 38.6 Overexpansion Nozzle flow separation takes place
NPR < 22.4 Overexpansion Normal shock wave exists inside nozzle
Figure 3 Simulated flight conditions: NPR against
Flight altitude
Figure 4 Relationship among leading edge angle, cruise
Mach number and boattail Mach number.
Figure 5 Hypothetical flight trajectory. Figure 6 Pressure distributions acting on the nozzle surface.
0 4 8 12 16 20 240
500
1000
1500
2000
2500
Flight Altitude, km
No
zzle
Pre
ssu
re R
atio
(N
PR
)
Pc = 4.0 MPa
Design NPR of Cell Nozzle
(NPR = 121.3, = 1.2)
Design NPR of Spike Nozzle
(NPR = 1131.0, = 1.2)
0 1 2 3 4 5 6 7 8 9 101.28
1.3
1.32
1.34
1.36
1.38
1.4
1.42
Leading Edge Angle (LE
), deg.
Mb
oatt
ail/M
cru
ise
Mcruise
= 2.0
Mcruise
= 3.0
Mcruise
= 3.5
Mcruise
= 4.0
Mcruise
= 5.0
0 2 4 6 8 10 12 14 16 18 20 22 240
0.5
1.0
1.5
2.0
2.5
3.0
3.5
4.0
Fight Altitude, km
Fli
gh
t M
ach
Nu
mb
er
Take-Off
Ascent and Cruise at Constant q = 50 kPa
boattail
1st Term
(& 2nd Term)
5th Term
Straight
Section
Spike
Section
Flight Direction
6th Term
8th Term
7th Term
3rd Term
4th Term
This document is provided by JAXA.

10
III. Thrust Performance Prediction Model
A. Overall Thrust Performance Prediction Model Under In-Flight Conditions
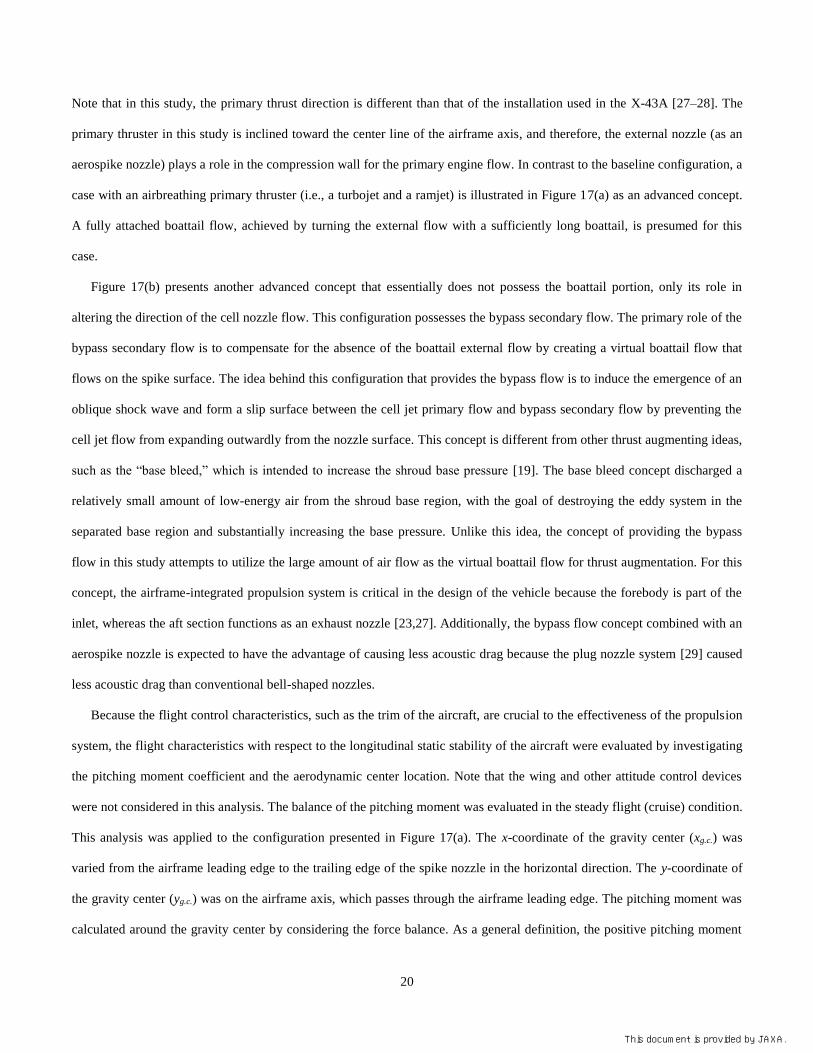
A rocket thruster is considered as the primary thruster for the baseline configuration. The overall performance prediction
model, based on quasi-one-dimensional analysis [15] in the case of a rocket primary thruster and boattail-equipped
configuration (the configuration illustrated in Figure 1) under in-flight conditions, is expressed as Eq. (2) by accounting for
the pressure distributions and their directions acting on the airframe and nozzle surfaces, as shown in Figure 6.
throatr
boattailboattailboattail
throatr
sbspikelocalboattailstraightboattailb
throatr
spikelocalboattailstraightboattailsf
throatr
sbsb
throatr
spikelocalboattailspike
throatr
straightboattailstraight
boattail
throatr
cbcb
boattail
r
r
r
r
r
r
r
b
r
r
r
r
r
r
r
r
AP
AP
AP
dAdAdAP
AP
dAdAD
AP
dAP
AP
dAP
AP
dAP
AP
dAP
P
P
P
P
P
P
P
P
P
PCF
r
r
rr
r
r
r
00
00
000
1
0
1
000
1
0
1
1
cos)sin(sin
)sin(sin
)sin(sincos
cos11
21
1
2
1
2
(2)
Here, the effects of change in environmental pressure (Pb) and total pressure (P0r) are considered. The left-hand side is the
coefficient of aerodynamic thrust performance. On the right-hand side, the first term corresponds to the thrust generated by
the cell nozzle. The second term is the drag generated by the cell base that appears when the clustered cell nozzle
configuration is deployed. The third and fourth terms are the thrusts generated from the straight and spike sections,
respectively. The fifth term is the thrust generated from the spike base pressure. This could also be a drag, depending on the
truncation configuration and flow condition. For the full-length spike model, the fifth term on the right-hand side is ignored.
The sixth term is the skin friction drag, the seventh term is the ambient pressure drag, and the eighth term is the boattail drag.
The local contour angle, local, was taken into account when integrating the spike surface pressure. The boattail angle, boattail,
was a variable parameter and other design parameters are summarized in Table 2. Prediction models for each thrust
component are described in more detail in the following sections. The leading edge angle and length should be determined by
accounting for a given design cruise Mach number and certain other design parameters for the inlet, but these are not
discussed in detail in this study.
This document is provided by JAXA.

11
Table 2 Summary of Design Parameters.
Fixed Parameters Value
Combustion chamber pressure (P0r) 4.0 MPa
Cell nozzle exit Mach number (Mr) 3.5
Aftbody height Determined by other parameters
Aftbody width 6.0 m
Spike length (truncation rate) 0–70%
Flight altitude 0–24 km
Number of cell nozzles 0 (2-D), 6 (One Side)
Aspect ratio of cell nozzle exit 1.0
Wall thickness 0.01 m
Boattail angle 10–15
Boattail length 2.0 m
B. Characteristics of Cell Nozzles
The cell nozzle characteristics were calculated from the first term in Eq. (2) based on the aerodynamic one-dimensional
analysis. The exit dimension of each cell nozzle that has a rectangular shape was determined by using the number of cell
nozzles, airframe base width (6.0 m), cell base width, aspect ratio of each cell nozzle (1.0), and wall thickness (0.01 m). The
cell base width is preset to 0 for the case of a 2-D cell nozzle. Note that the clustered cell nozzle configuration is more
realistic considering the benefits in operation as mentioned in the Introduction; however, the 2-D cell nozzle configuration
was also simulated for a comparison. Because the exit Mach number of each cell nozzle was presumed to be 3.5 to enable a
comparison between the simulated results and the experimental ones [14,15], the throat area was determined by the exit area
of the cell nozzle and the expansion ratio, which was determined by the area-Mach number relationship.
C. Spike Surface Pressure Distributions
The spike surface pressure distributions in the presence of the external flow were predicted by the analytical model and
procedure established in the previous study [15], as shown in Figure 7. As stated in Takahashi et al. [15], the external flow
governs the pressure determination mechanism on the spike surface according to the physics for the formation of a slip line
between the cell nozzle flow and the supersonic external flow, and the appearance of double oblique shock waves at the spike
entrance. Additionally, the model is applicable to not only the 2-D cell nozzle configuration but also to the clustered cell
nozzle configurations, regardless of the cell base width, with maximum error of approximately 5% [15]. More details about
the procedure for deriving the spike surface pressure distribution are provided in Takahashi et al. [15]. It should be noted that
a slight modification was introduced into the analytical model so that the model can be applicable for the case when the
This document is provided by JAXA.

12
boattail angle and cell nozzle inclination angle are different, because the spike surface plays a role in the compression wall
for the boattail flow. When the difference in pressure between P5 and P6 in Figure 7 exceeded the convergence limit (i.e.,
10% [15]), the averaged pressure between P5 and P6 was taken. This difference was mainly caused by the slight discrepancy
between the assumed flow turning angle for the external flow and the local contour angle. The difference between these two
pressures was considered the error value.
Figure 8 compares the calculated spike surface pressure distributions in the presence of external flow for various NPR
conditions. Normalized pressure, which is the surface pressure divided by the cell nozzle total pressure, is plotted against the
streamwise direction. The Mach number of the external flow was 2.0, as observed in the experiment. The boattail Mach
number was 2.6, as seen in Figure 4, and the resulting static pressure of the external flow was 5.2 kPa. The error was
determined from the difference between P5 and P6, as mentioned above. As the cell nozzle total pressure increases, the
overall spike surface pressure decreases. This is because the wall pressure changes depending on the cell nozzle expansion
feature. For example, under overexpansion condition (low cell nozzle total pressure), the overall wall pressure is high because
of the appearance of an oblique shock wave on the wall. In contrast, during the underexpansion condition (high cell nozzle
total pressure), the overall spike surface pressure decreases because of the Prandtl-Meyer expansion formation on the spike
surface. This same feature was observed in the experiment [15]; therefore, this model is expected to accurately predict the
pressure distribution.
Figure 7 Schematic of flowfield model with external flow
for an overexpanded jet.
Figure 8 Simulated spike surface pressure distributions
for various cell nozzle total pressure cases.
D. Cell Base and Spike Base Pressures
The characteristics of the cell base and spike base pressures were calculated by using the base pressure prediction models
established in previous studies [14–15]. Only a brief explanation and simulated results are presented in this section. Detailed
descriptions of the model and the procedure for deriving the base pressure are available in Takahashi et al. [14–15].
Slip Line
(Tail of Expansion Fan)Ma = 2.0
Pa
Pa2
Ma2
Oblique Shock Wave (OSW)
a2
a2
Mr=3.5
Pw
P3, P03, M3
P4, P04, M4
P5, P05, M5
4
5 (= 6)
OSW
1
2
3-3
3
ROSW x5① ②③ ④
⑤
⑥P2, P02, M2
x2
Jet Boundary
Control Surface
4
Cell
Nozzle Spike (Contoured Ramp)
Pa3 = P6
a3
4
0 0.1 0.2 0.3 0.4 0.5 0.6 0.7 0.8 0.9 1.00
0.01
0.02
0.03
0.04
0.05
Normalized distance from cell nozzle exit (x/xspike nozzle
)
P/P
0r
Overexpansion
(Cell Nozzle)
Optimal expansion
(Cell Nozzle)
Underexpansion
(Aerospike Nozzle)
NPR = 50
NPR = 121
NPR = 500 NPR = 1131
Optimal expansion
(Aerospike Nozzle)
Underexpansion
(Cell Nozzle)
This document is provided by JAXA.

13
The spike base pressure was predicted by using the model depicted in Figure 9. An overexpansion case is presented here.
For the underexpanded jet, the oblique shock waves in regions 1–3 and the compression waves in region 5 are replaced with
Mach waves. The premises for the model are that the spike base wake structure is in the closed-wake state and that the spike
base pressure is highly correlated with the pressure at the spike edge, as observed in the experiment [15]. Additionally, the lip
shock and recompression shock waves emerge behind the Prandtl-Meyer expansion fan formed to the center at the spike
edge.
Figure 10 presents simulated spike base pressure distributions for the case in which the total pressure of the cell nozzle is
4.0 MPa. The normalized pressure in terms of the normalized differential pressure (NDP), defined as (Psb − Pb)/P0r, is plotted
against the NPR. This normalization is useful when the pressure is compared to the ambient pressure level. In this calculation,
the ambient pressure was varied, and thus, the spike base pressure was simulated according to the change in NPR. The spike
length was truncated at 25% for this calculation. Under a condition of very low NPR, which involves an overexpanded cell
nozzle, the calculated base pressure can be a positive value. In the NPR range up to approximately 120, the base pressure
periodically drops and increases as the NPR increases. The hypothesis for this behavior is that the Prandtl-Meyer expansion
fan enters the spike surface as the cell nozzle is underexpanded. Above NPR of approximately 120, the base pressure drops
again, but then increases as NPR increases; eventually, the base pressure becomes higher than the ambient pressure. This is
because the Prandtl-Meyer expansion fan emanating from the cell nozzle lip enters the spike base wake region, and
consequently the base wake pressure is affected by the cell nozzle pressure condition. Thus, the base pressure basically acts
as a drag or neutral thrust, except under conditions of NPR less than approximately 120 and greater than 1000.
Regarding the cell base pressure distribution, the preceding model was applied with the same assumptions because the
model was established based on flow visualization results to more accurately represent flow physics.
Figure 9 Schematic of the flowfield model with external flow for
an overexpanded jet.
Figure 10 Simulated spike base pressure
distribution plotted against NPR.
Slip line
Ma = 2.0
Pa
Pa2
Ma2
Oblique Shock Wave (OSW)
a2
a2
Mr=3.5Pw
P4, P04, M4 P5, P05, M5
4
4
5 (= a2)OSW
1
23
ROSW x5① ②
③ ④⑤
⑧P2, P02, M2
x2
Jet Boundary
Control Surface
Cell
NozzleSpike
4
Dividing
Stream Line
Recompression
Shock
P-M fan
P6, P06, M6
Psb
P7, P07, M7
Lip
Shock⑥⑦
Center of
Separated Shear Layer
Pa3 = P6
a3
P3, P03, M3
3-3
⑨
0 500 1000 1500 2000 2500-0.01
-0.005
0
0.005
0.01
NPR
ND
P
Ambient Pressure Level
Optimal Expansion
(Aerospike Nozzle)
Underexpansion
(Aerospike Nozzle)
Overexpansion
(Aerospike Nozzle)
This document is provided by JAXA.
14
E. Skin Friction Drag
A previous study [12] showed that the wall impingement by oblique shock waves significantly increased the skin friction
drag, whereas expansion fans negligibly affected the skin friction values. The skin friction drag was predicted by using the
Van Driest II model [25]. This model can be applied when no separation or shock waves are involved. In the case that oblique
shock waves exist, the skin friction drag drastically increases on the entire spike surface [12]. Because no analytical model
has been established to accurately predict the increased skin friction values, the skin friction drag was assumed based on the
Van Driest II model, which is given as follows:
7.1Relog15.4
1
2
1sin 21
w
efxe
e
wf
w
eae
C
T
TC
T
TM
(3)
where Mae is the Mach number of the flow at the location of interest on the spike surface, Te is the static temperature of the
flow. Mae and Te were calculated by the model described in Figure 7. The viscosities e and w for the free stream and at the
wall, respectively, were calculated by the Sutherland viscosity law. The wall temperature (Tw) was assumed to be 1000 K
because the temperature is expected to be close to that of the turbine disk [24]. As mentioned above, since the effect of shock
wave impingement was not considered in this calculation, the skin friction was estimated by taking the mean value over the
entire spike surface. The calculated mean skin friction coefficient was found to be 2.85×10⁻² and skin friction drag was 92.1
kN for the baseline condition mentioned above.
F. Boattail Drag (Aftbody Drag)
The boattail drag was calculated with the eighth term in Eq. (2) by considering the angle and length of the boattail.
Additionally, the external flow on the boattail is presumed to flow on the surface with no separation. The angle and length of
the boattail were first determined as 15 and 2.0 m, respectively, in the baseline case; however, they were later treated as
variables. The maximum boattail angle that may begin flow separation was assumed to be 15 as mentioned above. A more
detailed investigation on the separation angle should be carried out for a more accurate prediction.
This document is provided by JAXA.

15
In addition to the boattail drag, this study did not account for the forebody drag that appears as the leading edge drag,
although the leading edge drag has to be considered for accurately predicting the net thrust of the propulsion system. Note
that methodologies to reduce the boattail drag can be found elsewhere [26].
IV. Results and Discussion for Baseline Configuration
The insights gained from the performance evaluation for the airframe-integrated aerospike propulsion system are
discussed in this section and cover the following topics of interest: pressure distributions on the airframe and nozzle wall
surfaces, thrust components, and thrust performance with various parameters. Since this section emphasizes the propulsion
system, the flight stability will be discussed in the next section.
A. Surface Pressure Distributions
Figure 11 presents pressure distributions of the airframe surface for (a) still-air condition and (b) in-flight condition at
Mach 2.0. For the baseline case, the 2-D cell nozzle was considered with a full-length or 50%-length spike, P0r = 4.0 MPa,
and boattail angle of 15. The baseline case was similar to that in the experiment [15]. Additionally, as aforementioned, only
the nonreacting flowfield was considered for evaluating the aerodynamic performance. The ambient pressure level for still-air
and in-flight conditions was fixed at 15 kPa, which corresponds to the conditions of flight altitude of approximately 13 km
above sea level or flight Mach number of approximately 2.0 at sea level condition. The still-air condition was calculated for
comparison.
For the still-air condition (Figure 11(a)), the surface pressure distribution was calculated by using the method of
characteristics with consideration of the shock wave reflections on the spike surface. Pressures for both the full-length and
50%-length spike cases are plotted. Additionally, the airframe geometry is superimposed. The NPR for this condition was
approximately 267; therefore, the exhaust plume from the cell nozzle (as an inner nozzle) is underexpanded; the aerospike
nozzle (as an outer nozzle) is overexpanded. The shock wave reflection on the spike surface, which was observed for cases of
both full- and 50%-length spikes, features the pressure distribution with periodic compression and expansion.
For the in-flight condition (Figure 11(b)), the spike surface pressure was calculated by using the analytical prediction
model [15]. As previously stated in Takahashi et al. [15] in the case of in-flight conditions, unlike still-air conditions, the
supersonic external flow causes the spike surface pressure to continue increasing as flow proceeds downstream.
This document is provided by JAXA.

16
(a) Still-air condition (without external flow) (b) In-flight condition (with external flow)
Figure 11 Surface pressure distributions for (a) still-air condition and (b) in-flight condition.
B. Thrust Components
Figure 12 shows thrust components in the case of a Mach 2.0 flight condition with the 50%-length spike configuration
and boattail angle of 15. The ambient pressure was fixed at 15 kPa, which corresponds to a supersonic cruise altitude of
approximately 13 km above sea level. The case of a still-air condition is also plotted for comparison. The cell nozzle total
pressure was 4.0 MPa. Each thrust component is numbered; the number corresponds to each term in Eq. (2). The cell nozzle
thrust clearly makes the largest contribution to the total thrust for both still-air and in-flight conditions. The thrust generated
by the spike surface pressure makes the second largest contribution to total thrust. Whereas the drags generated by the
ambient pressure and the boattail portion of the airframe are comparable, the ambient pressure drag has the largest negative
impact on the total thrust. The skin friction drag cannot be neglected as well. With this flight condition and configuration (i.e.,
spike length), there is no remarkable difference in thrust between the still-air and in-flight conditions.
Figure 13 shows the thrust components for the full-length spike case. Each value is plotted as in Figure 12. A remarkable
difference in thrust between the still-air and in-flight conditions is clear for the spike surface pressure. Although the spike
surface pressure under the in-flight condition was expected to dramatically decrease because of the existence of the external
flow [13,16], the spike surface pressure remained comparable to that for the still air. As mentioned before, it is desirable to
maintain spike surface pressure higher than the ambient pressure to generate thrust. The mechanism that maintained the spike
surface pressure high was the formation of the oblique shock wave and slip line between the cell nozzle flows and external
flow as described in previous sections. By comparing the thrust with that presented in Figure 12 and considering the trade-off
between the spike length and the associated skin friction drag, the following statement can be made: the longer the spike, the
-4 -3 -2 -1 0 1 2 3 4 5 6 7 80
10
20
30
40
50
X (from cell nozzle exit), m
Sp
ike
Su
rfac
e P
ress
ure
, k
Pa
Surface Pressure for Full-Length Spike
Surface Pressure for 50%-Length Spike
Ambient Pressure Level
Airframe
Geometry
Cell Flows
-4 -3 -2 -1 0 1 2 3 4 5 6 7 80
10
20
30
40
50
X (from cell nozzle exit), m
Sp
ike
Su
rfac
e P
ress
ure
, k
Pa
Surface Pressure for Full-Length Spike
Surface Pressure for 50%-Length Spike
External Flow
Cell Flows
Ambient Pressure Level
Airframe
Geometry
This document is provided by JAXA.

17
higher the thrust performance under in-flight conditions. Therefore, a longer spike length is preferable to maximize the spike
surface pressure distributions, and thus, increase the thrust performance for in-flight conditions. It should, however, be noted
that the skin friction drag may increase in the flowfield where strong impingement of shock waves is involved.
Figure 12 Thrust components for still-air and in-flight
conditions in the case of 50%-length spike.
Figure 13 Thrust components for still-air and in-flight
conditions in the case of full-length spike.
C. Effects of Flight Conditions
Figure 14 shows the thrust performance calculated for various flight Mach numbers for cases with 50% and full-length
spikes, 2-D cell nozzle, and boattail angle of 15. The ambient pressure was fixed at 15 kPa, which corresponds to a
supersonic cruise altitude of approximately 13 km above sea level. The thrust performance calculated for only the cell nozzle
is additionally plotted for comparison.
The total thrust performance for the 50%-length spike could be lower than that of the cell nozzle for the Mach number
above approximately 2.2. Additionally, the total thrust performance for the 50%-length spike shows that the performance
decreases as flight Mach number increases, but the value asymptotically converges at approximately 1.5 at higher Mach
numbers. In contrast, the total thrust performance for the full-length spike shows a similar trend to that of the 50%-length
spike case, but much higher values over the calculated Mach number range. The thrust performance asymptotically converges
at approximately 1.85 in the higher Mach number range. Thus, a longer spike length configuration significantly benefits total
thrust, regardless of the flight Mach number.
0 1 2 3 4 5 6 7 8 9-1
-0.5
0
0.5
1
1.5
2
2.5
3
Thrust Component
Th
rust
Co
effi
cien
t
Still-air
In-flight
1 (Cell Nozzle)
3 (Spike Surface)
4 (Spike Base)
5 (Skin Friction)
6 (Ambient Pressure)
7 (Boattail Drag)
8 (Total Thrust)
2 (Cell Base)
0 1 2 3 4 5 6 7 8 9-1
-0.5
0
0.5
1
1.5
2
2.5
3
Thrust ComponentT
hru
st C
oef
fici
ent
Still-air
In-flight
1 (Cell Nozzle)
3 (Spike Surface)
4 (Spike Base)
7 (Boattail Drag)
8 (Total Thrust)
6 (Ambient Pressure)
5 (Skin Friction)
2 (Cell Base)
This document is provided by JAXA.

18
D. Effects of Boattail Angles
Figure 15 shows the thrust performance calculated for various boattail angles for cases with 50% and full-length spikes,
2-D cell nozzle, and various boattail angles ranging from 10 to 20. Note that the maximum boattail angle was stated in the
previous section to be 15, but the angles for additional 5 were also calculated for comparison. The cell nozzle total pressure,
flight Mach number, and ambient pressure were fixed at 4.0 MPa, 2.0, and 15 kPa, respectively. The thrust generated by the
cell nozzle itself is additionally plotted for comparison. The cell nozzle thrust remained constant as the inclination angle of
the cell nozzle was kept constant at 25. In contrast, for the both cases with the 50%-length and full-length spikes, the total
thrust slightly decreased as the boattail angle increased because of the increasing boattail drag. Similar to the observation in
Figure 14, the longer spike configuration tends to have higher thrust performance. The results indicated that the boattail angle
is less sensitive to the total thrust for this configuration and conditions.
Figure 14 Thrust performances calculated for various
flight Mach numbers at 50%- and full-length spikes.
Figure 15 Thrust performances calculated for various
boattail angles at 50%- and full-length spikes.
E. Effects of Spike Truncation Length
Figure 16 presents the effect of the spike length on the total thrust performance. This figure plots the thrust performance
calculated for flight Mach numbers of 1.5, 1.75, 2.0, 2.25, 2.5, 3.0, and 4.0, and for the boattail angle of 15 for various spike
lengths. Similar to the calculations given for Figures 14 and 15, the cell nozzle total pressure and ambient pressure were fixed
at 4.0 MPa and 15 kPa, respectively.
In general, the total thrust linearly increases with the spike length increasing toward the full length for all flight Mach
number cases. A notable point is that the total thrust performance could be lower than that of the cell nozzle thrust for all
flight Mach numbers with a spike length shorter than the length at a certain truncation ratio of approximately 35% to 58%
1.5 2 2.5 3 3.5 41.4
1.5
1.6
1.7
1.8
1.9
2
2.1
2.2
Flight Mach Number
Th
rust
Co
effi
cien
t
Total (Full-Length)
Total (50%-Length)
Cell Nozzle
10 12 14 16 18 201.4
1.5
1.6
1.7
1.8
1.9
2
2.1
2.2
Boattail Angle, deg.
Th
rust
Co
effi
cien
t
Total (Full-Length)
Total (50%-Length)
Cell Nozzle
This document is provided by JAXA.

19
depending on the flight Mach number. The total thrust performances for the flight Mach numbers above approximately 2.0
become almost identical, and the thrust value with the spike length longer than 60% becomes higher than that of the cell
nozzle.
In summary, it appears that a spike longer than 60% is beneficial for all flight Mach number range considered in this
study. From the observation obtained in this section, it can be concluded that an optimization study of airframe geometry is
possible for a given mission.
Figure 16 Thrust performances calculated for various
spike truncation lengths.
V. Advanced Airframe-Integrated Propulsion Concepts
Based on the performance prediction models discussed above, advanced concepts of airframe-integrated propulsion
systems are evaluated with respect to the thrust performance. The aerospike nozzle configuration in which a boattail is
equipped to the right upstream of the primary cell thruster is considered. The mechanism behind the increase in thrust is, as
aforementioned, attributed to the increase in the surface pressure of the spike under supersonic flight conditions [14–15].
However, a boattail-equipped airframe configuration with a sufficiently long boattail, which allows the external flow to flow
on the boattail surface without separation and to be inclined toward the center axis of the airframe, may not always be
allowed due to geometrical constraints of the airframe. Therefore, certain thrust augmentation (e.g., secondary flow) would
be desirable to increase the spike surface pressure, and thus, increase the thrust. A feasibility study is conducted for advanced
airframe-integrated propulsion systems, along with an evaluation of the thrust performance in a hypothetical flight trajectory.
A baseline concept, which equips the boattail configuration with a rocket primary cell thruster (presented in Figure 1), has
been discussed in the previous sections. For the advanced concept, the aerospike nozzle portion appears as the external nozzle.
0.3 0.4 0.5 0.6 0.7 0.8 0.9 11
1.2
1.4
1.6
1.8
2
2.2
2.4
Spike Truncation (Truncated Length / Full Length)
Th
rust
Co
effi
cien
t
M=1.5
M=1.75
M=2.0
M=2.25
M=2.5
M=3.0
M=4.0
Cell Nozzle
This document is provided by JAXA.
20
Note that in this study, the primary thrust direction is different than that of the installation used in the X-43A [27–28]. The
primary thruster in this study is inclined toward the center line of the airframe axis, and therefore, the external nozzle (as an
aerospike nozzle) plays a role in the compression wall for the primary engine flow. In contrast to the baseline configuration, a
case with an airbreathing primary thruster (i.e., a turbojet and a ramjet) is illustrated in Figure 17(a) as an advanced concept.
A fully attached boattail flow, achieved by turning the external flow with a sufficiently long boattail, is presumed for this
case.
Figure 17(b) presents another advanced concept that essentially does not possess the boattail portion, only its role in
altering the direction of the cell nozzle flow. This configuration possesses the bypass secondary flow. The primary role of the
bypass secondary flow is to compensate for the absence of the boattail external flow by creating a virtual boattail flow that
flows on the spike surface. The idea behind this configuration that provides the bypass flow is to induce the emergence of an
oblique shock wave and form a slip surface between the cell jet primary flow and bypass secondary flow by preventing the
cell jet flow from expanding outwardly from the nozzle surface. This concept is different from other thrust augmenting ideas,
such as the “base bleed,” which is intended to increase the shroud base pressure [19]. The base bleed concept discharged a
relatively small amount of low-energy air from the shroud base region, with the goal of destroying the eddy system in the
separated base region and substantially increasing the base pressure. Unlike this idea, the concept of providing the bypass
flow in this study attempts to utilize the large amount of air flow as the virtual boattail flow for thrust augmentation. For this
concept, the airframe-integrated propulsion system is critical in the design of the vehicle because the forebody is part of the
inlet, whereas the aft section functions as an exhaust nozzle [23,27]. Additionally, the bypass flow concept combined with an
aerospike nozzle is expected to have the advantage of causing less acoustic drag because the plug nozzle system [29] caused
less acoustic drag than conventional bell-shaped nozzles.
Because the flight control characteristics, such as the trim of the aircraft, are crucial to the effectiveness of the propulsion
system, the flight characteristics with respect to the longitudinal static stability of the aircraft were evaluated by investigating
the pitching moment coefficient and the aerodynamic center location. Note that the wing and other attitude control devices
were not considered in this analysis. The balance of the pitching moment was evaluated in the steady flight (cruise) condition.
This analysis was applied to the configuration presented in Figure 17(a). The x-coordinate of the gravity center (xg.c.) was
varied from the airframe leading edge to the trailing edge of the spike nozzle in the horizontal direction. The y-coordinate of
the gravity center (yg.c.) was on the airframe axis, which passes through the airframe leading edge. The pitching moment was
calculated around the gravity center by considering the force balance. As a general definition, the positive pitching moment
This document is provided by JAXA.

21
corresponded to the force acting on the airframe in the nose-up direction, and the negative pitching moment was assumed for
the force in the nose-down direction. The force for calculating the positive pitching moment was the pressure force acting on
the leading edge surface, and the force for the negative pitching moment was the sum of the pressure force acting on the spike
nozzle surface and the cell nozzle thrust. The pressure forces for the forebody were calculated as the average value acting on
the entire surface of the leading edge (e.g., LE = 5 and LLE = 10 m). The distance for calculating the moment was taken as
the length between the gravity center and the midpoint of the area where the force was considered. The cruise condition for
this analysis was 13 km above sea level, where the atmospheric pressure is approximately 15 kPa. The point where the force
balance becomes zero means the force equilibrium, namely the aerodynamic center. For this example case for the baseline
configuration (Figure 17(a)) with the aforementioned leading edge configuration, the aerodynamic center was found at 10.9
m from the airframe leading edge, which was located at approximately 9 m upstream of the middle point of the airframe. The
locations of the aerodynamic center for other cruise Mach numbers are plotted in Figure 18 along with the calculated case for
LE = 5 and LLE = 15 m. The aerodynamic center was located several meters upstream of the middle point of the airframe for
all calculated Mach numbers. Therefore, this proposed configuration is considered to be feasible. A more detailed study on
the flight control characteristics will be given in the future work.
(a) Airbreathing thruster with boattail configuration
(b) Advanced (with bypass flow) configuration
Figure 17 Schematic of airframe/propulsion integrated system for (a) baseline and (b) advanced configurations.
LE
External Flow
(M>1)
Leading Edge Oblique Shock
Combustor
LLE Linlet Lcombustor Lbt Lnozzle
OSW
boattail
Flight Direction
(M>1)
External Flow External Flow
Expansion Waves
Expansion Waves
Expansion WavesOSW
Spike Nozzle
00 , Pmcorecore Pm ,
rrrrr MVTPm ,,,,
Primary Flow Cell Flows
Cell Nozzle
LE
External Flow
(M>1)
Leading Edge Oblique Shock
Combustor
LLE Lbt Lnozzle
OSW
Flight Direction
(M>1)
External Flow
Expansion Waves
Expansion Waves
Expansion WavesOSW
Spike Nozzle
00 , Pmcorecore Pm ,
rrrrr MVTPm ,,,,
Primary Flow Cell Flows
Cell Nozzle
Bypass Flow
22222 ,,,, rrrrr MVTPmbypassbypass Pm ,
Bypass Flow
(Inlet-Spillage Flow)
Linlet Lcombustor
This document is provided by JAXA.

22
Figure 18 Location of aerodynamic center plotted against cruise Mach
number (at altitude of 13 km).
The overall thrust performance prediction model for the configuration presented in Figure 17(a) is given by the
summation of the cell nozzle thrust (Fcell) and the thrust generated by the spike nozzle (Fspike nozzle), and expressed by Eqs. (4)
to (6). Here, the leading edge drag was omitted to focus on the analysis of the thrust generated by the cell and spike nozzles.
Additionally, the term for calculating the base pressures was omitted because the cell and spike nozzle configurations
considered here are the 2-D nozzle and full-length spike, respectively.
nozzlespikecelltotal FFF (4)
000 cos)( VmAPPVmF boattailrrrrcell (5)
spikelocalboattailstraightboattailsf
sbspikelocalboattailstraightboattailbboattailboattailboattail
spikelocalboattailspikestraightboattailstraightnozzlespike
dAdAD
dAdAdAPAP
dAPdAPF
)sin(sin
)sin(sincos
)sin(sin
(6)
In Eq. (4), the first term in the right-hand side is the thrust by the primary cell thruster and the second term is the thrust
generated by the spike nozzle portion, as mentioned above, and each portion is expressed in detail by Eqs. (5) and (6),
respectively. In Eq. (5), in the case that a rocket primary thruster is employed, Eq. (5) becomes identical to that of the first
term in Eq. (2) by eliminating the ram drag, which appeared as the second term in Eq. (5). When employing the airbreathing
primary thruster (i.e., a turbojet and a ramjet), the ram drag term remains. The flow deceleration attributable to the leading
edge shock was considered as well.
2 2.5 3 3.5 49
9.5
10
10.5
11
11.5
12
Flight Mach Number
Aer
od
yn
amic
Cen
ter
(fro
m L
E),
m
L
LE = 10 m
LLE
= 15 m
This document is provided by JAXA.

23
In the case of the advanced airbreathing concept (shown in Figure 17(b)), a turbojet propulsion is considered up to the
flight Mach number range of 3.0; for above this Mach number range, the bypass ramjet propulsion concept is considered.
Figure 17 simply illustrates the airframe-integrated propulsion configurations with an emphasis on the difference between the
baseline and advanced configurations. Therefore, the mechanical device for switching the propulsion system from turbojet to
ramjet, such that shown in a turbine based combined/combination cycle (TBCC) engine, which is usually used to propel a
hypersonic airbreathing cruise vehicle [30–32] configuration proposed by Bulman et al. [32], is not considered in detail in
this study. As mentioned above, the cell nozzle exit geometry is fixed so that the Mach number at the cell nozzle exit is fixed
at 3.5, and the vehicle can be accelerated up to Mach 4.7 for this aerospike nozzle configuration.
The thrust performance prediction model for the cell nozzle and bypass flow for the advanced configuration with a bypass
airbreathing primary thruster is given as Eq. (7) by replacing the boattail drag, which appeared as the third term in Eq. (6),
with the bypass thrust. In this analysis, the bypass flow is calculated similarly to the general turbofan propulsion. It should be
noted that this quasi-one-dimensional analysis simply evaluates the feasibility of the proposed system, which uses the bypass
flow to eliminate the boattail drag, because the flowfield is more complex. Therefore, a two- or three-dimensional
computational analysis is needed for a more accurate prediction.
20202 coscos rrboattailrrbypassrcoreboattailrrbypasscell APPAPPVbprVbprVVmFF (7)
Here, the bypass ratio (bpr) is expressed by assuming that the flow rate of fuel is significantly smaller than that of the air
flows:
r
r
core
bypass
m
m
m
mbpr
2 (8)
The thrust equation for the primary cell thruster and bypass flow is rewritten as follows. In the higher supersonic range, a
turbojet engine is hypothetically replaced with a ramjet engine because of the drag. The specific heat ratios of the core and
bypass flows at the inlet were assumed to be 1.4 because the core and bypass flows are basically ambient air with a value of
1.4. The specific heat ratio for the cell nozzle exhaust gas was presumed to be 1.2. The atmospheric air temperature (T0) was
referred from the U.S. Standard Atmosphere [22] according to the flight altitude. The temperatures for the core flow (Tcore)
and bypass flow (Tbypass) at the engine inlet were assumed to be the same as the atmospheric air. The bypass flow Mach
number at its exit was assumed to be unity (Mr2 = 1.0); it was assumed that the supersonic external flow incoming to the
This document is provided by JAXA.

24
bypass flow duct was decelerated, and consequently the flow Mach number at its exit becomes unity. Assuming that Tcore =
Tbypass and they can be calculated through the isentropic relation with T0 and Mflight, and that Mcore = Mbypass, yields the
following relationship:
2020
2
1
2
0
0
)(cos)(
2
111
1
2cos
rrboattailrr
flightflightboattailrrrrrrr
rr
r
bypasscell
APPAPP
MRTMbprRT
bprTRMAMPTR
F
(9)
The temperature at the combustor exit was assumed to be 1500 K [24], and that at the cell nozzle exit was calculated by
assuming isentropic flow process. The gas constant of the cell nozzle flow was assumed to be 400 J/(kgK), which is similar
to the value for hydrogen combustion with air at 4.0 MPa. The thrust generated by the spike nozzle portion is expressed by
Eq. (6), but the boattail drag which is expressed as the third term in Eq. (6) is eliminated by the existence of the bypass flow.
The duct areas for the core flow (Ar) and the bypass flow (Ar2) were considered to have the same value of 1.0, and the area at
the inlet was assumed to be the same as that of the cell nozzle exit. It should be noted that these areas should be optimized for
a more accurate performance prediction.
Figure 19 compares the total thrust generated by the primary cell thruster that comprises a rocket or an airbreathing
propulsion system (configuration of Figure 17(a)) with the aerospike nozzle portion. The thrust generated by only employing
the airbreathing primary thruster is also plotted for comparison. The calculated thrust coefficient is plotted against the flight
altitude. The hypothetical flight trajectory was considered as presented in Figure 4. During the cruise phase, the flight Mach
number was calculated from the constant dynamic pressure (at 50 kPa) condition. It was assumed that there was no reverse
flow due to imbalance between the cell nozzle and bypass flows [23]. The thrust for both configurations generally increases
along with the flight altitude, and largely depends on the flight Mach number given for the specific mission phases, as clearly
seen as a stepwise change in the lower altitude range. During the cruise phase, which appears for the altitude range over
approximately 3.0 km, the thrust gradually decreases as the flight altitude increases. However, the thrust performance in the
low altitude range is high. This is mainly caused by the altitude-compensating feature of the aerospike nozzle. At the altitude
of approximately 8.5 km, the thrust drops. This is attributable to the fact that the spike nozzle expansion attains its optimal
expansion condition at this altitude, and therefore, the spike surface pressure decreased above this altitude, as observed in
Figure 8. Then, the thrust keeps decreasing as the altitude increases until approximately 11.1 km, after which the thrust starts
to increase for the higher altitude range. This is because of the change in atmospheric temperature; the temperature becomes
constant above this altitude as the transition of the atmospheric layer between the troposphere and the stratosphere occurs at
This document is provided by JAXA.
25
this altitude. Throughout the mission phases from take-off to cruise, the primary thruster configuration of the rocket, which
was considered the ideal case, appears to have higher thrust performance than the airbreathing configuration. This is
primarily attributed to the ram drag that appeared as the second term in Eq. (5). It is remarkable that the configuration with
the aerospike nozzle provides a higher thrust throughout the flight trajectory compared to the case of employing only the
airbreathing primary thruster without the aerospike nozzle. Therefore, the proposed configuration, which employs the
airbreathing primary thruster with the aerospike nozzle, is beneficial.
Figure 20 presents the total thrust calculated for the baseline and advanced configurations (Figure 17(b)), respectively.
The thrust coefficient generally shows a similar trend as observed in Figure 19; the thrust in the cruise phase decreases until
reaching the altitude of approximately 11.1 km, then the thrust starts to increase. In the take-off to ascent phases up to the
altitude of approximately 6 km, the thrust is higher when utilizing the advanced concept with the accompanying bypass flow
than for a pure jet or rocket primary thruster case. However, it is notable that the thrust at the altitude above 11.1 km for the
advanced concept with the bypass ratio less than 1.0 shows an increasing trend, while the advanced concepts with the bypass
ratio higher than 1.0 show a decreasing trend. With the bypass ratios less than 1.0, the thrust is higher than that of the pure
airbreathing case (bpr = 0) up to the altitude of approximately 14 km. In this regard, the advanced configuration with some
bypass flow shows a notable increase in the altitude of up to 14 km. With respect to the bypass ratio, a higher thrust
performance is expected with the bypass ratio of less than 1.0. This suggests that there would be an optimized point between
the bypass ratio and cruise efficiency for a given mission. It should be noted that more realistic configurations for the
airbreathing primary thruster cases should be explored by accounting for the inlet design [30,33] simultaneously for
optimizing the advanced propulsion system. Additionally, structural installations [1] and weight impacts resulting from flow
path modifications should be taken into account.
In summary, by considering the fact that the external flow can aid thrust in off-design flight conditions, as observed in the
previous studies [14–15], an advanced propulsion system comprising an airbreathing propulsion system with a bypass flow
using a small bypass ratio for the primary cell propulsion system and spike nozzle configuration is beneficial. Additionally,
the increase in thrust for the advanced concept can be concluded to add the substantial effect of eliminating the boattail drag.
Therefore, the bypass ramjet propulsion system with a linear aerospike nozzle configuration is favorable for the high-speed
air transportation system. This conclusion was emphasized by the thrust performance. More specifically, the specific impulse
should be considered by accounting for the mission profile and fuel consumption rates. Additionally, airframe structure and
weight impacts should also be evaluated.
This document is provided by JAXA.

26
Certain concerns, such as the required mass flow rate for operating the ramjet propulsion system, inlet design, and drag,
should be taken into account; these and other concerns are thoroughly addressed by Bulman et al. [32] for this kind of
airframe-integrated propulsion system.
Figure 19 Comparison of total thrust between employing
rocket or airbreathing primary thruster along with the
aerospike nozzle.
Figure 20 Comparison of total thrust coefficients.
VI. Summary
Clustered linear aerospike nozzles integrated into an airframe and operated under off-design in-flight conditions were
evaluated for their thrust performance. The performance evaluation was implemented using the physics-based prediction
models established in previous studies. The aerodynamic performance of the nozzle configuration was predicted. Because
this study focused on the propulsion system and the airframe portion where the aerospike nozzle was integrated, the aftbody
configuration was mainly evaluated in terms of the benefit of the proposed system in increasing thrust performance. The
following conclusions were drawn from the performance evaluation of the airframe-integrated linear aerospike nozzle model.
1) The boattail-equipped configuration is highly beneficial for increasing thrust because it allows the influence of the
external flow to increase the spike surface pressure. Additionally, the boattail angle was found to be the least
sensitive to the total thrust.
2) The spike length longer than 60% of its full length is beneficial across the complete flight Mach number range
considered in this study. Additionally, the spike length was found to be the most important parameter to increase
the total thrust.
The following conclusions were drawn from the advanced concept:
0 2 4 6 8 10 12 14 16 18 20 22 240
0.5
1.0
1.5
2.0
2.5
3.0
3.5
4.0
Flight Altitude, km
(To
tal)
Th
rust
Co
effi
cien
t
Rocket primary thruster + aerospike nozzle
Airbreathing primary thruster (bpr = 0)
+ aerospike nozzle
Airbreathing primary thruster (bpr = 0) only
0 2 4 6 8 10 12 14 16 18 20 22 240
0.5
1.0
1.5
2.0
2.5
3.0
3.5
4.0
Flight Altitude, km(T
ota
l) T
hru
st C
oef
fici
ent
Rocketbpr = 1.0
bpr = 2.0
bpr = 3.0
bpr = 4.0
bpr = 5.0
bpr = 0
(pure jet)
bpr = 0.5
This document is provided by JAXA.

27
1) The airbreathing propulsion system of the primary thruster followed by the linear aerospike nozzle configuration
showed that the employment of the aerospike nozzle portion significantly increases the total thrust over the wide
flight range from take-off to supersonic cruise phases. The bypass ramjet propulsion system with bypass ratios less
than 1.0 showed benefits for increasing the thrust by compensating for the boattail drag. This notable benefit is
clear in low altitude conditions.
In future work, other possible drag components, such as inlet-bypass-bleed drag and inlet-spillage drag, have to be taken
into account for more accurate evaluation. Additionally, the reacting exhaust gas should be considered. Further, a more
realistic conceptual study, in terms of vehicle operation with trajectory optimization and specific impulse, bypass flow
configuration, noise concerns (i.e., jet noise and sonic booms), nozzle acoustics, and weight impacts by altering the flow path
to the cruise efficiency has to be conducted.
Acknowledgments
The authors wish to thank Dr. Shigeru Sato and staff members at computational group of the Japan Aerospace
Exploration Agency Kakuda Space Center for providing computational environment.
References
1Korte, J. J., Salas, A. O., Dunn, H. J., Alexandrov, N. M., Follett, W. W., Orient, G. E., and Hadid, A. H., “Multidisciplinary
Approach to Linear Aerospike Nozzle Design,” Journal of Propulsion and Power, Vol. 17, No. 1, Jan. 2001, pp. 93-98.
2Hagemann, G., Immich H., Nguyen, T. V., and Dumnov, G. E., “Advanced Rocket Nozzles,” Journal of Propulsion and Power, Vol.
14, No. 5, Sep. 1998, pp. 620-634.
3Nasuti, F., and Onofri, M., “Analysis of In-Flight Behavior of Truncated Plug Nozzles,” Journal of Propulsion and Power, Vol. 17,
No. 4, Jul. 2001, pp. 809-817.
4Shannon, D. E., Matthew, D. W., Stephan, A. W., and Zachary, W. P., “Side-Force Amplification on an Aerodynamically
Thrust-Vectored Aerospike Nozzle,” Journal of Propulsion and Power, Vol. 28, No. 4, Jul. 2012, pp. 811-819.
5Frendi, A., Nesman, T. E., and Wang, T.-S., “Computational and Experimental Study of Linear Aerospike Engine Noise,” AIAA
Journal, Vol. 39, No. 8, Aug. 2001, pp. 1485-1492.
6 Verma, S. B., “Performance Characteristics of an Annular Conical Aerospike Nozzle with Freestream Effect,” Journal of Propulsion
and Power, Vol. 25, No. 3, May 2009, pp. 783-791.
This document is provided by JAXA.

28
7Tomita, T., Takahashi, M., Onodera, T., and Tamura, H., “A Simple Performance Prediction Model of Clustered Linear Aerospike
Nozzles,” AIAA Paper 2001-3560, 2001.
8Fick, M. and Schmucker, R. H., “Performance Aspects of Plug Cluster Nozzles,” Journal of Spacecraft and Rockets, Vol. 33, No. 4,
Jul. 1996, pp. 507-512.
9Wang, T. S., “Analysis of Linear Aerospike Plume-Induced X-33 Base-Heating Environment,” Journal of Spacecraft and Rockets,
Vol. 36, No. 6, 1999, pp. 777-783.
10Nasuti, F., and Onofri, M., “Methodology to Solve Flowfields of Plug Nozzles for Future Launchers,” Journal of Propulsion and
Power, Vol. 14, No. 3, May 1998, pp. 318-326.
11Ito, T., Fujii, K., and Hayashi, A. K., “Computations of Axisymmetric Plug-Nozzle Flowfields: Flow Structures and Thrust
Performance,” Journal of Propulsion and Power, Vol. 18, No. 2, Mar. 2002, pp. 254-260.
12Takahashi, H., Tomioka, S., Sakuranaka, N., Tomita, T., Kuwamori, K., and Masuya, G., “Effects of Plume Impingements of
Clustered Nozzles on the Surface Skin Friction,” Journal of Propulsion and Power, Vol. 31, No. 2, Mar. 2015, pp. 485-495.
13Ruf, J., and McConaughey, P. K., “The Plume Physics Behind Aerospike Nozzle Altitude Compensation and Slipstream Effect,”
AIAA Paper 1997-3218, 1997.
14Takahashi, H., Tomioka, S., Sakuranaka, N., Tomita, T., Kuwamori, K., and Masuya, G., “Influence of External Flow on Plume
Physics of Clustered Linear Aerospike Nozzles,” Journal of Propulsion and Power, Vol. 30, No. 5, Sep. 2014, pp. 1199-1212.
15Takahashi, H., Tomioka, S., Tomita, T., and Sakuranaka, N., “Aerodynamic Characterization of Linear Aerospike Nozzles in
Off-Design Flight Conditions,” Journal of Propulsion and Power, 2014, Vol. 31, No. 1, Jan. 2015, pp. 204-218.
16Moes, T. R., Cobleigh, B. R., Cox, T. H., Conners, T. R., Iliff, K. W., and Powers, B. G., “Flight Stability and Control and
Performance Results from the Linear Aerospike SR-71 Experiment (LASRE),” AIAA Paper 1998-4340, 1998.
17Whitmore, S. A., and Moes, T. R., “Base-Drag-Reduction Experiments on the X-33 Linear Aerospike SR-71 Flight Program,”
Journal of Spacecraft and Rockets, Vol. 37, No. 3, May 2000, pp. 297-303.
18Corda, S., Neal, B. A., Moes, T. R., Cox, T. H., Monaghan, R. C., Voelker, L. S., Corpening, G. P., Larson, R. R., and Powers, B. G.,
“Flight Testing the Linear Aerospike SR-71 Experiment (LASRE),” NASA/TM-1998-206567, 1998.
19Reid, J., “The Effects of Base Bleed on Plug Nozzles,” Reports and Memoranda No. 3466, Feb. 1965.
20Bayer, M. J., “Comparative Assessment of Rocket-Propelled Single-Stage-to-Orbit Concepts,” Journal of Spacecraft and Rockets,
Vol. 40, No. 2, Mar. 2003, pp. 273-278.
21Stark, R. H., “Flow Separation in Rocket Nozzles, a Simple Criteria,” AIAA Paper 2005-3940, 2005.
22“The U.S. Standard Atmosphere 1976,” U.S. Government Printing Office, Washington, D.C., 1976.
23Segal, C., “The Scramjet Engine—Process and Characteristics,” Cambridge University Press, 2009.
24Merlin, P. W., “Design and Development of the Blackbird: Challenges and Lessons Learned,” AIAA Paper 2009-1522, 2009.
This document is provided by JAXA.

29
25Van Driest, E. R., “Turbulent Boundary Layer in Compressible Fluid,” Journal of Aeronautical Sciences, Vol. 18, No. 3, Mar. 1951,
pp. 145-160.
26Korkegi, R. H., and Freeman, L. M., “Aft-Body Drag Reduction by Combined Boat-Tailing and Base Blowing at M = 3,” AIAA
Journal, Vol. 14, No. 8, Aug. 1976, pp. 1143-1145.
27Engelund, W. C., Holland, S. D., Cockrell, Jr., C. E., and Bittner, R. D., “Aerodynamic Database Development for the Hyper-X
Airframe-Integrated Scramjet Propulsion Experiments,” Journal of Spacecraft and Rockets, Vol. 38, No. 6, Nov. 2001, pp. 803-810.
28Davis, M. C., and White, J. T., “X-43A Flight-Test-Determined Aerodynamic Force and Moment Characteristics at Mach 7.0,”
Journal of Spacecraft and Rockets, Vol. 45, No. 3, May 2008, pp. 472-484.
29Das, I. S., Khavaran, A., and Krejsa, E. A., “A Computational Study of Contoured Plug-Nozzle Jet Noise,” Journal of Sound and
Vibration, Vol. 206, No. 2, 1997, pp. 169-194.
30Colville, J. R., Starkey, R. P., and Lewis, M. J., “Axisymmetric Inlet Design for Combined-Cycle Engines,” Journal of Propulsion
and Power, Vol. 22, No. 5, Sep. 2006, pp. 1049-1058.
31Dissel, A. F., Kothari, A. P., and Lewis, M. J., “Comparison of Horizontally and Vertically Launched Airbreathing and Rocket
Vehicles,” Journal of Spacecraft and Rockets, Vol. 43, No. 1, Jan. 2006, pp. 161-169.
32Bulman, M. J., and Siebenhaar, A., “Combined Cycle Propulsion: Aerojet Innovations for Practical Hypersonic Vehicles,” AIAA
Paper 2011-2397, 2011.
33Hirt, S. M., Chima, R. V., Vyas, M. A., Wayman T. R., Conners, T. R., and Reger R. W., “Experimental Investigation of a
Large-Scale Low-Boom Inlet Concept,” AIAA Paper 2011-3796, 2011.
This document is provided by JAXA.