Embed Size (px)
Citation preview
PERFORMANCE EFFECTIVENESS OF NATIONALISED BANKS:A CASE STUDY OF SYNDICATE BANK.
Thesis submitted to the Cochin University of Science and Technology
for the Award of the Degree of DOCTOR OF PHILOSOPHY
under the Faculty of Social Sciences.
By
ZACHARIAS THOMAS-
Under the supervision of
Dr. P. SUDARSANAN PILLAr Head
Department of Commerce.
School of Management Studies
COCHIN UNIVERSITY OF SCIENCE AND TECHNOLOGY
Kochi, Kerala-682 022
January 1996
Dr. P. SUDARSANAN PILLAI M. A .. M. Corn .. LL. 8 •• Ph.D.
HEAD
DEPARTMENT OF COMMERCE COCHIN UNIVERSITY OF
SCIENCE AND TECHNOLOGY COCHIN-682 022, Kerala, India
Phon~ (Off.) 555310
Fax: 0484-532495
Telex: 885·5019 CU IN
25-01-1996 Dated ........................................... _
CERTIFICATE
I certify that the thesis entitled "Performance
Effectiveness of Nationalised Banks I A Cas. Study of Syndicate
Bank". is a record of bonafide research work carried out by
Sri. Zacharias Thomas (Part-time Research Scholar- Reg.
No.972) under my guidance. This has not been previously
submitted for the award of any degree. diploma. associateship
or other similar title. The thesis is worth submitting for
the degree of Doctor of Philosophy in Social Sciences.
'. -.~-.
Dr. P. Sudarsanan Pillai. (Research Supervisor)
Residence: No. 5, Type 11 Quarters, Cochin University Campus, Cochin. 682 022. Phone: 0484-569655
CHAPTER
I
11
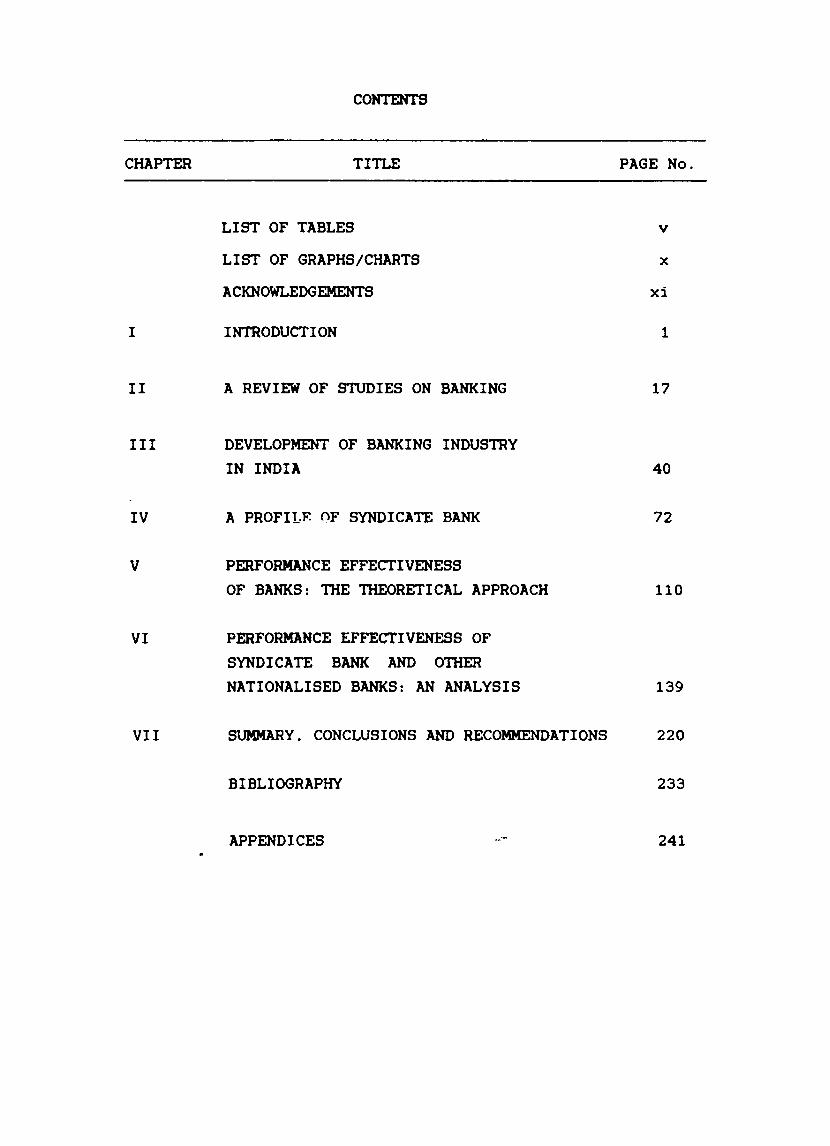
CONTENTS
TITLE
LIST OF TABLES
LIST OF GRAPHS/CHARTS
ACKNOWLEDGEMENTS
INTRODUCTION
A REVIEW OF STUDIES ON BANKING
III DEVELOPMENT OF BANKING INDUSTRY IN INDIA
IV A PROFILF. OF SYNDICATE BANK
V PERFORMANCE EFFECTIVENESS OF BANKS: THE THEORETICAL APPROACH
VI PERFORMANCE EFFECTIVENESS OF SYNDICATE BANK AND OTHER NATIONALISED BANKS: AN ANALYSIS
VII SUMMARY. CONCLUSIONS AND RECOMMENDATIONS
BIBLIOGRAPHY
APPENDICES
PAGE No.
v
x
xi
1
17
40
72
110
139
220
233
241
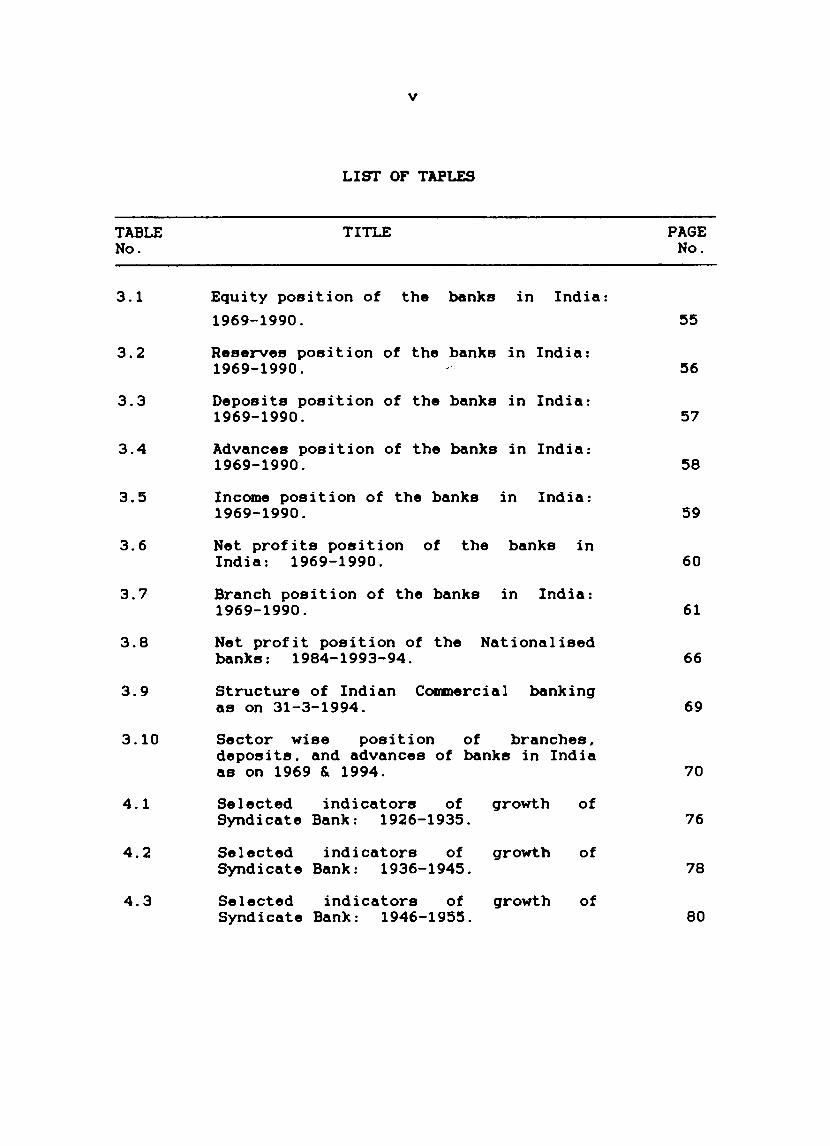
TABLE No.
v
LIST OF TAPLES
TITLE
3.1 Equity position of the banks in India:
1969-1990.
3.2
3.3
3.4
3.5
3.6
3.7
3.8
3.9
3.10
4.1
4.2
4.3
Reserves position of the banks in India: 1969-1990.
Deposits position of the banks in India: 1969-1990.
Advances position of the banks in India: 1969-1990.
Income position of the banks in India: 1969-1990.
Net profits position of the banks in India: 1969-1990.
Branch position of the banks in India: 1969-1990.
Net profit position of the Nationalised banks: 1984-1993-94.
Structure of Indian Commercial banking as on 31-3-1994.
Sector wise position of branches. deposits. and advances of banks in India as on 1969 & 1994.
Selected indicators of growth Syndicate Bank: 1926-1935.
Selected indicators of growth Syndicate Bank: 1936-1945.
Selected indicators of growth Syndicate Bank: 1946-1955.
of
of
of
PAGE No.
55
56
57
58
59
60
61
66
69
70
76
78
80
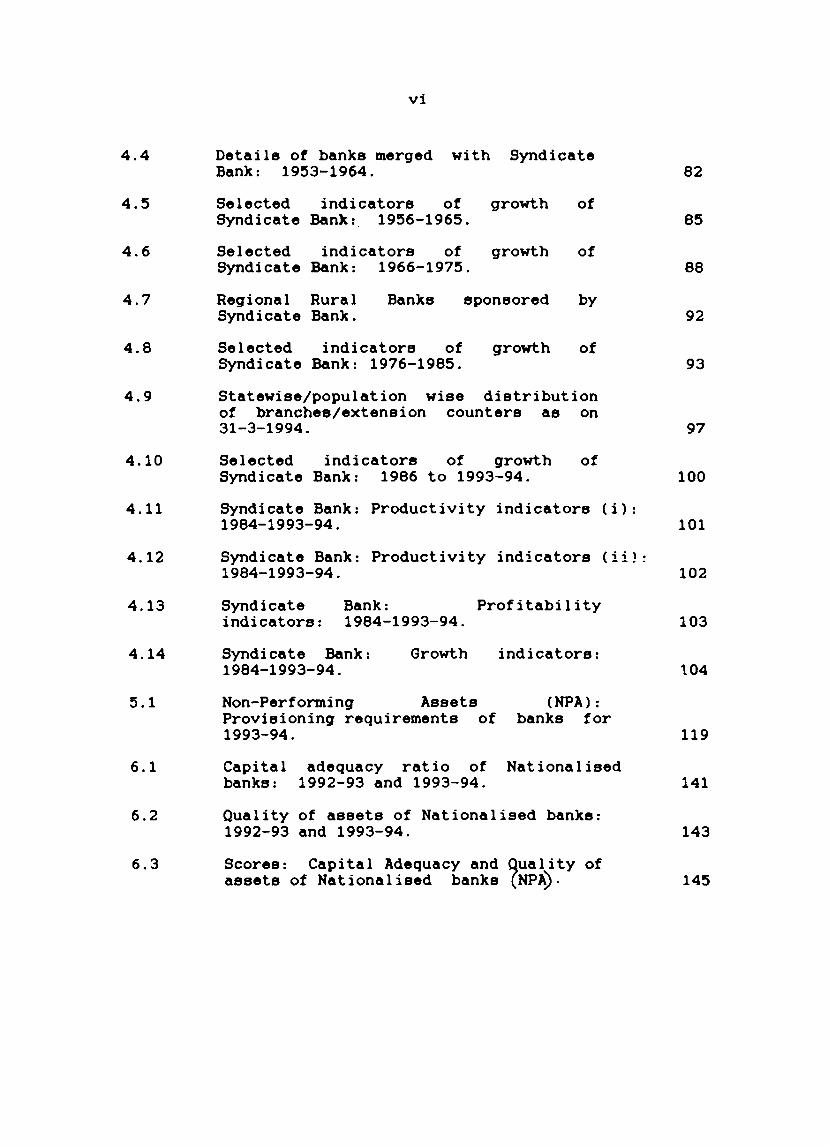
4.4
4.5
4.6
4.7
4.8
4.9
4.10
4.11
4.12
4.13
4.14
5.1
6.1
6.2
6.3
vi
Details of banks merged with Syndicate Bank: 1953-1964.
Selected indicators of growth of Syndicate Bank I 1956-1965.
Selected indicators of growth of Syndicate Bank: 1966-1975.
Regional Rural Banks sponsored by Syndicate Bank.
Selected indicators of growth of Syndicate Bank: 1976-1985.
Statewise/population wise distribution of branches/extension counters as on 31-3-1994.
Selected indicators of growth Syndicate Bank: 1986 to 1993-94.
of
Syndicate Bank: Productivity indicators (i): 1984-1993-94.
Syndicate Bank: Productivity indicators (ii)! 1984-1993-94.
Syndicate Bank: Profitability indicators: 1984-1993-94.
Syndicate Bank: 1984-1993-94.
Growth indicators:
Non-Performing Assets (NPA): Provisioning requirements of banks for 1993-94.
Capital adequacy ratio of Nationalised banks: 1992-93 and 1993-94.
Quality of assets of Nationalised banks: 1992-93 and 1993-94.
Scores: Capital Adequacy and quality of assets of National ised banks (NPA).
82
85
88
92
93
97
100
101
102
103
1.04
119
141
143
145

6.4
6.5
6.6
6.7
6.8
6.9
6.10
6.11
6.12
6.13
6.14
6.15
6.16
Rate of growth of Nationalised banks 1993-94.
vii
net (%) :
profit 1984
of to
Ratio of net profit to working fund of Nationalised banks: 1984 to 1993-94.
Ratio of net profit to total deposits of the Nationalised banks: 1984 to 1993-94.
Ratio of net profit to total the Nationalised banks: 1993-94.
income of 1984 to
Ratio of net profit to spread of Nationalised banks: 1984 to 1993-94.
Ratio of spread to working fund of Nationalised banks: 1984 to 1993-94.
Ratio of non-interest income to total income of Nationalised banks: 1984 to 1993-94.
Rativ of operating expenses to total income of Nationalised banks: 1984 to 1993-94.
Ratio of cash to total deposits of Nationalised banks: 1984 to 1993-94.
Scores: ~rofitability- Sub-parameters of Nationalised banks.
Health Performance Nationalised Banks.
Score (HPS) of
Share of rural and semi-urban branches to total branches of of Nationalised banks: 1984 to 1993-94.
Ratio of priority total advances of 1984 to 1993-94.
sector advances to Nationalised banks:
147
148
150
152
153
155
157
159
161
163
165
168
170
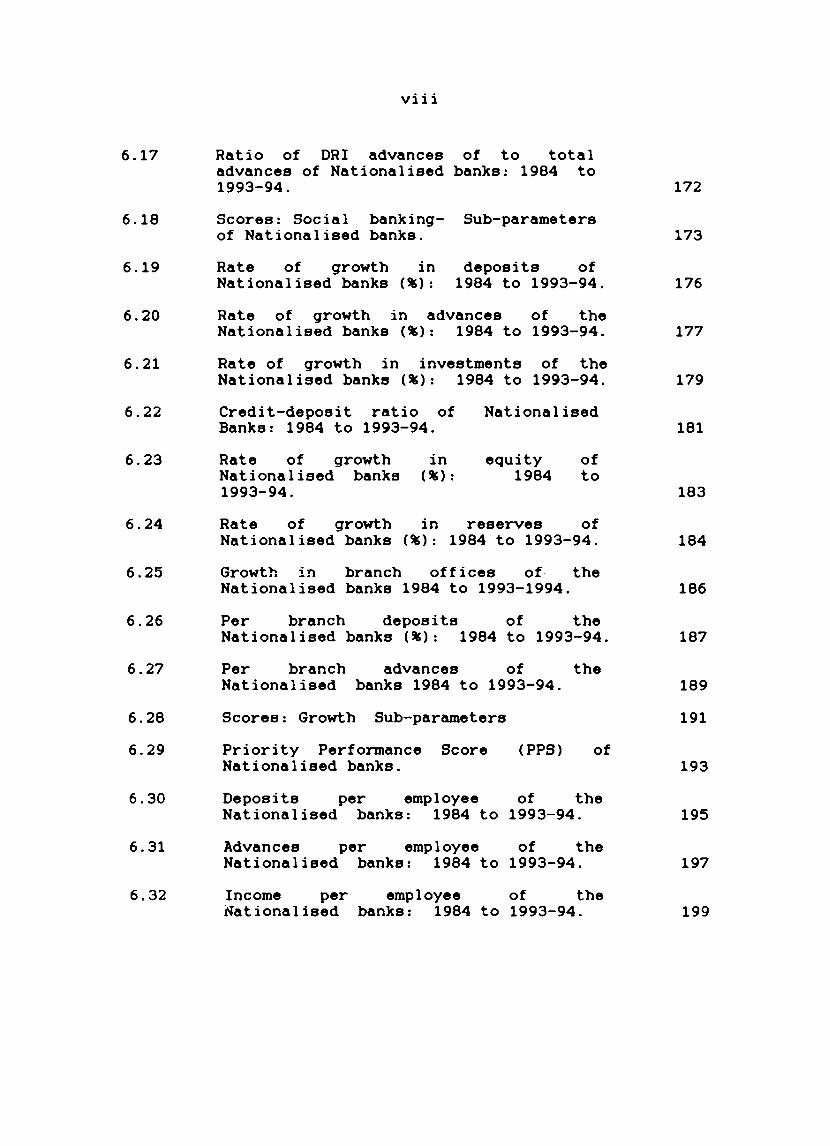
6.17
6.18
6.19
6.20
6.21
6.22
6.23
6.24
6.25
6.26
6.27
6.28
6.29
6.30
6.31
6.32
viii
Ratio of DRI advances of to total advances of Nationalised banks: 1984 to 1993-94.
Scores: Social banking- Sub-parameters of Nationalised banks.
Rate of growth in deposits of Nationalised banks (%): 1984 to 1993-94.
Rate of growth in advances of the Nationalised banks (%): 1984 to 1993-94.
Rate of growth in investments of the Nationalised banks (%): 1984 to 1993-94.
Credit-deposit ratio of Banks: 1984 to 1993-94.
Nationalised
Rate of growth in Nationalised banks (%): 1993-94.
equity 1984
of to
Rate of growth in reserves of Nationalised banks (%): 1984 to 1993-94.
Growth in branch offices of· the Nationalised banks 1984 to 1993-1994.
Per branch deposits of the Nationalised banks (%): 1984 to 1993-94.
Per branch advances of the Nationalised banks 1984 to 1993-94.
Scores: Growth Sub-parameters
Priority Performance Score Nationalised banks.
(PPS) of
Deposits per employee of the Nationalised banks: 1984 to 1993-94.
Advances per employee of the Nationalised banks: 1984 to 1993-94.
Income per employee of the Nationalised banks: 1984 to 1993-94.
172
173
176
177
179
181
183
184
186
187
189
191
193
195
197
199
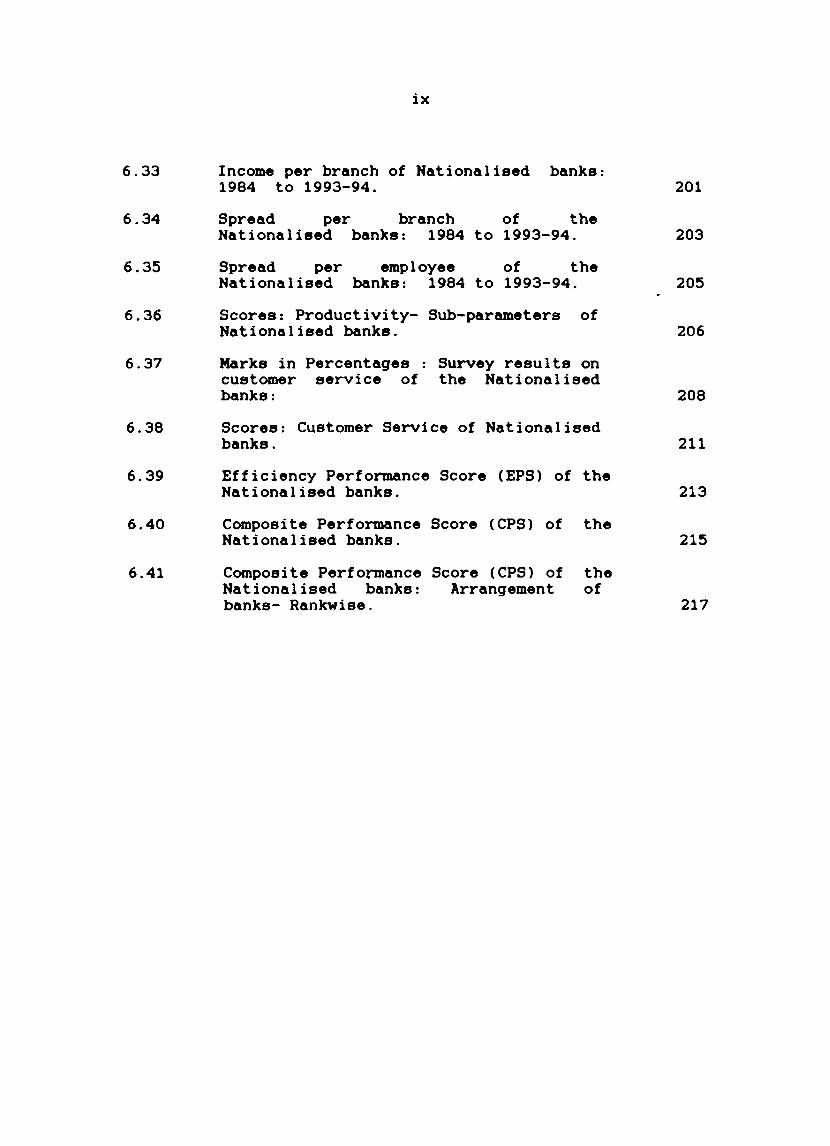
6.33
6.34
6.35
6.36
6.37
6.38
6.39
6.40
6.41
ix
Income per branch of Nationalised banks: 1984 to 1993-94.
Spread per branch of the Nationalised banks: 1984 to 1993-94.
Spread per employee of the Nationalised banks: 1984 to 1993-94.
Scores: Productivity- Sub-par~eters of Nationalised banks.
Marks in Percentages Survey results on customer service of the Nationalised bdnks:
Scores: Customer Service of Nationalised banks.
Efficiency Perfo~nce Score (EPS) of the Nationalised banks.
Composite Performance Score (CPS) of the Nationalised banks.
Composite Performance Score (CPS) of the Nationalised banks: Arrangement of banks- Rankwise.
201
203
205
206
208
211
213
215
217
x
LIST OF GRAPHS/CHARTS
FIG. No. TITLE OF THE GRAPH/CHART PAGE No.
4.1 THE FOUR-TIER ORGANISATION SET-UP OF SYNDICATE BANK AS ON 31-3-94 108
6.1 HEALTH PERFORMANCE OF NATIONALISED BANKS (BASED ON TABLE 6.14) 253
6.2 PRIORITY PERFORMANCE OF NATIONALISED BANKS (BASED ON TABLE 6.29) 254
6.3 EFFICIENCY PERFORMANCE OF NATIONALISED BANKS 255 (BASED ON TABLE 6.39)
6.4 COMPOSITE PERFORMANCE OF NATIONALISED BANKS 256 (BASED ON TABLE 6.40)
CHAPTER I
INTRODUCTION
The bankinq system is an integral part of any
economy.It is one of the many institutions that impinges on
the economy and affect its performance. Economists have
expressed a variety of opinions on the effectiveness of the
banking systems in promoting or facilitatinq economic
development. As an economic institution. the bank is expected
to be more directly and more positively related to the
performance of the economy than most non-economic
. t· t t' 1 lns 1 u lons. Banks are considered to be the mart of the
world. the nerve centre of economies and finance of a nation
and the barometer of its economic perspective. 2 Theyare not
merely dealers in money but are in fact dealers in
development.
Banks are important agencies for the generation of
savinqs of the community. They are also the main agents of
credit. They divert and employ the funds to make possible
fuller utilisation of the resources of a nation. They
1
2
Cameron Rondo. Bankinq and Economic Lessons of History. Oxford University 1972. p.7.
Development-f'ress. New
Some York.
Sharma B.P .. The Role of Banks in India's Developing Economy. S.Chand & Co .. New Delhi. 1974. pp.85-86.
2
transfer funds from regions where it is available in plenty to
where it can be efficiently utilised: the distribution of
funds between regions pave the way for the balanced
development of the different regions. They are thus catalytic
agents that create opportunities for the development of the
resources to speed up the tempo of economic development.
In the Indian financial system. commercial banks are
the major mobilisers and disbursers of financial resources.
They have an all pervasive role in the growth of a developing
country like India. The role of banks in accelerating the
economic development of a country like India has been
increasingly recognised following the nationalisation of
fourteen major commercial banks in July 1969 and six more
banks in April 1980. With nationalisation. the concept of
banking has undergone significant changes. Banks are no
longer viewed as mere lending institutions. They are to serve
the society in a much bigger way with a socio-economic
development oriented outlook3 . They are specially called upon
to use their resources to attain social upliftment and
speedier economic development.
3 Thomas Zacharias. 'Nationalised Banks: A Decades Evaluation of Performance'. Facts For You. (June 1995). p.41.
3
To achieve the varied ob;ectives of nationalisation.
the nationalised banks have introduced innovative schemes in
the mobilisation of resources as well as its
disbursement.Nationalisation resulted in a comprehensive
programme of branch expansion. innovations in mobilisation of
savings. lending to priority sectors and weaker sections of
the society and so on.
The horizon of commercial banking in India that
enlarged with nationalisation has further widened with thp-
implementation of the Banking Sector Reforms in the year
1992-93. Banks are now increasingly identifying themselves
with national problems and thereby trying to bring about
social and economic transformation in the cvuotry. To quote
Bhabha. 11 Banking is the kingpin of the chariot of economic
progress. As such its role in expanding the economy of a
country like India can neither
overlooked. ,,4
1.1. Statement of the Problem
be underestimated
The nationalised banking sector in India
nor
has
produced commendable results i.n the decades of the seventies
4 Bhabha C.H .. Better Climate for Expansion of Indian Banking Needs. Commerce. (Annual Number 1956). p.50.
4
and eighties in achieving the socio-economic objectives
entrusted to them. However some disturbing trends have
emerged towards the end of the eighties and at the dawn of the
nineties. Against the achievement in a few areas of business,
the overall business performance as well as financial
performance of the banks are not encouraging. Even the market
share of the deposits of nationalised banks showed a
decelerating trend. The market share of the total deposits of
the nationalised banks which was 63.30 percent of the total
deposits of the banking sector in India as on 31st December
1984 has come down to 62.75 percent by 31st March 1991 and
decelerated further to 57.10 percent as on 31st March 1994. 5
On the basis of the ma;or recommendations of the
Narasimham Committee on Financial System (1991), the
Government of India introduced certain Banking Sector Reforms
from the fiscal year 1992-93. These reform measures,
especially the capital adequacy standards and prudential
accounting have in particular changed the entire complexion
and character of Indian banking almost overnight. It has
brouqht to light the alarmingly low capital base. hiqh and
growing non-performing assets and relatively low profitability
5 Indian Banks Association. Financial Analysis of Banks 1984,1990-91 and 1993-94, Indian Banks Association. Bombay.
5
position of the nationalised banks. The capital of the
nationalised banks is inadequate in relation to the risk
assets and the off-balance sheet liabilities. Non-performing
assets (NPA) which do not create any real income to the banks
are eroding enormously their profitability. Non-performing
assets of the nationalised banks were estimated by the Finance
Ministry. Government of India to be Rs. 22.08.900 lakhs6 and
Rs.23.74.115 lakhs7 as on 31st March 1993 and 31st March 1994
respectively. An increase in non-performing assets is
detrimentaj not only to profitability. but also to the
deployment of funds for productive purposes. The observations
of the Estimates Committee of the Lok Sabha on Customer
Services and Security System in the nationalised banks (1989-
71st Report) hold qood even now: 'the Quality of the loan
portfolio. the end use of credit and the rate of recycling of
funds continue to constitute an area of concern. 8
The poor state of affairs of the nationalised banks
could be well understood from the fact that the twenty
6
7
8
Economic Times. 3rd May 1994. p.15.
Business Line. 29th August 1995. p.7.
The Estimates Committee of the Lok Sabha. Customer Services and Security System Banks. The Hindu. April 2. 1989. p.4.
71st Report on in Nationalised
6
nationalised banks showed an aggregate net loss of Rs.3,64,292
lakhs and Rs. 3.44.664 lakhs during 1992-93 and 1993-94 ,
respectively. All these banks have in fact showed negative
profits during the year 1992-93. According to the
classification of the Reserve Bank of India. seven of the
nationalised banks- Bank of Baroda. Canara Bank. Corporation
Bank. Oriental Bank of Commerce, Punjab National Bank, Union
Bank of India and Vijaya Bank belonged to the list of Category
A Banks during 1993-94: they reported net profits. The banks
which reported operating profits but net loss during the
period and belonged to the list of Category B Banks consisted
of the following six banks- Allahabad Bank. Bank of India.
Dena Bank. Indian Bank. Indian Overseas Bank and Syndicate
Bank. The banks which reported net loss as well as operatinq
loss during the year 1993-94 were Andhra Bank. Bank of
Maharashtra. Central Bank of India. Punjab and Sind Bank. U Co I
Bank and United Bank of India: they belonged to the list of
Category C Banks.
The average net profit of the twenty nationalised
banks durinq the years 1984. 1989-90. 1992-93 and 1993-94
reveal a negative rate of growth. The poor growth in net
profits is further aggravated through increased growth in net
losses.
7
Like profitability. productivity of the banks too
shows decelerati0n: productivity and profitability are closely
inter-related.
Not only capital adequacy. quality of
productivity and profitability. but also growth.
assets.
social
banking and customer service are areas of concern where a wide
difference in performance exists among the nationalised banks.
The business indicators of the banks have failed to attain
Bubstantial growth. The rise in bank charges. the long
waiting at counters. the unhelpful attitude of the bank staff.
the inordinate delay in the collection of outstation cheques.
discounting bills. the failure to comply with the genuine
instructions of the customers. the non-availability of
necessary forms and so on continue to trouble the customer.
The casual m~nner in which the employees deal with the public
is a clear indication of the fall in general efficiency.
Social banking had imposed substantial financial and
managerial burden on the banking sector and the economy. In
the name of helping the under-privileged. the banks have been
helping the privileged classes: over the last few years there
was gross-subsidisation instead of b "d" t" 9 cross-su 81 lsa lon.
9 Patel I.G.. 'Inaugural Address. Bank Economists Conference'. in N.K.Thingalaya (ed). On Bankers and Economists'. Macmillan India Ltd .. Bombay. 1980. pp.14-15.
8
Though nationalisation has aimed at professional management,
it has actually brought the banks to a dismal state of
affairs, for, the post nationalisation period witnessed the
replacement of 'professional bent' by 'political bent' .10 With
this background, the actual performance of our nationalised
banks and the problems if any they face are to be evaluated
through a scientific study.
Syndicate Bank, once regarded as a model bank by the
Reserve Bank of India and other sister banks in the country.
is chosen for a case study. With its roots in the rural soil,
it has earned a name and fame for itself as the 'small man's
big bank' .It has performed tremendously well during the
pre-nationalisation and early post-nationalisation periods.
But in recent years. along with many other nationalised banks,
there is deceleration in its performance.To obtain a clear
picture, it is worthwhile to have a close look at the
performance effectiveness of Syndicate Bank, which will
further reflect the state of affairs in the rest of the
nationalised banks in the country.
10 Krishn Iyer V.H .. 25 years of Bank Nationalisation. Indian Express. July 20. 1994. p.5.
9
1.2 Objectives of the Study
The important objectives of the present study are,
1) To examine the growth and development of banking industry
in India
2) To examine the extent of achievement of Syndicate Bank in
relation to:
a. Capital adequacy, quality of assets and profitability
b. Social banking and growth
c. Productivity and customer service
3) To make a comparative analysis of the performance
effectiveness of Syndicate Bank in relation to the rest of
the nationalised banks.
4) To put forward concrete suggestions and recommendations to
make the performance of Syndicate Bank and other
nationalised bank~ effective and efficient.
1.3 Scope of the study
~ close look at the performance effectiveness of
Syndicate Bank since 1984 is undertaken through a case study.
For a comparative analysis, the performance of all the other
nationalised banks in India ( ~ppendix I) is also evaluated
10
since 1984. A period of ten years from 1984 to 1993-94 is
taken for the study. The present study is undertaken by
reviewing and analysing the performance effectiveness of
Syndicate Bank and other nationalised banks in India by using
an Economic-Managerial-Efficiency- Evaluation Model (EMEE
Model) developed by the researcher.
1.4 Significance of the Study
The performance effectivenesd of the nationalised
banking industry that controls more than 90 percent of the
banking business in India is an issue of serious concern to
the Government of India. the national and international
monetary authorities such as the Reserve Bank of India. the
World Bank. the International Monetary Fund and so on: it is a
seriously debating topic among academicians and public at
large.
Though a number of studies are available on banking
industry. there is dearth of a comprehensive academic study on
the performance effectiveness and managerial efficiency of the
nationalised banks. A review of the available literature on
banking reveals that no exclusive study on the pertormance
effectiveness of banks has so far been attempted in India. In
this context the present study may fill the gap to a certain
11
extent. Further. it would throw some light on the performance
of Syndicate Bank and other nationalised banks on the basis of
the Banking Sector Reforms introduced in the country since
1992-93. as the study also covers a period of two years since
the introduction of the reform measures.
1.5 Methodology
Performance evaluation is an important pre-reQuisite
for sustained growth and development of any institution. As
in the case of any institution. the evaluation of a bank's
performance too has to be undertaken in relation to its goals
and objectives. Though many studies have been undertaken in
India for evaluating the performance of b~~ke. no
universally acceptable technique/methodology has
beset
single
emerqed
with
or
so
many far. Assessment of a bank's performance is
difficulties on account of its diverse
influence its performance: the affairs
bank are conducted not merely on
considerations in which case it would
of
objectives that
the nationalised
evolve suitable
performance.
parameters and
The researcher. after
financial or business
have been easier to
thereby evaluate its
much deliberations has
attempted to convert the broad objectives of the nationalised
12
banks in terms of certain specific parameters
the evaluation of their performance. This is
to facilitate
done in the
light of the objectives of nationalisation as well as on the
basis of the recommendations of the Narasimham Committee on
the Financial System.
After observing the various performance evaluation
studies and assessing the gaps/deficiencies that exist in this
field, the researcher has used six broad parameters in this
study to evaluate and assess the performance of Syndicate Bank
and other nationalised banks so as not to overlook the various
aspects of the problem. The following are the six basic
parameters used in the study to evaluate the performance of
the individual nati~~alised banks.
1. Capital adequacy and quality of assets
2. Profitability
3. Social banking
4. Growth
5. Productivity
6. Customer service
The above basic parameters are the aggregate of a
number of sub-parameters. All
sub-parameters are important in
the basic parameters
varying degrees t0wards
and
an
13
evaluation of the all round performance. However. it is hard
to determine the influence of each of them independently
towards performance. An optimum mix of these parameters would
provide a comprehensive picture. Development of a proper
Model incorporating the parameters and giving due weightage to
them would provide a good measure of all round
Such a Model would avoid the limitations of
performance on separate parameters too. (Detailed
the Model is presented in chapter V)
1.6 Sources of Data
performance.
evaluating
analysis of
The data required for the study is collected from
both primary and secondary sources. Data pertaining to
customer service. which is mostly qualitative in nature is
collected by a survey coverinq eight percent of the branches
of the nationalised banks in Kerala using an interview
schedule. The schedule consisted of twenty nine questions
brought under eleven sub-headings or areas of concern to
customers. Reliable secondary data is made use of in areas
where primary source is not accessible. The Financial
AnaI"ysis of Banks and Performance Highlights of Public Sector
Banks both published by Indian Banks Association form the most
important source baAed on which the present study is
accomplished. The Annual Reports of the twenty nationalised
14
banks, Reserve Bank of India publications, publications of the
Indian Banks Association Bombay, Indian Institute of Bankers
Bombay, National Institute of Bank Management Pune, Individual
Bank's publications-Pigmy Economic Review of the Syndicate
Bank, State Bank of India Monthly Review etc. form some of the
secondary sources of data for the present study.
1.7 Scheme of the Study
Chapter I. Introduction
The first chapter starts with a brief introduction
characterising the importance of banking in economic
development. It is followed by statement of the research
problem, objectives, scope, significance
methodology and sources of data of the study,
the research report and limitation of the
incorporated in the introductory chapter.
Chapter 11. A Review of Studies on Banking
of the study,
The scheme of
study are also
A brief review of the available literature related
to the problem under investigation is given in chapter two.
15
Chapter Ill. Development of Banking in India
In the third chapter an overview of the growth and
development of banking in India is given. Nationalisation of
banks and its objectives are outlined here. A reference to
the Banking Sector Reforms introduced in India on the basis of
the recommendations of the Narasimham Committee on Financial
System (1991) and its impact on Indian banking. especially on
the nationalised banking sector also is outlined in chapter
three.
Chapter IV. A Profile of Syndicate Bank
A review of the history of Syndicate Bank is carried
out in chapter four. The growth and development as well as
organisation and management of the Bank is outlined in this
chapter.
Chapter V. Performance Effectiveness of Banks: The Theoretical
Approach
Chapter five presents the theoretical foundation of
the study. The Model developed by the researcher for the
evaluation of the performance effectiveness of nationalised
banks is discussed in detail here.
16
Chapter VI. Performance Effectiveness of Syndicate Bank and
other Nationalised Banks: An Analysis
Chapter six outlines the analytical part of the
present study- analysing the performance of Syndicate Bank and
other nationalised banks based on the parameters identified in
the Model.
Chapter VII. Summary, Conclusions and Recommendations
A summary of the entire research study. the
important conclusions of the study. as well as the
recommendations are included in chapter seven.
1.8 Limitation of the Study
A comprehensive picture of the impact of Financial
Sector Reforms on Syndicate Bank and other nationalised banks
could not be fully revealed by the present study. for, the
study could cover a period of two years only since the
introduction of the reform measures ie. 1992-93 and 1993-94.
CHAPTER 11
A REVIEW OF STUDIES ON BANKING
An academic study on the performance of the
nationalised banking sector in India is very important and
pertinent in the context of its structural existence. Before
taking up such an exercise. an attempt is made in this section
to present a review of the available studies in the relevant
area of banking.
Organised or formal research in banking and related
areas is of recent origin in India. The research studies
conducted in the field of banking in Indi~ and abroad relate
mostly to institutional. functional and developmental
activities of banks.
Karkal 1 in his book 'Perspectives of Indian Banking'
has dealt with the various problems and difficulties of the
banking activities after the introduction of the new social
policy in banking. He analyses the implications of the
changed situation in the organisation and functions of banks
1 Karkal. Gopal. Perseectives of Indian Banking. Popular Prakashan Private LImited. Bombay. 1977.
18
and the techniques the banks should adopt for achieving
optimum efficiency.
Mathur2 in his book 'Public Sector Banks in India's
Economy - A Case Study of State Bank of India' has evaluated
the role of the puhlic sector banks as an instrument for the'
rapid growth of the Indian economy. In the process of
analysing that role he has made a thorough study of the
working of the State Bank of India and its seven subsidiaries.
Agarwall 3 in his book 'Management of Nationalised
Commercial Banks in India with Reference to their Social
obligations' has assessed the performance of nationalised
banks in discharging the various social obligations. There
being no absolute line of measurement in this regard. an
effort has been made to evaluate the performance of the
n~tionalised banks in discharging the various social
obligations on the basis of a comparison with the performance
of other bank groups. For the assessment of their individual
2
3
Mathur. O.P .. Public Sector Banks in India's Case Study of State Bank of India. Sterling Private Limited. New Delhi. 1978.
Economy-A Publishers
Agarwall. H.N .. Management of Nationalised Commercial Banks in India with Reference to their Social Obligations. Inter-India Publications. Delhi. 1979.
19
performance. the line of assessment adopted was the average
performance of all the nationalised banks in toto.
Seshadri4 in her book 'Banks Since Nationalisation'
has analysed the achievements of the nationalised banks with
those that were left in the private sector. The progress
achieved by these banks in the sphere of branches. deposits.
advances etc. were analysed with secondary data available from
various banks. the Reserve Bank of India and so on. The
efficiency and profitability of the nationalised banks too
were analysed.
Agarwal1 5 in his book 'Commercial Banking in India
After Nationalisation- A Study of their Policies and Progress'
analysed the performance of commercial banks in India after
nationalisation. It was neither an empirical study nor the
study of a particular aspect of commercial banking. It was
only a study of banking development in the light of
nationalisation. Annual reports of banks. periodical reports
4
5
Seshadri, I.J.H., Banks Since Nationalisation, Birla Institute of Scientific Research. New Delhi. 1981.
Agarwall. B.F .. Commercial Banking in India After Nationalisation - A Study of their Policies and Progress. Classical Publishing Company. New Delhi. 1982.
20
of the Reserve Bank of India. personal discussion with bank
officials and so on were the major sources relied on for the
study.
Hussain6 in '~ Study of New Roles of the Public
Sector Commercial Banking in India' analyses the major
problems faced by the public sector banks in India. ~s
national public sector institutions. they are required to face
new challenges. How can the new developmental. organisational.
managerial and functional problems be solved? How best can
they serve the priority sectors for economic regeneration and
what should be the strategy for dynamic commercial banking
policy in India - were some of the basic problems discussed in
the book.
Chawla7 in his book 'Nationalisation and Growth of
Indian Banking' has investigated the development and growth of
banking activities in India with particular reference to the
state of Punjab. The analysis was carried out with the help
6
7
Hussain. Farhat. ~ Study of New Roles Sector Commercial Banking in India. Publications. New Delhi. 1986.
of Deep
the and
Public Deep
Chawla. ~.S.. Nationalisation and Growth of Indian Banking. Deep and Deep Publications. New Delhi. 1987.
21
of different types of growth rates; indices of changes were
also calculated. Certain statistical tools like co-efficient
of variation and rank correlation too were used in the study.
Chandrayya8 has undertaken a study 'Structural
Changes in the Credit Deployment Policies and Practices of
Commercial Banks in India- A Case Study of Andhra Bank'. The
study was confined to the period 1969 - 1984. The researcher
has examined the various changes that took place in the
structure. organisation and composition of credit deployed by
the commercial banks in India and the varied problems
experienced both by the lending authorities as well as the
borrowers and suggested feasible ways and means to overcome
these problems.
Prabhu9 in 'Excellence Through People: The Canara
Bank Way'. explains how an organisation can achieve its
changing goals from time to time by following the right type
of policies. He has made an attempt to share his experiences.
8
9
Chandrayya. V .. Structural in the Credit Deployment Policies an ractices 0 ommercial Banks in India- A Case Study of Andhra Bank. Discovery Publishing House. New Delhi. 1990.
Prabhu. N.D .. Excellence Through People: The Canara Bank Way. Ko~ark Publishers Pvt. Ltd .. New Delhi. 1991.
22
thoughts and views on creating and sustaining organisational
excellence through people.
10 Jagwant in his book 'Indian Banking Industry:
Growth and Trends in Productivity' examines the trends in
productivity in public sector banks excluding the six banks
nationalised in 1980. He has analysed the trends and changes
in productivity. with particular emphasis on labour
productivity and branch productivity. The trends. changes and
differentials in productivity in different banks and bank
groups are examined in detail based on seventeen indicators.
The main source of data for the study was Financial Analysis
of Banks published by Indian Banks Association and Annual
reports of banks.
Rajendran 11 in his comparative study of the public
sector and private sector banks during the year 1990-91 has
chosen three profitability ratios and six balance sheet
10
11
Singh. Jagwant. Indian Banking Industry: Growth Trends in Productivity. Deep and Deep Publications. Delhi. 1993.
and New
Rajendran. K.A .. 'Comparative Study on Public and Private Sector Banks' .in N. Vinayakumar (ed.).A Peep into Private Sector Banks. Kanishka Publishers and Distributors Delhi. 1993.
23
ratios. He has brought eight scheduled private sector banks.
three nationalised banks and the State Bank of India within
the purview of his study.
Giridhari 12 in his paper has narrated the growth of
private sector banks and public sector banks as a whole for a
three year period - 1989 to 1991. The growth is narrated both
figure-wise and percentage wise. The important variables
considered in the study include - paid up capital. deposits.
advances. priority sector credit. investment. income.
expenditure. profit as also per employee deposits. advances.
profit. investment. branch. expenditure etc. Though the study
is empirical in nature. the individual performance of the
banks is outside the purview of the study. An integrated
picture of the performance of the two sectors too is beyond
the scope of the study.
The Banking Commission13 undertook a comprehensive
research study of the entire banking system of the country and
12
13
Giridhari. D.G .. 'An Evaluatory Study of Performances of Private and Public Sector Banks.' in N. Vinayakumar. (ed.). A Peep into Private Sector Banks'. Kanishka Publishers. Distributors. Delhi. 1993.
Report of the Banking (Saraiya) Commission. Government of India. 1972.
24
came out with salient policy level recommendations in 1972.
It reviewed bank operating methods and procedures and made
recommendations for improving and modernising operating
methods and procedures, particularly relating to customer
service, credit procedures and internal systems. The various
possible ways in which the banking system could assist
economic development was explored.
The PEP Committee on Banking14 constituted to study
the productivity, efficiency and profitability of commercial
banks has used four criteria; namely, productivity, social
objectives-spatial, social objectives-sectoral and
profitability. Under each criterion, it used a set of
indicators. It also examined aspects like planning,
budgeting, marketing, management information systems, annual
accounts, audit systems, procedures and so on. It analysed
banking costs, profitability of operations, pricing of bank
services, trends in earnings and expenditures etc. and made a
number of recommendations. The study was experimental in
nature and it categorically stated that the set of indicators
14 Profitabilit .C. Luther),
25
used by it does not represent either the first or the last
choice.
The Committee on the Functioning of Public Sector
15 Banks appointed by the Reserve Bank of India in 1977 has made
a broad evaluation of the performance of public sector banks
in the country covering the spheres of branch expansion.
deposit mobilisation. credit disbursal. priority sector
lending. efficiency. management - employee relations and so on
and made recommendations to ensure improvement in the
efficiency of their operations and to restore their financial
health. The Committee made a pragmatic evaluation of the
actual performance and functioning of the public sector banks
during the period 1969 to 1977. It collected data from banks.
bank staff. other financial institutions. commercial
associations and so on.
The Committee on the Financial System16 appointed by
the Government of India (Narasimham Committee). in 1991
15
16
Report of the Committee On the Functioning of Public Sector Banks (Headed by India. 1978.
James Raj). Reserve
Report of the Committee on the Financial System (Headed by M. Narasimham). Reserve Bank of Bulletin. February 1992.
Bank of
(1991). India
26
examined all aspects relating to the structure. organisation
and functions of the Indian financial ~stem. It made wide
ranging recommendations with a view to ensuring flexibility.
functional autonomy and thereby enhancing efficiency.
productivity and profitability of the banking sector and the
financial system. It examined the cost. composition and
adequacy of the capital structure of the various financial
institutions and reviewed the relative roles of the different
types of financial institutions in the financial system and
recommended ways to improve the efficiency and effectiveness
of the system with the emerging credit needs of the economy.
Its recommendations include. "inter alia capital adequacy
norms. prudential norms for income recognition. provisioning
for bad debts, transparency of bank balance sheets, liberal
branch licensing policy and so on.
By integrating the field of commercial banking with
economic planning in India. 17 Basu in his research study
presented a picture of the dynamic role which the commercial
banking system can play to help in the process of economic
development in the country. "!"he study underlined in detail
17 Basu, C.R., "!"he Role of the Commercial Planned Economy of India, Ph.D University, Burdwan, 1977.
Banking "!"hesis,
in the Burdwan
27
the development of the commercial banking sector in the
pre-nationalisation period and evaluated the diversified role
the commercial banks have been called upon to play.
Nayan 18 in his research study has made a comparison
of the performance of individual nationalised banks with that
of the banking system as a whole. An attempt was made to
build up a model for the performance evaluation of the banks.
Rastogi19~in his study evaluated the trends in Indian
banking after nationlisation. He made an effort to ascertain
how the banks were in a position to cater to the banking needs
of the Indian masses. He made an effort to suggest ways and
means for further development of banking. Tne data for the
study were collected from the Reserve bank of India and
different other agencies directly or indirectly engaged in the
task of developing banking facilities in the country. The
reports of the various committees and study groups appointed
18
19
Nayan, Kamal, Performance Evaluation of Commercial Banks: Development of an Evaluation Model, Ph.D Thesis, Himachal Pradesh University, Simla, 1982.
Rastogi, Peeyush Kumar, Post Nationlisation Trends in Indian Banking, Ph.D Thesis, Rohilkhand University, Barielly. 1982.
28
by the Government of India and the Reserve Bank of India too
were extensively used in the study.
20 Yadav evaluated the working of Syndicate Bank in
its northern zone and ascertained whether it was working on
the lines suggested by the Government of India and the Reserve
bank of India. With the help of an analytical and comparative
study. the researcher has ascertained whether Syndicate Bank
has been successful in the northern part of the country and
how far it has been able to achieve the objectives of
nationalisation by accelerating banking facilities in the
rural. remote and the neglected areas.
J . 21 . hl·S h t d h d tt t aln ln researc s u y as ma e an a emp to
examine and analyse the funds management policies in selected
nationalised banks. The study examined how the funds have
been acquired and utilised by banks since nationlisation to
achieve the stipulated objectives. Various published sources
such as The Reserve Bank of India Bullettins. Statistical
20
21
Yadav. Bal Ram Singh. An Evaluation of the Working of the Syndicate Bank in Northern Zone. Ph.D Thesis.Rohilkhand University. 'Bareilly. 1983.
Jain. Mohinder Kumar. Funds Nationlised Banks. Ph.D Thesis. 1984.
Management in selected Kurukshetra University.
29
Tables relating to banks in India. Trends and Progress of
Banking in India. Report on Currency and Finance. Annual
reports of nationalised banks. Indian Banks Association
publications. etc. provided the 'required data for the study.
Prasad22 in his study examined the entire activities
and operations of the State Bank of India with particular
emphasis on the various aspects viz. deposit growth. credit
expansion. branch expansion merchant banking and so on. The
study made also an appraisal of the performance of the entire
nationalised commercial banks.
Shete23 and Karkal in their study analysed the
performance and prospects of the Regional Rural Banks in
extending rural credit and in profitability performance. The
study was based on the secondary data published by the Reserve
Bank ef India and NABARD. The study covered 196 RRB's in
respect of geographical spread. business performance. and
financial performance.
22
23
Prasad. Narendra. 'Performance of State Bank of India Ph.D. Thesis. Magadh University. Bodh-Gaya. 1984.
Shete. N.B. and Gopal. Karkal, 'Profit and Profitability of Regional Rural Banks.' National Institute of Bank Man~gement, 1989-90.
30
Chawla24 in his study focussed on the policy making
and management practices in relation to deployment of funds in
banks in the context of the rapidly changing environment. He
focussed on the objectives and strategies of funds management.
structure of roles~and relationships and organisation set up
of the banks. Twenty six Indian banks. both in the public as
well as private sector. were covered in the study. The study
was based on detailed structured interviews with head of Funds
and Investment Departments of the banks. preceded by
discussions with top management personnel. The study brought
out the major systematic deficiencies in the banks funds.
planning. co-ordination and control systems.
Chawla 25 in his study focused on several segments of
banks financial statements to provide an assessment of the
financial health of different bank groups. The study was
based on an analysis of financial and related data available
in the Annual reports of banks and the Reserve bank of India
24
25
Chawla. O.P .. 'Funds Planning and Control in Banks.' National Institute of Bank Management. 1989-90.
Chawla. O.P .. 'Aspects of Financial health of Public Sector Banks: An Exploratory Study of on-balance sheet and off-balance sheet Business Performance. 'National Institute of Bank Management. 1990-91.
31
publications. The study covered a period of twenty years from
1969 to 1989.
Bose26 in her study on 'Trend and Progress of Banking
in India' has tried to analyse the connection between banking
and economic development during the first three five year plan
periods. The problem was studied under two aspects. viz. the
impact that economic development had on banking in India and
secondly. the role the banking system could play in economic
development. To study the problem. she analysed the changes
in the volume. character and composition of bank deposits and
loans. A survey too was conducted to know the changing
character of commercial banking in India.
R ,27, h' angaraJan ln lS paper examined the extent to
which the common man has been helped by the banking system in
India since the nationalisation of the major banks in 1969,
The study revealed that the disparities which existed with
respect to banking infrastructure in the country was very
26
27
Bose. Manjula. 'Trend and Progress of Banking in India.' Ph.D Thesis. Calcutta University. Calcutta. 1991.
Rangarajan. V.. 'Nationalisation Banking Development Since Nationalisation.' T.N. Srinivasan and T.N. Bardhan (eds.). 'Poverty and Income Distribution in India.' Statistical Publishing Society. Calcutta. 1974.
32
large. It revealed that the fruits of banking are even now
enjoyed mostly by the 'elite'.
Shetty28 critically examined the extent to which the
banking system in India has been able to achieve the
objectives set before it initially by the scheme of social
control and subsequently by the nationalisation of banks. It
was observed that no major structural change has occurred in
the composition of deposits and the banks have failed to
improve their credit-deposit ratio over the time. Obviously
rural areas were neglected in the opening of bank branches
too.
D" t" 29 lva la and Venkatechalam in their study of
operational efficiency and profitability of banks proposed to
create a composite index. which would explore certain
indicators that would suitably represent varied aspects of
banks performance. They recognised the problems in creating
28 Shetty. S.L.. "Performance of Conmercial Banks since Nationalisation of major Banks. Promise and Reality". Economic and Political Weekl . Vol.XII. No.31. 32.33. Special Number. August. 1978 pp. 1407-1447.
Divatia. V.V. and T.R. Venkatachalam. ·Operational Efficiency and Profitability of Public Sector Banks'. RBI Occassional Papers. (June. 1978). pp.1-16.
33
such a composite index. The indicators chosen for the study
were divided into (a) operational efficiency. in terms of
productivity (b) operational efficiency in terms of social
objectives and (c) profitability.
Shah30 in various papers discussed bank profitability
and productivity. He disapproved the attitudes of banks that
higher profitability can result from increased spread and that
innovations have a limited role. He emphasised also on
reduction of costs. creation of a team spirit. improvement in
the management for improving bank profitability and
productivity.
Varde and Singh31 in a study of profitability of
commercial banks over a period of fifteen years gave
consideration to two types of factors that affect interest
30
31
Shah. S.G.. 'Bank Profitability: The Real Issue.' Journal of Indian Institute of Bankers. (July-Sept. ~1=97=9~)~.--p-p-.~1=3=O--~14~4~.------------------------
-----.Concern with three P's -Performance. Productivity and Profitability. Commerce. (July 31. 1982). pp.2-4.
Varde. V.S .. and S.P. Singh. 'Profitability of Commercial Banks.' Management Accountant. (August 1979). pp.778-788.
34
rate levels, i.e., external factors like monetary policy,
fiscal policy, interest rate policy etc. and internal factors,
including operational and managerial efficiency of individual
banks.
Kulkarni 32 in his study on developmental
responsibility and profitability of banks stated that while
considering bank's costs and profits - social benefits arising
out of bank operationa cannot be ignored. He claimed that
profit maximisation approach is out of place while referring
to profitability of banks. He recognised that whi le
fulfilling the social responsibility, the banks should try to
make the developmental business as successful as ~ossible,
reduce costs, improve banking system and increase the overall
product i vi ty.
A d ·33. hl'S t f th 't' nga 1 ln paper pu s or a proposl lon that
operational efficiency of a bank is inversely related to the
responsiveness of operating costs to the changes in output.
32
33
Kulkarni. L.G., "Development Responsibility and Prof i tabi 1 i ty of Banks", .;;,;E;,..;;c.....;o....;.n~o;,..;;m....;.l;:..· c~.;;;a,;..;n.....;d~.....;P_o;".",::".l =-i..:.t.;;;i.....;c.....;a~l~_W_e..;;....:.e,;..;k.....;l..L..y, (August 1979), pp.99-102.
Angadi, V. B. , "Measurement of Industry, RBI, Occassional pp.110-112.
Efficiency in Papers, (June
banking 1983),
35
The ratio of proportionate change in operating cost due to
proportionate change in output is treated as a measure of
responsiveness of operating costs. Recognising the external
and internal factors that affect productivity. he expressed
the view that operating cost measures most of them. In his
opinion efficiency is an important yardstick for measuring
bank performance.
Ojha34 in his paper gave a detailed description of
the concepts. productivity and profitability of public sector
banks and outlined the difficulty of measuring those concepts.
He studied these aspects with a number of indicators and
outlined that the profitability of the banks has not been
improving despite increases in productivity. On an
international comparison our public sector banks showed very
low level of productivity and profitability. He emphasised
that a more comprehensive and multi-dimensional approach has
to be adopted to increase productivity and profitability.
34 Ojha. J.. 'Productivity and Profitability of P'lblic Sector Banks in India: An International Comparison. State Bank of India Monthly Review, (July, 198~.
36
Varde35 in his conference paper distinguished between
effectiveness. efficiency and productivity. He classified the
efficiency of a bank into four categories. i.e .. (1) manpower
efficiency ( 2 ) operational efficiency (3) commercial
efficiency and (4) efficiency of ancillary business.
Efficiency under each category can be measured separately.
and measure of efficiency can be considered as productivity.
36 Bankers Training College in its conference paper
made an attempt to bring out the factors generally affecting
efficiency and productivity. It recognised that business per
employee and ratio of average business to establishment
expenses are the most popular indicators of productivity.
However it favoured a 'Disagrregated ~pproach' for measuring
the efficiency and productivity of banks.
35
36
Department of Banking Operations and Development.
Varde. V.S.. 'Effectiveness. Efficiency and Customer Service in Banks.' Conference paper. National Conference on Banking Development organised. by Reserve bank of India. Bombay. 12th November. 1988.
Bankers Training College. Reserve bank of 'Efficiency Productivity and Customer Service in Conference paper. National Conference on Development. Bombay. November 12. 1988.
India. Banks' . Banking
37
The Reserve Bank of India37 in its conference paper observed
that the rapid expansion of baking activities called for a
phase of consolidation to improve the quality of banks'
operational efficiency, productivity and customer service. It
noted that poor quality of bank assets continues to be a cause
for concern in view of large scale industrial sickness and
wide spread defaults in repayment of banks dues. It
emphasised the need for sustained efforts to improve bank
productivity and profitability.
Sooraj and Ganti 38 in their paper 'Comparative
performance of Public Sector Banks in India' used the
taxonomic method to measure inter-bank comparisons of
performance of twenty eight public sector banks in India. In
their study the bank performance index is based on three
income indicators percentage of interest and discount
income, commission and brokerage-income and other income - and
three expenditure indicators percentage of interest
37
38
Department of Banking Operations and Development. Reserve Bank of India, 'Efficiency, Productivity and Customer Service in Banks,' Conference Paper, National Conference on Banking Development, Reserve Bank of India. Bombay. November 12. 1988.
Swami, Sooraj B. and Subrahmanyam Performance of Public Sector Banks (July-September 1993), p.185.
Ganit, . Comparative in India.' Prajnan.
38
expenses, manpower expenses and other expenses. The analysis
was carried out with the help of differential weights and
equal weights to each variable.
Bhattacharyay39 in his research article examined
whether customer service in the banking industry was really
deteriorating. He examined the issue using data from two
filed surveys, conducted by the National Institute of Bank
Management in 1974 and 1984. Based on the study he concluded
that an unqualified assertion that customer services have
deteriorated in the post-nationalisation phase was empirically
untenable.
Reserve Bank of India Committee on Customer Service
in Banks (1991) (Goiporia Committee)40 undertook a detailed
customer survey covering different categories of bank
customers. The Committee has made 97 wide ranging
recommendations to improve the customer service in banks.
39
40
Bhattacharyay, B.N., 'Is Customer Service Deterioratory in the Indian Banking Industry?' Vikalpa, Vol.15, (July-September 1990).
Reports of the Committee on Customer Services in (1991), (Headed by Goiporia), Indian Banking Year 1994.
Banks Book,
39
The forgoing review reveals that. with the exception
of a few. no systematic and scientific effort has ever been
made towards a critical analysis of the performance
effectiveness of the nationalised banking industry in India.
While there have been several piecemeal studies on some
aspects of the banking performance. the results fail to bring
out the overall resultant picture about the performance. No
systematic effort has been made to review the extent of
performance of the uationalised banks which are bound to play
a dominant role in the national economy. Further. none of the
studies covered an evalution of the impact of the Financial
Sector Reforms on the banking sector. In this context. the
present study would be a pioneering venture at analysing the
performance effectiveness of the nationalised banks in India.
CHAPTER III
DEVELOPMENT OF BANKING INDUSTRY IN INDIA
3.1 Early Periods
Commercial banking of the western type is a recent
development in India. But banking was not unknown to India.
From very ancient times indigenous banking and money lending
existed in India in the form of family or individual business.
The ancient Hindu Scriptures refer to their existence in the
Vedic period.
Chanakya's Arthasasthra (about 300 B.C.) has several
references to show that there were in existence powerful
guilds of merchant bankers who received deposits. advanced
loans and carried on other banking functions. During the
r~oghul period. bankers were fairly prominent in the financing
of trade and the use of instruments of trade. They rendered
great service to the East India Company in the early days of
British occupation. The revenue of the East India Company was
collected primarily through the indigenous bankers of various
districts. From the early Vedic period right through the
Moghul period as well as that of the East India Company's rule
41
the money lenders and the indigenous bankers conducted
business similar to that of modern bankers.
All through the period of ancient Indian history.
moneylenders who were called either bankers. or seths. or
shroffs are recorded to have carried on a roaring business in
moneylending and banking1.
The first European Bank in India was started in
Calcutta in 1770 by one of the leading agency houses viz ..
Messers Alexander & Company under the name lithe Bank of
Hindoostan 11 • The Bank was started mostly to meet the
financial needs of foreign trade during the period. The Bank
of Hindoostan failed in the year 1832. with the fall of the
agency house of Messers. Alexander & Company.
Banking in the modern sense came to be established
in India with the setting up of three Presidency Banks The
Bank of Bengal in 1806. The Bank of Bombay in 1840 and The
Bank of Madras in 1843 by the respective Presidency
Governments of Bengal. Bombay and Madras. The Presidency
Banks were successors to agency houses which invariably
1 Davar. S.R .. Law and Practice of Banking. Progressive Corporation Pvt. Ltd .. Bombay. 1986. p.3.
42
combined banking with their commercial and trading activities.
and were floated by the East India Company to facilitate the
borrowings of the Government and maintenance of credit. These
Presidency Banks were really like central banks for their
respective areas as they performed central banking functions
and each-was the Government's banker in its area.
3.2. Pre-Independence Period
With the enactment of the Joint Stock Companies Act
1850. Indian joint stock banks began to be floated. The first
Indian bank was Oudh Commercial Bank started in 1881. It was
followed by the Punjab National Bank in 1894.
The Swadeshi Movement. prompted Indians to start
many new banking institutions. The number of joint stock
banks in India inc~eased remarkably during the boom of
1906-13. The Peoples Bank of India Ltd .• The Bank of India
Ltd .. The Central Bank of India Ltd .. The Indian Bank Ltd ..
and The Bank of Baroda Ltd .. were started during this
The boom continued till it was overtaken by the
period.
crash of
1913-17. a severe crisis faced by the Indian joint stock
banks.
43
The Indian Companies Act was passed in 1913. It
contained only very few regulations specially applicable to
banks. In 1920, the Imperial Bank of India Act was passed
which brought into existence on January 27, 1921 the
Bank of India. The Imperial Bank of India was the
Imperial
result of
the fusion of the three Presidency Banks. The Reserve Bank of
India was started as a private shareholders bank in April 1935
to act as the central bank of the country.
The Indian Companies Act 1913 was amended in 1936 to
bring in control over the mushroom growth and failure of the
banks in the country. But it was not sufficiently effective.
The two World Wars proved a boom to the banking
industry when many large and small banks were started. A good
proportion of them stood the test of time and survived the
subsequent crises, but at least an- equal number of them
failed. Though the Reserve Bank of India was constituted in
1935. much could not be done in respect of bank failures.
3.3 Post-Independence Period
The post-independence period had witnessed a massive
growth of the Indian banking system. The first step taken in
44
this direction was nationalisation of the Reserve Bank of
India in September. 1948.
To have sound and balanced growth of banking
business in the country. the Banking Regulation Act 1949 was
passed. The Act. the first of its kind to regulate the banks
has extensively enlarged the control of the Reserve Bank of
India over the banking industry. It came into
March 16. 1949. The Banking Regulation Act gave
to the Reserve Bank of India to regulate.
develop the banking system. The fifties
effect from
wide powers
supervise and
witnessed the
consolidation of banking structure and the emergence of big
commercial banks through amalgamations and mergers.
The All India Rural Credit Survey Committee
appointed by the Reserve Bank of India. reviewed the rural
credit scene in India in 1954 and -made a few major
recommendations for improving rural credit. On the basis of
its recommendations. the Imperial Bank of India was
nationalised and renamed as State Bank of India from July 1.
1955 based on the provisions of the State Bank of India Act
1955. The State Bank of India (Subsidiary Banks) Act was
passed in 1959 enabling State Bank of India to take over the
then eight state-associated b~nks as its subsidiaries.' Of the
45
eight banks. the State Bank of Bikaner and State Bank of
Jaipur were merged into one bank: the other state-associated
banks which were made subsidiaries consisted of State Bank of
Patiala. State Bank of Saurashtra. State Bank of Indore. State
Bank of Hyderabad. State Bank of Mysore and State Bank of
Trvancore.
To maintain the confidence of the public in the
banks and to stabilise the banking system. the Deposit
Insurance Corporation was formed in 1962. Compulsory mergers
and amalgamation of the banks of weak financial structure with
other healthy banks were undertaken on a massive scale since
the sixties.
The Indian banks made rapid progress in the sixties.
In a very limited scale. a few of the Indian banks established
their branches abroad.
In December 1967. the scheme of Social Control over
banks was announced in the Parliament. The basic objectives
of social control were to ensure an equitable and purposive
distribution of credit within the resources available. keeping
in view the relative priorities of developmental needs in the
country. It was to ensure without actual take over of banks
46
into public ownership. the achievements of those social ends
that nationalisation could conceivably secure.
Social Control brought about a change in the outlook
of bankers. The Boards of Directors of the banks were
reconstituted giving adequate representations to various
interests like agriculture. small scale industries etc.
Banking was professionalised by making the Chief Executive of
the banks as a full-time employee.
3.4 Post-National isation Period
The scheme of Social Control initiated in December
1967 was found to be unsatisfactory and
Central Government. Banks were to be
inadequate
adequately
by the
motivated
towards speedy achievements of the social objectives of
meeting the legitimate requirements of the weaker sections of
society. Accordingly fourteen major Indian commercial banks
each with a deposit of Rs.5000 lakhs or more. were
nationalised on 19th July. 1969.
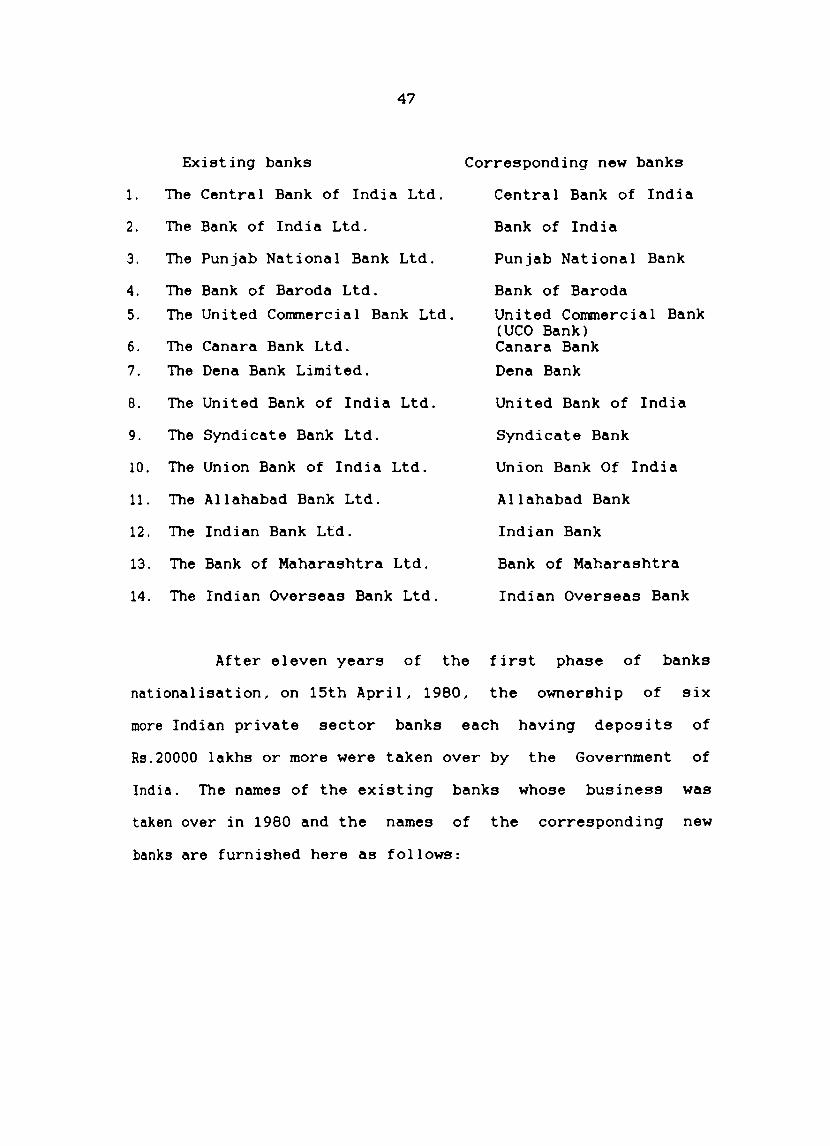
The list of the 'existing banks' whose business was
taken over in 1969 and the corresponding new banks is as
follows:
47
Existing banks
1. The Central Bank of India Ltd.
2. The Bank of India Ltd.
3. The Punjab National Bank Ltd.
4. The Bank of Baroda Ltd.
5. The United Commercial Bank Ltd.
6. The Canara Bank Ltd.
7. The Dena Bank Limited.
8. The United Bank of India Ltd.
9. The Syndicate Bank Ltd.
10. The Union Bank of India Ltd.
11. The Allahabad Bank Ltd.
12. The Indian Bank Ltd.
13. The Bank of Maharashtra Ltd.
14. The Indian Overseas Bank Ltd.
Corresponding new banks
Central Bank of India
Bank of India
Punjab National Bank
Bank of Baroda
United Commercial Bank (UCO Bank) Canara Bank
Dena Bank
United Bank of India
Syndicate Bank
Union Bank Of India
Allahabad Bank
Indian Bank
Bank of Maharashtra
Indian Overseas Bank
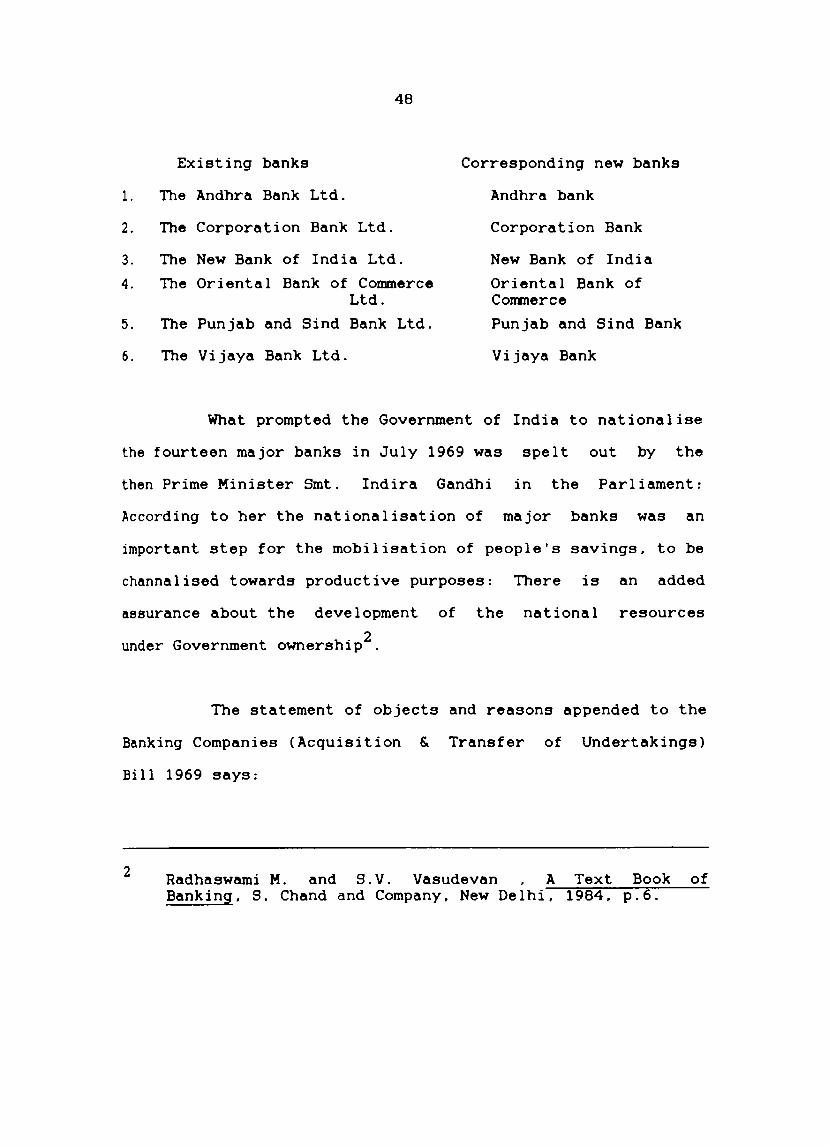
After eleven years of the first phase of banks
nationalisation, on 15th April, 1980, the ownership of six
more Indian private sector banks each having deposits of
Rs.20000 lakhs or more were taken over by the Government of
India. The names of the existing banks whose business was
taken over in 1980 and the names of the corresponding new
banks are furnished here as follows:
1.
2.
3.
4.
5.
6.
48
Existing banks
The Andhra Bank Ltd.
The Corporation Bank Ltd.
The New Bank of India Ltd.
The Oriental Bank of Commerce Ltd.
The Punjab and Sind Bank Ltd.
The Vijaya Bank Ltd.
Corresponding new banks
Andhra bank
Corporation Bank
New Bank of India
Oriental Bank of Commerce
Punjab and Sind Bank
Vijaya Bank
What prompted the Government of India to nationalise
the fourteen major banks in July 1969 was spelt out by the
then Prime Minister Smt. Indira Gandhi in the Parliament:
According to her the nationalisation of major banks was an
important step for the mobilisation of people's savings. to be
channalised towards productive purposes: There is an added
assurance about the development of the national resources
under Government ownership2.
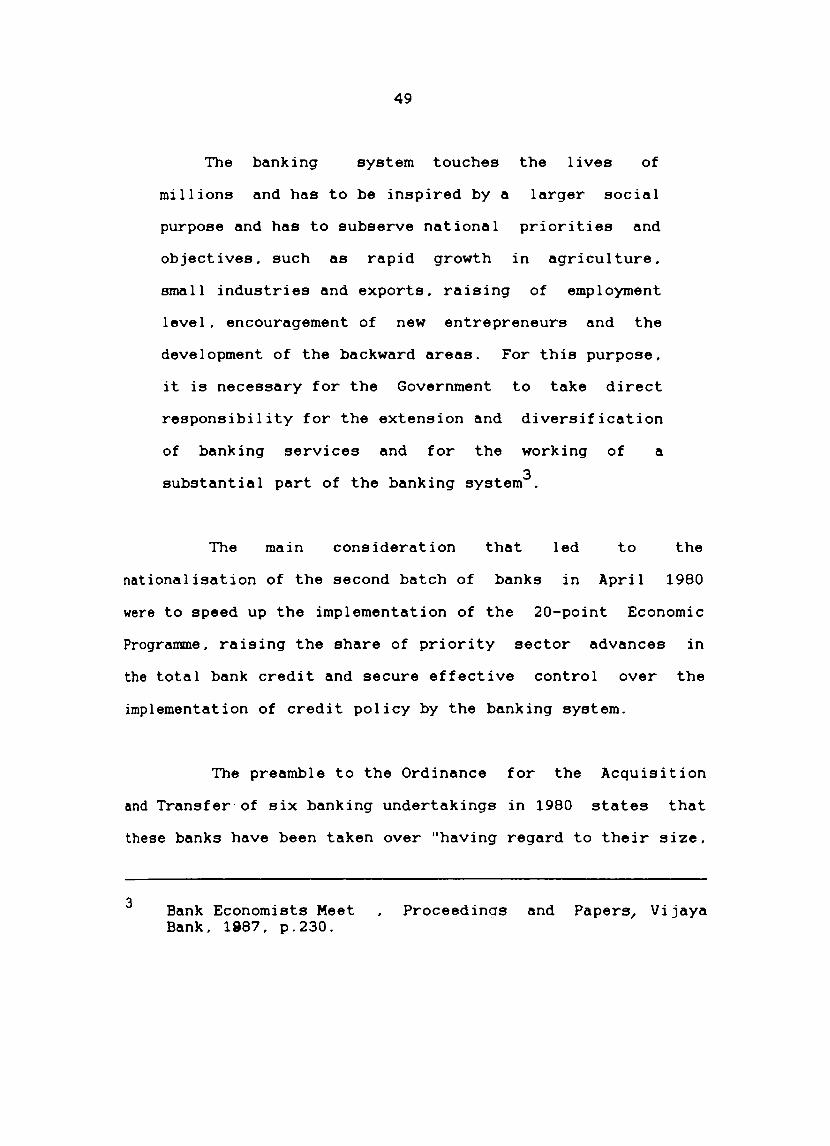
The statement of objects and reasons appended to the
Banking Companies (Acquisition & Transfer of Undertakings)
Bi 11 1969 says:
2 Radhaswami M. and S.V. Vasudevan A Text Book of Banking. S. Chand and Company. New Delhi. 1984. p.6.
49
The banking system touches the lives of
millions and has to be inspired by a larger social
purpose and has to subserve national priorities and
objectives. such as rapid growth in agriculture.
small industries and exports. raising of employment
level. encouragement of new entrepreneurs and the
development of the backward areas. For this purpose.
it is necessary for the Government to take direct
responsibility for the extension and diversification
of banking services and for the working of a
substantial part of the banking system3 .
The main consideration that led to the
nationalisation of the second batch of banks in April 1980
were to speed up the implementation of the 20-point Economic
Programme. raising the share of priority sector advances in
the total bank credit and secure effective control over the
implementation of credit policy by the banking system.
The preamble to the Ordinance for the Acquisition
and Transfer of six banking undertakings in 1980 states that
these banks have been taken over "having regard to their size.
3 Bank Economists Meet Bank. 1987. p.230.
Proceedinas and Papers, Vijaya
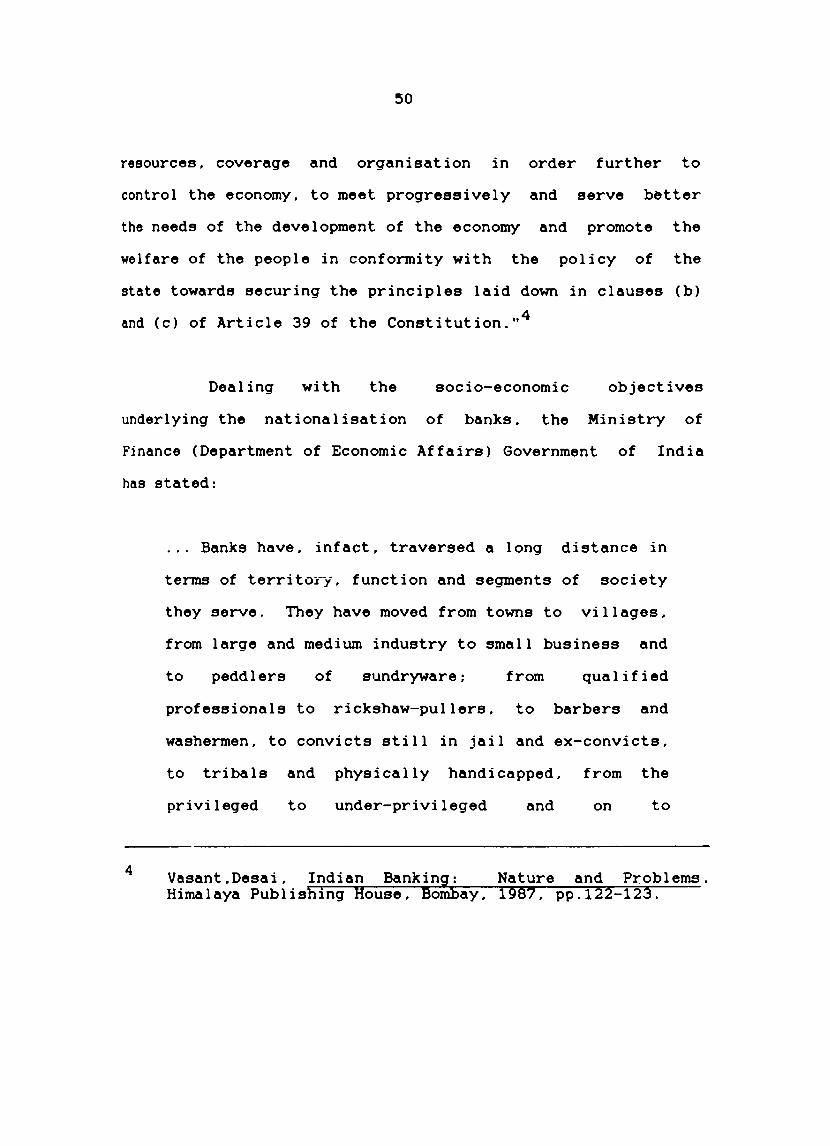
50
resources. coverage and organisation in order further to
control the economy. to meet progressively and serve b&tter
the needs of the development of the economy and promote the
welfare of the people in conformity with the policy of the
state towards securing the principles laid down in clauses (b)
and (c) of Article 39 of the Constitution ... 4
Dealing with the socio-economic objectives
underlying the nationalisation of banks. the Ministry of
Finance (Department of Economic Affairs) Government of India
has stated:
... Banks have. infact. traversed a long distance in
terms of territory. function and segments of society
they serve. They have moved from towns to villages.
from large and medium industry to small business and
to peddlers of sundryware; from qualified
professionals to rickshaw-pullers. to barbers and
washermen. to convicts still in jail and ex-convicts.
to tribals and physically handicapped. from the
privileged to under-privileged and on to
4 Vasant.Desai. Indian BankiniE Nature and Problems. Himalaya Publishing House. Bo ay, 1987. pp.122-123.
51
un-privileged; in short to all those who work for a
living or looking for opportunities to work for a
living and believe in dignity
5 self-respect.
of labour and
The broad objectives of nationalised banks can be
swmarised as under:
1. To usher in faster economic growth of the country through
mobilisation of savings and channelising them into
productive uses.
2. To improve the economic well- being of the society at
large and to help the socially and economically
downtrodden people in particulCi'-.
3. To reduce the imbalance in economic growth among
different regions and there by facilitate a more balanced
growth.
4. To manage properly, as trustees, the funds mobililsed
5
from the public.
Nigam Raj K., "Banking in India in the Eighties", Documentation Centre, New Delhi, 1986 ..
52
5. To maintain efficiency both in terms of
(a) rendering service to various types of customers and
(b) operations.
6. To render professionalised management services.
As a result of the nationalisation of banks in 1969
and 1980. the total number of public sector banks in the
country has increased to 28. These include State Bank of
India. its seven subsidiaries and the twenty nationalised
banks. The public sector banks accounted for 91 percent of
the total deposits and credits of all the commercial banks in
India in April 19806 .
The focus of banks since nationalisation primarily
has been on "widening and deepening the banking system and
effecting a structural transformation in the deployment of
commercial bank credit in pursuance of the plan objectives of
increasing the financial savings. alleviation of poverty.
modernisation of agriculture. small and cottage industries.
6 Annual Report. Reserve Bank of India. 1979-80. pp.28-29.
53
Banking has thus emerged as an effective catalytic agent of
7 socia 1 and economi c change
A series of measures were taken in close succession.
enabling the nationalised banks to play an effective role in
economic development. Nationalised banks were directed t~
identify centres for branch expansion by selecting the
hitherto unbanked areas. The Lead Bank Scheme was initiated
in 1970 assigning the responsibility of developing the banking
activities in the district allotted to each of the
national ised banks. The commercial banks in collaborat ion
with the Central and State Governments sponsored Regional
Rural Banks in different parts of the country. As on
31-3-1994 there are 196 Regional Rural B~nks in different
parts of the country with a network of branches numbering
14561 and deposits and advances to the extent of Rs.830000
lakhs and Rs.510700 lakhs respectively.
As a step towards strengthening the banking sector
in India. four Private Sector Banks - United Industrial Bank
Ltd .. Bank of Tamil Nadu Ltd .. Bank of Thanjavur Ltd .. and the
Paravur Central Bank Ltd.. were amalgamated during the
7 Malhotra. R.N. Meet. 1986.
"Inaugural Address" at Bank Economists
54
financial year 1989-90 with Allahabad Bank. Indian Overseas
Bank. Indian Bank and Bank of India respectively.
In addition to the traditional commercial banking
functions. banks. as part of the process of diversification of
their activities have developed specific divisions or promoted
subsidiaries and have assisted widely the promotion of
leasing. merchant banking. housing finance. factoring. mutual
fund. venture capital. portfolio management. consumer finance
and so on.
The kaleidoscopic change in the Indian banking
system after nationalisation can be seen from the fact that
the equity of the banks which was RS.4308 lakhs as VII 31st
December 1969 rose to RS.234048 lakhs as on 31st March 1990
showing an average annual growth rate of 21 percent in equity
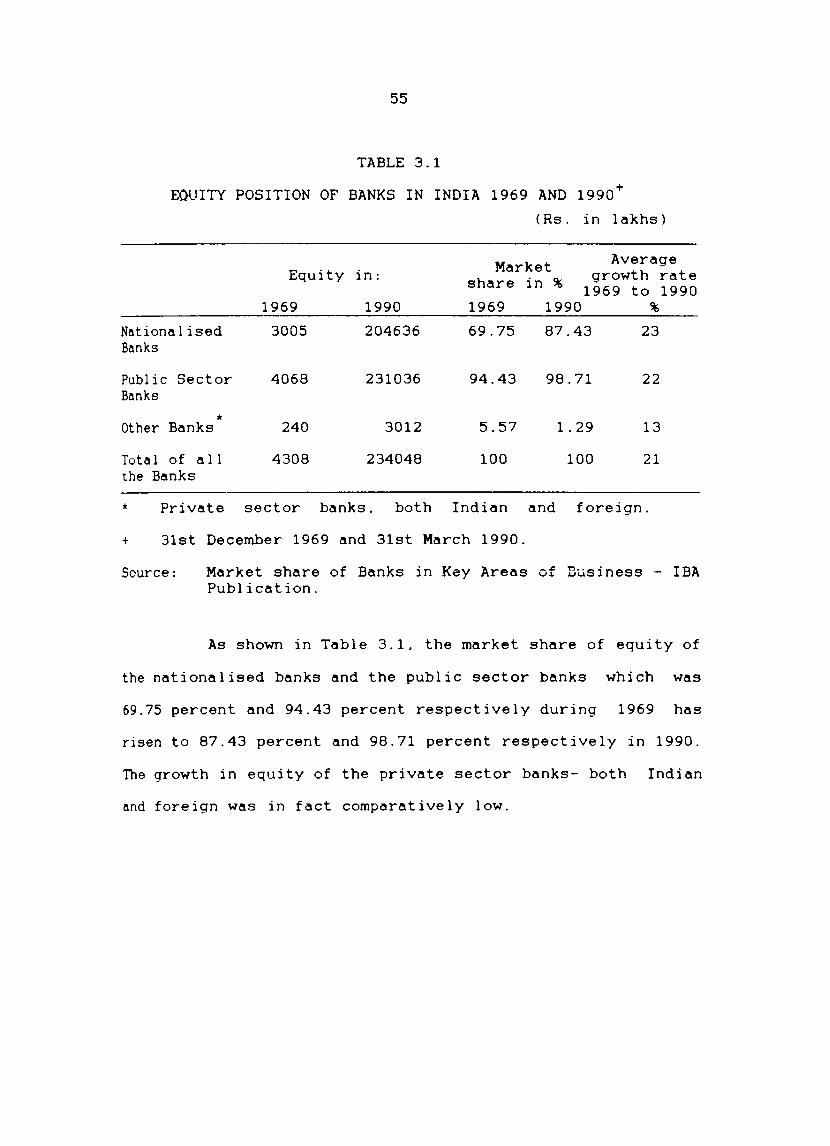
during the period.
55
TABLE 3.1
EQlIITY POSITION OF BANKS IN INDIA 1969 AND 1990+
( Rs. in I akhs )
Market Average Equity in: growth rate share in % 1969 to 1990
1969 1990 1969 1990 %
National ised 3005 204636 69.75 87.43 23 Banks
Publ ic Sector 4068 231036 94.43 98.71 22 Banks
* Other Banks 240 3012 5.57 1. 29 13
Total of all 4308 234048 100 100 21 the Banks
* Private sector banks, both Indian and foreign.
+ 31st December 1969 and 31st March 1990.
Source: Market share of Banks in Key Areas of ~usiness - IBA Publication.
As shown in Table 3.1, the market share of equity of
the nationalised banks and the public sector banks which was
69.75 percent and 94.43 percent respectively during 1969 has
risen to 87.43 percent and 98.71 percent respectively in 1990.
The growth in equity of the private sector banks- both Indian
and foreign was in fact comparatively low.
56
TABLE 3.2
RESERVES POSITION OF THE BANKS IN INDIA 1969 AND 1990
(Rs in lakhs
Market Average Rserves in: share in %
growth rate 1969 to 1990
1969 1990 1969 1990 %
National ised 4210 120610 59.35 48.79 18 Banks
Publ i c Sector 6024 223785 84.93 90.52 19 Banks
Other Banks 1069 23425 15.07 9.48 17
TJta 1 of all 7093 247210 100 100 19 the Banks
Source: Ibid.
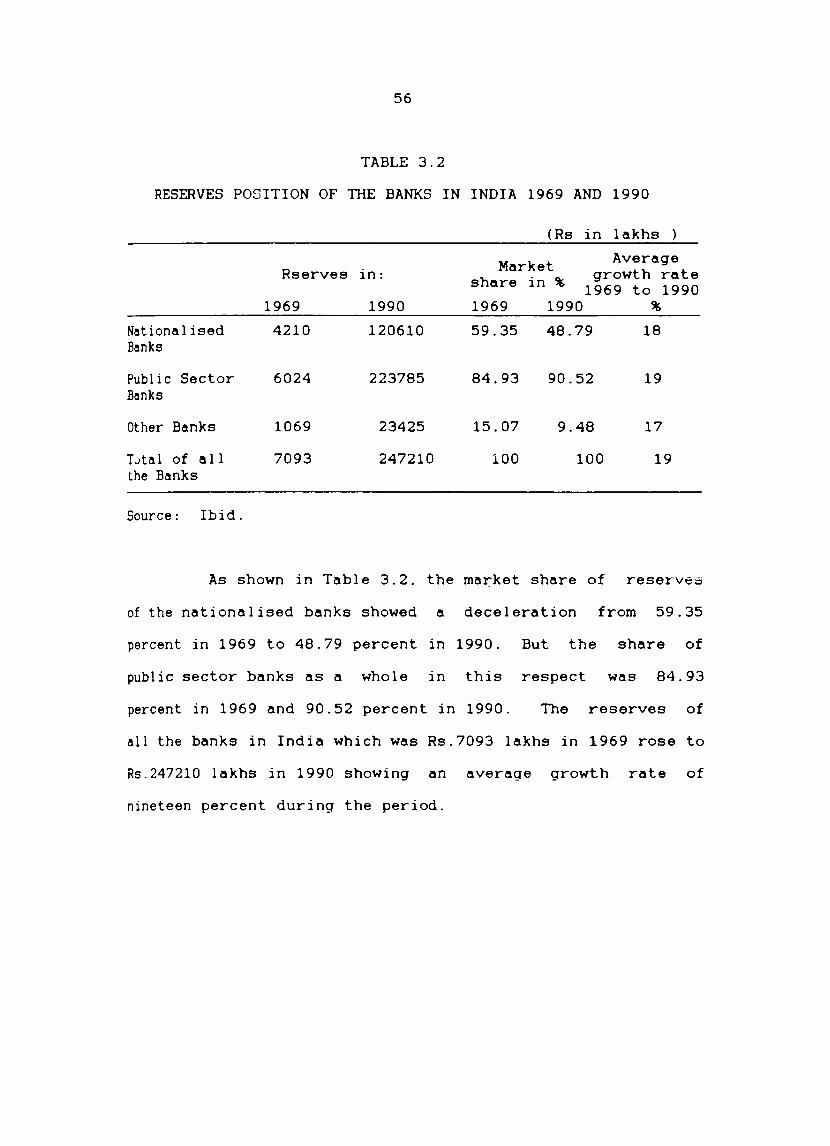
As shown in Table 3.2. the ma~ket share of reserV66
of the nationalised banks showed a deceleration from 59.35
percent in 1969 to 48.79 percent in 1990. But the share of
publ ic sector banks as a whole in this respect was 84.93
percent in 1969 and 90.52 percent in 1990. The reserves of
all the banks in India which was Rs.7093 lakhs in 1969 rose to
Rs.247210 lakhs in 1990 showing an average growth rate of
nineteen percent during the period.
57
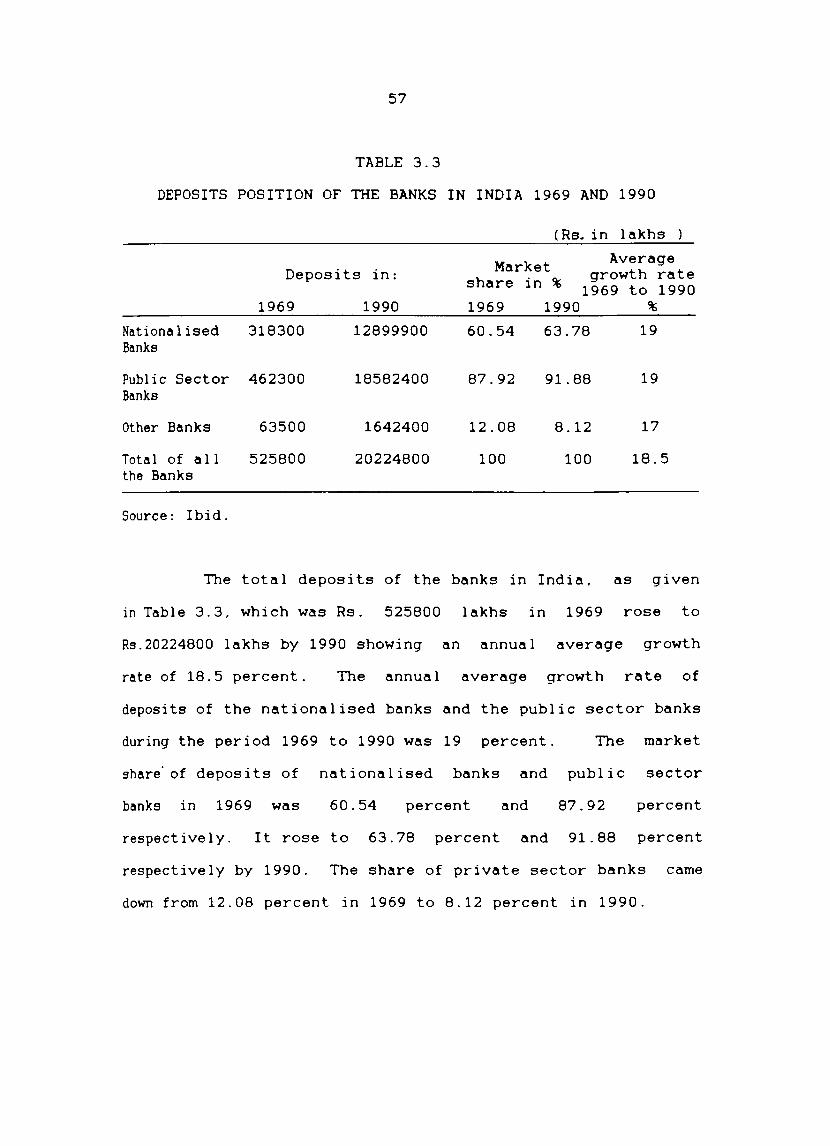
TABLE 3.3
DEPOSITS POSITION OF THE BANKS IN INDIA 1969 AND 1990
(Rs. in 1 akhs
Deposits in: Market Average
share in % growth rate
1969 to 1990 1969 1990 1969 1990 %
Nationa 1 ised 318300 12899900 60.54 63.78 19 Banks
Publ i c Sector 462300 18582400 87.92 91.88 19 Banks
Other Banks 63500 1642400 12.08 8.12 17
Total of all 525800 20224800 100 100 18.5 the Banks
Source: Ibid.
The total deposits of the banks in India. as given
in Table 3.3. which was Rs. 525800 lakhs in 1969 rose to
RS.20224800 lakhs by 1990 showing an annual average growth
rate of 18.5 percent. The annual average growth rate of
deposits of the nationalised banks and the public sector banks
during the period 1969 to 1990 was 19 percent. The market
share' of deposits of nationalised banks and public sector
banks in 1969 was 60.54 percent and 87.92 percent
respectively. It rose to 63.78 percent and 91.88 percent
respectively by 1990. The share of private sector banks came
down from 12.08 percent in 1969 to 8.12 percent in 1990.
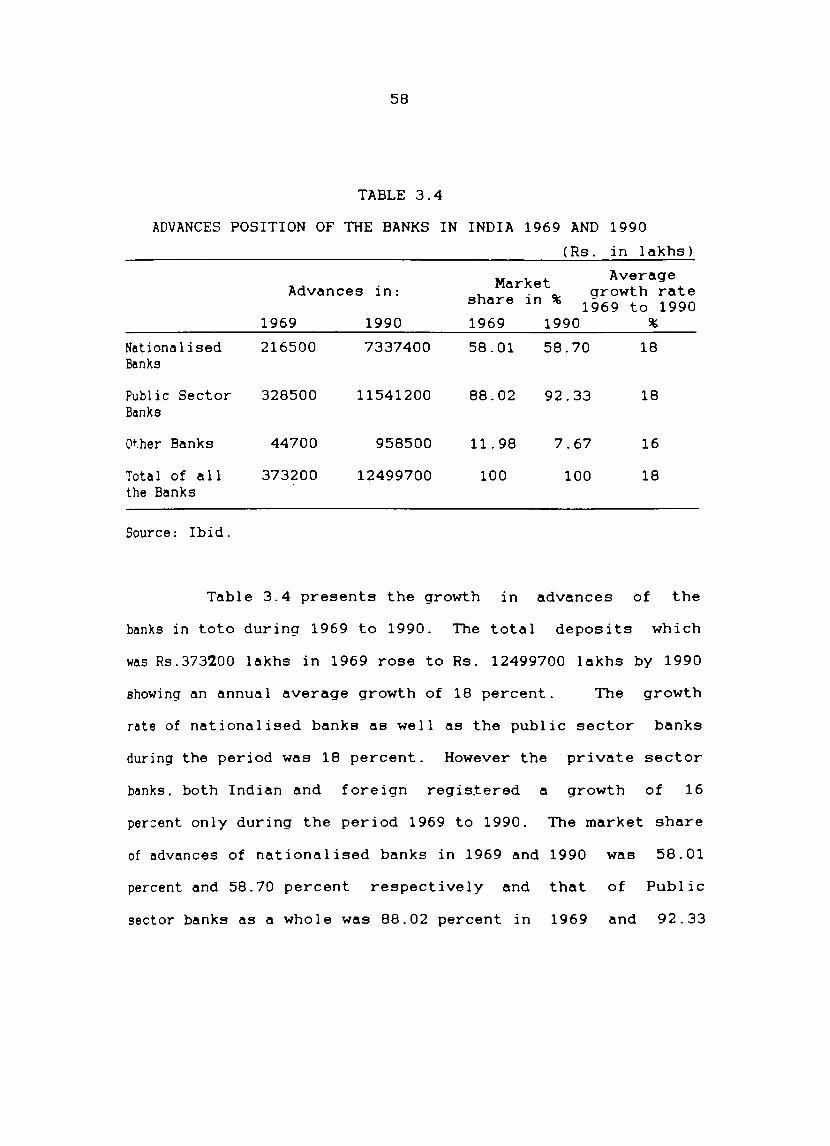
58
TABLE 3.4
ADVANCES POSITION OF THE BANKS IN INDIA 1969 AND 1990
(Rs. in lakhs)
Market Average Advances in: share in %
growth rate 1969 to 1990
1969 1990 1969 1990 %
National ised 216500 7337400 58.01 58.70 18 Banks
Publ i c Sector 328500 11541200 88.02 92.33 18 Banks
Other Banks 44700 958500 11.98 7.67 16
Tota 1 of all 373200 12499700 100 100 18 the Banks
Source: Ibid.
Table 3.4 presents the growth in advances of the
banks in toto during 1969 to 1990. The total deposits which
was Rs.373~00 lakhs in 1969 rose to Rs. 12499700 lakhs by 1990
showing an annua 1 average growth of 18 percent. The growth
rate of nationalised banks as well as the public sector banks
during the period was 18 percent. However the private sector
banks, both Indian and foreign registered a growth of 16
per:ent only during the period 1969 to 1990. The market share
of advances of nationalised banks in 1969 and 1990 was 58.01
percent and 58.70 percent respectively and that of Publ ic
sector banks as a whole was 88.02 percent in 1969 and 92.33
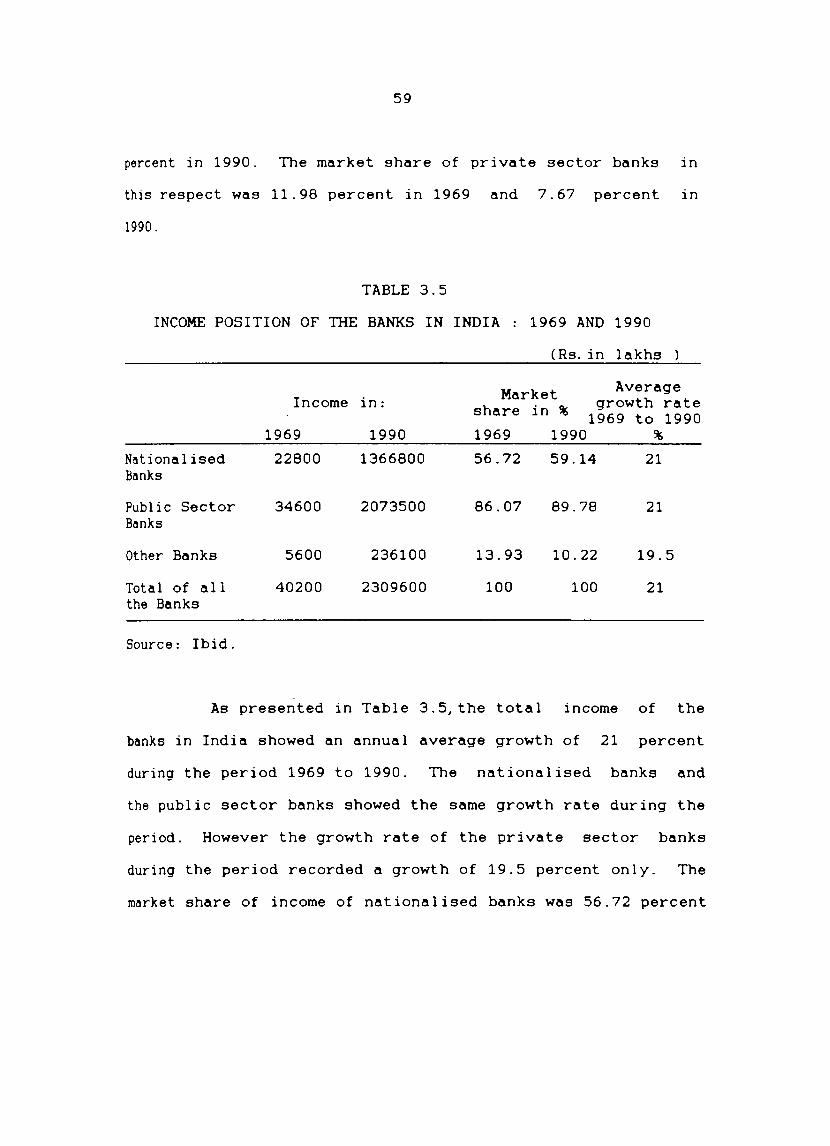
59
percent in 1990. The market share of private sector banks in
this respect was 11.98 percent in 1969 and 7.67 percent in
1990.
TABLE 3.5
INCOME POSITION OF THE BANKS IN INDIA 1969 AND 1990
(Rs. in 1 akhs
Market Average Income in: share in % growth rate
1969 to 1990 1969 1990 1969 1990 %
National ised 22800 1366800 56.72 59.14 21 Banks
Publ i c Sector 34600 2073500 86.07 89.78 21 Banks
Other Banks 5600 236100 13.93 10.22 19.5
Total of all 40200 2309600 100 100 21 the Banks
Source: Ibid.
As presented in Table 3.5,the total income of the
banks in India showed an annual average growth of 21 percent
during the period 1969 to 1990. The nationalised banks and
the public sector banks showed the same growth rate during the
period. However the growth rate of the private sector banks
during the period recorded a growth of 19.5 percent only. The
market share of income of nationalised banks was 56.72 percent
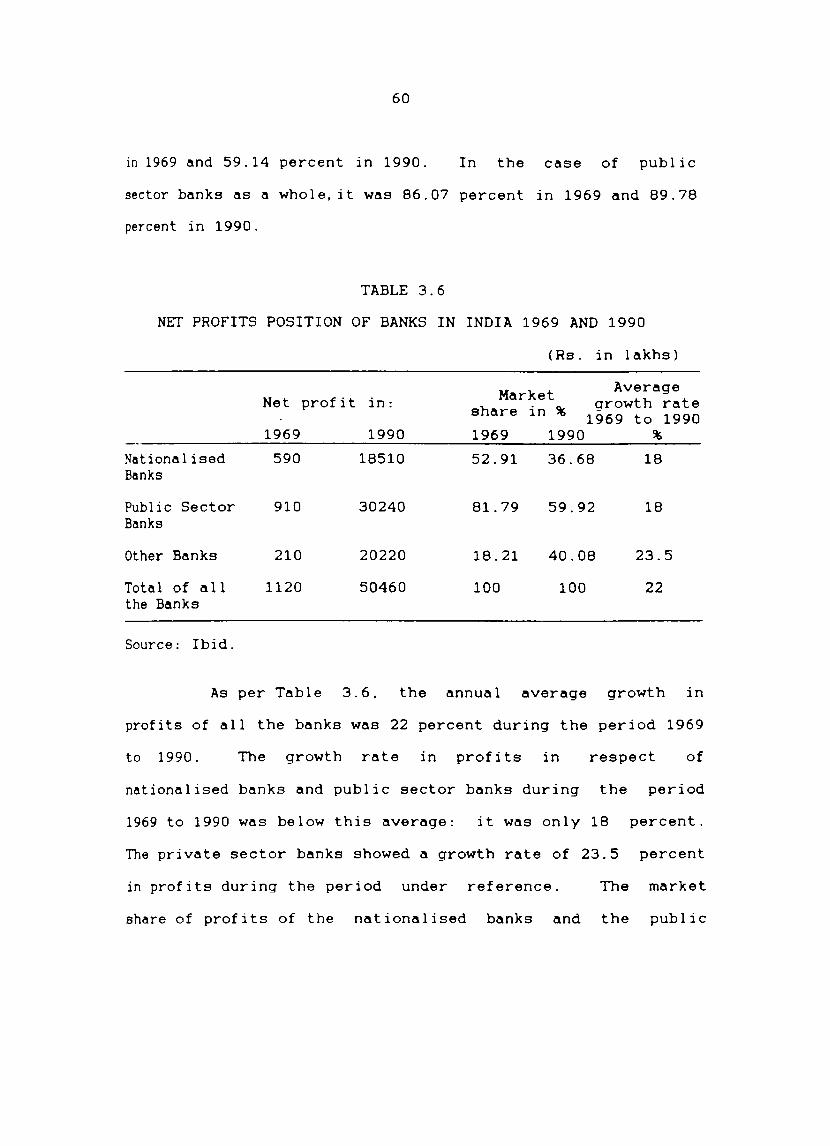
60
in 1969 and 59.14 percent in 1990. In the case of public
sector banks as a whole, it was 86.07 percent in 1969 and 89.78
percent in 1990.
TABLE 3.6
NET PROFITS POSITION OF BANKS IN INDIA 1969 AND 1990
(Rs. in lakhs)
Market Average Net profit in: share in % growth rate
1969 to 1990 1969 1990 1969 1990 %
National ised 590 18510 52.91 36.68 18 Banks
Public Sector 910 30240 81.79 59.92 18 Banks
Other Banks 210 20220 18.21 40.08 23.5
Total of all 1120 50460 100 100 22 the Banks
Source: Ibid.
As per Table 3.6, the annual average growth in
profits of all the banks was 22 percent during the period 1969
to 1990. The growth rate in profits in respect of
nationalised banks and public sector banks during the period
1969 to 1990 was below this average: it was only 18 percent.
The private sector banks showed a growth rate of 23.5 percent
in profits during the period under reference. The market
share of profits of the nationalised banks and the public
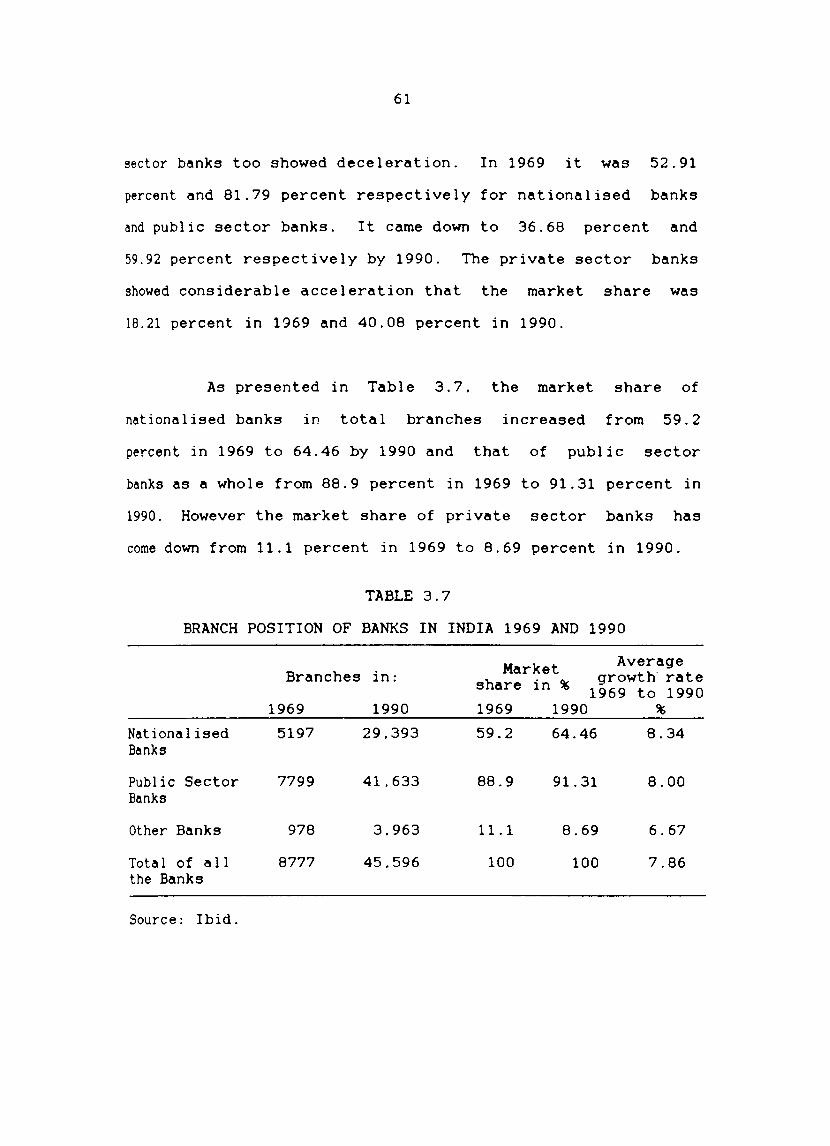
61
sector banks too showed deceleration. In 1969 it was 52.91
percent and 81.79 percent respectively for nationalised banks
and publ ic sector banks. It came down to 36.68 percent and
59.92 percent respectively by 1990. The private sector banks
showed considerable acceleration that the market share was
18.21 percent in 1969 and 40.08 percent in 1990.
As presented in Table 3.7, the market share of
nationalised banks in total branches increased from 59.2
percent in 1969 to 64.46 by 1990 and that of public sector
banks as a whole from 88.9 percent in 1969 to 91.31 percent in
1990. However the market share of private sector banks has
come down from 11.1 percent in 1969 to 8.69 percent in 1990.
TABLE 3.7
BRANCH POSITION OF BANKS IN INDIA 1969 AND 1990
Market Average Branches in: share in %
growth' rate 1969 to 1990
1969 1990 1969 1990 %
National ised 5197 29,393 59.2 64.46 8.34 Banks
Public Sector 7799 41.633 88.9 91. 31 8.00 Banks
Other Banks 978 3.963 11.1 8.69 6.67
Total of all 8777 45,596 100 100 7.86 the Banks
Source: Ibid.
62
3.5 Financial Sector Reforms and the Banking Sector
In August 1991. the Government of India appointed a
high-level committee to look into the structure. organisation
and functions of the financial system. The nine-member
Committee headed by Mr.M. Narasimham. former governor of the
Reserve Bank of India. a deputy governor of the Reserve Bank
of India (Banking operations). Chairmen of State Bank of
India. Industrial Development Bank of India and ICICI. Mr Manu
Shroff. Mr. Y.H. Malegam. Mr. Mrinal Datta Chaudhuri and the
addi t iona 1 secretary. Min istry of Finance (Bank ing) . The
Committee submitted its report on November 16. 1991 to the
Government of India. The Committee (Narasimham Committee)
made a detailed review of the structure. organisation.
functioning and procedure of the financial system and made
recommendations with far reaching effects relating to the
Indian banking system.
The recommendations of the Committee formed the
basis of the Financial Sector Reforms introduced in the
country in 1992-93 and pursued since then to improve the
competitiveness and operational efficiency of the financial
sector. In pursuance of the recommendations of the Narasimham
Committee. the Reserve Bank of India. among other measures of
53
reform. issued new prudential norms relating to income
recognition. classification of assets. provisioning for bad
debts and capital adequacy level to be attained by banks. The
new income recogni tion norms laid down that overdue interest
not actua 11 y rece i ved by banks cannot be shown as accrued.
Norms were also laid down for categorising non-performing
accounts and making provisions for sub-standard. doubtful and
loss-making assets at specified rates. The Statutory
Liquidity Ratio (SLR) for scheduled commercial banks which was
39.5 percent on Apri 1 3. 1992 has been brought down in a
phased manner to 34.24 percent of the outstanding net demand
and time liabilities as on 31st March 1994. It has been
further reduced to 31.50 percent.
Revised formats for balance sheet and
loss accounts of banks have been introduced from
profit
the
health
of
and
year
of
the
1991-92 with a view to reflect the true financial
the banks. To meet the capital requirements
nationalised banks. the Government has provided for funds in
the budgets of 1992-93. 1993-94 and 1994-95 to the extent of
Rs.470000 lakhs. Rs. 570000 lakhs. and Rs.550000 lakhs
respectively. They are also permitted to raise share capital
from the public by maintaining at least 51 percent of the
share capital under government ownership.
64
As a part of the exercise relating to strengthening
md restructuring of the public sector banks. the Government.
on 4th September 1993 merged the loss making New Bank of India
with Punjab National Bank thereby bringing down the number of
nationalised banks to nineteen.
Guidelines for the setting up of new private sector
banks and Special Recovery Tribunals were introduced. The
commercial banks that started under the new guidelines/policy
and are functioning as on 31-3-94 are:
l.
2.
3.
Name of the banks
UTI Bank Ltd.
Indusland Bank Ltd.
ICICI Banking Corporation Itd
Registered office
Ahmedabad
Pune
Baroda
The following new banks have received "in principle"
approval and started functioning since then.
l. HDFC Bank Ltd. Bombay
2. Global Trust Bank Ltd. Secunderabd
3. Bank of Gujarat Ltd. Ahmedabad
4. IDBI Bank Ltd. Indore
5. Bank of Punjab Ltd. Chandigarh
6. Centurion Bank Ltd. Panaji
7. The Times Bank Ltd }"aridabad.
65
In tune with the recommendations of the Narasimham
Conmittee. the Reserve Bank of India granted freedom to banks
to rationalise their existing branch net work by relocating
~anches. opening specialised branches. spinning off business
at other locations. setting up of controlling offices and
establ ishing extension counters. Banks attaining the
prescribed capital adequacy norms and prudential accounting
standards were allowed to set up new branches without prior
approval of the Reserve Bank of India. Of the various
measures introduced as part of the Banking Sector Reforms. the
prudential accounting and capital adequacy standards have in
particular changed the entire complexion and character of
Indian banking. The majority of the nationalised banks as on
31st March 1992 had turned out with good performance. Only
three banks showed a net loss as on 31-3-1992. With the
implementation of the new norms in 1992-93. out of twenty
nationalised banks, thirteen banks reported a net loss: out of
nineteen banks. twelve banks reported a net loss in 1993-94.
Highly profit making banks have shown reduced profits as is
shown in Table 3.8.
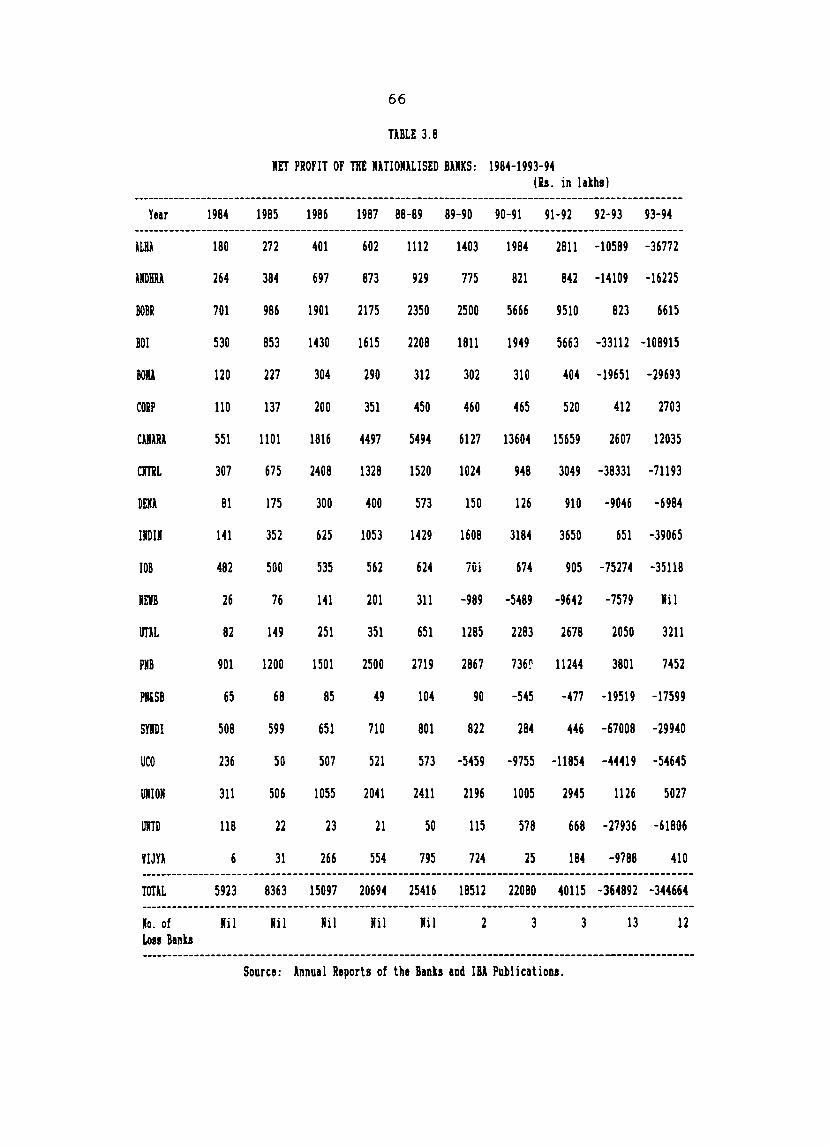
66
TABLE 3.8
NET PROFIT OF THE NATIONALISED BANKS: 1984-1993-94 (Ra. in lakhs)
Year 1984 1985 1986 1987 88-89 89-90 90-91 91-92 92-93 93-94
ALBA 180 272 401 602 1112 1403 1984 2811 -10589 -36772
AIIDHRA 264 384 697 873 929 775 821 842 -14109 -16225
BOBR 701 986 1901 2175 2350 2500 5666 9510 823 6615
BOI 530 853 1430 1615 2208 1811 1949 5663 -33112 -108915
BOO 120 227 304 290 312 302 310 404 -19651 -29693
COIP 110 137 200 351 450 460 465 520 412 2703
cmu 551 1101 1816 4497 5494 6127 13604 15659 2607 12035
CJTRL 307 675 2408 1328 1520 1024 948 3049 -38331 -71193
DEn 81 175 300 400 573 150 126 910 -9046 -6984
mm 141 352 625 1053 1429 1608 3184 3650 651 -39065
lOB 482 500 535 562 624 iOi 674 905 -75274 -35118
MEn 26 76 141 201 311 -989 -5489 -9642 -7579 Mil
UTAL 82 149 251 351 651 1285 2283 2678 2050 3211
901 1200 1501 2500 2719 2867 736~ 11244 3801 7452
pmB 65 68 85 49 104 90 -545 -477 -19519 -17599
srn! 508 599 651 710 801 822 284 446 -67008 -29940
UCO 236 50 507 521 573 -5459 -9755 -11854 -44419 -54645
UNION 311 506 1055 2041 2411 2196 1005 2945 1126 5027
urn 118 22 23 21 50 115 578 668 -27936 -61806
VIJYA 6 31 266 554 795 724 25 184 -9788 410
TOTAL 5923 8363 15097 20694 25416 18512 22080 40115 -364892 -344664
ID. of Nil Nil Nil Mil Nil 2 3 3 13 12 Loss Banks
Source: Annual Reports of the Banks and IBA Publications.
67
However the picture is quite different if the rate
of growth in net profit is considered. All the nationalised
banks reported negative growth in net profits during the year
1992-93 (See Table 6.4 in chapter VI).
The reform process the Indian banks are now passing
through has been experienced by many countries of the world.
both developed and developing like the USA. Spain. Colombia.
Chile. Thailand. Philippines. Malaysia. Guinea. etc. From the
experience of the developed and developing countries. the
success of Indian banking in the era of transformation would •
depend on how effectively the individual banks function.
Though with deficiencies. the banking sector in
India has succeeded in extending the banking and financial
facilities to a cross section of the people by receiving
deposits through attractive schemes and lending them in
conformity with the priorities. This is all the more true in
the case of nationalised banks. The nationalised banks occupy
the dominant position in the major business parameters viz.
deposits. advances and also in branch position.
Table 3.9 presents the relative position of the
different banking groups in the country as on 31st March 1994.
68
There are 275 banks in the country with a net work of 61852
branches. Nationalised banks account for 49.2 percent of the
branches. The share of deposits and advances of the
nationalised banks is almost in conformity with their market
share in branches. They ha¥e 57.1 percent share in total
deposits and 51.8 percent share in total advances. The public
sector banks constituting the nationalised banks and the State
Bank of India group have a net work of 43161 branches with a
market share of 69.8 percent in total branches. and deposits
and advances to the extent of Rs.2.67.46.800 lakhs and
Rs.l.53.70.000 lakhs respectively as on 31st March 1994. The
market share of the public sector banks in deposits and
advances on 31-3-1994 are 84.1 percent and 85.4 percent
respectively. The dominant position of the public sector
banks in the Indian commercial banking scenario and the
relative position of the other banking groups are revealed in
Table 3.9.
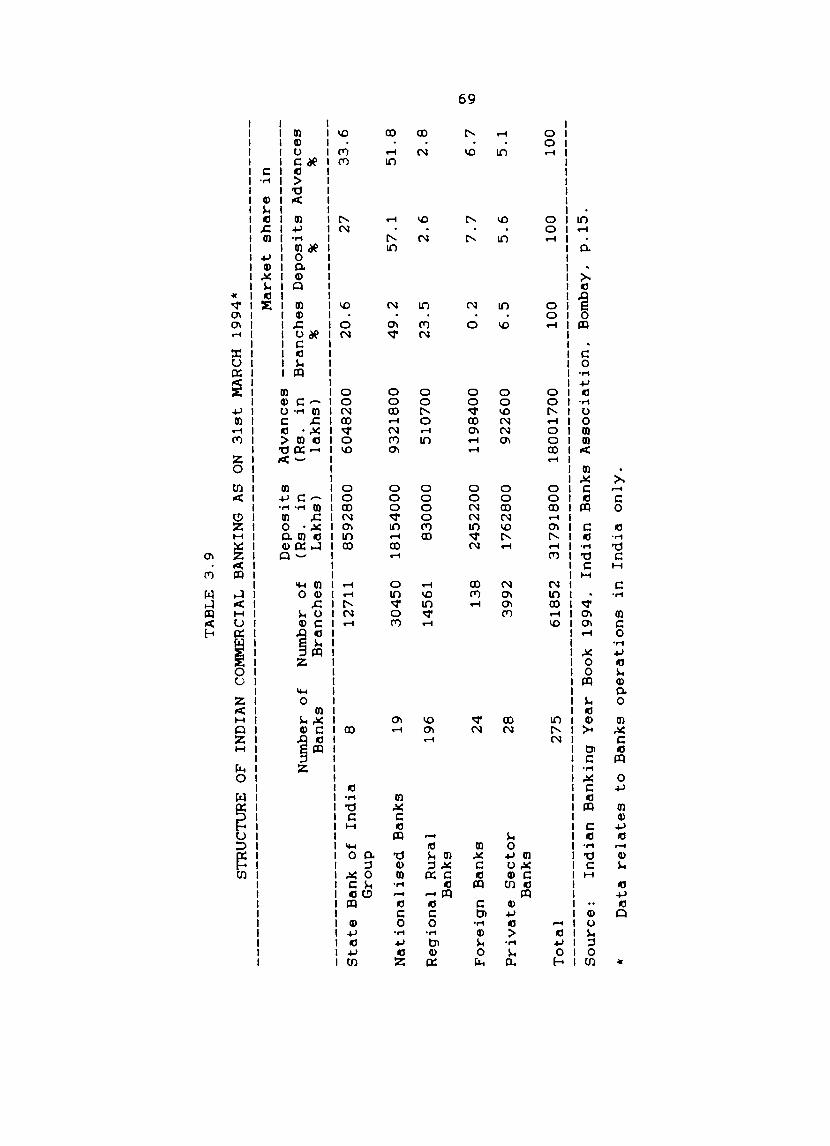
TA
BL
E
3.9
STR
UC
TU
RE
O
F IN
DIA
N
CO
MM
ERC
IAL
BA
NK
ING
A
S O
N
31
st
MA
RCH
1
99
4*
Nu
mb
er
of
Ban
ks
Nu
mb
er
of
Bra
nch
es
Dep
osi
ts
(Rs.
in
L
ak
hs)
Mark
et
sh
are
in
A
dv
ance
s ---------------------------
(Rs.
in
B
ran
ch
es
Dep
osi
ts
Ad
van
ces
lak
hs)
%
%
%
--
----
----
----
----
----
----
----
----
----
----
----
----
----
----
----
----
----
----
----
----
----
--S
tate
B
ank
o
f In
dia
8
12
71
1
85
92
80
0
60
48
20
0
20
.6
27
3
3.6
G
rou
p
Nati
on
ali
sed
B
ank
s 1
9
30
45
0
18
15
40
00
9
32
18
00
4
9.2
5
7.1
5
1. 8
Reg
ion
al
Ru
ral
19
6
14
56
1
83
00
00
5
10
70
0
23
.5
2.6
2
.8
Ban
ks
Fo
reig
n
Ban
ks
24
1
38
2
45
22
00
1
19
84
00
0
.2
7.7
6
.7
Pri
vate
S
ecto
r 2
8
39
92
1
76
28
00
9
22
60
0
6.5
5
.6
5.1
B
ank
s
To
tal
27
5
61
85
2
31
79
18
00
1
80
01
70
0
10
0
10
0
10
0
So
urc
e:
Ind
ian
B
an
kin
g
Year
Bo
ok
1
99
4,
Ind
ian
B
ank
s A
sso
cia
tio
n,
Bo
mb
ay,
p.1
5.
* D
ata
re
late
s
to
Ban
ks
op
era
tio
ns
in
Ind
ia
on
ly.
C7I
ID
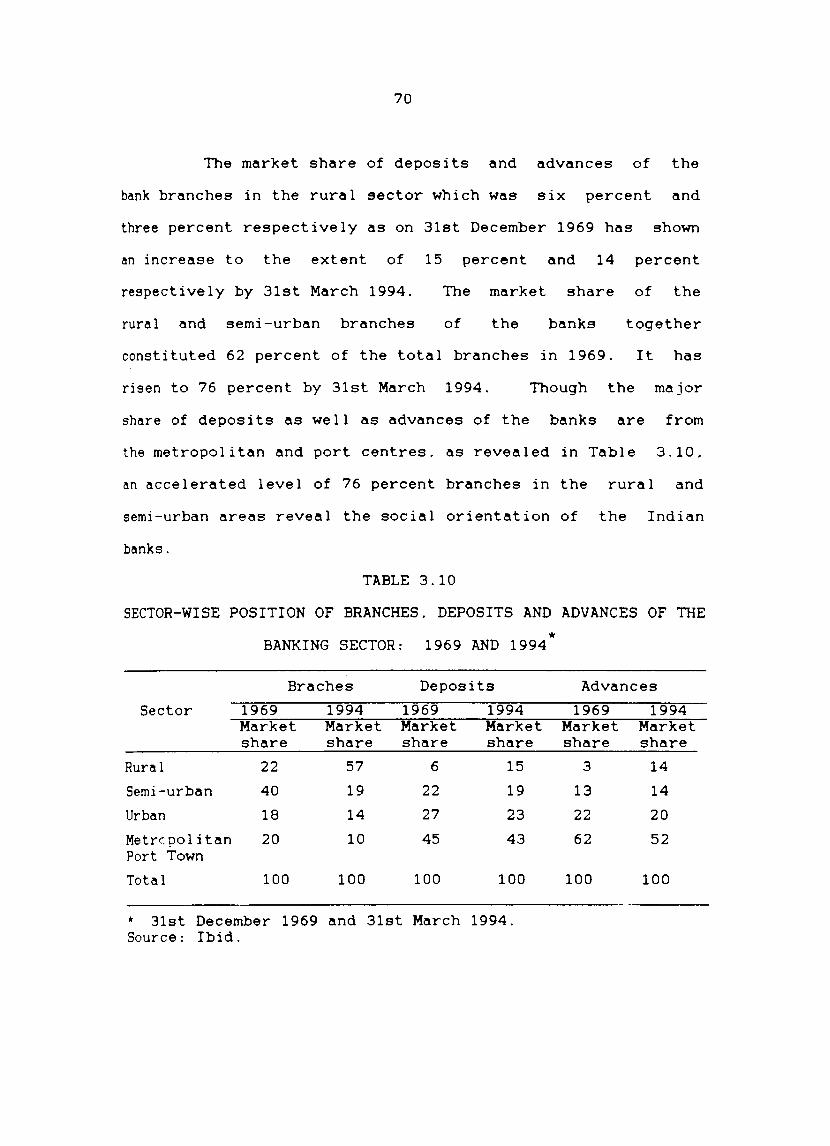
70
The market share of deposits and advances of the
bank branches in the rural sector which was six percent and
three percent respectively as on 31st December 1969 has shown
an increase to the extent of 15 percent and 14 percent
respectively by 31st March 1994. The market share of the
rura I and semi -urban branches of the banks together
consti tuted 62 percent of the tota I branches in 1969. It has
risen to 76 percent by 31st March 1994. Though the major
share of deposits as well as advances of the banks are from
the metropolitan and port centres, as revealed in Table 3.10,
an accelerated level of 76 percent branches in the rural and
semi-urban areas reveal the social orientation of the Indian
banks.
TABLE 3.10
SECTOR-WISE POSITION OF BRANCHES, DEPOSITS AND ADVANCES OF THE
* BANKING SECTOR: 1969 AND 1994
Braches Deposits Advances
Sector 1969 1994 1969 1994 1969 1994 Market Market Market Market Market Market share share share share share share
Rural 22 57 6 15 3 14
Semi-urban 40 19 22 19 13 14
Urban 18 14 27 23 22 20
Metrcpol i tan 20 10 45 43 62 52 Port Town
Total 100 100 100 100 100 100
* 31st December 1969 and 31st March 1994. Source: Ibid.

71
The achievements of the Indian banking system are
~ique in many respects. However. considering the needs of
the Indian economy and its population. banks have still a long
way to go.
CHAPTER IV
A PROFILE OF SYNDICATE BANK
Founded in a small town in South Kanara District in
1925. Syndicate Bank today occupies a prominent position among
the nationalised banks in the country. Serving the common man
has been the forte of Syndicate Bank from the very beginning.
It has inculcated the saving habits among a large section of
the Indian rural society. The Bank considered that 'No man is
too small for a bank account'. It has come to be recognised
dS the 'small man's big bank'. The nationalisation of the
Bank in 1969 has enabled it to pursue its various programmes
with the backing and support of the state.
4.1 Emblem and Motto
Since the early thirties. the logo of the Bank was
the letter CIBS (Canara Industrial and Banking Syndicate)
interlocked and positioned in a circle. with the words
'Service'. 'Security' and 'Sincerity'. In 1965. a more
animate emblem was adopted by selecting a dog. the most
faithful animal in the world in a sitting posture. within a
circle with the words - 'Faithful and Friendly' written
around the circle.
The Bank treats its customers in an extremely polite
and courteous manner and lends an attentive ear to their
problems and a helping hand with their solut~ons. "Service
73
with a smi le" is essential for good banking service.
Syndicate Bank is the best example to be cited in serving the
people in the very best way. Their emblem containing the
picture of a faithful and friendly animal i.e .. the dog
indicates the motto and the way in which they deal with the
public. The dog is identified as a companion and a
trustworthy and faithful servant. So is the Syndicate Bank.
It serves its masters. i.e .. the customers in a most friendly
and faithful manner.
4.2 Genesis of the Bank
The genesis of Syndicate Bank may be traced back to
the efforts of Mr. Upendra Ananth Pai. a handloom businessman
who wanted to solve the financial problems of the poor weavers
in and around Udupi in South Kanara District of Karnataka
state. He. with the active support of three of his brothers.
Mr.T. Purushottama Pai. Dr. T.M.A. Pai and Mr. T.R.A. Pai.
started a joint stock bank called the "Canara Industrial &
Banking Syndi cate Limi ted" . It was registered on 20th October
1925. The three founder directors of the Bank were.
Mr.Upendra Ananth Pai. Mr. V.S. Kudva and Dr. T.M.A. Pai a
businessman. an engineer and a doctor respectively. Among the
early shareholders there were quite a large number of weavers
also.
74
4.3 Development of the Bank: Pre-Nationaliaation Period
The business of the Bank commenced on 10th .November
1925 in a small room in Udupi with only one employee. The
P.A. Pai Brothers were the managing agents of the Bank. The
authorised capital of the Bank was one lakh rupees and the
paid up capital was Rs.8,OOO/-.
During the first year of its operation the Bank's
deposits amounted to Rs.5.758/- and the advances stood at
Rs.11,142/-. There were no restrictions then regarding the
ratio between the deposits and the advances. The lending
policy of the Bank was firmly based on the philosophy of
catering to the common man's needs. In 1926~the Bank earned a
net profit of Rs.978/- enabling it to pay a dividend of 61/.
per cent for the year.
In 1928 the Bank took up "branch banking". The
first branch of the Bank was opened at Brahmavar, a village
about 13 kilometers from Udupi. In 1928 the Bank started the
'Pigmy' Deposit Scheme. Under this scheme, an amount as low
as two annas (Rs.O.12) could be deposited by
daily for a period of seven years to receive
amount with attractive rate of interest.
collected by the Pigmy collectors from the
the depositor
a cumulative
The deposits
doors of the
depositors have contributed abundantly to the popularisation
of banking habits among the poor sections of society. To
75
provide greater incentives to save. the Bank in the early
thirties introduced the "prize chitties" in which prizes were
given on monthly draws. "Laxmi Cash Certificates" and 11 Laxrni
Provident Deposi t" were some of the other saving schemes
introduced by the Bank during the early periods to mobilise
savings.
During the first decade of its operations
has extended its attention to the land market and
the
the
Bank
life
insurance. In order to arrest the decline in the land values
due to depression. a land investment company known as the
Canara Land Investments Limited. was established by Dr. T.M.A.
Pai and his associates. The Bank rendered all help to promote
the company and was ap~vlnted as the managers of this company.
To mitigate the economic problems arising out of the the
sudden demise of the bread winner of the family. the Pai's in
1935 establ ished an insurance company by name "The Canara
Mutua 1 Assurance Company Limi ted" .
its Secretaries. The financial
The Bank was appointed as
position of the Bank
considerably improved with the deposits reaching a level of
Rs.14.13 lakhs in 1935. Similarly. the spurt in advances was
remarkable - from Rs. 0.11 lakhs in 1926 to Rs.14.10 lakhs in
1935. The investment of the Bank at the end of 1935 amounted
to Rs.3.24 lakhs. Details of a few selected indicators of
growth of Syndicate Bank from 1926 to 1935 is shown in Table
4.1.
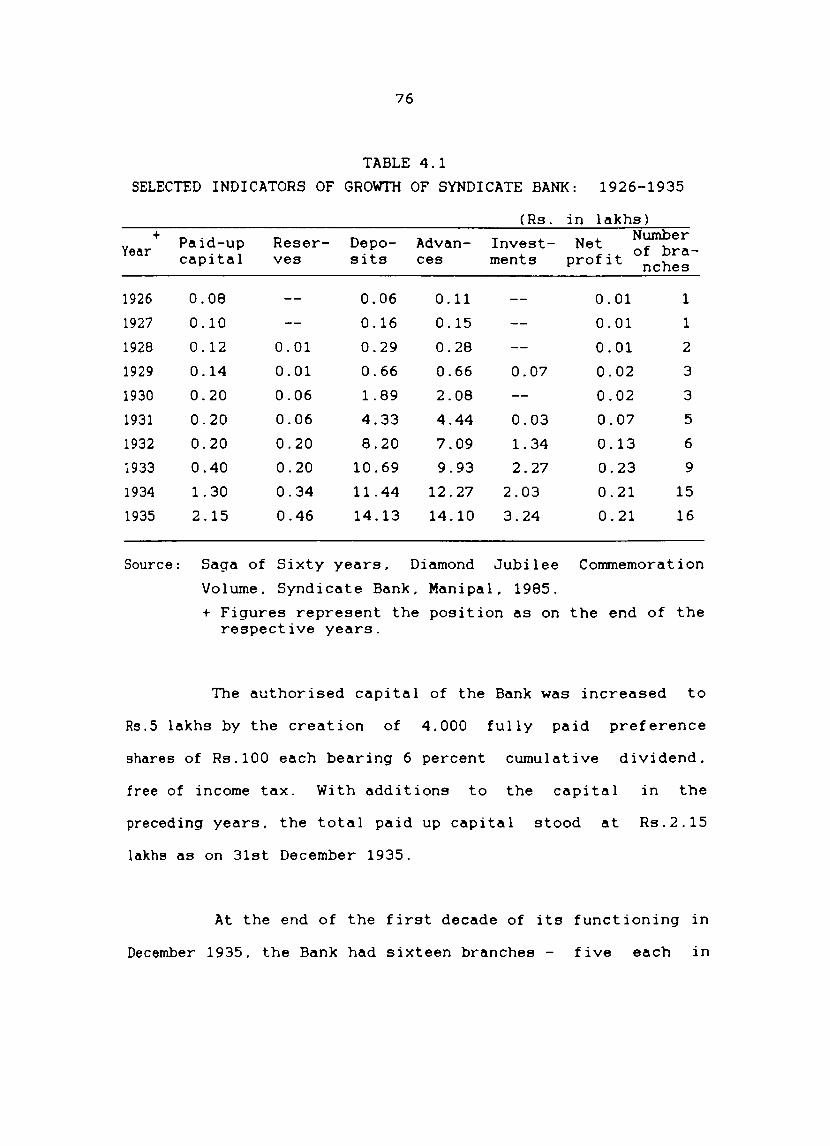
76
TABLE 4.1
SELECTED INDICATORS OF GROWTH OF SYNDICATE BANK: 1926-1935
(Rs. in lakhs) + Paid-up Reser- Depo- Advan- Invest-
Number Year Nei. of bra-
capital ves sits ces ments pro It nches
1926 0.08 0.06 0.11 0.01 1
1927 0.10 0.16 0.15 0.01 1
1928 0.12 0.01 0.29 0.28 0.01 2
1929 0.14 0.01 0.66 0.66 0.07 0.02 3
1930 0.20 0.06 1.89 2.08 0.02 3
1931 0.20 0.06 4.33 4.44 0.03 0.07 5
1932 0.20 0.20 8.20 7.09 1. 34 0.13 6
1933 0.40 0.20 10.69 9.93 2.27 0.23 9
1934 1. 30 0.34 11.44 12.27 2.03 0.21 15
1935 2.15 0.46 14.13 14.10 3.24 0.21 16
Source: Saga of Sixty years. Diamond Jubilee Commemoration
Volume. Syndicate Bank. Manipal. 1985.
+ Figures represent the position as on the end of the respective years.
The authorised capital of the Bank was increased to
Ra.5 lakhs by the creation of 4.000 fully paid preference
shares of Rs.100 each bearing 6 percent cumulative dividend.
free of income tax. With additions to the capital in the
preceding years. the total paid up capital stood at Rs.2.15
lakhs as on 31st December 1935.
At the end of the first decade of its functioning in
December 1935. the Bank had sixteen branches - five each in
77
South Kanara and North Kanara and the remaining in other parts
of the country.
In the second decade of 1936-1945. a number of
changes took place in the management. status and business
operations of the Bank. The authorised capital was increased
from Rs.5 lakhs to Rs.10 lakhs. The paid up capital became
Rs.3.68 lakhs as on 31st December
and reached Rs. 2 . 10 I akhs . The
1937; the reserves improved
Bank was included in the
Second Schedule of the Reserve Bank of India Act from June 18.
1937. With the opening of its Bombay branch in 1937.
Syndicate Bank became a member of the Bombay clearing house.
As the amendment to the Indian Companies Act 1936
prohibited banking companies from managing other companies and
banking companies being managed by managing agents. the Canara
Industrial and Banking Syndicate Limited severed its
connections with Canara Land Investments Limited and Canara
Mutual Assurance Company Limited in January 1939. The P.A.Pai
Brothers retired as the Managing Agents in January 1939 and
Dr. T.M.A. Pai became the Chairman and Managing Director of
the Bank since then.
It was felt by the Bank that instead of developing a
monolithic organisation. it would be better to decentralise
its operations by promoting subsidiary banks. Accordingly.
the Bank promoted the Southern India Apex Bank Limited with
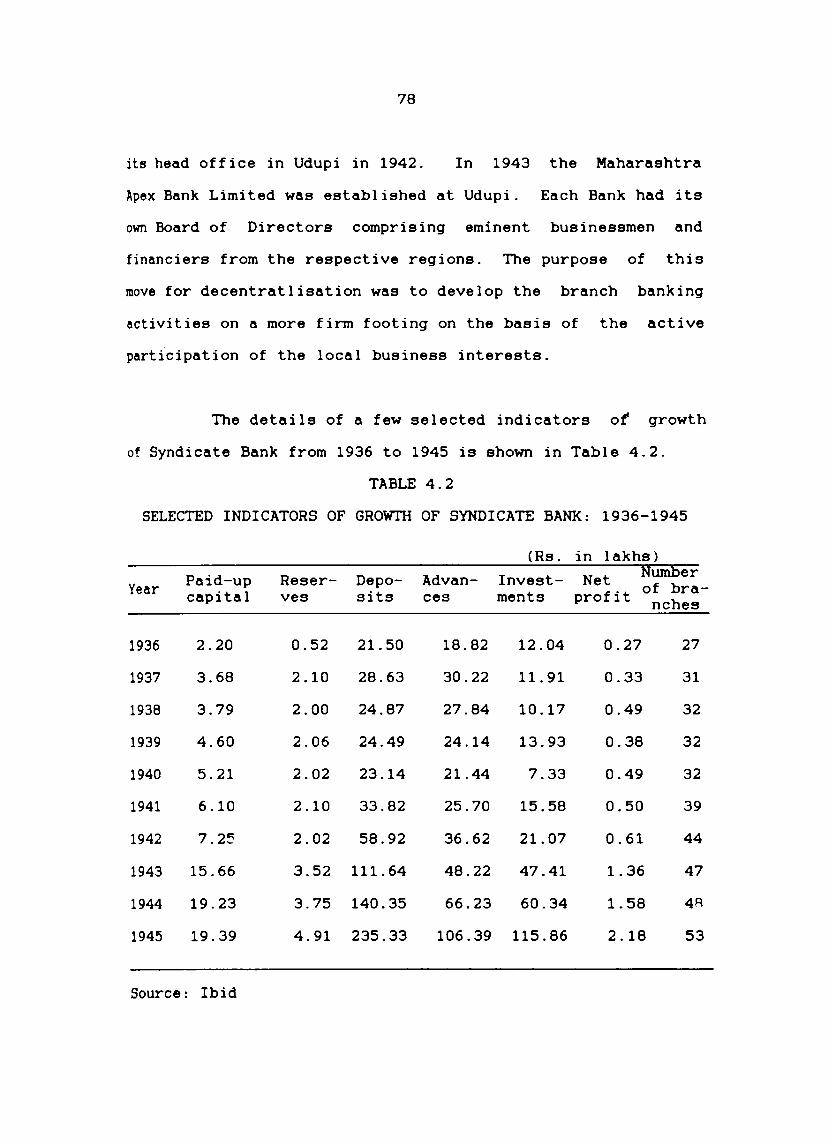
78
its head office in Udupi in 1942. In 1943 the Maharashtra
Apex Bank Limited was established at Udupi. Each Bank had its
own Board of Directors comprising eminent businessmen and
financiers from the respective regions. The purpose of this
move for decentratlisation was to develop the branch banking
activities on a more firm footing on the basis of the active
part{cipation of the local business interests.
The details of a few selected indicators of growth
of Syndicate Bank from 1936 to 1945 is shown in Table 4.2.
TABLE 4.2
SELECTED INDICATORS OF GROWTH OF SYNDICATE BANK: 1936-1945
Year
1936
1937
1938
1939
1940
1941
1942
1943
1944
1945
Paid-up capital
2.20
3.68
3.79
4.60
5.21
6.10
7.2~
15.66
19.23
19.39
Source: Ibid
Reserves
Deposits
0.52 21.50
2.10 28.63
2.00 24.87
2.06 24.49
2.02 23.14
2.10 33.82
2.02 58.92
3.52 111. 64
3.75 140.35
4.91 235.33
Advances
(Rs.
Investments
18.82 12.04
30.22 11.91
27.84 10.17
24.14 13.93
21.44 7.33
25.70 15.58
36.62 21.07
48.22 47.41
66.23 60.34
106.39 115.86
in lakhs) Net NUJnber
f.t of brapro 1 nches
0.27 27
0.33 31
0.49 32
0.38 32
0.49 32
0.50 39
0.61 44
1.36 47
1.58 4R
2.18 53
79
The deposits increased from Rs.21.50 lakhs in 1936
to Rs. 235.33 1 akhs in 1945. The advances as we 11 as the
investments crossed a hundred lakhs level generating a net
profit of Rs.2.18 lakhs as on 31st December 1945.
In 1946 Syndicate Bank with its rural orientation
and its commitment to improve the lot of the rural masses. has
decided to open a large number of its branches in the rural
areas with a population of less than 5000. Selecting a group
of villages from the coastal and interior parts of Karnataka.
twenty seven branches were opened during the year 1946. of
which twenty were opened on a single day.
appointing full-fledged managers for the new bank
prominent person of the '.'111 age was appo inted
Instead of
offices. a
as "rural
representative" in-charge of the branch on a commission basis.
To organise the banking sector in the country in a
uniform manner conducive to the growing needs of the economy.
the Banking Companies Act 1949 was passed by the Government of
India. Soon after independence. Syndicate Bank seriously
considered the issue of taking over smaller banks in the
country. In 1953. the assets and liabilities of the Southern
India Apex Bank Limited and the Maharashtra Apex Bank Limited
were taken over by Syndicat~ Bank. Through the process of
merger. the Bank added eight new branches to its existing
group of branches.
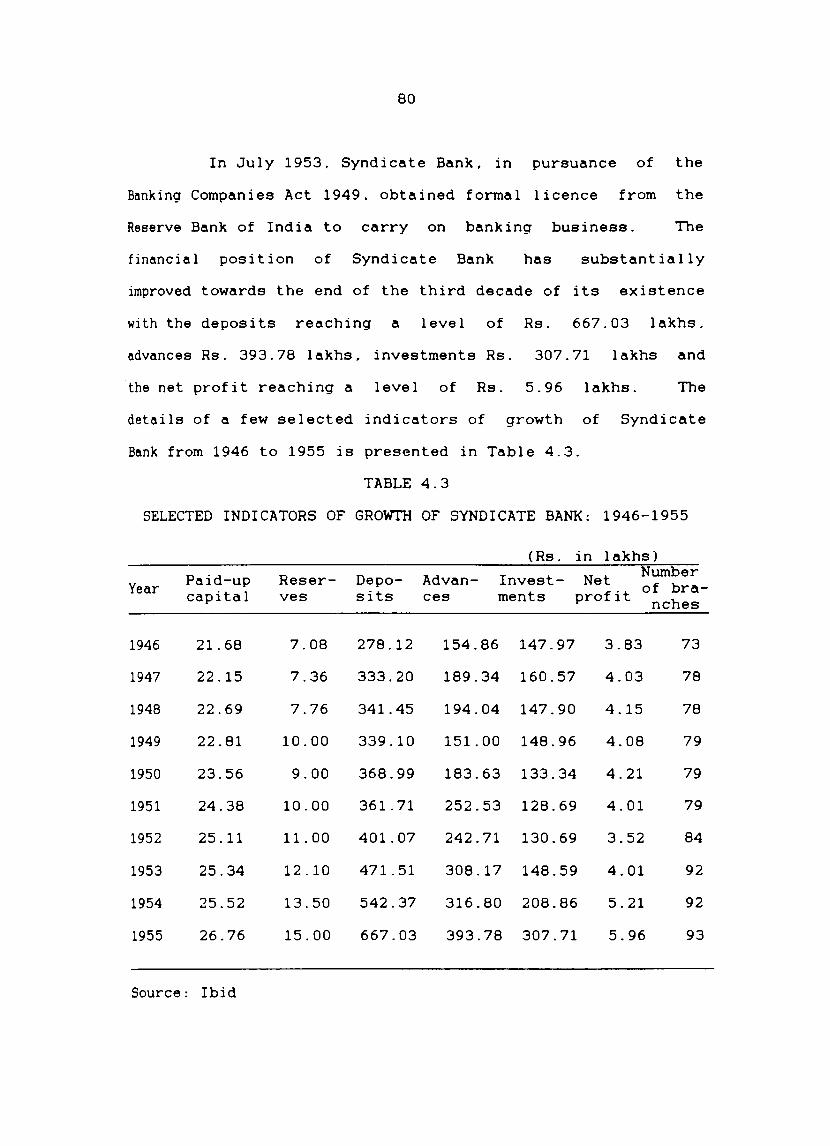
80
In July 1953. Syndicate Bank, in pursuance of the
Banking Companies Act 1949. obtained formal licence from the
Reserve Bank of India to carry on banking business. The
financial position of Syndicate Bank has substantially
improved towards the end of the third decade of its existence
with the deposits reaching a level of Rs. 667.03 lakhs,
advances Rs. 393.78 lakhs, investments Rs. 307.71 lakhs and
the net profit reaching a level of Rs. 5.96 lakhs. The
details of a few selected indicators of growth of Syndicate
Bank from 1946 to 1955 is presented in Table 4.3.
TABLE 4.3
SELECTED INDICATORS OF GROWTH OF SYNDICATE BANK: 1946-1955
Year
1946
1947
1948
1949
1950
1951
1952
1953
1954
1955
Paid-up capital
21. 68
22.15
22.69
22.81
23.56
24.38
25.11
25.34
25.52
26.76
Source: Ibid
Reserves
7.08
7.36
7.76
10.00
9.00
10.00
11.00
12.10
13.50
15.00
Deposits
278.12
333.20
341.45
339.10
368.99
361.71
401.07
471.51
542.37
667.03
(Rs. in lakhs)
Advances
Investments
Net Number f't of bra
pro 1 nches
154.86 147.97 3.83 73
189.34 160.57 4.03 78
194.04 147.90 4.15 78
151.00 148.96 4.08 79
183.63 133.34 4.21 79
252.53 128.69 4.01 79
242.71 130.69 3.52 84
308.17 148.59 4.01 92
316.80 208.86 5.21 92
393.78 307.71 5.96 93
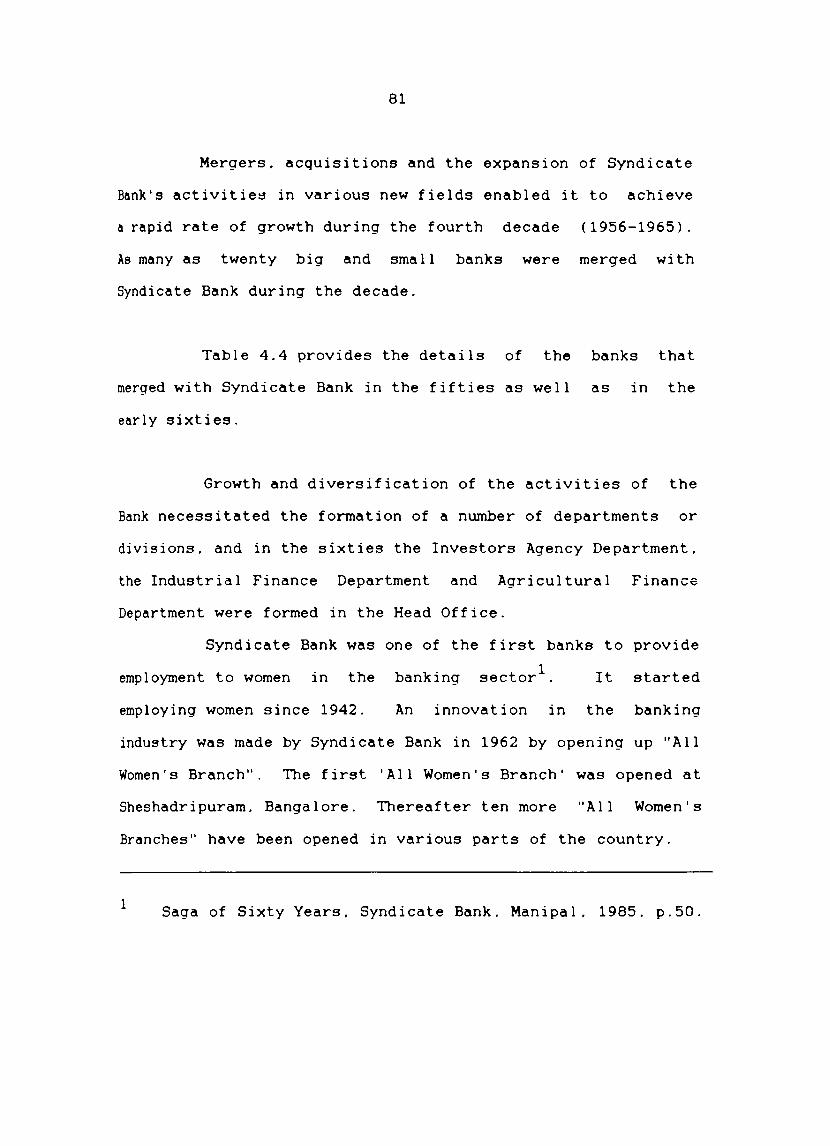
81
Mergers. acquisitions and the expansion of Syndicate
Bank's activitie~ in various new fields enabled it to achieve
a rapid rate of growth during the fourth decade (1956-1965).
As many as twenty big and small banks were merged with
Syndicate Bank during the decade.
Table 4.4 provides the details of the banks that
merged with Syndicate Bank in the fifties as well as in the
early sixties.
Growth and diversification of the activities of the
Bank necessitated the formation of a number of departments or
divisions. and in the sixties the Investors Agency Department.
the Industrial Finance Department and Agricultural Finance
Department were formed in the Head Office.
Syndicate Bank was one of the first banks to provide
employment to women in the banking sector1. It started
employing women since 1942. An innovation in the banking
industry was made by Syndicate Bank in 1962 by opening up "All
Women's Branch". The first 'All Women's Branch' was opened at
Sheshadripuram. Bangalore. Thereafter ten more "All Women's
Branches" have been opened in various parts of the country.
1 Saga of Sixty Years. Syndicate Bank. Manipal. 1985. p.50.
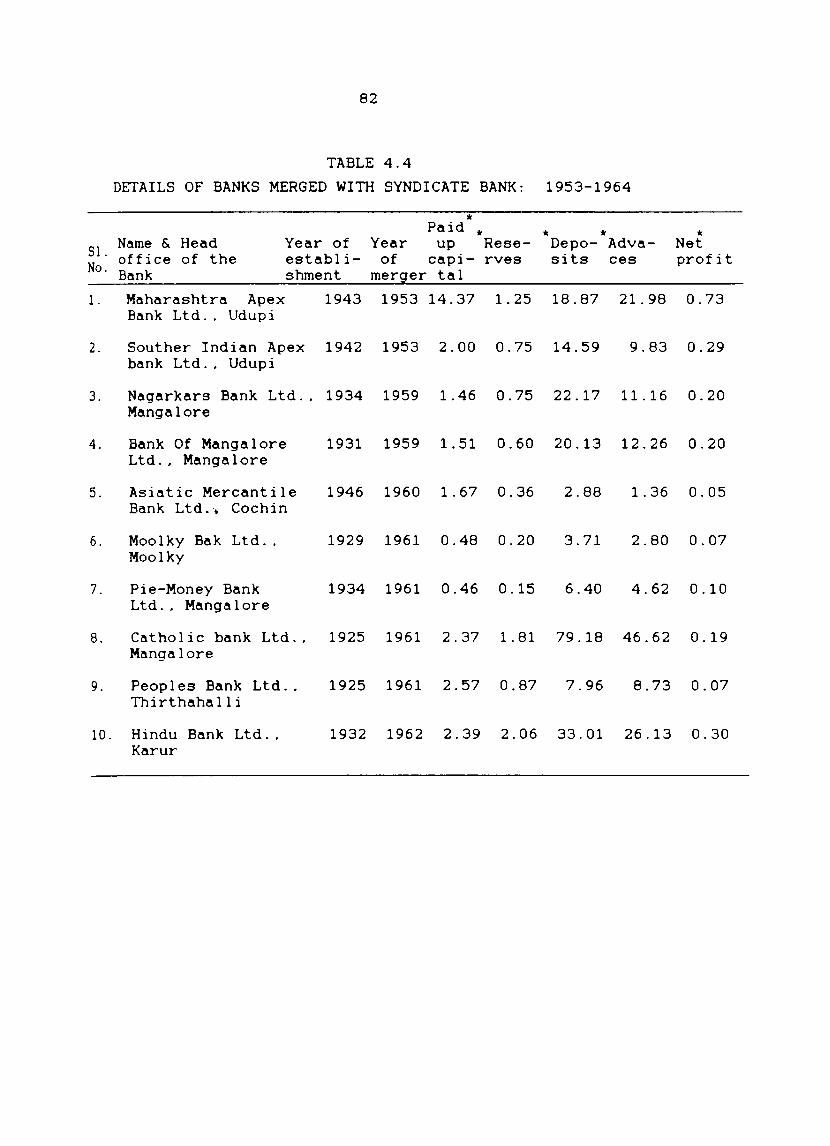
82
TABLE 4.4
DETAILS OF BANKS MERGED WITH SYNDICATE BANK: 1953-1964
Name &. Head S1. office of the No. Bank
* Paid * Year of Year up Reseestabli- of capi- rves shment merger tal
* * Depo- Adva-sits ces
* Net profit
1. Maharashtra Apex Bank Ltd .. Udupi
1943 1953 14.37 1.25 18.87 21.98 0.73
2. Souther Indian Apex 1942 1953 2.00 0.75 14.59 bank Ltd .. Udupi
9.83 0.29
3. Nagarkars Bank Ltd .. 1934 1959 1.46 0.75 22.17 11.16 0.20 Mangalore
4. Bank Of Mangalore 1931 1959 1.51 0.60 20.13 12.26 0.20 Ltd .. Manga lore
5. Asiatic Mercantile 1946 1960 1.67 0.36 2.88 1.36 0.05 Bank Ltd.~ Cochin
6. Moolky Bak Ltd.. 1929 1961 0.48 0.20 3.71 2.80 0.07 Moolky
7. Pie-Money Bank 1934 1961 0.46 0.15 6.40 4.62 0.10 Ltd .. Manga lore
8. Catholic bank Ltd.. 1925 1961 2.37 1.81 79.18 46.62 0.19 Mangalore
9. Peoples Bank Ltd.. 1925 1961 2.57 0.87 7.96 8.73 0.07 Thirthahalli
10. Hindu Bank Ltd.. 1932 1962 2.39 2.06 33.01 26.13 0.30 Karur
83
1<
Paid 1< 1< 1< 1<
SI. Name & Head Year of Year up Rese- Depo- Adva- Net
No. office of the establi- of capi- rves sits ces profit Bank shment merger tal
11. Salem Ammapet 1933 1962 0.50 0.49 5.34 3.88 0.13
SaganderBank Ltd .. Salem
12. Kerala Service Bank 1928 1962 5.25 0.50 35.39 21.97 0.64
Ltd .. Trivandrurn
13. Citizen's Bank Ltd .. 1937 1963 0.80 0.45 4.48 1. 75 Robertsonpet
14. Pollachi Town Bank 1917 1963 0.53 0.55 2.97 2.23 0.05 Ltd .. Pollachi
15. Coimbatore Sri 1927 1963 0.36 0.39 4.89 2.69 0.05 Kannikaparameshawari Bank Ltd .. Coimbatore
16. The Oriental Union 1929 1964 0.62 0.11 0.83 1.18 0.10 Bank Ltd .. Kaduthuruthy
17. The Kottagiri Bank 1929 1964 0.45 0.59 1.34 0.05 0.07 Ltd .. Kottagiri
18. Sri Ranga Raja Bank 1921 1964 0.40 0.24 0.60 0.30 Ltd .. Mettupalayam
19. The Kothamangalam 1929 1964 0.35 0.26 2.96 2.20 0.03 Namboodiri Bank Ltd .. Quilandy
20. The South Travancore 1929 1964 0.58 0.12 2.21 1.17 0.01 bank Ltd .. Neyyoor
Source: Ibid
84
In April 1963. Syndicate Bank obtained licence from
the Reserve bank of India to do foreign exchange business.
The foreign Exchange Division of the Bank is located in Oberoi
Centre. Bombay.
The name of the Bank was changed in 1964. Its name
was changed into "Syndicate Bank Limited" from 1st January
1964. The expansion in the number of departmp.nts and
personnel created the need for a more spacious office
accommodation for the Bank. The Head Office of the Bank was
shifted from Udupi to the present building at Manipal in 1964.
Syndicate Bank is the only bank of its size in the country
which has its Head Office in a remote rural area2 .
Through mergers. amalgamations. consolidations. and
through growth and diversification. Syndicate Bank grew into a
big bank towards the end of the decade 1956-1965. Table 4.5
presents the details of a few selected indicators of growth of
Syndicate Bank from 1956-1965.
2 Ibid. p.51.
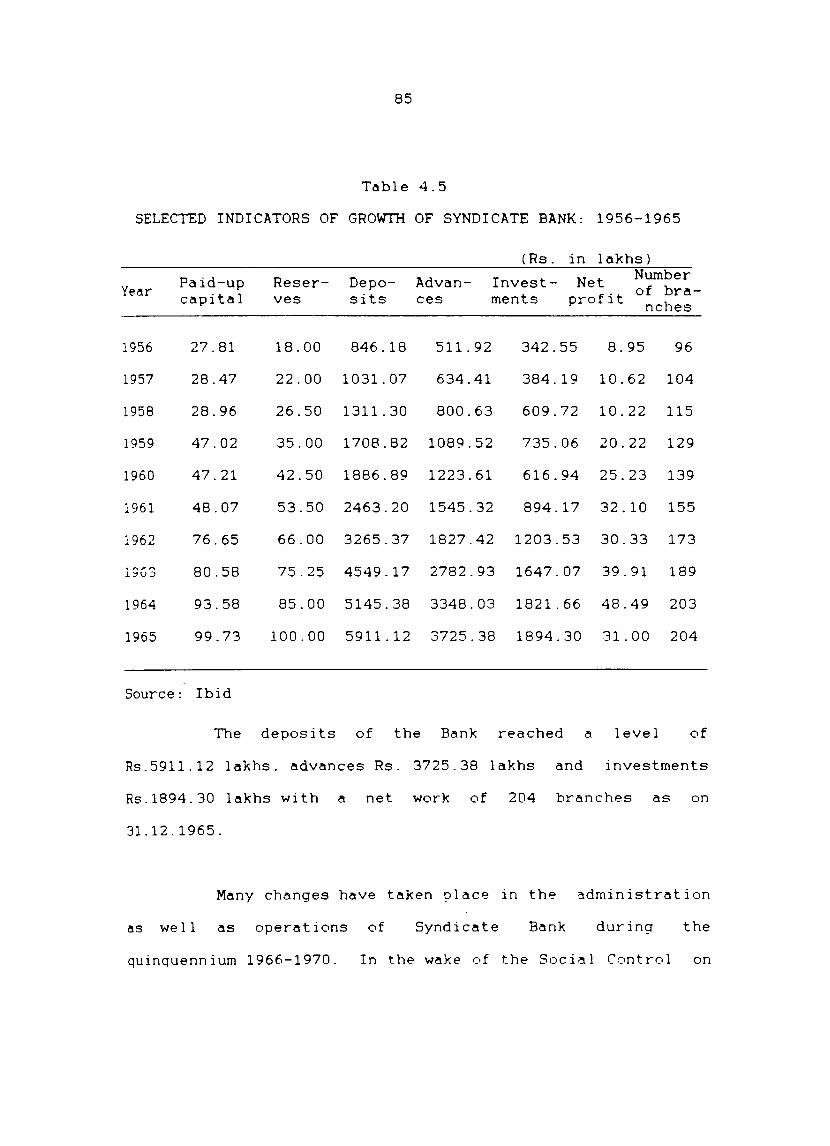
85
Table 4.5
SELECTED INDICATORS OF GROWTH OF SYNDICATE BANK: 1956-1965
(Rs. in lakhs)
Paid-up Reser- Depo- Advan- Invest- Net Number Year of bra-capital ves sits ces ments profit nches
1956 27.81 18.00 846.18 511.92 342.55 8.95 96
1957 28.47 22.00 1031.07 634.41 384.19 10.62 104
1958 28.96 26.50 1311.30 800.63 609.72 10.22 115
1959 47.02 35.00 1708.82 1089.52 735.06 20.22 129
1960 47.21 42.50 1886.89 1223.61 616.94 25.23 139
1961 48.07 53.50 2463.20 1545.32 894.17 32.10 155
1962 76.65 66.00 3265.37 1827.42 1203.53 30.33 173
19G3 80.58 75.25 4549.17 2782.93 1647.07 39.91 189
1964 93.58 85.00 5145.38 3348.03 1821.66 48.49 203
1965 99.73 100.00 5911.12 3725.38 1894.30 31.00 204
Source: Ibid
The deposits of the Bank reached a level of
Rs.5911.12 lakhs. advances Rs. 3725.38 lakhs and investments
Rs.1894.30 lakhs with a net work of 204 branches as on
31.12.1965.
Many changes have taken place in the administration
as well as operations of Syndicate Bank during the
quinquennium 1966-1970. In the wake of the Social Control on
86
banks introduced in December 1967, Syndicate Bank
reconstituted its Board of Directors giving adequate
representation to various interests. The Bank's operations
during the years of Social Control, as in the past, were in
conformity with the framework recommended by the National
credit Council for the implementation of the Social
Objectives. As on 31st December 1968, the paid up capital of
Syndicate Bank stood at Rs. 136.33 lakhs, reserves Rs. 157.76
lakhs, deposits Rs. 11219.26 lakhs, advances Rs.7060.98 lakhs
jnd investments Rs.3113.31 lakhs. It had a net work of 254
branches, mostly rural and semi-urban as on 31.12.1968.
4.4 Development of the Bank - Post nationalisation Period
It was on July 19, 1969 that the Government of India
nationalised the Bank along with thirteen other leading
commercial banks in the country.
During the post-nationalisation period, Syndicate
Bank was able to achieve all round progress by expandiD~ ;+~
activities in deposit mobilisation, credit disbursement, and
also in extending its net work of branches far and wide.
Syndicate Bank is the sole bank in the Union Territory of
87
3 Lakshadeep. It has opened its branches in the Andaman and
Ni cobar is 1 ands .
In the seventies the Bank organised the "Doctors
week". "Teachers Week". "Students Week". "Lawyers Week" and
similar programmes to mobilise the savings of the different
professional groups in an intensified manner. 'Adarsh Deposit
Scheme' which is a modified version of the 'Pigmy Deposit'
scheme was introduced during the year 1971. On the occasion
of its Golden Jubilee in 1975. the Bank has introduced 'The
Golden Jubilee Certificates'.
In October 1975. the fir8t Regional Rural Bank
sponsored by Syndicate Bank - 'Prathma Bank' was opened at
Moradabad. The Bank received in 1974. the Indian Merchant's
Chamber Award for 'Outstanding contribution in the promotion
of savings' . The Federation of the Indian Chambers of
Commerce and Industry selected the Bank to receive their 1974
Award for 'Outstanding achievements in Agriculture'. The
National Alliance of Young Entrepreneurs has given their Award
to the Bank 'Laghu Udyog Sahakari' in recognition of the
Bank's useful services.
3 Ibid p.57.
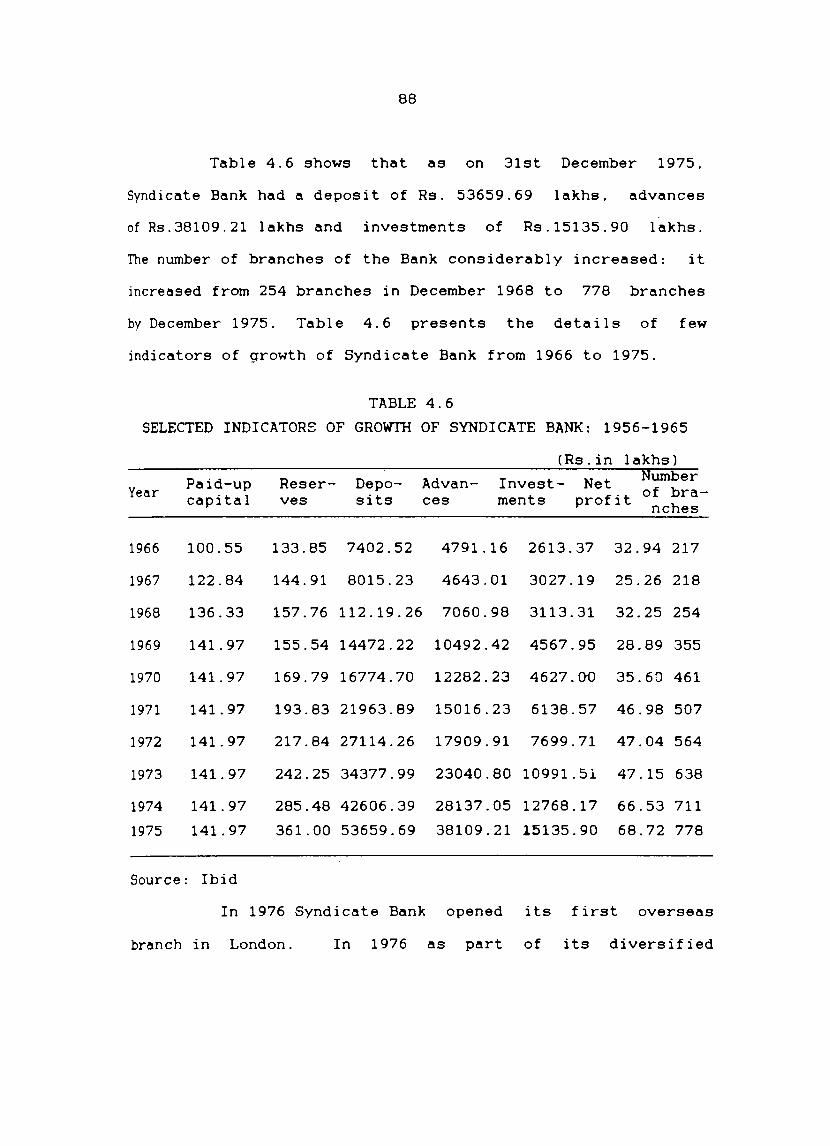
88
Table 4.6 shows that as on 31st December 1975.
Syndicate Bank had a deposit of Rs. 53659.69 lakhs. advances
of Rs.38109.21 lakhs and investments of Rs.15135.90 lakhs.
The number of branches of the Bank considerably increased: it
increased from 254 branches in December 1968 to 778 branches
by December 1975. Table 4.6 presents the details of few
indicators of growth of Syndicate Bank from 1966 to 1975.
TABLE 4.6
SELECTED INDICATORS OF GROWTH OF SYNDICATE BANK: 1956-1965
Year
1966
1967
1968
1969
1970
1971
1972
1973
1974
1975
Paid-up capital
100.55
122.84
136.33
141.97
141.97
141.97
141.97
141.97
141.97
141.97
Source: Ibid
Reserves
133.85
144.91
157.76
155.54
169.79
193.83
217.84
242.25
285.48
361.00
Deposits
7402.52
8015.23
112.19.26
14472.22
16774.70
21963.89
27114.26
34377.99
42606.39
53659.69
(Rs.in lakhs)
Advances
Invest- Net Number ments profit of bra
nches
4791.16 2613.37 32.94 217
4643.01 3027.19 25.26 218
7060.98 3113.31 32.25 254
10492.42 4567.95 28.89 355
12282.23 4627. GO 35.60 461
15016.23 6138.57 46.98 507
17909.91 7699.71 47.04 564
23040.80 10991.51 47.15 638
28137.05 12768.17 66.53 711
38109.21 15135.90 68.72 778
In 1976 Syndicate Bank opened its first overseas
branch in London. In 1976 as part of its diversified
89
activities. Syndicate Bank. in collaboration with the Life
Insurance Corporat~on of India. marketed Army Group Insurance
Scheme among the defence forces of the country. A new deposit
scheme enti tIed 'Suraksha Deposi t Scheme' for the genera 1
publ i c was 1 aunched. Under the scheme. personal accident
insurance benef its were extended to the depositors in
association with the units of the 'General Insurance
Corporation of India.
A scheme for financing bullock carts was introduced
by the Bank in 1976. With a view to encouraging improvements
in the designs of bullock carts. the Bank conducted a national
competition for better designs of the bullock cart.
The deposits of Syndicate Bank increased from
Rs.11219 lakhs as on 31st December 1968 to RS.107625 lakhs by
the year ending 1978. By 1978 Syndicate Bank became one among
the top ten banks in Indi a 4 .
In 1978. the Bank introduced the
Information System to collect and
information.
4 Ibid. p.70.
disseminate
Management
uptodate
90
During the year 1978 the Bank in collaboration with
the Khadi and Village Industries Commission. prepared a
special scheme to popularise and install gobar gas plants in
rural areas. Innovative social and farm forestry programmes.
were implemented during the year. A scheme of production
linked housing credit was designed and implemented by the
Bank.
During the 1982. Syndicate Bank in collaboration
with the Canara Bank, Shree Dharmasthala Manjuathesware
Education Trust and Syndicate Agricultural Foundation
established the Rural Development and Self-employment Training
Institute in Dakshina Kannada district. It aimed at
motivating unemployed rural youth to take up self-employment
activities in rural areas and to ensure that the trained youth
are given advisory and credit support by the Bank's branches.
Financial assistance was extended by the Bank on easy terms
for the development of infrastructural facilities required for
fishing. The Bank. through the Syndicate Agriculture
Foundation organised regular extension programme for spreading
the new agricultural technology among the farmers.
During the period 1975-1985 the Bank has sponsored
nine Regional Rural Banks in different parts of the country in
addition to 'Prathama Bank' sponsored by it in 1975.
91
Table 4.7 presents the details of the Regional Rural
Banks sponsored by Syndicate Bank. The Regional Rural Banks
sponsored by Syndicate Bank are operating in five states. viz.
Haryana. Uttar Pradesh. Andhra Pradesh. Karnataka and Kerala
and cover altogether nineteen districts.
During the year 1984 the global deposits of
Syndicate Bank showed a growth rate of 23 percent over the
previous yearS. So too advances showed a growth rate of
twenty four percent during the period. The rate of growth in
deposits during 1984-85 in fact dwindled and it was fifteen
percent during the year under reference. A corresponding
change in advance was noticed during the year 1984-85. The
rate of growth in net profits during 1983-84. and 1984-85 had
in fact a different trend. It was three percent and eighteen
percent respectively during the period under reference. Table
4.8 furnishes the details of a few selected indicators of
growth of Syndicate Bank from 1975 to 1985.
5 Financial Analysis of Banks Association. Bombay.
1985. Indian Rank's
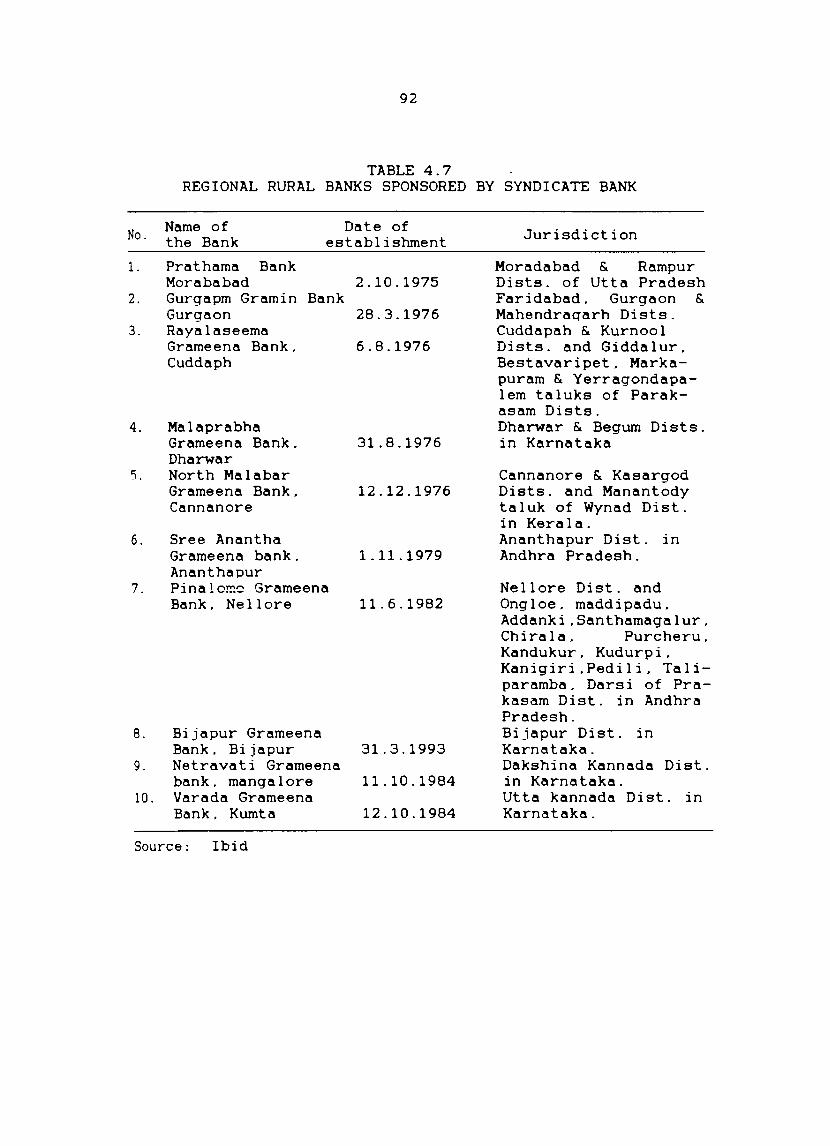
92
TABLE 4.7 REGIONAL RURAL BANKS SPONSORED BY SYNDICATE BANK
No.
1.
2.
3.
Name of the Bank
Prathama Bank
Date of establishment
Morababad 2.10.1975 Gurgapm Gramin Bank Gurgaon 28.3.1976 Rayalaseema Grameena Bank. 6.8.1976 Cuddaph
4. Ma 1 aprabha Grameena Bank. 31.8.1976 Dharwar
5. North Malabar Grameena Bank. 12.12.1976 Cannanore
6. Sree Anantha Grameena bank. 1.11.1979 Ananthapur
7. Pinalomo Grameena Bank. Nellore 11.6.1982
S. Bi japur Grameena Bank. Bijapur 31.3.1993
9. Netrava t i Grameena bank. mangalore 11.10.1984
10. Varada Grameena Bank. Kumta 12.10.1984
Source: Ibid
Jurisdiction
Moradabad & Rampur Dists. of Utta Pradesh Faridabad. Gurgaon & Mahendraqarh Dists. Cuddapah & Kurnool Dists. and Giddalur. Bestavaripet. Markapuram & Yerragondapalem taluks of Parakasam Dists. Dharwar & Begum Dists. in Karnataka
Cannanore & Kasargod Dists. and Manantody taluk of Wynad Dist. in Kerala. Ananthapur Dist. in Andhra Pradesh.
Nellore Dist. and Ongloe. maddipadu. Addanki.Santhamagalur. Chirala. Purcheru. Kandukur. Kudurpi. Kanigiri.Pedili. Taliparamba. Darsi of Prakasam Dist. in Andhra Pradesh. Bijapur Dist. in Karnataka. Dakshina Kannada Dist. in Karnataka. Utta kannada Dist. in Karnataka.
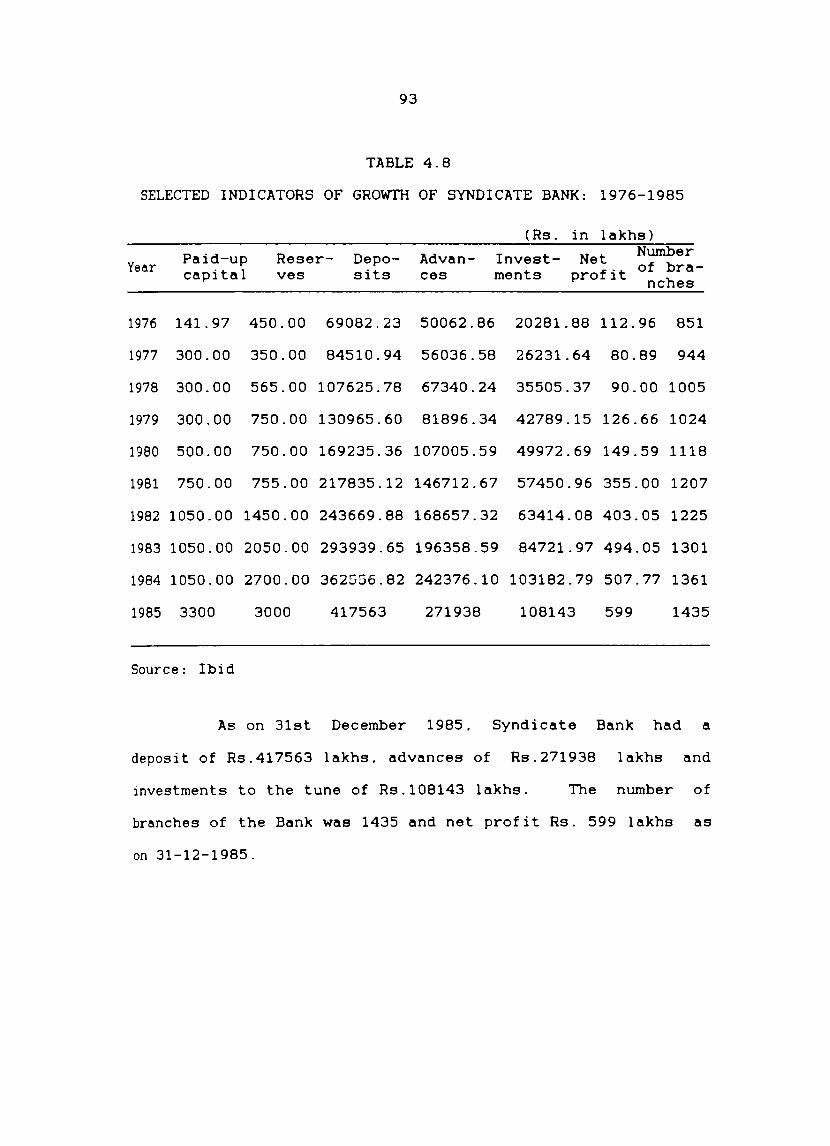
93
TABLE 4.8
SELECTED INDICATORS OF GROWTH OF SYNDICATE BANK: 1976-1985
(Rs. in lakhs)
Paid-up Reser- Depo- Advan- Invest- Net Number Year capital sits ments profit of bra-ves ces nches
1976 141.97 450.00 69082.23 50062.86 20281.88 112.96 851
1977 300.00 350.00 84510.94 56036.58 26231.64 80.89 944
1978 300.00 565.00 107625.78 67340.24 35505.37 90.00 1005
1979 300.00 750.00 130965.60 81896.34 42789.15 126.66 1024
1980 500.00 750.00 169235.36 107005.59 49972.69 149.59 1118
1981 750.00 755.00 217835.12 146712.67 57450.96 355.00 1207
1982 1050.00 1450.00 243669.88 168657.32 63414.08 403.05 1225
1983 1050.00 2050.00 293939.65 196358.59 84721.97 494.05 1301
1984 1050.00 2700.00 362556.82 242376.10 103182.79 507.77 1361
1985 3300 3000 417563 271938 108143 599 1435
Source: Ibi d
As on 31st December 1985. Syndicate Bank had a
deposit of Rs.417563 lakhs. advances of Rs.271938 lakhs and
investments to the tune of RS.108143 lakhs. The number 0 f
branches of the Bank was 1435 and net profit Rs. 599 lakhs as
on 31-12-1985.
94
Syndicate Bank has one of the largest number of
clientele served by any public sector bank in India 6 . It
became the sixth biggest nationalised bank in India by the
. ht' 7 elg les . It figured in the list of the 'Top 500 Banks' of
the world with the 444th rank during the eighties8 .
All out efforts are made by Syndicate Bank to
maintain good standards in customer service. The Bank has
constituted Customer Service Committees at all its branches
and conducts 'Customer Meets'. The 'Customers Fortnight' was
observed in all the branches of the Bank in 1993. The Bank
has implemented the various recommendations of Gopioria
Committee on customer service. Customers grievances redressal
has been accorded top priority and efforts are made to attend
to all complaints within the shortest period so as to extend
the best service.
In order to identify and motivate scheduled
caste/scheduled tribe unemployed youth for taking up
self-employment ventures. special training programmes were
6 Syndicate Bank. Annual Report. 1987. p.6.
7 Saga of Sixty years. Op.Cit .. p.79.
8 The Banker. London. (July. 1985). p.177.
95
organised. An SC/ST cell is operating at the corporate office
to oversee the implementation of the Government of India
instructions relating to SC/ST matters. The cell is
functioning under the direct supervision of one of the General
Managers.
To make rural operations more effective and
meaningful. the Bank has organised a number of Agricultural
Extension Programmes. through hundreds of technically
qualified personnel posted at its rural and semi-urban
branches. This effort aims at bridging the technology gap c ,
between the I and and I ab.
With the commissioning of the ICIM 29C4/50 computer
system in 1984 at the corporate level. the Bank entered the
era of electronics. Since then all major functions in the
corporate office and zonal offices have been brought under the
fold of computerisation. The Bank is a member of the SWIFT.
an internat iona I commun i cat ion network.
The Bank has introduced the STOCKINVESI scheme for
the benefit of small investors. Recogni~ing the potentiality
in credit card business. the Bank has launched 'CANCARD' as an
affiliate member of the scheme introduced by Canara Bank.
The poverty alleviation programmes sponsored by the
Government of India received the Bank's support on a priority
basis.
96
In keeping with the National Policy in the promotion
of housing. the Bank assisted in the development of housing
both by lending directly to individuals and indirectly through
investing in Bonds of the State Housing Boards. National
Housing Bank and Housing and Urban Development Corporation.
The Bank has laid special emphasis on the promotion of small
houBing units for the weaker sections.
As a step in improving its operational efficiency
and profitability, Syndicate Bank has merged some of the
~hronically loss incurring branches with the nearby branches.
It has merged eight of its branches with other viable
branches. The total number of branches of the Bank stood at
1558 at the end of the year 1993-94. The Bank has 180
Extension Counters. The operations of the Bank is spread over
20 states and 4 union territories9 . Of the 1558 branches. 705
are located in rura 1 area. 346 in semi ~ urban area. 254 in
urban area. 252 in metropolitan and port town areas and one is
10 an overseas branch . The rura 1 and semi ~ urban branches
together constitute 67.5 percent of the total branches. The
n~er of branches operating in the Lead Districts of the Bank
are 660. constituting 42.3 percent 0f the total branch network
of the Bank.
9 Syndicate Bank. Annual report. 1993-94. p.9.
10 Ibid. p.48.
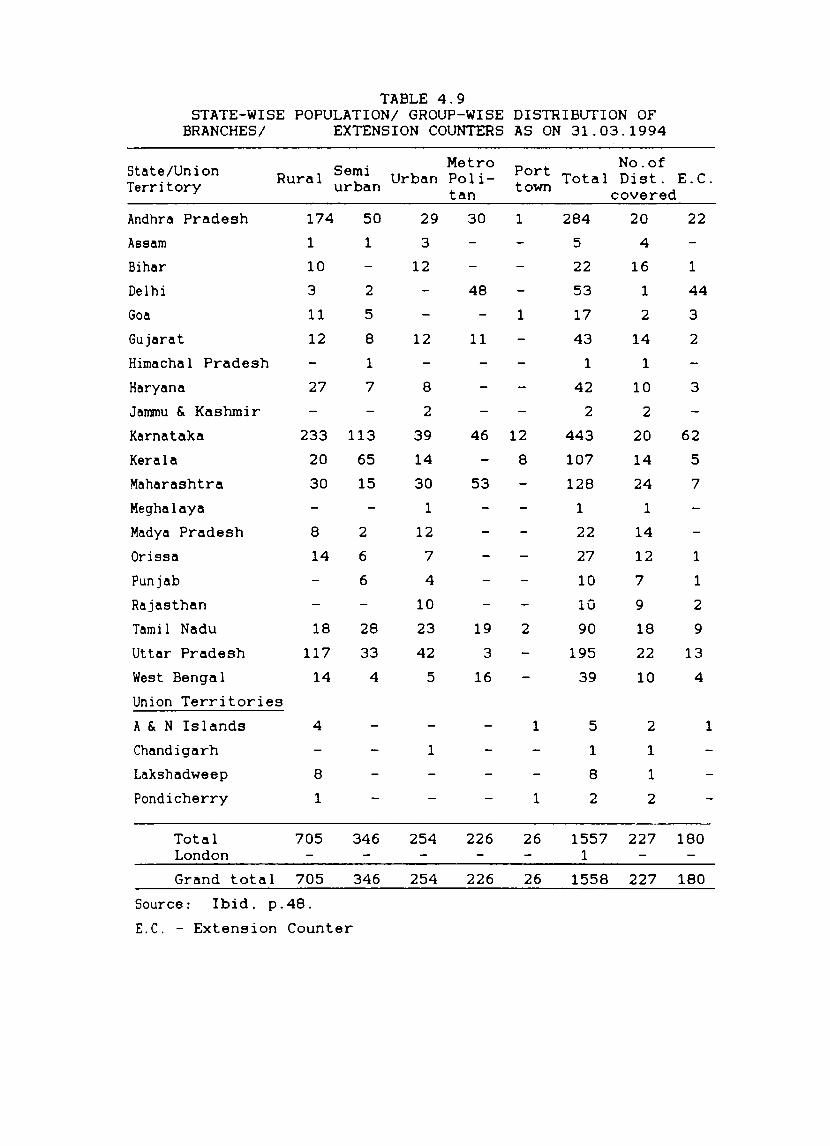
TABLE 4.9 STATE-WISE POPULATION/ GROUP-WISE DISTRIBtITION OF
BRANCHES/ EXTENSION COUNTERS AS ON 31.03.1994
State/Union Semi Metro Port No.of
Rural Urban Pol i- Total Dist. E.C. Territory urban tan town covered
Andhra Pradesh 174 50 29 30 1 284 20 22
Assam 1 1 3 5 4
Bihar 10 12 22 16 1
Del hi 3 2 48 53 1 44
Goa 11 5 1 17 2 3
Gujarat 12 8 12 11 43 14 2
Himachal Pradesh 1 1 1
Haryana 27 7 8 42 10 3
Jammu & Kashmir 2 2 2
Karnataka 233 113 39 46 12 443 20 62
Kerala 20 65 14 8 107 14 5
Maharashtra 30 15 30 53 128 24 7
Meghalaya 1 1 1
Madya Pradesh 8 2 12 22 14
Orissa 14 6 7 27 12 1
Punjab 6 4 10 7 1
Rajasthan 10 10 9 2
Tami I Nadu 18 28 23 19 2 90 18 9
Uttar Pradesh 117 33 42 3 195 22 13
West Bengal 14 4 5 16 39 10 4
Union Territories
A & N Islands 4 1 5 2 1
Chandigarh 1 1 1
Lakshadweep 8 8 1
Pondicherry 1 1 2 2
Total 705 346 254 226 26 1557 227 180 London 1
Grand total 705 346 254 226 26 1558 227 180
Source: Ibid. p.48.
E.C. - Extension Counter
98
Table 4.9 provides statewise. sector wise
distribution of bran~h offices of Syndicate Bank as on 31st
March 1994.
An analysis of the performance of the Regional Rural
Banks (RRBs) sponsored by Syndicate Bank vis-a-vis the other
RRBs. reveals that the performance of the RRBs sponsored by
the Bank is comparatively better: five RRBs sponsored by
Syndicate Bank find a place among the top ten RRBS in the
country in respeot. of the major business paramet.ers viz ..
ueposits and outstanding advances.
Special emphasis was laid on the recovery of
advances falling under non-performing assets.
recovery targets were fixed for each branch.
and specific
division and
zone. A General manager exclusively in charge of recoveries
had been appointed to monitor the recovery performance.
The Bank has initiated innovative measures to extend
prompt service to the foreign business clients. It has
designated export financing as a thrust area in line with the
'National Priority' status accorded by the Government of
India. Syndicate Bank is a category I Merchant Banker.
As per the guidelines of the Reserve bank of India.
total branch mechanisation was introduced in seven key
branches - Nehru Place Delhi. South Block Delhi. Transport

99
Bhavan Delhi, Vayu Bhavan Delhi, Fort Bombay, Industrial
Finance Branch Bombay and Industrial Finance Branch Bangalore.
Besides, the Bank has drawn up a plan of mechanising its 150
branches.
The total staff strength of the Bank as at the end
of 1993-94 was 36,357 (excluding 1895 part - time employees)
comprising 9,158 officers, 21,889 clerks and 5.310 attenders.
Out of the total staff strength. 6.399 belonged to scheduled
castes and 1.763 belonged to scheduled tribes constituting
16.7 percent and 4.6 percent respectively.
The Bank has a vigilance cell which is functioning
directly under the administrative control of the General
Manager (Vigilance and Inspection) who exclusively looks after
all the vigilance matters. and is reporting directly to the
Chairman and Managing Director of the Bank. The inspection of
offices are conducted without any backlog and every effort is
taken to improve the internal control system. The system of
concurrent audit is followed by the Bank based on the
recommendations of the Ghosh Committee11 .
The paid up capital of Syndicate Bank was Rs.83900
lakhs as on 31.3.1994. The reserves of the Bank stood at
11 Reserve Bank of India Committee on Bank Accounts. (Ghosh Committee). 1982.
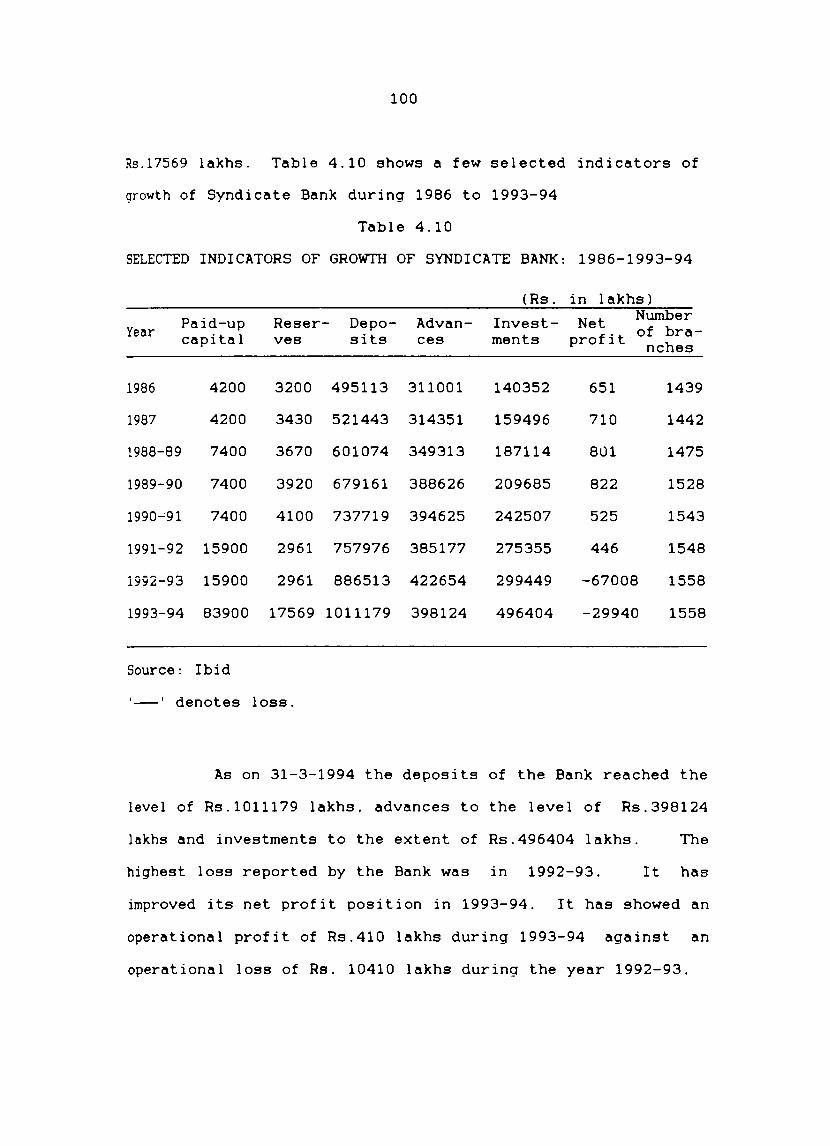
100
Rs .17569 1 akhs. Table 4.10 shows a few selected indicators of
growth of Syndicate Bank during 1986 to 1993-94
Table 4.10
SELECTED INDICATORS OF GROWTH OF SYNDICATE BANK: 1986-1993-94
(Rs. in lakhs)
Paid-up Reser- Depo- Advan- Invest- Net Number Year of bra-capital ves sits ces ments profit nches
1986 4200 3200 495113 311001 140352 651 1439
1987 4200 3430 521443 314351 159496 710 1442
1988-89 7400 3670 601074 349313 187114 801 1475
1989-90 7400 3920 679161 388626 209685 822 1528
1990...;91 7400 4100 737719 394625 242507 525 1543
1991-92 15900 2961 757976 385177 275355 446 1548
1992-93 15900 2961 886513 422654 299449 -67008 1558
1993-94 83900 17569 1011179 398124 496404 -29940 1558
Source: Ibid
'-' denotes loss.
As on 31-3-1994 the deposits of the Bank reached the
level of Rs.1011179 lakhs. advances to the level of Rs.398124
lakhs and investments to the extent of Rs.496404 lakhs. The
highest loss reported by the Bank was in 1992-93. It has
improved its net profit position in 1993-94. It has showed an
operational profit of Rs.410 lakhs during 1993-94 against an
operational loss of Rs. 10410 lakhs during the year 1992-93.
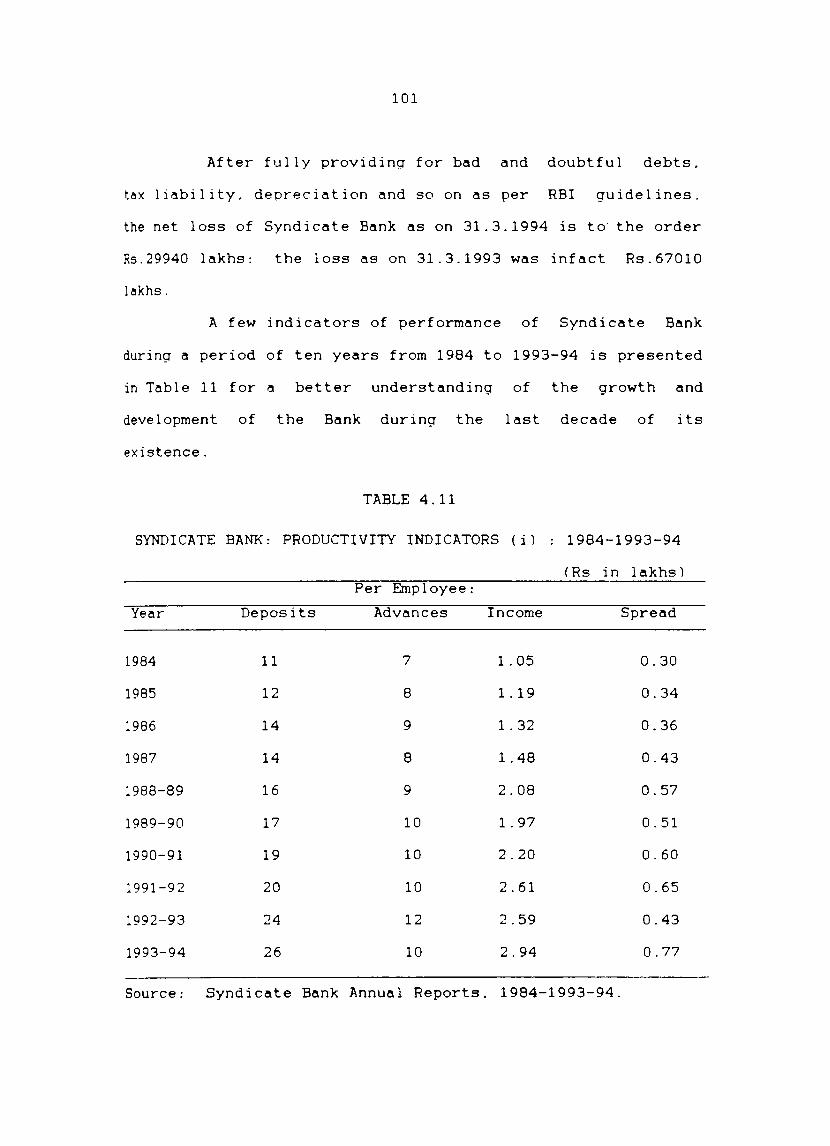
101
After fully providing for bad and doubtful debts.
tax liability. depreciation and so on as per RBI guidelines.
the net loss of Syndicate Bank as on 31.3.1994 is to' the order
RS.29940 lakhs: the loss as on 31.3.1993 was infact RS.67010
lakhs.
A few indicators of performance of Syndicate Bank
during a period of ten years from 1984 to 1993-94 is presented
in Table 11 for a better understanding of the growth and
development of the Bank during the last decade of its
existence.
TABLE 4.11
SYNDICATE BANK: PRODUCTIVITY INDICATORS ( i ) 1984-1993-94
(Rs in lakhs) Per Employee:
Year Deposits Advances Income Spread
1984 11 7 1. 05 0.30
1985 12 8 1.19 0.34
1986 14 9 1. 32 0.36
1987 14 8 1. 48 0.43
1988-89 16 9 2.08 0.57
1989-90 17 10 1. 97 0.51
1990-91 19 10 2.20 0.60
1991-92 20 10 2.61 0.65
1992-93 24 12 2.59 0.43
1993-94 26 10 2.94 0.77
Source: Syndicate Bank Annual Reports. 1984-1993-94.
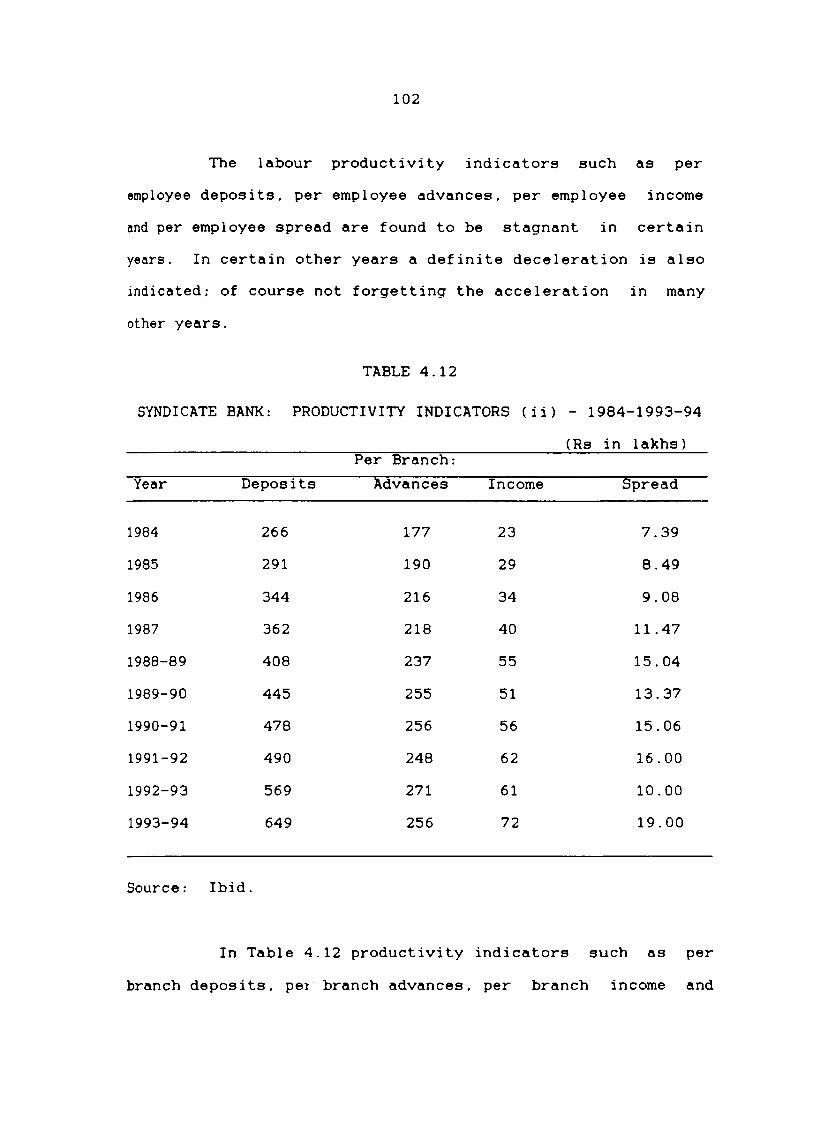
102
The labour productivity indicators such as per
employee deposits. per employee odvances. per employee income
and per employee spread are found to be stagnant in certain
years. In certain other years a definite deceleration is also
indicated; of course not forgetting the acceleration in many
other years.
TABLE 4.12
SYNDICATE BANK: PRODUCTIVITY INDICATORS (ii) - 1984-1993-94
(Rs in lakhs) Per Branch:
Year Deposits Advances Income Spread
1984 266 177 23 7.39
1985 291 190 29 8.49
1986 344 216 34 9.08
1987 362 218 40 11.47
1988-89 408 237 55 15.04
1989-90 445 255 51 13.37
1990-91 478 256 56 15.06
1991-92 490 248 62 16.00
1992-93 569 271 61 10.00
1993-94 649 256 72 19.00
Source: Ibid.
In Table 4.12 productivity indicators such as per
branch deposits. per branch advances. per branch income and
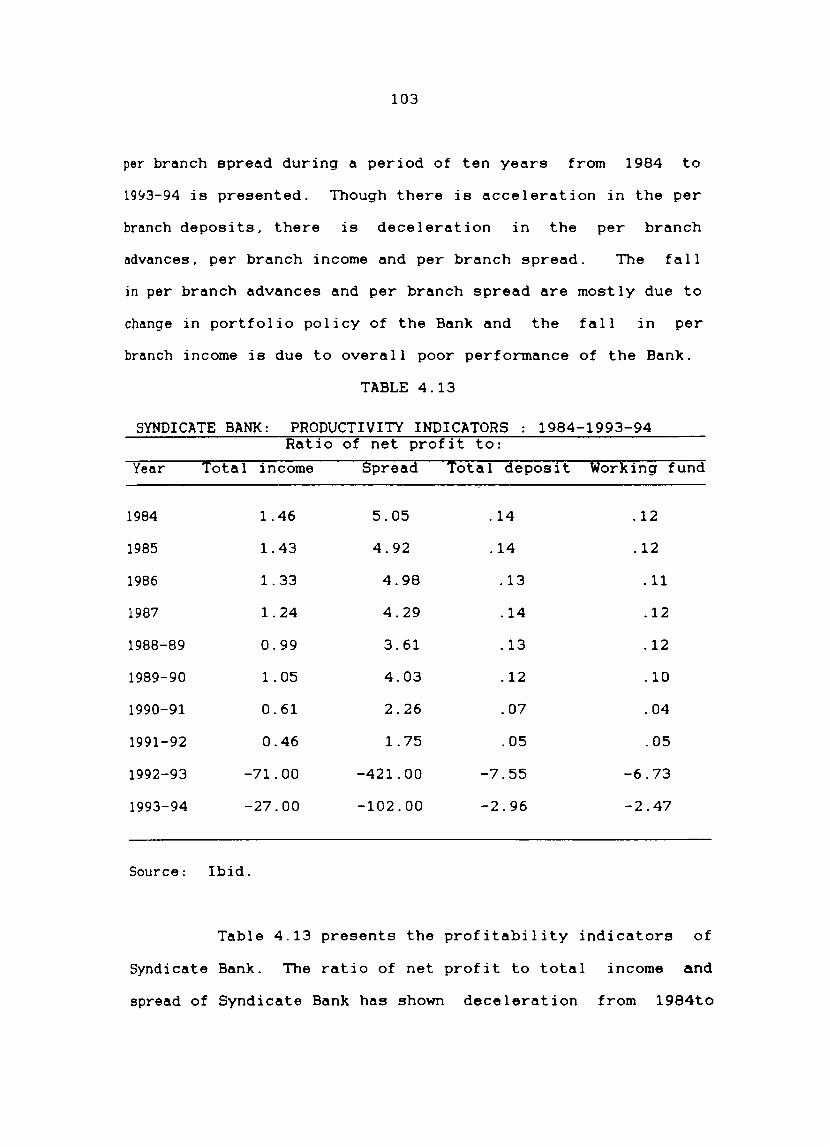
103
per branch spread during a period of ten years from 1984 to
19~3-94 is presented. Though there is acceleration in the per
branch deposits, there is deceleration in the per branch
advances, per branch income and per branch spread. The fall
in per branch advances and per branch spread are mostly due to
change in portfolio policy of the Bank and the fall in per
branch income is due to overall poor performance of the Bank.
TABLE 4.13
SYNDICATE BANK: PRODUCTIVITY INDICATORS : 1984-1993-94 Ratio of net profit to:
Year Total income Spread Total deposit Working fund
1984 1.46 5.05 .14 .12
1985 1.43 4.92 .14 .12
1986 1. 33 4.98 .13 .11
1987 1. 24 4.29 .14 .12
1988-89 0.99 3.61 .13 .12
1989-90 1. 05 4.03 .12 .10
1990-91 0.61 2.26 .07 .04
1991-92 0.46 1. 75 .05 .05
1992-93 -71.00 -421.00 -7.55 -6.73
1993-94 -27.00 -102.00 -2.96 -2.47
Source: Ibid.
Table 4.13 presents the profitability indicators of
Syndicate Bank. The ratio of net profit to total income and
spread of Syndicate Bank has shown deceleration from 1984to
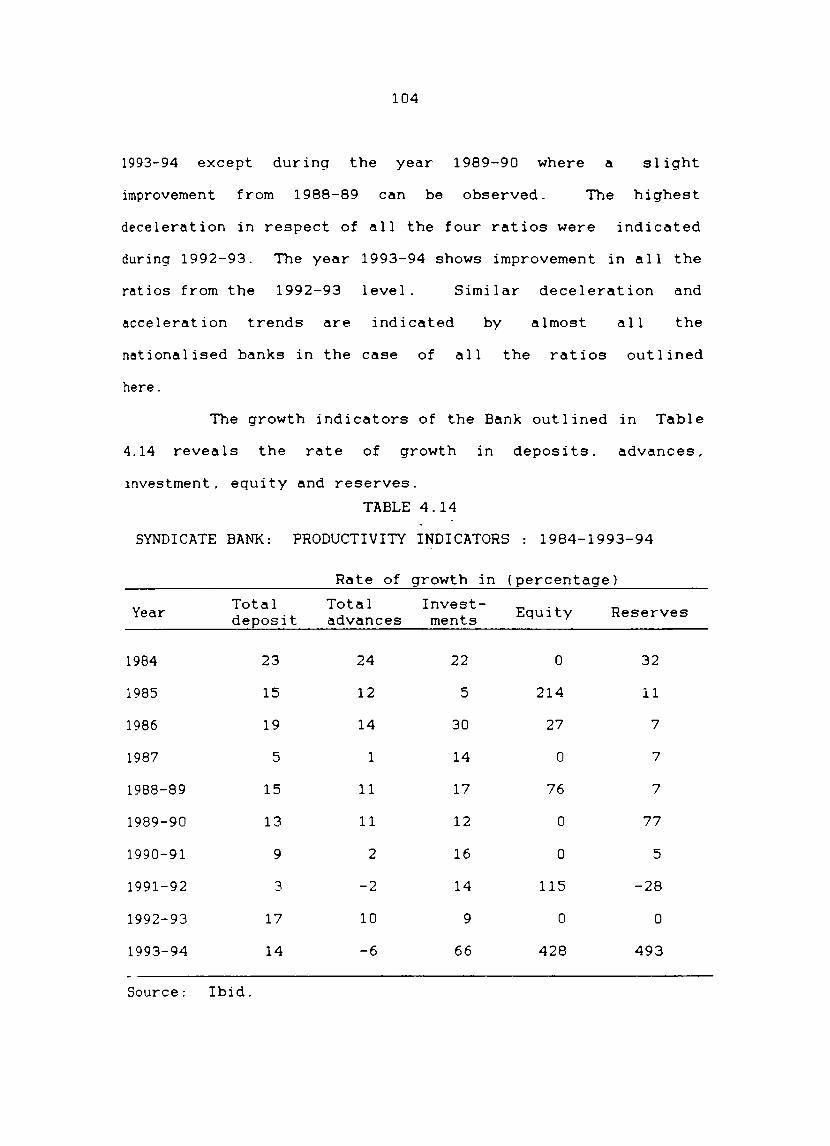
104
1993-94 except during the year 1989-90 where a slight
improvement from 1988-89 can be observed. The highest
deceleration in respect of all the four ratios were indicated
during 1992-93. The year 1993-94 shows improvement in all the
ratios from the 1992-93 I eve 1 . Similar deceleration and
acceleration trends are indicated by almost all the
nationalised banks in the case of all the ratios outlined
here.
The growth indicators of the Bank outlined in Table
4.14 reveals the rate of growth in deposits. advances.
investment. equity and reserves.
TABLE 4.14
SYNDICATE BANK: PRODUCTIVITY INDICATORS : 1984-1993-94
Rate of growth in (percentage)
Year Total Total Invest- Equity Reserves deposit advances ments
1984 23 24 22 0 32
1985 15 12 5 214 11
1986 19 14 30 27 7
1987 5 1 14 0 7
1988-89 15 11 17 76 7
1989-90 13 11 12 0 77
1990-91 9 2 16 0 5
1991-92 3 -2 14 115 -28
1992-93 17 10 9 0 0
1993-94 14 -6 66 428 493
Source: Ibid.
105
The negative growth in advances in 1991-92 and
1993-94 can be attributed to the change in the portfolio
management of Syndicate Bank. Equity and reserves show the
highest growth during 1993-94: equity growth with
contribution from the Central Government to the extent of
Rs.68000 lakhs and growth in reserves with compulsory
apportioning and provisioning.
4.5 Organisation and Management
Syndicate Bank has a Board of Directors which is
responsible for the management of the Bank. According to the
Banking Companies (Acquisition and Transfer of Undertakings)
Act 1970. the general superintendence. direction and
management of the affairs and business of a nationalised bank
is to be vested in a nominated Board of Directors which shall
be entitled to exercise all such powers and do all such acts
and things as the bank is authorised to do and exercise. The
Board of the bank consists of the representatives of the
Central Government. The Reserve bank of India and various
other interests including the workmen. The Board consists of
two whole time directors of whom one is the Chairman and the
Managing Director. The second whole time director is
designated as the Executive Director and he is required to
assist the Managing Director in executing and implementing the
policies and decisions of the Board and to discharge the
106
duties of the Managing Director in his absence, or to act as
directed by the Managing Director.
The Chairman and managing Director has a two fold
function: on the one hand, he frames the policies along with
other members of the Board and on the other. he is directly
responsible for the implementation of the polices. He works
under the guidance of the Board of Directors and yet he enjoys
considerable authority. He exercises such authority for the
smooth running of the Bank. He places before the Board
periodically the details of all important developments for
their approval.
The Board and the executives are assisted by the
General Managers and a number of other line managers. The
General Managers are responsible for the smooth running of the
administration and have to maintain effective control over the
banking departments put under their charge. They have an
overall accountability for all the aspects of the Bank's
business. In all their activities. the General Managers are
assisted by the deputy or assistant general managers to whom
the necessary powers and responsibilities are delegated with
definite authority and rights.
In the past, with limited number of branches. the
head office of the Bank could directly communicate and pass
instructions even on minor issues. With the growing branch
107
net work. there is the need for setting up of regional and
zonal offices and the need for increased delegation is greater
than ever before. Decentralisation of the administrative
pattern of the Bank was effected for the first time during the
year 1977. The Bank adopted a four tier system comprising the
branch. regional office covering about 90-130 branches. zonal
office having two or three regions and the head office. The
organisation structure of Syndicate bank has undergone many a
changes over the years. At present in the organisational
hierarchy of Syndicate Bank, zo~al and divisional offices act
as the representatives of the head office. As the zonal and
divisional offices of the Bank control the branches. so is the
head office control over the zones and divisions. These
controls are inevitable to promote and achieve the objectives
and goals of the Bank. However. since the objectives and
priorities are subject to change and the Bank as a living
organisation grows. there is the necessity of continuous
organisation review and change.
The organisation set up
present composed of four distinct
Office 2) Zonal Offices 3)
of Syndicate Bank
tiers. namely. 1)
Divisional Offices
is at
Head
and 4)
Branches. The organisation set up as on 31-3-1994 is
diagrammatically represented below:-
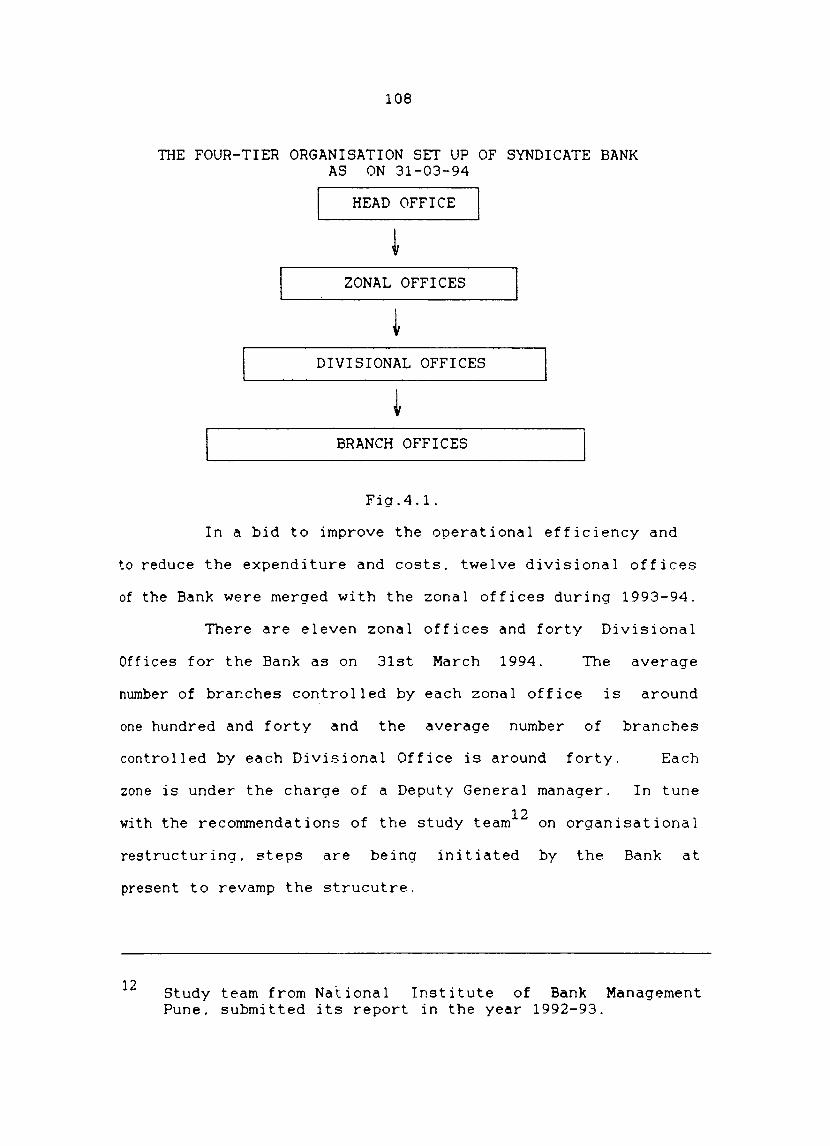
108
THE FOUR-TIER ORGANISATION SET UP OF SYNDICATE BANK AS ON 31-03-94
HEAD OFFICE
ZONAL OFFICES
DIVISIONAL OFFICES
BRANCH OFFICES
F1g.4.1.
In a b1d to improve the operational efficiency and
to reduce the expend1ture and costs. twelve divisional off1ces
of the Bank were merged with the zonal offices during 1993-94.
There are eleven zonal offices and forty D1v1sional
Offices for the Bank as on 31st March 1994. The average
number of brar.ches controlled by each zonal off1ce 1S around
one hundred and forty and the average number of branches
controlled by each D1visional Off1ce is around forty. Each
zone is under the charge of a Deputy General manager. In tune
12 with the recommendations of the study team on organisational
restructuring. steps are being initiated by the Bank at
present to revamp the strucutre.
12 Study team from National Institute of Bank Management Pune. subm1tted its report in the year 1992-93.
109
Syndicate Bank which had put to practice the
objectives of nationalisation even before the advent of
nationalisation had served the common man with maximum
earnestness. It gained expertise in merger and acquisition at
a time when even the European banks were not practising
mergers or consolidation. It is a champion of mass banking
and innovations. It displayed a dismal picture in all of its
activities only during the period 1990-94. This. infact was a
common feature of the Indian banking system.
Now the Bank is looking forward with confidence to
excel itself in all areas of banking in the days to come. It
is reasonable to think that the fruits of liberalisation
coupled with the changes in the internal structure and a new
dynamism in management would take the Bank to greater heights
in performance. True to its tradition. Syndic~te Bank has a
strong commitment to fulfil the aims and objectives of
nationalisation. It still considers the customer as 'Master'.
It murmurs silently with a feeling of self satisfaction.
CUSTOMERS OUR PRIDE' !
'OUR
CHAPTER V
PffiFORMANCE EFFECTIVENE8S OF BANKS: THE THEORETICAL APPROACH
5.1 Need of a New Approach
Performance evaluation is an important pre-requisite
for sustained growth and development of any institution. As
in the case of any institution, the evaluation of the
performance of banks has to be undertaken in relation to their
goals and objectives.
In recent years the evaluation of performance of
commercial banks, particularly those in the public sector, has
attracted considerable attention. Banks are expected to work
towards several objectives which can sometimes appear to be
inconsistent. They have to abide by monetary and credit
policy regulations, achieve social and economic goals, and
operate on commercial considerations. Their affairs are not
conducted merely on economic or financial considerations.
Hence it is not easy to evolve a definite set of parameters to
evaluate their overall performance. About bank performance,
Shri. R. N. Ma 1 hotra, the former GO'v'ernor of the Reserve Bank
of India observed that
deposits that fulfil the
banks with satisfactory growth in
lending criterion to the various
111
~ctors and meet the requisite reserve requirements and
~ovide for bad and doubtful debts with a proper track record
in making profits would be acclaimed as 'good'. Such a
performance if associated wi th a good image in customer
service would be regarded as 'highly creditable,l.
The researcher has thoroughly examined the various
studies pertaining to the eva 1 uation of the performance of the
~nks. None of the existing studies on the evaluation of the
performance of the banks has succeeded in assessing the
overall performance. On the basis of one or a few parameters.
the evaluation of performance is made and findings and
conclusions arrived at. Such a piecemeal approach has failed
to provide a comprehensive picture of the nationalised banking
sector of our country. It is to fill such a gap that a new
methodology is evolved which could provide a comprehensive
picture of all the vital aspects concerning the functioning of
the individual nationalised banks and the nationalised banking
sector as a who 1 e .
1 Malhotra R.N .. "Inaugural Address". at Bank Economists Meet.1987.
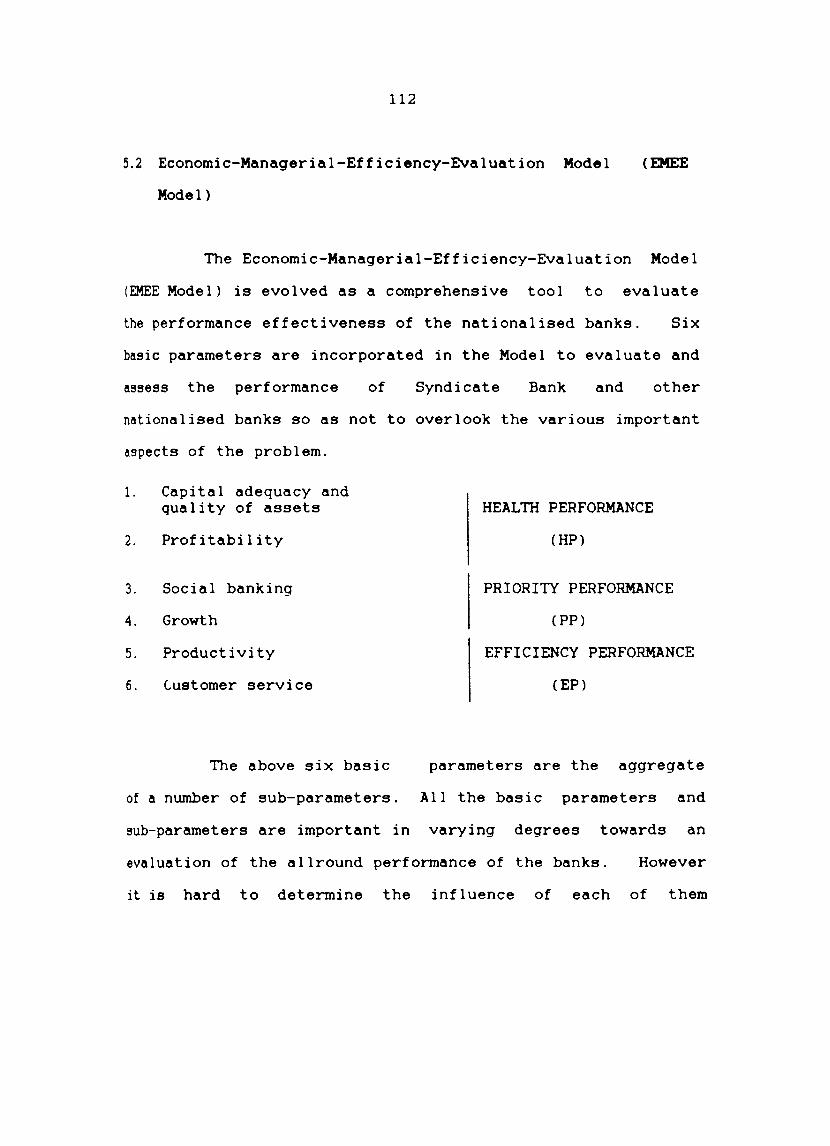
112
5.2 Economic-Managerial-Efficiency-Eval uation Model (EMEE
Model)
The Economic-Managerial-Efficiency-Evaluation Model
(DmE Model) is evolved as a comprehensive tool to evaluate
the performance effectiveness of the nationalised banks. Six
basic parameters are incorporated in the Model to evaluate and
assess the performance of Syndicate Bank and other
nationalised banks so as not to overlook the various important
aspects of the prob I em.
1. Capital adequacy and quality of assets HEALTH PERFORMANCE
2. Profitability (HP)
3. Social banking PRIORITY PERFORMANCE
4. Growth (PP)
5. Productivity EFFICIENCY PERFORMANCE
6. Customer service (EP)
The above six basic parameters are the aggregate
of a number of sub-parameters. All the basic parameters and
sub-parameters are important in varying degrees towards an
evaluation of the allround performance of the banks. However
it is hard to determine the influence of each of them
113
independently towards performance. An optimum mix of these
parameters would provide a comprehensive picture. This calls
for the adoption of an integrated approach keeping in mind the
various socio-economic objectives and management
responsibilities to weave them coherently. The development of
a proper Model incorporating the parameters and giving due
weightage to them would provide a good measure of allround
performance. Such a Model would avoid the limitations of
evaluating the performance on separate parameters too. Hence
the Model. an Economic-Managerial- Efficiency-Evaluation Model
l~E) is developed for the study to arrive at a Composite
Performance Score (CPS). It would reveal the overall
performance of Syndicate Bank and other nationalised banks.
5.2.1.The Composite Performance Score (CPS)
The Composite Performance Score is formulated by
incorporating the six basic parameters identified for the
study and assigning them equal weights/scores. Every basic
parameter is assigned a score of 100. The sum total of the
scores for the six basic parameters gives the Composite
Performance Score The total score ie ..
Performance Score is 600. The scores are assigned
basis of subjective but considered judgement
Composite
on the
of the
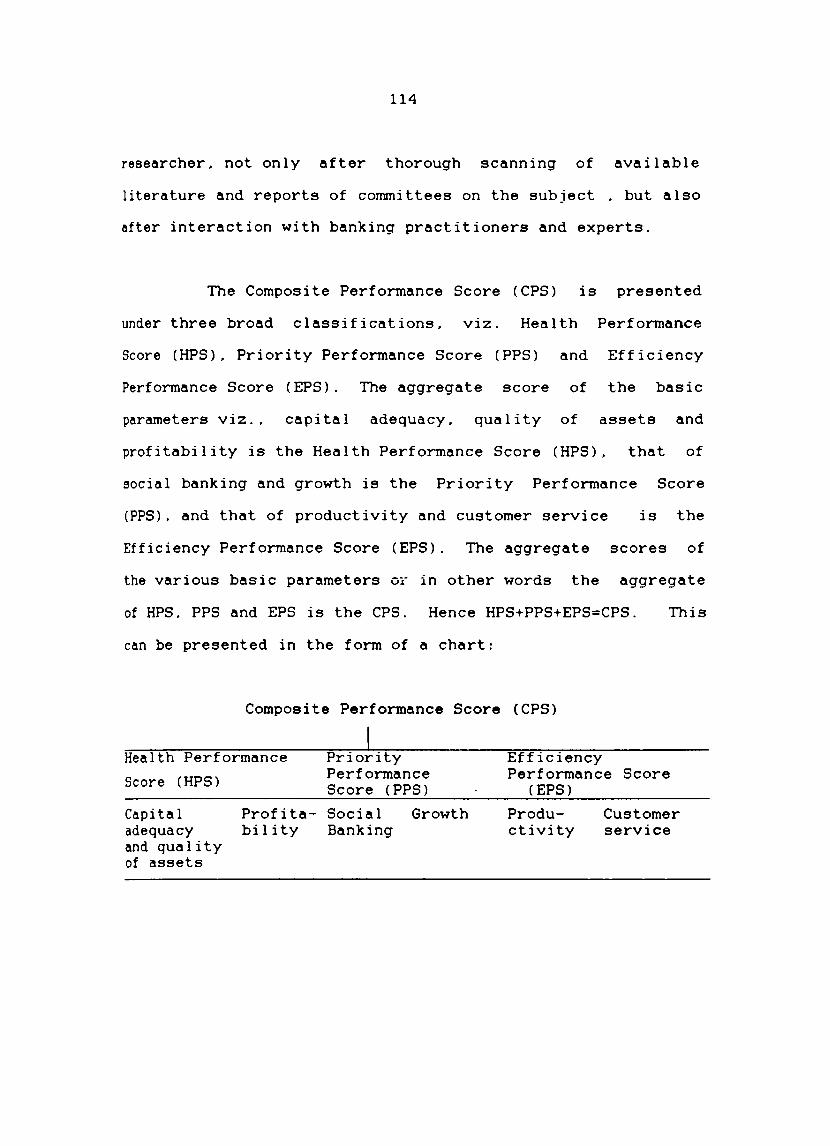
114
researcher. not only after thorough scanning of available
literature and reports of committees on the subject . but also
after interaction with banking practitioners and experts.
The Composite Performance Score (CPS) is presented
under three broad classifications. viz. Health Performance
Score (HPS). Priority Performance Score (PPS) and Efficiency
Performance Score (EPS). The aggregate score of the basic
parameters viz.. capital adequacy. quality of assets and
profitability is the Health Performance Score (HPS). that of
social banking and growth is the Priority Performance Score
(PPS). and that of productivity and customer service is the
Efficiency Performance Score (EPS). The aggregate scores of
the various basic parameters OT in other words the aggregate
of HPS. PPS and EPS is the CPS. Hence HPS+PPS+EPS=CPS. This
can be presented in the form of a chart:
Composite Performance Score (CPS)
Health Performance Priority Performance Score (PPS) Score (HPS)
Capita 1 adequacy and qual i ty of assets
Profita- Social Growth bility Banking
Efficiency Performance Score
(EPS)
Productivity
Customer service
115
Sub-Parameters: Ass ignment of Scores
The basic parameters considered in the study are the
aggregate of a number of sub-parameters. Hence the scores of
~e respective basic parameters are apportioned among their
respective sub-parameters. The scores for the different
levels of achievement in respect of the different
sub-parameters are arrived at by taking the mean value of the
achievement of the sub-parameters of all the twenty
nationalised banks from 1st January 1984 to 31st March 1994.
Such mean values of the sub-parameters concerned stand as the
basis to find out the standard deviation to fix the ranges for
assigning the eligible scores to every bank in each of the
sub-parameters. A detailed description of the assignment of
the scores is given be I ow.
The mean value of the achievement of every
sub-parameter in respect of all the twenty nationalised banks
pertaining to the ten year period from 1984 to 1993-94 is
first taken. The mid-value of the scores of the concerned
sub-parameters are assigned to the mean values of the
respective sub-parameters. The actual
respective banks for their achievement in
concerned are assigned on the basis of
scores of the
the sub-parameters
mean. mean plus
116
standard deviation. mean minus standard deviation. mean plus
two standard deviat ion. mean minus two standard deviat ion.
~an plus three standard deviation and mean minus three
standard deviat ion except in the sub-parameters under
adequacy and qua 1 i ty of assets and customer servi ce.
capital
The
scores of the respective sub-parameters under the different
basic parameters are aggregated separate 1 y.
The mean value of the aggregate scores of the
~oncerned sub-parameters under the respective basic parameters
give the score of the various basic parameters. The scores of
the basic parameters are aggregated appropriately to arrive at
the bank wise Health Performance Score (HPS). Priority
Performance Score (PPS) and Efficiency Performance Score
(EPS). The aggregate of HPS. PPS and EPS gives the CPS. The
Composite Performance Score (CPS) indicates the overall
performance of the bank/banks. Banks are ranked on the basis
of the CPS to understand vis-a-vis their overall performance.
A detailed analysis of the basic parameters and the
sub-parameters considered under the basic parameters and the
details of the apportionment of the scores to the various
sub-parameters are outlined in the following paragraphs.
117
Capital Adequacy and Qual i ty of Assets
Capital Adequacy is seen as the measure of a bank's
strength to absorb credi t risks i. e. its strength to provide
for losses that may arise upon its advance going bad. It is
expressed as a proportion of capital to assets weighted
according to the risk of default attached to them.
The Reserve Bank of India has come out with capital
/ldequacy norm for banks on the strength of Narasimham
Committee recommendations and in the light of Basle Committee 2
framework.
To strengthen the capital base of banks. the Reserve
Bank of India introduced in April 1992. a risk-weighted assets
ratio as the basis of assessment of capital for commercial
banks. including foreign banks. It was stipulated that (i)
Indian banks having branches abroad should achieve capital
2 The Committee on Banking Regulations and Supervisory practices set up under the aegis of Bank for International Settlement (BIS) Ileaded by Peter Cooke. known as Cooke Committee/Basle Committe recommer.ded guidelines on capital adequacy and risk assessment. The recommendations of this Committee formed the basis of the capital adequacy and risk assessment provisions introduced in all the countries. including India.
118
adequacy norm of 8 percent by March 1995. ( i i) foreign banks
operating in India should achieve the ratio of 8 percent by
~rch 1994 and (iii) other banks to achieve 4 percent ratio by
March 1993 and 8 percent ratio by March 1996.
Along with the above capital adequacy norm, the
Reserve bank of India introduced a new system called Income
Recognition and Asset classification to be followed by the
banks. The main object of this system is to ensure booking of
profit in respect of non-performing assets3 (NPA) only when it
is realised.
Other than the classification of assets either as
performing assets or non-performing assets, to ensure a
uniform. consistent and logical basis for reflecting the true
financial position. banks as per the Reserve bank of India
guidelines are required to classify their assets under four
categories viz.. Standard Assets .. Sub-Standard Assets.
Doubtful Assets and Loss Assets and appropriate provisions are
to be made. In terms of the guidelines issued by the Reserve
3 If interest charged to a borrowal account remains unpaid for a period of four quarters during the financial year 1992-93. three quarters during 1993-94 and two quarters from 1994-95 onwards. it has to be treated as a non-performing a~set(NPA) as per RBI guidelines.
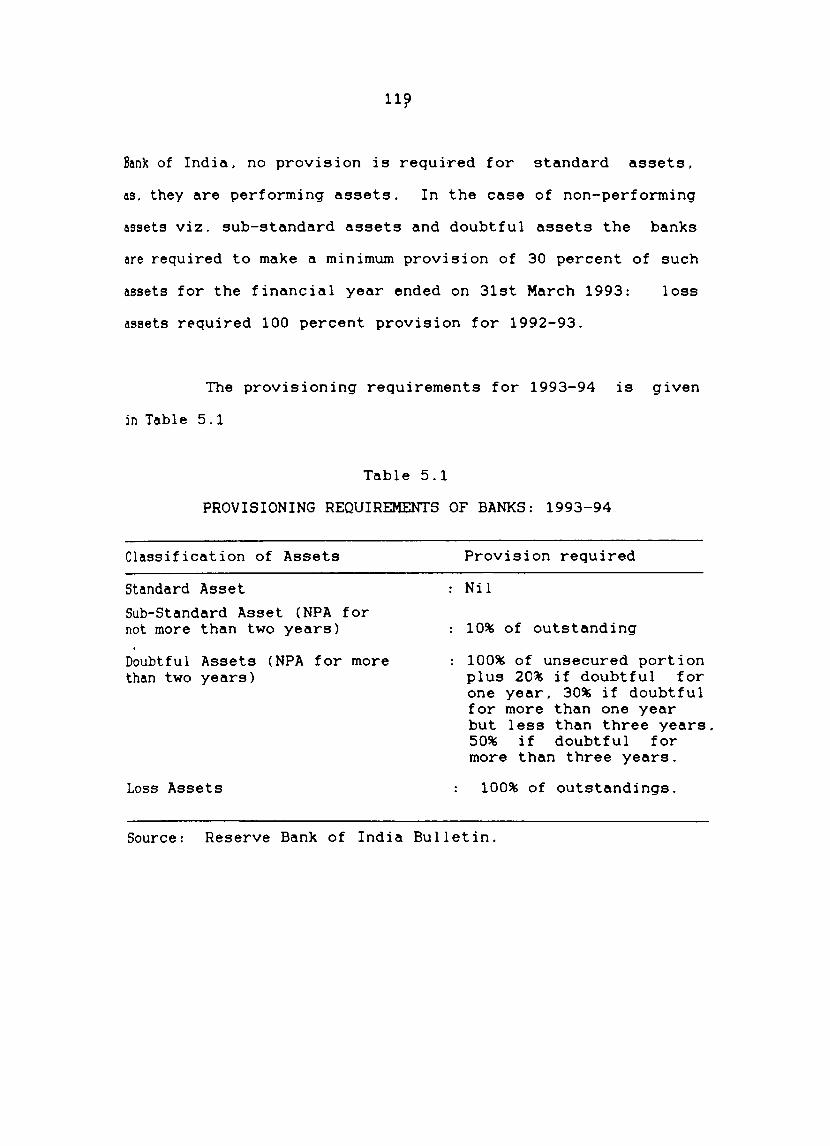
11~
&nk of India. no provision is required for standard assets.
as, they are performing assets. In the case of non-performing
assets viz. sub-standard assets and doubtful assets the banks
are required to make a minimum provision of 30 percent of such
assets for the financial year ended on 31st March 1993: loss
assets rE'quired 100 percent provision for 1992-93.
The provisioning requirements for 1993-94 is given
in Table 5.1
Table 5.1
PROVISIONING REQUIREMENTS OF BANKS: 1993-94
Classification of Assets
Standard Asset
Sub-Standard Asset (NPA for not more than two years)
Doubtful Assets (NPA for more than two years)
Loss Assets
Provision required
Nil
10% of outstanding
100% of unsecured portion plus 20% if doubtful for one year. 30% if doubtful for more than one year but less than three years. 50% if doubtful for more than three years.
100% of outstandings.
Source: Reserve Bank of India Bulletin.
120
The performance in capital adequacy and quality of
assets indicates the 'health' of the banks. An evaluation of
the performance of Syndicate Bank and other nationalised banks
will not give a clear picture without examining the extent of
their achievement in 'health'. Hence capital adequacy and
quality of assets ar~ incorporated in the 'Model' developed
for measuring the Health Performance and in assessing the
Composite Performance.
The following pertinent issues are raised in
relation to the performance of capital adequacy and quality of
assets of Syndicate Bank and other nationalised banks in the
present study.
(1) Whether Syndicate Bank and the rest of the
nationalised banks attained the minimum four percent capital
adequacy ratio during 1992-93 and 1993-94 irrespective of
their national and international presence.
(ii) Whether 100 percent provision for unsecured
doubtful debts and loss assets were made during 1992-93 and
1993-94.
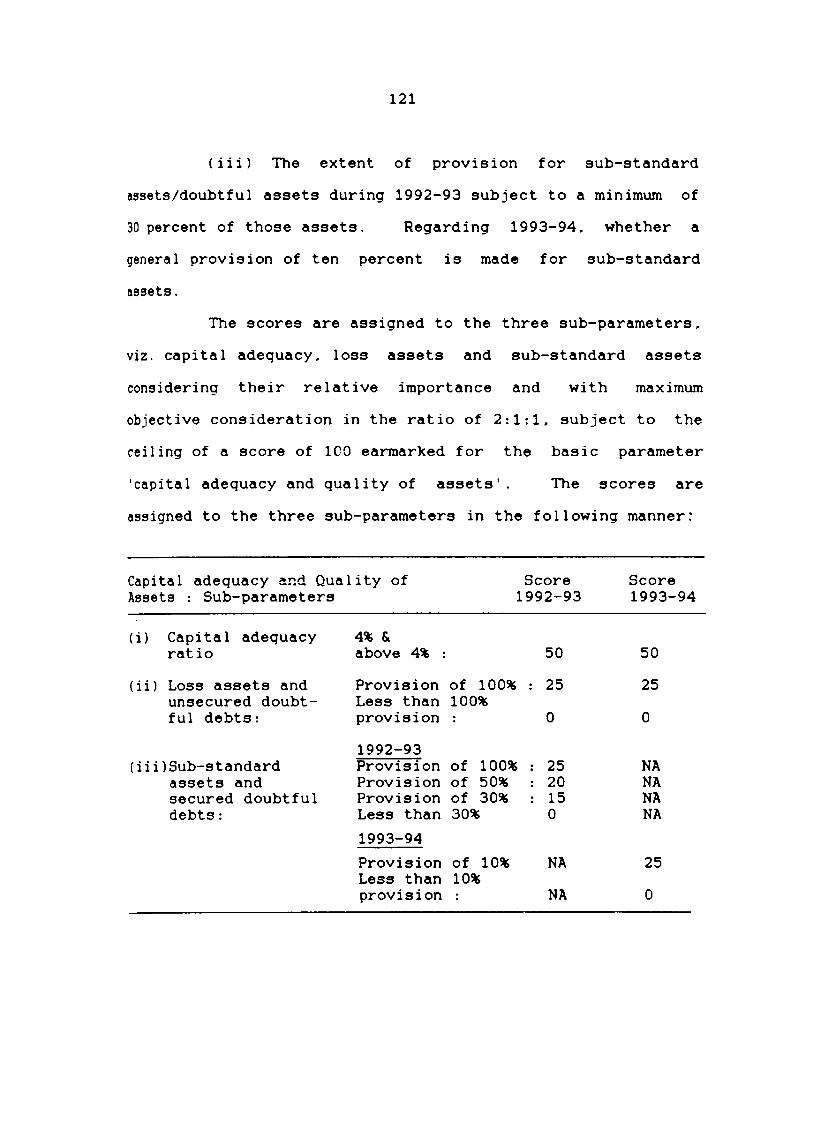
121
(iii) The extent of provision for sub-standard
assets/doubtful assets during 1992-93 subject to a minimum of
30 percent of those assets. Regarding 1993-94. whether a
general provision of ten percent is made for sub-standard
assets.
The scores are assigned to the three sub-parameters.
viz. capital adequacy. loss assets and sub-standard assets
considering their relative importance and with maximum
objective consideration in the ratio of 2:1:1. subject to the
ceiling of a score of 100 earmarked for the basic parameter
'capital adequacy and quality of assets'. The scores are
assigned to the three sub-parameters in the following manner:
Capital adequacy and Quality of Assets : Sub-parameters
Score 1992-93
(i) Capi ta 1 adequacy ratio
( i i) Loss assets and unsecured doubtful debts:
(iii)Sub-standard assets and secured doubtful debts:
4% & above 4% :
Provision of 100% Less than 100% provision
1992-93 Provision of 100% Provision of 50% Provision of 30% Less than 30%
1993-94
Provision of 10% Less than 10% provision
50
25
o
25 20 15 o
NA
NA
Score 1993-94
50
25
o
NA NA NA NA
25
o
122
Since capital adequacy and quality of assets are
recognised as important sub-parameters of bank performance
only with the introduction of the recommendations of the
Narasimham Committee in April 1992.the data in respect of
these sub-parameters are collected for the financial years
1992-93 and 1993-94. The scores are assigned on the basis of
the performance of the sub-parameters during these two years.
The average score of the two years is taken to arrive at the
score of the sub-parameter for the period of study. These
scores are aggregated to arrive at the score of the basic
parameter 'capital adequacy and quality of assets'. The score
attained is aggregated with the score of 'profitability' to
arrive at the Health Performance Score. which form part of the
Composite Performance Score.
Profitability
The concept of profitability in banks
greater significance in the present day context.
other business institution. profit is necessary to
for their survival. A viable and profit making bank
assumes
Like any
the banks
reflects
operational efficiency and effective and efficient resource
management. There is adoptability of well-planned systems and
123
procedures and a successful organisation4
Profitability is mainly based on the concept of
profit: it is the profit making ability of an enterprise.
The profitability earned by an organisation over the years is
a barometer reflecting organisational performanceS
Management of profitability is a broad concept which
consists of many factors. viz. efficient management of assets.
moderate cost of funds. attractive yield on advances.
effective investment portfolio. faster liquidity of funds.
optimum level of productivity. required control on operational
expenses etc. The level of profitability of banks would
largely depend on developing a spirit of cost consciousness at
all levels and strengthening overall monitoring arrangem6Dts.
A thorough examination of the profitability performance of the
nationalised banks in India is undertaken in the present study.
'Profitability' as a parameter is incorporated in the 'Model'
developed for assessing the Composite Performance Score of the
nationalised banks.
4
5
Sinha Kanhaiya. "Profit Planning in Banks" in: S.S.Hugar(ed.). T~ends and Challenges to Indian Banking. Deep and Deep Publications. New Delhi. 1993. p.43.
Kolay M.K.. "Measuring the total Performance of an Organisation". Productivity. Vol.34. No.2. (July September. 1993). p.275.
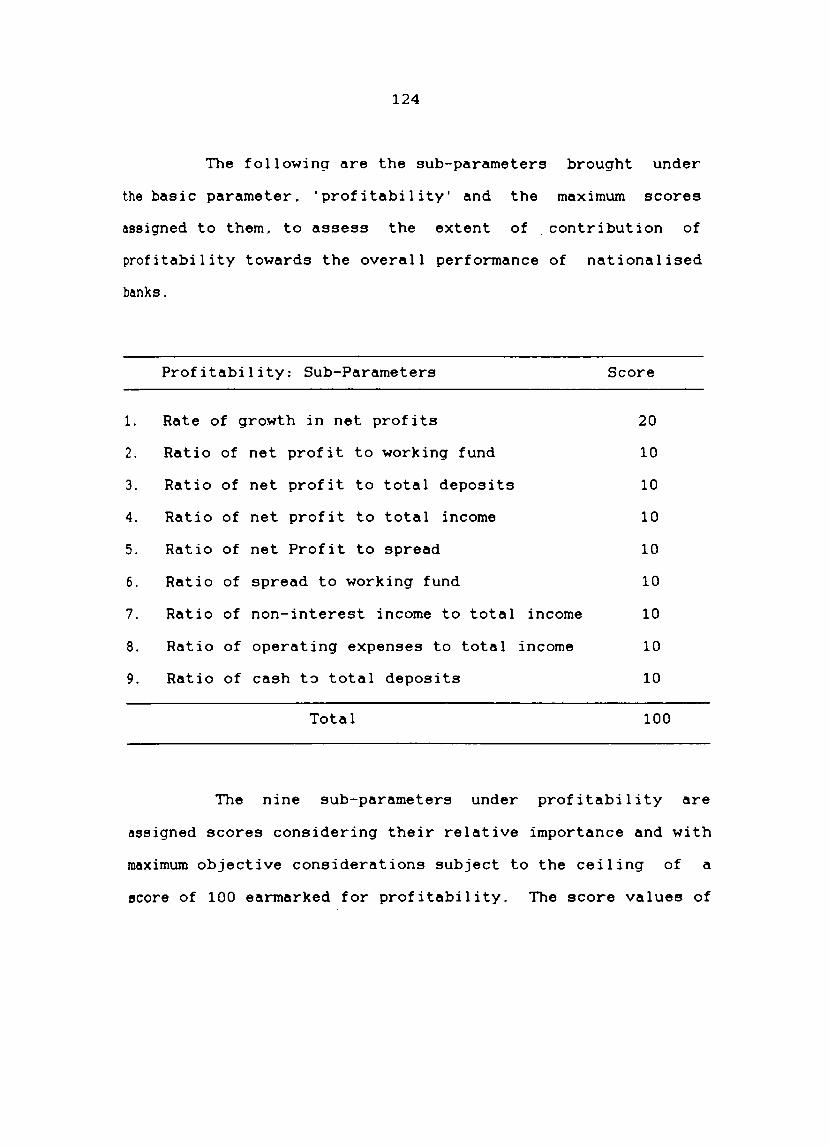
124
The following are the sub-parameters brought under
the basic parameter. 'profitability' and the maximum scores
assigned to them. to assess the extent of contribution of
profitability towards the overall performance of nationalised
banks.
Profitability: Sub-Parameters Score
1. Rate of growth in net profits 20
2. Ratio of net profit to working fund 10
3. Ratio of net profit to total deposits 10
4. Ratio of net profit to total income 10
5. Ratio of net Profit to spread 10
6. Ratio of spread to working fund 10
7. Ratio of non-interest income to total income 10
8. Ratio of operating expenses to total income 10
9. Ratio of cash t~ total deposits 10
Total 100
The nine sub-parameters under profitability are
assigned scores considering their relative importance and with
maximum objective considerations subject to the ceiling of a
score of 100 earmarked for profitability. The score values of
125
the sub-parameters pertaining to the ten year period of study
is arrived at in conformity with the methodology in the
present study. The score value of profitability attained is
aggregated with the score value of 'capital adequacy and
quality of assets' to arrive at the Health Performance Score
which forms part of the Composite Performance Score.
Social Banking
Social Control on banks is a measure to employ
prudently and purposefully the bank deposits along productive
and socially desirable channels. It was introduced with the
objective of achieving economic growth. combined with
stability and ~ocial justice. as envisaged in the national
plan and an accepted policy of the Government.
Under social banking. banks are required to assist
increasingly the neglected sectors such as agriculture. small
scale industries. self-employment. small business. education.
etc .. which had hardly any access to the banking system prior
to the nationalisation of the major commercial banks in 1969.
For ensuring a progressively increasing flow of bank credit to
the economically backward sectors of the economy. targets for
lending were laid down. In September 1979. Indian Public
126
Sector Banks were asked to lend at least 3~/9 percent of
their total credit to the above mentioned priority sectors and
this target was raised to a minimum of 40 percent to be
achieved by March 1985. The target is being continued
thereafter. As a measure of further social justice.
sub-targets were prescribed within the specified
sectors. to be achieved by the banks. particularly
public sector banks.
separate
priority
by the
The Differential Interest Rate Scheme was introduced
in 1972 by the Public sector banks where loans were granted at
the concessional rate of four percent to the weakest among the
weaker section. The 20-point Economic Programme. and various
other socio-economic programmes for the benefit of backward
communities, minority communities and women have been launched
by the Government through the banks.
To what extent the individual nationalised banks
~re able to excel in Social banking? An examination of the
social baking performance of the individual nationalised banks
in India is undertaken in the present study. Social banking
is incorporated as a p~rameter in the 'Model' developed for
assessing the Composite Performance Score of the nationalised
banks.
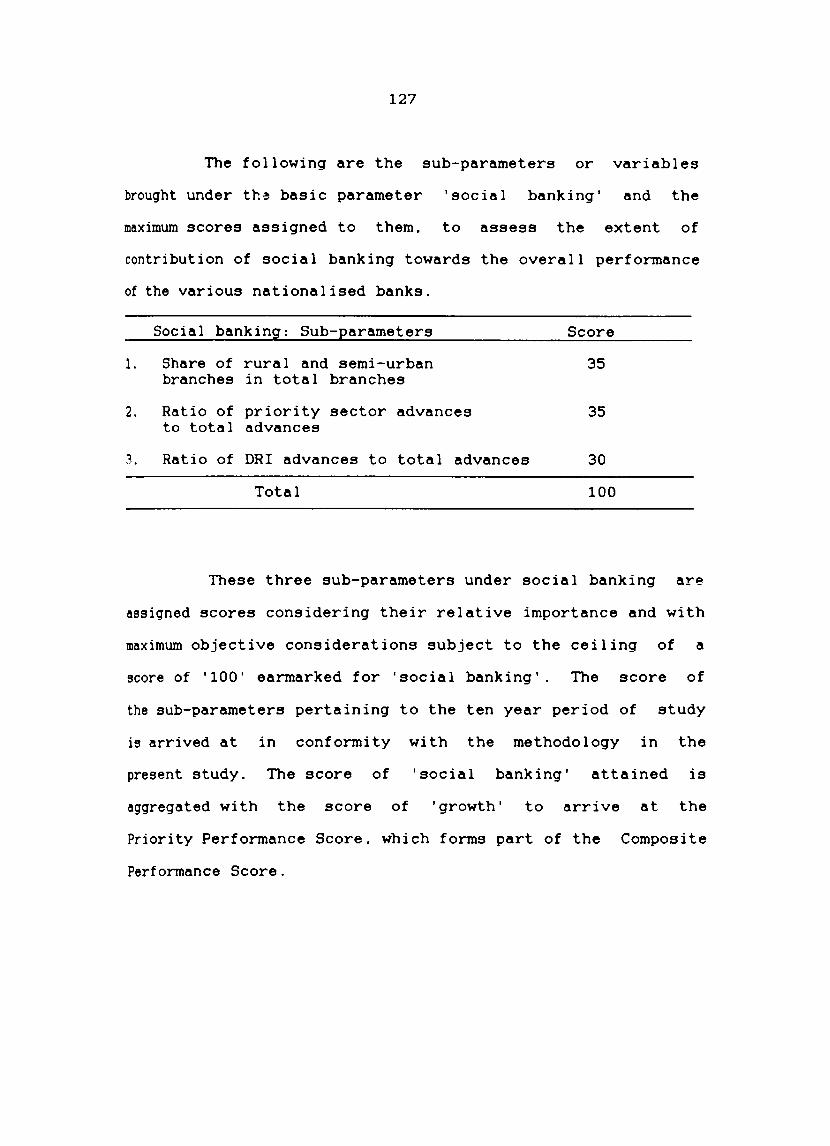
127
The following are the sub-parameters or variables
brought under th~ basic parameter 'social banking' and the
maximum scores assigned to them, to assess the extent of
contribution of social banking towards the overall performance
of the various national ised banks.
1.
2.
3.
Social banking: Sub-parameters
Share of rural and semi-urban branches in total branches
Ratio of priority sector advances to total advances
Ratio of DRI advances to total advances
Total
Score
35
35
30
100
These three sub-parameters under social banking are
assigned scores considering their relative importance and with
maximum objective considerations subject to the ceiling of a
score of 'lOO' earmarked for 'social banking'. The score of
the sub-parameters pertaining to the ten year period of study
is arrived at in conformity with the methodology in the
present study. The score of 'social banking' attained is
aggregated with the score of 'growth' to arrive at the
Priority Performance Score, which forms part of the Composite
Performance Score.
128
The aim of every institution is to grow. During
the post nationalisation period. the banks have grown
functionally. geographically and multi-dimensionally in
various business parameters.
With an increase in branch offices. the banks
attracted a lot of deposits. Whatever be the type of
deposits. an increase in the quantity of deposits of banks is
an index of their growth. The growth in deposits naturally
tempt the banker to increase his advances and investment
portfolio. The growth in advances or investment is really an
index of bank's growth. Banks cannot survive without balanced
growth in these variables: the growth of one variable affects
other variables too.
The growth in deposits and advances if managed
properly will contribute to the growth of profits. and if not
cared. may lead to the growth in losses. Growth in profits
can lead to growth in reserves and consequently to
equity. A growth in Q number of variables in
growth in
the right
direction is hence required for an allround growth and sound
performance of the banks. A thorough examination of the
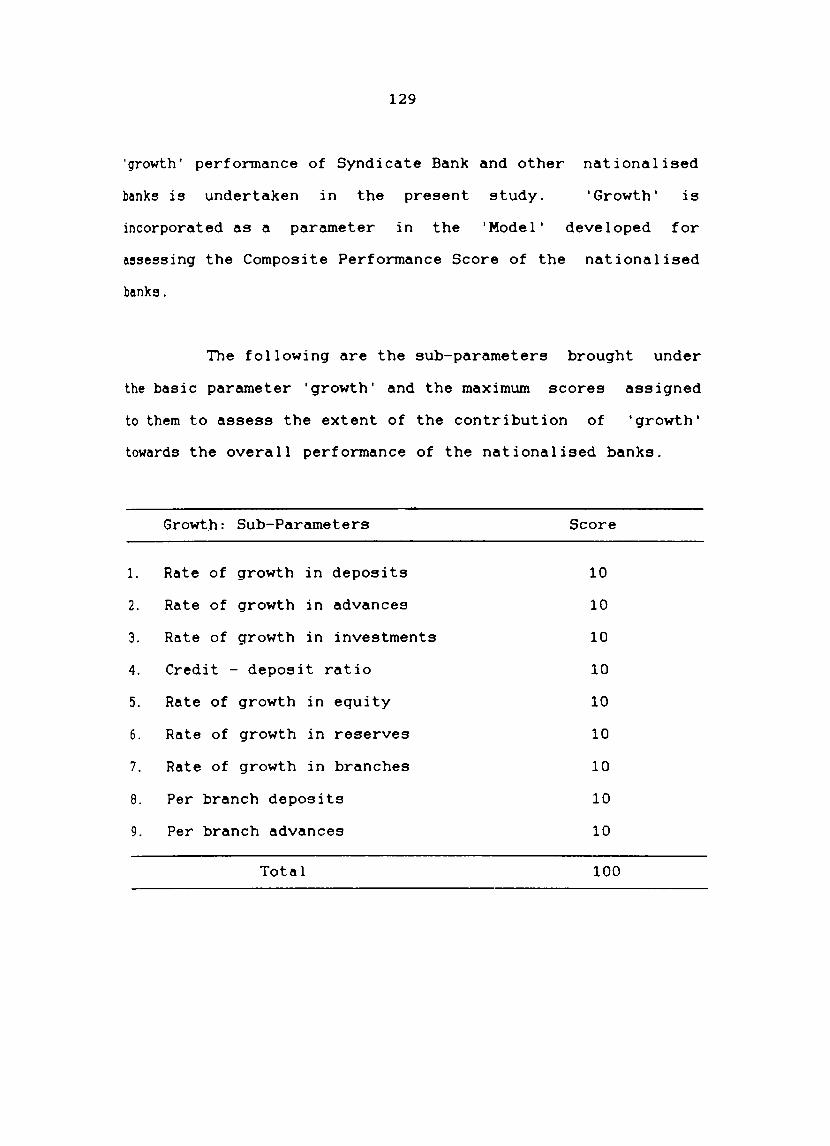
129
'growth' performance of Syndicate Bank and other nationalised
banks is undertaken in the present study. 'Growth' is
incorporated as a parameter in the 'Model' developed for
assessing the Composite Performance Score of the nationalised
banks.
The following are the sub-parameters brought under
the basic parameter 'growth' and the maximum scores assigned
to them to assess the extent of the contribution of 'growth'
towards the overall performance of the nationalised banks.
Growth: Sub-Parameters Score
1. Rate of growth in deposits 10
2. Rate of growth in advances 10
3. Rate of growth in investments 10
4. Credit - deposit ratio 10
5. Rate of growth in equity 10
6. Rate of growth in reserves 10
7. Rate of growth in branches 10
8. Per branch deposits 10
9. Per branch advances 10
Total 100
130
The nine sub-parameters under 'growth' are assigned
scores considering their relative importance and with maximum
objective considerations. subject to the ceiling of a score of
100 earmarked for 'growth'. The score values of the
sub-parameters pertaining to the ten year period of study is
arrived at in conformity with the methodology in the present
study. The score value for 'growth' arrived at is aggregated
with the score value of 'social banking' to arrive at the
Priority Performance Score. which forms part of the Composite
Performance Score.
Productivity
Productivity as understood in common parlance. is
the output per unit of input employed: it is the output/input
ratio. The basic definition of productivity is the ratio of
t t t . t 6 ou pu 0 lnpu
The commercial banks in India as a whole had given
only little emphasis to productivity in the seventies and the
6 Srivastava T.N.. and A.K. Sharma. 'Productivity in Banks-Comparative Evaluation of Fourteen nationalised Banks'. Bank Economists Meet. Collection of Papers presented at the Madras Conference. 1984. pp.232-45.
131
eighties. Now the emphasis started shifting towards
efficiency and productivity. It is recognised that wi~h
increasing emphasis on social banking, it is impossible to
increase profit without improving efficiency and productivity.
As emphasized by Productivity, Efficiency and Profitability
Committee on Banking, (PEP Committee) banks being business
organisations, profit should continue to remain an important
"d t" 7 comn era lon . Under the given circumstances profit is to be
improved by improving productivity.
The approach of Narasimham Committee (1991) has been
to ensure that the financial services industry operates on the
basis of operational flexibility and functional autonomy with
a view to enhancing efficiency, productivity and
profitability.
The concept and definition of productivity as
applied in other industries cannot be applied in banking
industry. which is primarily a service industry. It enabled
service industries like banking to avoid the question of
productivity for a long time.
7 Reserve Bank of India, Report of the Efficiency and Profitability (PEP)Committee 1977. p.42.
Productivity. on Banking,
132
As banks produce services. the measurement of their
output may pose conceptual difficulty8. In fact. productivity
indicated by per employee. per office and some financial
indicators are popular all over the world and are mostly
rei ied upon. According to Cunningham. 'the universal
yardsticks of banking economies are. profit. profit per square
foot and prof it per emp loyee ,9
Productivity as a parameter is incorporated in the
'Model' developed for assessing the Composite Performance of
the national ised banks.
The following are the sub-parameters brought under
the basic parameter 'productivity' and the maximum scores
assigned to them to assess the extent of the contribution of
Syndicate Bank and other nationalised banks:-
8
9
Ismai l. Abd'i..ll Hal im. "Productivi ty in Banking and Finance". Banker's Journal. Malaysia. (October. 1982). p.34.
Cunningham. Annual branches). 1985.
Report. Grindlays Bank (India
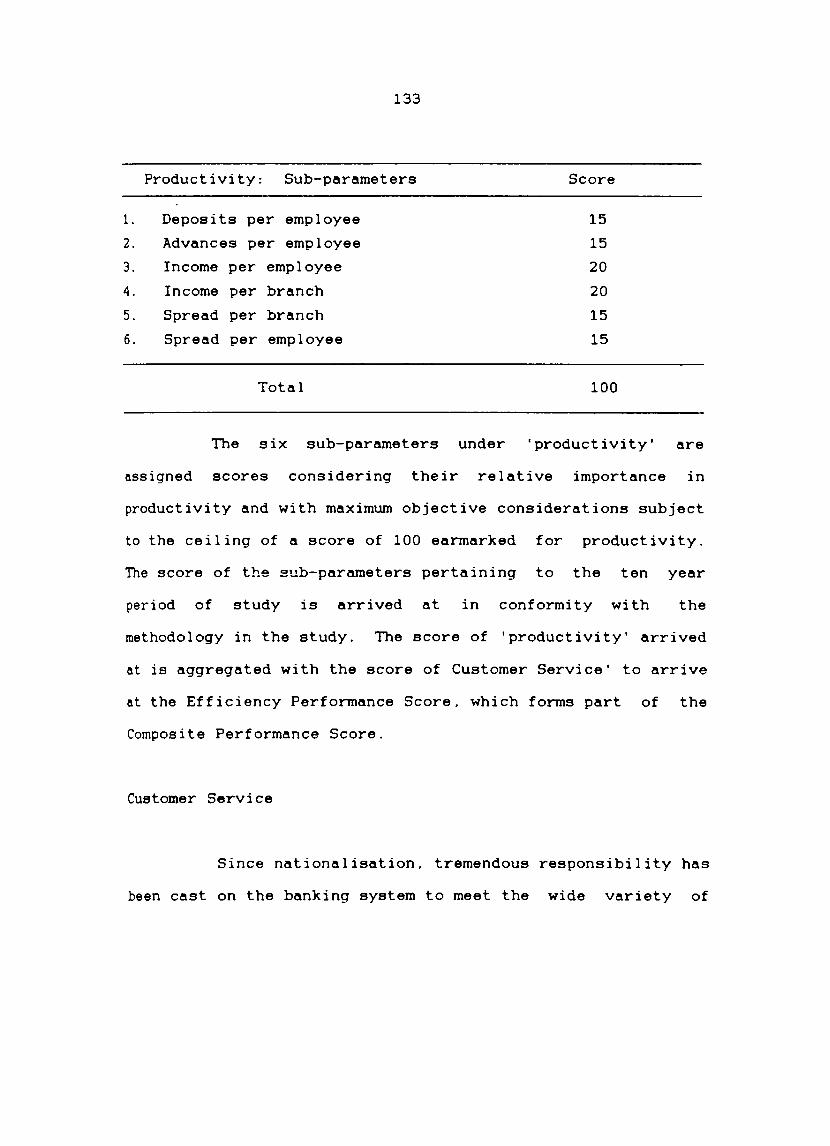
133
Productivity: Sub-parameters Score
l. Deposits per employee 15
2. Advances per employee 15
3. Income per employee 20
4. Income per branch 20
5. Spread per branch 15
6. Spread per employee 15
Total 100
The six sub-parameters under 'productivity' are
assigned scores considering their relative importance in
productivity and with maximum objective considerations subject
to the ceiling of a score of 100 earmarked for productivity.
The score of the sub-parameters pertaining to the ten year
period of study is arrived at in conformity with the
methodology in the study. The score of 'productivity' arrived
at is aggregated with the score of Customer Service' to arrive
at the Efficiency Performance Score. which forms part of the
Composite Performance Score.
Customer Service
Since nationalisation. tremendous responsibility has
been cast on the banking system to meet the wide variety of
134
needs of the vast and varied clientle. The clientle vary from
the smallest and the weakest in society to the corporate
giants in the publ ic or private sector. The customers tend to
assess a bank's working and its responsiveness mainly on the
basis of the speed and quality of service delivered at its
~anches and counters. rather than on other functional
parameters. Competing banks provide the same type of service.
but they do not provide the same quality of service is
becoming a great differentiator the most powerful
competitive weapon banks possess 1O .
'Customer Service' is an extremely dynamic concept.
~at is good customer service today may be considered as an
indifferent one tomorrow and a bad service the day after. It
is essential for banks to continuously assess how customers
perceive bank services. what are their expectations and how
they can be satisfied. There is always room for improvement
in customer servi ce .
To quote the words of the former Chairman of the
State Bank of India "Banking system in India has grown in an
environment where it provides what it wants to provide. where
10 Gupta Shekhar. "Improving Customer Service in Banks". Banking Finance. 1992. p.34.
135
it wants and when it wants. This has to change in favour of
providing the customer what he wants. when he wants and where
he wants 11 . This will not only mean developing new services
and new instruments to meet the emerging needs of customers:
it will also mean rendering services in an efficient and
effect i ve manner.
'Customer service' as a parameter is incorporated in
the Model developed for assessing the Composite Performance of
Syndicate Bank and other nationalised banks. A systematic and
scientific study of the customer service extended by the
nationalised banks was carried out with he aid of an interview
schedule consisting of 29 questions that matter the customer
(Appendix 11 for schedule).
The universe for the selection of branches for
collection of data on customer service is restricted to
Kerala. The survey on the customer service extended by the
branches of the nationalised banks in Kerala was conducted in
1993 based on the branch position as on 31st March 1992. Of
the total 1125 branches of the nationalised banks in Kerala
comprising 130 rural branches. 715 semi-urban branches and 280
urban branches. 90 branches constituting eight percent of the
11 Sreenivasan P.B.. "Marketing Approach to Banking Services". The Journal of the Indian Institute of Bankers. Vol.58. (July-September 1987). p.129.
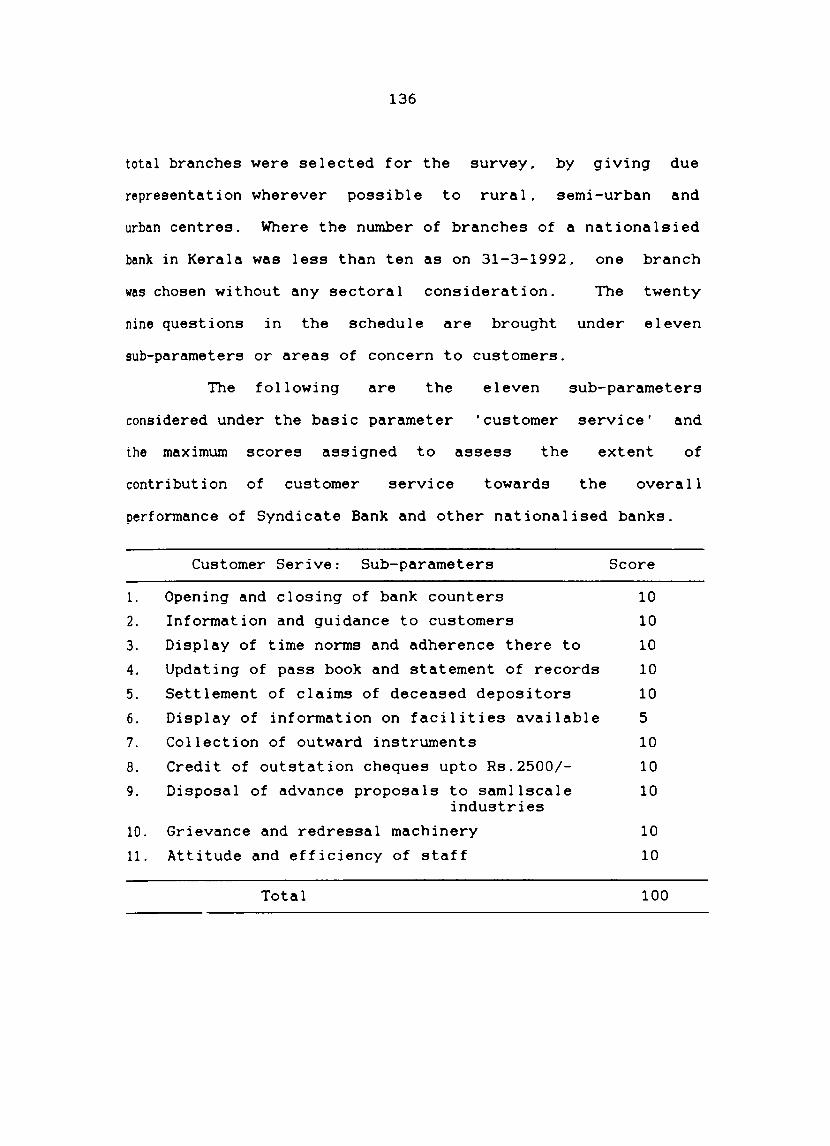
136
total branches were selected for the survey. by giving due
representation wherever possible to rural. semi-urban and
urban centres. Where the number of branches of a nationalsied
~nk in Kerala was less than ten as on 31-3-1992. one branch
~s chosen without any sectoral consideration. The twenty
nine questions in the schedule are brought under eleven
sub-parameters or areas of concern to customers.
The following are the eleven sub-parameters
considered under the basic parameter 'customer service' and
the maximum scores assigned to assess the extent of
contribution of customer service towards the overall
performance of Syndicate Bank and other nationalised banks.
Customer Serive: Sub-parameters Score
1. Opening and closing of bank counters 10
2. Information and guidance to customers 10
3. Display of time norms and adherence there to 10
4. Updating of pass book and statement of records 10
5. Settlement of claims of deceased depositors 10
6. Display of information on facilities available 5
7. Collection of outward instruments 10
B. Credit of outstation cheques upto Rs.2500/- 10
9. Disposal of advance proposals to samllscale 10 industries
10. Grievance and redressal machinery 10
11. Attitude and efficiency of staff 10
Total 100
137
The various questions under the eleven
sub-parameters are assigned scores on the basis of their
relative importance and objective considerations subject to
the ceiling limit of a score of 'lOO' earmarked for 'customer
service' in the computation of the Composite Performance
Score.
Thus the EMEE Model comprising of the six vital
parameters of bank performance identified in the study
capital adequacy and quality of assets. profitability. social
banking. growth. productivity and customer service brought
under three sub-headings Health Performance. Priority
Performance. and Efficiency Performance and eventually under
Composite Performance provides an overall picture of the
performance of Syndicate Bank and the rest of the nationalised
banks in India. The assignment of the scores to the forty one
sub-parameters. the six basic parameters and their aggregation
under three sub-headings and eventually under the Composite
Performance Score is done most judiciously to arrive at a
score that is capable of indicating the true performance. The
Composite Performance Score arrived at covering a period of
ten years is capable of providing a definite picture of the
performance of Syndicate Bar.k and other nationalised banks.

138
The comparative performance position of the nationalised banks
could be better understood by their respective Composite
Performance Scores.
CHAPTER VI
PERFORMANCE EFFECTIVENESS OF SYNDICATE BANK
NATIONALISED BANKS: AN ANALYSIS
AND OTHER
The Economic Managerial Efficiency Evaluation Model
(EMEE Mode 1 ) developed by the researcher for the
accomplishment of the present study is outlined in chapter V.
In :he present chapter an attempt is made to evaluate the
Economic Managerial and Efficiency performance of Syndicate
Bank and other nationalised banks on the basis of the
different parameters identified and included in the Model.
The performance is analysed under the following headings. viz.
Health Performance. Priority Performance.Efficiency
Performance and Composite Performance.
6.1. Health Performance (HP)
As already explained. Health Performance is the
aggregate of the performance of 'capital adequacy and quality
of assets' as well as 'profitability'.
140
6.1.1. Capital Adequacy and Quality of Assets:
Table 6.1 indicates the capital adequacy ratio
attained by Syndicate Bank and other nationalised banks during
the two financial years. 1992-93 and 1993-94. Wherever the
banks attained a higher capital adequacy ratio in relation to
the minimum of four percent prescribed by the Reserve Bank of
India, the exact ratio attained is shown in the table. Where
the ratio attained is less than the minimum prescribed. it is
shown with an (*). The two financial years about which
information about capital adequacy is available reveal that
Syndicate Bank has failed to attain the prescribed ratio
during 1992-93 and 1993-94. Of the other eighteen (excluding
New Bank of India) nationalised banks. seven banks achieved
the minimum level of four percent prescribed by the Reserve
Bank of India for 1992-93'. eight of the banks achieved four
percent during 1993-94. the minimum ratio prescribed for banks
incorporated in India and are operating in the country alone.
Though the Reserve Bank of India has stipulated a minimum
capital adequacy ratio of eight percent to be attained by
Indian banks with international presence by the end of the
financial year 1993-94. for the present study four percent
ratio is stipulated irrespective of their national or
international presence. Of the seven nationalised banks with
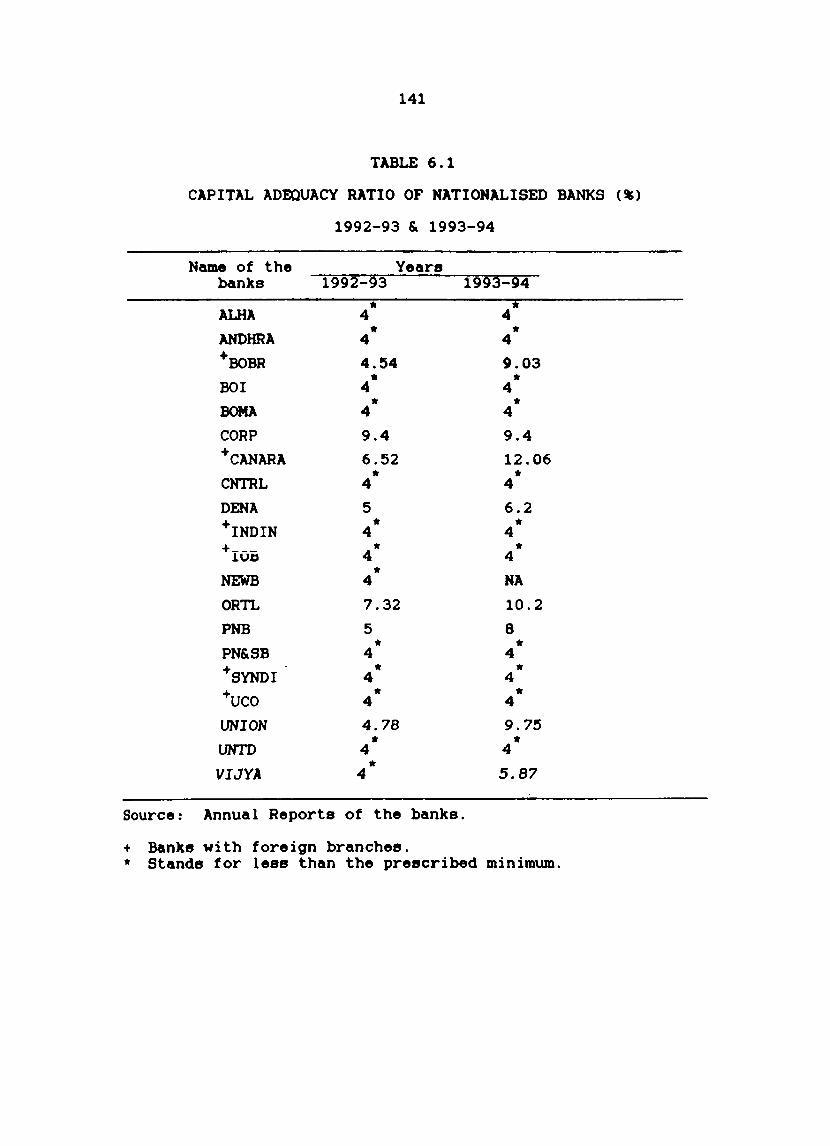
141
TABLE 6.1
CAPITAL ADEQUACY RATIO OF NATIONALISED BANKS (%)
1992-93 & 1993-94
Name of the Years banks 1992-93 1993-94
* * ALHA 4 4 * * ANDHRA 4 4
+BOBR 4.54 9.03 * * BOI 4 4 * * SOMA 4 4
CORP 9.4 9.4 +CANARA 6.52 12.06
* * CNTRL 4 4
DENA 5 6.2 +INDIN * * 4 4 +--- * * lUD 4 4
* NEWB 4 NA
ORTL 7.32 10.2
PNB 5 8 * * PN&SB 4 4
+SYNDI - * * 4 4 +UCO * * 4 4
UNION 4.78 9.75 * * UNTD 4 4 *
VIJYA 4 5.87
Source: Annual Reports of the banks.
+ Banks with foreign branches. * Stands tor less than the prescribed minimum.
142
international presence. Syndicate Bank and four other banks.
could not attain even the four percent ratio in 1993-94 as is
revealed from Table 6.1. The attainment of the minimum
capital adequacy ratio ensures the soundness and financial
health of the banks. It is the outcome of the banks
performance in the areas covered by the other parameters too.
The Table discloses the poor 'health' and dismal state of
affairs in Syndicate Bank and the other nationalised banks.
Table 6.2 on the quality of assets furnishes the
extent of provision made by the nationalised banks in respect
of doubtful and loss assets and sub-standard assets during
1992-93 and 1993-94. As per the prudential accounti .. g norms
prescribed by the Reserve Bank of India. and which is followed
in the present study. a provision of hundred percent is to be
made for loss assets and to the unsecured part of the doubtful
debts during 1992-93 and 1993-94. Syndicate Bank and all the
other nationalised banks made a provision of
for 1992-93 and 1993-94. The minimum
hundred percent
stipulated for
sub-standard assets was thirty percent during 1992-93 and ten
percent during 1993-94. All the nationalised banks including
Syndicate Bank made the minimum stipulated provision for
1992-93 and 1993-94. Canara Bank and Vijaya Bank made a
provision of 100 percent and Dena Bank to the extent of 50
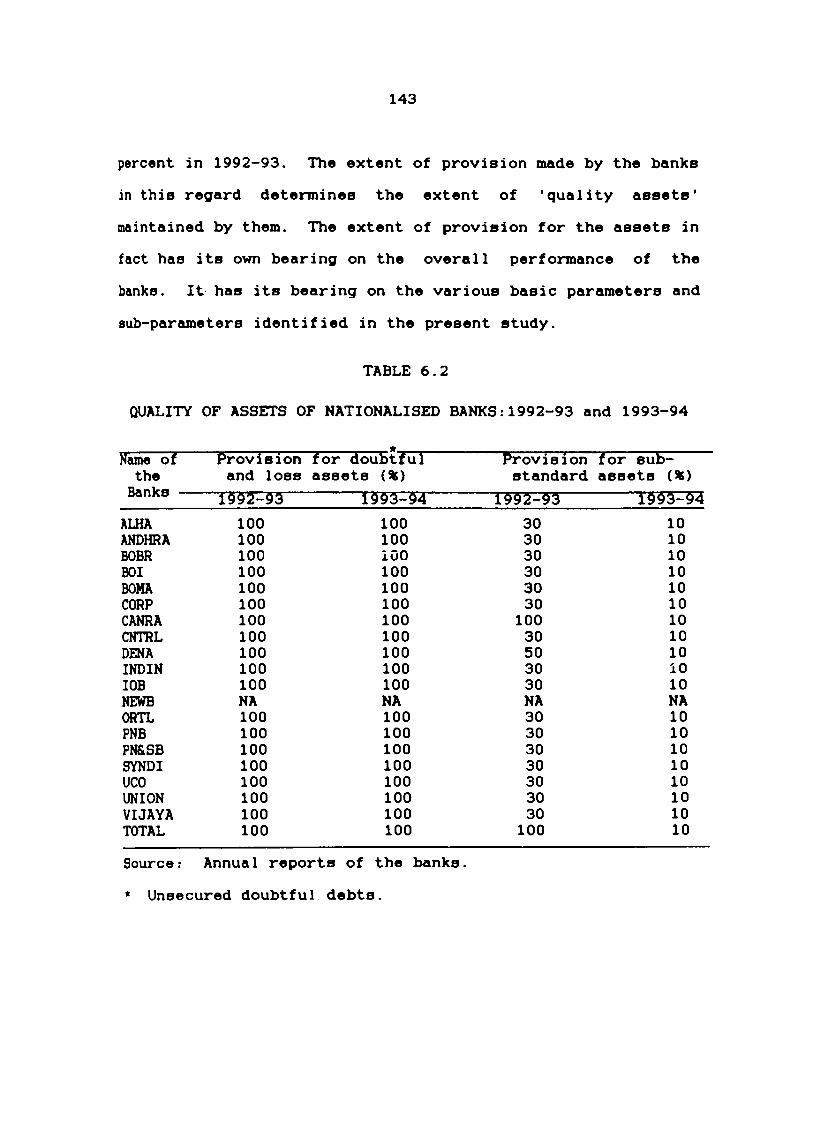
143
percent in 1992-93. The extent of provision made by the banks
in this regard determines the extent of 'quality assets'
maintained by them. The extent of provision for the assets in
fact has its own bearing on the overall performance of the
banks. It has its bearing on the various basic parameters and
sub-parameters identified in the present study.
TABLE 6.2
QUALITY OF ASSETS OF NATIONALISED BANKS: 1992-93 and 1993-94
Name of the
Banks
Provision for doubt~f-uTl---------P-r-ov-Ti-s~i-on--7fo-r---s-ubr------and loss assets (%) standard assets (%)
ALHA ANDHRA BOBR 801 BOMA CaRP CANRA CNTRL DENA INDIN lOB NEWB ORTL PNB PN&SB SYNDI UCO UNION VIJAYA TOTAL
1992-93 100 100 100 100 100 100 100 100 100 100 100 HA 100 100 100 100 100 100 100 100
1993-94 100 100 100 100 100 100 100 100 100 100 100 HA 100 100 100 100 100 100 100 100
Source: Annual reports of the banks.
* Unsecured doubtful debts.
1992-93 1993-94 30 30 30 30 30 30
100 30 50 30 30 HA 30 30 30 30 30 30 30
100
10 10 10 10 10 10 10 10 10 10 10 HA 10 10 10 10 10 10 10 10
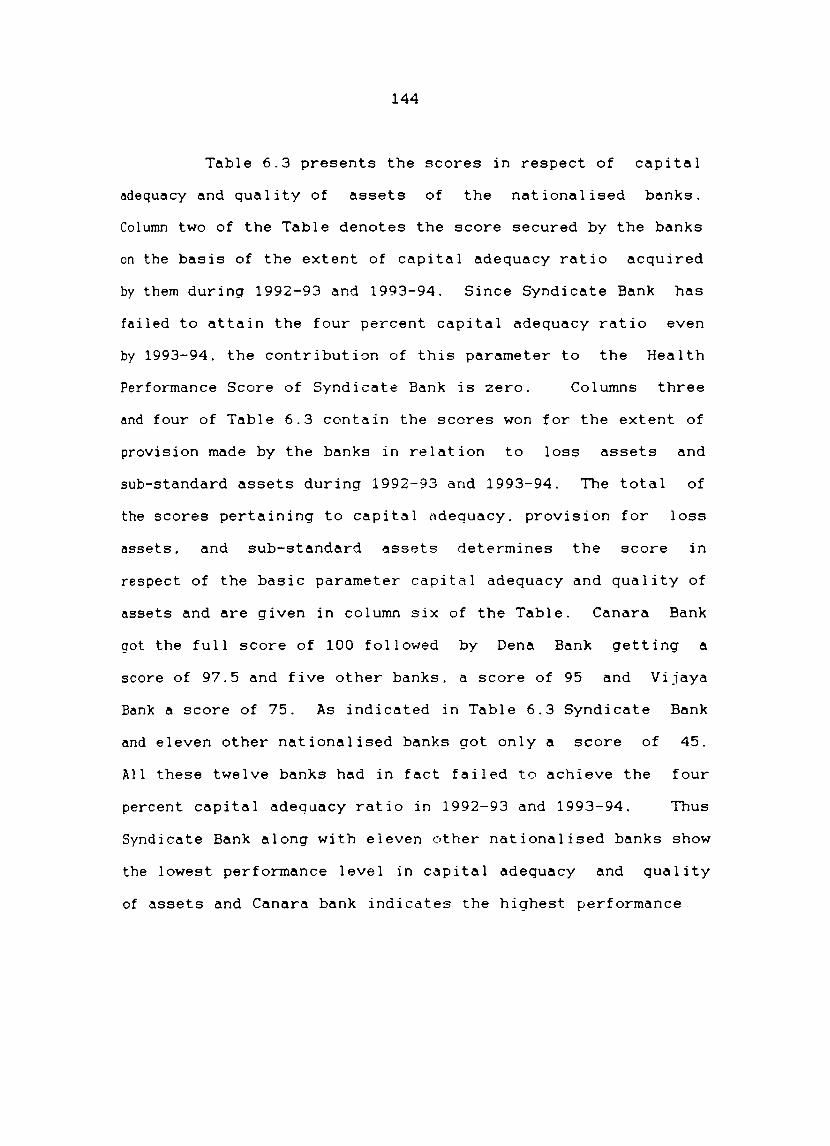
144
Table 6.3 presents the scores in respect of capital
adequacy and quality of assets of the nationalised banks.
Column two of the Table denotes the score secured by the banks
on the basis of the extent of capital adequacy ratio acquired
by them during 1992-93 and 1993-94. Since Syndicate Bank has
failed to attain the four percent capital adequacy ratio even
by 1993-94. the contribution of this parameter to the Health
Performance Score of Syndicate Bank is zero. Columns three
and four of Table 6.3 contain the scores won for the extent of
provision made by the banks in relation to loss assets and
sub-standard assets during 1992--93 and 1993-94. The total of
the scores pertaining to capital ndequacy. provision for loss
assets. and sub-standard assets determines the score in
respect of the basic parameter capital adequacy and quality of
assets and are given in column six of the Table. Canara Bank
got the full score of 100 followed by Dena Bank getting a
score of 97.5 and five other banks. a score of 95 and Vijaya
Bank a score of 75. As indicated in Table 6.3 Syndicate Bank
and eleven other nationalised banks got only a score of 45.
All these twelve banks had in fact failed to achieve the four
percent capital adequacy ratio in 1992-93 and 1993-94. Thus
Syndicate Bank along with eleven other nationalised banks show
the lowest performance level in capital adequacy and quality
of assets and Canara bank indicates Lhe highest performance
TA
BL
E 6
.3
SCO
RES
: C
API
TAL
ADEQ
UACY
AN
D Q
UA
LITY
O
F A
SSET
S O
F N
ATI
ON
ALI
SED
BA
NKS
Nam
e:
Ban
ks
Cap
ital
ad
equa
cy
Pro
vis
ion
fo
r P
rov
isio
n fo
r A
ggre
gate
sco
re
Agg
rega
te s
core
of
loss
ass
ets
. su
b s
tan
dar
d a
ssets
o
f lo
ss a
nd s
ub
-cap
ital
adeq
uacy
and
r-
' st
and
ard
ass
ets
. q
uali
ty o
f ass
ets
1 2
3 4
5 6
.---
----
----
----
----
--M
ax.
Sco
re:
50
Max
. S
core
: 25
M
ax.
Sco
re:
25
3+4
2+5
ALHA
0
.0
25
.0
20
.0
45
.0
45
.0
ANDH
RA
0.0
2
5.0
2
0.0
4
5.0
4
5.0
oo
BR
50
.0
25
.0
20
.0
45
.0
95
.0
001
0.0
2
5.0
2
0.0
4
5.0
4
5.0
:s
oMA
0.0
2
5.0
2
0.0
4
5.0
4
5.0
CO
RP
50
.0
25
.0
20
.0
45
.0
95
.0
CANA
RA
50
.0
25
.0
25
.0
50
.0
10
0.0
C
NTR
L 0
.0
25
.0
20
.0
45
.0
45
.0
DENA
5
0.0
2
5.0
2
2.5
4
7.5
9
7.5
1N
D1N
0
.0
25
.0
20
.0
45
.0
45
.0
lOB
0.0
2
5.0
2
0.0
4
5.0
4
5.0
NE
WB
0.0
2
5.0
2
0.0
4
5.0
4
5.0
OR
TL
50
.0
25
.0
20
.0
45
.0
95
.0
PNB
50
.0
25
.0
20
.0
45
.0
95
.0
PN
& SB
0
.0
25
.0
20
.0
45
.0
45
.0
SYN
DI
0.0
2
5.0
2
0.0
4
5.0
4
5.0
ue
o 0
.0
25
.0
20
.0
45
.0
45
.0
UNIO
N 5
0.0
2
5.0
2
0.0
4
5.0
9
5.0
U
NTD
0
.0
25
.0
20
.0
45
.0
45
.0
VIJ
YA
2
5.0
2
5.0
2
5.0
5
0.0
7
5.0
._
----
----
----
----
----
----
----
----
----
----
----
----
----
----
----
----
----
Bas
ed o
n T
able
6.1
and
Tab
le 6
.2.
146
6.1.2 Profitability
The rate of growth in net profit of the nationalised
banks has shown many ups and downs during the ten year period
of 1984 to 1993-94 as indicated in Table 6.4 The average
growth of net profit of all the nationalised banks showed the
highest deceleration during 1984. 1989-90. 1992-93 and
1993-94. the maximum deceleration being in 1992-93. All the
nationalised banks including Syndicate Bank recorded the
highest negative growth in net profit in 1992-93: the only
exception was Indian Bank which had its highest negative
growth in net profit in 1993-94. Though the increased
deceleration in net profit in 1992-93 and 1993-94 can be
attributed to the new provisioning and
such a huge deceleration is definitely
deteriorating profit making capacity
banks.
accounting methods.
the result of the
of the nationalised
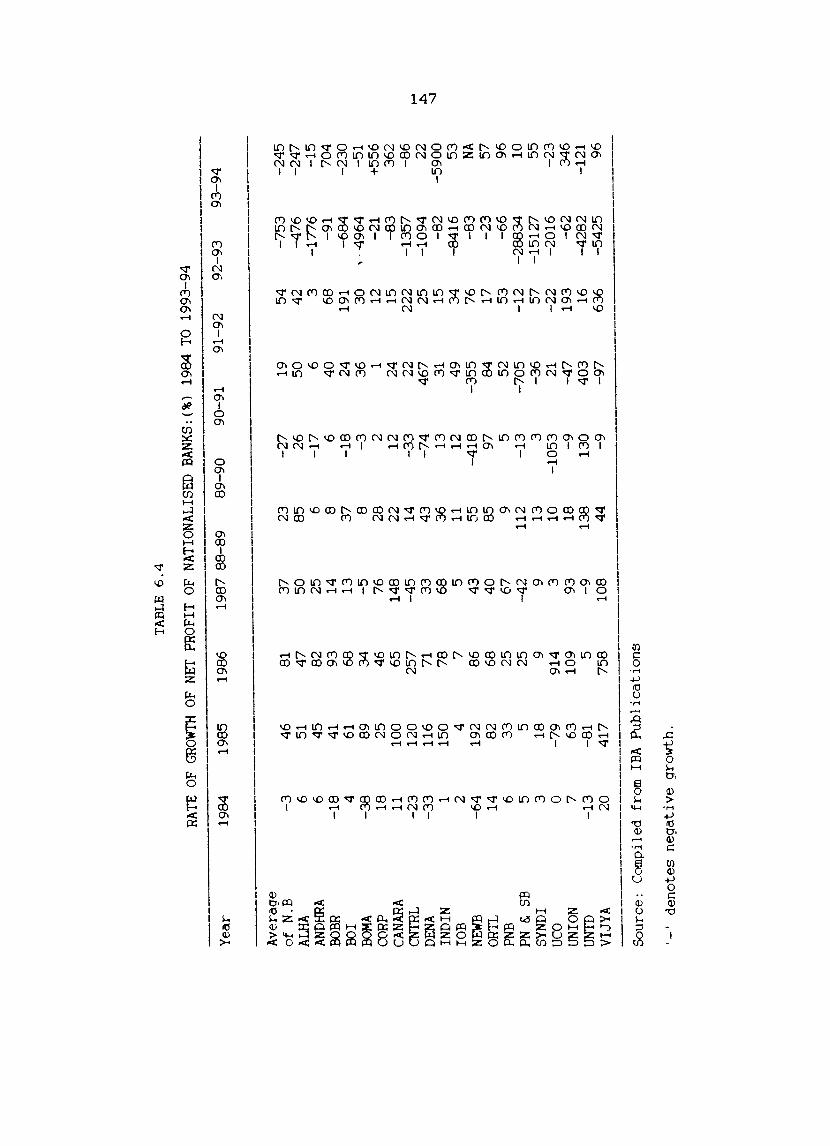
TABL
E 6
.4
RATE
OF
GROW
TH
OF
NET
PRO
FIT
OF
NA
TIO
NA
LISE
D B
AN
KS:
(%)
1984
TO
1993
-94
----
----
----
----
----
----
----
----
----
----
----
--Y
ear
1984
19
85
1986
19
87 8
8-89
89
-90
90-9
1 91
-92
92-9
3 93
-94
----
----
----
----
----
----
----
----
----
----
----
----
----
----
----
----
----
----
----
Ave
rage
o
f N
.B
-3
46
81
37
23
-27
19
54
-7
53
-2
45
ALHA
6
51
47
50
85
26
50
42
-47
6
-24
7
ANDH
RA
6 45
82
25
6
-17
6
3 -1
776
-15
BO
BR
-18
41
93
14
8
6 40
68
-9
1 70
4 BO
I 4
61
68
13
37
-18
24
19
1 -6
84
-2
30
BO
MA
-38
89
34
-5
8
-3
36
30
,·4
96
4
-51
CORP
18
25
46
76
28
2
1 12
-2
1
+556
CA
NARA
11
10
0 65
14
8 22
12
24
15
-8
3
362
CNTR
L -2
3
120
257
-45
14
-3
3
22
222
-135
7 -8
6
DENA
-3
3
116
71
33
43
-74
46
7 25
-1
094
22
t->
J:>
. IN
DIN
1
150
78
68
36
13
31
15
-8
2
-590
0 -.
..]
lOB
2
4 7
5 11
12
49
34
-8
416
53
NEW
B -6
4
192
86
43
55
-41
8
-35
5
76
-83
NA
OR
TL
14
82
68
40
85
97
84
17
-23
57
PN
B 6
33
25
67
9 5
52
53
-66
96
PN
&.
SB
5 5
25
-42
11
2 -1
3
-705
-1
2
-288
34
10
SYN
DI
3 18
9
9 13
3
-36
57
-1
5127
55
UC
O 0
-79
91
4 3
10
-105
3 21
-2
2
-201
6 -2
3
UNIO
N 7
63
109
93
18
-9
-47
19
3 -6
2
346
UNTD
-1
3
-81
5 -9
13
8 13
0 40
3 16
-4
282
-121
V
IJY
A
20
417
758
108
44
-9
-97
63
6 -5
425
96
----
----
----
----
----
----
----
----
----
----
----
----
---
Sou
rce:
C
ompi
led
from
IB
A
Pu
bli
cati
on
s
'-'
den
ote
s n
egat
ive
grow
th.
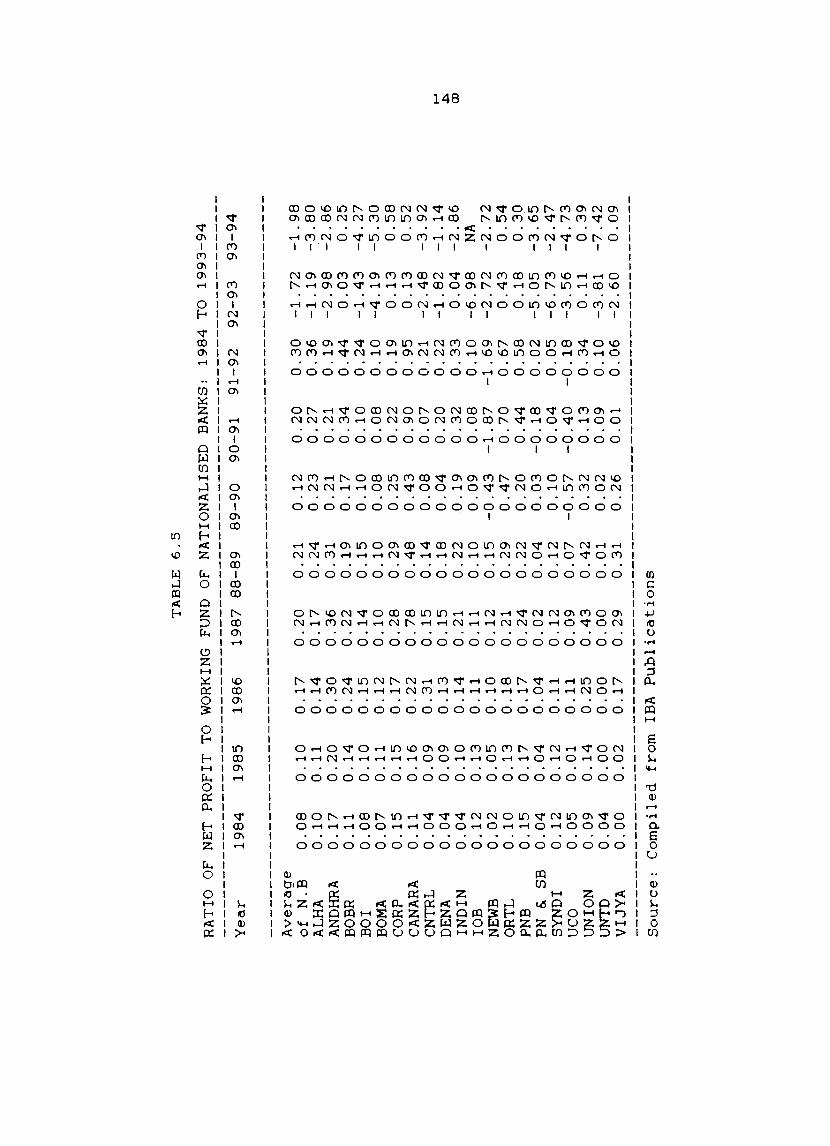
TA
BL
E
6.5
RA
TIO
O
F N
ET
PR
OF
IT
TO
WO
RK
ING
FU
ND
O
F N
AT
ION
AL
ISE
D
BA
NK
S:
19
84
TO
1
99
3-9
4
Year
19
84
1
98
5
19
86
1
98
7
88
-89
8
9-9
0
90
-91
9
1-9
2
92
-93
9
3-9
4
Av
era
ge
of
N.B
A
LHA
A
ND
HRA
B
OB
R
BO
I BO
MA
C
OR
P C
AN
AR
A
CN
TRL
DEN
A
IND
IN
lOB
N
EWB
OR
TL
PNB
PN
&
SB
SY
ND
I U
CO
U
NIO
N
UN
TD
V
IJY
A
0.0
8
0.1
0
0.1
7
0.1
1
0.0
8
0.0
7
0.1
5
0.1
1
0.0
4
0.0
4
0.0
4
0.1
2
0.0
2
0.1
0
0.1
5
0.0
4
0.1
2
0.0
5
0.0
9
0.0
4
0.0
0
0.1
0
0.1
1
0.2
0
0.1
4
0.1
0
0.1
1
0.1
5
0.1
6
0.0
9
0.0
9
0.1
0
0.1
3
0.0
5
0.1
3
0.1
7
0.0
4
0.1
2
0.0
1
0.1
4
0.0
0
0.0
2
0.1
7
0.1
4
0.3
0
0.2
4
0.1
5
0.1
2
0.1
7
0.2
2
0.3
1
0.1
3
0.1
4
0.1
1
0.1
0
0.1
8
0.1
7
0.0
4
0.1
1
0.1
1
0.2
5
0.0
0
0.1
7
0.2
0
0.1
7
0.3
6
0.2
2
0.1
4
0.1
0
0.2
8
0.7
8
0.1
5
0.1
5
0.2
1
0.1
1
0.1
2
0.2
1
0.2
4
0.0
2
0.1
2
0.0
9
0.4
3
0.0
0
0.2
9
0.2
1
0.2
4
0.3
1
0.1
9
0.1
5
0.1
0
0.2
9
0.4
8
0.1
4
0.1
8
0.2
2
0.1
0
0.1
5
0.2
9
0.2
2
0.0
4
0.1
2
0.0
7
0.4
2
0.0
1
0.3
1
So
urc
e:
Co
mp
iled
fr
om
IB
A
Pu
bli
cati
on
s
0.1
2
0.2
3
0.2
1
0.1
7
0.1
0
0.0
8
0.2
5
0.4
3
0.0
8
0.0
4
0.1
9
0.0
9
-0.4
3
0.4
7
0.2
0
0.0
3
0.1
0
-0.5
7
0.3
2
0.0
2
0.2
6
0.2
0
0.2
7
0.2
1
0.3
4
0.1
0
0.0
8
0.2
2
0.9
0
0.0
7
0.2
0
0.3
2
0.0
8
-1.8
7
0.7
0
0.4
4
-0.1
8
0.0
4
-0.4
0
0.1
3
0.0
9
0.0
1
0.3
0
0.3
6
0.1
9
0.4
4
0.2
4
0.1
0
0.1
9
0.9
5
0.2
1
0.2
2
0.3
3
0.1
0
-1.6
9
0.6
7
0.5
8
0.0
2
0.0
5
-0.1
8
0.3
4
0.1
0
0.0
6
-1.7
2
-1.1
9
-2.9
8
0.0
3
-1.4
3
-4.1
9
0.1
3
0.1
3
-2.4
8
-1.
82
0
.04
-6
.98
-2
.72
0
.43
0
.18
-5
.05
-6
.73
-3
.56
0
.11
-3
.81
-2
.60
-1.9
8
-3.8
0
-2.8
6
0.2
5
-4.2
7
-5.3
0
0.5
8
0.5
2
-3.9
2
-1.1
4
-2.8
6
NA
-2.7
2
0.5
4
0.3
0
-3.6
5
-2.4
7
-4.7
3
0.3
9
-7.4
2
0.0
9
.....
.to
CD
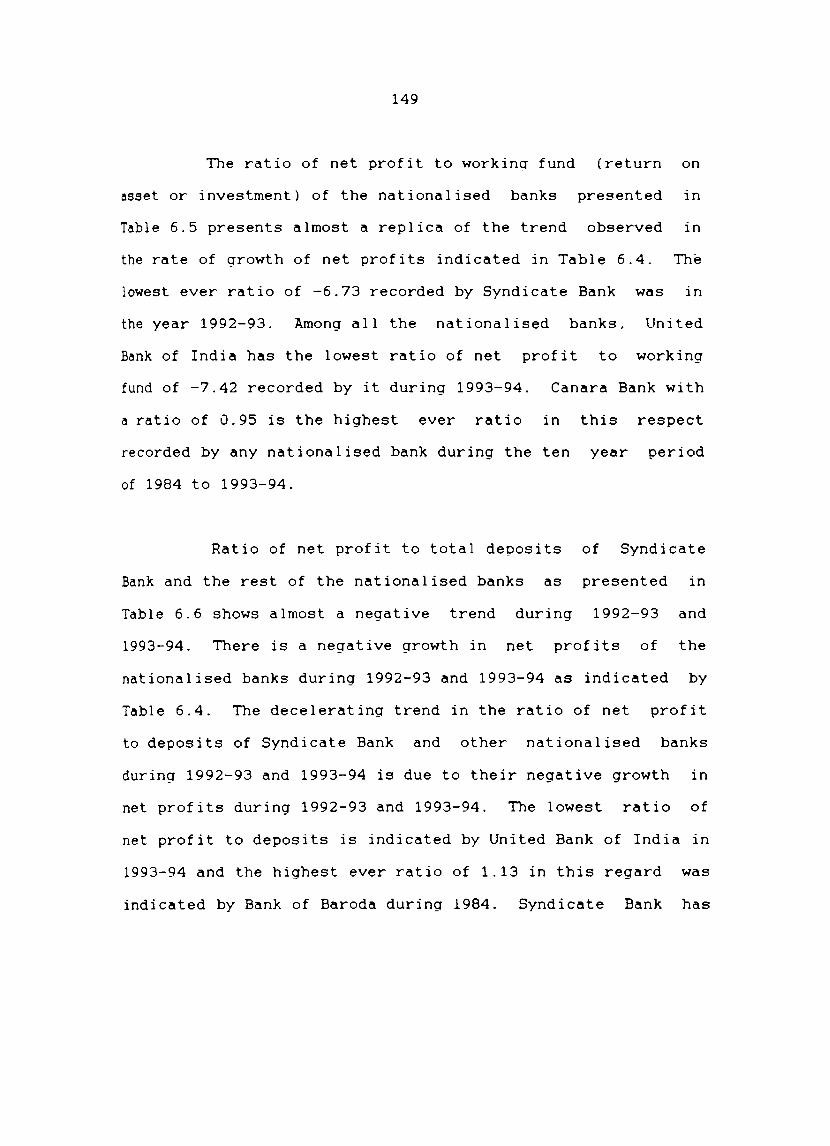
149
The ratio of net profit to working fund (return on
asset or investment) of the nationalised banks presented in
Table 6.5 presents almost a replica of the trend observed in
the rate of growth of net profits indicated in Table 6.4. The
lowest ever ratio of -6.73 recorded by Syndicate Bank was in
the year 1992-93. Among all the nationalised banks. United
Bank of India has the lowest ratio of net profit to working
fund of -7.42 recorded by it during 1993-94. Canara Bank with
a ratio of 0.95 is the highest ever ratio in this respect
recorded by any nationalised bank during the ten year period
of 1984 to 1993-94.
Ratio of net profit to total deposits of Syndicate
Bank and the rest of the nationalised banks as presented in
Table 6.6 shows almost a negative trend during 1992-93 and
1993-94. There is a negative growth in net profits of the
nationalised banks during 1992-93 and 1993-94 as indicated by
Table 6.4. The decelerating trend in the ratio of net profit
to deposits of Syndicate Bank and other nationalised banks
during 1992-93 and 1993-94 is due to their negative growth in
net profits during 1992-93 and 1993-94. The lowest ratio of
net profit to deposits is indicated by United Bank of India in
1993-94 and the highest ever ratio of 1.13 in this regard was
indicated by Bank of Baroda during 1984. Syndicate Bank has
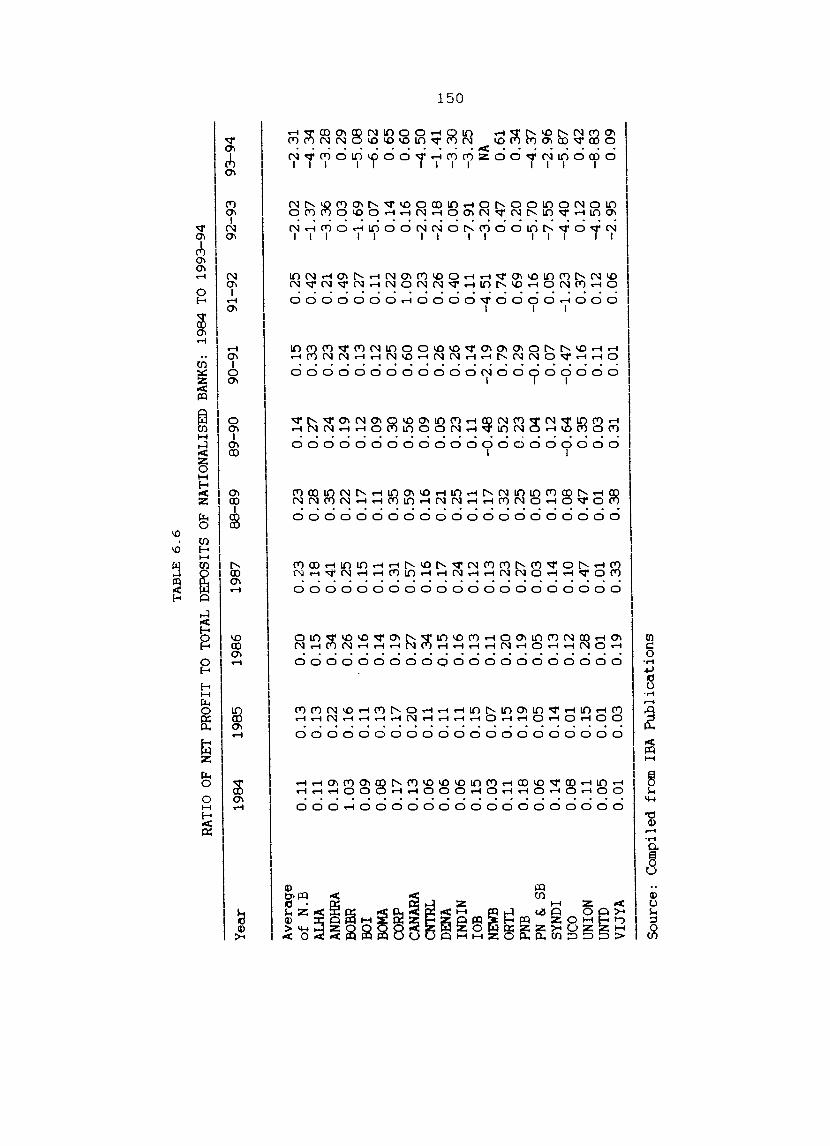
TA
BL
E 6
.6
RATI
O O
F NE
T PR
OFI
T TO
TOT
AL D
EPO
SITS
OF
NA
TIO
NA
LISE
D B
ANKS
: 19
84 T
O 19
93-9
4
Yea
r 19
84
1985
19
86
1987
8
8-8
9
89
-90
90
-91
91-9
2 9
2-9
3
93-9
4
Ave
rage
of
N.B
0
.11
0
.13
0
.20
0
.23
0
.23
0
.14
0
.15
0
.25
-2
.02
-2
.31
AL
HA
0.1
1
0.1
3
0.1
5
0.1
8
0.2
8
0.2
7
0.3
3
0.4
2
-1.3
7
-4.3
4
ANDH
RA
0.1
9
0.2
2
0.3
4
0.4
1
0.3
5
0.2
4
0.2
3
0.2
1
-3.3
6
-3.2
8
BCER
1
.03
0
.16
0
.26
0
.25
0
.22
0
.19
0
.24
0
.49
0
.03
0
.29
BC
I 0
.09
0
.11
' 0
.16
0
.15
0
.17
0
.12
0
.13
0
.27
-1
.69
-5
.08
BO
MA
0.0
8
0.1
3
0.1
4
0.1
1
0.1
1
0.0
9
0.1
2
0.1
1
-5.0
7
-6.6
2
CO
RP
0.1
7
0.1
7
0.1
9
0.3
1
0.3
5
0.3
0
0.2
5
0.2
2
0.1
4
0.6
5
CANA
RA
0.1
3
0.2
0
0.2
7
0.5
7
0.5
9
0.5
6
0.6
0
1.0
9
0.1
6
0.6
0
CN
TRL
0.0
6
0.1
1
0.3
4
0.1
6
0.1
6
0.0
9
0.1
0
0.2
3
-2.2
0
-4.5
0
DENA
0
.06
0
.11
0
.15
0
.17
0
.21
0
.05
0
.26
0
.26
-2
.18
-1
.41
t-
>
IND
IN
0.0
6
0.1
1
0.1
6
0.2
4
0.2
5
0.2
3
0.2
6
0.4
0
0.0
5
-3.3
0
Ul
lOB
0
.15
0
.15
0
.13
0
.12
0
.11
0
.11
0
.14
0
.11
-7
.91
-3
.25
0
NEW
B 0
.03
0
.07
0
.11
0
.13
0
.17
-0
.48
-2
.19
-4
.51
-3
.20
NA
OR
TL
0.1
1
0.1
5
0.2
0
0.2
3
0.3
2
0.5
2
0.7
9
0.7
4
0.4
7
0.6
1
PNB
0.1
8
0.1
9
0.1
9
0.2
7
0.2
5
0.2
3
0.2
9
0.6
9
0.2
0
0.3
4
PN &
SB
0.0
6
0.0
5
0.0
5
0.0
3
0.0
5
0.0
4
-0.2
0
-0.1
6
-5.7
0
-4.3
7
SYND
I 0
.14
0
.14
0
.13
0
.14
0
.13
0
.12
0
.07
0
.05
-7
.55
-2
.96
UC
O 0
.08
0
.01
0
.12
0
.10
0
.08
-0
.64
-0
.47
-1
.23
-4
.40
-5
.87
UN
ION
0.1
1
0.1
5
0.2
8
0.4
7
0.4
7
0.3
5
0.1
6
0.3
7
0.1
2
0.4
2
UN
TD
0.0
5
0.0
1
0.0
1
0.0
1
0.0
1
0.0
3
0.1
1
0.1
2
-4.5
0
-8.8
3
VIJ
YA
0
.01
0
.03
0
.19
0
.33
0
.38
0
.31
0
.01
0
.06
-2
.95
0
.09
Sou
rce:
C
ompi
led
from
IB
A P
ub
lica
tio
ns
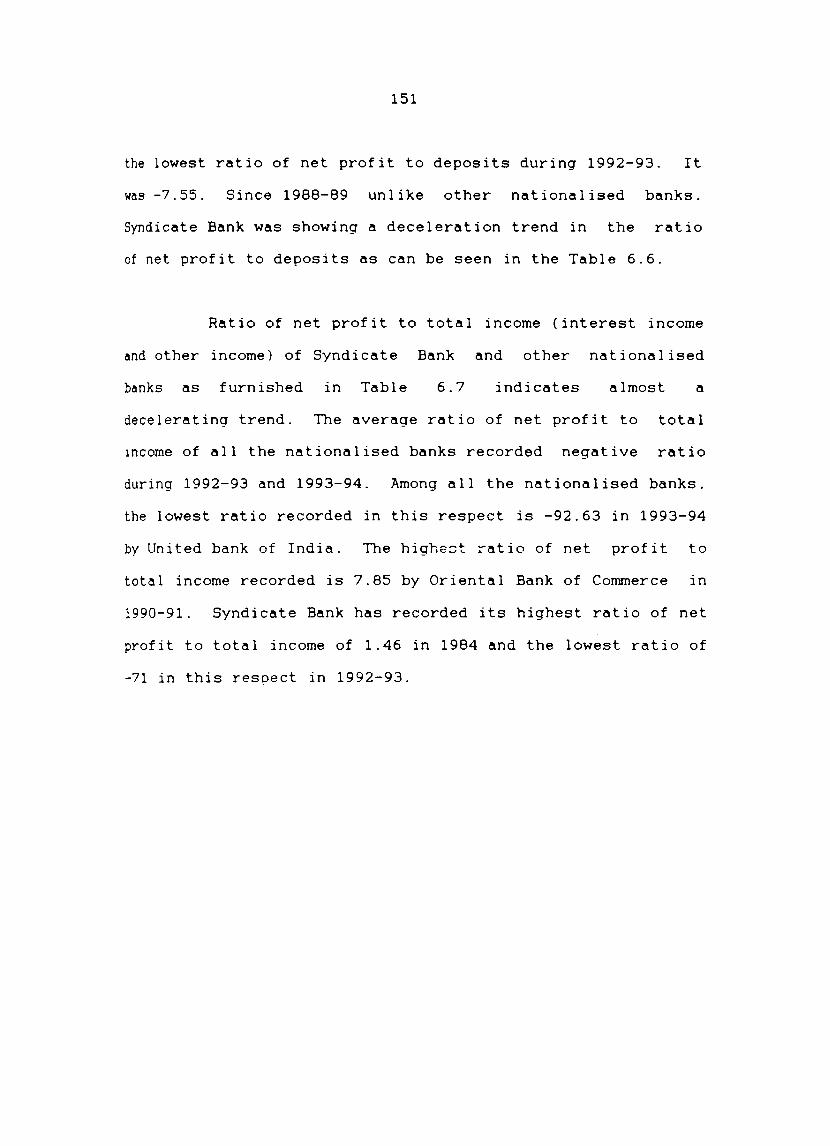
151
the lowest ratio of net profit to deposits during 1992-93. It
~s -7.55. Since 1988-89 unlike other nationalised banks.
Syndicate Bank was showing a deceleration trend in the ratio
of net profit to deposits as can be seen in the Table 6.6.
Ratio of net profit to total income (interest income
and other income) of Syndicate Bank and other nationalised
banks as furnished in Table 6.7 indicates almost a
decelerating trend. The average ratio of net profit to total
Income of all the nationalised banks recorded negative ratio
during 1992-93 and 1993-94. Among all the nationalised banks.
the lowest ratio recorded in this respect is -92.63 in 1993-94
by Un i ted bank of Indi a . The highe:::;t ~at i 0 of net prof it to
total income recorded is 7.85 by Oriental Bank of Commerce in
1990-91. Syndicate Bank has recorded its highest ratio of net
profit to total income of 1.46 in 1984 and the lowest ratio of
-71 in this respect in 1992-93.
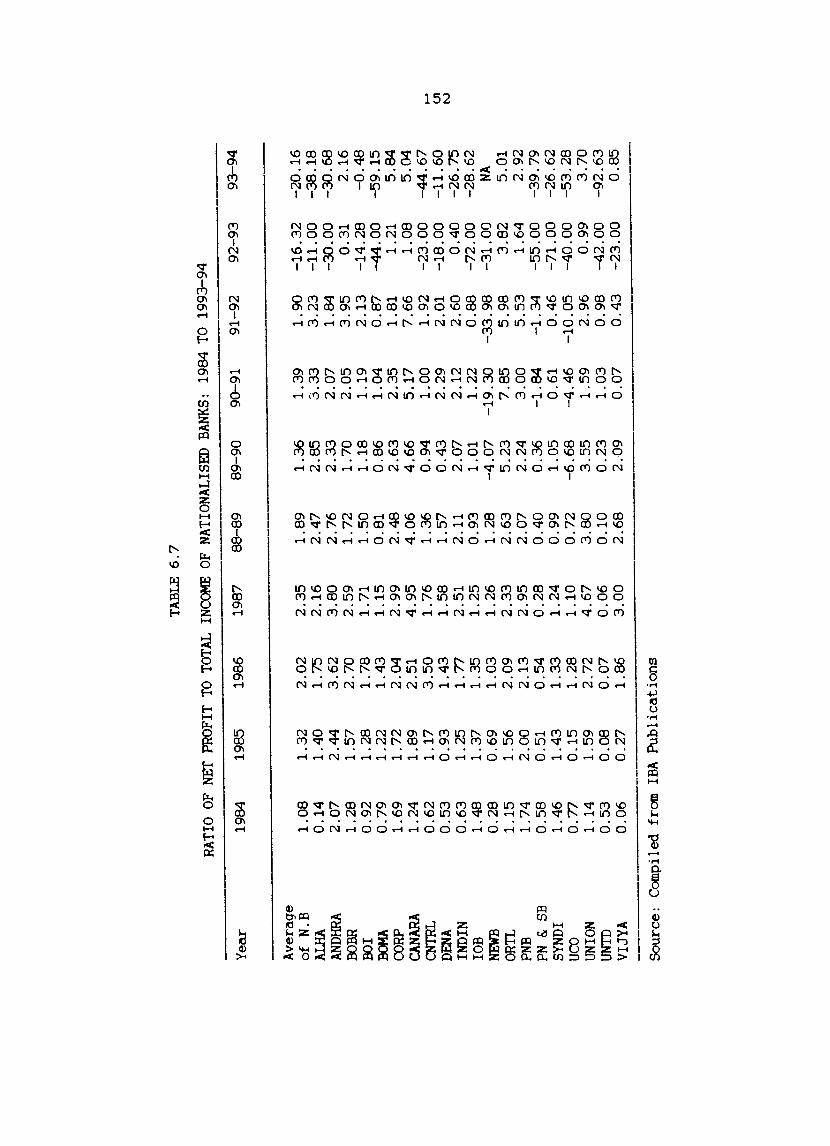
TABL
E 6
.7
RATI
O OF
NET
PR
OFI
T TO
TOT
AL
INCO
ME
OF N
ATIO
NALI
SED
BANK
S:
1984
TO
1993
-94
Yea
r 19
84
1985
19
86
1987
8
8-8
9
89
-90
90
-91
91-9
2 9
2-9
3
93
-94
Ave
rage
of
N.B
1
.08
1
.32
2
.02
2
.35
1
.89
1
.36
1
.39
1
.90
-1
6.3
2
-20
.16
AL
HA
0.1
4
1.4
0
1. 7
5 2
.16
2
.47
2
.85
3
.33
3
.23
-1
1. 0
0 -3
8.1
8
ANDH
RA
2.0
7
2.4
4
3.6
2
3.8
0
2.7
6
2.3
3
2.0
7
1.8
4
-30
.00
-3
0.6
8
0000
1
.28
1
.57
2
.70
2
.59
1
.72
1
.70
2
.05
3
.95
0
.31
2
.16
oo
I 0
.92
1
.28
1
.78
1
. 71
1.5
0
1.1
8
1.1
9
2.1
3
-14
.28
-0
.48
BO
MA
0.7
9
1.2
2
1.4
3
1.1
5
0.8
1
0.8
6
1.0
4
0.8
7
-44
.00
-5
9.1
5
CO
RP
1.6
9
1.7
2
2.0
4
2.9
9
2.4
8
2.6
3
2.3
5
1.8
1
1.2
1
5.8
4
CANA
RA
1.2
4
1.8
9
2.5
1
4.9
5
4.0
6
4.6
6
5.1
7
7.6
6
1.0
8
5.0
4
CN
TRL
0.6
2
1.1
7
3.5
0
1. 7
6 1
.36
0
.94
1
.00
1
. 92
-23
.00
-4
4.6
7
......
DENA
0
.53
0
.93
1
.43
1
.58
1
.57
0
.43
2
.29
2
.01
-1
8.0
0
-11
.60
U
1
IND
IN
0.6
3
1.2
5
1.7
7
2.5
1
2.1
1
2.0
7
2.1
2
2.6
0
0.4
0
-26
.75
N
lOB
1.4
8
1.3
7
1.3
5
1.2
5
0.9
3
1.0
1
1.2
2
0.8
8
-72
.00
-2
8.6
2
NEW
B 0
.28
0
.69
1
.03
1
.26
1
.28
-4
.07
-1
9.3
0
-33
.98
-3
1.0
0
NA
ORTL
1
.15
1
.56
2
.09
2
.33
2
.63
5
.23
7
.85
5
.98
3
.82
5
.01
PN
B 1
.74
2
.00
2
.13
2
.95
2
.07
2
.24
3
.00
5
.53
1
.64
2
.92
PN
& S
B 0
.58
0
.51
0
.54
0
.28
0
.40
0
.36
-1
.84
-1
.34
-5
5.0
0
-39
.79
SY
ND
I 1
.46
1
.43
1
.33
1
.24
0
.99
1
.05
0
.61
0
.46
-7
1.0
0
-26
.62
U
CO
0.7
7
0.1
5
1.2
8
1.1
0
0.7
2
-6.6
8
-4.4
6
-10
.05
-4
0.0
0
-53
.28
UN
ION
1.1
4
1.5
9
2.7
2
4.6
7
3.8
0
3.5
5
1.5
9
2.9
6
0.9
9
3.7
0
UN
TO
0.5
3
0.0
8
0.0
7
0.0
6
0.1
0
0.2
3
1.0
3
0.9
8
-42
.00
-9
2.6
3
VIJY
A
0.0
6
0.2
7
1.8
6
3.0
0
2.6
8
2.0
9
0.0
7
0.4
3
-23
.00
0
.85
Sour
ce:
Com
pile
d fr
om
IBA
Pub
lica
tion
s
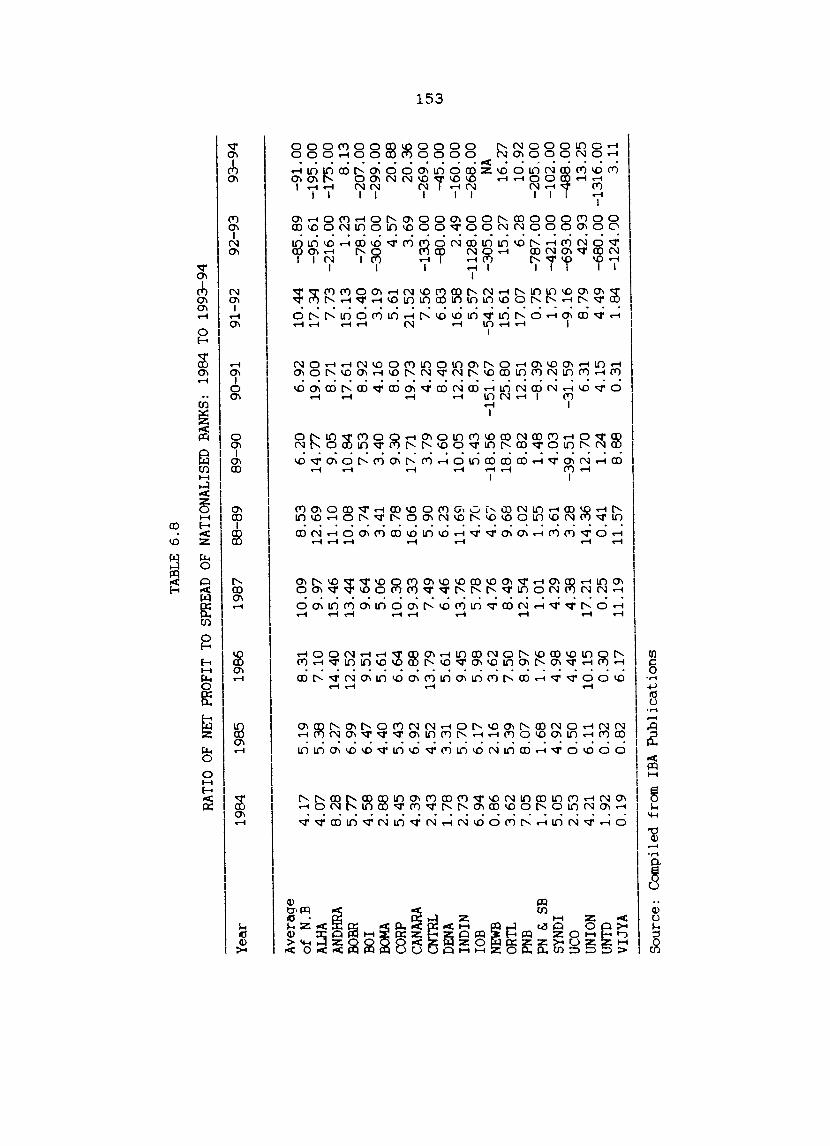
TABL
E 6
.8
RATI
O O
F N
ET
PRO
FIT
TO
SPRE
AD
OF
NA
TIO
NA
LISE
D B
AN
KS:
19
84 T
O 19
93-9
4 --
----
Yea
r 19
84
1985
19
86
1987
88
-89
89
-90
90
-91
91-9
2 92
-93
93-9
4
Ave
rage
o
f N
.B
4.1
7
5.1
9
8.3
1
10
.09
8
.53
6
.20
6
.92
1
0.4
4
-85
.89
-9
1.0
0
ALHA
4
.07
5
.38
7
.10
9
.97
1
2.6
9
14
.77
1
9.0
0
17
.34
-9
5.6
1
-19
5.0
0
ANDH
RA
8.2
8
9.2
7
14
.40
1
5.4
6
11
.10
9
.05
8
.71
7
.73
-2
16
.00
-1
75
.00
BO
BR
5.7
7
6.9
9
12
.52
1
3.4
4
10
.08
1
0.8
4
17
.61
1
5.1
3
1.2
3
8.1
3
OO
I 4
.58
6
.47
9
.51
9
.64
9
.74
7
.53
8
.92
1
0.4
0
-78
.51
-2
07
.00
BO
MA
2.8
8
4.4
0
5.6
1
5.0
6
3.4
1
3.4
0
4.1
6
3.1
9
-30
6.0
0
-29
9.0
0
CORP
5
.45
5
.43
6
.64
1
0.3
0
8.7
8
9.3
0
8.6
0
5.6
1
4.5
7
20
.88
CA
NARA
4
.39
6
.92
9
.88
1
9.3
3
16
.06
1
7.7
1
19
.73
2
1.5
2
3.6
9
20
.36
C
NTR
L 2
.43
4
.52
1
3.7
9
7.4
9
5.9
0
3.7
9
4.2
5
7.5
6
-13
3.0
0
-26
9.0
0
.....
U1
DENA
1
.78
3
.31
5
.61
6
.46
6
.23
1
.60
8
.40
6
.83
-8
0.0
0
-45
.00
w
IN
DIN
2
.73
5
.70
9
.45
1
3.7
6
11
.69
1
0.0
5
12
.25
1
6.5
8
2.4
9
-16
0.0
0
lOB
6
.94
6
.17
5
.98
5
.78
4
.7('
5
.43
8
.79
5
.57
-1
12
8.0
0
-26
8.0
0
NEW
B 0
.86
2
.16
3
.62
4
.76
4
.61
' -1
8.5
6
-15
1.6
7
-54
.52
-3
05
.00
NA
O
RTL
3.6
2
5.3
9
7.5
0
8.4
9
9.6
8
18
.78
2
5.8
0
15
.61
1
5.2
7
16.'2
:7
PNB
7.0
5
8.0
7
8.9
7
12
.54
9
.02
8
.82
12
.51
17
.07
6
.28
1
0.9
2
PN &
SB
1.7
8
1.6
8
1.7
6
1.0
1
1.5
5
1.4
8
-8.3
9
0.7
5
-78
7.0
0
-20
5,0
0
SYN
DI
5.0
5
4.9
2
4.9
8
4.2
9
3.6
1
4.0
3
2.2
6
1.7
5
-42
1.0
0
-10
2.0
0
UCO
2.5
3
0.5
0
4.4
6
4.3
8
3.2
8
-39
.51
-3
1.5
9
-9.1
6
-69
3.0
0
-48
8.0
0
UN
ION
4
.21
6
.11
1
0.1
5
17
.21
1
4.3
6
12
.70
6
.31
8
.79
4
2.9
3
13
.25
UN
TD
1. 9
2 0
.32
0
.30
0
.25
0
.41
1
.24
4
.15
4
.49
-6
80
.00
-1
31
6.0
0
VIJ
YA
0
.19
0
.82
6
.17
1
1.1
9
11
.57
8
.88
0
.31
1
.84
-1
24
.00
3
.11
----------------
---
Sou
rce:
C
ompi
led
from
IB
A
Pu
bli
cati
on
s
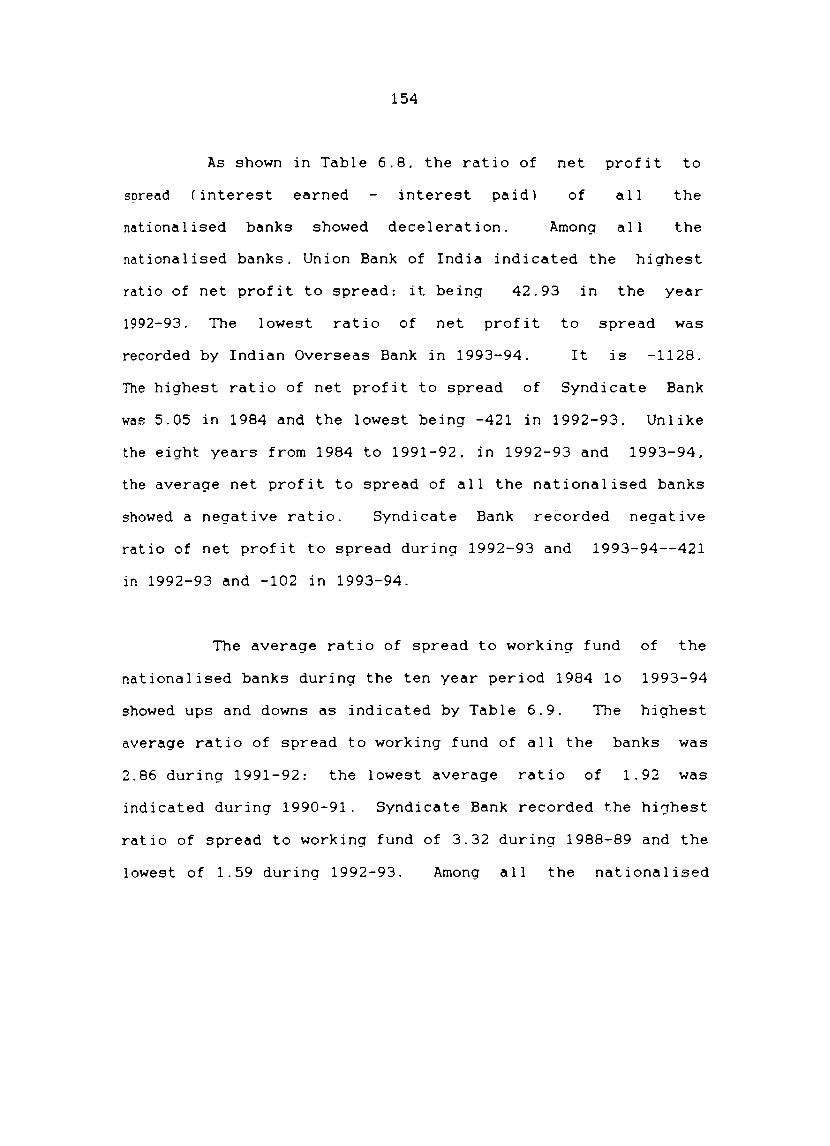
154
As shown in Table 6.8. the ratio of
spread (interest earned interest paid)
nationalised banks showed deceleration.
net profit to
of all the
Among all the
nationalised banks. Union Bank of India indicated the highest
the year ratio of net profit to spread: it being 42.93
1992-93. The lowest ratio of net profit
recorded by Indian Overseas Bank in 1993-94.
in
to spread was
It is -1128.
The highest ratio of net profit to spread of Syndicate Bank
was 5.05 in 1984 and the lowest being -421 in 1992-93. Unlike
the eight years from 1984 to 1991-92. in 1992-93 and 1993-94.
the average net profit to spread of all the nationalised banks
showed a negative ratio. Syndicate Bank recorded negative
ratio of net profit to spread during 1992-93 and 1993-94--421
in 1992-93 and -102 in 1993-94.
The average ratio of spread to working fund of the
nationalised banks during the ten year period 1984 10 1993-94
showed ups and downs as indicated by Table 6.9. The highest
average ratio of spread to working fund of all the banks was
2.86 during 1991-92: the lowest average ratio of 1.92 was
indicated during 1990-91. Syndicate Bank recorded the hi~hest
ratio of spread to working fund of 3.32 during 1988-89 and the
lowest of 1.59 during 1992-93. Among all the nationalised
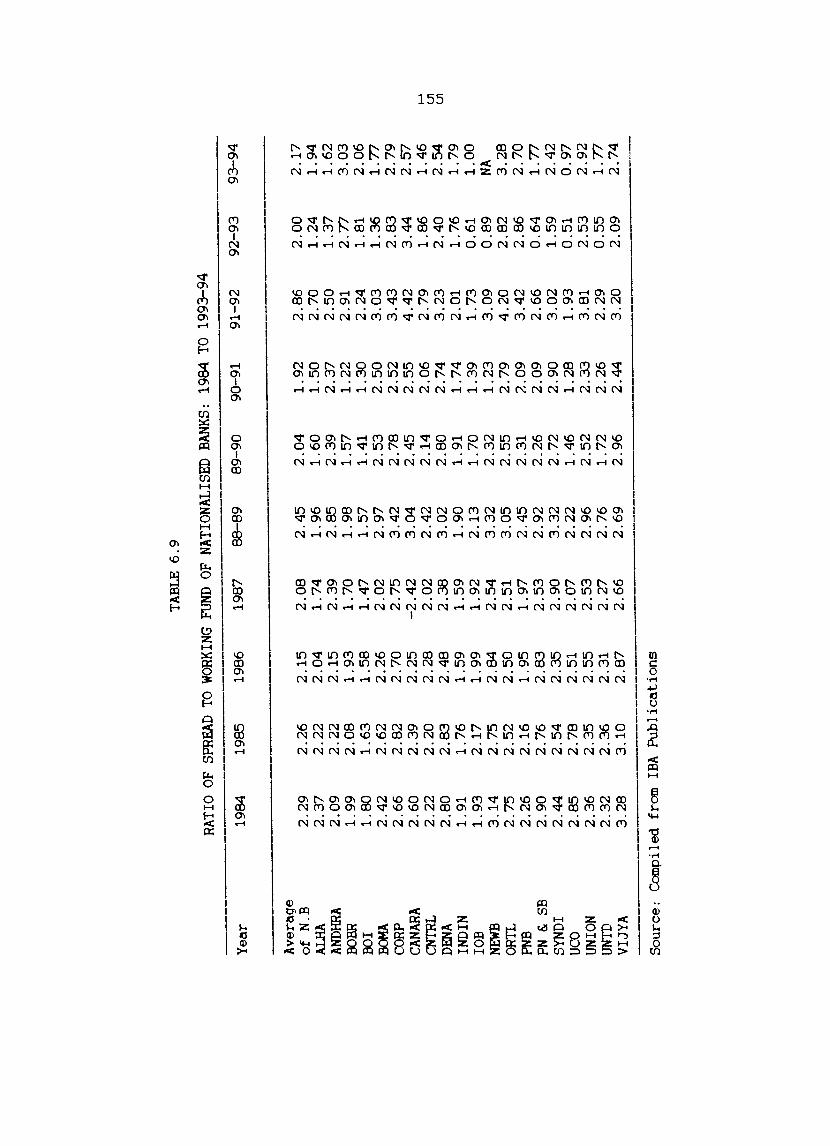
TABL
E 6
.9
RA
TIO
OF
SPRE
AD
TO
WOR
KING
FUN
D O
F N
ATI
ON
ALI
SED
BA
NK
S:
1984
TO
1993
-94
----
----
---
Yea
r 19
84
1985
19
86
1987
8
8-8
9
89
-90
90
-91
91
-92
9
2-9
3
93
-94
Ave
rage
o
f N
.B
2.2
9
2.2
6
2.1
5
2.0
8
2.4
5
2.0
4
1.9
2
2.8
6
2.0
0
2.1
7
Alli
A
2.3
7
2.2
2
2.0
4
1. 7
4 1
.96
1
.60
1
.50
2
.70
1
.24
1
.94
AN
DHRA
2
.09
2
.22
2
.15
2
.39
2
.85
2
.39
2
.37
2
.50
1
.37
1
.62
oo
ER
1.9
9
2.0
8
1.9
3
1. 7
0 1
. 98
1.5
7
1.2
2
2.9
1
2.7
7
3.0
3
001
1.8
0
1.6
3
1.5
8
1.4
7
1.5
7
1.4
1
1.3
0
2.2
4
1.8
1
2.0
6
BOM
A 2
.42
2
.62
2
.26
2
.02
2
.97
2
.53
2
.50
3
.03
1
.36
1
.77
CO
RP
2.6
6
2.8
2
2.7
0
2.7
5
3.4
2
2.7
8
2.5
2
3.4
3
2.8
3
2.7
9
CANA
RA
2.6
0
2.3
9
2.2
5
-2.4
2
3.0
4
2.4
5
2.5
5
4.4
2
3.4
4
2.5
7
CNTR
L 2
.22
2
.20
2
.28
2
.02
2
.42
2
.14
2
.06
2
.79
1
.86
1
.46
~
DENA
2
.80
2
.83
2
.48
2
.38
3
.02
2
.80
2
.74
3
.23
2
.40
2
.54
(J
1
(J1
IND
IN
1. 9
1 1
.76
1
.59
1
.59
1
.90
1
. 91
1.7
4
2.0
1
1.7
6
1.7
9
lOB
1
.93
2
.17
1
.99
1
.92
2
.13
1
.70
1
.39
1
.73
0
.61
1
.00
NE
WB
3.1
4
2.7
5
2.8
4
2.5
4
3.3
2
2.3
2
1.2
3
3.0
9
0.8
9
NA
ORT
L 2
.75
2
.52
2
.50
2
.51
3
.05
2
.55
2
.79
4
.20
2
.82
3
.28
PN
B 2
.26
2
.16
1
.95
1
.97
2
.45
2
.31
2
.09
3
.42
2
.86
2
.70
PN
&
SB
2.9
0
2.7
6
2.8
3
2.5
3
2.9
2
2.2
6
2.0
9
2.6
6
0.6
4
1.7
7
SYN
DI
2.4
4
2.5
4
2.3
5
2.9
0
3.3
2
2.7
2
2.9
0
3.0
2
1.5
9
2.4
2
UCO
2.8
5
2.7
8
2.5
1
2.0
7
2.2
2
1.4
6
1.2
8
1.9
3
0.5
1
0.9
7
UN
ION
2
.36
2
.35
2
.55
2
.53
2
.96
2
.52
2
.33
3
.81
2
.53
2
.92
UN
TD
2.3
2
2.3
6
2.3
1
2.2
7
2.7
6
1.7
2
2.2
6
2.2
9
0.5
5
1.7
7
VIJ
YA
3
.28
3
.10
2
.87
2
.66
2
.69
2
.96
2
.44
3
.20
2
.09
2
.74
------
So
urc
e:
Com
pile
d fr
om
IBA
P
ub
licati
on
s
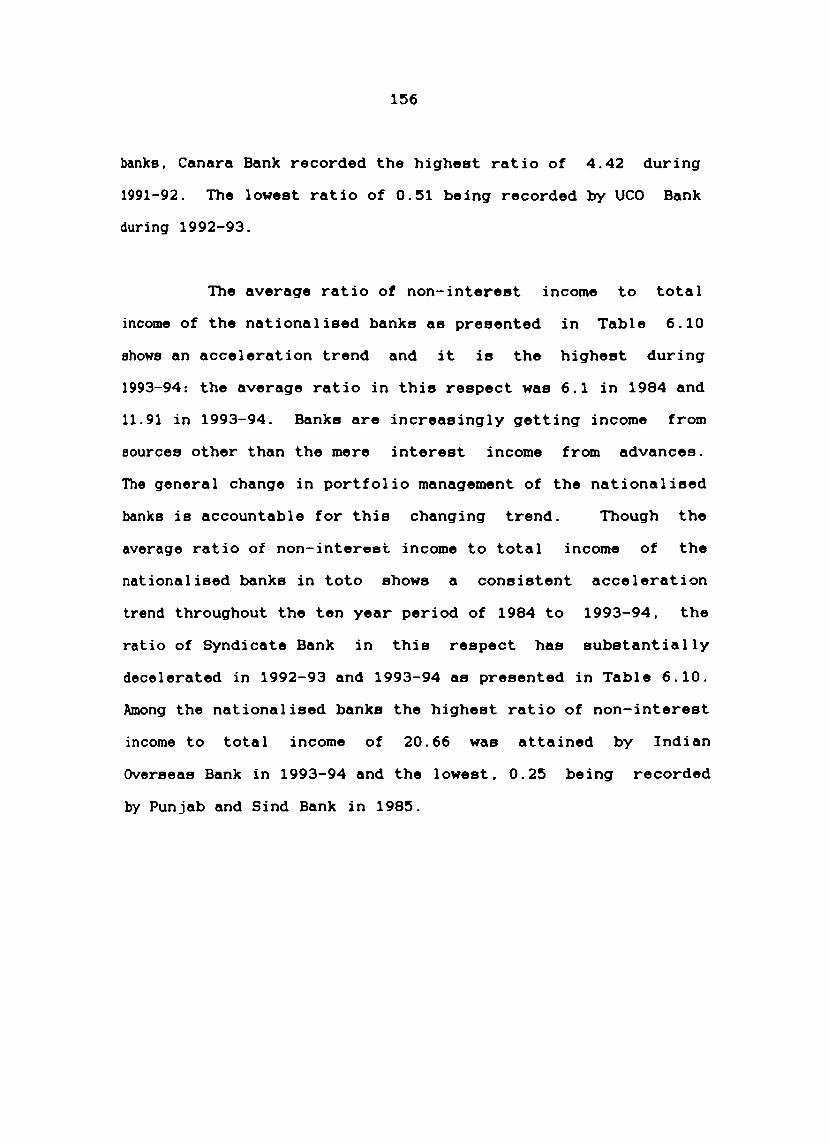
156
banks, Canara Bank recorded the highest ratio of 4.42 during
1991-92. The lowest ratio of 0.51 being recorded by UCO Bank
during 1992-93.
The average ratio of non-interest income to total
income of the nationalised banks as presented in Table 6.10
shows an acceleration trend and it is the highest during
1993-94: the average ratio in this respect was 6.1 in 1984 and
11.91 in 1993-94. Banks are increasingly getting income from
sources other than the mere interest income from advances.
The general change in portfolio management of the nationalised
banks is accountable for this changing trend. Though the
average ratio of non-interest income to total income of the
nationalised banks in toto shows a consistent acceleration
trend throughout the ten year period of 1984 to 1993-94, the
ratio of Syndicate Bank in this respect has substantially
decelerated in 1992-93 and 1993-94 as presented in Table 6.10.
Among the nationalised banks the highest ratio of non-interest
income to total income of 20.66 was attained by Indian
Overseas Bank in 1993-94 and the lowest, 0.25 being recorded
by Punjab and Sind Bank in 1985.
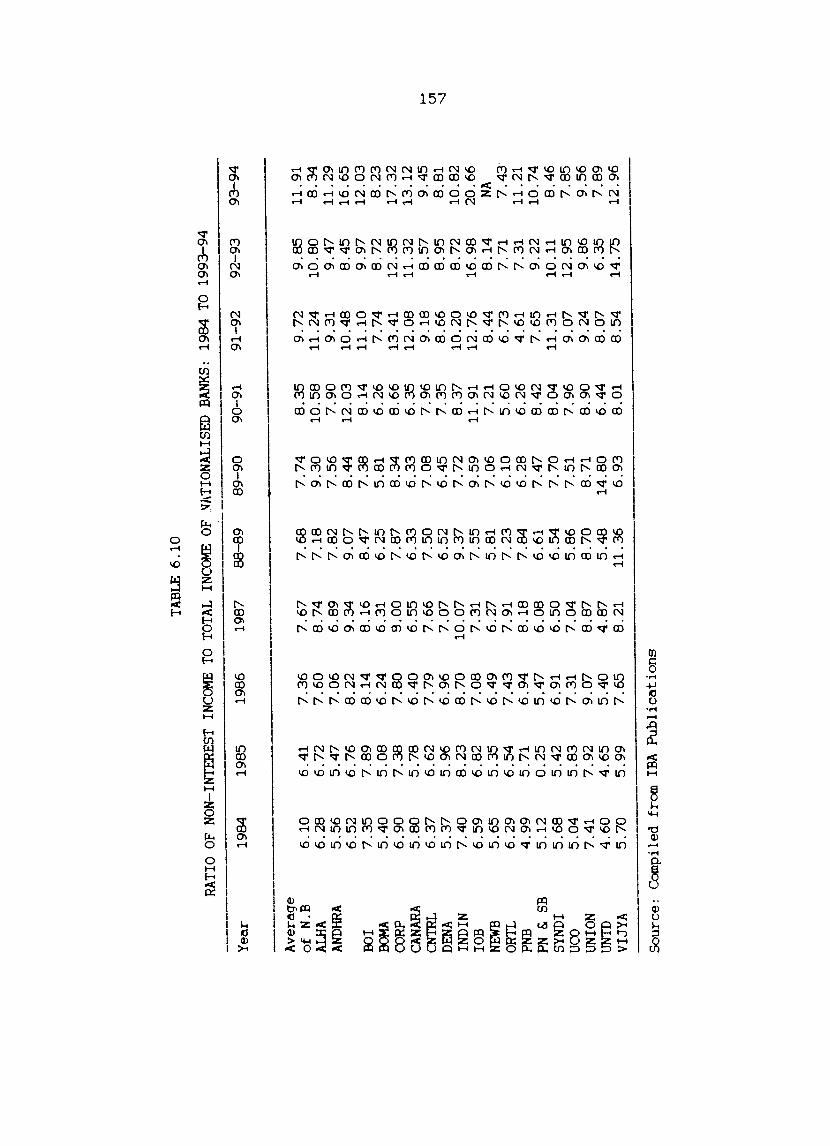
TABL
E 6
.10
RA
TIO
O
F N
ON
-INTE
RES
T IN
COM
E TO
TO
TAL
INCO
ME
OF
~lITIONALISED
BAN
KS:
19
84 T
O 19
93-9
4 -----
Yea
r 19
84
1985
19
86
1987
8
8-8
9
89
-90
90
-91
91
-92
9
2-9
3
93
-94
-----------
----
---
Ave
rage
o
f N
.B
6.1
0
6.4
1
7.3
6
7.6
7
7.6
8
7.7
4
8.3
5
9.7
2
9.8
5
11
. 91
ALHA
6
.28
6
.72
7
.60
8
.74
7
.18
9
.30
1
0.5
8
11
.24
1
0.8
0
8.3
4
ANDH
HA
5.5
6
5.4
7
7.0
6
6.8
9
7.8
2
7.5
6
7.9
0
9.3
1
9.4
7
11
.29
6
.52
6
.76
8
.22
9
.34
9
.07
8
.44
1
2.0
3
10
.48
8
.45
1
6.6
5
BO
I 7
.35
7
.89
8
.14
8
.16
8
.47
7
.38
8
.14
1
1.1
0
9.9
7
12
.03
BO
MA
5.4
0
5.0
8
6.2
4
6.3
1
6.2
5
5.8
1
6.2
6
7.7
4
8.7
2
8.2
3
CO
RP
6.9
0
7.3
8
7.8
0
8.0
0
7.8
7
8.3
4
8.6
6
13
.41
1
2.3
5
17
.32
CA
NARA
5
.80
5
.78
6
.40
6
.55
6
.33
6
.33
6
.35
1
2.0
8
11
.32
1
3.1
2
CNTR
L 6
.37
6
.62
7
.79
7
.66
7
.50
7
.08
7
.96
9
.18
8
.57
9
.45
.....
DE
NA
5.3
7
5.9
6
6.9
6
7.0
7
6.5
2
6.4
5
7.3
5
8.6
6
8.9
5
8.8
1
(J1
-....J
IND
IN
7.4
0
8.2
3
8.7
0
10
.07
9
.37
7
.72
8
.37
1
0.2
0
8.7
2
10
.82
lO
B
6.5
9
6.8
2
7.0
8
7.3
1
7.5
5
9.5
9
11
. 91
12
.76
1
6.9
8
20
.66
NE
WB
5.6
5
5.3
5
6.4
9
6.2
7
5.8
1
7.0
6
7.2
1
8.4
4
8.1
4
NA
ORT
L 6
.29
6
.54
7
.43
7
.91
7
.23
6
.10
5
.60
6
.73
7
.71
7
.43
PN
B 4
.99
5
.71
6
.94
8
.18
7
.84
6
.28
6
.26
4
.61
7
.31
1
1.2
1
PN &
SB
5.1
2
0.2
5
5.4
7
6.0
8
6.6
1
7.4
7
8.4
2
7.6
5
9.2
2
10
.74
SY
ND
I 5
.68
5
.42
6
.91
6
.50
6
.54
7
.70
8
.04
1
1.3
1
10
.11
8
.46
UC
O
5.0
4
5.8
3
7.3
1
7.0
4
5.8
6
7.5
1
7.9
6
9.0
7
12
.95
7
.85
U
NIO
N
7.4
1
7.9
2
9.0
7
8.8
7
8.7
0
8.7
1
8.9
0
9.2
4
9.8
6
9.5
6
UN
TO
4.6
0
4.6
5
5.4
0
4.8
7
5.4
8
14
.80
6
.44
8
.07
6
.35
7
.89
V
IJY
A
5.7
0
5.9
9
7.6
5
8.2
1
11
.36
6
.93
8
.01
8
.54
1
4.7
5
12
.96
So
urc
e:
Com
pile
d fr
om
IBA
P
ub
licati
on
s
158
The average ratio of operating expenses to total
income of the nationalised banks as presented in Table 6.11
shows a deceleration from 30.89 in 1984 to 24 in 1991-92. In
1992-93 and 1993-94 the ratio has gone
respectively. In the case of Corporation
Bank of Commerce. the trend from 1984 to
up to 25 and 27
Bank and Oriental
1993-94 is clearly
decelerating. These banks are able to keep operating expenses
within the manageable limits. In the case of Syndicate Bank.
from the lowest ratio of 31 in 1986. the ratio has accelerated
to 38 in 1992-93 and came down to 34 in 1993-94. This means
an increase
increase in
in operating
total income.
expenses and
The lowest
no corresponding
ratio among the
nationalised ~a~ks in this respect is 18 recorded by Bank of
India in 1991-92 and Indian Bank in 1992-93.
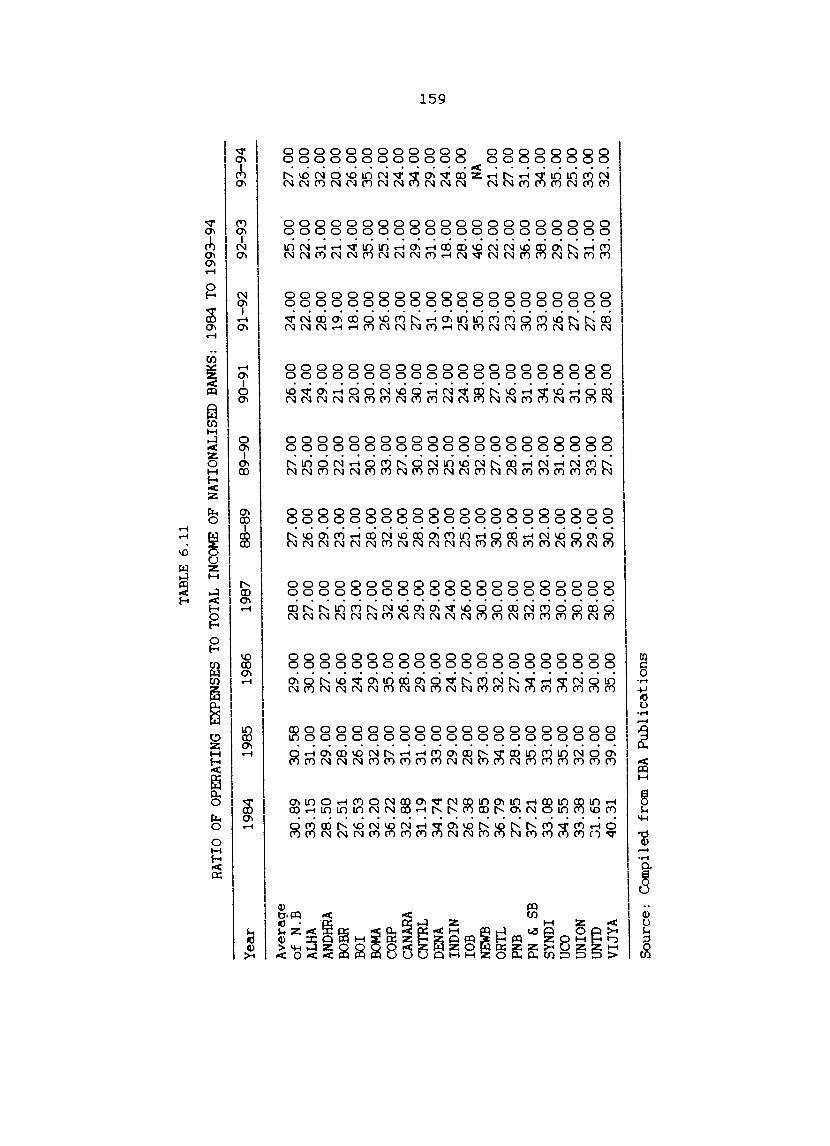
TA
BL
E
6.1
1
RA
TIO
O
F O
PERA
TIN
G
EXPE
NSE
S TO
TO
TAL
INCO
ME
OF
NA
TIO
NA
LISE
D
BAN
KS:
19
84 T
O 19
93-9
4
Yea
r 19
84
1985
19
86
1987
8
8-8
9
89
-90
90
-91
91-9
2 92
-93
93-9
4
Ave
rage
o
f N
.B
30
.89
3
0.5
8
29
.00
2
8.0
0
27
.00
2
7.0
0
26
.00
2
4.0
0
25
.00
2
7.0
0
ALHA
3
3.1
5
31
.00
3
0.0
0
27
.00
2
6.0
0
25
.00
2
4.0
0
22
.00
2
2.0
0
26
.00
AN
DHRA
2
8.5
0
29
.00
2
7.0
0
27
.00
2
9.0
0
30
.00
2
9.0
0
28
.00
3
1.0
0
32
.00
oo
BR
27
.51
2
8.0
0
26
.00
2
5.0
0
23
.00
2
2.0
0
21
.00
1
9.0
0
21
.00
2
0.0
0
001
26
.53
2
6.0
0
24
.00
2
3.0
0
21
.00
2
1.0
0
20
.00
1
8.0
0
24
.00
2
6.0
0
BOM
A 3
2.2
0
32
.00
2
9.0
0
27
.00
2
8.0
0
30
.00
3
0.0
0
30
.00
3
5.0
0
35
.00
CO
RP
36
.22
3
7.0
0
35
.00
3
2.0
0
32
.00
3
3.0
0
32
.00
2
6.0
0
25
.00
2
2.0
0
CANA
RA
32
.88
3
1.0
0
28
.00
2
6.0
0
26
.00
2
7.0
0
26
.00
2
3.0
0
21
.00
2
4.0
0
CN
TRL
31
.19
3
1.0
0
29
.00
2
9.0
0
28
.00
3
0.0
0
30
.00
2
7.0
0
29
.00
3
4.0
0
DENA
3
4.7
4
33
.00
3
0.0
0
29
.00
2
9.0
0
32
.00
3
1.0
0
31
.00
3
1.0
0
29
.00
.....
. U
1 IN
DIN
2
9.7
2
29
.00
2
4.0
0
24
.00
2
3.0
0
25
.00
2
2.0
0
19
.00
1
8.0
0
24
.00
1
0
lOB
2
6.3
8
28
.00
2
7.0
0
26
.00
2
5.0
0
26
.00
2
4.0
0
25
.00
2
8.0
0
28
.00
NE
WB
37
.85
3
7.0
0
33
.00
3
0.0
0
31
.00
3
2.0
0
38
.00
3
5.0
0
46
.00
NA
O
RTL
36
.79
3
4.0
0
32
.00
3
0.0
0
30
.00
2
7.0
0
27
.00
2
3.0
0
22
.00
2
1.0
0
PNB
27
.95
2
8.0
0
27
.00
2
8.0
0
28
.00
2
8.0
0
26
.00
2
3.0
0
22
.00
2
7.0
0
PN &
SB
37
.21
3
5.0
0
34
.00
3
2.0
0
31
.00
3
1.0
0
31
.00
3
0.0
0
36
.00
3
1.0
0
SYN
DI
33
.08
3
3.0
0
31
.00
3
3.0
0
32
.00
3
2.0
0
34
.00
3
3.0
0
38
.00
3
4.0
0
UCO
34
.55
3
5.0
0
34
.00
3
0.0
0
26
.00
3
1.0
0
26
.00
2
6.0
0
29
.00
3
5.0
0
UN
ION
3
3.3
8
32
.00
3
2.0
0
30
.00
3
0.0
0
32
.00
3
1.0
0
V.O
O
V.O
O
25
.00
UN
TO
J1.6
5
30
.00
3
0.0
0
28
.00
2
9.0
0
33
.00
3
0.0
0
27
.00
3
1.0
0
33
.00
V
IJY
A
40
.31
3
9.0
0
35
.00
3
0.0
0
30
.00
2
7.0
0
28
.00
2
8.0
0
33
.00
3
2.0
0
So
urc
e:
Com
pile
d fr
om
IBA
P
ub
licati
on
s
160
The ratio of cash to total deposits of the
nationalised banks is presented in Table 6.12. Though in
individual bank cases some variations are observed. the
average ratio of the nationalised banks for the entire period
of 1984 to 1993-94 is 16. In the case of Syndicate Bank. it
maintained its ratio of cash to deposits at 14. during the
period 1990-91 to 1993-94. The highest ever ratio of cash to
deposits maintained was 27 in 1991-92 by Corporation Bank and
the lowest ratio being maintained by Vijaya Bank in 1989-90
and 1991-92 to a level as low as half of the average ratio of
the nationalised banks taken together during those years.
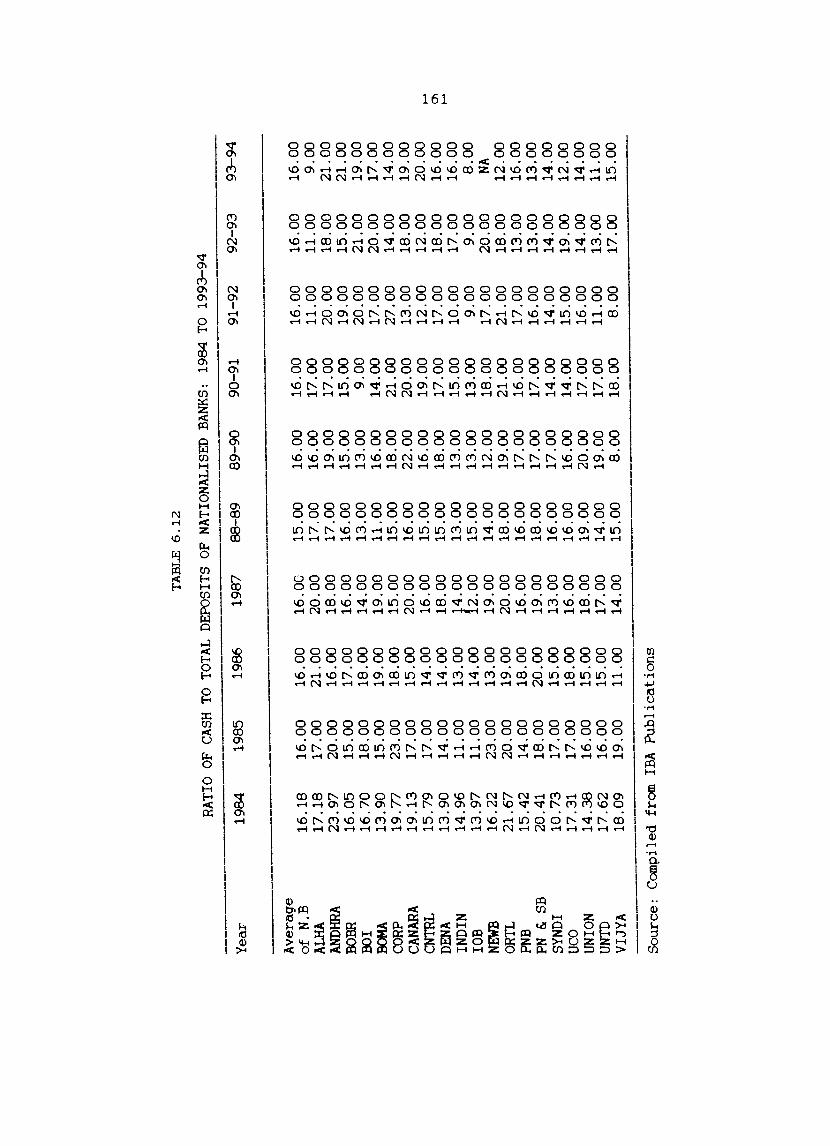
TA
BL
E 6
.12
RA
TIO
O
F CA
SH
TO T
OTA
L D
EPO
SITS
O
F N
ATI
ON
ALI
SED
BA
NK
S:
1984
TO
1993
-94
Yea
r 19
84
1985
19
86
1987
8
8-8
9
89
-90
90
-91
91-9
2 92
-93
93-9
4
Ave
rage
o
f N
.B
16
.18
1
6.0
0
16
.00
16
.0C
1
5.0
0
16
.00
1
6.0
0
16
.00
1
6.0
0
16
.00
AL
HA
17
.18
1
7.0
0
21
.00
2
0.0
0
17
.00
1
6.0
0
17
.00
1
1.0
0
11
.00
9
.00
AN
DHRA
2
3.9
7
20
.00
1
6.0
0
18
.00
1
7.0
0
19
.00
1
7.0
0
20
.00
1
8.0
0
21
.00
BO
HR
16
.05
1
5.0
0
17
.00
1
6.0
0
16
.00
1
5.0
0
15
.00
1
9.0
0
15
.00
2
1.0
0
BO
I 1
6.7
0
18
.00
1
8.0
0
14
.00
1
3.0
0
13
.00
9
.00
2
0.0
0
21
.00
1
9.0
0
BOM
A 1
3.9
0
15
.00
1
9.0
0
19
.00
1
1.0
0
16
.00
1
4.0
0
17
.00
2
0.0
0
17
.00
CO
RP
19
.77
2
3.0
0
18
.00
1
5.0
0
15
.00
1
8.0
0
21
.00
2
7.0
0
14
.00
1
4.0
0
CANA
RA
19
.13
1
7.0
0
15
.00
2
0.0
0
16
.00
2
2.0
0
20
.00
1
3.0
0
18
.00
1
9.0
0
CN
TRL
15
.79
1
7.0
0
14
.00
1
6.0
0
15
.00
1
6.0
0
19
.00
1
2.0
0
12
.00
2
0.0
0
~
DENA
1
3.9
0
14
.00
1
4.0
0
18
.00
1
5.0
0
18
.00
1
7.0
0
17
.00
1
8.0
0
16
.00
O
l
IND
IN
14
.96
1
1.0
0
13
.00
1
4.0
0
13
.00
1
3.0
0
15
.00
1
0.0
0
17
.00
1
6.0
0
~
lOB
1
3.9
7
11
.00
1
4.0
0
2.0
0
15
.00
1
3.0
0
13
.00
9
.00
9
.00
8
.00
NE
WB
16
.22
2
3.0
0
13
.00
1
9.0
0
14
.00
1
2.0
0
18
.00
1
7.0
0
20
.00
NA
O
RTL
21
.67
2
0.0
0
19
.00
2
0.0
0
18
.00
1
9.0
0
21
.00
2
1.0
0
18
.00
1
2.0
0
PNB
15
.42
1
4.0
0
18
.00
1
6.0
0
16
.00
1
7.0
0
16
.00
1
7.0
0
13
.00
1
6.0
0
PN &
SB
20.4
1 1
8.0
0
20
.00
1
9.0
0
18
.00
1
7.0
0
17
.00
1
6.0
0
13
.00
1
3.0
0
SYN
DI
10
.73
1
7.0
0
15
.00
1
3.0
0
16
.00
1
7.0
0
14
.00
1
4.0
0
14
.00
1
4.0
0
UCO
17
.31
1
7.0
0
18
.00
1
6.0
0
16
.00
1
6.0
0
14
.00
1
5.0
0
19
.00
1
2.0
0
UN
ION
1
4.3
8
16
.00
1
5.0
0
18
.00
1
9.0
0
20
.00
1
7.0
0
16
.00
1
4.0
0
14
.00
UN
TO
17
.62
1
6.0
0
15
.00
1
7.0
0
14
.00
1
9.0
0
17
.00
1
1.0
0
13
.00
1
1.0
0
VIJ
YA
1
8.0
9
19
.00
1
1.0
0
14
.00
1
5.0
0
8.0
0
18
.00
8
.00
1
7.0
0
15
.00
---------
So
urc
e:
Com
pile
d fr
om
IBA
P
ub
licati
on
s
162
Table 6.13 provides the scores in respect of the
sub-parameters under I prof i tabi 1 i ty I. The scores in respect
of five out of the nine sub-parameters referred to in Tables
6.4 to 6.8 i.e .. rate of growth of net profit. ratio of net
profit to working fund. ratio of net profit to total deposits.
ratio of net profit to total income and ratio of net profit to
spread are directly related to the net profit of the banks
during the ten year period under reference. The other
sub-parameters are directly related to the efficiency and
profitability of the banks. The total score of profitability
as indicated in column 11 of Table 6.13 reveals that among the
nationalised banks. Canara Bank has the highest profitability
performance with a score of 63.31 followed by Union Bank of
India with 62.26. Syndicate Bank has the fifteenth position
in profitability performance among the nationalised banks with
a score of 41.30. Punjab and Sind Bank has the lowest
profitability performance with the score of 29.39 in
'profitability' .
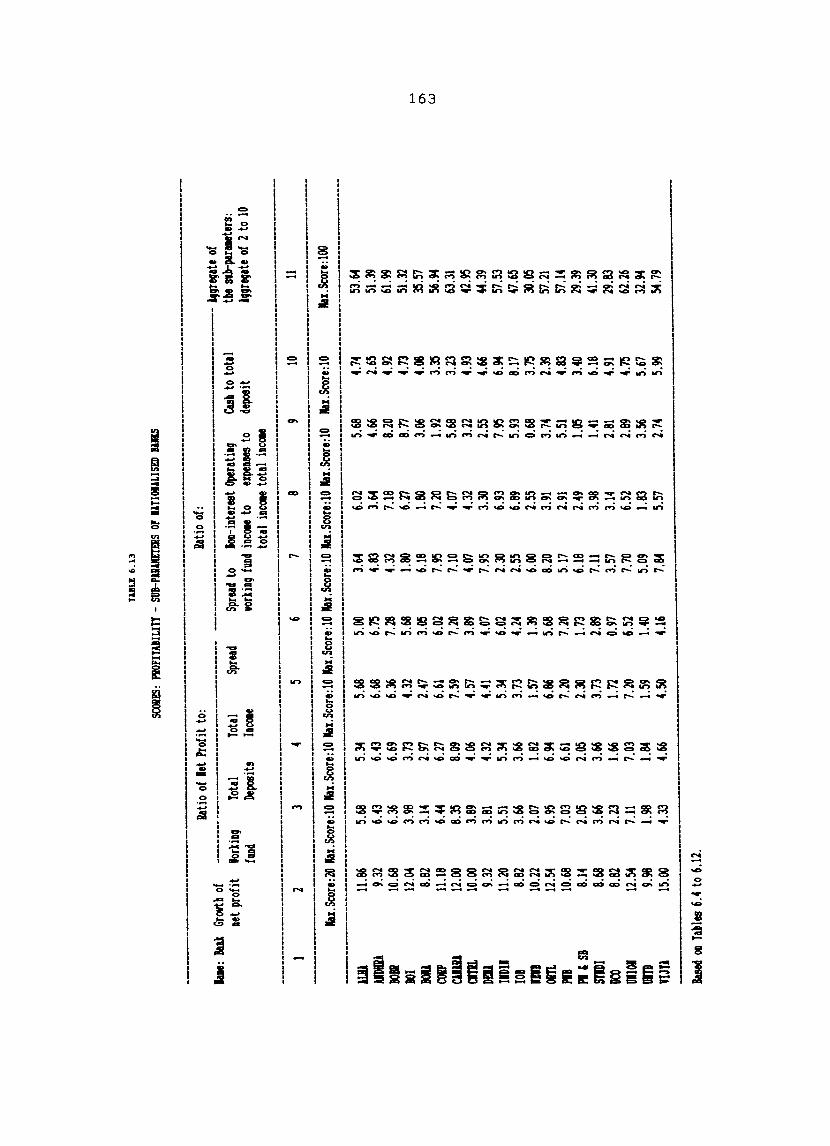
TU
U 6
.13
SCOI
IES:
PIIO
FITA
BILI
n -
SUB-
PWIIE
TEIIS
or
IUIO
IlLIS
ED B
AIlS
----
----
----
----
----
----
----
----
----
----
----
----
----
----
----
----
----
----
-.
Ratio
of
let
Prof
it to
: lIa
tio o
f: 1a
Ie:
Balk
Gror
tb of
----
----
----
----
----
----
----
----
----
----
----
----
----
----
----
----
----
----
----
----
----
---
lqqreq
ate o
f De
t pro
fit
IorkiD
q f1lD
d
2 3
Total
To
tal
Depo
si ts
lDcc
.e
4
Sprea
d
5 6
Sprea
d to
lo
a-iD
teres
t Ope
ratilq
Ca
sb to
tota
l tbe
stb
-par
aaete
rs:
vorki
Dq fU
Dd i
Deote
to
expe
nses
to
depo
sit
lqqr
eqate
of
2 to
10
tota
l iD
eote
tota
l iDC
CM
7 8
9 10
11
----
----
----
----
----
----
----
----
----
----
----
----
----
----
----
----
----
--.-
----
----
----
----
----
----
----
----
----
----
----
----
----
----
----
----
----
----
----
----
----
----
---
IaI.S
core
:20
IaI.S
core
:l0 R
ax.Sc
ore:l
0 Ra
x.Sco
re:l0
Rax.S
core:
l0 Ra
x.Sco
re:l0
IaI.S
core
:l0 R
ax.Sc
ore:l
0 1a
I. Sc
ore:
10
Rax.
Score
: 100
--
----
----
---.-
----
----
----
----
----
----
----
----
----
----
----
----
----
----
----
----
----
----
----
----
----
----
----
----
----
.----
----
----
----
----
----
----
----
-.---
-.---
----
llID
11
.86
5.68
5.34
5.68
5.00
3.64
6.02
5.68
4.74
53.64
AI
1IIIIIA
9.3
2 6.4
3 6.4
3 6.6
8 6.7
5 4.8
3 3.6
4 4.6
6 2.6
5 51
.39
BOil
10.68
6.3
6 6.6
9 6.3
6 7.2
8 4.3
2 7.1
8 8.2
0 4.9
2 61
.99
BOI
12.04
3.9
8 3.7
3 4.3
2 5.6
8 1.8
0 6.2
7 8.
n 4.7
3 51
.32
1(11
8.8
2 3.1
4 2.9
7 2.4
7 3.0
5 6.1
8 1.8
0 3.0
6 4.0
8 35
.57
C(IJ
I 11
.18
6.44
6.27
6.61
6.02
7.95
7.20
1.92
3.35
56.94
CW
II1
12.00
8.3
5 8.0
9 7.5
9 7.2
0 7.1
0 4.0
7 5.6
8 3.2
3 63
.31
cmL
10.00
3.8
9 4.0
6 4.5
7 3.8
9 4.0
7 4.3
2 3.2
2 4.9
3 42
.95
DEll
9.32
3.81
4.32
4.41
4.07
7.95
3.30
2.55
4.66
44.39
IID
11
11.20
5.5
1 5.3
4 5.3
4 6.0
2 2.3
0 6.9
3 7.9
5 6.9
4 57
.53
lOB
8.82
3.66
3.66
3.73
4.24
2.55
6.89
5.93
8.17
47.65
no
10
.22
2.07
1.82
1.57
1.39
6.00
2.55
0.68
3.75
~.05
om
12
.54
6.95
6.94
6.86
5.68
8.20
3.91
3.74
2.39
57.21
PO
10
.68
7.03
6.61
7.20
7.20
5.17
2.91
5.51
4.83
57.14
P
" S
B 8.1
4 2.0
5 2.0
5 2.
~ 1.7
3 6.1
8 2.4
9 1.0
5 3.4
0 29
.39
SYlD
I 8.6
8 3.6
6 3.6
6 3.7
3 2.8
9 7.1
1 3.9
8 1.4
1 6.1
8 41
.30
lJCO
8.82
2.23
1.66
1.72
0.97
3.57
3.14
2.81
4.91
29.83
01
101
12.54
7.1
1 7.0
3 7.2
0 6.5
2 7.7
0 6.5
2 2.8
9 4.7
5 62
.26
om
9.98
1.98
1.84
1.59
1.40
5.09
1.83
3.56
5.67
32.94
m
u 15
.00
4.33
4.66
4.50
4.16
7.84
5.57
2.74
5.99
54.79
Based
011
Tab
les 6
.4 to
6.12
.
......
01
w
164
Table 6.14 gives the Health Performance Score (HPS)
of Syndicate Bank and other national ised banks. It is the
aggregate of the scores based on the extent of the performance
in the basic parameters capital adequacy and quality of assets
and . prof i tabi 1 i ty'. The aggregate of the scores of a 11 the
national ised banks in respect of the two basic parameters.
'capi to. 1 adequacy and quo. 1 i ty of assets' as we 11 as
'profitability' is shown in column four of the Table
indicat ing the Hea 1 th Performance Score of the i nd i vi duo. 1
nationalised banks. Syndicate Bank has a Health Performance
Score of 86.3. In relation to other nationalised banks. it
has the fifteenth position in respect of Health Performance.
~anara Bank with the highest score of 163.31 is the Bank with
the best Health performance. Punjab and Sind Bank with a
health performance score of 74.39 is the Bank with the least
Health Performance. The first position of Canara Bank in
Health Performance is the outcome of its highest performance
posit ion in cap i to. 1 adequacy and ma intenance of quo. 1 it y of
assets and the first performance position in profitability.
As revealed in Table 6.4. the highest negative growth rate in
net profit i.e .. highest percentage growth in net loss during
the period 1984 to 1993-94 is attributable to the lowest
performance of Punjab and Sind Bank in respect of . Hea 1 th' .
It has the lowest score in 'profitability' as well as in
'capi to. 1 adequacy an quo. 1 i ty of assets'. (See Fig. 6 . 1. in
Append i x I I I )
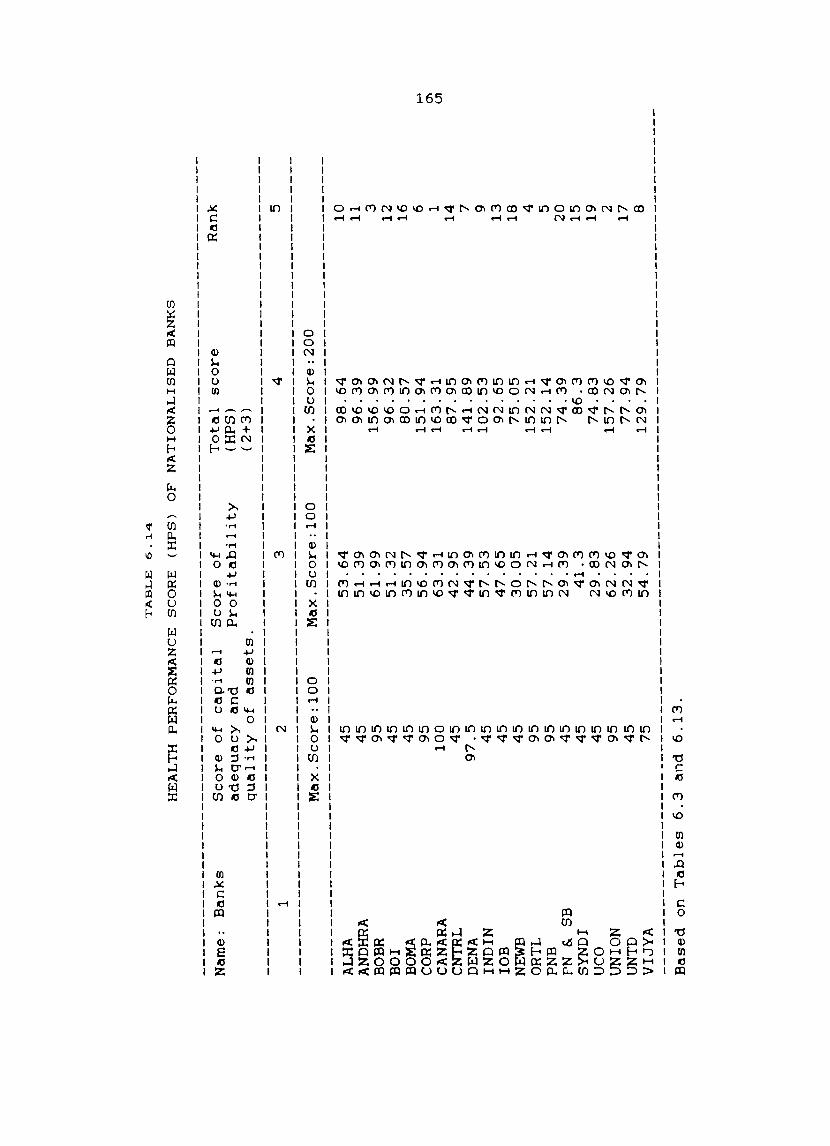
TA
BL
E
6.1
4
HE
AL
TH
P
ER
FO
RM
AN
CE
S
CO
RE
(H
PS
) O
F
NA
TIO
NA
LIS
ED
B
AN
KS
--------------------------------------------------------
----
----
----
----
----
----
----
-N
ame:
B
ank
s
ALH
A
AN
DH
HA
B
OB
R
BO
l BO
MA
CO
RP
CAN
ARA
C
NTR
L D
ENA
lN
DIN
lO
B
NEW
B
OR
TL
PNB
PN
&
SB
SY
ND
I U
CO
UN
ION
U
NTD
V
IJY
A
1
Sco
re
of
cap
ital
Sco
re
of
ad
eq
uacy
an
d
Pro
fit
ab
ilit
y
qu
ali
ty
of
assets
.
2
Max
.Sco
re:1
00
45
4
5
95
4
5
45
9
5
10
0
45
9
7.5
4
5
45
4
5
95
9
5
45
4
5
45
9
5
45
7
5
3
Max
.Sco
re:1
00
53
.64
5
1.3
9
61
.99
5
1.
32
3
5.5
7
56
.94
6
3.3
1
42
.95
4
4.3
9
57
.53
4
7.6
5
30
.05
5
7.2
1
57
.14
2
9.3
9
41
.3
29
.83
6
2.2
6
32
.94
5
4.7
9
Base
d
on
T
ab
les
6.3
an
d
6.1
3.
To
tal
sco
re
(HP
S)
(2+
3)
4
Max
.Sco
re:2
00
98
.64
9
6.3
9
15
6.9
9
96
.32
8
0.5
7
15
1.9
4
16
3.3
1
87
.95
1
41
.89
1
02
.53
9
2.6
5
75
.05
1
52
.21
1
52
.14
7
4.3
9
86
.3
74
.83
1
57
.26
7
7.9
4
12
9.7
9
Ran
k
5
10
1
1 3
12
1
6
6 1 1
4
7 9 1
3
18
4 5
20
1
5
19
2
17
8
......
0'1
(J1
166
The fifteenth position of Syndicate Bank in 'Health
hrformance' is due to the low performance in capital adequacy
and quality of assets and the relatively poor profitability
performance. It has failed to attain the minimum stipulated
capital adequacy ratio. Though it has international presence.
it cannot even attain the four percent capital adequacy ratio
~ring 1993-94. Syndicate Bank has provided for hundred
percent on loss assets during 1992-93 and 1993-94.
the provisioning in respect of substandard assets
~f the extent of provision made by highly health
~nks like Canara Bank. Next to Punjab and
However
fell short
performing
Sind Bank.
Syndicate Bank has shown the highest negative growth in net
profits during the ten year period under reference (See Table
6.4). The poor performance of Syndicate Bank in the matter of
'Health' is reflected in the low score secured by it in the
relevant basic parameters and their sub-parameters and the
relevant scores as depicted in Tables 6.3 and 6.13.
6.2. Priority Performance (PP)
The Priority Performance Score (PPS) represents t~~
performance of Syndicate Bank and the rest of the nationalised
banks in relation to 'social banking' and 'growth'.
167
6.2.1. Social Banking
The study of the performance of social banking is
based on the share of the rural and semi-urban bank branches
to the total branches of the individual banks. the ratio of
their priority sector advances to total advances. as well as
the share of advances of these banks under the Differential
Interest Rate Scheme (DRI scheme).
Table 6.15 contain details of the share of rural and
semi-urban branches of Syndicate Bank and the other
nationalised banks in relation to their total branches from
1984 to 1993-94. The social orientation of the banks under
this sub-parameter is mostly based on the policy laid down by
the Reserve Bank of India in this respect. Allahabad Bank has
achieved the highest share of 74 percent in rural and
semi-urban branches in 1985 and maintained it around 74
percent except in 1993-94. Vijaya Bank. Corporation Bank and
Punjab and Sind Bank had only a share around 60 percp.nt during
the ten year period of 1984 to 1993-94. Syndicate Bank
maintained a share around 70 percent during the ten year
period.
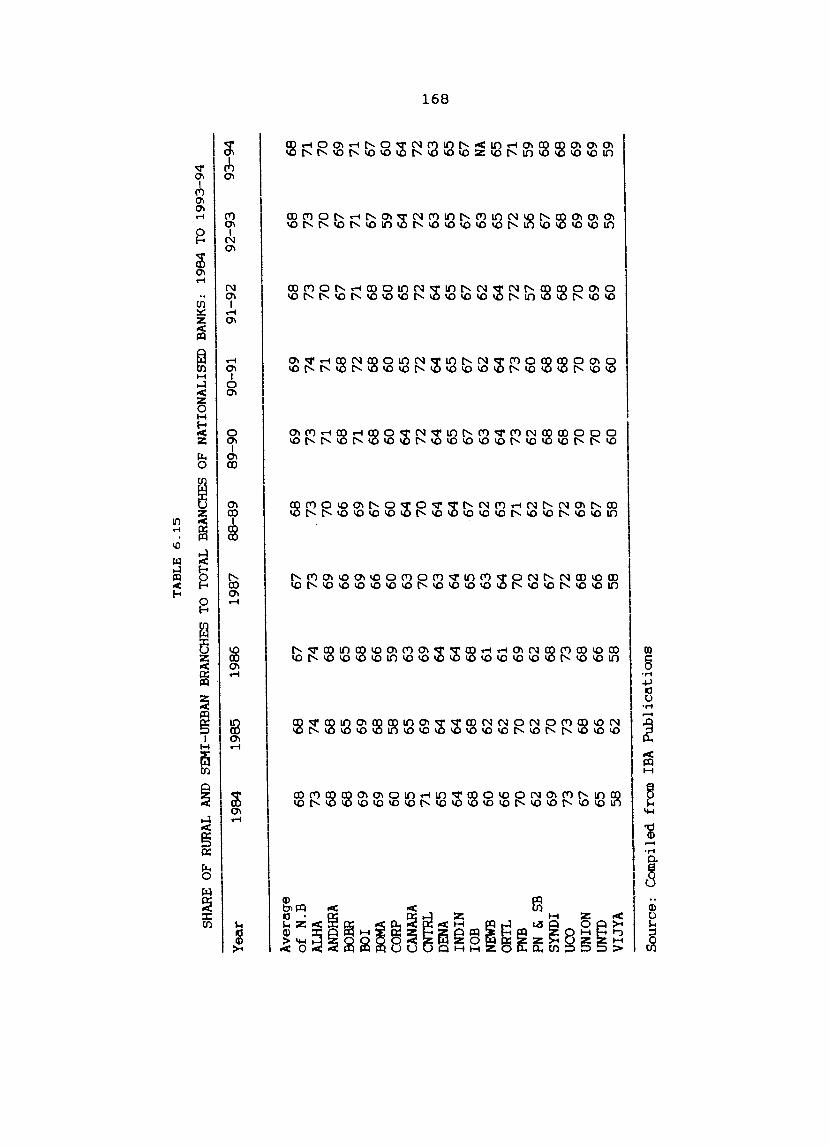
TA
BL
E 6
.15
SHAR
E OF
RUR
AL
AND
SEM
I-URB
AN
BRA
NCHE
S TO
TOT
AL B
RANC
HES
OF
NA
TIO
NA
LISE
D B
ANKS
: 19
84 T
O 19
93-9
4
Yea
r 19
84
1985
19
86
1987
8
8-8
9
89
-90
9
0-9
1
91
-92
9
2-9
3
93
-94
Ave
rage
o
f N
.B
68
68
67
67
68
69
69
68
68
6
8
ALHA
7
3
74
74
73
.7
3
73
74
7
3
73
71
AN
DHRA
6
8
68
6
8
69
70
71
71
7
0
70
70
BO
BH
68
65
65
66
66
68
6
8
67
67
69
BO
I 69
69
6
8
69
69
71
72
71
71
71
BOM
A 69
6
8
66
66
67
6
8
68
68
6
7
67
CORP
60
58
59
60
60
60
60
60
59
60
CA
NARA
65
65
63
63
6
4
64
65
65
64
64
CN
TRL
71
69
69
70
70
72
72
72
72
72
DE
NA
65
64
64
63
64
64
6
4
64
63
63
.....
01
IND
IN
64
64
64
64
64
65
65
65
65
65
()
)
lOB
68
68
6
8
65
67
67
67
67
6
7
67
NEW
B 60
62
61
6
3
62
63
62
62
63
NA
O
RTL
66
62
61
64
63
64
64
6
4
65
65
PNB
7
0
70
69
70
71
73
7
3
72
72
71
PN
& SB
62
62
62
62
62
62
60
5
7
56
59
SYN
DI
69
70
68
6
7
67
68
6
8
68
6
7
68
UCO
73
7
3
73
72
72
68
68
6
8
68
6
8
UNIO
N 67
6
8
68
68
69
70
70
70
69
69
UNTD
65
66
66
66
6
7
70
69
69
69
69
VIJ
YA
5
8
62
58
58
58
60
60
60
59
59
Sou
rce:
C
ompi
led
from
IB
A
Pu
bli
cati
on
s
169
Though there is a stipulated target of forty percent
wery year in respect of priority sector advances to total.
advance. Table 6.16 shows the non-adherence to the stipulated
target by almost all the nationalised banks during the period
1984 to 1993-94.Such a variation was entirely at the
discretion of the banks: either too much emphasis on this
sub-parameter or the least emphasis. In the case of Syndicate
Bank where it had a rise in priority sector advances to the
extent of 45.51 percent during 1985. it had even come down to
26.12 percent during 1992-93. Bank of India. Bank of Baroda.
Indian Overseas Bank. Uco Bank. Indian Bank and so on too
followed the same trend extending credit to the priority
sectors. Only very few banks like Oriental Bank of Commerce.
Dena Bank and Bank of Maharashtra maintained a consistently
satisfactory performance in priority sector advances as is
revealed by Table 6.16.
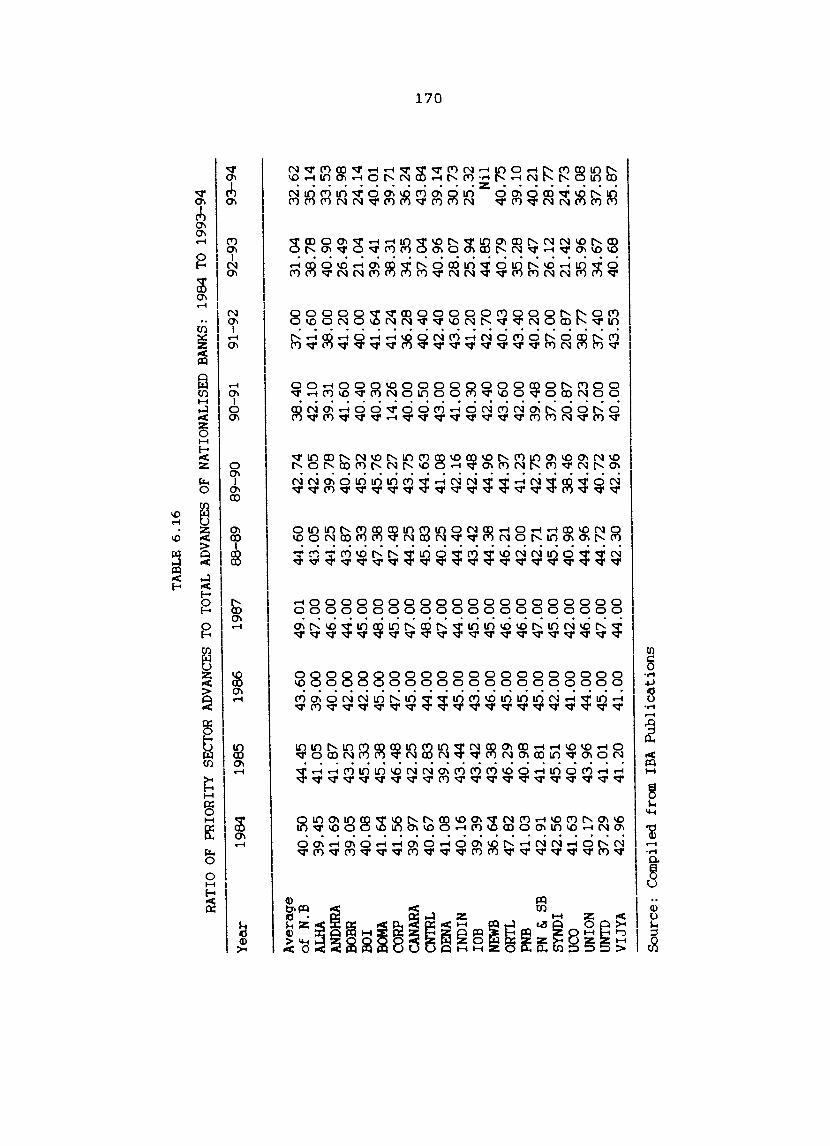
TA
BL
E 6
.16
RATI
O O
F PR
IORI
TY
SECT
OR
ADVA
NCES
TO
TOTA
L AD
VANC
ES O
F N
ATI
ON
ALI
SED
BAN
KS:
1984
TO
1993
-94
Yea
r 19
84
1985
19
86
1987
88
-89
89-9
0 90
-91
91-9
2 92
-93
93-9
4
Ave
rage
of
N.B
4
0.5
0
44
.45
4
3.6
0
49.0
1 44
.60
42
.74
3
8.4
0
37
.00
3
1.0
4
32
.62
AL
HA
39
.45
4
1.0
5
39
.00
4
7.0
0
4:3.
05
42
.05
4
2.1
0
41
.60
3
8.7
8
35
.14
AN
DHRA
4
1.6
9
41
.87
4
0.0
0
46
.00
4
1.2
5
39
.78
39
.31
38
.00
4
0.9
0
33
.53
BO
BR
39
.05
4
3.2
5
42
.00
4
4.0
0
43
.87
4
0.8
7
41
.60
4
1.2
0
26.4
9 2
5.9
8
BOl
40
.08
4
5.3
3
42
.00
4
5.0
0
46
.33
4
5.3
2
40
.40
4
0.0
0
21
.04
2
4.1
4
BOM
A 4
1.6
4
45
.38
4
5.0
0
48
.00
4
7.3
8
45
.76
4
0.3
0
41
.64
39
.41
40.0
1 C
OR
P 4
1.5
6
46
.48
4
7.0
0
45
.00
4
7.4
8
45
.27
1
4.2
6
41
.24
38
.31
39.7
1 CA
NARA
3
9.9
7
42
.25
4
5.0
0
47
.00
4
4.2
5
43
.75
4
0.0
0
36
.28
34
.35
36.2
4 CN
TRL
40
.67
4
2.8
3
44
.00
4
8.0
0
45
.83
4
4.6
3
40
.50
4
0.4
0
37
.04
4
3.8
4
.....
DENA
4
1.0
8
39
.25
4
4.0
0
47
.00
4
0.2
5
41
.08
4
3.0
0
42
.40
4
0.9
6
39
.14
-..
J 0
IND
IN
40
.16
4
3.4
4
45
.00
4
4.0
0
44
.40
4
2.1
6
41
.00
4
3.6
0
28
.07
3
0.7
3
lOB
3
9.3
9
43
.42
4
3.0
0
45
.00
4
3.4
2
42
.48
4
0.3
0
41
.20
25
.94
25.3
2 NE
WB
36
.64
4
3.3
8
46
.00
4
5.0
0
44
.38
4
4.9
6
42
.40
4
2.7
0
44.8
5 N
il
ORTL
4
7.8
2
46
.29
4
5.0
0
46
.00
46
.21
44
.37
4
3.6
0
40
.43
4
0.7
9
40
.75
PN
B 4
1.0
3
40
.98
4
5.0
0
46
.00
4
2.0
0
41
.23
4
2.0
0
43
.40
3
5.2
8
39
.10
PN
& SB
42
.91
41.8
1 4
5.0
0
47
.00
42
.71
42
.75
3
9.4
8
40
.20
3
7.4
7
40.2
1 SY
NDI
42
.56
4
5.5
1
42
.00
4
5.0
0
45.5
1 4
4.3
9
37
.00
3
7.0
0
26.1
2 2
8.7
7
UCO
4
1.6
3
40
.46
4
1.0
0
42
.00
4
0.9
8
38
.46
2
0.8
7
20
.87
21
.42
24
.73
UN
ION
40
.17
4
3.9
6
44
.00
4
6.0
0
44
.96
4
4.2
9
40
.23
3
8.7
7
35
.96
3
6.0
8
UN
TO
37
.29
41
.01
45
.00
4
7.0
0
44
.72
4
0.7
2
37
.00
3
7.4
0
34
.67
3
7.5
5
VIJ
YA
4
2.9
6
41
.20
4
1.0
0
44
.00
4
2.3
0
42
.96
4
0.0
0
43
.53
4
0.6
8
35
.87
Sou
rce:
C
ompi
led
from
IB
A P
ub
lica
tio
ns
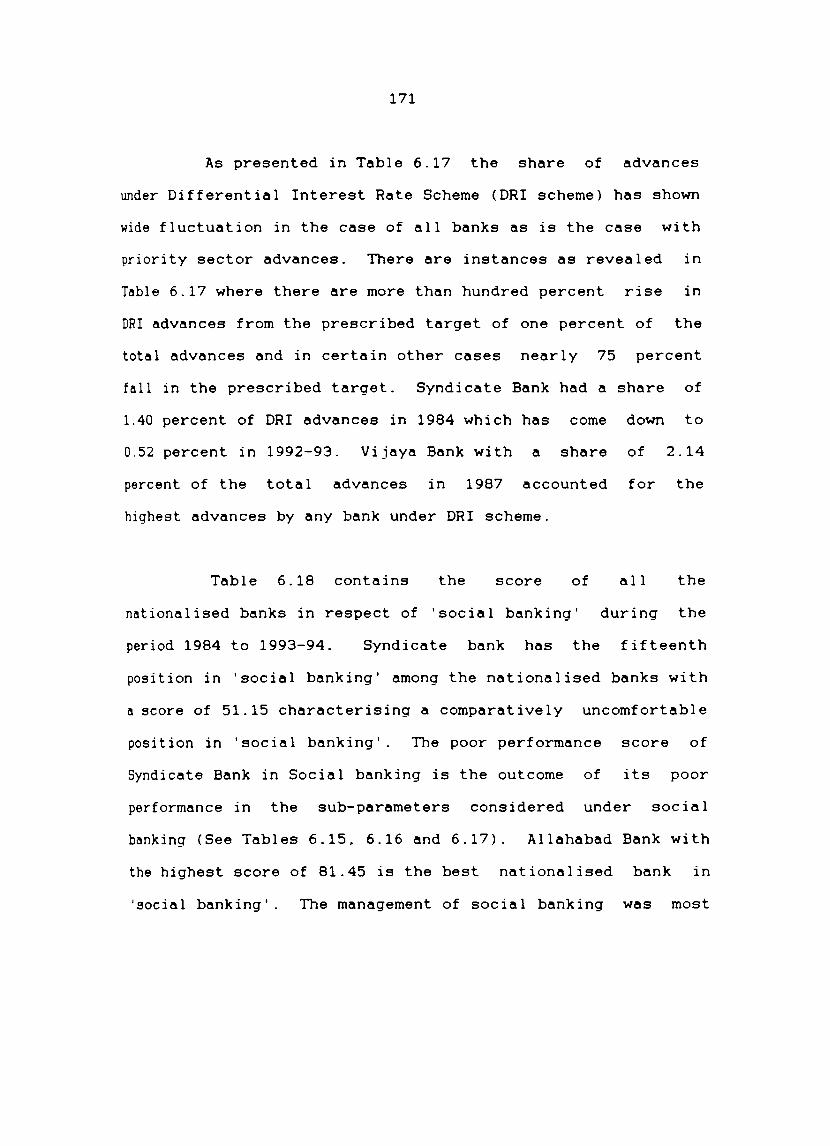
171
As presented in Table 6.17 the share of advances
under Differential Interest Rate Scheme (DRI scheme) has shown
wide fluctuation in the case of all banks as is the case with
priority sector advances. There are instances as revealed in
Table 6.17 where there are more than hundred percent rise in
DRI advances from the prescribed target of one percent of the
total advances and in certain other cases nearly 75 percent
fall in the prescribed target. Syndicate Bank had a share of
1.40 percent of DRI advances in 1984 which has come down to
0.52 percent in 1992-93. Vijaya Bank with a share of 2.14
percent of the total advances in 1987 accounted for the
highest advances by any bank under DRI scheme.
Table 6.18 contains the score of all the
nationalised banks in respect of 'social banking' during the
period 1984 to 1993-94. Syndicate bank has the fifteenth
position in 'social banking' among the nationalised banks with
a score of 51.15 characterising a comparatively uncomfortable
position in 'social banking'. The poor performance score of
Syndicate Bank in Social banking is the outcome of its poor
performance in the sub-parameters considered under social
banking (See Tables 6.15. 6.16 and 6.17). Allahabad Bank with
the highest score of 81.45 is the best nationalised bank in
'social banking'. The management of social banking was most
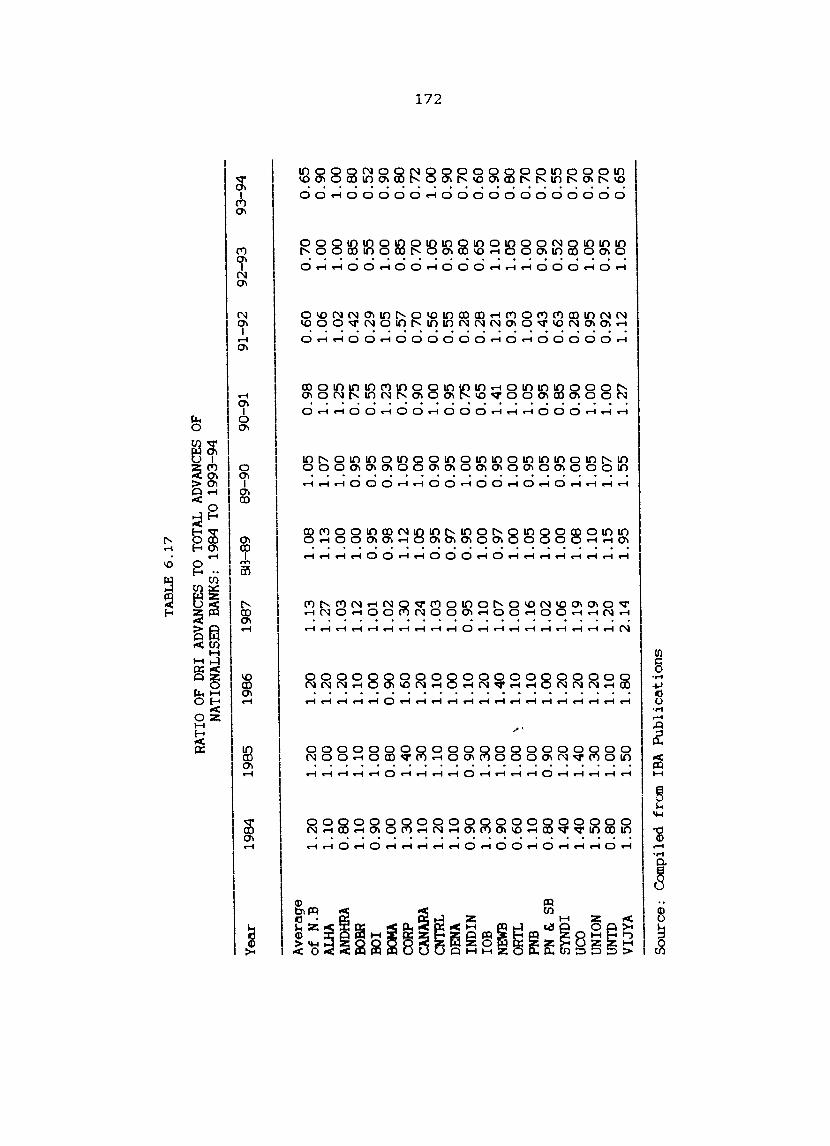
TA
BL
E 6
.17
RA
TIO
O
F D
RI
ADVA
NCES
TO
TO
TAL
ADVA
NCES
O
F N
ATI
ON
ALI
SED
BA
NK
S:
1984
TO
1993
-94
Yea
r 19
84
1985
19
86
1987
81
3-89
8
9-9
0
90-9
1 9
1-9
2
92
-93
93
-94
Ave
rage
o
f N
.B
1.2
0
1.2
0
1.2
0
1.1
3
1.0
8
1.0
5
0.9
8
0.6
0
0.7
0
0.6
5
ALH.
A 1
.10
1
.00
1
.20
1
.27
1
.13
1
.07
1
.00
1
.06
1
.00
0
.90
AN
DHRA
0
.80
1
.00
1
.20
1
.03
1
.00
1
.00
1
.25
1
.02
1
.00
1
.00
BO
BR
1.1
0
1.1
0
1.1
0
1.1
2
1.0
0
0.9
5
0.7
5
0.4
2
0.8
5
0.8
0
001
0.9
0
1.0
0
1.0
0
1.0
1
0.9
5
0.9
5
0.5
5
0.2
9
0.5
5
0.5
2
BCM
A 1
.00
0
.80
0
.90
1
.02
0
.98
0
.90
1
.23
1
.05
1
.00
0
.90
C
OR
l' 1
.30
1
.40
1
.60
1
.30
1
.12
1
.05
0
.75
0
.57
0
.85
0
.80
CA
NARA
1
.10
1
.30
1
.20
1
.24
1
.05
1
.00
0
.90
0
.70
0
.70
0
.72
~
CNTR
L 1
.20
1
.10
1
.10
1
.03
0
.95
0
.90
1
.00
0
.56
1
.05
1
.00
-.J
DENA
1
.10
1
.00
1
.00
1
.00
0
.97
0
.95
0
.95
0
.55
0
.95
0
.90
t\
J
IND
IN
0.9
0
0.9
0
1.1
0
0.9
5
0.9
5
1.0
0
0.7
5
0.2
8
0.8
0
0.7
0
lOB
1
.30
1
.30
1
.20
1
.10
1
.00
0
.95
0
.65
0
.28
0
.65
0
.60
NE
WB
0.9
0
1.0
0
1.4
0
1.0
7
0.9
7
0.9
5
1.4
1
1.2
1
1.1
0
0.9
0
OIIT
L 0
.60
1
.00
':
1.1
0
1.0
0
1.0
0
1.0
0
1.0
0
0.9
3
1.0
5
0.8
0
PNB
1.1
0
1.0
0
1.1
0
1.1
6
1.0
5
0.9
5
1.0
5
1.0
0
1.0
0
0.7
0
PN &
SB
0.8
0
0.9
0
1.0
0
1.0
2
1.0
0
1.0
5
0.9
5
0.4
3
0.9
0
0.7
0
SYN
DI
1.4
0
1.2
0
1.2
0
1.0
6
1.0
0
0.9
5
0.8
5
0.6
3
0.5
2
0.5
5
UCO
1.4
0
1.4
0
1.2
0
1.1
9
1.0
8
1.0
0
0.9
0
0.2
8
0.8
0
0.7
0
UN
ION
1
.50
1
.30
1
.20
1
.19
1
.10
1
.05
1
.00
0
.95
1
.05
0
.90
UN
TD
0.8
0
1.0
0
1.1
0
1.2
0
1.1
5
1.0
7
1.0
0
0.9
2
0.9
5
0.7
0
VIJ
YA
1
.50
1
.50
1
.80
2
.14
1
.95
1
.55
1
.27
1
.12
1
.05
0
.65
So
urc
e:
Com
pile
d fr
om
IBA
P
ub
licati
on
s
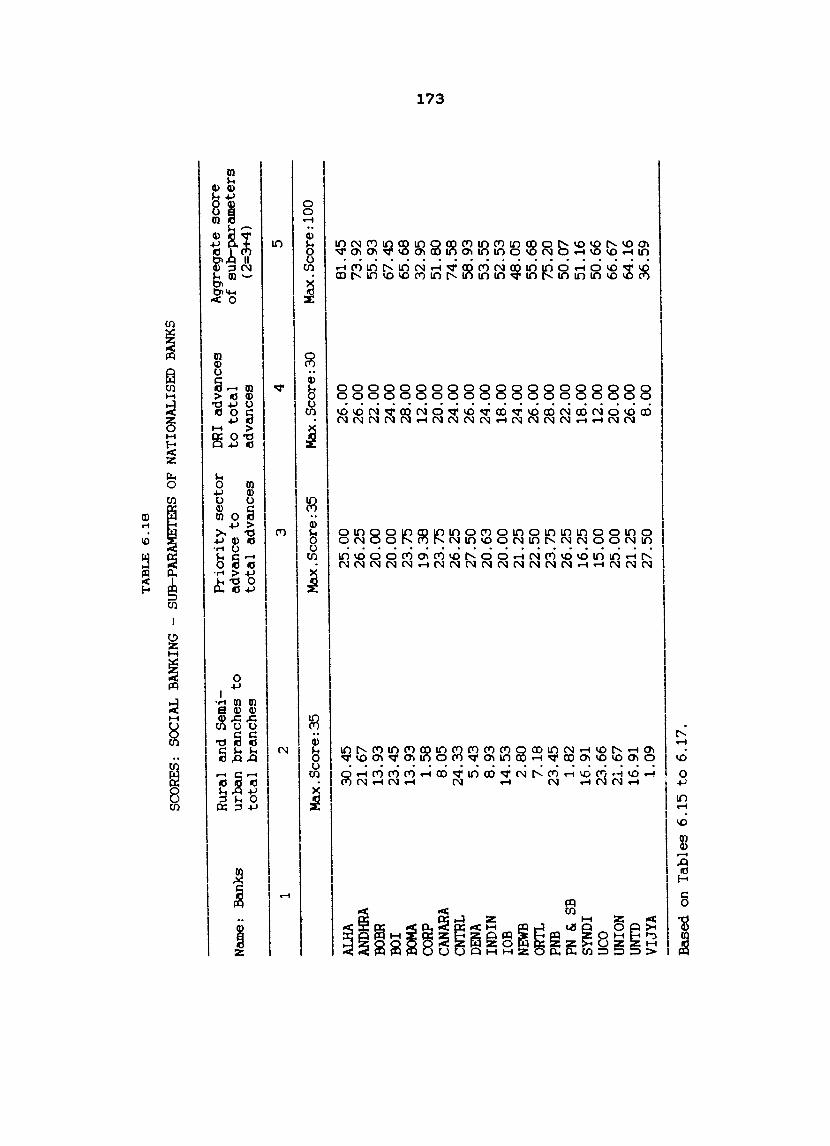
TA
BL
E 6
.18
SCO
RES:
SO
CIA
L BA
NKIN
G -
SUB-
PARA
MET
ERS
OF
NA
TIO
NA
LISE
D B
ANKS
Rur
a 1 a
nd S
emi-
Pri
ori
ty s
ecto
r D
RI
adva
nces
A
ggre
gate
sco
re
Na
me
: B
an
ks
urba
n b
ran
ches
to
ad
vanc
e to
to
to
tal
of
sub
-par
amet
ers
tota
l b
ran
ches
to
tal
adva
nces
ad
vanc
es
(2=
3+4)
1 2
3 4
5
Max
.Sco
re:3
5 M
ax.S
core
:35
Max
.Sco
re:3
0 M
ax.S
core
:l00
ALHA
3
0.4
5
25.0
0 26
.00
81
.45
AN
DH
RA
21.6
7 26
.25
26.0
0 73
.92
ooBR
1
3.9
3
20.0
0 22
.00
55
.93
00
1 23
.45
20.0
0 24
.00
67.4
5 BO
MA
13
.93
23
.75
28.0
0 65
.68
CORP
1
.58
1
9.3
8
12
.00
3
2.9
5
.... CA
NARA
8
.05
23
.75
20.0
0 5
1.8
0
-..J w
CNTR
L 2
4.3
3
26.2
5 24
.00
74
.58
DE
NA
5.4
3
27.5
0 26
.00
58
.93
IN
DIN
8
.93
20
.63
24.0
0 5
3.5
5
lOB
1
4.5
3
20.0
0 1
8.0
0
52
.53
NE
WB
2.8
0
21.2
5 24
.00
48.0
5 e
Rn
7
.18
22
.50
26.0
0 5
5.6
8
PNB
23.4
5 23
.75
28.0
0 75
.20
PN
&
SB
1.8
2
26.2
5 22
.00
50
.07
SY
ND
I 16
.91
16
.25
1
8.0
0
51.1
6 UC
O 23
.66
15
.00
1
2.0
0
50.6
6 U
NIO
N
21
.67
25
.00
20.0
0 66
.67
UN
TD
16.9
1 21
.25
26.0
0 64
.16
VIJ
YA
1
.09
27
.50
8.0
0
36
.59
--
_.,
B
ased
on
Tab
les
6.1
5 t
o 6
.17
.
174
judiciously undertaken by Allahabad Bank. Vijaya Bank with a
score of 36.58 is the least performing bank in 'social
banking'. It has lagged behind all other banks in opening
rural and semi-urban branches as is revealed by Table 6.15 and
has an improper performance in the DRI advances as is shown in
Table 6.17.
6.2. 2 . Growt h
'Growth' is generally considered as the most
important parameter of performance. 'Growth' is the outcome
of a bank's general management function. Of course the
policies and priorities of the Reserve Bank of India and the
Government of India play an important role in this respect.
The general economic environment. prudential funds management
and so on too have its bearing on 'growth' of the banks. The
performance of 'growth' of Syndicate Bank and other
nationalised banks is assessed on the basis of the performance
of a number of sub-parameters. Tables 6.19 to 6.27 put forth
the identified sub-parameters of 'growth' and their
performance during the ten year period of 1984 to 1993-94.
Table 6.19 shows that. except for the years 1984.
1992-93 and 1993-94. the rate of growth in deposits of
175
Syndicate Bank was below the average
deposits of all the nationalised banks
rate
taken
of growth
together.
of
A
negative rate of·~rowth in deposits during the ten year period
of study is shown by UCO Bank during 1993-94. The highest
rate of growth in deposits during the ten year period was
recorded by Oriental Bank of Commerce during 1985. Oriental
~nk of Commerce has in fact maintained all throughout the ten
year period. a rate of growth above the average rate of growth
of all the nationalised banks.
The rate of growth of advances of Syndicate Bank and
other nationalised banks show many ups and downs during the
ten year perie~ ef 1984 to 1993-94 as is presented in Table
6.20. Syndicate Bank has the highest rate of growth in
advances of 24 percent during 1984 and the lowest rate of
growth during 1993-94 - a negative growth rate of six percent.
It has a negative growth of two percent during 1991-92. the
year when it recorded the lowest rate of growth in deposits as
indicated in Table 6.19. Among the nationalised banks. the
highest negative growth of twenty one percent in advances
during the ten year period was recorded by UCO Bank in
1993-94: the highest rate of growth of forty five percent in
advances during the ten year period was recorded by Indian
bank in 1988-89.
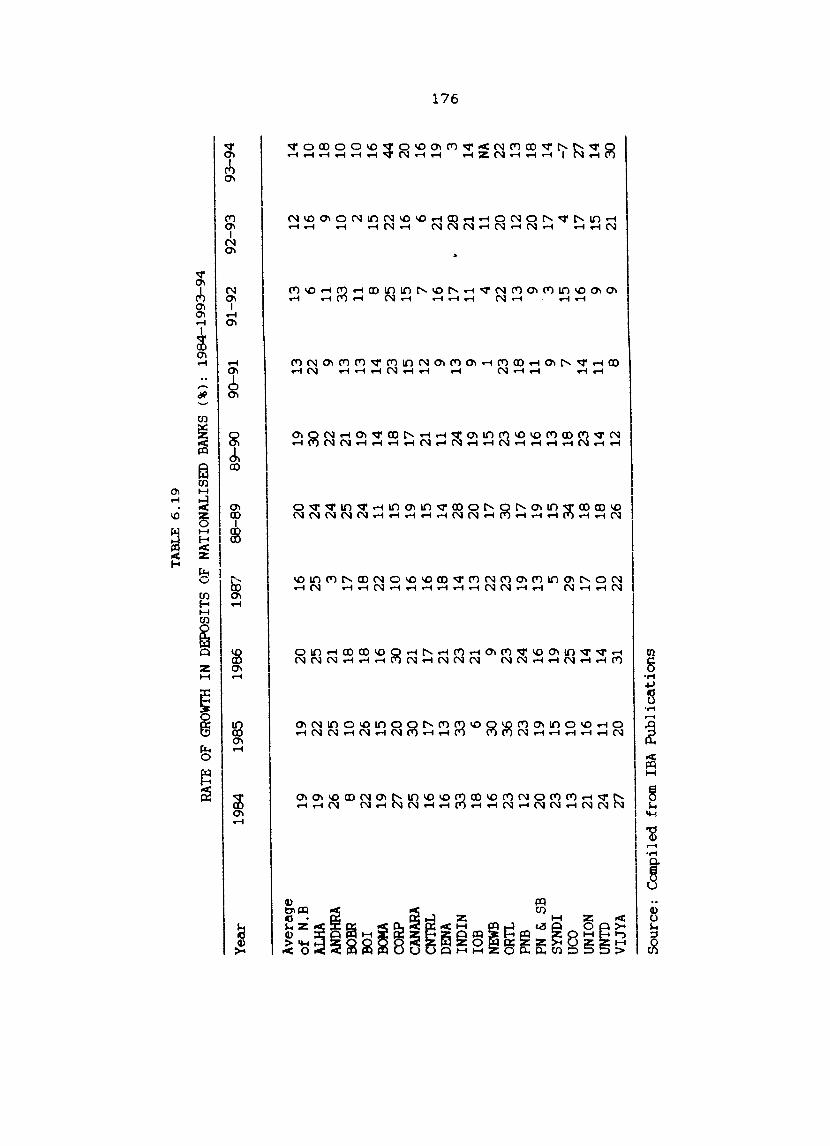
TA
BL
E 6
.19
RATE
OF
GROW
TH I
N D
EPO
SITS
OF
NATI
ONAL
ISED
BAN
KS
(%):
19
84-1
993-
94
Yea
r 19
84
1985
19
86
1987
88
-89
89-9
0 90
-91
91-9
2 92
-93
93-9
4
Ave
rage
o
f N
.B
19
19
20
16
20
19
13
13
12
14
ALH
A 19
22
25
25
24
3
0
22
6 16
10
AN
DHRA
26
25
21
3
24
22
9 11
9
18
BOBR
8
10
18
17
25
21
13
33
10
10
BO
I 22
26
18
18
24
19
13
11
2
10
BOM
A 19
15
16
22
11
14
14
8
15
16
CORP
Z7
20
3
0
10
15
18
23
25
22
44
CAN
ARA
25
30
21
16
19
17
15
15
16
20
CN
TRL
16
17
17
16
15
21
12
7 6
16
DENA
16
13
21
18
14
11
9
16
21
19
~
IND
IN
33
3
3
23
14
28
24
13
17
28
3 -.J
"
(]'I
lOB
18
6 21
13
20
19
9
11
21
14
NEW
B 16
3
0
9 22
17
15
1
4 11
NA
OR
TL
23
36
23
23
30
23
23
22
20
22
PN
B 12
23
24
19
17
16
18
13
12
13
PN
& SB
20
19
16
13
19
16
11
9
20
18
SYND
I 23
15
19
5
15
13
9 3
17
14
UCO
13
10
25
29
34
18
7 15
4
-7
UNIO
N 21
16
14
17
18
2
3
14
16
17
Z7
UNTD
24
11
14
10
18
14
11
9
15
14
VIJY
A
Z7
20
31
22
26
12
8 9
21
30
Sou
rce:
C
Om
pile
d fr
om
IBA
Pu
bli
cati
on
s
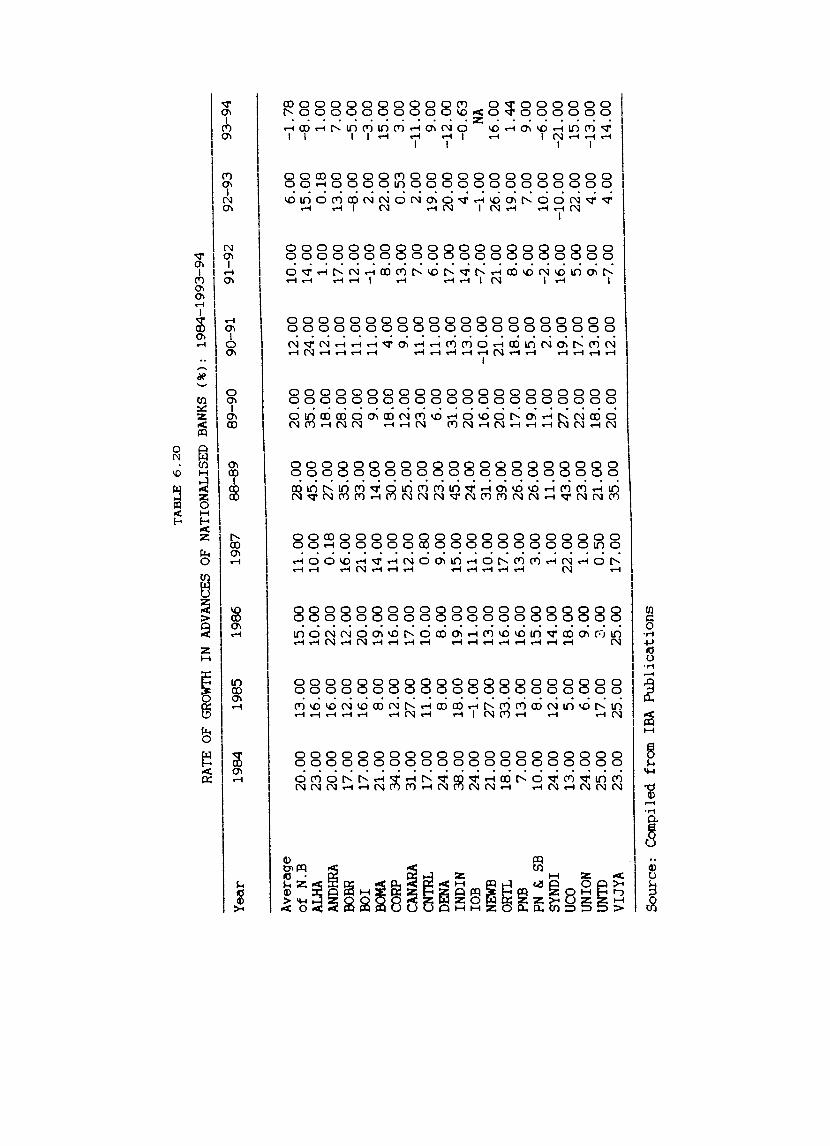
TA
BL
E 6
.20
RATE
OF
GROW
TH
IN
ADVA
NCES
O
F N
ATI
ON
ALI
SED
BA
NKS
(%):
19
84-1
993-
94
Yea
r 19
84
1985
19
86
1987
8
8-8
9
89
-90
90
-91
91
-92
9
2-9
3
93
-94
-----
Ave
rage
of
N.B
2
0.0
0
13
.00
1
5.0
0
11
.00
2
8.0
0
20
.00
1
2.0
0
10
.00
6
.00
-1
.78
ALHA
2
3.0
0
16
.00
1
0.0
0
10
.00
4
5.0
0
35
.00
2
4.0
0
14
.00
1
5.0
0
-8.0
0
ANDH
RA
20
.00
1
6.0
0
22
.00
0
.18
2
7.0
0
18
.00
1
2.0
0
1.0
0
0.1
8
1.0
0
BOBH
1
7.0
0
12
.00
1
2.0
0
16
.00
3
5.0
0
28
.00
1
1.0
0
17
.00
1
3.0
0
7.0
0
BOI
17
.00
1
6.0
0
20
.00
2
1.0
0
33
.00
2
0.0
0
11
.00
1
2.0
0
-8.0
0
-5.0
0
:soM
A
21
.00
8
.00
1
9.0
0
14
.00
1
4.0
0
9.0
0
11
.00
-1
.00
2
.00
-3
.00
CO
RP
34
.00
1
2.0
0
16
.00
1
1.0
0
30
.00
1
8.0
0
4.0
0
8.0
0
22
.00
1
5.0
0
CANA
RA
31
.00
2
7.0
0
17
.00
1
2.0
0
25
.00
1
2.0
0
9.0
0
13
.00
0
.53
3
.00
CN
TRL
17
.00
1
1.0
0
10
.00
0
.80
2
3.0
0
23
.00
1
1.0
0
7.0
0
2.0
0
-11
.00
DENA
2
4.0
0
8.0
0
8.0
0
9.0
0
23
.00
6
.00
1
1.0
0
6.0
0
19
.00
9
.00
IND
IN
38
.00
1
8.0
0
19
.00
1
5.0
0
45
.00
3
1.0
0
13
.00
1
7.0
0
20
.00
-1
2.0
0
lOB
24
.00
-1
.00
1
1.0
0
11
.00
2
4.0
0
20
.00
1
3.0
0
14
.00
4
.00
-0
.63
NEW
B 2
1.0
0
27
.00
1
3.0
0
10
.00
3
1.0
0
16
.00
-1
0.0
0
-7.0
0
-1.0
0
NA
ORTL
1
8.0
0
33
.00
1
6.0
0
17
.00
3
9.0
0
20
.00
2
1.0
0
21
.00
2
6.0
0
16
.00
PNB
7.0
0
13
.00
1
6.0
0
13
.00
2
6.0
0
17
.00
1
8.0
0
8.0
0
19
.00
1
.44
PN &
. SB
1
0.0
0
8.0
0
15
.00
3
.00
2
6.0
0
19
.00
1
5.0
0
6.0
0
7.0
0
9.0
0
SYND
I 2
4.0
0
12
.00
1
4.0
0
1.0
0
11
.00
1
1.0
0
2.0
0
-2.0
0
10
.00
-6
.00
UC
O
13
.00
5
.00
1
8.0
0
22
.00
4
3.0
0
27
.00
1
9.0
0
16
.00
-1
0.0
0
-21
.00
UNIO
N 2
4.0
0
6.0
0
9.0
0
1.0
0
23
.00
2
2.0
0
17
.00
5
.00
2
2.0
0
15
.00
UN
TD
25
.00
1
7.0
0
3.0
0
0.5
0
21
.00
1
8.0
0
13
.00
9
.00
4
.00
-1
3.0
0
VIJY
A
23
.00
2
5.0
0
25
.00
1
7.0
0
35
.00
2
0.0
0
12
.00
-7
.00
4
.00
1
4.0
0
----
Sou
rce:
C
ompi
led
from
IB
A
Pu
bli
cati
on
s
The average rate of growth in investments of all the
nationalised banks showed the highest level of thirty three
percent during 1993-94 as depicted in Table 6.21. This. as
noted earl ier is the outcome of the change in portfol io pol icy
of the banks consequent on the introduction of norms relating
to provisioning of assets. Syndicate Bank had a growth rate
of sixty six percent in investments during 1993-94 from a mere
nine percent growth in 1992-93. Syndicate Bank recorded the
lowest growth rate in investments during 1985. Among all the
nationalised banks. Corporation Bank has recorded the highest
growth rate in investments of 120 percent during 1993-94 and
the lowest growth rate of zero percent by Bank of Baroda in
1984.
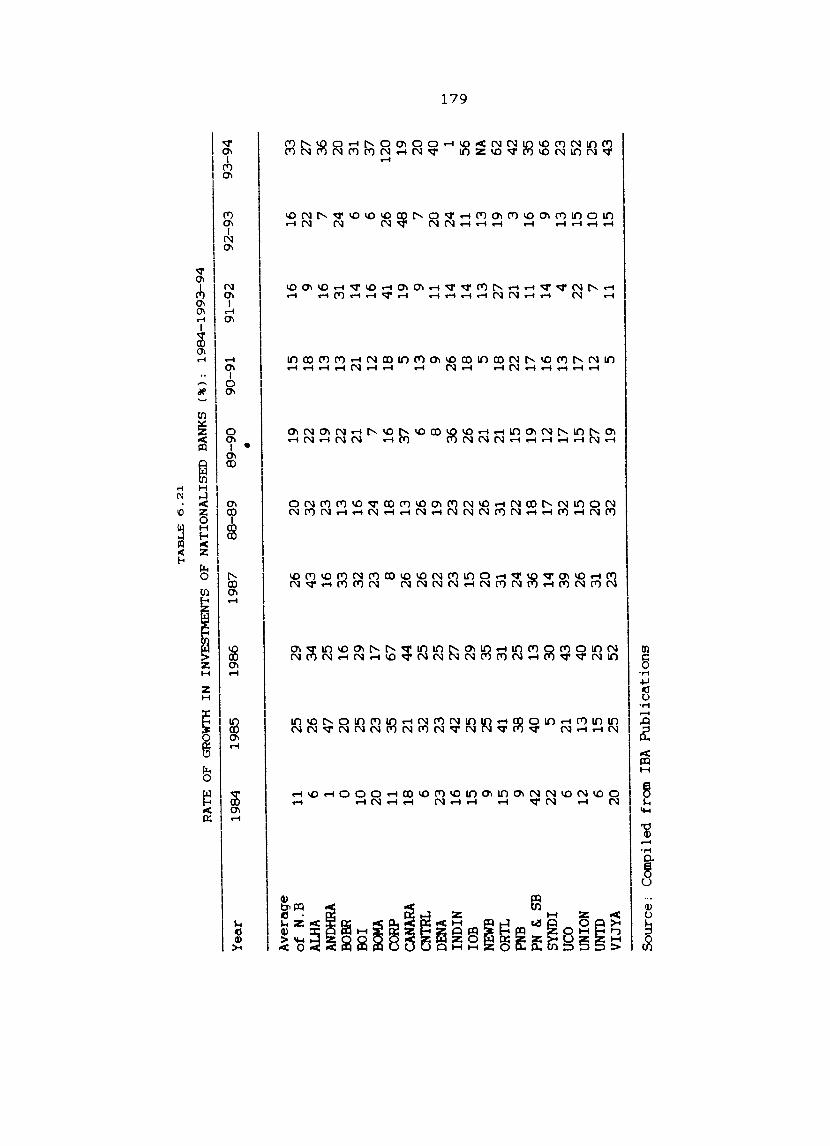
TA
BL
E 6
.21
RA
TE
O
F G
ROW
TH
IN
INV
EST
ME
NT
S O
F N
AT
ION
AL
ISE
D
BA
NK
S (%
):
19
84
-19
93
-94
Yea
r 1
98
4
19
85
1
98
6
19
87
8
8-8
9
89
-90
9
0-9
1
91
-92
9
2-9
3
93
-94
•
Ave
rage
o
f N
.B
11
25
29
26
20
19
1
5
16
1
6
33
A
LHA
6
26
34
4
3
32
22
1
8
9 22
27
AN
DH
RA
1 4
7
25
16
23
1
9
13
1
6
7 36
BO
HR
0 20
1
6
33
1
3
22
13
31
24
20
BO
I 1
0
25
29
3
2
16
21
21
1
4
6 31
BO
MA
20
23
1
7
23
24
7
12
1
6
6 3
7
CORP
11
3
5
67
8
18
1
6
18
41
26
1
20
CA
NA
RA
18
21
44
26
1
3
'37
5 1
9
48
19
C
NTR
L 6
32
25
26
26
6
13
9
7 20
DE
NA
23
2
3
25
22
1
9
8 9
11
20
40
IND
IN
16
42
Z7
2
3
23
3
6
26
14
24
1
~
~
lOB
1
5
25
29
15
22
26
1
8
14
11
5
6
ID
NEW
B 9
25
35
2
0
26
21
5 1
3
13
NA
O
RTI.
15
41
31
31
31
21
1
8
27
1
9
62
PN
B 9
38
25
24
22
1
5
22
21
3 4
2
PN &
SB
42
4
0
13
3
6
18
1
9
17
11
1
6
35
SY
NDI
22
5 3
0
14
1
7
12
1
6
14
9
66
UC
O 6
21
43
3
9
32
1
7
13
4
13
2
3
UNIO
N 1
2
13
4
0
26
15
1
5
17
22
1
5
52
UN
TO
6 1
5
25
31
2
0
27
1
2
7 1
0
25
VIJ
YA
20
25
5
2
23
3
2
19
5
11
15
4
3
Sou
rce:
C
ompi
led
from
IB
A
Pu
bli
cati
on
s
180
Table 6.22 presented the credit-deposit ratio of the
nationalised banks during the period 1984 to 1993-94. The
percentage of advances to total deposits of all the
national ised banks in toto have come down during 1993-94. The
reason again is the shift in the portfolio policy of the
banks. The effect of this shift is already shown in Table
6.20. The shift from the advances portfolio to investment
portfolio is evident from the details furnished in Table 6.21.
Syndicate bank has its lowest credit-deposit ratio of thirty
nine percent during 1993-94 and its highest ratio was during
1984. Among all the nationalised banks, the lowest ratio
recorded during the ten year period is seventy two percent in
1991-92 by Indian bank. It is also the Bank which is
maintaining the highest ratio of fifty seven percent during
1993-94. In the changed circumstances. this policy is one
among the reasons for the highest negative growth in net
profits of Indian bank during 1993-94 (See Table 6.4).

TA
BL
E 6
.22
CR
EDIT
-DEP
OSI
T R
ATI
O O
F N
ATI
ON
ALI
SED
BAN
KS
(%):
19
84-1
993-
94
Ye
ar
1984
19
85
1986
19
87
88-8
9 89
-90
90-9
1 91
-92
92-9
3 93
-94
Ave
rage
o
f N
.B
61
58
55
53
56
57
57
56
53
46
A
I.JiA
53
50
44
39
45
47
47
52
51
44
AN
DHRA
59
54
54
53
54
52
53
49
46
39
BO
BR
57
58
55
54
59
62
61
55
56
55
BO!
63
58
59
60
65
65
6
4
65
59
51
BOM
A 58
55
56
52
53
51
54
54
4
8
40
CO
RP
62
58
52
52
59
59
49
43
43
3
5
CAN
ARA
65
63
61
59
62
60
56
56
49
42
CNTH
L 60
57
5
4
47
50
51
51
51
49
38
~
(l)
DENA
61
59
52
49
52
50
51
49
4
8
44
~
IND
IN
67
59
57
58
66
70
70
72
67
57
lO
B
70
65
69
59
60
61
63
65
57
49
NE
WB
56
55
56
51
57
57
52
46
41
NA
ORT
L 53
52
49
46
50
49
4
8
49
52
49
PNB
58
5
3
50
47
51
52
52
51
54
45
PN &
SB
57
52
51
46
49
50
52
51
45
42
SY
ND
I 67
65
63
61
) 58
57
53
50
4
8
39
UCO
59
57
53
51
) 54
5
8
64
67
5
8
49
UNIO
N 62
56
54
4'7
4
8
48
50
46
4
8
44
UNTD
54
5
7
51
47
49
50
51
52
48
36
V
IJY
A
57
60
57
55
59
63
65
56
49
43
So
urc
e:
Com
pile
d fr
cm
IBA
P
ub
lica
tio
ns
182
Table 6.23 indicates substantial growth in equity of
all the nationalised banks. during the period under
reference'. As depicted in Table 6.23. Syndicate Bank has
recorded a rate of growth in equity of 428 percent during
1993-94 -the highest growth rate in equity recorded by a
nationalised bank during the year. Among the nationalised
banks. the highest rate of growth in equity of 1268 during the
ten year period of 1984 to 1993-94 was reported in the case of
Allahabad Bank during 1985. Tt.ere was no addition to the
equity of the nationalised banks during 1987.
The growth in reserves of Syndicate Bank and the
rest of the nationalised banks during 1984 to 1993-94 as
depicted in Table 6.24 reveals a growth rate of 493 percent
for Syndicate Bank during 1993-94. Among all the nationalised
banks. for the ten year period of 1984 to 1993-94 Punjab and
Sind Bank recorded the highest growth in reserves during
1993-94 with 941 percent increase over the previous year. The
lowest growth i.e .. the highest negative growth of reserves is
shown by Dena Bank during 1993-94.
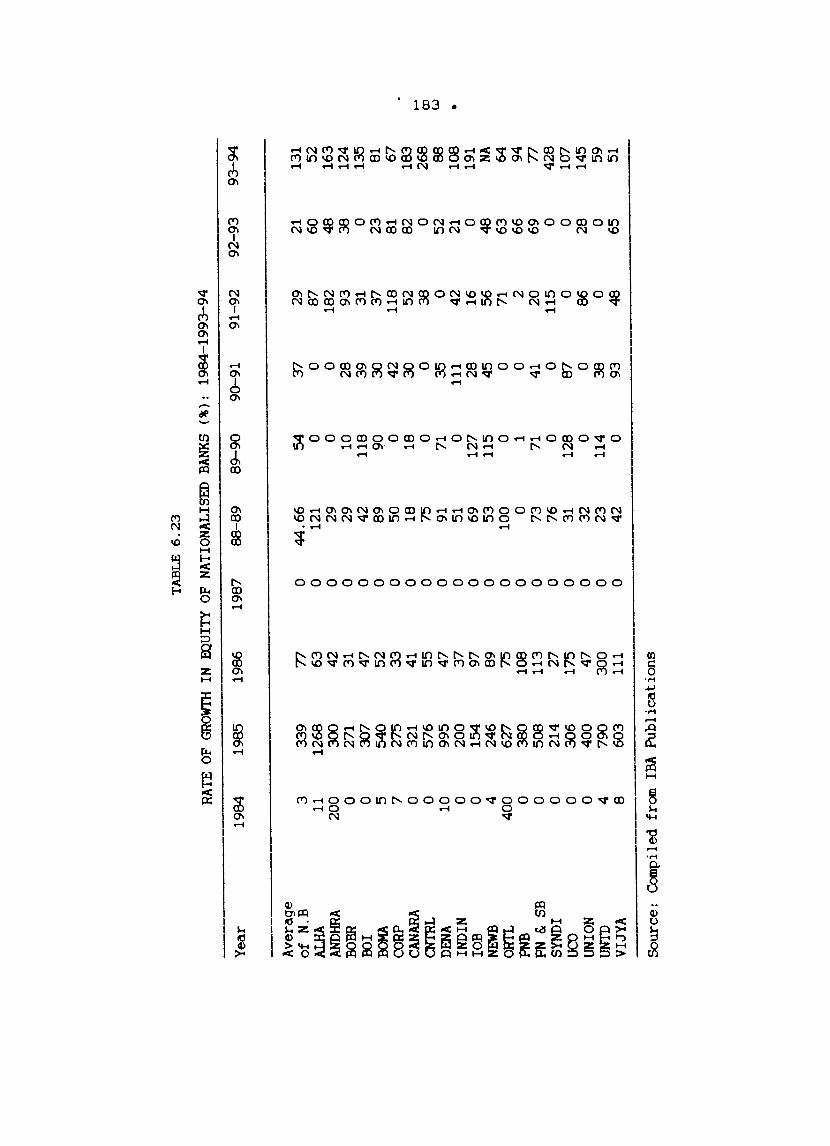
TA
BL
E 6
.23
RATE
OF
GROW
TH
IN
EQU
ITY
O
F N
ATI
ON
ALI
SED
BA
NKS
(%):
19
84-1
993-
94
Yea
r 19
84
1985
19
86
1987
8
8-8
9
89
-90
90
-91
91-9
2 9
2-9
3
93-9
4
Ave
rage
o
f N
.B
3 33
9 7
7
0 4
4.6
6
54
'37
29
21
131
ALH.
A 11
12
68
63
0 12
1 0
0 87
60
52
AN
DHRA
20
0 30
0 42
0
29
0 0
182
48
16
3 OO
BR
0 27
1 31
0
29
10
28
93
38
12
4 00
1 0
307
47
0 42
11
8 39
31
0
135
BOM
A 5
540
52
0 89
90
30
37
23
81
CO
RP
7 27
5 3
3
0 50
0
42
118
81
67
CAN
ARA
0 32
1 41
0
18
18
30
52
82
183
CNTR
L 0
576
55
0 75
0
0 3
8
0 26
8 I-
'
CD
DENA
10
99
5 47
0
91
71
35
0 52
88
w
IN
DIN
0
200
37
0 51
0
111
42
21
108
• lO
B
0 15
4 97
0
69
127
28
16
0 19
1 NE
WB
4 24
6 89
0
53
11
5 45
56
4
8
NA
ORT
L 40
0 62
7 75
0
100
0 0
71
63
64
PNB
0 3
80
10
8 0
0 1
0 2
66
94
PN &
SB
0 50
8 11
3 0
73
71
41
20
69
77
SY
ND
I 0
214
27
0 76
0
0 11
5 0
428
UCO
0 30
6 17
5 0
31
128
87
0
0 10
7 U
NIO
N
0 40
0 47
0
32
0 0
86
28
145
UN
TD
4 79
0 30
0 0
23
114
38
0
0 59
V
IJY
A
8 60
3 11
1 0
42
0 93
4
8
65
51
So
urc
e:
Com
pile
d fr
om
IBA
P
ub
licati
on
s
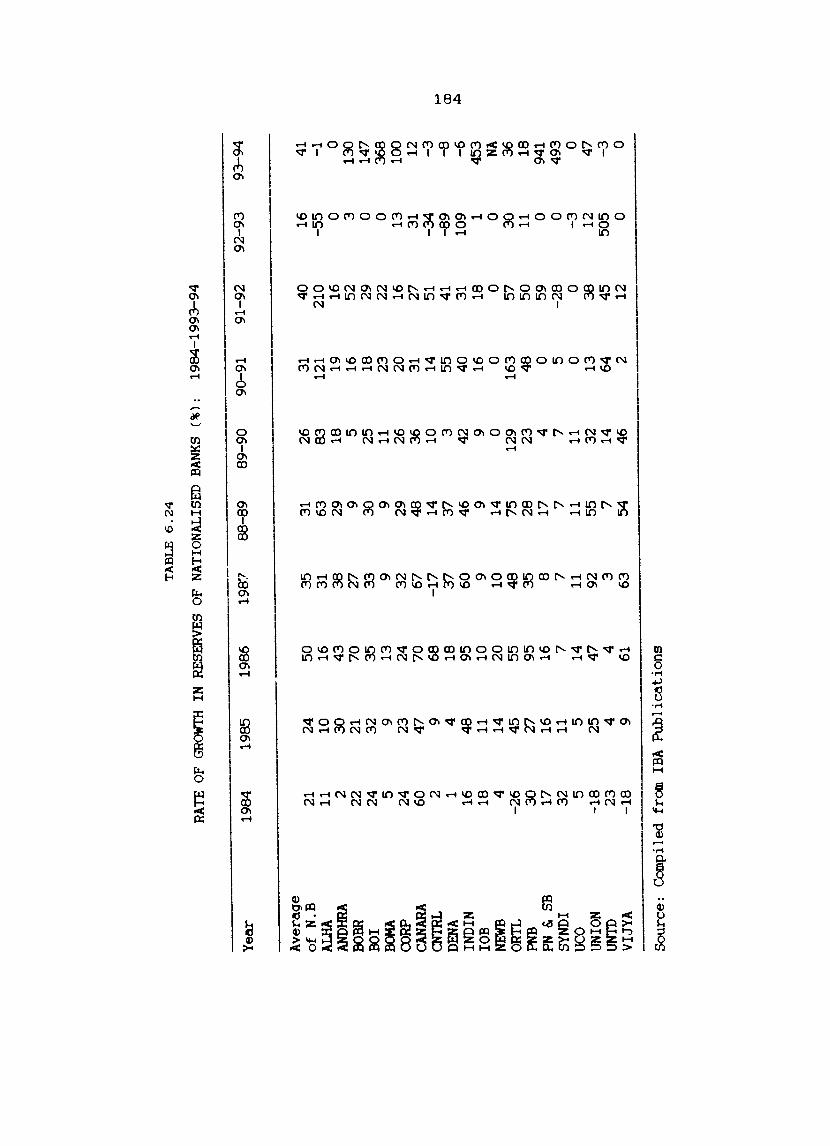
TA
BL
E 6
.24
RATE
OF
GROW
TH
IN R
ESER
VES
OF N
ATI
ON
ALI
SED
BAN
KS
(%):
19
84-1
993-
94
Yea
r 19
84
1985
19
86
198?
88
-89
89-9
0 90
-91
91-9
2 92
-93
93-9
4
Ave
rage
o
f N
.B
21
24
50
35
31
26
31
40
16
41
AL
HA
11
10
16
31
63
83
12
1 21
0 -5
5
-1
ANDH
RA
2 3
0
43
38
29
18
19
16
0
0 BO
HR
22
21
70
27
9 5
16
52
3 13
0 00
1 24
32
3
5
33
30
25
18
29
0
147
BOM
A 5
9 13
9
9 11
23
22
0
36
8
CORP
24
23
24
32
29
26
20
16
13
10
0 CA
NARA
60
47
70
67
48
36
31
27
31
12
CN
TRL
2 9
68
-1
7
14
10
14
51
-34
-3
DE
NA
1 4
18
37
37
3
55
41
-89
-8
~
CD
IND
IN
16
48
95
60
46
42
40
31
109
-6
.t-
lOB
18
11
10
9 9
9 16
18
1
453
NEW
B 4
14
20
10
14
0 0
0 0
NA
ORTL
-2
6
45
55
48
75
129
163
57
30
36
PNB
30
'Z
7 95
3
5
28
23
48
50
11
18
PN &
SB
17
16
16
8 17
4
0 59
0
941
SYND
I 32
11
7
7 7
7 5
-28
0
493
UCO
5 5
14
11
11
11
0 0
-3
0 UN
ION
-18
25
47
92
55
32
13
3
8
12
47
UNTO
23
4
4 3
7 14
6
4
45
505
-3
VIJ
YA
-1
8
9 61
63
5
4
46
2 12
0
0
Sou
rce:
C
ompi
led
from
IB
A P
ub
lica
tio
ns
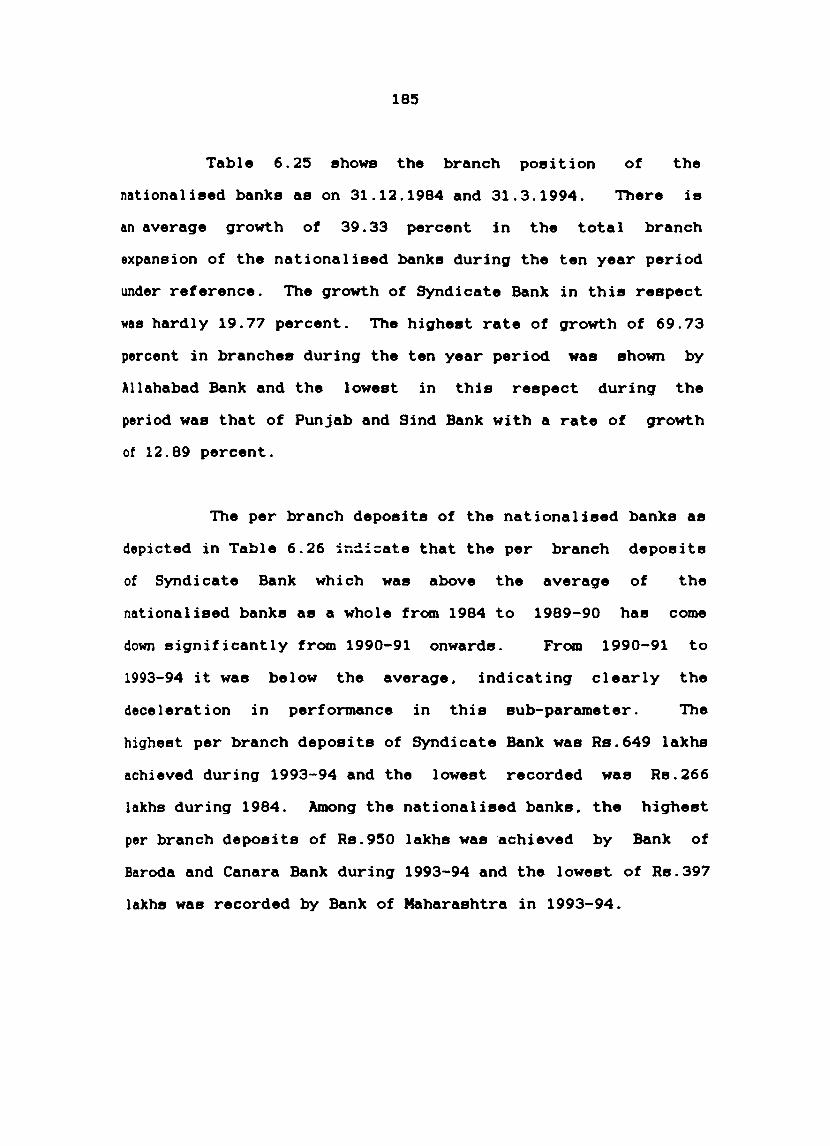
185
Table 6.25 shows the branch position of the
nationalised banks as on 31.12.1984 and 31.3.1994. There is
an average growth of 39.33 percent in the total branch
expansion of the nationalised banks during the ten year period
under reference. The growth of Syndicate Bank in this respect
was hardly 19.77 percent. The highest rate of growth of 69.73
percent in branches during the ten year period was shown by
Allahabad Bank and the lowest in this respect during the
period was that of Punjab and Bind Bank with a rate of growth
of 12.89 percent.
The per branch deposits of the nationalised banks as
depicted in Table 6.26 in~i~ate that the per branch deposits
of Syndicate Bank which was above the average of the
nationalised banks as a whole from 1984 to 1989-90 has come
down significantly from 1990-91 onwards. From 1990-91 to
1993-94 it was below the average. indicating clearly the
deceleration in performance in this sub-parameter. The
highest per branch deposits of Syndicate Bank was Rs.649 lakhs
achieved during 1993-94 and the lowest recorded was Rs.266
lakhs during 1984. Among the nationalised banks. the highest
per branch deposits of Rs.950 lakhs was achieved by Bank of
Baroda and Canara Bank during 1993-94 and the lowest of Rs.397
lakhs was recorded by Bank of Maharashtra in 1993-94.
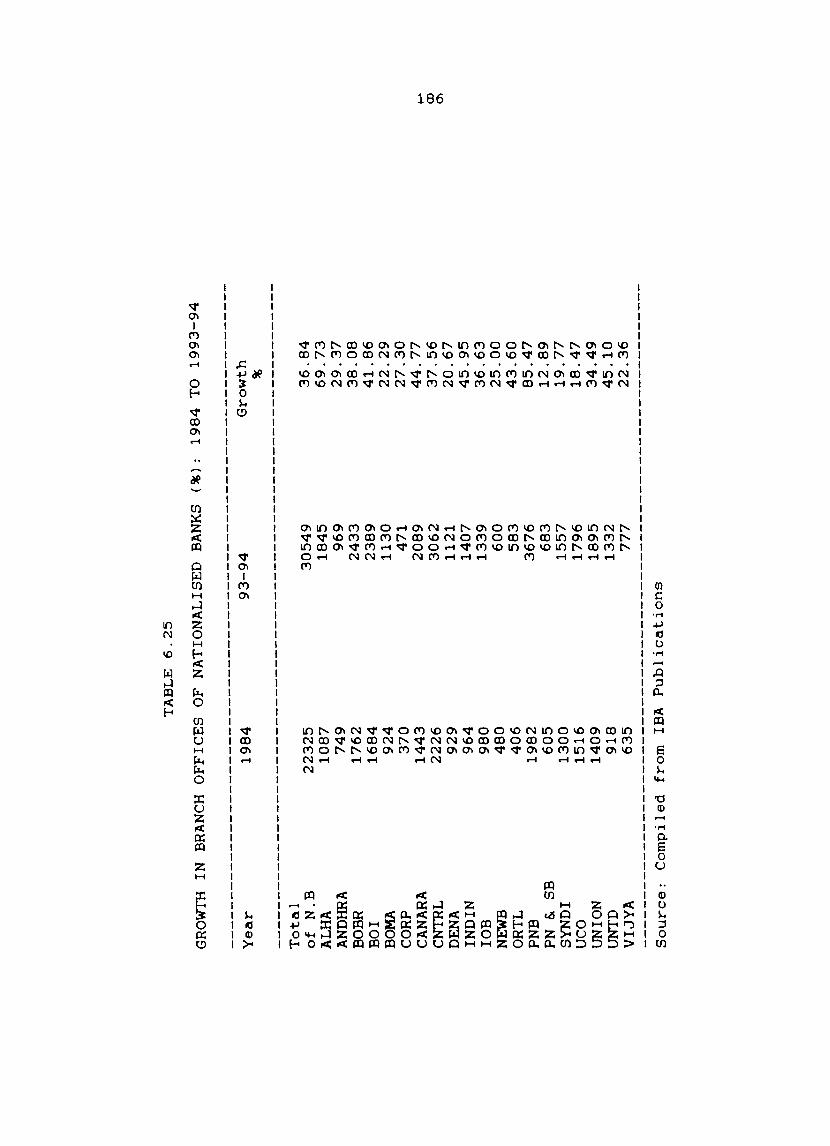
TA
BL
E
6.2
5
GRO
WTH
IN
B
RA
NC
H
OF
FIC
ES
O
F N
AT
ION
AL
ISE
D
BA
NK
S (%
);
19
84
TO
1
99
3-9
4
Year
To
tal
of
N.B
A
LHA
AN
DHRA
B
OB
R
BO
I BO
MA
C
OR
P CA
NARA
CN
TRL
DEN
A
IND
IN
lOB
N
EWB
O
RT
L
PNB
PN
&
SB
SY
ND
I U
CO
U
NIO
N
UN
TD
V
IJY
A
19
84
22
32
5
10
87
7
49
1
76
2
16
84
9
24
3
70
1
44
3
22
26
9
29
9
64
9
80
4
80
4
06
1
98
2
60
5
13
00
1
51
6
14
09
9
18
6
35
93
-94
30
54
9
18
45
9
69
2
43
3
23
89
1
13
0
47
1
20
89
3
06
2
11
21
1
40
7
13
39
6
00
5
83
3
67
6
68
3
15
57
1
79
6
18
95
1
33
2
77
7
So
urc
e:
Co
mp
iled
fr
om
IB
A
Pu
bli
cati
on
s
Gro
wth
%
36
.84
6
9.7
3
29
.37
3
8.0
8
41
.86
2
2.2
9
27
.30
4
4.7
7
37
.56
2
0.6
7
45
.95
3
6.6
3
25
.00
4
3.6
0
85
.47
1
2.8
9
19
.77
1
8.4
7
34
.49
4
5.1
0
22
.36
.... (Xl
0\
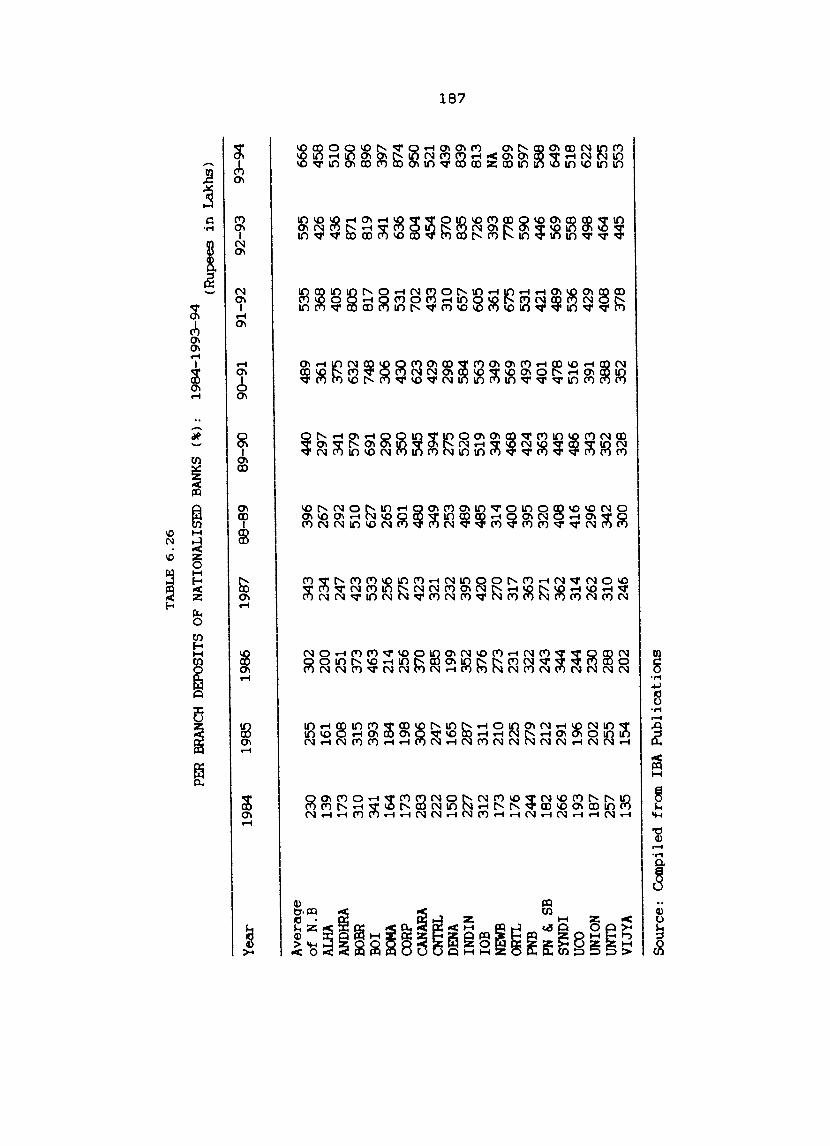
TA
BL
E 6
.26
PER
BRAN
CH D
EPO
SITS
OF
NA
TIO
NA
LISE
D B
ANKS
(%
):
19
84
-19
93
-94
(R
up
ee
s in
La
kh
s)
Yea
r 19
84
1985
19
86
1987
88
-89
89-9
0 90
-91
91-9
2 92
-93
93-9
4
Ave
rage
o
f N
.B
230
255
302
343
396
440
489
535
595
666
ALHA
13
9 16
1 20
0 23
4 26
7 29
7 36
1 36
8 42
6 45
8 AN
DH
RA
173
208
251
247
292
341
375
405
436
510
BOBR
31
0 31
5 37
3 42
3 51
0 57
9 63
2 80
5 87
1 95
0 BO
I 34
1 39
3 46
3 53
3 62
7 69
1 74
8 81
7 81
9 89
6 BO
NA
164
184
214
256
265
290
306
300
341
397
CO
RP
173
198
256
275
301
350
430
531
636
874
CAN
ARA
28
3 30
6 37
0 42
3 48
0 54
5 62
3 70
2 8
04
95
0 C
NTR
L 22
2 24
7 28
5 32
1 34
9 39
4 42
9 43
3 45
4 52
1 DE
NA
150
165
199
232
253
275
298
310
370
439
~
IND
IN
227
287
352
395
489
520
58
4
657
835
839
CD
-..,J
lOB
312
311
376
420
485
519
563
605
726
813
NEW
B 17
3 21
0 27
3 27
0 31
4 34
9 34
9 36
1 39
3 NA
oo
n.
176
225
231
317
400
46
8
569
675
778
899
PNB
244
279
322
363
395
424
493
531
590
597
PN &
SB
18
2 21
2 24
3 27
1 32
0 36
3 40
1 42
1 44
6 5
88
SY
NDI
266
291
34
4
362
408
445
478
489
569
649
UCO
19
3 19
6 24
4 31
4 41
6 48
6 51
6 53
6 55
8 51
8 UN
ION
187
202
230
262
296
343
391
429
498
622
UNTD
25
7 25
5 28
8 31
0 34
2 35
2 3
88
40
8 46
4 52
5 V
IJY
A
135
154
202
246
300
328
352
378
445
553
Sou
rce:
C
ompi
led
from
IB
A P
ub
lica
tio
ns
188
The per br~nch advances of
from 1984 to 1993-94 is furnished in
the
Table
nationalised banks
6.27. The per
branch advances of Syndicate Bank as in the case of per branch
deposits too was above the average per branch advances of all
the nationalised banks from 1984 to 1989-90. It has shown
deceleration from 1990-91 to 1993-94. The shift in
policy of the banks consequent on the introduction
portfolio
of the
prudential norms relating to provisioning of assets etc. based
on the Narasimham Committee recommendations. has its
on the per branch advances during 1992-93 and 1993-94.
the ten year period under reference the highest per
advances of Rs.563 lakhs was recorded in 1992-93 by
bearing
During
branch
Indian
Bank and the lowest of Rs.73 lakhs was recorded in 1984 by
Allahabad Bank. The highest per branch advances of Rs.271
lakhs in the case of Syndicate Bank was recorded by it in the
year 1992-93 and the lowest per branch advances of Rs.178
lakhs reported by it during 1984.
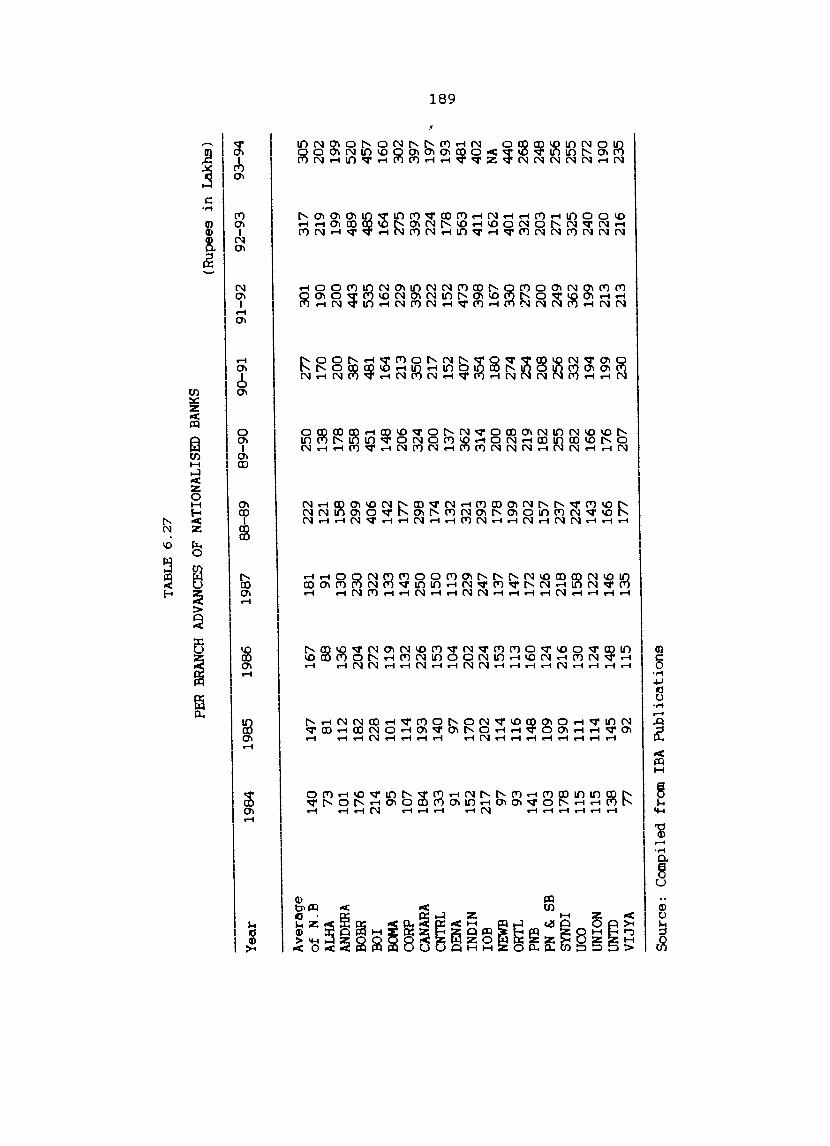
TA
BL
E 6
.27
PER
BRAN
CH A
DVAN
CES
OF N
ATI
ON
ALI
SED
BAN
KS
(Rup
ees
in L
akh
s)
Yea
r 19
84
1985
19
86
1987
8
8-8
9
89
-90
90
-91
91
-92
9
2-9
3
93
-94
Ave
rage
of
N
.B
140
147
167
181
222
250
277
301
317
305
ALHA
73
81
88
91
12
1 13
8 17
0 19
0 21
9 20
2 AN
DHHA
10
1 11
2 13
6 13
0 15
8 17
8 20
0 20
0 19
9 19
9 BO
HR
176
182
204
230
299
35
8
387
443
489
520
EOI
214
228
272
322
406
451
481
535
48
5
457
.BCN
A 95
10
1 11
9 13
3 14
2 14
8 16
4 16
2 16
4 16
0 CO
RP
107
114
132
143
177
206
213
229
275
302
CANA
RA
184
193
226
250
298
324
350
395
393
397
CNTR
L 13
3 14
0 15
3 15
0 17
4 20
0 21
7 22
2 22
4 19
7 "
.....
DENA
91
97
10
4 11
3 13
2 13
7 15
2 15
2 17
8 19
3 (X
l ID
IN
DIN
15
2 17
0 20
2 22
9 32
1 36
2 40
7 47
3 56
3 48
1 lO
B 21
7 20
2 22
4 24
7 29
3 31
4 3
54
39
8 41
1 40
2 NE
WB
97
114
153
137
178
200
180
167
162
NA
OR
n 93
11
6 11
3 14
7 19
9 22
8 27
4 3
30
40
1 44
0 PN
B 14
1 14
8 16
0 17
2 20
2 21
9 25
4 27
3 32
1 26
8 PN
& SB
10
3 10
9 12
4 12
6 15
7 18
2 20
8 20
0 20
3 24
8 SY
NDI
178
190
216
218
237
255
256
249
271
256
UCO
115
111
130
158
224
282
332
362
325
255
UNIO
N 11
5 11
4 12
4 12
2 14
3 16
6 19
4 19
9 24
0 27
2 UN
TO
138
145
148
146
166
176
199
213
220
190
VIJY
A
77
92
115
135
177
207
230
213
216
235
Sou
rce:
C
ompi
led
from
IB
A P
ub
lica
tio
ns
190
Table 6.28 furnishes the score in respect of the
performance of the sub-parameters of growth outlined in Tables
6.19 to 6.27. The 'growth performance' as indicated by column
eleven of Table 6.28 is a true indicator of the performance
achieved by the nationalised banks during the ten year period
from 1984 to 1993-94. As indicated in the Table, the growth
performance score of Syndicate bank is 43.91. Indian Bank
with a score of 68.91 is the best performing bank in 'growth'
and Bank of Maharashtra with a score of 29.88 is the lowest
performing bank in 'growth'. Syndicate Bank has the ninth
position among the nationalised banks in 'growth'performance
~~ is revealed by Table 6.28.
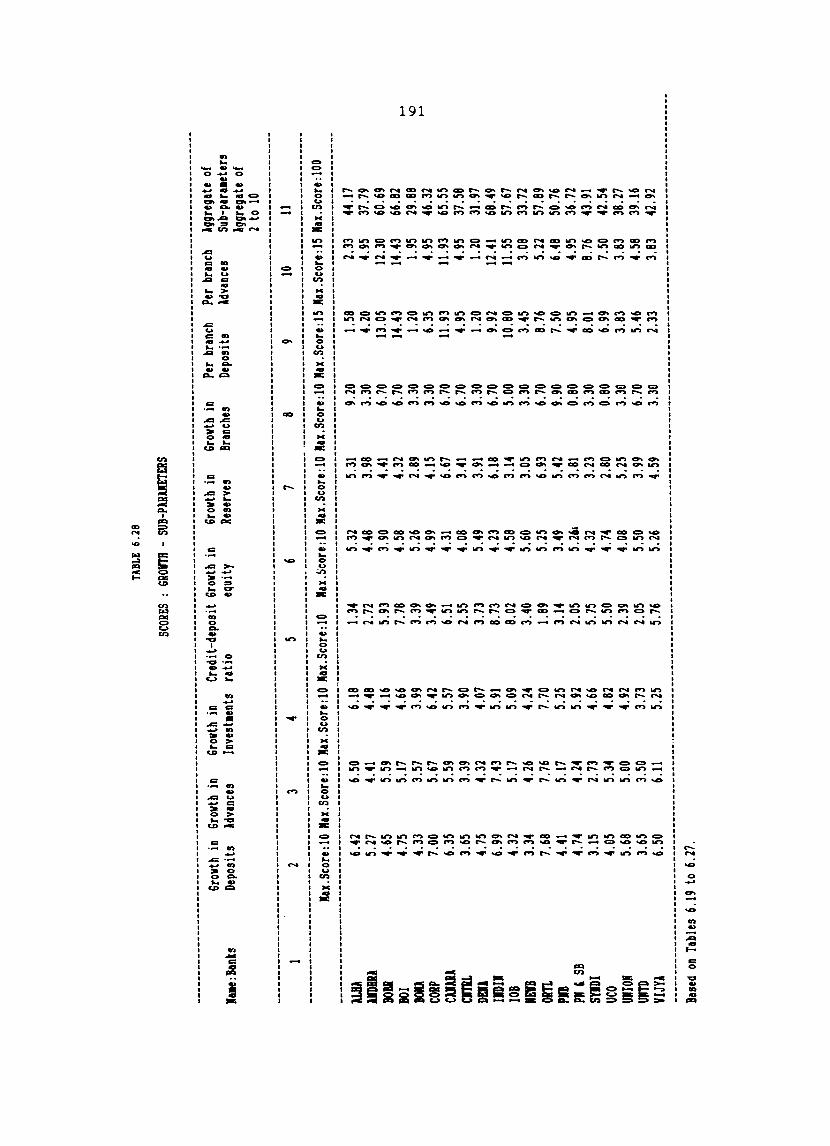
TABL
E 6.
28
SCOR
ES :
GRO
VTB
-SU
B-PlR
lIETE
RS
Grow
th in
Gr
owth
in
Grow
th in
Cre
dit-d
epos
it Gr
owth
in
Grow
th in
Grow
th in
Per
bran
ch
Per
bran
ch
Aggr
egate
of
lue:
Ban
ks
Dep
osits
Ad
vanc
es
Inve
stle
nts
ratio
eq
uity
Re
serv
es
Bran
ches
D
epos
its
Adva
nces
Sub-
para
lete
rs
Aggr
egate
of
2 to
10
----
----
----
----
----
----
----
----
----
----
----
----
----
-.---
----
----
--.--
----
----
----
----
----
----
----
----
----
----
----
----
----
----
----
----
----
----
----
----
----
-2
3 4
5 6
7 8
9 10
11
--
----
----
----
----
----
----
----
----
----
----
----
----
---.-
--.--
----
----
----
--_.
_---
----
----
----
----
..... -
----
----
----
----
----
----
----
----
----
----
----
----
----
-. K
ax.S
core
:l0 K
ax.S
core
:l0 K
ax.S
core
:l0 K
ax.S
core
:l0
Ku.~
core
:l0
KU
.Sco
re:l0
KU
.Sco
re:l0
KU
.Sco
re:1
5 K
U.S
core
:15
KU
.Sco
re:l0
0 • _
____
____
____
____
____
____
____
____
____
____
____
__ • _
____
__ n
. ___
____
__ . _
____
____
____
_ . _
____
____
____
____
____
____
____
____
____
____
____
____
____
____
____
____
__ . _
__ .
1W
6.4
2 6.5
0 6.1
8 1.
34
5.32
5.3
1 9.2
0 1.
58
2.33
44.17
lID
BRl
5.27
4.4
1 4.
48
2.72
4.48
3.9
8 3.3
0 4.
20
4.95
37.79
lO
BI
4.65
5.5
9 4.
16
5.93
3.9
0 4.4
1 6.7
0 13
.05
12.30
60
.69
101
4.75
5.
17
4. 66
7.7
8 4.
58
4.32
6.7
0 14
.43
14.43
66
.82
BOIl
4.33
3.
57
3.99
3.39
5.26
2.89
3.30
1. 20
1.
95
29.88
.....
ID
CORP
7.0
0 5.
67
6.42
3.49
4.99
4.15
3.3
0 6.3
5 4.
95
46.32
.....
cu
m
6.35
5.59
5.
57
6.51
4.31
6.67
6.70
11. 9
3 11
. 93
65.55
CJ
TiL
3.65
3.39
3.90
2.5
5 4.
08
3.41
6.70
4.95
4.9
5 37
.58
DEll
4.75
4.
32
4.07
3.
73
5.49
3.91
3.30
1. 20
1.
20
31.97
IID
IJ
6.99
7.43
5.9
1 8.
73
4.23
6.1
8 6.7
0 9.9
2 12
.41
68.49
lO
B 4.
32
5.17
5.
09
8.02
4.58
3.1
4 5.
00
10.80
11
.55
57.67
m
B
3.34
4.26
4.24
3.
40
5.60
3.0
5 3.3
0 3.
45
3.08
33.72
G
in
7.68
7.
76
7.70
1.
89
5.25
6.9
3 6.7
0 8.7
6 5.2
2 57
.89
PD
4.41
5.17
5.
25
3.14
3.49
5.42
9.90
7.50
6.4
8 50
.76
PI,
SB
4.74
4.24
5.
92
2.05
5.261
3.8
1 0.8
0 4.9
5 4.9
5 36
.72
SYlD
I 3.1
5 2.7
3 4.
66
5.75
4.32
3.23
3.30
8.0
1 8.7
6 43
.91
UCO
4.05
5.
34
4.82
5.5
0 4.
74
2.80
0.80
6.99
7.50
42.54
Ul
IOM
5.68
5.0
0 4.
92
2.39
4.08
5.25
3.3
0 3.
83
3.83
38.27
UJ
TD
3.65
3.50
3.73
2.0
5 5.5
0 3.9
9 6.7
0 5.4
6 4.
58
39.16
YIJ
YA
6.50
6.11
5.25
5.76
5.2
6 4.
59
3.30
2.33
3.83
42.92
--
----
----
----
----
----
----
----
----
----
----
---_
.. -.--
----
----
----
----
----
----
----
----
----
----
----
----
----
----
----
----
----
----
----
----
----
----
----
----
----
----
----
---
Base
d on
Tab
les 6
.19 t
o 6.
27.
192
Table 6.29 presents the Priority Performance Score
(PPS) of Syndicate Bank and the rest of the nationalised
banks. It is the aggregate of the scores in Tables 6.18 and
6.28. The score given in Table 6.29 indicate the extent of
performance of the nationalised banks in the field of 'social
banking' and 'growth' which are considered in the present
study as 'priority parameters'. Syndicate Bank has a Priority
Performance Score of 95.06. This score is the aggregate of
the performance scores in respect of 'social banking' and
'growth' as outlined in Tables 6.18 and 6.28. Based on the
score. Syndicate Bank has the fourteenth position among the
nationalised banks in its 'priority performance'. The highest
performing bank in 'Priority Performance' is Bank of India
with a Priority Performance Score of 134.27 and the least
performing bank based on this score is Corporation Bank with a
score of 79.26. Though Allahabad Bank was the highest
performing bank in 'social banking' it has come down heavily
in respect of 'growth'. But Bank of India with its
comparatively better performance score in social banking
with its highest performance score in 'growth' could secure
the maximum score on their aggregation. to attain the highest
performance position in 'priority performance'. (See Fig.6.2.
in Appendix Ill)
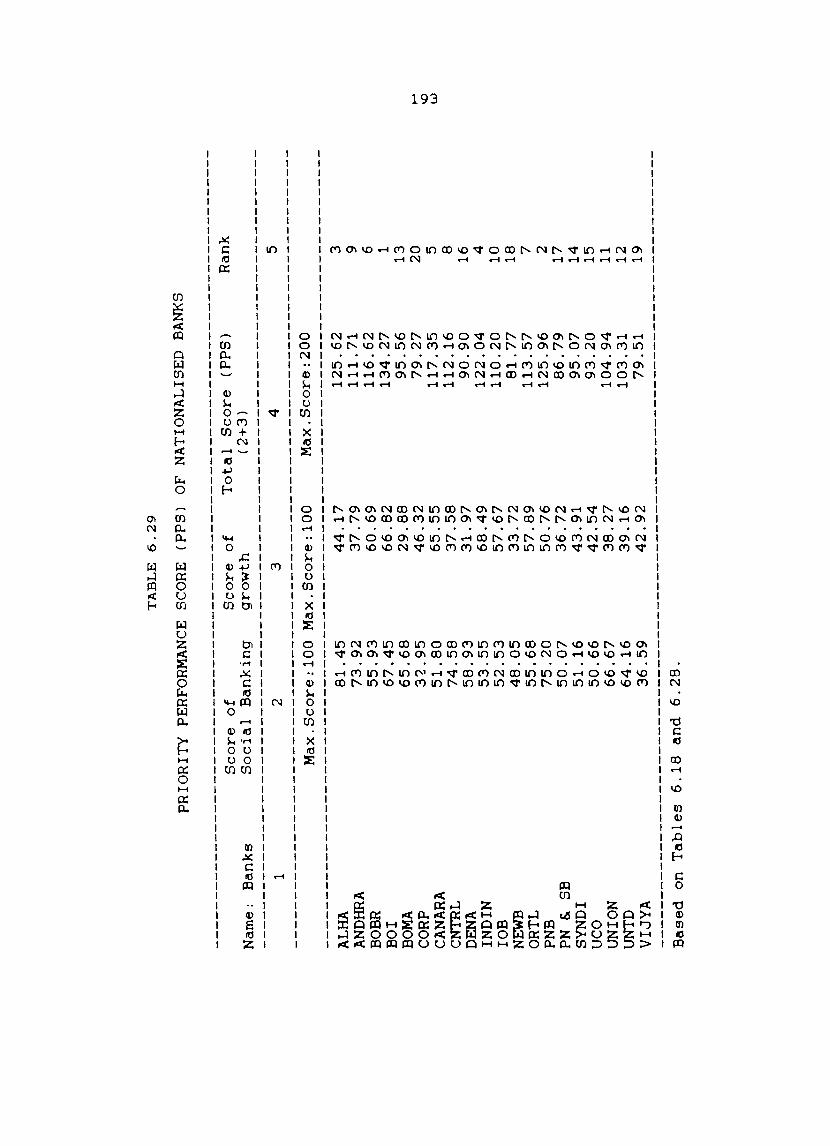
TA
BL
E
6.2
9
PR
IOR
ITY
PE
RFO
RM
AN
CE
SCO
RE
(P
PS
) O
F N
AT
ION
AL
ISE
D
BA
NK
S
Nam
e:
Ban
ks
ALH
A
AN
DH
RA
BO
BR
B
OI
BOM
A
CO
RP
CA
NA
RA
C
NT
RL
D
ENA
IN
DIN
lO
B
NEW
B
OR
TL
PN
B
PN
& S
B
SYN
DI
UC
O
UN
ION
U
NT
D
VIJ
YA
1
Sco
re
of
So
cia
l B
an
kin
g
2
Sco
re
of
gro
wth
3
Max
.Sco
re:1
00
M
ax
.Sco
re:1
00
81
.45
7
3.9
2
55
.93
6
7.4
5
65
.68
3
'2.9
5
51
.80
7
4.5
8
58
.93
5
3.5
5
52
.53
4
8.0
5
55
.68
7
5.2
0
50
.07
5
1.1
6
50
.66
6
6.6
7
64
.16
3
6.5
9
44
.17
3
7.7
9
60
.69
6
6.8
2
29
.88
4
6.3
2
65
.55
3
7.5
8
31
.97
6
8.4
9
57
.67
3
3.7
2
57
.89
5
0.7
6
36
.72
4
3.9
1
42
.54
3
8.2
7
39
.16
4
2.9
2
Base
d
on
T
ab
les
6.1
8
an
d
6.2
8.
To
tal
Sco
re
(PP
S)
(2+
3) 4
Max
.Sco
re:2
00
12
5.6
2
11
1.7
1
11
6.6
2
13
4.2
7
95
.56
7
9.2
7
11
7.3
5
11
2.1
6
90
.90
1
22
.04
1
10
.20
8
1.7
7
11
3.5
7
12
5.9
6
86
.79
9
5.0
7
93
.20
1
04
.94
1
03
.31
7
9.5
1
Ran
k
5 3 9 6 1 1
3
20
5 8
16
4 1
0
18
7 2
17
1
4
15
1
1
12
1
9
I-'
ID
W
194
6.3. Efficiency Performance (EPl
The Efficiency Performance of Syndicate Bank and ,
other nationalised banks is assessed in the present study by
incorporating 'productivity' and 'customer service' as the
basic parameters and evaluating their performance by assigning
scores to these parameters. The Efficiency Performance Score
(EPS) implies the extent of efficiency of the banks in
relation to their productivity and customer service. In fact
the 'Health Performance' as well as 'Priority Performance' of
the banks is the result of its 'Efficiency Performance'. The
extent of capital adequacy ratio attained. the maintenance of
quality assets. attainment of high pr~fitability. best
performance in social banking and the highest growth in the
relevant growth factors are the result of the extent of
performance in the 'productivity' of the banks. This is
dependent on the extent of efficient customer service imparted
by the banks.
6.3.1. Productivity
The productivity performance of Syndicate Bank and
other nationalised banks is assessed on the basis of six
sub-parameters which are outlined in Tables 6.30 to 6.36.
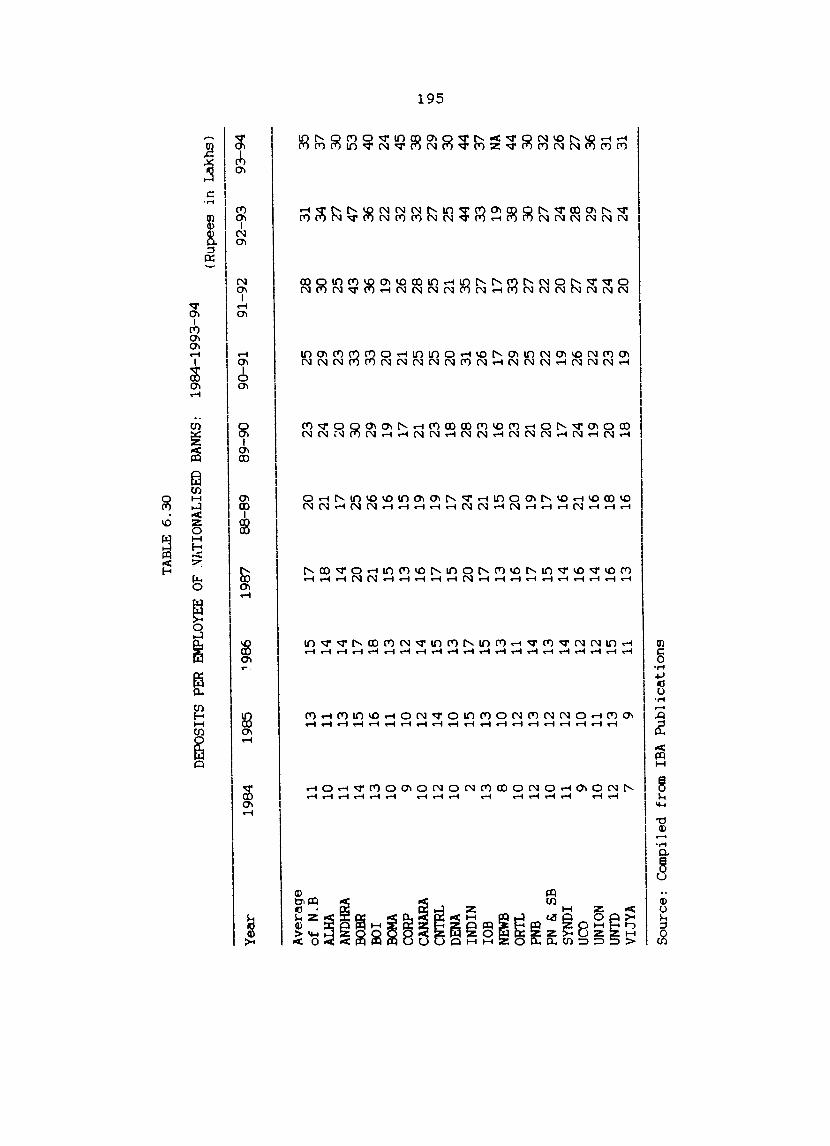
TA
BL
E 6
.30
DEP
OSI
TS P
ER E
MPL
OYEE
OF
:"11I
TION
ALIS
ED B
ANKS
: 19
84-1
993-
94
(Rup
ees
in L
akh
s)
Yea
r 19
84
1985
'9
86
19
87
88
-89
8
9-9
0
90-9
1 91
-92
92-9
3 93
-94
Ave
rage
of
N.B
11
13
15
17
20
23
25
28
31
3
5
ALH
A 1
0
11
14
18
21
24
29
30
34
37
AN
DHRA
11
13
14
14
17
20
23
25
27
3
0
BOBR
14
15
17
20
25
3
0
33
43
47
53
BO
I 13
16
18
21
26
29
3
3
36
36
40
BOM
A 1
0
11
13
15
16
19
20
19
22
24
CORP
9
10
12
13
15
17
21
26
32
45
CAN
ARA
1
0
12
14
16
19
21
25
28
32
38
f-
'
CNTR
L 12
14
15
17
19
23
25
25
27
29
1
0
DENA
10
10
13
15
17
18
20
21
25
3
0
U1
IND
IN
2 15
17
20
24
28
31
3
5
44
4
4
lOB
13
13
15
17
21
23
26
27
33
37
NE
WB
8 1
0
13
13
15
16
17
17
19
NA
ORT!
. 10
12
11
16
20
23
29
3
3
38
44
PN
B 12
13
14
17
19
21
25
27
3
0
30
PN
& SB
1
0
12
13
15
17
20
22
22
27
32
SYND
I 11
12
14
14
16
17
19
20
24
26
UC
O 9
10
12
16
21
24
26
27
28
27
UN
ION
10
11
12
14
16
19
22
24
29
36
U
NTO
12
13
15
16
18
20
23
24
27
31
V
IJYA
7
9 11
13
16
18
19
20
24
31
Sou
rce:
C
ompi
led
from
IB
A
Pu
bli
cati
on
s
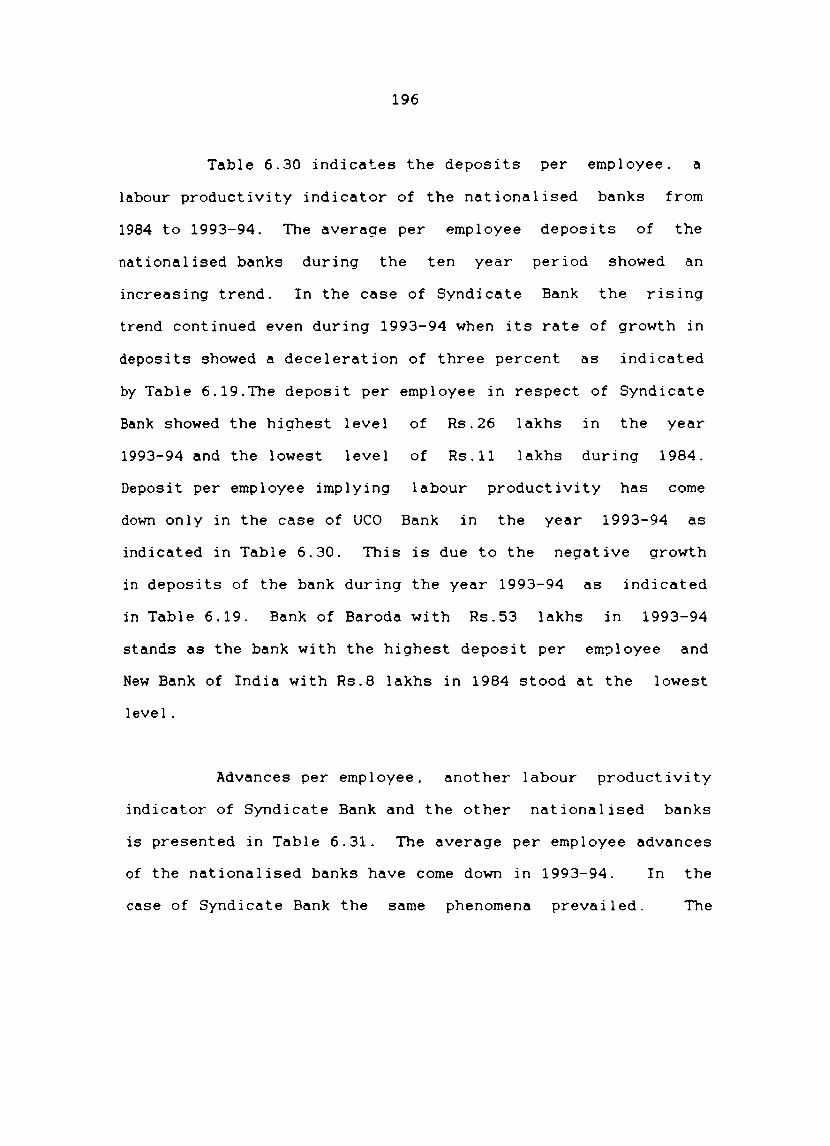
196
Table 6.30 indicates the deposits per employee. a
labour productivity indicator of the nationalised banks from
1984 to 1993-94. The average per employee deposits of the
nationalised banks during the ten year period showed an
increasing trend. In the case of Syndicate Bank the rising
trend continued even during 1993-94 when its rate of growth in
deposits showed a deceleration of three percent as indicated
by Table 6.19.The deposit per employee in respect of Syndicate
Bank showed the highest level of Rs.26 lakhs in the year
1993-94 and the lowest level of Rs.11 lakhs during 1984.
Deposit per employee implying labour productivity has come
down only in the case of UCO Bank in the year 1993-94 as
indicated in Table 6.30. This is due to the negative growth
in deposits of the bank during the year 1993-94 as indicated
in Table 6.19. Bank of Baroda with Rs.53 lakhs in 1993-94
stands as the bank with the highest deposit per em?loyee and
New Bank of India with Rs.8 lakhs in 1984 stood at the lowest
level.
Advances per employee. another labour productivity
indicator of Syndicate Bank and the other nationalised banks
is presented in Table 6.31. The average per employee advances
of the nationalised banks have come down in 1993-94. In the
case of Syndicate Bank the same phenomena prevailed. The
TAB
LE
6.3
1
ADVA
NCES
PER
EM
PLOY
EE O
F NA
TION
ALIS
ED B
ANKS
: 1
98
4-1
99
3-9
4
(Rup
ees
in L
akh
s)
Yea
r 19
84
1985
19
86
1987
8
8-8
9
89
-90
9
0-9
1
91
-92
9
2-9
3
93
-94
Ave
rage
of
N.B
7
7 8
9 11
1
3
14
16
17
16
AL
HA
5 6
6 9
10
11
14
15
17
16
ANDH
RA
7 7
8 8
9 1
0
12
12
12
12
BOBR
8
9 9
11
15
1
8
20
23
26
29
BO
I 8
9 11
1
3
17
19
21
2
3
22
20
:soM
A
6 6
7 8
8 10
11
1
0
11
10
CORP
6
6 6
7 9
10
10
11
14
16
CANA
RA
7 8
9 1
0
12
13
14
16
15
16
.....
CN
TRL
7 8
8 8
9 12
1
3
13
1
3
11
ID
-.J
DENA
6
6 7
7 9
9 10
10
12
1
3
IND
IN
8 9
10
11
16
20
22
25
30
25
lO
B 9
8 9
10
12
14
1
6
18
1
8
18
NE
WB
4 5
7 7
8 9
9 1
8 NA
O
Rn.
5
6 5
7 10
11
14
16
20
22
PN
B 7
7 7
8 1
0
11
13
1
4
17
14
PN &
SB
6 6
7 -.
9 10
11
11
12
1
3
/
SYND
I 7
8 9
El 9
10
10
10
12
10
UC
O 5
6 7
8 11
1
4
17
18
16
13
UN
ION
6 6
7 7
8 9
11
11
14
16
UNTD
6
7 7
7 9
10
1
2
12
13
11
V
IJYA
4
5 6
7 10
11
12
11
12
1
3
Sou
rce:
C
ompi
led
from
IB
A P
ubli
cati
ons
198
highest advances per employee of Rs.11 lakhs in the case of
Syndicate Bank was recorded during 1992-93 and the lowest
level of Rs.7 lakhs was recorded by it during 1984. Among the
nationalised banks. the highest advances per employee is
recorded by Bank of Baroda in 1993-94. It is Rs.29 lakhs.
The lowest per employee advances was Rs.4 lakhs reported by
New Bank of India and Vijaya Bank during 1984.
The income per employee of Syndicate Bank and otner
nationalised banks as an indicator of labour productivity is
shown in Table 6.32. The average per employee income of the
nationalised banks in toto indicate an increasing trend. The
highest per employee income of Rs.2.94 lakhs in respect of
Syndicate Bank was recorded by it in the year 1993-94 and the
lowest of Rs.1.05 lakhs was reported in 1984. Among all the
nationalised banks. the highest per employee income of Rs.6.99
lakhs was recorded by Bank of Baroda in 1993-94 and the lowest
of Rs.O.82 lakhs was recorded by New Bank of India in 1984.
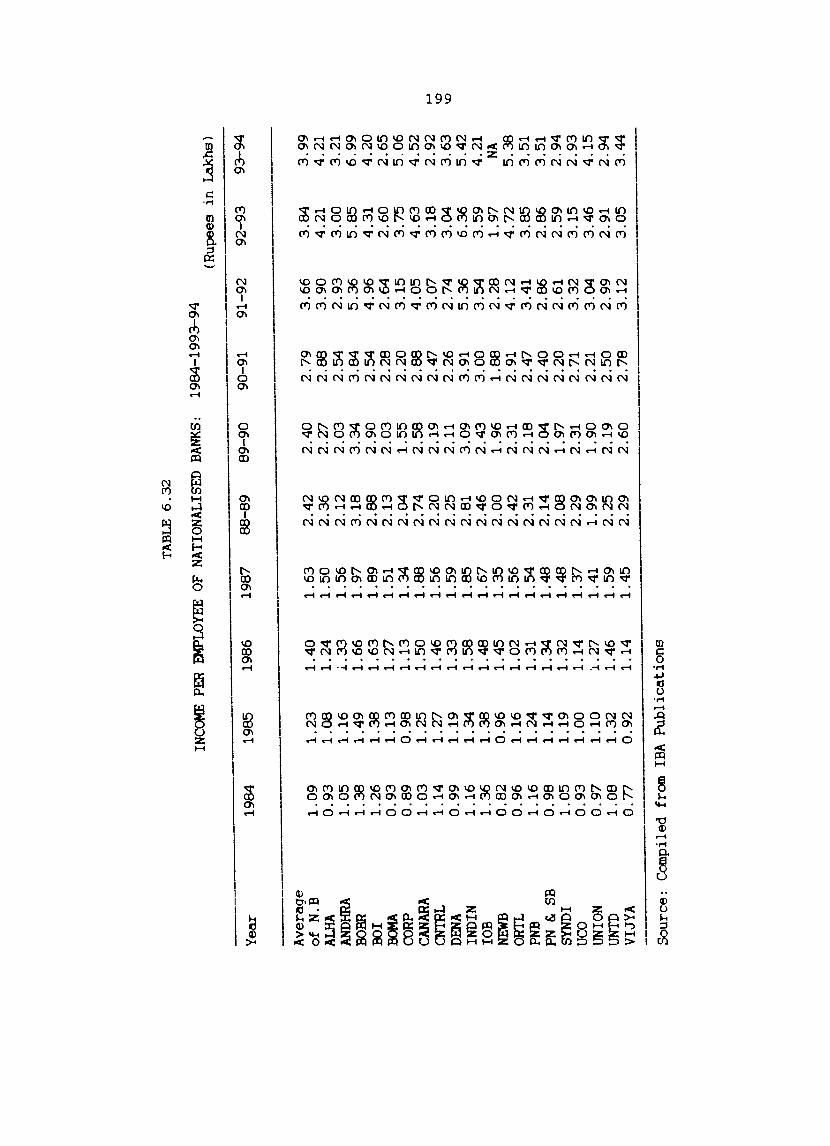
TA
BL
E 6
.32
INCO
ME
PER
EMPL
OYEE
OF
NA
TIO
NA
LISE
D B
ANKS
: 19
84-1
993-
94
(Rup
ees
in L
dkhs
) ----
Yea
r 19
84
1985
19
86
1987
8
8-8
9
89
-90
90
-91
91-9
2 92
-93
93-9
4
Ave
rage
of
N.B
1
.09
1
.23
1
.40
1
.63
2
.42
2
.40
2
.79
3
.66
3
.84
3
.99
A
LHA
0
.93
1
.08
1
.24
1
.50
2
.36
2
.27
2
.88
3
.90
4
.21
4.
21
AHDH
RA
1.0
5
1.1
6
.i.3
3
1.5
6
2.1
2
2.0
3
2.5
4
2.9
3
3.0
0
3.2
1
BOBR
1
.38
1
.49
1
.66
1
.97
3
.18
3
.34
3
.84
5
.36
5
.85
6
.99
00
1 1
.26
1
.38
1
.63
1
.89
2
.88
2
.90
2
.54
4
.96
4
.31
4
.20
13
0MA
0.9
3
1.1
3
1.2
7
1.5
1
2.1
3
2.0
3
2.2
8
2.6
4
2.6
0
2.6
5
CORP
0
.89
0
.98
1
.13
1
.34
2
.04
1
.55
2
.20
3
.15
3
.75
5
.06
CA
NARA
1
.03
1
.25
1
.50
1
.88
2
.74
2
.58
2
.88
4
.05
4
.63
4
.52
C
N'ff
iL
1.1
4
1.2
7
1.4
6
1.5
6
2.2
0
2.1
9
2.4
7
3.0
7
3.1
8
2.9
2
~
DEN
A 0
.99
1
.19
1
.33
1
.59
2
.25
2
.11
2
.26
2
.74
3
.04
3
.63
ID
ID
IND
IN
1.1
6
1.3
4
1.5
8
1.8
5
2.8
1
3.0
9
3.9
1
5.3
6
6.3
6
5.4
2
lOB
1.3
6
1.3
8
1.4
8
1.6
7
2.4
6
2.4
3
3.0
0
3.5
4
3.5
9
4.2
1
NEW
B 0
.82
0
.96
1
.45
1
.35
2
.00
1
.96
1
.88
2
.28
1
.97
NA
OR
TL
0.9
6
1.1
6
1.0
2
1.5
6
2.4
2
2.3
1
2.9
1
4.1
2
4.7
2
5.3
8
PNB
1.1
6
1.2
4
1.3
1
1.5
4
2.3
1
2.1
8
2.4
7
3.4
1
3.8
5
3.5
1
PN &
SB
0.9
8
1.1
4
1.3
4
1.4
8
2.1
4
2.0
4
2.4
0
2.8
6
2.8
6
3.5
1
SYND
I 1
.05
1
.19
1
.32
1
.48
2
.08
1
.97
2
.20
2
.61
2
.59
2
.94
UC
O 0
.93
1
.00
1
.14
1
.37
2
.29
2
.31
2
.71
3
.32
3
.15
2
.93
UN
ION
0.9
7
1.1
0
J.,2
7 1
.41
1
.99
1
.90
2.
21
3.0
4
3.4
6
4.1
5
UNTO
1
.08
1
.32
1
.46
1
.59
2
.25
2
.19
2
.50
2
.99
2
.91
2
.94
V
IJYA
0
.77
0
.92
1
.14
1
.45
2
.29
2
.60
2
.78
3
.12
3
.05
3
.44
Sou
rce:
C
ompi
led
from
IB
A P
ub
lica
tio
ns
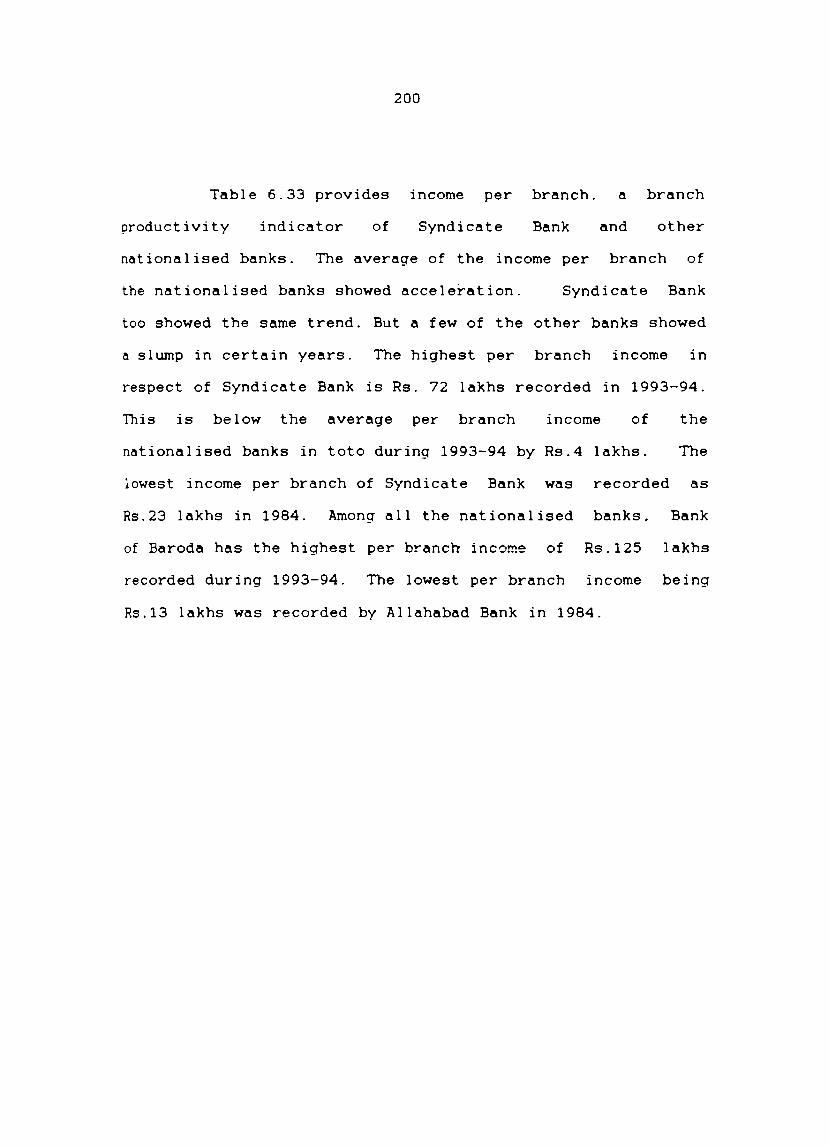
Table 6.33 provides
productivity indicator of
200
income per branch. a branch
Syndicate Bank and other
nationalised banks. The average of the income per branch of
the nationalised banks showed acceleration. Syndicate Bank
too showed the same trend. But a few of the other banks showed
a slump in certain years. The highest per branch income in
respect of Syndicate Bank is Rs. 72 lakhs recorded in 1993-94.
This is below the average per branch income of the
nationalised banks in toto during 1993-94 by Rs.4 lakhs. The
lowest income per branch of Syndicate Bank was recorded as
Rs.23 lakhs in 1984. Among all the nationalised banks. Bank
of Baroda has the highest per branch income of Rs.125 lakhs
recorded during 1993-94. The lowest per branch income being
Rs.13 lakhs was recorded by Allahabad Bank in 1984.
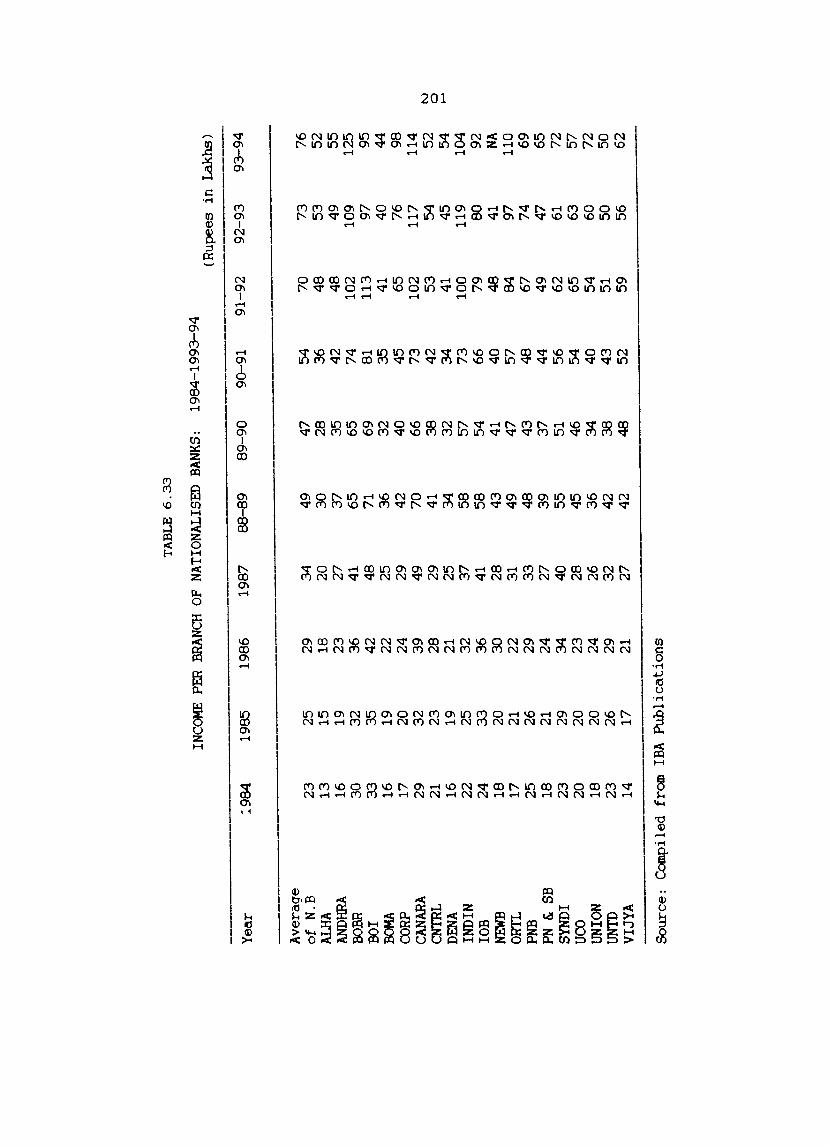
TA
BL
E 6
.33
INCO
ME
PER
BRAN
CH O
F N
ATI
ON
ALI
SED
BAN
KS:
1984
-199
3-94
<R
upee
s in
La
kh
s)
Yea
r :9
84
19
85
1986
19
87
88-8
9 89
-90
90-9
1 91
-92
92-9
3 93
-94
Ave
rage
of
N.B
23
25
29
3
4
49
47
54
70
73
76
AL
HA
13
15
18
20
30
28
36
48
53
52
AN
DHRA
16
19
23
27
37
35
42
48
49
55
oo
BH
30
32
36
41
65
65
74
102
109
125
001
33
35
42
48
71
69
81
11
3 97
95
BO
MA
16
19
22
25
36
32
35
41
40
44
CORP
17
20
24
29
42
40
45
65
76
98
CA
NARA
29
32
39
49
70
66
73
10
2 11
7 11
4 CN
TRL
21
23
28
29
41
38
42
53
5
4
52
N
0 DE
NA
16
19
21
25
34
32
34
41
45
54
I-
'
IND
IN
22
25
32
37
58
57
73
100
119
104
lOB
24
33
36
41
58
54
66
79
8
0
92
NEW
B 18
20
3
0
28
43
41
40
48
41
NA
OR
TL
17
21
22
31
49
47
57
84
97
110
PNB
25
26
29
33
48
43
4
8
67
74
69
PN &
SB
18
21
24
27
39
37
44
49
47
65
SYND
I 23
29
34
40
55
51
56
62
61
72
UC
O 20
20
23
28
45
46
5
4
65
63
57
UNIO
N 18
20
24
26
36
34
40
54
60
72
UN
TD
23
26
29
32
42
38
43
51
50
50
VIJY
A
14
17
21
27
42
48
52
59
56
62
Sou
rce:
C
ompi
led
from
IB
A P
ub
lica
tio
ns
202
Table 6.34 indicates the spread per branch. an
indicator of branch productivity of the
The average of all the nationalised
nationalised banks.
banks showed an
acceleration during the ten year period of the present study.
except during 1992-93. The new provisioning of assets led to
a heavy fall in the spread of many of the banks. This 1S
clearly reflected in Table 6.8. The highest spread per branch
of Rs.19 lakhs in respect of Syndicate Bank was recorded by it
in 1993-94. Its lowest spread per branch was Rs.7 lakhs
recorded in 1984. Among the nationalised banks. the highest
spread per branch was Rs.34 lakhs. recorded by Oriental Bank
of ComT.c~~e in 1993-94 followed by Bank of Baroda which
recorded Rs.33 lakhs in 1993-94. The lowest spread per branch
of Rs.4 lakhs was recorded by Andhra Bank. Allahabad Bank and
Bank of Maharashtra in 1984.
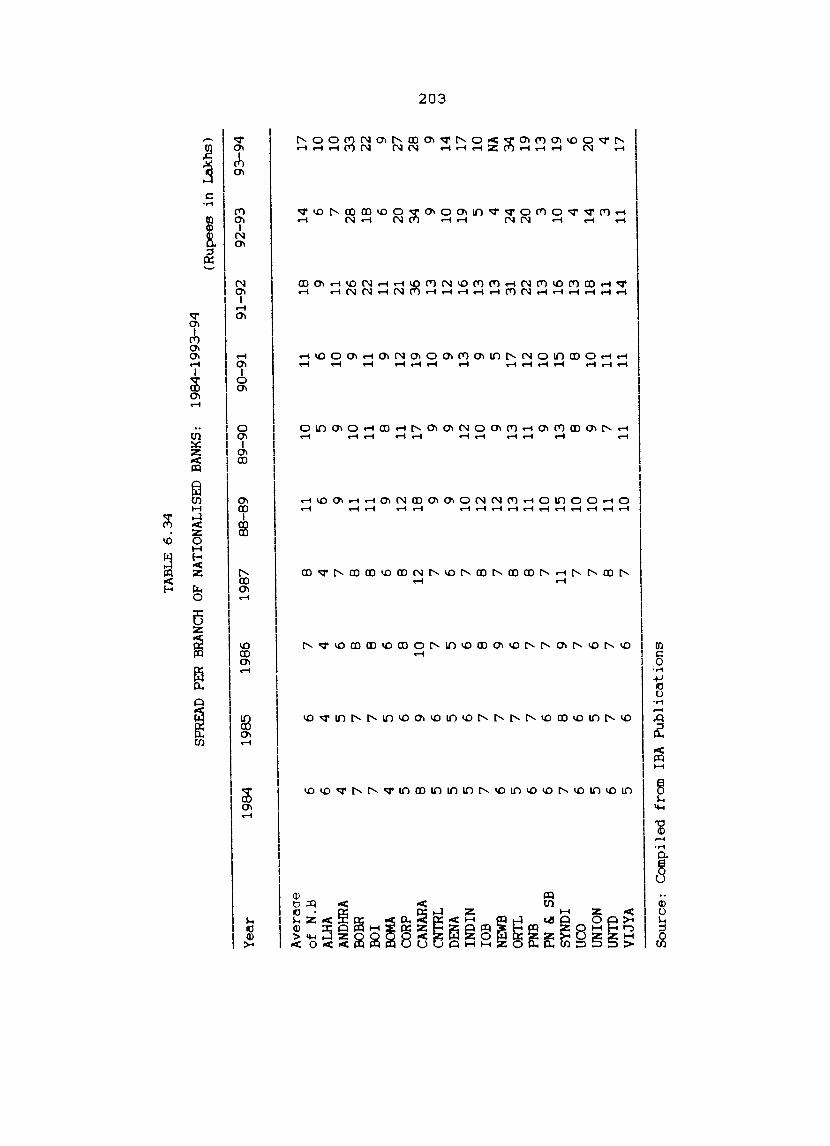
TA
BL
E 6
.34
SPRE
AD P
ER
BRAN
CH O
F N
ATI
ON
ALI
SED
BAN
KS:
19
84
-19
93
-94
(R
upee
s in
La
kh
s)
Yea
r 19
84
1985
19
86
1987
8
8-8
9
89
-90
90
-91
91
-92
9
2-9
3
93
-94
Ave
racr
e o
f N
.B
6 6
7 8
11
10
11
18
14
17
ALHA
6
4 4
4 6
5 6
9 6
10
ANDH
RA
4 5
6 7
9 9
10
11
7 10
O
OBR
7
7 8
8 11
10
9
26
28
33
00
1 7
7 8
8 11
11
11
22
18
22
BO
MA
4 5
6 6
9 8
9 11
6
9 CO
RP
5 6
8 8
12
11
12
21
20
27
CANA
RA
8 9
10
12
18
17
19
36
34
28
CN
TRL
5 6
7 7
9 9
10
13
9 9
to
0 DE
NA
5 5
5 6
9 9
9 12
10
14
w
IN
DIN
5
6 6
7 10
12
13
16
19
17
lO
B
7 7
8 8
12
10
9 13
5
10
NEW
B 6
7 9
7 12
9
5 13
4
NA
ORTL
5
7 6
8 13
13
17
31
24
34
PN
B 6
7 7
8 11
11
12
22
20
19
PN
& SB
6
6 7
7 10
9
10
13
3
13
SYN
DI
7 8
9 11
15
13
15
16
10
19
UC
O 6
6 7
7 10
8
8 13
4
6 UN
ION
5 5
6 7
10
9 10
18
14
20
U
NTO
6
7 7
8 11
7
11
11
3 4
VIJ
YA
5
6 6
7 10
11
11
14
11
17
--
----
----
Sou
rce:
C
ompi
led
from
IB
A
Pu
bli
cati
on
s
204
Table 6.35 indicates spread per employee. an
indicator of labour productivity of Syndicate Bank and other
nationalised banks. The average spread per employee of the
nationalised banks showed a slump during 1992-93. Syndicate
Bank has its highest spread per employee of Rs.0.77 lakhs
during 1993-94. the lowest being Rs.0.30 lakhs recorded by the
bank in 1984. Among the nationalised banks. the highest
spread per branch of Rs.1.86 lakhs is recorded by Bank of
Baroda in 1993-94. and the lowest of Rs.0.18 lakhs recorded by
United Bank of India in 1992-93.
Table 6.36 reveal the score secured by the
sub-parameters of productivity. viz .. deposits per employee.
advances per employee. income per employee. income per branch.
spread per branch and spread per employee outlined in Tables
6.30 to 6.35 based on their performance. Column eight under
Table 6.36 indicates the aggrbgate of the scores for the
various sub-parameters that collectively contribute towards
the 'productivity performance' of the banks. Syndicate Bank
with a score of 43.96 has the eighth position in 'productivity
performance' among the nationalised banks. Bank of Baroda has
the highest productivity performance with a score of 85.09 and
Bank of Maharashtra with a score of 20.64 has the least
'productivity performance' among all the nationalised banks.
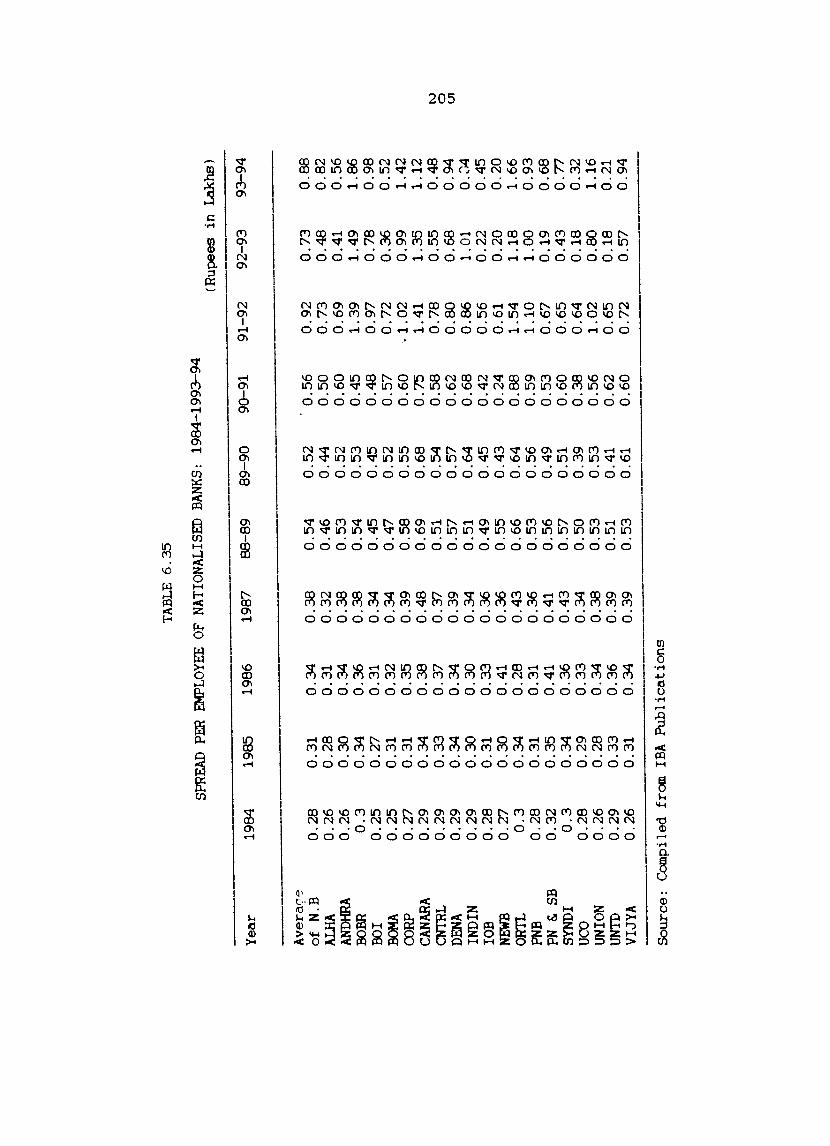
TA
BLE
6
.35
SPRE
AD
PER
EM
PLO
YEE
OF
NA
TIO
NA
LISE
D
BAN
KS:
19
84-1
993-
94
(Rup
ees
in L
akh
s)
Yea
r 19
84
1985
19
86
1987
8
8-8
9
89
-90
90
-91
91
-92
9
2-9
3
93-9
4
Ave
raqf
? o
f N
.B
0.2
8
0.3
1
0.3
4
0.3
8
0.5
4
0.5
2
0.5
6
0.9
2
0.7
3
0.8
8
ALHA
0
.26
0
.28
0
.31
0
.32
0
.46
0
.44
0
.50
0
.73
0
.48
0
.82
AN
DHRA
0
.26
0
.30
0
.34
0
.38
0
.53
0
.52
0
.60
0
.69
0
.41
0
.56
BO
BR
0.3
0
.34
0
.36
0
.38
0
.54
0
.53
0
.45
1
.39
1
.49
1
.86
00
1 0
.25
0
.27
0
.31
0
.34
0
.45
0
.45
0
.48
0
.97
0
.78
0
.98
BO
MA
0.2
5
0.3
1
0.3
2
0.3
4
0.4
7
0.5
2
0.5
7
0.7
2
0.3
6
0.5
2
CO
RP
0.2
7
0.3
1
0.3
5
0.3
9
0.5
8
0.5
5
0.6
0
.1.0
2
0.9
9
1.4
2
CANA
RA
0.2
9
0.3
4
0.3
8
0.4
8
0.6
9
0.6
8
0.7
5
1.4
1
1.3
5
1.1
2
CN
TRL
0.2
9
0.3
3
0.3
7
0.3
7
0.5
1
0.5
4
0.5
8
0.7
8
0.5
5
0.4
8
tv
DENA
0
.29
0
.34
0
.34
0
.39
0
.57
0
.57
0
.62
0
.80
0
.68
0
.94
0 U
1 IN
DIN
0
.29
0
.30
0
.30
0
.34
0
.51
0
.64
0
.68
0
.86
1.
01
0.0
4
lOB
0
.28
0
.31
0
.33
0
.36
0
.49
0
.45
0
.42
0
.56
0
.22
0
.45
NE
WB
0.2
7
0.3
0
0.4
1
0.3
6
0.5
5
0.4
3
0.2
4
0.6
1
0.2
0
0.2
0
OIIT
L 0
.3
0.3
4
0.2
8
0.4
3
0.6
6
0.6
4
0.8
8
1.5
4
1.1
8
1.6
6
PNB
0.2
8
0.3
1
0.3
1
0.3
6
0.5
3
0.5
6
0.5
9
1.1
0
1.0
0
0.9
3
PN &
SB
0.3
2
0.3
5
0.4
1
0.4
1
0.5
6
0.4
9
0.5
3
0.6
7
0.1
9
0.6
8
SYN
DI
0.3
0
.34
0
.36
0
.43
0
.57
0
.51
0
.60
0
.65
0
.43
0
.77
UC
O 0
.28
0
.29
0
.33
0
.34
0
.50
0
.39
0
.38
0
.64
0
.18
0
.32
U
NIO
N
0.2
6
0.2
8
0.3
4
0.3
8
0.5
3
0.5
3
0.5
6
1.0
2
0.8
0
1.1
6
UN
TO
0.2
9
0.3
3
0.3
6
0.3
9
0.5
1
0.4
1
0.6
2
0.6
5
0.1
8
0.2
1
VIJ
YA
0
.26
0
.31
0
.34
0
.39
0
.53
0
.61
0
.60
0
.72
0
.57
0
.94
So
urc
e:
Com
pile
d fr
om
IBA
P
ub
licati
on
s
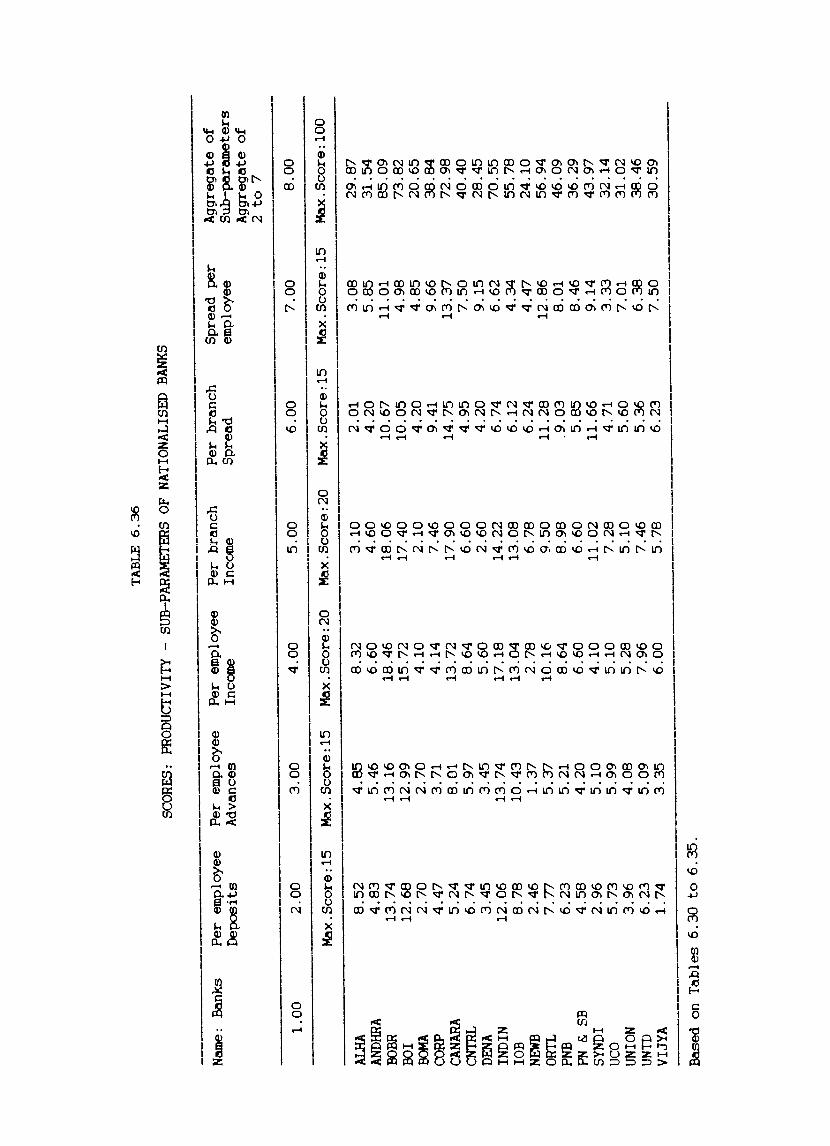
TA
BL
E 6
.36
SCO
RES
: PR
OD
UC
fIVIT
Y
-SU
B-PA
RAM
ETER
S O
F N
ATI
ON
ALI
SED
BA
NKS
----
----
---
----
----
-N
ame:
B
an
ks
Per
em
ploy
ee
Per
em
ploy
ee
Per
em
ploy
ee
Per
bra
nch
P
er b
ran
ch
Sp
read
per
Ag
gre
gat
e o
f D
epo
sits
A
dvan
ces
Inco
me
Inca
ne
Sp
read
em
ploy
ee
Su
b-p
aram
eter
s A
gg
reg
ate
of
2 to
7
1.0
0
2.0
0
3.0
0
4.0
0
5.0
0
6.0
0
7.0
0
8.0
0
Max
. Sco
re: 1
5 M
ax. S
core
: 15
Max
.Sco
re:2
0 M
ax.S
core
:20
Max
.Sco
re:1
5 M
ax. S
core
: 15
Max
. Sco
re: 1
00
ALH
A 8
.52
4
.85
8
.32
3
.10
2
.01
3
.08
2
9.8
7
ANDH
RA
4.8
3
5.4
6
6.6
0
4.6
0
4.2
0
5.8
5
31
.54
BO
BR
13
.74
1
3.1
6
18
.46
1
8.0
6
10
.67
1
1.0
1
85
.09
oo
I 1
2.6
8
12
.99
1
5.7
2
17
.40
1
0.0
5
4.9
8
73
.82
BO
MA
2.7
0
2.7
0
4.1
0
2.1
0
4.2
0
4.8
5
20
.65
CO
RP
4.4
7
3.7
1
4.1
4
7.4
6
9.4
1
9.6
6
38
.84
CA
NAHA
5
.24
8
.01
1
3.7
2
17
.90
1
4.7
5
13
.37
7
2.9
8
CNTR
L 6
.74
5
.97
8
.64
6
.60
4
.95
7
.50
4
0.4
0
DENA
3
.45
3
.45
5
.60
2
.60
4
.20
9
.15
2
8.4
5
IND
IN
12
.06
1
3.7
4
17
.18
1
4.2
2
6.7
4
6.6
2
70
.55
lO
B
8.7
8
10
.43
1
3.0
4
13
.08
6
.12
4
.34
5
5.7
8
NEW
B 2
.46
1
.37
2
.78
6
.78
6
.24
4
.47
2
4.1
0
OR
n
7.7
7
5.3
7
10
.16
9
.50
1
1.2
8
12
.86
5
6.9
4
PNB
6.2
3
5.2
1
8.6
4
8.9
8
.9.0
3
8.0
1
46
.09
PN
&
SB
4
.58
4
.20
6
.60
6
.60
5
.85
8
.46
3
6.2
9
SYN
DI
2.9
6
5.1
0
4.1
0
11
.02
1
1.6
6
9.1
4
43
.97
UC
O 5
.73
5
.99
5
.10
7
.28
4
.71
3
.33
3
2.1
4
UN
ION
3
.96
4
.08
5
.28
5
.10
5
.60
7
.01
3
1.0
2
UN
TI>
6.2
3
5.0
9
7.9
6
7.4
6
5.3
6
6.3
8
38
.46
V
IJY
A
1.7
4
3.3
5
6.0
0
5.7
8
6.2
3
7.5
0
30
.59
--
----
----
----
----
----
----
----
----
----
----
----
---
Bas
ed
on
Tab
les
6.3
0 t
o 6
.35
.
207
6.3.2. Customer Service:
Table 6.37 indicates the percentage of marks secured
by the nationalised banks for extending 'customer service'.
The interview schedule for collecting data on customer service
through survey consisted of eleven main
questions/sub-parameters.
The important findings of
parameter vise -
Marks are expressed in percentages.
the survey are furnished below.
(1) "Opening and closing of counters"
Maharashtra. Dena Bank. and Union Bank of India have
100 percent marks. being the highest and Indian
percent. being the lowest marks. Syndicate Bank has
86 percent marks.
Bank of
secured
Bank 84
secured
(2) 'Information and guidance to customers' - Dena Bank
and Bank of India have secured 90 percent marks being the
highest and Allahabad Bank 40 percent being the lowest marks.
Syndicate Bank has secured 70 percent marks.
3. 'Display of time norms and adherence there to'
Bank of Maharashtra secured 95 percent marks being the highest
and Andhra Bank. Dena Bank and Uco Bank 56 percent being the
lowest marks. Syndicate Bank has secured 77 percent marks.
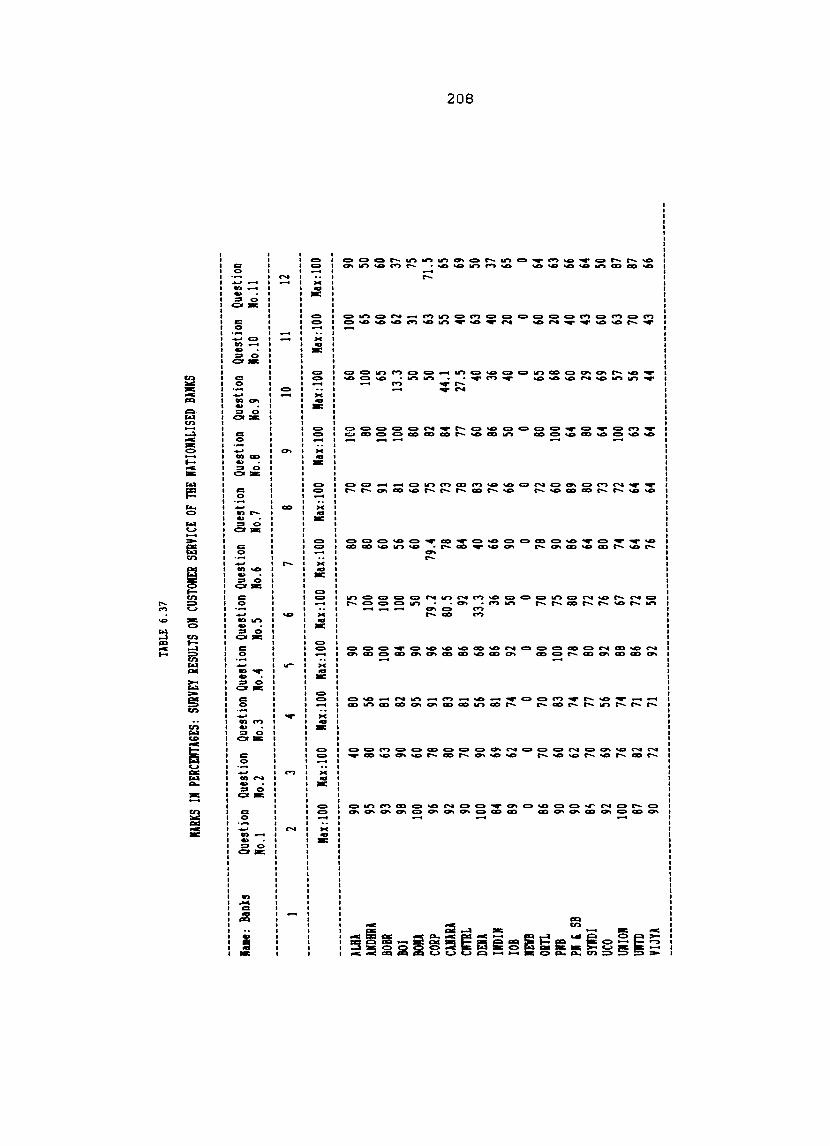
TABL
E 6.
37
KARK
S IN
PER
CENT
AGES
: SU
RVEY
RES
ULTS
ON
CUST
OKER
SER
VICE
OF
THE
IATI
OIAL
ISED
BANK
S
----
----
----
----
----
----
----
----
----
----
----
----
----
----
----
----
----
----
----
----
----
----
----
.----
----
-.---
-.---
----
----
----
--lu
e: B
anks
Q
uesti
on
Que
stion
Q
uesti
on Q
uesti
on Q
uesti
on Q
uesti
on
Que
stion
Q
uesti
on
Que
stion
Q
uesti
on
Que
stion
M
O.l
10.2
10
.3
10.4
M
o.5
Mo.6
No
.7 M
o.8
Mo.9
10
.10
No.11
--
----
.---.-
----
----
----
----
----
--.--
----
----
----
----
----
----
--.--
----
----
----
----
----
----
----
----
----
----
-.---
----
----
----
--2
3 4
~ 6
7 8
9 10
11
12
--
----
----
----
----
----
----
----
----
----
----
----
----
----
----
----
----
----
----
----
----
----
----
----
----
----
----
-.---
----
--.--
----
-Ki
ll: 10
0 Ki
ll: 10
0 Ka
x:l0
0 Ka
x:l0
0 Ka
x:l0
0 Ka
x:100
Ki
ll: 10
0 Ki
ll: 10
0 Ki
ll: 10
0 Ki
ll: 10
0 Ki
ll: 10
0 --
----
----
----
----
----
----
----
----
----
----
----
----
----
----
----
----
----
----
----
----
----
----
----
----
----
----
----
----
----
----
---
ALBA
90
40
80
90
75
80
70
10
0 60
10
0 90
UD
RRA
95
80
56
80
100
80
70
80
100
65
50
BOBR
93
63
81
10
0 10
0 60
91
10
0 65
60
60
DO
l 98
90
82
84
10
0 56
81
10
0 13
.3 62
37
BO
Il 10
0 60
95
90
50
60
60
80
50
31
75
CO
RP
96
78
91 96
79
.2
79.4
75
82
50
63
71
.5
CAJA
RA
92
80
83
86
80.5
78
73
84
44.1
55
65
mRL
90
70
81
86
92
84
78
77
27
.5 40
69
N
0
DElA
10
0 90
56
68
33
.3
40
83
60
40
63
50
(D
IIDIM
84
69
81
86
36
66
76
86
36
40
37
lO
B 89
62
74
92
50
90
66
50
40
20
65
IE
VB
0 0
0 0
0 0
0 0
0 0
0 OR
n 86
70
70
80
70
78
72
80
65
60
64
PI
B 90
60
83
10
0 75
90
60
10
0 68
20
63
PI
, S
B 90
62
74
78
80
86
89
64
60
40
66
SY
JDI
8~
70
77
80
72
64
80
80
29
43
64
UCO
92
69
56
92
76
80
73
64
69
60
50
UJIO
I 10
0 76
74
88
67
74
72
10
0 57
63
87
UI
TD
87
82
71 86
72
64
64
63
56
70
87
VI
JYA
90
72
71
92
50
76
64
64
44
43
66
----
----
----
----
----
----
----
----
----
----
----
----
----
----
----
----
----
----
----
----
----
----
----
----
----
----
----
----
----
----
----
----
----
--
209
4. 'Updating of pass book and statement of records'
Bank of Baroda and Punjab National Bank secured 100 percent
marks being the highest and Dena Bank 6S percent being the
lowest marks. Syndicate Bank has secured SO percent marks.
5. 'Settlement of claims of deceased depositors'
Andhra Bank, Bank of Baroda, and Bank of India secured 100
percent marks being the highest and Dena Bank 33.3 percent
being the lowest marks. Syndicate Bank has secured 72 percent
marks.
6. 'Display of information of facilities available'
Indian Overseas Bank and Punjab National Bank secured 90
percent marks being the highest and Dena Bank 40 percent being
the lowest marks. Syndicate Bank, secured 64 percent marks.
7. 'Collection of outward instruments' - Bank of Baroda
secured 91 percent marks being the highest and Bank of
Maharashtra and Punjab National Bank 60 percent being the
lowest marks. Syndicate Bank has secured SO percent marks.
S. 'Credit of outstation cheques upto Rs.2500/'
Allahabad Bank. Bank of Baroda. Bank of India. Punjab National
Bank and Union Bank of India sec~red 100 percent marks being
210
the highest and Indian Overseas Bank ~O percent being the
lowest marks. Syndicate Bank has secured 80 percent marks.
9. 'Disposal ot advance proposals relating
scale industries/priority sector advances' - Andhra
secured 100 percent marks being the highest marks.
Bank has secured 29 percent marks.
to small
Bank has
Syndicate
10. 'Grievance and redressal machinery' - Allahabad Bank
has secured 100 percent marks being the highest and Indian
Overseas Bank and Punjab National Bank 20 percent being the
lowest marks. Syndicate Bank has secured 43 percent marks.
11. 'Attitude and efficiency of staff' - Allahabad Bank
secured 90 percent marks being the highest and Bank of India
and Indian Bank 37 percent each being the lowest marks.
Syndicate Bank has secured 64 percent marks.
Table 6.38 brings to light the scores secured by the
nationalised banks for their performance in 'customer
service'. The percentage of ma~ks marked in Table 6.37 is the
basis for awarding the scores. Syndicate Bank has a score of
67.3 which gave it the fifteenth position in 'customer
service' among the nationalised banks. The highest
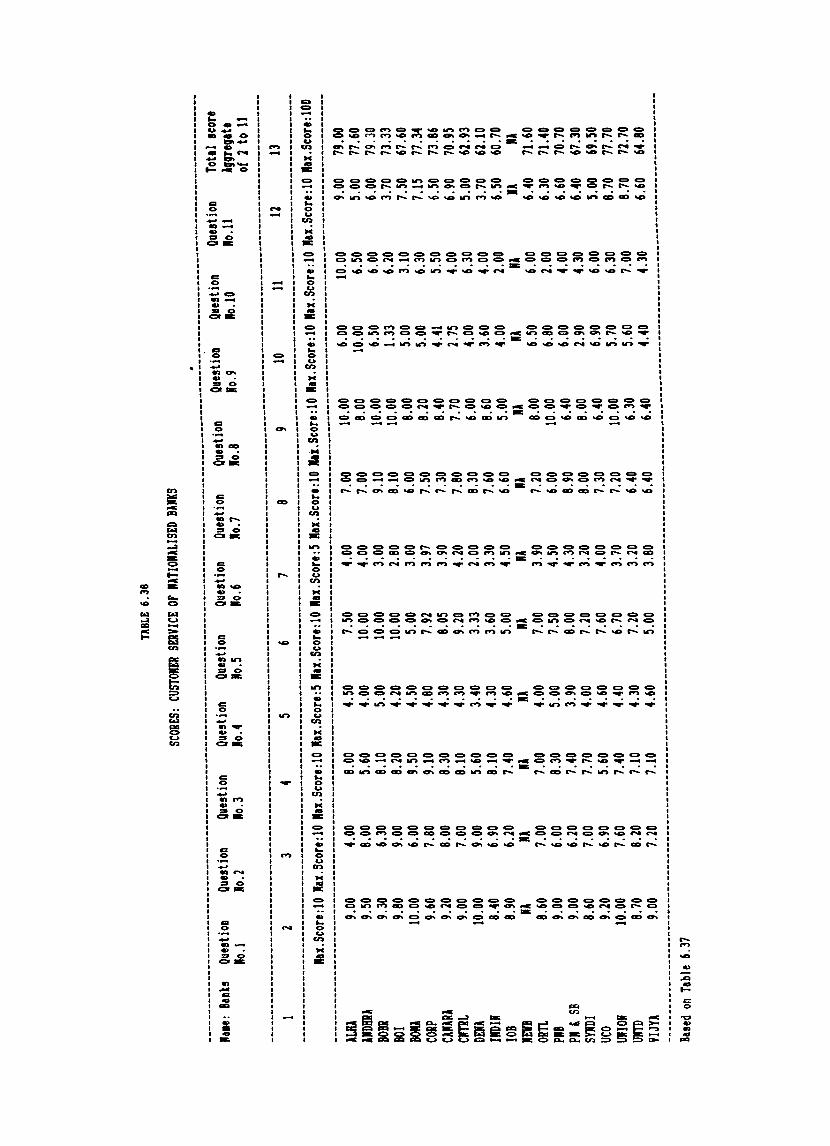
TABL
E 6.
38
SCOR
ES:
CUST
OIER
SER
VICE
OF
IATI
OIAL
ISED
BAlK
S .
----
----
----
----
----
----
----
----
----
----
----
----
----
----
----
----
----
----
----
----
----
----
----
----
----
----
----
----
----
----
----
----
----
----
----
----
----
----
----
----
----
----
-la
le:
Bank
s Qu
estio
D Qu
estio
n Qu
estio
n Qu
estio
n Qu
estio
n Qu
estio
n Qu
estio
n Qu
estio
n Qu
estio
D Qu
estio
n Qu
estio
D To
tal s
core
10.1
10.2
10
.3
10.4
10
.5
10.6
10
.7
10.8
10
.9
10.10
10
.11
199r
egate
of
2 to
11
----
----
----
----
----
----
----
----
----
----
----
----
----
----
----
----
----
----
----
----
----
----
----
----
----
----
----
----
----
----
----
----
----
----
----
----
----
----
----
----
----
----
-2
3 4
5 6
7 8
9 10
11
12
13
----
----
----
----
----
----
----
----
----
----
----
----
----
----
----
----
----
----
----
----
----
----
----
----
----
----
----
----
----
----
----
----
----
----
----
----
----
----
----
----
----
----
-Ra
x.Sco
re:1
0 Ra
x.Sco
re:1
0 Ra
x.Sco
re:1
0 Ra
x.Sc
ore:5
Rax
.Sco
re:1
0 Ra
x.Sc
ore:5
Rax
.Sco
r.:10
lai
.Sco
re:1
0 Ra
x.Sco
re:1
0 Ra
x.Sco
re:1
0 Ra
x.Sco
re:1
0 Ra
x.Sco
re:1
00
----
----
----
----
----
----
----
----
----
----
----
----
----
----
----
----
----
----
----
----
----
----
----
----
----
----
----
----
----
----
----
----
----
----
----
----
----
----
----
----
----
----
-10
0 9.0
0 4.0
0 8.0
0 4.5
0 7.5
0 4.0
0 7.0
0 10
.00
6.00
10.00
9.0
0 79
.00
IIDBR
I 9.5
0 8.
00
5.60
4.00
10.00
4.0
0 7.0
0 8.
00
10.00
6.5
0 5.0
0 77
.60
SOBR
9.3
0 6.3
0 8.1
0 5.0
0 10
.00
3.00
9.10
10.00
6.5
0 6.0
0 6.0
0 79
.30
BOl
9.80
9.00
8.20
4.20
10.00
2.8
0 8.1
0 10
.00
1.33
6.20
3.70
73.33
BOO
10.00
6.0
0 9.5
0 4.5
0 5.
00
3.00
6.00
8.00
5.0
0 3.1
0 7.5
0 67
.60
CORP
9.6
0 7.8
0 9.1
0 4.8
0 7.9
2 3.9
7 7.5
0 8.
20
5.00
6.30
7.15
77.34
ClIIR
l 9.2
0 8.0
0 8.3
0 4.3
0 8.0
5 3.9
0 7.3
0 8.
40
4.41
5.50
6.50
73.86
ClTR
L 9.0
0 7.0
0 8.1
0 4.3
0 9.2
0 4.2
0 7.8
0 7.7
0 2.7
5 4.0
0 6.9
0 70
.95
DEJl
10.00
9.0
0 5.6
0 3.4
0 3.3
3 2.0
0 8.3
0 6.0
0 4.0
0 6.3
0 5.
00
62.93
IIDII
8.40
6.90
8.10
4.30
3.60
3.30
7.60
8.60
3.60
4.00
3.7
0 62
.10
lOB
8.90
6.20
7.40
4.60
5.00
4.50
6.60
5.00
4.0
0 2.0
0 6.5
0 60
.70
mB
III
lA
lA
lA
lA
lA
lA
lA
lA
lA
11
11
ORn
8.60
7.00
7.00
4.00
7.00
3.90
7.20
8.00
6.50
6.00
6.40
71.60
PIB
9.00
6.00
8.30
5.00
7.50
4.50
6.00
10.00
6.8
0 2.0
0 6.3
0 71
.40
PI ,
SB
9.00
6.20
7.40
3.90
8.00
4.30
8.90
6.40
6.00
4.00
6.60
70.70
SrnI
8.6
0 7.0
0 7.7
0 4.0
0 7.2
0 3.2
0 8.0
0 8.0
0 2.9
0 4.3
0 6.4
0 67
.30
UCO
9.20
6.90
5.60
4.60
7.60
4.00
7.30
6.40
6.90
6.00
5.00
69
.50
ORlON
10
.00
7.60
7.40
4.40
6.70
3.70
7.20
10.00
5.7
0 6.3
0 8.
70
77.70
UITD
8.7
0 8.2
0 7.1
0 4.3
0 7.2
0 3.2
0 6.4
0 6.3
0 5.6
0 7.0
0 8.
70
72.70
VIJY
l 9.0
0 7.2
0 7.1
0 4.6
0 5.0
0 3.8
0 6.4
0 6.4
0 4.4
0 4.
30
6.60
64.80
----
----
----
----
----
----
----
----
----
----
----
----
----
----
----
----
----
----
----
----
----
----
----
----
----
----
----
----
----
----
----
----
----
----
----
----
----
----
----
----
----
----
-Ba
sed o
n Ta
ble 6
.37
212
performer in 'customer service' is Bank of Baroda with a score
of 79.3 followed by Allahabad Bank with a score of 79. Indian
Overseas Bank has the lowest score of 60.7 in customer
service. keeping aside New Bank of India which did not exist
during the period when the survey was conducted using the
schedule specially prepared for evaluating the performance ui
customer service of the nationalised banks.
Table 6.39 denotes the 'Efficiency Performance
Score' (EPS) of Syndicate Bank and other nationalised banks.
It is the aggregate of the scores in Table 6.36 and 6.38. The
scores presented in 6.39 indicates the extent of performance
of Syndicate Bank and other nationalised banks in respect of
two efficiency parameters. viz.. productivity and customer
service. The efficiency performance of Syndicate Bank denoted
by the score achieved by it is 111.26. Among the nationalised
banks. Syndicate Bank has eleventh position in efficiency
performance. The bank with the highest 'efficiency
performance' is Bank of Baroda with a score of 164.39 and the
lowest performer in this category is New Bank of India. Bank
of Maharashtra is the least performing bank in 'efficiency'
next to New Bank of India. The high 'efficiency performance'
of Bank of Baroda is evident from its high performance in
productivity and customer service furnished by the scores in
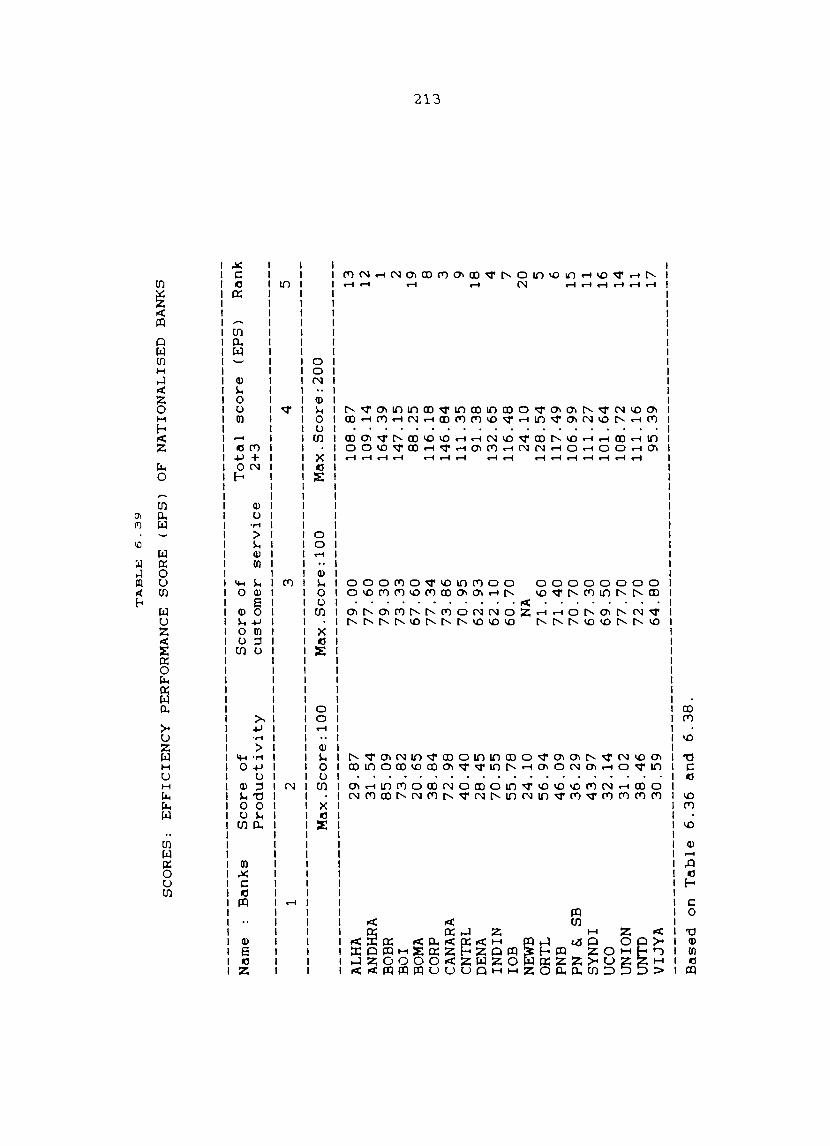
TA
BL
E
6.3
9
SC
OR
ES
: E
FF
ICIE
NC
Y
PER
FOR
MA
NC
E
SCO
RE
(E
PS
) O
F N
AT
ION
AL
ISE
D
BA
NK
S
Nam
e B
an
ks
ALH
A
AN
DH
RA
BO
BR
B
Ol
BOM
A
CORP
CA
NA
RA
CN
TRL
DEN
A
lND
IN
lOB
N
EWB
O
RTL
PN
B
PN
&. SB
SY
ND
I UC
O U
NIO
N
UN
TD
V
IJY
A
1
Sco
re
of
Pro
du
cti
vit
y
2
Max
.Sco
re:1
00
29
.87
3
1.5
4
85
.09
7
3.8
2
20
.65
3
8.8
4
72
.98
4
0.4
0
28
.45
7
0.5
5
55
.78
2
4.1
0
56
.94
4
6.0
9
36
.29
4
3.9
7
32
.14
3
1.0
2
38
.46
3
0.5
9
Base
d
on
T
ab
le
6.3
6
an
d
6.3
8.
Sco
re
of
To
tal
sco
re
(EP
S)
Ran
k
cu
sto
mer
serv
ice
2+
3
3
Max
.Sco
re:1
00
79
.00
7
7.6
0
79
.30
7
3.3
3
67
.60
7
7.3
4
73
.86
7
0.9
5
62
.93
6
2.1
0
60
.70
NA
7
1.6
0
71
.40
7
0.7
0
67
.30
6
9.5
0
77
.70
7
2.7
0
64
.80
4
Max
.Sco
re:2
00
10
8.8
7
10
9.1
4
16
4.3
9
14
7.1
5
88
.25
1
16
.18
1
46
.84
1
11
.35
9
1.3
8
13
2.6
5
11
6.4
8
24
.10
1
28
.54
1
17
.49
1
06
.99
1
11
.27
1
01
.64
1
08
.72
1
11
.16
9
5.3
9
5 13
1
2
1 2 1
9
8 3 9 1
8
4 7 2
0
5 6 1
5
11
1
6
14
1
1
17
N .....
w
214
Table 6.36 and 6.38. Efficiency Performance Score (EPS)
definitely justifies the efficiency of the banks. (See
Fig.6.3 in Appendix Ill)
6.4. Composite Performance
The Composite Performance Score (CPS) of Syndicate
bank and other nationalised banks is presented in Table 6.40.
The Composite Performance Score truly represents an index of
the performance effectiveness of Syndicate Bank and other
nationalised banks. Table 6.40 shows the aggregate of the
scores presented vide Tables 6.14. 6.29 and 6.38. It is the
aggregate of Health Performance Score (HPS). Priority
Performance Score (PPS) and Efficiency Performance Score
(EPS). These scores. as already explained. are the aggregate
of the scores attained in the study for the basic parameters
Capital adequacy and quality of assets. profitability. social
banking. growth. productivity and customer service. The
scores of the six basic parameters are in fact the aggregate
of the scores of forty sub-parameters including eleven
sub-parameters under customer service. The extent of their
perfonmance during the ten year period of study are presented
in the various Tables dealt with in this chapter. The
Composite Performance Score (CPS) of Syndicate Bank and other
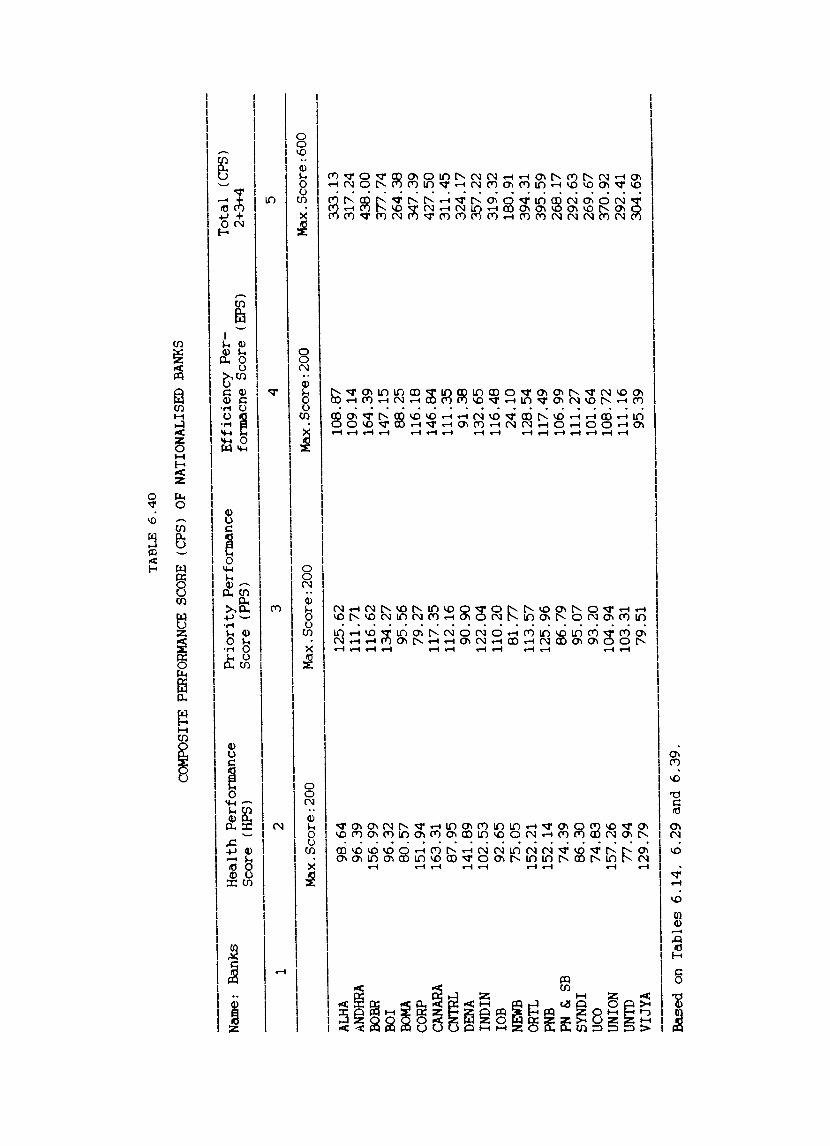
TA
BL
E 6
.40
COM
POSI
TE P
ERFO
RMAN
CE S
CORE
(C
PS)
OF
NA
TIO
NA
LISE
D B
ANKS
----
----
----
----
----
----
----
---
----
----
---
Nam
e:
Ba
nks
H
ealt
h P
erfo
rman
ce
Pri
ori
ty P
erfo
rman
ce
Eff
icie
ncy
Per
-T
ota
l (C
PS)
Sco
re
(HPS
) S
core
(P
PS)
form
acne
Sco
re
(EPS
) 2+
3+4
1 2
3 4
5 --
----
----
----
Max
.Sco
re:2
00
Max
. Sco
re: 2
00
Max
.Sco
re:2
00
Max
.Sco
re:6
00
ALHA
98
.64
125.
62
108.
87
333.
13
ANDH
RA
96.3
9 11
1. 7
1 10
9.14
31
7.24
BO
BR
156.
99
116.
62
164.
39
438.
00
BOI
96.3
2 13
4.27
14
7.15
37
7.74
BO
MA
80
.57
95
.56
88
.25
26
4.38
CO
RP
151.
94
79
.27
11
6.18
34
7.39
CA
NARA
16
3.31
11
7.35
14
6.84
42
7.50
CN
TRL
87
.95
11
2.16
11
1.35
31
1.45
DE
NA
141.
89
90.9
0 91
.38
324.
17
IND
IN
102.
53
122.
04
132.
65
357.
22
lOB
9
2.6
5
110.
20
116.
48
319.
32
NEW
B 7
5.0
5
81
.77
24
.10
180.
91
ORT
L 15
2.21
11
3.57
12
8.54
39
4.31
PN
B 15
2.14
12
5.96
11
7.49
39
5.59
PN
& SB
7
4.3
9
86
.79
10
6.99
26
8.17
SY
ND
I 8
6.3
0
95
.07
11
1. 2
7 29
2.63
UC
O 7
4.8
3
93.2
0 10
1.64
26
9.67
U
NIO
N
157.
26
104.
94
108.
72
370.
92
UNTD
7
7.9
4
103.
31
111.
16
292.
41
VIJ
YA
12
9.79
79
.51
95.3
9 30
4.69
--
----
----
----
---
----
----
----
----
---------
Bas
ed o
n T
able
s 6
.14
. 6
.29
and
6.3
9.
\
216 \
nationalised banks secured by aggregating their respective
Health Performance Score (HPS). Priority Performance Score
(PPS) and Efficiency Performance Score (EPS) are recorded
against thelr names in column five of Table 6.40. (See
Fig.6.4 in Appendix Ill)
Table 6.41 presents rank wise Composite Performance
Score (CPS) of the nationalised banks. Syndicate Bank has the
fifteenth position in Composite Performance with a Composite
Performance Score of 292.63. The highest Composite Performer
is Bank of Baroda with a score of 438. It is the 'best
performing bank' among the nationalised banks. It is followed
by Canara Bank with a score of 427.49. It is the second best
performer. The lowest performer is New Bank of India. It has
a score of only 180.91 to keep it in the twentieth position.
Bank of Maharashtra with a score of 264.37 out of the total
score of 600 stands in the nineteenth position in Composite
Performance. The relative position of other nationalised
banks is evident from Table 6.41.
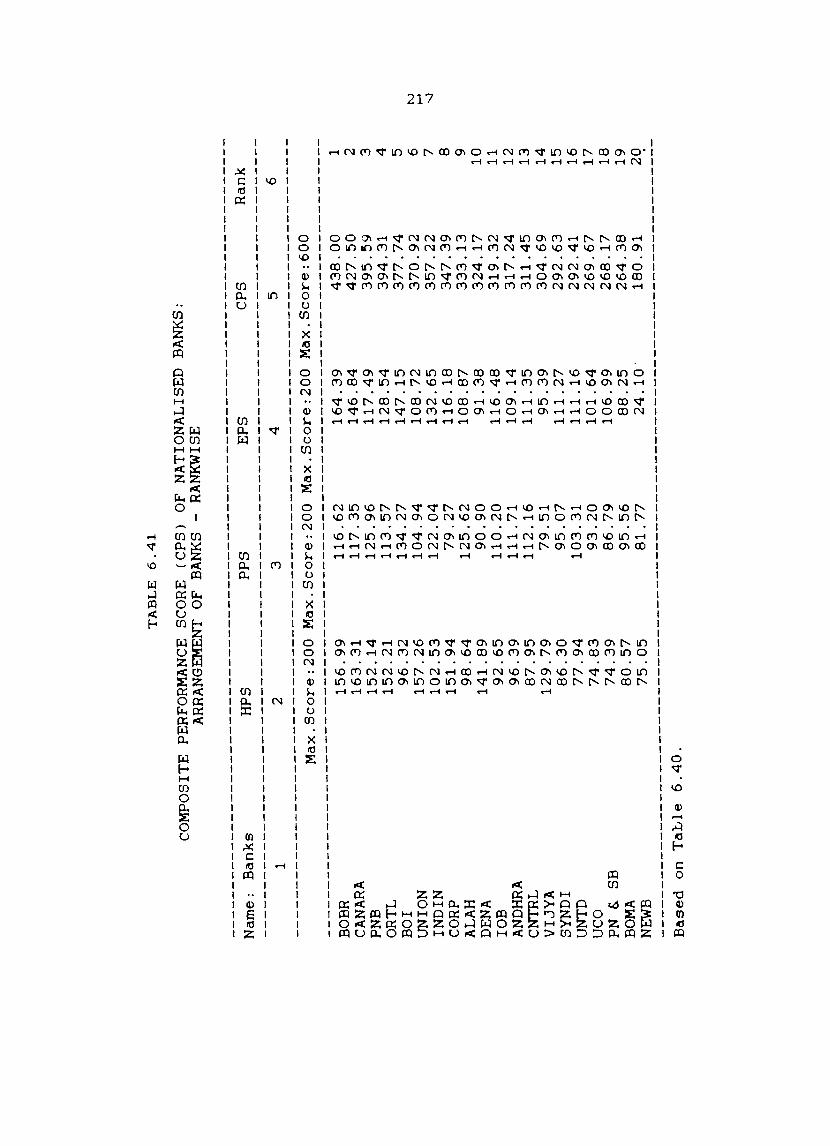
TA
BL
E
6.4
1
CO
MPO
SIT
E
PER
FOR
MA
NC
E SC
OR
E
(CP
S)
OF
NA
TIO
NA
LIS
ED
B
AN
KS:
A
RR
AN
GEM
ENT
OF
BA
NK
S -
RA
NK
WIS
E
Nam
e:
Ban
ks
HPS
P
PS
E
PS
C
PS
Ran
k
1 2
3 4
5 6
Max
.Sco
re:2
00
M
ax
.Sco
re:2
00
M
ax
.Sco
re:2
00
M
ax
.Sco
re:6
00
-----------------------------------------------------------------------------------
BO
BR
1
56
.99
1
16
.62
1
64
.39
4
38
.00
1
CA
NA
RA
1
63
.31
1
17
.35
1
46
.84
4
27
.50
2
PNB
1
52
.14
1
25
.96
1
17
.49
395.~9
3 O
RT
L
15
2.2
1
11
3.5
7
12
8.5
4
39
4.3
1
4 B
OI
96
.32
1
34
.27
1
47
.15
3
77
.74
5
UN
ION
1
57
.26
1
04
.94
1
08
.72
3
70
.92
6
N .....
IND
IN
10
2.5
3
12
2.0
4
13
2.6
5
35
7.2
2
7 --.
J C
OR
P 1
51
.94
7
9.2
7
11
6.1
8
34
7.3
9
8 A
LAH
9
8.6
4
12
5.6
2
10
8.8
7
33
3.1
3
9 D
ENA
1
41
.89
9
0.9
0
91
.38
3
24
.17
1
0
lOB
9
2.6
5
11
0.2
0
11
6.4
8
31
9.3
2
11
AN
DH
RA
9
6.3
9
11
1.7
1
10
9.1
4
31
7.2
4
12
C
NT
RL
8
7.9
5
11
2.1
6
11
1.3
5
31
1.4
5
13
V
IJY
A
12
9.7
9
79
.51
9
5.3
9
30
4.6
9
14
SY
ND
I 8
6.3
0
95
.07
1
11
.27
2
92
.63
1
5
UN
TD
77
.94
1
03
.31
1
11
.16
2
92
.41
1
6
UC
O
74
.83
9
3.2
0
10
1.6
4
26
9.6
7
17
PN
&.
SB
74
.39
8
6.7
9
10
6.9
9
26
8.1
7
18
BO
MA
8
0.5
7
95
.56
8
8.2
5
26
4.3
8
19
NEW
B 7
5.0
5
81
.77
2
4.1
0 .
18
0.9
1
20
--
----
----
----
----
----
----
----
----
----
----
----
----
----
----
----
----
----
----
----
----
--B
ase
d
on
T
aL
le
6.4
0.
218
The performance position of Syndicate Bank in
relation to the other nationalised banks is briefly furnished
below:-
Capital adequacy and quality of assets
Profitability
Health Performance (HP)
Social Banking
Growth
Priority Performance (PP)
Productivity
Customer service
Efficiency Performance (EP)
Composite Performance (CP)
:Fifth position (lowest)
:Fifteenth position
:Fifteenth position
:Fifteenth position
:Ninth position
:Fourteenth position
:Eighth position
:Fifteenth position
:Eleventh position
:Fifteenth position
The comp~ratively poor composite performance of
Syndicate Bank is the outcome of its poor performance in the
various basic parameters outlined in the present study. The
poor performance of the basic parameters have resulted in poor
Health Performance. Priority Performance and Efficiency
Performance. Hence Syndicate Bank Could present only a poor
Composite Performance.
219
The Composite Performance of Syndicate Bank is
capable of showing improvement only if the Bank takes earnest
efforts of enhance its performance in areas such as internal
manage~ent. asset management. technology upgradation. customer
service and so on. This could go a long way in improving its
overall performance.
CHAPTER VII
SUMMARY. CONCLUSIONS AND RECOMMENDATIONS
society.
The b~nking system is indispens~ble in the modern
It plays ~ key role in the economic development and
forms the core of the money market in an ~dvanced economy.
Realising the crucial role of the banks in the national
economy. the Government of India nationalised fourteen major
commercial banks in July.1969 and six more in April.19bO. As
~ result of this 'banking revolution'. the old concepts.
attitudes and methods of banking in India have changed. Now
the credit institutions in the country are required to
participate in the nation building activities and help in
bringing about socio-economic changes. Banks. as social
assist the
in achieving
institutions have to go out to the people and
the society weaker and neglected sections of
their socio-economic aspirations. They are
catalysts in the development of the country
to act as
mobilising
resources whrerever they may be. and channelising them towards
productive purposes. The role of the public sector banks in
India is all the more enhanced with the implementation of the
Banking Sector Reforms introduced on the basis of the
recommendations of the Narasimham Committee on the Financial
System.
221
Though with some silver linings here and there. the
individual performance of all the nationlised banks in India
are far from satisfactory. The poor state of affairs of the
banks is all the more brought to light with the introduction
of the Financial Sector Reforms. All the nationalised banks
incurred a net loss during the year 1992-93. The aggregate
net loss of the nationalised banks came to Rs.3.64. 292 lakhs
and Rs.3.44.664 lakhs during 1992-93 and 1993-94 respectively.
Syndicate Bank. a bank that performed unusually well during
the pre-nationlisation and early post-nationalisation periods
and which show the same decelerating trend in performance
along with other nationalised banks is taken as a case study.
The present study which evaluated the overall
individual performance of all the twenty nationalised banks
(now nineteen) over a period of ten years from 1984 to 1993-94
comprises of seven chapters. The first chapter provides an
introduction outlining the importance of banks in the economic
development of the country. A statement of the problem
investigated. the objectives of the study. the methodology and
sources of data as well as the limitation of the study are
presented in this chapter.
222
A review of the relevant studies in the area of
banking is presented in the second chapter.
In the third chapter an overview of the growth and
development of Indian banking industry. outlining the major
phases. viz. nationlisation of the banks. the Banking Sector
Reforms introduced on the basis of the Narasimham Committee
recommendations and their impact on the banking sector. are
discussed with special emph~sis on the nationalised banking
industry.
A profile of Syndicate Bank including its origin.
history. development and its organisation and management are
outlined in the fourth chapter.
The theoretical foundation of the present study is
outlined in chapter five. The EMEE Model developed for the
study is discussed in detail in this chapter.
The sixth chapter provides the analysis of the
performance effectiveness of Syndicate Bank vis-a-vis with the
rest of the nationlised banks in the country. The nationlised
banks are ranked on the basis of their Health Performance.
Priority Performance. Efficiency Performance and Composite
Performance as delineated in the EMEE Model.
223
The seventh chapter presents an overview of the
entire study. The findings and conclusions as well as the
recommendations drawn on the basis of the detailed analysis
are presented in the chapter.
7.1. Findings and Conclusions
The findings of the study based on the EMEE Model is
outlined below. parameter wise.
Capital ~dequacy and Quality of ~ssets
Among the nationalised banks. Canara Bank obtained
the first position in capital adequacy and quality of assets
by attaining the full score of 100 earmarked for the parameter
followed by Dena Bank obtaining a score of 97.5 and five other
banks a score of 95. Vijaya Bank with a score of 75 occupy
the fourth position in the performance of this parameter.
Syndicate Bank and eleven other banks got only a score of 45.
being the lowest.
224
Profitability
Canara Bank has the highest score of 63.31 in
profitability followed by Union Bank of India occupying the
second position with a score of 62.06. The fifteenth position
of Syndicate Bank in profitability with a score of 41.30 is
the outcome of its poor performance in the various vital
sub-parameters considered under the basic
'profitability'. The lowest performing bank in
is Punjab and Sind Bank with a score of 29.39.
Health Performance (HP)
parameter
profitability
Canara Bank with its best performance in
adequacy and quality of assets and profitability. is
capital
able to
attain the first position in Health Performance by a score of
163.31 out of maximum of 200 earmarked for Health performance.
Canara Bank is followed by Union Bank of India in Health
Performance with a score of 157.26. Syndicate Bank has
fifteenth position in Health Performance with a score of 8b.3.
Punjab and Sind Bank has the lowest position in Health
Performance with a score of 74.39.
225
Social Banking
Allahabad Bank has the highest score in social
banking with a score of 81.45 followed by Punjab National Bank
with a score of 75.2. Syndicate Bank has a score of 51.15 to
keep it at the fifteenth position in its performance in soc~al
banking. Corporation Bank with a score of 32.95 is the least
performing bank in social banking.
Growth
Though Syndicate Bank has the lowest performance
position in capital adequacy and quality of assets along with
eleven other banks and it has only the fifteenth position in
profitability. health performance. and social banking. it has
the ninth position in 'growth' with a score of 43.91. Other
than 'productivity'. discussed under Efficiency Performance.
'growth' is the only parameter for which Syndicate Bank has a
rank position below ten. Only in these two parameters
Syndicate Bank has a comparatively better performance. Indian
Bank with a score of 68.49 is the best performer in growth and
Bank of Maharashtra with a score of 29.88 is the least
performing bank in 'growth'.
226
Priority Performance (PP)
In priority performance. which is the outcome of a
bank's performance in social banking and growth as per the
present study. Syndicate Bank has the fourteenth position with
a score of 95.06. The Bank's low performance in this aspect
is the result of its uncomfortable performance position in
social banking as indicated by the relevant score. Syndicate
Bank is said to have a rural heritage and it functions mo~tly
in a rural environment. But it has a poor performance in
social banking as indicated by the management of the
sub-parameters identified under this basic parameter. Hence
its poor performance in priority performance. Bank of India
with a Priority Performance Score of 134.27 is the best
performer and Corporation Bank with a score of 79.26 stands in
the lowest position in priority performance.
Productivity
Syndicate Bank has the eighth position in
productivity performance with a score of 43.96. It is one
among the two basic par~~eters for which Syndicate Bank has a
relatively better performance position. the other being
growth: Bank of Baroda has the highest productivity
227
performance with a score of 85.09 and Bank of Maharashtra with
a score of 20.64 has the lowest productivity performance.
Customer Service
In customer service Syndicate Bank could not enjoy a
comfortable position with a score of 67.3: it has only the
fifteenth position in the performance of this basic parameter.
The highest performer in customer service is Bank of Baroda:
it has a score of 79.3 followed by Allahabad Bank with a score
of 79. Indian Overseas Bank has the lowest score of 60.7 in
customer service.
Efficiency Performance (EP)
The eleventh position of Syndicate Bank in
Efficiency Performance with a score of 111.26 is the outcome
of its performance in productivity and customer service.
Unlike Health Performance and Priority Performance where
Syndicate Bank has only the fifteenth position and the
fourteenth position respectively, it has a slightly better
performance position in Efficiency Performance. Though it has
the eighth position in productivity performance. this is
offset through its low performance in customer service which
228
took it to the eleventh position in Efficiency Performance.
The Bank with the highest Efficiency Performance is Bank of
Baroda wi th a score of 164.39 ou.t of a total score of 200.
The high efficiency performance of this Bank is the result of
its high performance in productivity and customer service.
The lowest performing bank in this respect is New Bank of
India with a score of 20. Of course. this score of New Bank
of India is the score of productivity alone. for. it has no
score in customer service. It was non-existent at the time of
the survey on customer service by the researcher. Bank of
Maharashtra with a score of 88.24 is the least performing bank
in efficiency. next to New Bank of India.
Composite Performance (CP)
Composite Performance Score (CPS) denoting the
aggregate scores of all the six identified basic parameters or
the aggregate of HPS. PPS and EPS is an index of the allround
performance. Syndicate Bank has the fifteenth position in
Composite Performance with a score of 292.63 out of the
maximum score of 600 earmarked for tr.e six basic parameters:
the highest performer is Bank of Bardoa with a CPS of 438
followed by Canara Bank with a score of 427.49. The lowest
performing bank is New Bank of India.with a score of 180.91.
229
Bank of Maharashtra with a score of 264.37 in
Performance is the least performing bank next to New
India.
Composite
Bank of
The study reveals the overall performance of all the
nationalised banks in India. The relatively poor performan;e
of Syndicate Bank in the various parameters identified in the
present study resulted in its dismal picture in allround
performance. Except for the two parameters. 'growth' an1
'productivity'. the Bank's performance in all the other
parameters are really uncomfortable. When compared to
Syndicate Bank fourteen banks fared better in overall
performance as indicated by their Composite Performance Score
(CPS). Only four nationalised banks exhibit poor performance
in relation to Syndicate Bank.
Thus it can be concluded that the performance of the
nationalised banks especially banks like Syndicate bank leaves
scope for improvement. The Cmposite Performance Score of the
individual nationalised banks including that of Syndicate Bank
is capable of showing improvement if the banks take earnest
efforts to enhance their performance in the vital areas viz.
internal management. asset management. technology upgradatlon
and customer service. Su~h an effort would lead to the
230
enhancement of the performance in all the parameters and
eventually to the Composite Performance/overall performance of
the banks.
7.2. Recommendations
In the light of the observations and findings of the
study. it is but fitting and proper to put forward the
following recommendations
effectiveness of the Indian
nationalised banking sector:
to improve
banking sector.
the performance
especially the
I Low performing banks should take every effort to improve
their quality of assets. capital adequacy. profitability.
and customer service. Steps should be taken to improve
their Health Performance. Priority
Efficiency Performance.
Performance and
11 The operational efficiency of the banks is to be ensured.
maintained and improved through modern technology.
systems and better staff management on an on-going basis.
III The Board of Directors of the low performing banks should
be reconstituted. with people having expertise. vision
and mission.

231
IV New avenues of viable projects are to be identified by
the nationalised banks to invest effectively and
profitably the funds tapped through various sources. so
that profitability and productivity can be improved.
V The internal management system of the nationalised banks
are to be toned up.
VI All top and senior executives should be placed in duly
earmarked areas of responsibility and should be held
answerable and accountable for all that happens within
their respective areas. Persons who exploit their power.
authorjty and position should be severely dealt with.
VII Political affiliations in
executives and the
management and day to
eliminated to achieve
effectiveness.
the appointment of the
political interference in
day administration is to
maximum efficiency
top
the
be
and
VIII Management audit is to be introduced as a tool for an
objective evaluation of the management performance of the
nationalised banks in the overall functioning of the
organisation. Such an audit should clearly reveal the
232
lapses in the organisation structure. systems and
procedures. so that corrective actions can be taken.
IX Nationalised banks should be permitted to operate on the
basis of operational flexibility and functional autonomy
within the broad framework of the guidelines issued by
the Reserve bank of India: the approach to management of
the resources should not be mere target-oriented. A
'need based' and 'credit worthy' policy instead of a
'directive based' lending could only minimise
accumulation of non-performing assets.
X The banks should make every endeavour to enhance customer
satisfaction. They should try to iUlI-J.t-ove quality service
through effective staff training. service monitoring.
orientation and recognition programmes. Banks should
offer the customer what he wants rather than offering
what they have in stock. for, every customer has a
different need.
To conclude. let us
through dedication and hard work
hope.
the
in the coming vears
nationalised banks in
India would improve their performance and march towards the
achievement of their corporate mission and goals in a better
way.
233
BIBLIOGRAPHY
BOOKS
Agarwall. B.P.. Commercial Banking in India Nationalisation. Classical Publishing Company. New 1982.
After Delhi.
Agarwall. H.N .• A Portrait of Nationalised Banks. Inter-India Publications.Delhi. 1979.
Agarwall. H.N .. Management of Nationalised Commercial Banks in India with Reference to their Social abli ation. Inter-India
lcatlons. 1 i.
Angadi. V.B .. A Portrait of Nationalised Banks. Inter-India Publications. Delhi. 1979.
Basu. S.K .. A Review of Current Banking Theory and Practice. Macmillan India Ltd .• BOmbay. 1984.
Bhatta. C. Ramesh. Banking Structure and Performance. National Institute of Bank Management. Pune. 1982.
Chawla. A.S .. Nationalisation and Growth of Indian Banking. Deep and Deep Publications. Delhi. 1987.
Chawla. a.p .• Funds Plannint and Control in Institute of Bank Managemen • Pune. 1989-90.
Banks.
Chew Donald. New Develo6Sjnts in Commercial Banking. Publishers. Cambridge. • 1991.
National
Blackwell
Davar S.R .. Law and Practice of Corporation :Pvt. Ltd .. Bombay. 1986.
Banking. Progressive
Desai. S.S.M .. Rural Banking in India.~ Himalaya Publishing House. Bombay. 1979.
Desai. Vasant. Indian BankinK: Nature and Publishing House. Bombay. 19 7.
Problems. Himalaya
234
Ghosh. D.V .• Banking Policy in India- An Evaluation. Allied Publishers. Bombay. 1979.
Giridhari. D.G .. "An Evaluatory Study of Performances of Private and Public Sector Banks". in Vinayakam (ed.) A Peep into Private Sector Banks. Kanishka Publishers & Distributors. Delhi. 1993.
Hussain Farhat. A StUdl of New Roles of the Public Sector Commercial Banking inndia. Deep and Deep Publications.New Delhi. 1986.
Indian Banks Association. Indian Banking Year Book. 1994. Bombay. 1994.
Karkal. Gopal. Perspectives in Indian Banking. Prakashan (P) Ltd-.-.-=B~omo-r-ay--.~19~7=7~.-----------------&
Popular
in Kaura. N. Mohinder. Mana Commercial Banks. Vir-a-s~~~~~---n~~--~--~~r---~~r-----
Kessides. Christine and others (eds.). Financial Reform in Socialist Economies. Washington. D.C .• IBRD, 1989.
Maheswari. 8.N .. Banking Lawand Practice. 4th ed. Kalyani Publishers. New Delhi. 1985.
Mathur. O.P .. Public Sector Banks in India's Economh: Study of State Bank of India. Sterling Publishers.ew 1978.
A Case Delhi.
Nadler. Pauls. Commercial Banking in the Economy. Random House. New York. 1966.
Radhaswamy. M. and S.V. Vasudevan. A Text Book of Banking. Deep and Deep Publications. New Delhi. 1984.
Rajendran. K.A .. "Comparative Study on Public and Private Sector Banks". in Vinayakam (ed.), A Peep into Private Sector Banks. Kanishka Publishers, Distributors. Delhi. 1993.
Rangarajan. C .. "Banking Development since Nationalisation". in T.N. Srinivasan and T.N. Bardhan (eds.). Poverty and Income Distribution in India, Statistical Publishing Society, Calcutta. 1974. pp.417-439.
235
----------. Innovations in Banking. Oxford and IBH Publishing Company. Bombay. 1982.
Rao. Ramachandra. B .. Current Trends in Indian Banking. Deep and Deep Publications. New Delhi. 1984.
Sastry. K.S .• Performance BUdgetin~ for Radiant Publishers. New Delhi. 197 .
Planned Development.
Seshadri. I.J.H .. Banks Since Nationalisation. Birla Institute of Scientific Management, New Delhi, 1981.
Sharma, B.P., Role of Commercial Banks in India's Developing Economy, S. Chand & Co., New Delhi, 1974.
Sharma, H.C.. Nationalisation of Banks in India, Sahitya Bhavan, Agra, 1985.
Shekhar, K.C .. Banking Theory and Practice, 7th ed., Vikas Publishing House (P) Ltd., New Delhi. 1982.
in
reme Court Singhvi, L.M .. Bank Nationalisation and ---'-'~-r~~--~r-------~~~--~~------------Judgement. Nationa ompany,
Subrahmanya. K.N .. (ed.). Modern Banking in India. Deep & Deep Publications. New Delhi, 1982.
Syndicate Bank. The Saga of sixty Years. Diamond Jubilee Commemoration Volume, Manipal, 1985.
Thingalaya N.K .. (ed.> On Bankers and Economists. Macmiilan India Ltd., Bombay. 1981.
Vijaya Bank, 10th Bank Economists Meet 1987 - Proceedings and Papers, Bangalore, 1987.
Articles
Abramovitz, M.. 'Economic Growth in the United States', American Economic Review. (Sept. 1962), pp.762-82.
Ammannaya. K.K .. 'Employee Productivity in Banks'. Financial Express, (Sept. 1979j. p.4.
236
Angadi. V.B .. 'Measurement of Efficiency in Banking Industry'. Reserve Bank of India Occasional Papers. (June. 1983). pp.110-112.
Anjaria. J.J .. 'New Dimensions in Central Banking'. Reserve Bank of India Bulletin. (Sept. 1968). p.1159.
Apte. Narendra M .. 'Banking in the Eighties: Various Growth Constraints'. The Economic Times. (May 20. 1983). p.7.
Babha. C.H .. 'Better Climate for Expansion of Indian Banking Needs'. Commerce. (A~~u~l Number. 1956). p.50.
Ballal. N. Murari. 'Future of Commercial Banking in India: Some Reflections'. Pigmy Economic Review. (November. 1963). pp.6-8.
Bhatt. Atul. 'Bank Marketing. Market Research and Indian Banks'. Prajnan. Vol XX (Jan.-Mar 1991). pp.46-56.
Bhattacharya B.N .. 'Is Customer Service Deteriorating in the Indian Banking Industry'. Vikalpa. Vol.15. (July-September. 1990). p.23.
'Evaluation of Customer Service in Banking Industry , Decision. Vol. 18. (January-March. 1991).p.57.
Bhattacharya. Hrishikes.'Performance in a Nationalised Banks'. Productivity. (April-June. 1985). pp.29-35.
B.R. Prasad. 'Pressures on Bank Profits'. IBA Bulletin. Vol.XV. No.8. (August. 1993). p.3.
Business Line. August 29. 1995. p.7.
Chadha. B.L .. 'Changing Phases of Indian Banking since 1969: Emerging Scenario'. Pigmy Economic Review. (November. 1993-94). Manipal.
Deshpande. D.D.. 'Towards Better Customer Service'. IBA Bulletin. Vol. IX. No.11. (November. 1987). p.224.
De WUlf. Luc. 'Financial Reform in China'. Development. Vol.24. No.4. (December. 1985).pp.19-22.
Finance
Divatia. V.V. and T.R. Venkatachalam. 'Operational Efficiency and Profitability of Public Sector Banks'. RBI Occasional Papers. (June. 1978). pp. 1-16.
237
Dooley. Michael P. and Mathieson. Donald. J.. "Financial Liberalisation in Developing Countries". Finance and Development. Vol.24. No.3. (September. 1987). pp.23-27.
Economic Times. May 3. 1994. p.15.
Krishnaswamy. K.S.. 'On Liberalisation and Some Matters'. Economic and Political Weekly. Vol.26. (October 19. 1991). pp.2415-2422.
Related No.42.
Kulkarni. L.G .. "Development Responsibility and Profitability of Banks". Economic and Pol itical Weekly. (August. 1979). pp.99-102.
Majumdar. N.A .. "Financial Scenario in the 1990's: Agenda for Reform". Economic and Political Weekly.Vo1.26. No.14.(April 7. 1990). pp.731-737.
Murthy. Y. Sree Rama & Haresh. G.. 'Regional Variation in Banking Business: A Study Based on ANOVA Technique'. Prajnan. Vol XX. (Jan.- Mar. 1991). pp.31-43.
Narasimham. M .. "Towards Financial Liberalisation". State Bank of India Monthly Review. Vol.29. No.8. (August. 1990). pp.372-389.
Ojha. J .. 'Productivity and Profitability' of Public Sector Banks in India: An International Comparison'. State Bank of India Monthly Review. (July. 1987). pp.333-48 .
. " Padwal. S.M.. 'Conceptual Framework for Organisational Preparedness in a Changing Environment'. Prajnan. (Jan.-Mar .• 1993) pp.422-425.
-----. "Liberalisation and its Impact on Banking and Finance". Prajnan. Vol.XX. (Oct.-Dec.1991). pp.357-364.
Pathak. S.M .. "Restructuring of Banking System in India". Bank of India Bulletin. (August 23.1986). pp.92-96.
Prakasum. R .. 'Performance Appraisal of Public Sector Banks'. Journal of Indian Institute of Bankers. (April-June. 1983)pp.88-94.
Raghavendra. L .. Evaluation of Customer Service in Banks. IBA Bulletin. (April. 1993). p.12.
238
Ravisankar. T.S .. 'Towards Structural Changes in Banking Prajnan. (Jan.-Mar .. 1993). pp.439-453.
Sambamurthy. B .. "Restructuring Banking System". Financial Express, (November 16. 1989). p.4.
Satyajit. "Public Sector Banks Need Restructuring". Financial Express. (August 5. 1989), p.4.
Satyamurty. B .. 'Profitability Concepts and Evaluation', IBA pp.270-76.
and Productivity in Bulletin. (Nov ..
Banks: 1981),
Shah. S.G .. 'Bank Profitability: The Real Issue', Journal of Indian Institute of Bankers, (July-September, 1979) pp.130-144.
----------. Concern with Three P's.: Performance, Productivity and Profitability, Commerce. (July 31, 1982). pp.24.
Shetty. S.L.. "Performance of Coamercial banks since Nationalisation of Major Banks. Promise and Reality". Economic and Political Weekly. Vol. XII, No.31. 32. 33. special number. (August, 1978). pp. 1407-1447.
Sinha. K .. "Banking Reform: Redefining Roles". Economic Times. (October 31. 1991). p.9.
Sreenivasan, P.B .. "Marketing Approach to Banking The Journal of the Indian Institute of (July-September, 1987), p.129.
Services". Bankers.
Subrhamanyam. Ganti, 'An Approach to Inter-Bank Productivity Comparisons', Prajnan. (Oct.-Dec .. 1984), pp.381-92.
'Can Reintermediation Stay Far Behind Disintermediation?' Prajnan, (Jan.-Mar.1993). pp.475-488.
The Banker. (London). July 1985.
Varde. V.S. and S.P. Singh. 'Pofitability of Commercial Banks', Management Accountant. (May, 1979), pp.778-88.
Varshneya. J.S .. "The Challenge of Fast Growing Number of Customers". The Journal of the Indian Institute of Bankers, 1992. p.34.
239
Reports
Reserve Bank of India. Annual Repor~.1977-80.
Financial Analysis of Banks 1984 to 1993-94. Indian Banks Association. BOmbay.
Market Share of Business in Key Areas of Business 1969-1991. Indian Banks Association 1993.
Public Sector Banks Performance Hi hli hts-1991-92 to 1993-94. ndian Ban s Association. Bombay.
Sector
Report of the Banking Commission. Government of India. 1972.
Report of the Productivity. Efficiency and Profitability (PEP) Committee on Banking (Headed by J.C.Luther). Reserve Bank of India. 1977.
Report of the Committee on Bank Accounts (Ghosh Committee). Reserve Bank of India. 1982.
Re ort of the Committee to Review the Wc~kin System. ( eaded by u hamoy Chakravarty>. India. 1985.
of the Moneta eserve Bank of
Report of the Bankin, Commission. (Saraiya Commission).
Committee on the Financial M. inistry 0 Finance.
Syndicate Bank. Annual Reports. 1984 to 1993-94.
71st Report on Customer Services and Security System in Nationalised Banks. The Estimates Committee of tne L~k S~bha. 1989.
240
Unpubished Sources
Basu, C.R., The Role of the Commercial Banking in the Planned Economy of India, Ph.D. Thesis, Burdwan University, Burdwan, 1970.
Banker's Training College, RBI, ~E~f~f~i~c~i~e~n~c~y~,~P~r~o~d~u~c~t~i~v~i~t~y~_a~n~d~ Customer Service in Banks, Conference paper, National Conference on Banking Development, (Nov. 12, 1988), RBI, Bombay.
Department of Banking Operations and Development, of India, Efficiency, Productivity and Customer Banks, Conference paper, National Conference Development, (November 12, 1988), Bombay.
Reserve Bank Service in on Banking
Jain Mohinder Kumar, Funds Management in Selected Nationalised Banks, Ph.D. Thesis, Kurukshetra University, 1984.
Nayan Kamal, Performance Evaluation of Development of an Evaluation Model, Ph.D. Pradesh University, Simla, 1982.
Commercial Banks: Thesis, Himachal
Rajan Ranga, V. Long Range Plan for Syndicate Bank, Project Report, NIBM, ry~e, 1991.
Restogi, Peeyush Kumar, Post Nationalisation Trends in Indian Banking, Ph.D. Thesis, Rohilkhand University, Bareilly, 1982.
Satyamurty, B., Efficienc ,Productivit and Customer Services in Banks, Conference aper, National onference on Banking Development, RBI, (Nov.12, 1988), Bombay.
Thomas Zacharias, A Review of the Working of Syndicate Bank Since Nationlisation, M.Com. Dissertation, University of Indore, 1975.
Varde, V.S., Effectiveness, Efficienc ,and Customer in Banks, Paper Presente at National Conference on Development, RBI, (Nov.12, 1988), Bombay.
Service Banking
Yadav Bal Ram Singh, An Evaluation of the Working of the Syndicate Bank in Nor~tTh~e-r~n~~Z~o~n~e~,~~P~h~.~D~.~'Th=-e~s~l~·s~,~R~o~h~i~l~k~h~a~n~d University, Bareilly, 1983.