Embed Size (px)
Citation preview
Performance Diagnostic Researchat PSC
Matt Mathis
John Heffner
Ragu Reddy
5/12/05
http://www.psc.edu/~mathis/papers/
PathDiag20050512.ppt
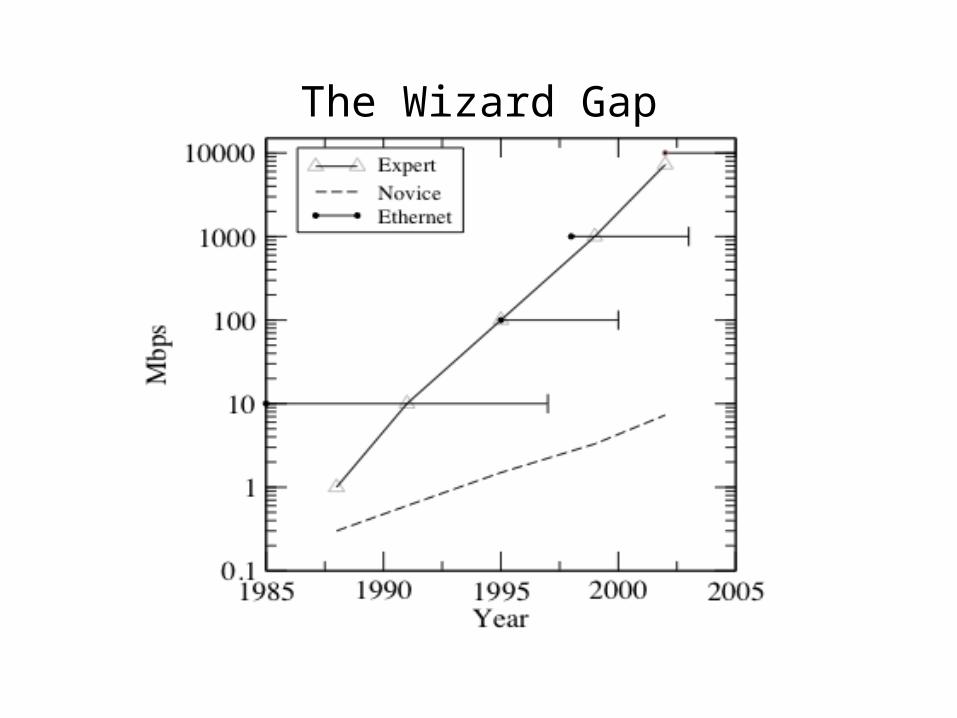
The Wizard Gap
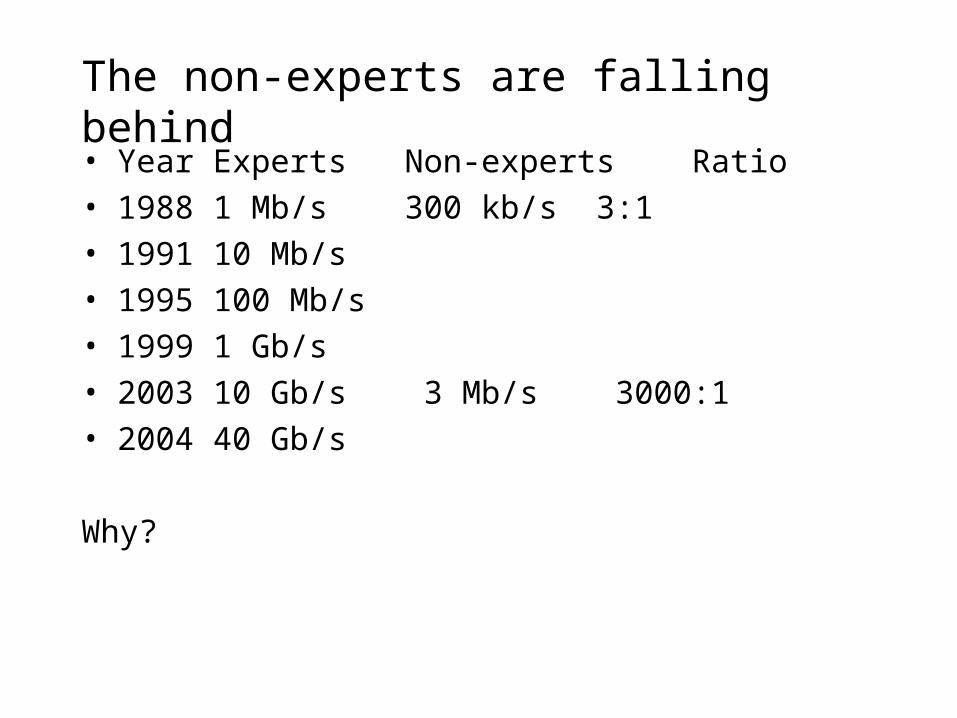
The non-experts are falling behind• Year Experts Non-experts Ratio• 1988 1 Mb/s 300 kb/s 3:1• 1991 10 Mb/s• 1995 100 Mb/s• 1999 1 Gb/s• 2003 10 Gb/s 3 Mb/s 3000:1• 2004 40 Gb/s
Why?
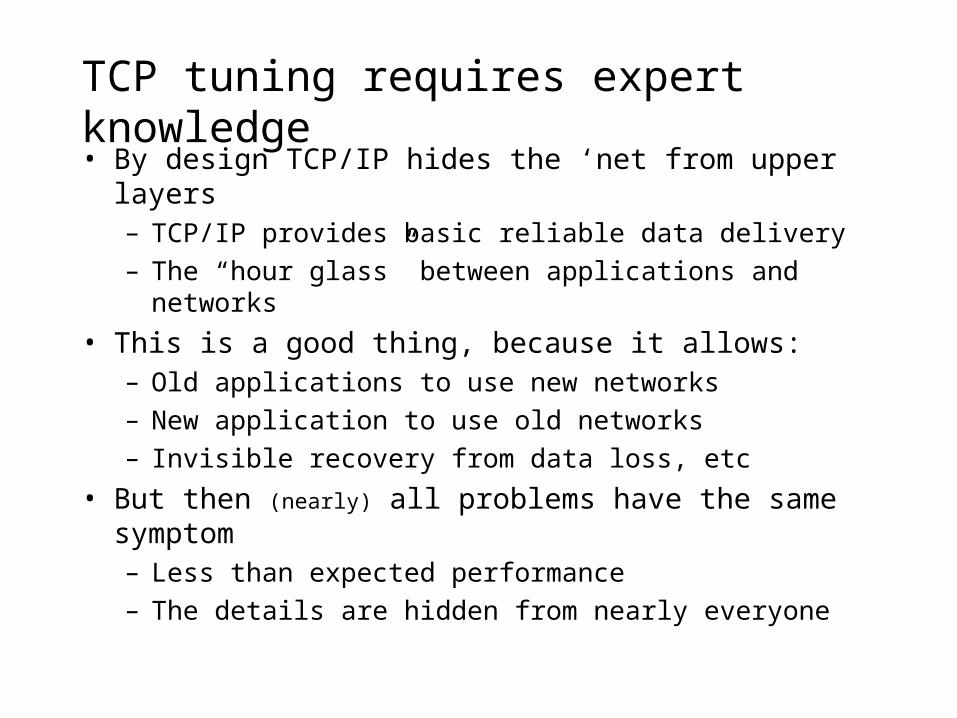
TCP tuning requires expert knowledge• By design TCP/IP hides the ‘net from upper layers
– TCP/IP provides basic reliable data delivery
– The “hour glass” between applications and networks
• This is a good thing, because it allows:– Old applications to use new networks
– New application to use old networks
– Invisible recovery from data loss, etc
• But then (nearly) all problems have the same symptom– Less than expected performance
– The details are hidden from nearly everyone
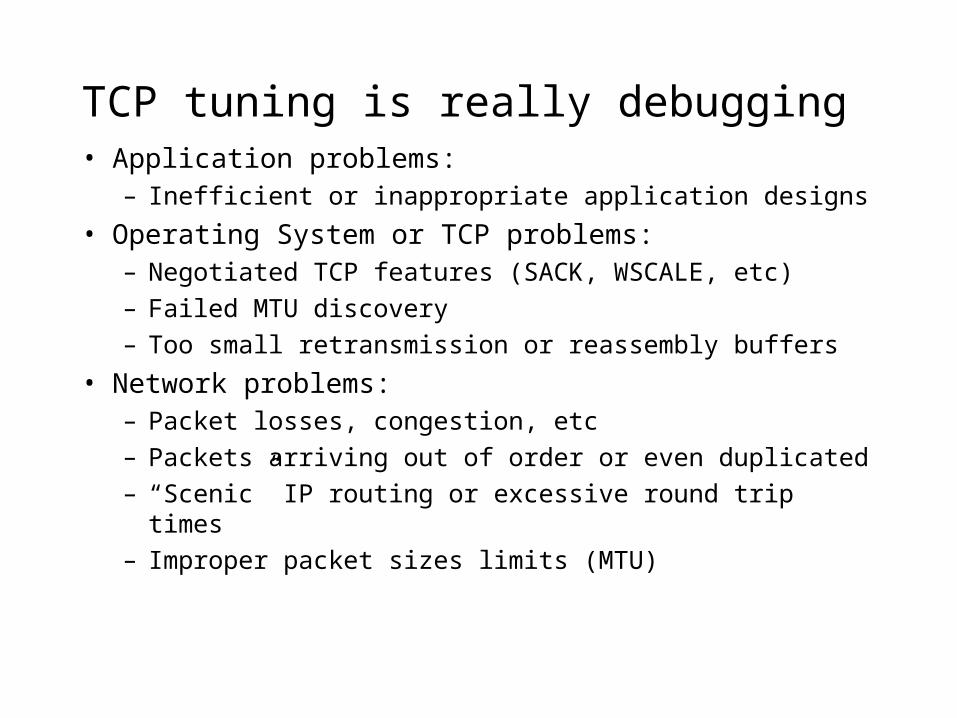
TCP tuning is really debugging• Application problems:
– Inefficient or inappropriate application designs
• Operating System or TCP problems:– Negotiated TCP features (SACK, WSCALE, etc)
– Failed MTU discovery
– Too small retransmission or reassembly buffers
• Network problems:– Packet losses, congestion, etc
– Packets arriving out of order or even duplicated
– “Scenic” IP routing or excessive round trip times
– Improper packet sizes limits (MTU)
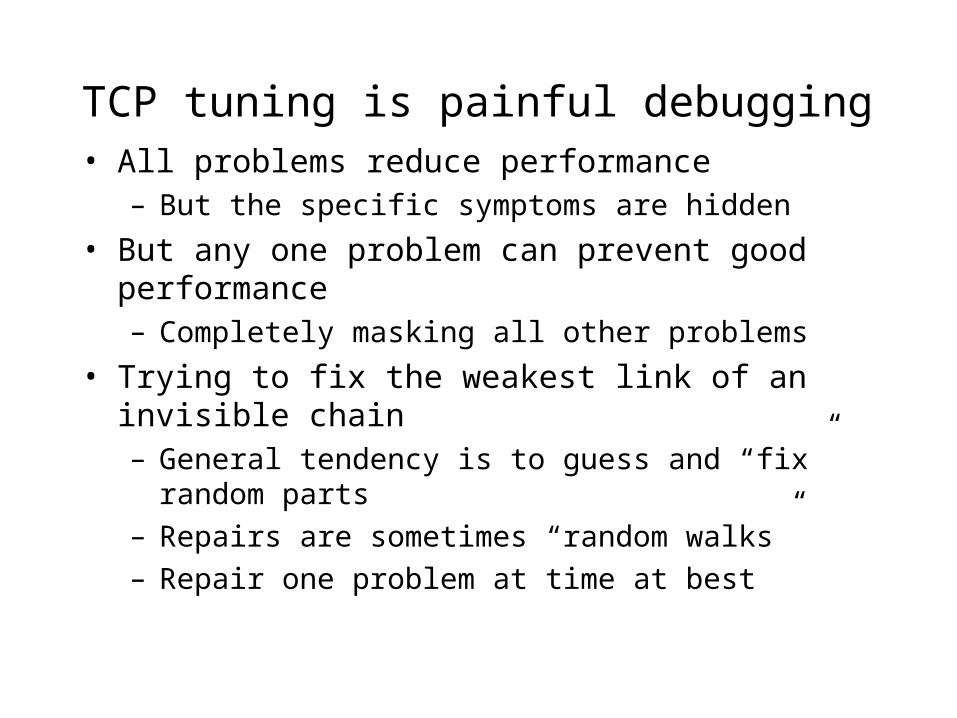
TCP tuning is painful debugging• All problems reduce performance
– But the specific symptoms are hidden
• But any one problem can prevent good performance– Completely masking all other problems
• Trying to fix the weakest link of an invisible chain– General tendency is to guess and “fix” random parts
– Repairs are sometimes “random walks”
– Repair one problem at time at best
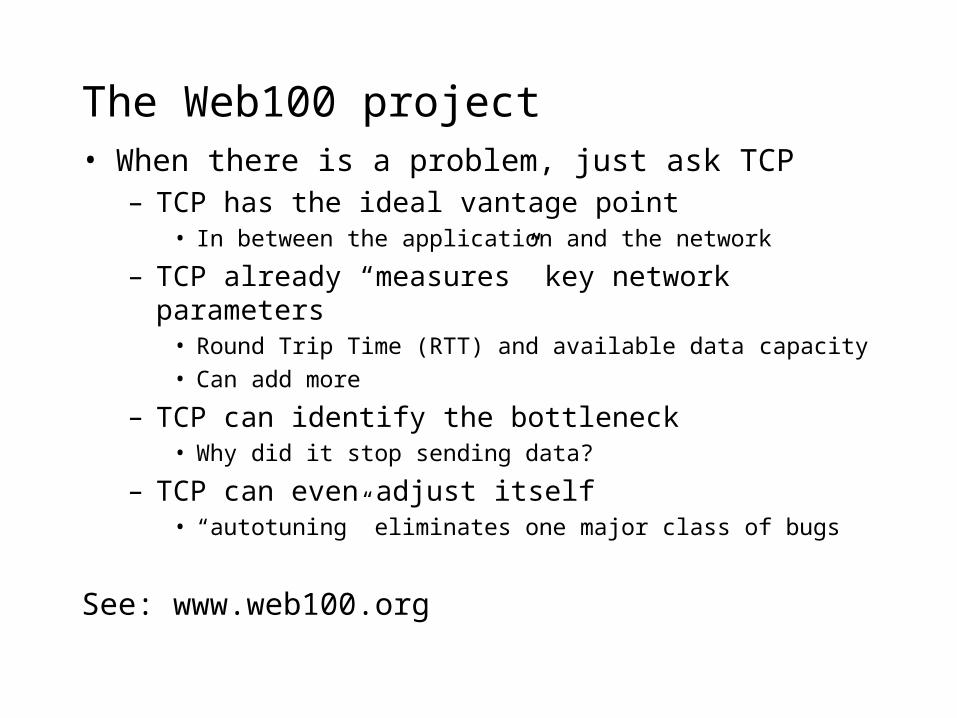
The Web100 project• When there is a problem, just ask TCP
– TCP has the ideal vantage point• In between the application and the network
– TCP already “measures” key network parameters• Round Trip Time (RTT) and available data capacity
• Can add more
– TCP can identify the bottleneck• Why did it stop sending data?
– TCP can even adjust itself• “autotuning” eliminates one major class of bugs
See: www.web100.org
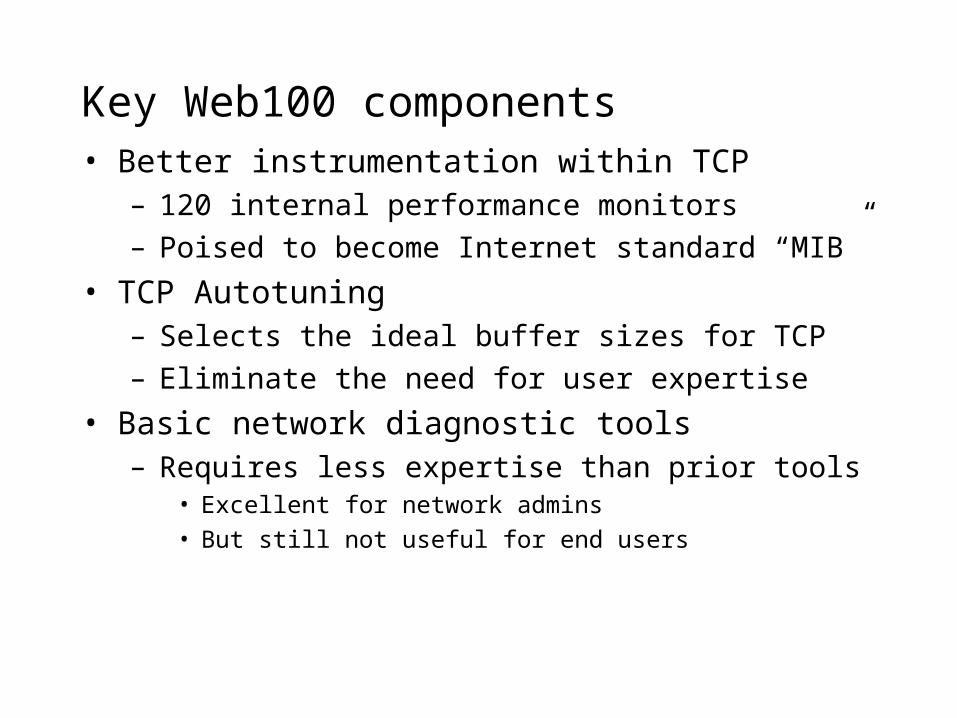
Key Web100 components• Better instrumentation within TCP
– 120 internal performance monitors
– Poised to become Internet standard “MIB”
• TCP Autotuning– Selects the ideal buffer sizes for TCP
– Eliminate the need for user expertise
• Basic network diagnostic tools– Requires less expertise than prior tools
• Excellent for network admins
• But still not useful for end users

Web100 Status• Two year no-cost extension
– Can only push standardization after most of the work
– Ongoing support of research users
• Partial adoption– Current Linux includes (most of) autotuning
• John Heffner is maintaining patches for the rest of Web100
– Microsoft • Experimental TCP instrumentation
• Working on autotuning (to support FTTH)
– IBM “z/OS Communications Server”• Experimental TCP instrumentation
The next step• Web100 tools still require too much expertise
– They are not really end user tools
– Too easy to overlook problems
– Current diagnostic procedures are still cumbersome
• New insight from web100 experience– Nearly all symptoms scale with round trip time
• New NSF funding– Network Path and Application Diagnosis (NPAD)
– 3 Years, we are at the midpoint
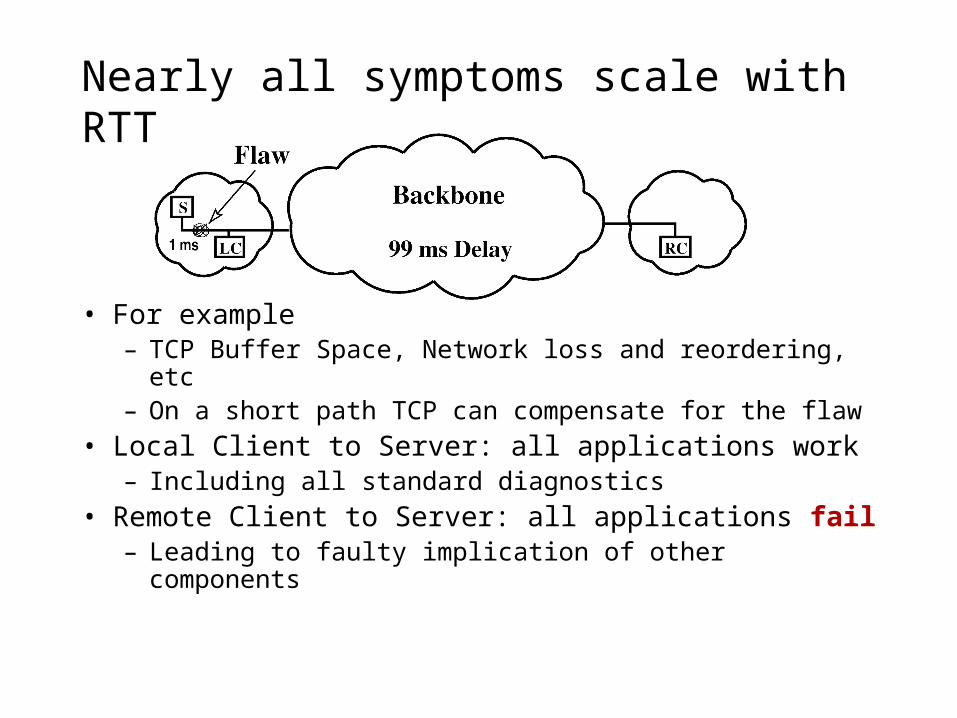
Nearly all symptoms scale with RTT
• For example– TCP Buffer Space, Network loss and reordering, etc– On a short path TCP can compensate for the flaw
• Local Client to Server: all applications work– Including all standard diagnostics
• Remote Client to Server: all applications fail – Leading to faulty implication of other components
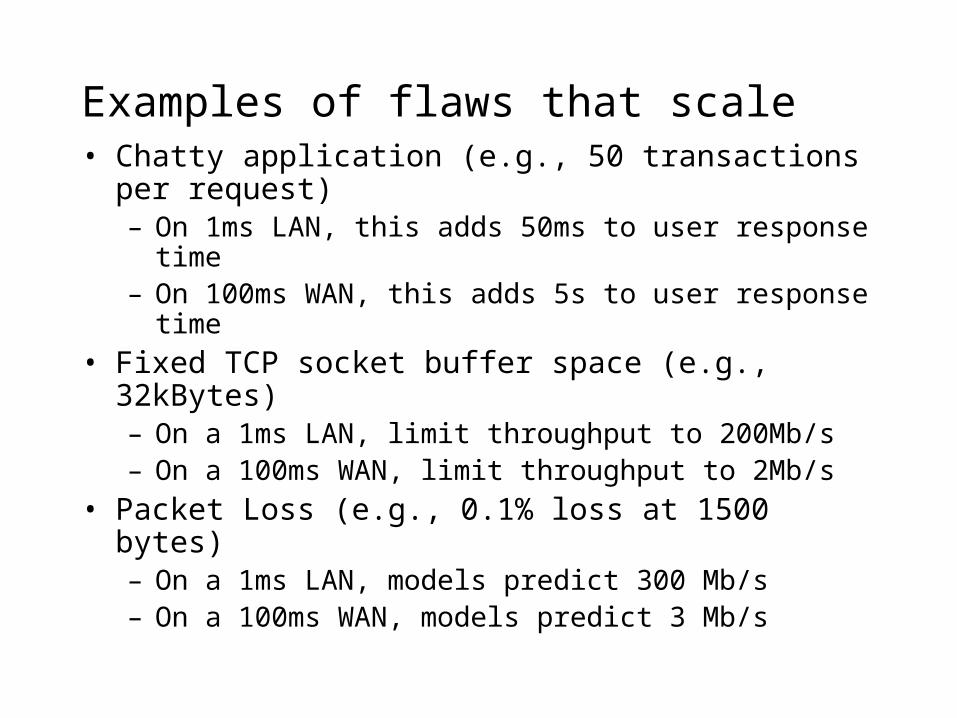
Examples of flaws that scale• Chatty application (e.g., 50 transactions per request)
– On 1ms LAN, this adds 50ms to user response time– On 100ms WAN, this adds 5s to user response time
• Fixed TCP socket buffer space (e.g., 32kBytes)– On a 1ms LAN, limit throughput to 200Mb/s– On a 100ms WAN, limit throughput to 2Mb/s
• Packet Loss (e.g., 0.1% loss at 1500 bytes)– On a 1ms LAN, models predict 300 Mb/s– On a 100ms WAN, models predict 3 Mb/s
Review• For nearly all network flaws
– The only symptom is reduced performance
– But this reduction is scaled by RTT
• On short paths many flaws are undetectable– False pass for even the best conventional diagnostics
– Leads to faulty inductive reasoning about flaw locations
– This is the essence of the “end-to-end” problem
– Current state-of-the-art diagnosis relies on tomography and complicated inference techniques

Our new tool: pathdiag• Specify End-to-End application performance goal
– Round Trip Time (RTT) of the full path– Desired application data rate
• Measure the performance of a short path section– Use Web100 to collect detailed statistics– Loss, delay, queuing properties, etc
• Use models to extrapolate results to full path– Assume that the rest of the path is ideal
• Pass/Fail on the basis of the extrapolated performance
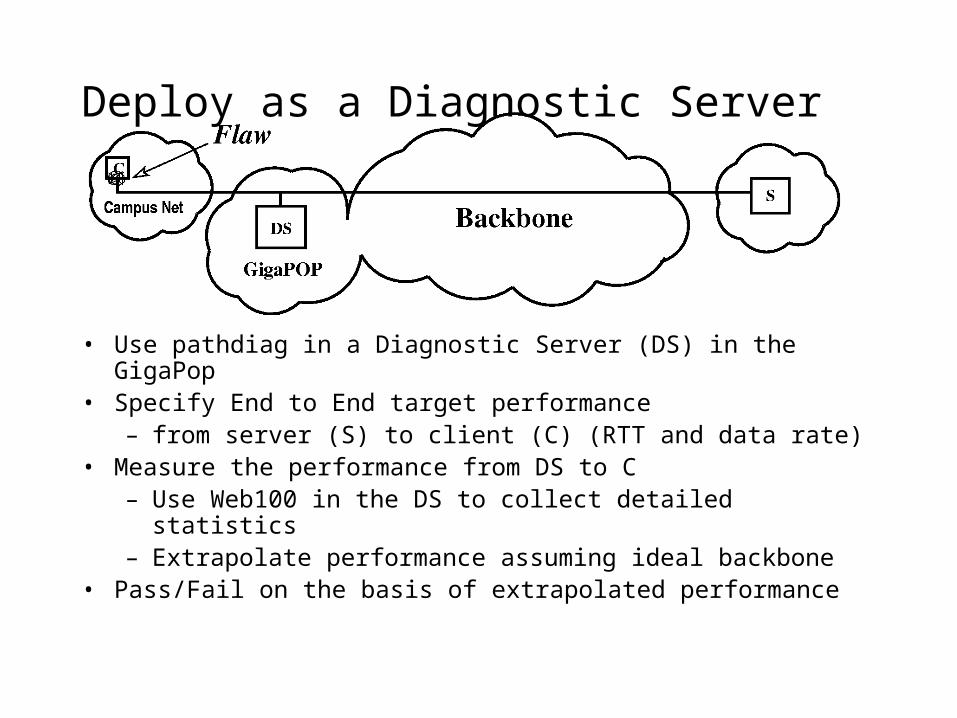
Deploy as a Diagnostic Server
• Use pathdiag in a Diagnostic Server (DS) in the GigaPop• Specify End to End target performance
– from server (S) to client (C) (RTT and data rate)• Measure the performance from DS to C
– Use Web100 in the DS to collect detailed statistics– Extrapolate performance assuming ideal backbone
• Pass/Fail on the basis of extrapolated performance
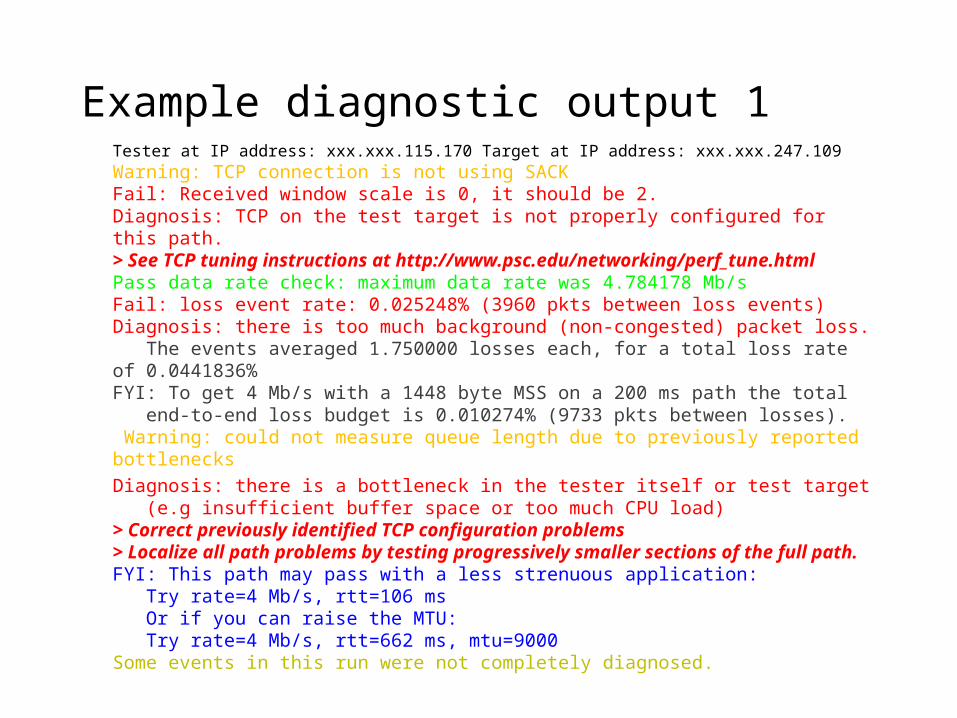
Example diagnostic output 1Tester at IP address: xxx.xxx.115.170 Target at IP address: xxx.xxx.247.109Warning: TCP connection is not using SACKFail: Received window scale is 0, it should be 2.Diagnosis: TCP on the test target is not properly configured for this path.> See TCP tuning instructions at http://www.psc.edu/networking/perf_tune.htmlPass data rate check: maximum data rate was 4.784178 Mb/sFail: loss event rate: 0.025248% (3960 pkts between loss events)Diagnosis: there is too much background (non-congested) packet loss. The events averaged 1.750000 losses each, for a total loss rate of 0.0441836%FYI: To get 4 Mb/s with a 1448 byte MSS on a 200 ms path the total end-to-end loss budget is 0.010274% (9733 pkts between losses). Warning: could not measure queue length due to previously reported bottlenecks
Diagnosis: there is a bottleneck in the tester itself or test target (e.g insufficient buffer space or too much CPU load)> Correct previously identified TCP configuration problems> Localize all path problems by testing progressively smaller sections of the full path.FYI: This path may pass with a less strenuous application: Try rate=4 Mb/s, rtt=106 ms Or if you can raise the MTU: Try rate=4 Mb/s, rtt=662 ms, mtu=9000Some events in this run were not completely diagnosed.
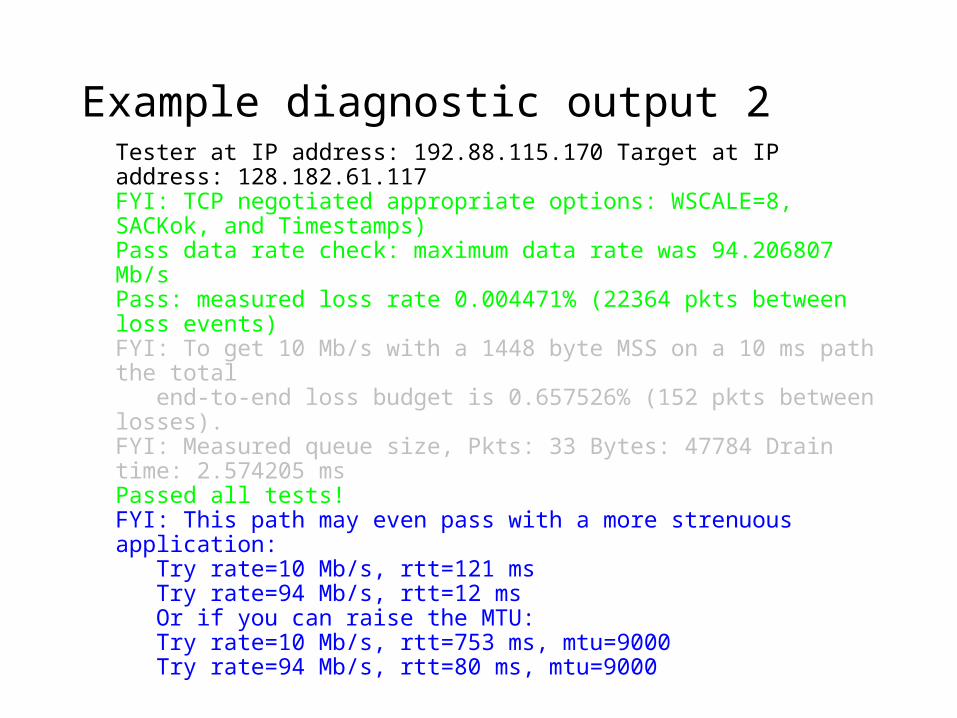
Example diagnostic output 2Tester at IP address: 192.88.115.170 Target at IP address: 128.182.61.117FYI: TCP negotiated appropriate options: WSCALE=8, SACKok, and Timestamps)Pass data rate check: maximum data rate was 94.206807 Mb/sPass: measured loss rate 0.004471% (22364 pkts between loss events)FYI: To get 10 Mb/s with a 1448 byte MSS on a 10 ms path the total end-to-end loss budget is 0.657526% (152 pkts between losses).FYI: Measured queue size, Pkts: 33 Bytes: 47784 Drain time: 2.574205 msPassed all tests!FYI: This path may even pass with a more strenuous application: Try rate=10 Mb/s, rtt=121 ms Try rate=94 Mb/s, rtt=12 ms Or if you can raise the MTU: Try rate=10 Mb/s, rtt=753 ms, mtu=9000 Try rate=94 Mb/s, rtt=80 ms, mtu=9000
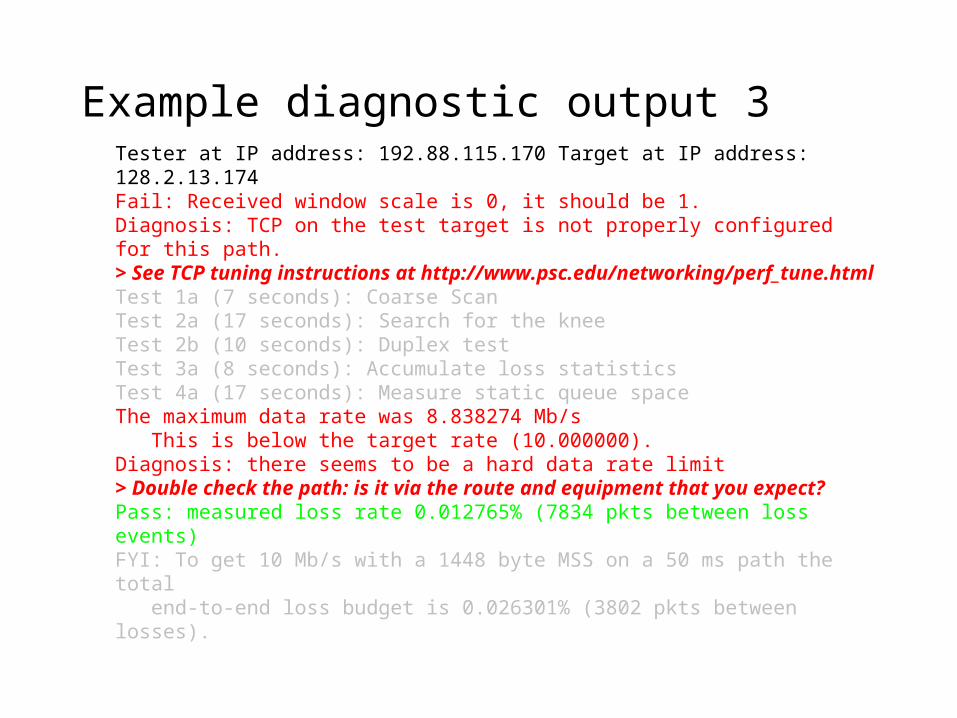
Example diagnostic output 3Tester at IP address: 192.88.115.170 Target at IP address: 128.2.13.174Fail: Received window scale is 0, it should be 1.Diagnosis: TCP on the test target is not properly configured for this path.> See TCP tuning instructions at http://www.psc.edu/networking/perf_tune.htmlTest 1a (7 seconds): Coarse ScanTest 2a (17 seconds): Search for the kneeTest 2b (10 seconds): Duplex testTest 3a (8 seconds): Accumulate loss statisticsTest 4a (17 seconds): Measure static queue spaceThe maximum data rate was 8.838274 Mb/s This is below the target rate (10.000000).Diagnosis: there seems to be a hard data rate limit> Double check the path: is it via the route and equipment that you expect?Pass: measured loss rate 0.012765% (7834 pkts between loss events)FYI: To get 10 Mb/s with a 1448 byte MSS on a 50 ms path the total end-to-end loss budget is 0.026301% (3802 pkts between losses).

Key DS features• Nearly complete coverage for OS and Network flaws
– Does not address flawed routing at all– May fail to detect flaws that only affect outbound data
• Unless you have Web100 in the client or a (future) portable DS
– May fail to detect a few rare corner cases– Eliminates all other false pass results
• Tests becomes more sensitive on shorter paths– Conventional diagnostics become less sensitive– Depending on models, perhaps too sensitive
• New problem is false fail (queue space tests)
• Flaws no longer completely mask other flaws– A single test often detects several flaws
• E.g. both OS and network flaws in the same test
– They can be repaired in parallel

Key features, continued• Results are specific and less geeky
– Intended for end-users– Provides a list of action items to be corrected
• Failed tests are showstoppers for high performance app.
– Details for escalation to network or system admins
• Archived results include raw data– Can reprocess with updated reporting SW
The future• Current service is “pre-alpha”
– Please use it so we can validate the tool• We can often tell when it got something wrong
– Please report confusing results• So we can improve the reports
– Please get us involved if it is non-helpful• We need interesting pathologies
• Will soon have another server near FRGP– NCAR in Boulder CO
• Will someday be in a position to deploy more– Should there be one at PSU?
What about flaws in applications?• NPAD is also thinking about applications• Using an entirely different collection of techniques
– Symptom scaling still applies
• Tools to emulate ideal long paths on a LAN– Prove or bench test applications in the lab
• Also checks some OS and TCP features
– If it fails in the lab, it can not work on a WAN

For example classic ssh & scp• Long known performance problems• Recently diagnosed
– Internal flow control for port forwarding
– NOT encryption
• Chris Rapier developed a patch– Update flow control windows from kernel buffer size
– Already running on most PSC systems
See: http://www.psc.edu/networking/projects/hpn-ssh/
NPAD Goal• Build a minimal tool set that can detect “every” flaw
– Pathdiag: all flaws affecting inbound data
– Web100 in servers or portable diagnostic servers:
All flaws affecting outbound data
– Application bench test: All application flaws
– Traceroute: routing flaws
• We believe that this is a complete set
http://kirana.psc.edu/NPAD/


![venkateswaran2010,9976316089,m.venkateswaran,m.venkates[Voting system1 ragu]](https://img.pdfslide.us/doc/110x75/540ce4e38d7f72747e8b4703/venkateswaran20109976316089mvenkateswaranmvenkatesvoting-system1-ragu.jpg)

