Embed Size (px)
Citation preview
Sains Malaysiana 44(11)(2015): 1643–1651
Performance Comparison between Bootstrap and Multiscale Bootstrap for Assessing Phylogenetic Tree for RNA polymerase
(Perbandingan Prestasi antara Butstrap dan Multiskala Butstrap untuk Menilai Pohon Filogenetik bagi RNA polymerase)
SAFINAH SHARUDDIN* & NORA MUDA
ABSTRACT
Phylogenetic inference refers to the reconstruction of evolutionary relationships among various species that is usually presented in the form of a tree. This study constructs the phylogenetic tree by using a novel distance-based method known as Modified one step M-estimator (MOM) method. The branches of the phylogenetic tree constructed were then evaluated to see their reliability. The performance of the reliability was then compared between the p-value of multiscale bootstrap (AU value) and bootstrap p-value (BP value). The aim of this study was to compare the performance between the AU value and BP value for assessing phylogenetic tree of RNA polymerase. The results have shown that multiscale bootstrap analysis can detect high sampling errors but not in bootstrap analysis. To overcome this problem, the multiscale bootstrap analysis has reduced the sampling error by increasing the number of replications. The clusters were indicated as significant if AU values or BP values were 95% or higher. From the analysis, the results showed that the BP and AU values differ at 11th and 15th branch of the phylogenetic tree. The BP values at both branches were 72 and 85%, respectively, thereby making the cluster not significant but by looking at the AU values, the two branches were more than 95% and the clusters were significant. This was due to the biasness in calculation of the probability of bootstrap analysis, therefore, the multiscale bootstrap analysis has improved the calculation of the probability value compared to the bootstrap analysis.
Keywords: Distance-based method; median absolute deviation (MADn); modified one-step M-estimator (MOM); phylogenetic inference
ABSTRAK
Pentaabiran filogenetik merujuk kepada pembinaan semula hubungan evolusi dalam kalangan pelbagai spesies yang biasanya dibentangkan dalam bentuk pohon. Dalam kajian ini, pohon filogenetik dibina menggunakan kaedah novel berdasarkan jarak yang dikenali sebagai kaedah Penganggar-M satu langkah terubah suai (MOM). Seterusnya penilaian ke atas pembinaan pohon filogenetik yang dibangunkan akan dinilai bagi menentukan kebolehpercayaan terhadap cabang yang terbentuk. Perbandingan cabang-cabang pohon filogenetik yang dibentuk dinilai dengan melihat nilai-p bagi kaedah multiskala butstrap (nilai AU) dan dibandingkan dengan nilai-p bagi kaedah butstrap (nilai BP). Tujuan utama kajian ini adalah untuk membandingkan prestasi antara nilai AU dan BP bagi menilai pohon filogenetik RNA polimerase. Keputusan mendapati bahawa analisis multiskala butstrap dapat mengesan ralat sampel yang tinggi berbanding analisis butstrap. Analisis multiskala butstrap mengurangkan ralat sampel ini dengan menambahkan bilangan replikasi. Kelompok dikatakan bererti sekiranya tahap keyakinan menunjukkan peratusan melebihi 95%. Hasil mendapati nilai BP dan AU berbeza pada cabang ke-11 dan ke-15 dengan nilai BP masing-masing adalah 72% dan 85% seterusnya menjadikan kelompok itu tidak bererti tetapi sebenarnya bererti dengan nilai AU iaitu kedua-dua cabang melebihi 95%. Ini adalah disebabkan oleh pengiraan nilai kebarangkalian bagi analisis butstrap adalah pincang. Oleh itu, analisis multiskala telah memperbaiki pengiraan nilai kebarangkalian bagi analisis butstrap.
Kata kunci: Kaedah berdasarkan jarak; median sisihan mutlak (MADn); penganggar-M satu langkah terubahsuai (MOM); pentaabiran filogenetik
INTRODUCTION
There are several popular computational methods used for phylogenetic inference, such as distance-based methods (i.e. UPGMA, neighbor joining), maximum parsimony, maximum likelihood and Bayesian. The distance-based methods are popular mainly due to their speed and generality. Thus, this article focuses on the distance-based method for phylogenetic inference. The most commonly
used and the simplest distance-based method namely the unweighted pair group method with arithmetic averages (UPGMA) was introduced by Michener and Sokal (1957) and its earliest version was popularized by Sokal and Sneath (1963). In this study, the modified one-step M-estimator (MOM) method was used in the clustering process for constructing a phylogenetic tree of RNA polymerase that was introduced by Muda et al. (2009). The MOM estimator

1644
has enhanced the UPGMA cluster algorithm by screening the outliers in the calculation of new distance to make it become more robust. Therefore, the phylogenetic inference using the selected methods should be evaluated to determine the level of confidence in the reliability of the branch support of a phylogenetic tree constructed. There are various methods that can be used to assess the phylogenetic tree such as bootstrap (Felsentein 1985), jackknife (Farris et al. 1996), permutation (Wilkinson 1994) and Bermer support (Bremer 1994). These methods generally provide a variety of ways to identify which branch support more or less on inferred tree. The bootstrap is the most popular method for evaluating the reliability of the branches of a phylogenetic tree. The general bootstrap procedure was introduced by Efron (1979) to infer the variability of an unknown distribution for an estimator T using computer-based methods. In 1985, Felsenstein first applied the bootstrap methods to phylogeny problems. Felsenstein constructed confidence limits on phylogenies to assess the confidence of phylogenetic tree by looking at bootstrap probability (BP) value. The BP, which is known as p-value, represents the probability that the branch on phylogenetic inference is correct (Felsenstein 1985). However, Hillis and Bull (1993) and Felsenstein and Kishino (1993) claimed that the BP value is biased and suggested more appropriate p-value is used to evaluate confidence level for phylogenetic tree in bootstrap method. Then Efron et al. (1996) introduced a method based on iterative bootstrapping to estimate more accurate p-value. Some alternative approaches have also been proposed to improve the biasness of the bootstrap probability such as by using the two-level bootstrap algorithm (1996), weighted boostrapping (2010) and multiscale bootstrap (2002). In 2010, Makarenkov et al. proposed a weighted bootstrapping on a pseudoreplication of the DNA or protein sequence to obtain a good quality of the phylogenetic inference (Table 1). In addition, Shimodaira developed multiscale bootstrap methods to assess the reliability of the branches of the character-based method on phylogenetic inference for DNA microarray data (2002). In this study, we adapt the multiscale bootstrap methods to distance-based method on phylogenetic inference for sequences of RNA polymerase.
MATERIALS AND METHODS
PHYLOGENETIC INFERENCE
In order to construct a robust phylogeny for RNA polymerase, we chose the MOM method. This method was developed by Muda et al. (2009) by applying the statistical method on the UPGMA method that was used. The MOM method was chosen for this study because there was weakness in the UPGMA method, namely lack of stability. This is because it applies the mean measurement on the distance matrix calculation, which is an important
aspect in phylogenetic inference based on the distance-based method. Therefore, the steps in the algorithm in the phylogenetic inference using the MOM and UPGMA methods can be seen as follows.
For MOM method, the steps in the algorithm are:
Let Dij be the distance between i-th and j-th protein sequence by using PAM matrix (Dayhoff 1978).
Find the i and j that have the smallest distance, Dij
Create a new group (ij), which has nij = ni + nj members where ni and nj refer to the number of group i and j.
Connect i and j on the tree to a new node (which corresponds to the new group (ij)). Give the two branches connecting i to (ij) and j to (ij) each length, b = dij/2.
Sort the distance, Dij in ascending order and denoted as xi and xj correspond to distance from groups i and j. Compute median for the nij members if there exist outliers by the MADn. using (1).
MADn = med⎟xi – medjxj⎟. (1)
If ⎟xi – median(xj)⎟>2.24* MADn, there is an outlier. Discard from the calculation of the MOM estimator.
Let be the MOM estimator. Then, compute the distance between the new groups (except for i and j) denoted as Y by using (2) after discarding the outliers (if any).
(2) Delete the columns and rows of the data matrix that correspond to groups i and j and add a column and row for group (ij).
If there is only one item in the data matrix, stop. Otherwise, return to step 1.
Then, the steps in the UPGMA method algorithm are:
Let Dij be the distance between i-th and j-th protein sequence by using PAM matrix (Dayhoff 1978).
Find the i and j that have the smallest distance, Dij
1645
Create a new group (ij), which has nij = ni + nj members where ni and nj refer to the number of group i and j.
Connect i and j on the tree to a new node (which corresponds to the new group (ij)). Give the two branches connecting i to (ij) and j to (ij) each length, b = dij/2.
Compute the distance between the new group and all the other groups (except for i and j) using (3) where dij is the distance between i in cluster A and j in cluster B. The branch point between the two clusters is given by b = dij/2.
(3)
Delete the columns and rows of the data matrix that correspond to groups i and j and add a column and row for group (ij).
If there is only one item in the data matrix, stop. Otherwise, return to step 1.
We can see the differences using MOM method and UPGMA method in step 4 for both algorithms. In step 4 for MOM method algorithm, modification has been made in (3) by implementing a checking process to detect outliers using the modified one-step M-estimator (MOM).
BOOTSTRAP ANALYSIS AND MULTISCALE BOOTSTRAP ANALYSIS
In order to test the reliability of support of phylogenetic inference using the MOM method, which is a distance-based method, bootstrap (Felsenstein 1985) and multiscale bootstrap (Shimodaira 2002) were evaluated. The performance of the reliability was then compared between the AU value for multiscale bootstrap analysis and the BP value for bootstrap analysis. The AU and BP value were denoted as probability value (p-value) to measure the uncertainty in the phylogenetic inference. First, let X be a set of n species of RNA polymerase and T be a phylogenetic inference. In this study, we chose the MOM method to construct the phylogenetic tree. Then the bootstrap and multiscale bootstrap analysis were performed. The multiscale bootstrap is an attempt to reduce the test bias of the BP and calculates an approximately unbiased (AU) p-value. A brief description for each algorithm of phylogenetic support method is given below. We first elaborate on the bootstrap method and the algorithm as follows:
Input data, X is RNA polymerase has undergone multiple sequence alignment.
Generate B bootstrap replicates X1*, X2
*, …, XB*.
Suppose T is initial tree which is represented phylogenetic inference and (X*) or (X1
*), (X2*), …, (XB
*) is bootstrap tree. Then, count how many times each tree topology is found in bootstrap tree and denoted as (X*) = T.
Calculate the frequency of observing (X*) = T denoted as C(T) = #{ (X*) = t, b = 1, 2, …, B}.
Finally calculate BP value using (4).
BP = C(T)/B, (4)
where C(T) = #{ (X*) = T, b = 1, 2, …, B} is the frequency of observing (X*) = T.
After looking into the bootstrap algorithm, let us move on to the multiscale bootstrap algorithm. The only difference between these two is the length/duration of sequence of the bootstrap replication. Therefore, this disparity can be clearly seen in the second step of the multiscale bootstrap algorithm. The multiscale bootstrap algorithm is shown as follows:
Input data, X is RNA polymerase has undergone multiple sequence alignment.
Suppose N is a sample of the original data while N is a bootstrap sample where N < N, N = N and N > N.
Let = N/N be the relative sequence length of the bootstrap replicates and K be the number of bootstrap simulation. Then, specify the scaling constant r1, r2,…, r4 and the number of replicates B1, B2, …, BK for K ≥ 2 bootstrap replicates.
Generate Bk bootstrap replicates with sequence length N = rkN for k = 1, 2, …, K to obtain K sets of B bootstrap replicates, X*1(rk), X
*2(rk), …, X*Bk(rk)
Calculate the observed BP values by fitting theoretical curve using (5) to estimate c and d where Φ the standard normal distribution function is:
BPr = (5)
Calculate the AU p-value by using (6).
AU = (6)
RESULTS AND DISCUSSION
In order to analyse the data, we used the built-in functions available in R version 2.12.2 (http://www.R-project.org/), which is a free statistical programming language. The package PVCLUST in the statistical software R, created by Suzuki and Shimodaira (2006), was used and modification was done to calculate the AU p-value for distance-based method based on MOM on phylogenetic inference. The PHANGORN package developed by Schliep (2010) was also used to ease data improvisation to the form that is needed on the multiscale bootstrap sampling part in the algorithm of the phylogenetic tree evaluation/assessment. The bootstrap analysis and the multiscale bootstrap analysis with 1000 replications (B=1,000) was done on the RNA polymerase protein sequence. The result of the
1646
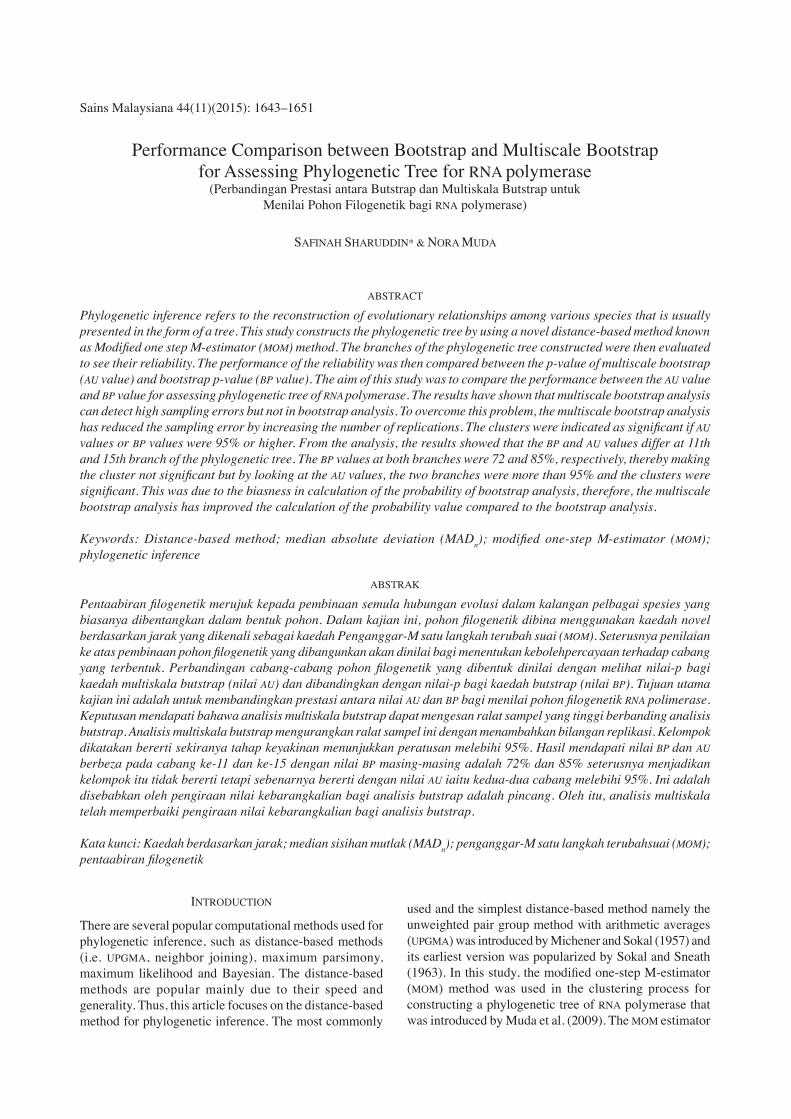
analysis can be seen in Figure 1 and Table 2. Figure 1 shows the result of the consensus tree using the MOM method with AU and BP value on each cluster that was generated in units of percentage. The AU value was on the right side of the edge while the BP value was on the left side of the edge. The numbers below the edge represent the number sequence of the cluster formation. Null hypothesis, H0 that was tested on the phylogenetic inference for Figure 1 shows inexistent cluster. On the other hand, the alternative hypothesis H1 shows that the cluster exists.
H0 : The cluster does not exist H1 : The cluster exists
As for the cluster with AU and BP value of > 95%, the null hypothesis which was the cluster that did not exist was pushed to the level of confidence of 0.05. This means that it was believed that 95% of the cluster exists significantly. In Figure 1, the clusters with AU and BP value higher than 95% were 1, 2, 3, 4, 8, 16, 20, 21 and 23. This made them a significant cluster. As for cluster 12, the AU and BP values
FIGURE 1. Phylogenetic tree of RNA polymerase using MOM method (B=1000 replications)
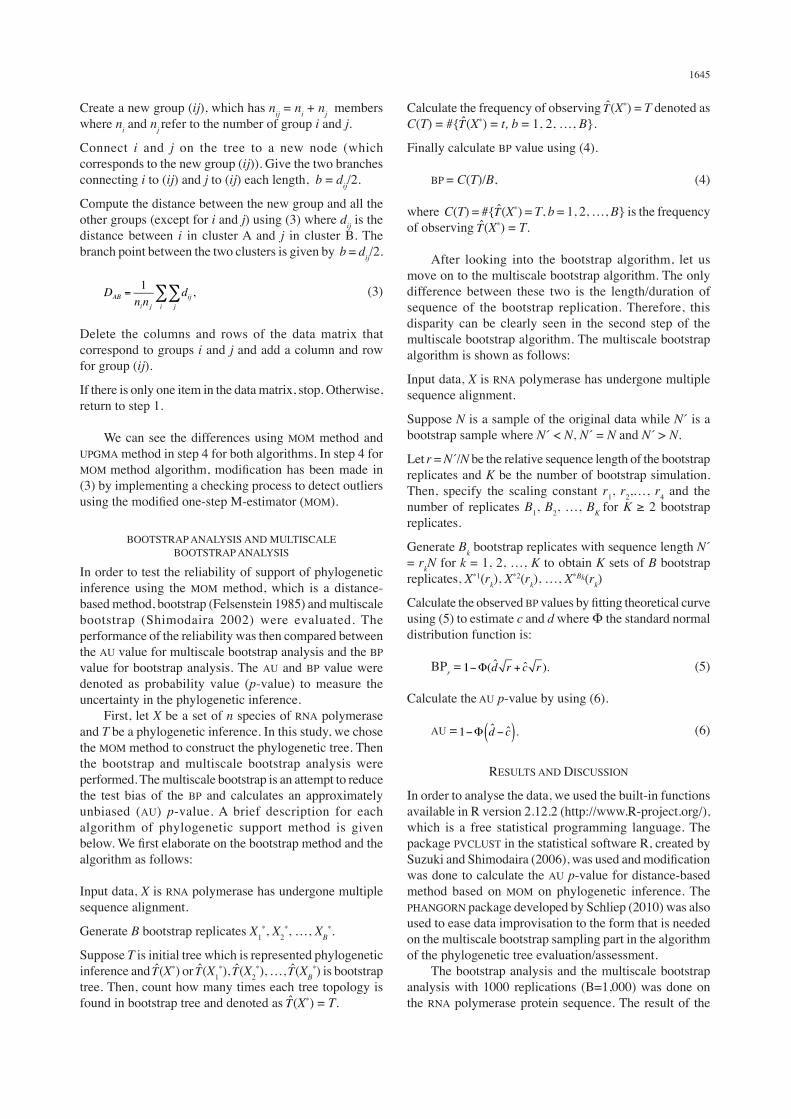
TABLE 1. Protein sequence of RNA polymerase
ID Name of bacteria % Identity LengthP22703Q3M5D0P77965Q8DL55Q7NIAOQ2JJ19Q7D5P1Q318Q7Q3AZA4Q7VA29Q3A9Q7Q2RFN9Q8R7U6Q97EG9Q47LI5Q82DQ5POA680Q6A6K6Q2JFI5Q31N17Q2JX64Q7V006Q46J22Q7U8K4
Nostoc sp. PCC 7120A. variabilis ATCC 29413Synechocystis sp. PCC 6803S. elongatusS. elongatus PCC 7942G. violaceusSynechococcus sp. JA-3-3Ab
Synechococcus sp. JA-2-3B’a(2-13)P. marinus str. MIT 9313Synechococcus sp. CC9902Synechococcus sp. WH 8102P. marinusP. marinus str. NATL 2AP. marinus str. MIT 9312P. marinus subsp. Pastoris str. CCMP1986T. tengcongensisC. hydrogenoformans Z-2901M. thermoacetia ATCC 39073C. acetobutyliaumFrankia sp. Ccl3S. avermitilisT. fusca YXM. tuberculosisP. acnes
1009984838382818076757575757575646262605555555452
113111171102110811121139109710971097109611321141123412411155118111781159114111001133109710951097
1647
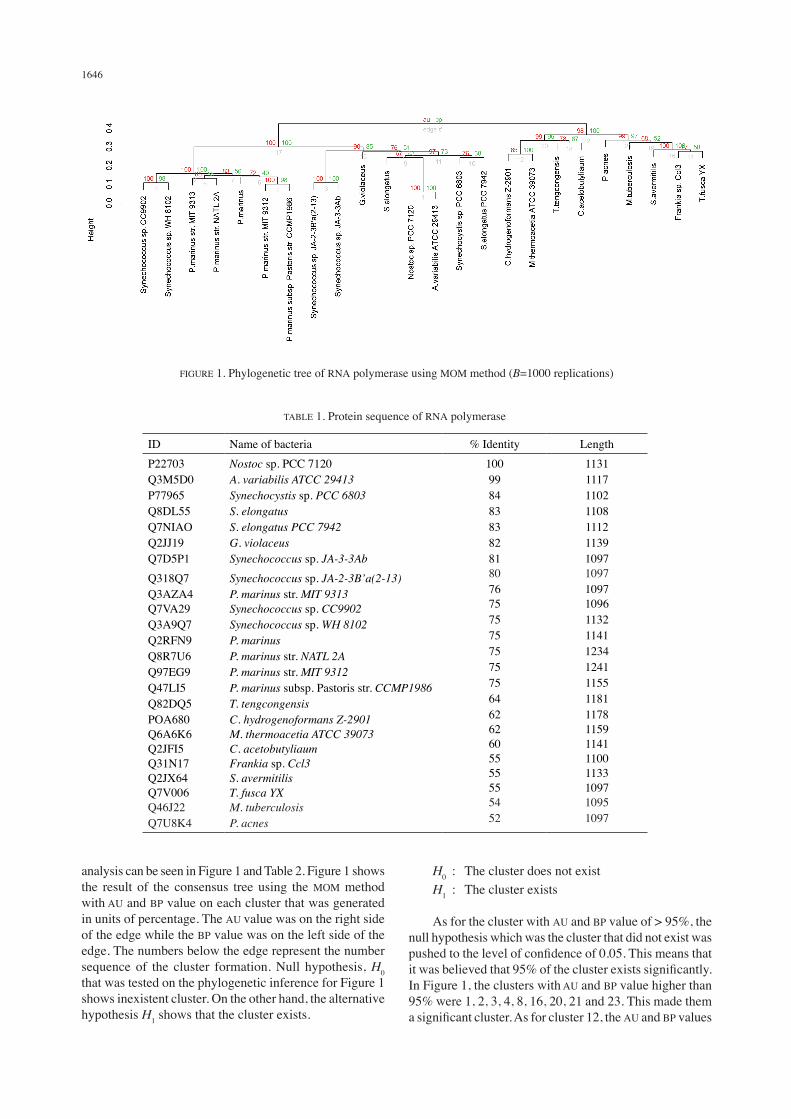
produced different results where its AU value made the cluster insignificant, and the BP value the opposite. The clusters on edge 12 were 16 and 17 namely the clusters of C. hydrogenoformans Z-2901 bacteria and M. thermoacetia ATCC 39073 bacteria, respectively. In order to see the performance difference of the analytical methods, we should observe the results in more detail. Table 2 shows the result of the analysis using the bootstrap method and multiscale bootstrap method in detail for each cluster that was formed. A detailed explanation on the AU, BP value, standard error for AU value, standard error for BP value and the confidence interval for AU value can be seen in Table 2. After discovering that there was a difference in the results of the analysis on cluster 12, focus was given by looking at the detailed result of the cluster. Looking at Table 2, the result of cluster 12 shows that the standard error for the AU value was very high than those for other clusters. On the other hand, the standard error for BP value of the cluster was almost similar to other clusters. This is clearly seen on Figures 2 and 3 that display the standard error plot versus the respective AU and BP value. Figure 2 shows that the standard error for AU value was very high and clear on cluster 12 compared to other clusters. Meanwhile, Figure 3 shows the situation that was different than those in Figure 2 where the standard error for BP value for cluster 12 was not too high compared to other clusters. This occurred due to the distortion in the calculation of BP value in the bootstrap analysis. This means that the performance of the multiscale bootstrap
method in measuring uncertain elements for the suggested hypotheses by using the AU value is better and less biased compared to those for the BP value. The existence of high sampling error for the AU value will cause the AU value to diverge from the assumption theory made. As explained in (5), the AU value is assumed to be scattered normally, whereby the standard and the confidence interval for the AU value should be at interval (0,1). Therefore, attention is given to cluster 12 and it
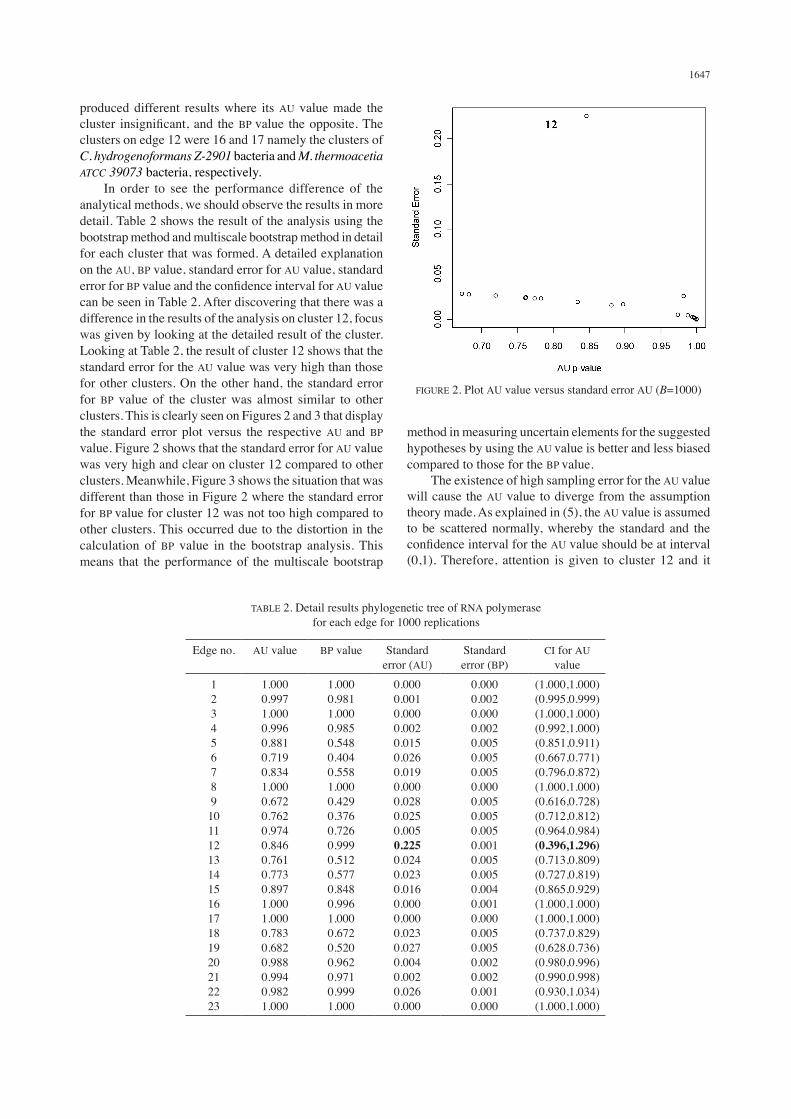
TABLE 2. Detail results phylogenetic tree of RNA polymerase for each edge for 1000 replications
Edge no. AU value BP value Standarderror (AU)
Standarderror (BP)
CI for AU value
1234567891011121314151617181920212223
1.0000.9971.0000.9960.8810.7190.8341.0000.6720.7620.9740.8460.7610.7730.8971.0001.0000.7830.6820.9880.9940.9821.000
1.0000.9811.0000.9850.5480.4040.5581.0000.4290.3760.7260.9990.5120.5770.8480.9961.0000.6720.5200.9620.9710.9991.000
0.0000.0010.0000.0020.0150.0260.0190.0000.0280.0250.0050.2250.0240.0230.0160.0000.0000.0230.0270.0040.0020.0260.000
0.0000.0020.0000.0020.0050.0050.0050.0000.0050.0050.0050.0010.0050.0050.0040.0010.0000.0050.0050.0020.0020.0010.000
(1.000,1.000)(0.995,0.999)(1.000,1.000)(0.992,1.000)(0.851,0.911)(0.667,0.771)(0.796,0.872)(1.000,1.000)(0.616,0.728)(0.712,0.812)(0.964,0.984)(0.396,1.296)(0.713,0.809)(0.727,0.819)(0.865,0.929)(1.000,1.000)(1.000,1.000)(0.737,0.829)(0.628,0.736)(0.980,0.996)(0.990,0.998)(0.930,1.034)(1.000,1.000)
FIGURE 2. Plot AU value versus standard error AU (B=1000)

1648
was found that the confidence interval for the AU value of the branch is not at interval (0,1). This explains that the AU value that was obtained from the branch can still be doubted. To overcome this, the sampling error has to be stabilised. The high occurrence of sampling error is caused by the insufficient selection in the number of bootstrap replication. Thus, the problem on high sampling error can be stabilised by having additional number of replicates. In this study, 1000 replicates that were earlier used were not enough. Therefore, the analysis was repeated by adding in the number of replication from 1000 to 10000 replications. After adding in the number of replications, the AU and BP value plots overwhelm the standard error, respectively and this can be seen in Figures 4 and 5. In Figure 4, all clusters obtained a standard error of less than 0.01 and no higher error was detected on cluster 12. Meanwhile, Figure 5 shows the standard error plot for the BP value versus another BP value shows similar results as those before the additional replications were made in Figure 2. In addition, a detailed result for the bootstrap and the multiscale bootstrap analyses can also be seen in Table 3. The confidence interval of 95% for the AU value on cluster 12 was at interval (0,1). This shows that the estimated AU value fulfilled the normal theory standard. This is evident that the high sampling error can be reduced by adding in the number of replication. Thus, all standard error for the AU value can be stabilised and less biased compared to BP value, and the AU value cannot be further doubted. After the problem of sampling error is solved, a comparison of the bootstrap and multiscale bootstrap analyses was made to see the difference between the BP and AU value that determines the significant cluster with confidence of 95%. By looking at the BP values in Figure 6, the cluster that was said to be significant at edges 1, 2, 3, 4, 8, 12, 16, 17, 20, 21 and 22, while the AU value for the cluster that was said to be significant was at edges
1, 2, 3, 4, 8, 11, 12, 15, 16, 17, 18, 20, 21 and 22. The disparity can be seen at edges 11 and 15. The BP value for edges 11 and 15 of 72 and 85%, respectively, was said to be insignificant at confidence of 95%, yet the AU value for both clusters was significant. Therefore, the issue on the simulation study, which claimed that a small value of 70% for BP value that was said to be significant by Li and Zharkikh (1994) and Zharkikh and Li (1992) which can be supported by this study. This is due to the biased BP value caused by the calculation of its probability value and the AU value has proven to be effective in overcoming the biasness. The conclusion and interpretation that can be made from the observation on the difference in the performance is that the clusters that exist based on the BP value can only be said to be ‘almost existent’ due to the sampling error. Moreover, this sampling error can be detected by the AU
FIGURE 3. Plot BP value versus standard error BP (B=1000) FIGURE 4. Plot AU value versus standard error AU (B=10000)
FIGURE 5. Plot BP value versus standard error BP (B=10000)

1649
value. Thus, the AU value has overcome the biasness of the BP value. After knowing that the performance shown through the multiscale bootstrap is better than the one through the bootstrap method, the AU value was chosen to observe the performance in evaluating the confidence level on the phylogenetic inference that was used. In this study, the chosen phylogenetic inference was the MOM method and was compared with the existing method namely UPGMA.
An evaluation was made to see the performance of the multiscale method in order to support the claim on the efficiency of the MOM method in identifying the existence of remote data as well as improving the existing method namely UPGMA. Figures 6 and 7 shows the result of the consensus tree through the MOM and UPGMA methods for 10000 bootstrap replications. Focus is only given on the AU value, which is the value on the upper left side of the edge. The AU value is said to be significant when it is more
TABLE 3. Detail results phylogenetic tree of RNA polymerase for each edge for 10000 replications
Edge no. AU value BP value Standard error (AU)
Standard error (BP)
CI for AU value
1234567891011121314151617181920212223
1.0000.9971.0000.9960.8640.7200.8311.0000.6430.7150.9671.0000.7430.7410.9131.0001.0000.7570.6740.9820.9940.9991.000
1.0000.9801.0000.9850.5510.4040.5581.0000.4250.3780.7251.0000.5120.5730.8460.9961.0000.6760.5260.9590.9671.0001.000
0.0000.0000.0000.0010.0050.0080.0060.0000.0090.0080.0020.0000.0080.0080.0050.0000.0000.0080.0090.0020.0010.0010.000
0.0000.0010.0000.0000.0020.0020.0020.0000.0020.0020.0020.0000.0020.0020.0010.0000.0000.0020.0020.0010.0010.0000.000
(1.000, 1.000)(0.997, 0.997)(1.000, 1.000)(0.994, 0.998)(0.854, 0.874)(0.704, 0.736)(0.819, 0.843)(1.000, 1.000)(0.625, 0.661)(0.699, 0.731)(0.963, 0.971)(1.000, 1.000)(0.727, 0.759)(0.725, 0.757)(0.903, 0.923)(1.000, 1.000)(1.000, 1.000)(0.741, 0.773)(0.656, 0.692)(0.978, 0.986)(0.992, 0.996)(0.997, 1.001)(1.000, 1.000)
FIGURE 6. Phylogenetic tree of RNA polymerase using MOM method (B=10000 replications)

1650
than 95% with a confidence level of 0.05. Thus, similar clusters that are formed for both phylogenetic inferences are found to be significant. Meanwhile, the different cluster formed on edge 19 is found to be insignificant and its confidence can be doubted. This is evident that the AU value can strengthen the claim that there are remote data at the edge and this was detected through the MOM method by making the cluster insignificant.
CONCLUSION
The findings showed that the multiscale bootstrap analysis can improve the biasness in the probability value that resulted from the bootstrap analysis results for the phylogenetic inference using the distance-based method. This is not only seen clearly when character-based method, namely the maximum likelihood method, is used but also on distance-based method. Moreover, the selection of the number of bootstrap replication plays an important role in obtaining a more accurate result at the evaluation stage of the phylogenetic tree. Insufficient number of bootstrap replication will lead to high sampling error to the cluster that is said to be existing significantly.
ACKNOWLEDGEMENTS
This work was supported by Research University Grant of the Universiti Kebangsaan Malaysia (UKM-GUP-NBT-08-02, UKM-GGPM-ICT-115-2010). Funding for open access charge: Universiti Kebangsaan Malaysia (UKM-GGPM-ICT-115-2010).
REFERENCES
Bremer, Kr. 1994. Branch support and tree stability. Cladistics 10: 295-304.
Dayhoff, M.O. 1978. Survey of new data and computer methods of analysis. Atlas of Protein Sequence and Structure 5(3): 9.
Efron, B. 1979. Bootstrap methods: Another look at the jackknife. Ann. Stat. 7: 1-26.
Efron, B., Halloran, E. & Holmes, S. 1996. Bootstrap confidence levels for phylogenetic trees. Presented at Proc. Natl. Acad. Sci. U.S.A.
Farris, J.S., Albert, V.A., Källersjö, M., Lipscomb, D. & Kluge, A.G. 1996. Parsimony jackkniffing outperforms neighbor-joining. Cladistics 12: 99-124.
Felsenstein, J. 1985. Confidence limits on phylogenies: An approach using the bootstrap. Evolution 39: 783-791.
Felsenstein, J. & Kishino, H. 1993. Is there something wrong with the bootstrap on phylogenies? A reply to Hillis and Bull. Syst. Biol. 42: 193-200.
Hillis, D.M. & Bull, J.J. 1993. An empirical test of bootstrapping as a method for assessing confidence in phylogenetic analysis. Syst. Biol. 42: 182-192.
Li, W.H. & Zharkikh, A. 1994. What is the bootstrap technique? Syst. Biol. 43: 424-430.
Makarenkov, V., Boc, A., Xie, J., Peres-Neto, P., Lapointe, F-J. & Legendre, P. 2010. Weighted bootstrapping: A correction method for assessing the robustness of phylogenetic trees. BMC. Evol. Biol. 10: 250.
Michener, C.D. & Sokal, R.R. 1957. A quantitative approach to a problem in classification. Evolution 11: 130-162.
Muda, N., Othman, A.R., Najimudin, N. & Hussein, Z.A.M. 2009. The phylogenetic tree of RNA polymerase constructed using MOM method. International Conference of Soft Computing and Pattern Recognition, Malacca. pp. 484-489.
Schliep, K.P. 2010. Phangorn: Phylogenetic analysis in R. Bioinformatics 27: 592-593.
Shimodaira, H. 2002. An approximately unbiased test of phylogenetic tree selection. Syst. Biol. 51: 492-508.
Sokal, R.R. & Sneath, P.H.A. 1963. Principles of Numerical Taxonomy. San Francisco, CA: W.H. Freeman.
Suzuki, R. & Shimodaira, H. 2006. Pvclust: an R package for assessing the uncertainty in hierarchical clustering. Bioinformatics 22: 1540-1542.
Wilkinson, M. 1994. The permutation method and character compatibility. Syst. Biol. 43: 274-277.
Zharkikh, A. & Li, W.H. 1992. Statistical properties of bootstrap estimation of phylogenetic variability from nucleotide
FIGURE 7. Phylogenetic tree of RNA polymerase using UPGMA method (B=10000 replications)

1651
sequences. I. Four taxa with a molecular clock. Mol. Biol. Evol. 9: 1119-1147.
School of Mathematical SciencesFaculty of Science and TechnologyUniversiti Kebangsaan Malaysia43600 Bangi, Selangor Darul Ehsan Malaysia
*Corresponding author; email: [email protected]
Received: 19 January 2014Accepted: 15 June 2015