Embed Size (px)
Citation preview
1
Performance-based analysis of large steel truss roof structure in fire
Limin Lu1,2
, Guanglin Yuan1, Zhaohui Huang
3,*, Qianjin Shu
2, Qing Li
2
1 State Key Laboratory for Geomechanics and Deep Underground Engineering, China University of
Mining and Technology, Xuzhou, 221116, China
2 Department of Architecture and Civil Engineering, China University of Mining & Technology,
Xuzhou, Jiangsu 221116, China
3 Department of Mechanical, Aerospace and Civil Engineering, Brunel University, Uxbridge,
Middlesex UB8 3PH, UK
Abstract
Due to the fast developments of large-space multi-functional architectures, large-span steel
structures have been widely used in recent years. Therefore, the fire-resistance design of this kind of
structures has attracted more attentions. Since traditional ISO834 standard fire curve is not suitable
for large space structures, performance-based fire resistance design method is required. This paper
presents the comprehensive case studies on the fire performance of a large space exhibition centre
in Shanxi province, China under real fire scenarios including heating and cooling phases. The
non-uniform fire temperature fields of the large space exhibition centre for the designed fire
scenarios have been generated by using Fire Dynamic Simulator (FDS). A finite element (FE) model
has been developed using FE software ANSYS for modelling the structural behaviour of the
exhibition centre under different fire scenarios. Based on the results generated in this research some
recommendations for the fire resistance design of large space steel truss structures have been
proposed.
Keywords: Performance-based; fire-resistance; large steel truss structure; fire scenario; local
cooling; structural behaviour.
____________________________ 3,*
Corresponding author. E-mail address: [email protected] (Z. Huang)

2
Highlights:
Conduct a comprehensive case study on the fire behaviour of an exhibition centre.
Generate the temperature fields of the fires and structural members in the building.
Simulate the structural behaviours of the exhibition centre under different fires.
Propose some design recommendations for large space structures against fire.

3
1. Introduction
With the developments of technology and economy, a variety of complex and large-scale buildings
are getting more and popular. Larger span steel structures are adopted to satisfy the requirements of
modern architectural designs. Thus, traditional –prescriptive- design method cannot meet the actual
needs of constructions, especially for the fire resistance design of large space buildings, such as
exhibition halls, stadiums, theatres, tall sharing spaces, and so on. Previous researches [1, 2]
indicate that prescriptive methods are sometimes too conservative or not safe enough for the
structural fire engineering design of large-scale buildings. Therefore, at present performance-based
design method is recommended for the fire resistance design of this kind of buildings, which has
been proved by many researches and practical experience [3]. In the performance-based fire
resistance design, the fire behaviour of a building should be analysed based on the space and
structural character of the building and real fire scenarios that building may undergo [4]. The
temperature field of the real fire scenarios in a large-scale building should be analysed and then
coupled into the structural performance study of that building [5].
Compared to normal office buildings, a fire within a large space structure happens in a limited area
within the building and the hot air only influences that part of the building’s space. The temperature
field within a large space structure is much more different than that a normal office building. Therefore,
the standard temperature-time curve is not suitable to represent the temperature distribution within
large space structures. Du and Li [6], Xue et al. [7] and Fan et al. [8] have developed the numerical
models for predicting temperature fields of the fires in large space buildings based on the fire
development using Fire Dynamics Simulator (FDS) [9]. The models mentioned above can more
accurately simulate the temperature distribution of the fires within large space structures. However,
these models do not consider the cooling process of a fire.
Currently, the researches on the structural response of large space steel truss structures under real
fire scenarios are still limited, especially considering whole heating-cooling process. Liu et al. [10]
carried out the full scale fire tests on two steel truss structures. The research indicated that the
damage of planar circular steel tube truss was mainly caused by the local yielding of the web tubes.
With the increase of load ratio, the fire resistance of a planar circular steel tube truss decreases

4
gradually. Moreover, Zhao and Shen [11] have developed a numerical model by using finite
element software ABAQUS to predict the fire resistance of the planer steel tube truss structures and
the results showed that the fire-resistance of the structures decreased with increasing temperature
and load ratio.
Li et al. [12, 13] have developed a finite element model by using ABAQUS for analysing the
non-linear fire performance of steel frames. The model took into account the material and geometric
nonlinearities, and non-uniform temperature field within steel frames. Yin and Wang [14, 15] have
done a series of researches on the fire resistance of steel beams. However, the researches mentioned
above didn’t consider the characteristic of a fire in large space structures. From the authors’
knowledge, the researches on the fire performance of large space steel tube truss structures under
real fire scenarios are still very limited and further researches are needed. Therefore, the main
objectives of this research are:
Conduct a comprehensive case study by using performance-based approach on the fire
resistance of a large space exhibition centre in Shanxi province, China under real fire
scenarios including heating and cooling phases;
Generate the non-uniform fire temperature fields of a large space exhibition centre for the
designed fire scenarios by using FDS finite element package [9];
Calculate the temperatures of the structural members within the large-space steel truss
structure based on the local fire temperature fields. Then a finite element (FE) model is
developed using FE software ANSYS. The non-uniform temperatures of different structural
members within the large space exhibition centre are inputted into the FE model to simulate
the structural behaviour of the exhibition centre under different fire scenarios;
Give a comprehensive demonstration for practical engineers to show how fire resistance of a
large-space steel truss structure can be assessed based on performance-based fire design
approach;
Propose some recommendations for the fire resistance design of large space steel truss
structures.

5
2. Fire scenarios design for large space structures
2.1. Project overview
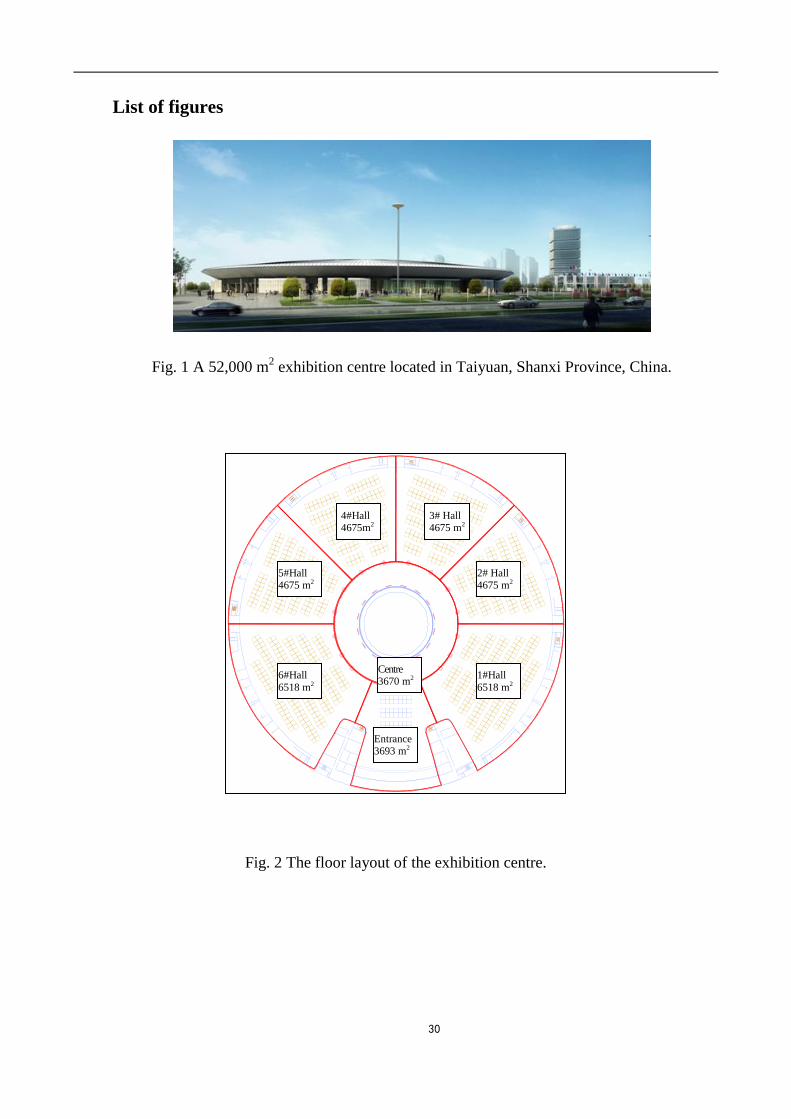
Fig. 1 shows a 52,000 m2 exhibition centre located in Taiyuan, Shanxi Province, China. This
exhibition centre was used in this paper for the comprehensive case study on the thermal and
structural behaviours of a large space exhibition centre. The exhibition centre is a typical large
space frame structure with a large-span roof constructed with steel trusses. As shown in Fig 2 the
building is composed by two circles, with an out circle of 229 m in diameter and an inner circle of
50 m in diameter. The total area of the first layer is 46600 m2 and was designed to be one
fireproofing zone. As an exhibition centre, it consists of six exhibition halls (the area of 1# and 6# is
6518 m2 and that of 2# to 5# is 4675 m
2), a main entrance hall (3693 m
2) and a circle gallery (3670
m2) in the inner centre. The whole roof of the building was constructed by spatial intersection steel
trusses into an arc structure. The lowest position on the bottom chord of the steel truss structure is
12 m and the highest point on the steel truss structure is 26 m.
It can be seen that the area of the fireproofing zone is much larger than the requirements specified
by the Chinese code for fire protection design of buildings (GB 50016-2014) [16], which is 10000
m2 for maximum. The maximum evacuation distance of 114.5 m, which is the radius of the out
circle of the building, is also larger than the value specified by the code. Therefore, it is needed to
adopt performance-based approach for the fire-resistance design of such large buildings.
According to the Chinese fire safety design codes [16, 17], the performance-based fire resistance
designed approach for this lager space exhibition centre is needed. The detail procedures are:
(1) To determinate typical upper-bound and lower-bound design fire scenarios and
corresponded fire temperature distribution histories within a structure;
(2) Calculate the temperature fields for all structural members inside the structure for the
required fire exposing time;
(3) Compute the loading conditions of the structure, which take into account the load
combination effect according to the Chinese codes;

6
(4) Conduct structural modelling to calculate the deflections, forces, stresses for all structural
members under each fire condition;
(5) Check the fire resistance of the structure based on the deflection and ultimate load bearing
capacities of the structural members and the stability of the whole structure;
(6) Determinate structural members’ sizes or apply the fire protection to certain structural
members until the structure fulfils the fire resistance requirements.
2.2. Design of fire scenarios
Fire scenario design is one of the most critical processes during performance-based fire resistance
design. It should be designed based on the most unfavourable principles, including: the design of
fire load, the location and area of fire sources, the model of fire development and the maximum heat
release rate (HRR) of a fire.
2.2.1. Fire sources
As an exhibition centre, the main fire source should be the exhibits. The magnitude of fire load of
combustible materials differs for various location and quantities. According to Fire Engineering
Design Guide [5], the fire load of general auto exhibition is 200 MJ/m2, furniture exhibition is 500
MJ/m2, machinery exhibition is 80 MJ/m
2 and art exhibition is 200 MJ/m
2. Under an overall
consideration, the furniture exhibition was adopted in this study.
Since the top of the circle gallery of the exhibition centre is an open space, if the fires occur in the
areas near the centre, the hot air can be ventilated to the outside of the building directly, so fire
sources occurring in or near the circle gallery were not investigated in this paper. From the floor
layout shown in Fig. 2, it can be seen that the fires occurring near the entrance hall will directly
affect the occupant’s evacuation and are more dangerous. Moreover, the height of exhibition
platform within the exhibition centre is 3 m to 4 m, so in this study the height of the fire location
was set to be 4 m. Based on above discussions, two fire source locations were assumed in the
exhibition centre, as shown in Fig. 3:
(1) Fire source A: The fire occurred on the exhibition platform near the out wall of 5# Hall.

7
(2) Fire source B:The fire occurred on the exhibition platform in the centre of 6# Hall.
2.2.2. Fire development model and maximum heat release rate
The fire development within a large space is very complex problem, normally in the
performance-based fire-resistance design some conservative assumptions are made for the fire
spread. Therefore, in this research the fire development curve was assumed to be constant after the
heat release rate reached to the maximum value as shown in Fig. 4 [7], ignoring the decay period of
the fire source.
The fire development model can also be expressed as the relationship between heat release rate and
fire lasting time. At present, the most popular model used is:
2tQ (1)
where, Q is heat release rate (kW); is fire growth rate (kW/s2); t is the fire lasting time (s).
US Standard for Smoke and Heat Venting [18] defines four categories of fires according to fire
growth rate , which are: slow fire, medium fire, rapid fire and ultra-fast fire. As mentioned before,
the design of fire in this study was based on the most unfavourable principles. Hence, the fast fire
was considered with = 0.04689 kW/s2. As mentioned in Section 2.2.1, for an exhibition centre,
the main fire source should be the exhibits. Hence, it is reasonably assumed that the fire source of
this project was furniture exhibits. According to Chinese code for the fire protection design of
buildings [16], the heat release rate (HRR) of a unit area for the furniture exhibits is 100 kW/m2.
This value was used in this study. Also, in accordance with the requirements of the exhibition centre
to store or display different items, two fire source areas were considered. The first fire source area
was based on the area of one exhibition platform, which was 9×9 m2. The second fire source area
was based on the area of two exhibition platform, which was 18×18 m2. In reality the case with
large area is not always happened, which represents more extreme fire scenario. However, the case
with small area is frequently happened under normal condition. In the reality the combustible fuel
near the fire source can be ignited due to the radiation of the flames and fire can spread within the
exhibition center. However, for simplicity this situation was not considered in this study.

8
2.2.3. Fire scenarios
According to the most unfavourable principle and taking the dangerous factors of a real fire disaster
into consideration, four fire scenarios were designed for the exhibition centre, as listed in Table 1. It
was assumed that the fire fighting system is out of work in all four fire scenarios.
2.3. Modelling of fire temperature fields within the exhibition centre
Due to the lager space of the exhibition centre it is obvious that zone modelling approach is not
suitable for modelling the fire. Hence, in this study the fire development within this large space
exhibition centre was modelled by using Fire Dynamics Simulator (FDS) FE package [9]. FDS has
been used by many researchers in the world for fire dynamics simulation and has been validated
intensively with test data [19]. FDS can analyse the gas diffusion and heat conduction in the
combustion process, including combustion, thermal radiation and pyrolysis models. Therefore, FDS
package was adopted in this project to simulate the real fire scenarios of the exhibition centre, in
order to study the non-uniform fire temperature field within the large-space steel structure. Some
bench mark tests were done to assess the accuracy or reliability of numerical results generated from
the program. The predicted non-uniform fire temperature field by FDS was used to predict the
temperatures of the steel structural members for the structural analysis of the exhibition centre.
In the simulation of FDS, the grid size is an important modelling parameter as it determines the
accuracy of modelling results. The density, velocity, temperature and pressure of each grid are all
calculated for every time step and the parameters of each grid are also time-dependent. Therefore,
good mesh size of the model in FDS is the key factor which affects the accuracy of the results. In
theory, the finer the mesh, the higher the accuracy of the results. However, since for a large-space
structure, many grids, even up to millions of grids, are needed, the simulation will have
considerable demand on computational power and time. Therefore, structural scale, accuracy and
time of the simulation should all be considered for selecting the mesh size. Based on the previous
research [8, 19], in this study a mesh size of 1×1×0.5 m3 has been adopted to simulate the fire
development within the exhibition centre. From the results (see Figs 7 and 9) it is evident that the
temperature within a mesh volume is relatively uniform. The combustion model of fire in FDS is

9
the key for the simulation of fire scenarios. In this study, modeling tool PYROSIM, developed by
Thunderhead Engineering Company, is used to create the FDS model.
In this study, four different fire scenarios were simulated to predict smoke and gas distribution and
temperature field within the exhibition centre. Fig. 5 shows the fire simulation model established
using FDS for the exhibition centre. The large space structure was meshed into 1×1×0.5 m3 small
volume elements, with 3920 measuring points which were related to 3920 nodes below the bottom
chord of the structure. The fire duration was assumed to be 1.5 hour (5400 s), and the time step was
10 s. The temperature-time curves of the measuring points were recorded and were used to calculate
the temperature field of the steel members.
2.3.1. Fire scenarios with fire source location A
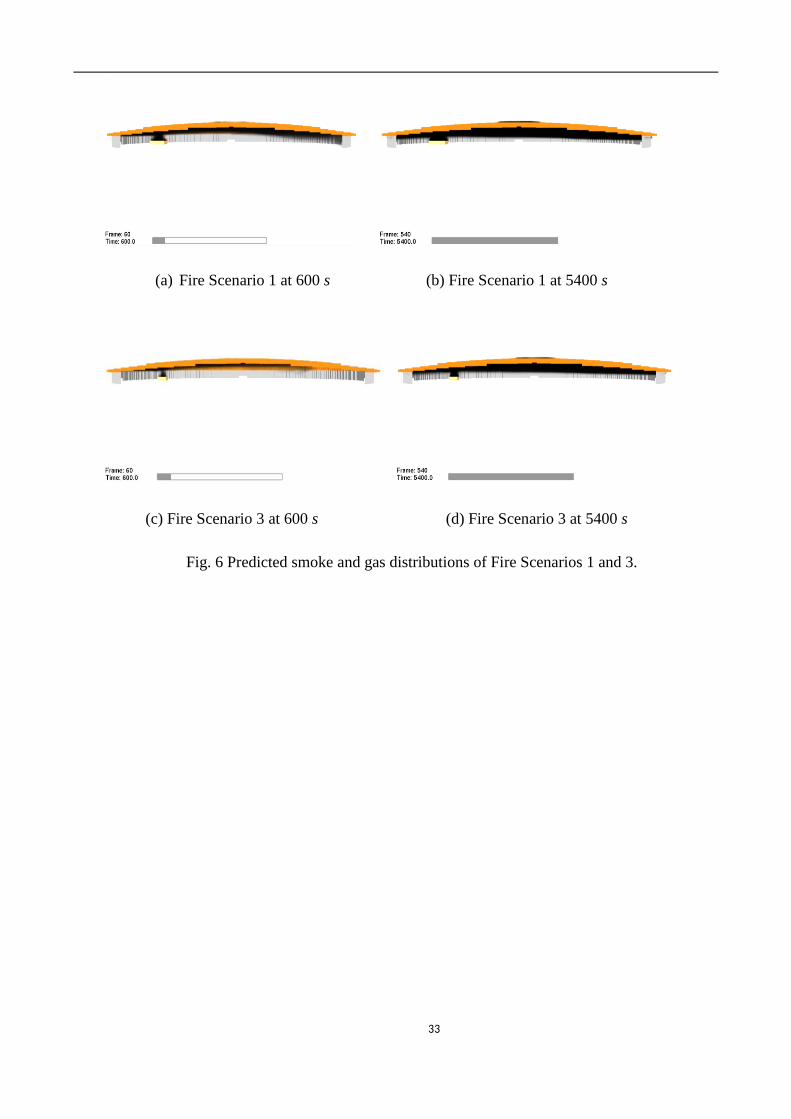
Fig. 6 shows the predicted smoke and gas distributions of Fire Scenarios 1 and 3 (see Table 1). The
predicted temperature distributions of Fire Scenarios 1 and 3 at height of 12 m are shown in Fig. 7.
From Figs 6 and 7, it can be concluded that:
(1) For the fire location near the outer wall (fire source location A), the smoke risen in an axial
symmetric plume form. When the smoke reached the ceiling, the part of the smoke spread
outwards and transferred into the central courtyard then finally was ventilated to the
outside of the building. Hence, after 600 s of the fire, only the gas near the fire source
location had obvious temperature increasing.
(2) The distribution of the temperature field was non-uniform in the areas closed to the fire
source location with the highest gas temperature right above the fire source location and
the gas temperature was decreased with the increasing distance from the fire source
location. Due to the influence of the central courtyard, the gas temperature on the left-hand
side of the building was higher than that of right-hand side for the same distance away
from the fire source location. After 5400 s of the fire, the highest temperatures for Fire
Scenarios 1 and 3 were about 400 oC and 300
oC, respectively.
(3) After 600 s of the fire, the smoke reached the furthest place of the hall for Fire Scenario 1,
however, for Fire Scenario 3 the smoke only reached about the half way of the hall with a

10
relatively small expanded area and lower height. This demonstrated that the fire source
area is a critical factor to influence the spreading of a fire. Larger fire source area leads to a
higher gas temperature near the fire source location and a larger fire hazarded area.
(4) After 5400s of the fire, the hot gas and smoke expended the entire space of the hall. For Fire
Scenario 1 the gas temperatures were above 60 oC within the area of 1000 m
2. However,
For Fire Scenario 3 only the temperature of the area of 500 m2 closed to the fire source
location had notable increase. Therefore, the fire source area has a significant impact on the
temperature field of a fire, the large fire source area leads to a sever fire.
2.3.2. Fire scenarios with fire source location B
The predicted smoke and gas distributions of Fire Scenarios 2 and 4 (see Table 1) are presented in
Fig. 8. The predicted temperature distributions of Fire Scenarios 2 and 4 at height of 12 m of the
structure are shown in Fig. 9. From Figs 8 and 9, it can be seen that the patterns of the smoke
distribution and gas temperature field of Fire Scenarios 2 and 4 were similar with Fire Scenarios 1
and 3, respectively. The highest gas temperatures above the fire source location were 360 oC and
260 oC for Fire Scenario 2 and Fire Scenario 4, respectively.
It is clear that the highest temperatures of the fires with the same fire source area at the fire source
location A were higher compared to the fire at the fire source location B. This is because the fire
source location B is closed to the central courtyard of the hall and the net height of the space is
larger. Another factor is that the smoke and hot gas are more easily to be ventilated to the outside of
the hall through the opening of the courtyard. However, the results show that the influence of fire
source area is more significant compared to the fire source location. It is evident from this research
that the temperature fields of the fire scenarios presented here are very non-uniform and the ISO834
standard fire curve is not suitable for the fire resistance design of the structures with large space.
2.4. Temperature calculations for steel structural members
The main objective of this research is to assess the fire resistance of large steel roof structure
without any passive fire protection for an exhibition hall using performance-based approach. Hence,
the temperatures of all steel truss members were calculated based on the local fire temperature field

11
for different fire scenarios. And then, the temperatures of all structural members were imputed into
the structure model build in ANSYS (see Fig. 10) for the structural simulation.
2.4.1. The Simplified calculation method
In this study, the non-uniform temperature field of the steel members for the exhibition centre was
calculated using the simplified calculation method proposed in the Chinese Code: “Technical
specification for fire protection of steel structure of buildings” [17]. The ambient temperature was
assumed to be 20 oC, and then the temperature of the steel truss member can be calculated as:
tTttTtTc
BttT ssg
ss
s (2)
where Δt is the time step, which is 30 s in this study (s);
Ts is the temperature of the steel truss member (oC);
Tg is the local air temperature around the steel truss member (oC);
B is the heat transfer coefficient of unit length steel member (W/(m3· oC));
cs is the specific heat capacity of steel (600 J/(kg·℃));
s is the density of the steel (7850 kg/m3).
The heat transfer coefficient of unit length steel member B without fire protection can be calculated
as:
V
FB rc (3)
sg
bg
rrTT
TT
44273273
(4)
Where: F is the fire exposing area of the unit length of steel member (m2/m);
V is the fire exposing volume of the unit length of steel member (m3/m);
c is the heat transfer coefficient, 25c W/(m2 oC);
εr is the overall heat radiance, εr=0.5;

12
is Stefan-Boltzmann factor, =5.6710-8
[W/(m2·K
4)].
It is well known that MATLAB is an advanced technology computing language and interactive
environment for algorithm development, data visualization, data analysis and numerical calculation.
Users can write in the command window to synchronize the input statement with the execution
command and can also write a complex application (M file) and then run the commands together.
Hence, the simplified method presented above has been written into an M-file in MATLAB
program to calculate the non-uniform temperature field of the steel truss members. The local air
temperatures around the steel truss members (Tg) were determined from the temperature-time
curves predicted by FDS modelling for the different design fire scenarios.
2.4.2. Temperature field of the structures under different fire scenarios
As mentioned in Section 2.4.1, the temperatures of all truss members of the structure were
calculated using Eq. (2) based on the predicted non-uniform fire temperature field for different fire
scenarios. The temperature data of all truss members were inputted into structural analysis model to
simulate the structural behaviour of the exhibition centre under different fire conditions. Fig. 11
shows the calculated temperature distributions of the structural members for different fire scenarios.
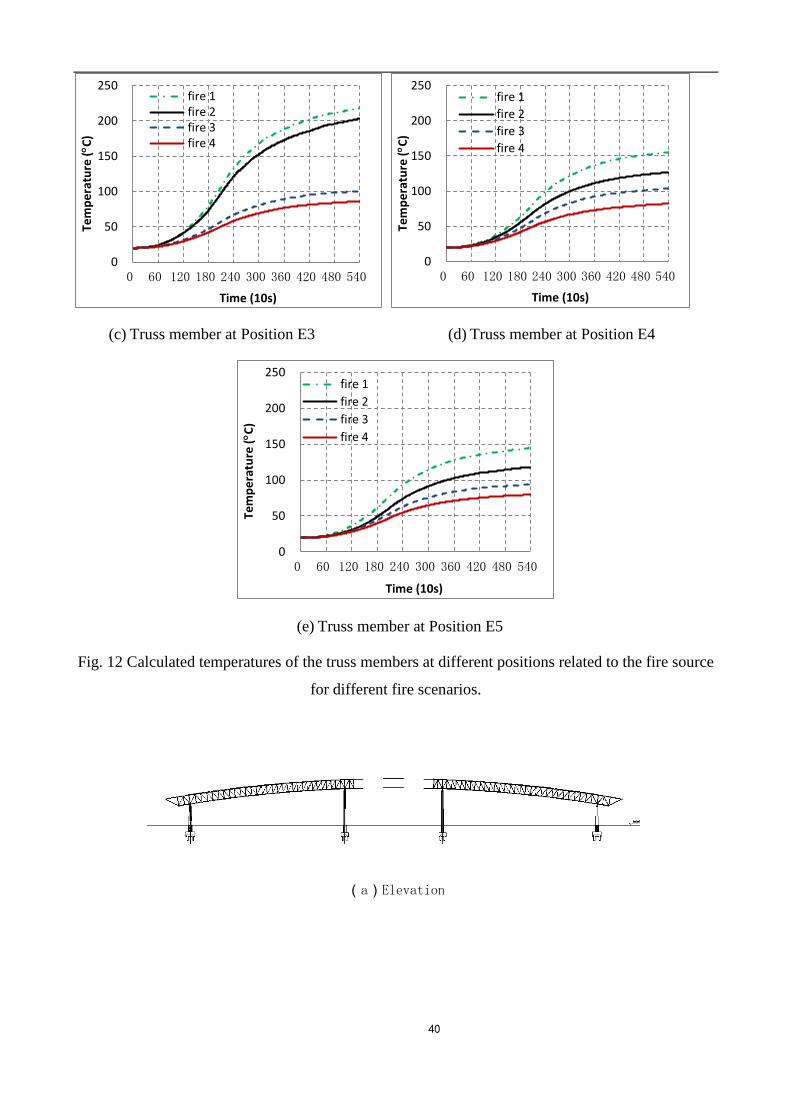
The predicted temperatures of the truss members at different positions related to the fire source for
four designed fire scenarios are presented in Fig. 12. As shown in the figure, Position E1 is just
right above the fire source; Positions E2 and E4 are both on the left-hand side of E1 and 1 m and 2
m away from E1, respectively. Positions E3 and E5 are both on the right-hand side of E1 and 1 m
and 2 m away from E1, respectively.
It can be seen from the figure that the maximum temperatures of the steel truss members were lower
than 350 oC for the different fire scenarios. The temperatures of the steel truss members were
gradually reduced away from the fire sources. The fire source area and location have a considerable
influence on the temperatures of the steel truss members. Hence, in order to do the
performance-based fire resistance, the temperatures of all steel truss members need to be evaluated
respectively.
3. Development of finite element structural model for the exhibition centre

13
A general-purpose finite element software, ANSYS has become the mainstream simulation analysis
software for civil engineering and construction all over the world. It has been widely used for the
analysis of steel and reinforced concrete buildings, stadiums, bridges and underground structures
under external loading conditions. More extensive validations of ANSYS for modelling thermal and
structural behaviours of steel, concrete and composite structures under fire conditions have been
conducted in previous researches [20, 21]. For steel structures, especially the large-space steel
structures developed in recent years, ANSYS has obvious advantages compared with other finite
element software, that is: powerful modelling capability, strong solving and nonlinear analysis
abilities, good mesh ability, and optimization, advanced single and multi-field coupling analysis
ability, multiple interfaces, strong processing and secondary development abilities. ANSYS
provides users with parameterized design language APDL (ANSYS Parameter Design Language) to
operate the finite analysis automatically. The APDL language can be used for the parametric
modelling, parametric loading and solving, parametric results showing after treatment and also for
the optimization of design and analysis. Therefore, in this research ANSYS was used for the
structural modelling of the exhibition centre under different fire conditions. Some bench mark tests
were carried to validate the accuracy of numerical results predicted from the software. Also the
mesh sensitivity was done for selecting reasonable mesh size for larger scale modelling.
3.1. Structural model
The FE model for this large space steel truss structure was built in ANSYS as shown in Fig. 10. In
this ANSYS structural model both geometric and material nonlinearity were considered. The total
element number of the model was 28448 with 8064 nodes in which 4144 nodes on the top chord
and 3920 nodes on the bottom chord of the structure. All the steel trusses members were
constructed using Q345 steel tubes. Table 2 lists the cross-section sizes of the steel tube elements
used for a typical truss girder (as shown in Fig. 10 (c)) and the main circular elements on the top
and bottom chords of the roof structure. In Table 2: elements 1-36 are the top chord member of the
truss girder arranged from inside circle to outside circle; elements 8513-8546 are the bottom chord
member of the truss girder arranged from inside circle to outside circle; elements 16689-16723 are
vertical web truss members of the truss girder arranged from inside circle to outside circle; elements

14
20609-20643 are diagonal web truss members of the truss girder arranged from inside circle to
outside circle (see Fig. 10(c)). Elements 8065, 8177, 8289, 8401 are the main circular members of
the top chord of the roof structure arranged from inside circle to outside circle; elements 16129,
16241, 16353, 16465, 16577 are the main circular members of the bottom chord of the roof
structure arranged from inside circle to outside circle.
The steel material properties are:
The thermal conductivity s =45 W/(m K);
The specific heat cs=600 J/(kg·K);
The thermal expansion factor s=1.410-5
;
The density s=7850 Kg/m3;
The Poisson ratio s=0.3;
The yielding strength at ambient temperature fy,20 = 356 MPa.
The constitutive material model of Q345 steel tubes at elevated temperatures developed by Yuan et
al. [22] was adopted in this study.
All the joints of the steel tube trusses are tubular joints. The top and bottom chord trusses are
continuous through members and the web trusses penetrated into chord trusses. According to the
“Design code of steel structures” (GB 50017-2003 [23]), the connections of the trusses may be
considered as hinges if the following requirements are fulfilled:
(1) The geometric parameters are in the required scope of the correspond connections;
(2) The length/ height ratio of the chord trusses is larger than 12 and that of the web trusses is
smaller than 24.
The requirement (1) mainly limit the radius ratio between the chord trusses and web trusses, the
angles between the chord trusses and the web trusses, the diagonal angle of the joints, the lap ratios
and so on. Although the requirement (1) is fulfilled, if the length/ height ratio of the chord trusses is
less than 12 or that of the web trusses is bigger than 24, the joints may be regarded as a rigid joint.

15
In this study, most of the length/ radius ratios of the chord trusses were larger than12 and most of
these for web trusses were larger than 24. Hence, in the FE model, the steel structural members on
the top and bottom chords of the structure were represented as beam elements and connected rigidly
each other. Other steel truss members connected to truss girders were modelled as an assembly of
truss elements connected by semi-rigid connections, with the property between the rigid connection
and the hinge which takes the nonlinear relationship of bending moment and rotational
displacement into consideration. According to EC3 [24], the connection with the rotational stiffness
between 0.5~25 times of its linear stiffness should be considered as semi-rigid connection. The web
truss members were represented as truss elements and the connections between the web truss
members and the members on the top and bottom chords were pinned. The supports of the structure
are shown in Fig. 13. It is reasonable assumed that the supports at the bases of the columns can
rotate in the radius direction and other degrees of freedom were fixed. In the ANSYS structural
model all columns were included in the model.
3.2. Loading conditions
During the modelling process of the large space steel roof structure, the loads applied on the
effective area of the nodes within the structure were calculated based on the static load equivalent
principle, which is so called equivalent nodal load. For ANSYS, it is difficult to obtain the
equivalent nodal load effectively and accurately with the normal comments provided by the
graphical user interface (GUI) for the following reasons:
(1) Firstly, in real large-scale structures, the nodes of polygons are not in the same surface, they are
spaced polygons. For the spaced polygons it is difficult to compute the equivalent nodal loads.
(2) Secondly, a large space steel roof structure contains a large number of members and nodes, the
work of calculating the uniform load of each grid one by one is too time consuming and difficult to
perform.
(3) Thirdly, the "SF" command supplied by ANSYS applies the surface load on a group of nodes
which requires that the load should be perpendicular to the surface. If the load is not perpendicular
to the surface like the suspension load of the curved steel roof, the “SF” command cannot be used.

16
In order to overcome these limitations, a time effective and precise approach for calculating the
equivalent nodal load was proposed in this study. The proposed method was conducted by writing
comments using APDL language, applying all the dead load, live load and wind load on the roof
structure and then calculating the equivalent nodal loads.
The main objective of this paper is to investigate the influence of various fire scenarios (fire source
locations and fire areas) on the structural performance of large space steel tube structures. For the
large space steel roof structure the main live loads are snow and wind loads. For the snow load, it’s
not the common situation that when the larger snow loads are applied to the structure when a fire
happens in the structure. Hence, according to the Chinese code [16] the snow load can be ignored
for the fire-resistance design of structure under fire limit state. Also the wind load can be neglected
when the effect of frequency of live load is bigger than the combined effect of wind load and
permanent live load. Therefore, the main loads were assumed to be static loads, so the live loads,
such as wind and snow loads, were not considered in this research. Hence, only the permanent loads
were applied to the structure, including the weight of structural members, roofing materials,
equipment, pipes and lightings.
The self-weight of the structural member was calculated automatically according to geometric
dimensions of the member by the software. The weight of the roofing materials (glass curtain roof
of 5 mm lead wire glass including frame weight) was 300 N/m2. The weight of the equipment, pipes
and lightings (taking the standard value) was 1000 N/ m2. The weight of the roofing materials were
applied on the top nodes and that of the equipment were applied on the bottom nodes, and then the
equivalent nodal loads can be calculated by the proposed method described above.
4. Structural response of the exhibition centre under different fire conditions
4.1. The deformation of the structure
The results indicated that the vertical displacements of the structural members changed with
their temperatures. The nodes within the span part of the structure were moved upwards while
the nodes on the cantilever part were moved downward (see Fig. 13(a) for the cantilever part
and span part of the roof structure). Fig.14 shows the vertical nodal displacement contours in

17
the top chord of the steel truss structure for four different fire scenarios at time of 5400 s, in
which the downward displacement is negative and upward displacement is positive.
It can be seen from the figure that for Fire Scenarios 1 and 2, the absolute maximum negative
displacement (downward) appeared on the cantilever part of the top chord in the area closed to the
fire source. The absolute maximum positive displacement (upward) formed at a node in the area
between the fire source location and the out-circle supports of the structure, in which the
temperature of the member at that node position was lower than the member right above the fire
source location. This is because that the node at the member with highest temperature had largest
negative displacement at ambient temperature which counteracted the part of the positive
displacement generated in the fires. For Fire Scenarios 3 and 4, the upward nodal displacements
caused in the fires were not big enough to counteract the initial negative nodal displacements at
ambient temperature, so nearly all nodal displacements were negative displacements.
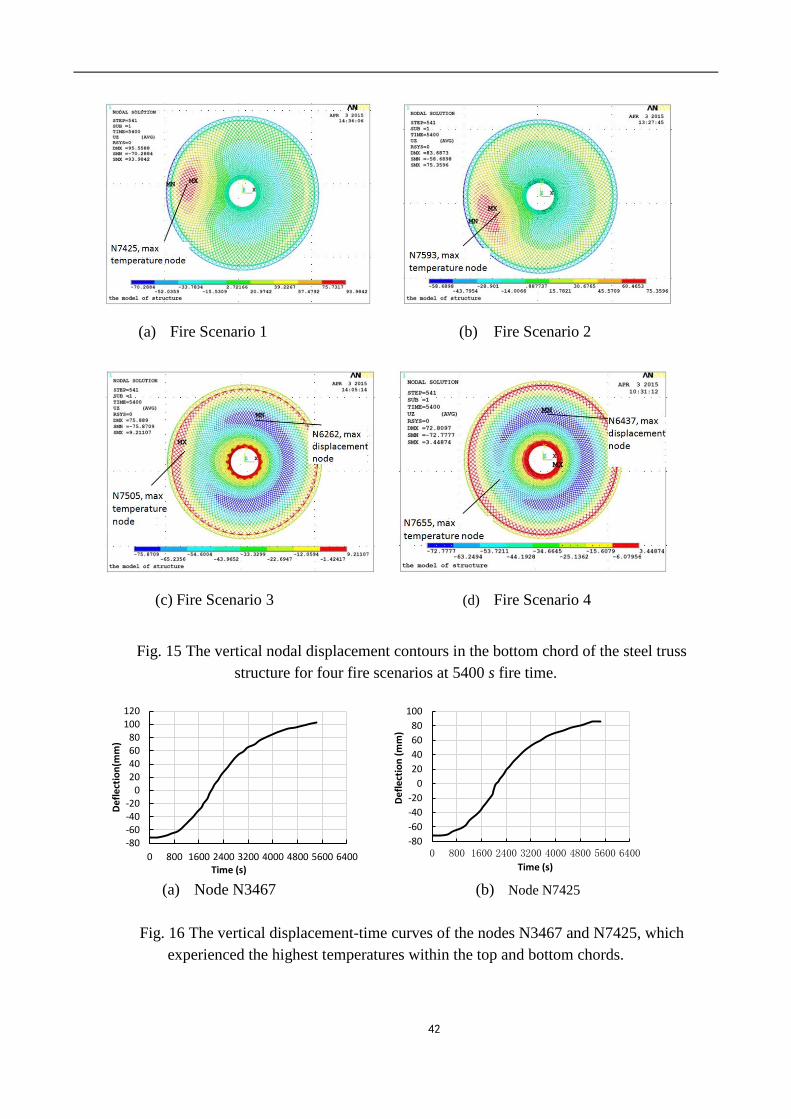
Fig. 15 shows the vertical nodal displacement contours in the bottom chord of the steel truss
structure for four fire scenarios at 5400 s. It can be seen that development of the nodal
displacements in the bottom chord of the structure was similar to those of the top chord of the
structure. However, due to the restraint of the bottom chord resulted from directly connected to the
column’ supports, their displacements were comparatively smaller than the one in the top chord.
The displacement-time curves of the nodes of N3467 and N7425, which experienced the highest
temperatures within the top and bottom chords are shown in Fig. 16. The locations of the nodes
N3467 and N7425 are just above the fire source, as shown in Figs. 11 and 12. The vertical
displacements of nodes N3467 and N7425 were changed from -72.4 mm and -71.4 mm to +101.6
mm and +85.2 mm, respectively after 5400s of fire. The total displacement changes of them were
up to 177.0 mm and 156.7 mm, respectively. The maximum vertical negative displacements,
positive displacements and the maximum displacement changes for the four fire scenarios are
shown in Table 3. In the modelling the deformations and forces of each structural members were
recorded. There was no buckling in any truss members observed during the structural simulation.
It can be seen that the key differences between fire scenarios in term of the displacements of the
structure are: (1) for Fire Scenarios 1 and 2 there were considerable large maximum vertical
downward and upward deflections. The displacement changes were relatively large during the fires.

18
(2) for Fire Scenarios 3 and 4 there were relative small maximum vertical downward deflections
and there were no upward deflections. The displacement changes were relatively small during the
fires. This indicated that the influence of fire source area was greater than the location of fire
source.
4.2. The stresses of the structural members
With the equivalent nodal loads, the structural performances of the exhibition centre at elevated
temperatures were analysed. From the modelling results, it can be seen that the change of
stresses of the structural members at elevated temperatures has a similar trend compared to the
displacements. The stresses of the structural members were growing slowly during the initial
and post fire periods, and developed rapidly during the mid-term of the fires. The structural
members most prone to failure were the members right above the fire source and the supporting
members near the fire source. The former one experienced the highest temperature and yielding
earlier while the later one experienced the maximum stresses due to the strong restraint to the
thermal expansion from the supporting members.
Figs 17 and 18 show the distribution of the stresses of the top and bottom chord members,
respectively. The positions of the truss members with maximum stresses for both top and bottom
chords were marked respectively in the figures.
The sections of the members with the highest temperature or the maximum stresses within the
structure were regarded as the critical sections. Table 4 gives the stresses at the critical sections of
the structure at both ambient and under various fire scenarios. In the table, the locations of critical
sections were defined at the member with highest temperature (at highest temperature, see Fig. 15)
or the member with highest stress (at highest stress, see Fig. 18) for different fire scenarios. Also the
related temperature, yield strength of steel and the ratios of the stress with yield strengths at that
temperature are presented in the table. In this study, the yield strengths of steel tube at elevated
temperatures were calculated according to the model proposed by Yuan et al. [22].
After detailed examination of the stress situations within the structural members, it is clear that the
key differences between fire scenarios in term of the stresses within the structural members of the

19
structure are: (1) for Fire Scenarios 1 and 2 there were considerable large maximum stresses formed
within the structural members during the fires and the maximum stresses reached 80-90% of
yielding strength of steel. (2) for Fire Scenarios 3 and 4 there were relative small maximum stresses
formed during the fires and the maximum stresses only reached below 70% of yielding strength of
steel. This further supported that the influence of fire source area was greater than the location of
fire source.
4.3. Influences of different fire source locations
The comparison of vertical displacements between different fire scenarios shows that the maximum
downward (negative) displacements for Fire Scenarios 1 and 2 all occurred on the cantilever part of
the top chord, as shown in Fig. 14. The magnitudes of the maximum downward displacement and
upward (positive) displacement of Fire Scenario 1 were all bigger than that of Fire Scenario 2.
Although the displacements of Fire Scenarios 3 and 4 were in the state of downward (negative)
displacement after fire, however, the maximum change on the vertical displacement of Fire
Scenario 3 was slightly greater than Fire Scenario 4.
To assess the stresses of structural members for different fire scenarios, it can be seen that the
maximum stresses of the members for Fire Scenarios 1 and 2 all occurred on the bottom chord near
the supporting columns. However, the magnitudes of the maximum stress and the maximum ratios
of the stress with yield strengths for Fire Scenarios 1 were all bigger than that of Fire Scenario 2, as
shown in Table 4. The comparison between Fire Scenario 3 and 4 was similar to that of Fire
Scenarios 1 and 2. In conclusion, the fire located in the area with comparatively lower height within
the larger space steel roof structure is more dangerous related to the structural performance. This is
due to the fire source is more closed to the roof structure with a lower height. Hence, that part of the
roof structure will have higher temperature during a fire.
For the exhibition centre with large space roof structures, due to the structural requirement, the
height in the span of the structure near the boundary is always lower than that in the middle span.
Therefore, if fire occurs in the area near the boundary like Fire Scenarios 1 in this study, the
structural members right above the fire source will have higher temperatures. Moreover, this fire
location is near the supporting columns and the fire will results a higher downward (negative)

20
displacement of the cantilever part of the structure, and a larger stresses will be generated within the
members near the supports. Hence, for large space structures, such as exhibition centre, avoid
storing combustible goods near the external wall. For enhancing the fire resistance of the structure,
the cross-section of the structural members near the supports needs to be properly increased in order
to strengthen their load bearing capacity.
4.4. Influences of different fire source areas
To compare the vertical displacements between Fire Scenarios 1 and 2 (with the fire source area of
18×18 m2) and Fire Scenarios 3 and 4 (with the fire source area of 9×9 m
2), it can be seen that the
maximum changes of the vertical displacements of Fire Scenarios 1 and 2 all occurred at the nodes
above the fire source, and reversed to the upward (positive) displacements after 2000 s of the fires.
The changes of the displacements of the nodes in Fire Scenarios 3 and 4 were relatively small and
the displacements were still in the state of downward (negative) displacement after 5400 s of the
fire.
To analyse the stresses of the structural members for different fire scenarios, it is evident that the
maximum stresses of the structural members for the four fire scenarios were all happened in the
members near the supports. The maximum ratios of the stress with yield strength for Fire Scenarios
1 and 2 were 93% and 83%, respectively. This indicates that the members right above the fire
source area of Fire Scenarios 1 were almost yielded in which the highest temperature of the member
was only 334 oC. In contrast, the maximum ratios of the stress with yield strength for Fire Scenarios
3 and 4 were 67% and 54%, respectively. This means that all the structural members were still in
the elastic state with enough safety margins for load bearing capacity.
Based on the above analysis it can be concluded that the fires with the fire source area larger than
18×18 m2 in the exhibition centre studied here can cause structural failure of the members near the
supports or right above the fire source. For the fires with the fire source area less than 9×9 m2 the
structure performance of the exhibition centre was in the safe condition. The research indicated that
large space steel structures can tolerate different fire conditions. Hence, it is important to adopt
performance-based approach for the fire resistance design of large space steel structures.

21
4.5. Behaviour of the structure subjected to partial cooling
For considering the safety of fire fighters, it is important to understand the behaviour of the
structure subjected to partial cooling conditions. In this research the performance of the exhibition
centre was reanalysed and when the fire duration of 5400 s was reached then partial cooling was
applied to the structure. In this analysis, the most dangerous fire scenario (Fire Scenario 1) was used.
For the partial cooling, it was assumed that the structural members right above the fire source area
were instantly cooled to 20 oC by water. Based on this cooling condition, the displacements and
stresses of the structure were analysed.
4.5.1. Vertical displacements of the structure after cooling
Fig. 19 shows the vertical displacement-time curves of the node N3467 (see Fig. 14(a) for the
position) and node N7425 (see Fig. 15(a) for the position) within the top and bottom chords after
partial cooling on that structural members. The rest of the structure was assumed to be at hot
condition of fire time of 5400 s. These two nodes on the top and bottom chords of the structure had
the highest temperatures before cooling. From the figure it can be seen that the both nodal
displacements were recovered immediately after the sudden water cooling. This is due to those steel
members were still in the elastic stage at fire time of 5400 s.
It can be seen that the changes of the displacements of two nodes were considerable different. For
nodes N3467 and N7425, the displacements were changed from 102.2 mm and 93.9 mm to
69.6 mm and 70.8 mm, respectively. This is due to the node N7425 was at the bottom chord and
near the support. Hence, the members in the cooling zone were under more significant restraint
from the surrounding members and less displacements’ changes were generated. In contrast, the
node N3467 was at the top chord and away from the supports, therefore more displacement’s
change was resulted from the cooling.
4.5.2. The stresses of the structural members after cooling
Table 5 presents the changes of the maximum stresses of four structural members at different
locations within the top and bottom chords subjected to partial cooling. As mentioned above before
the cooling the steel truss members were still in the elastic stage, the stresses of the structural

22
members were significantly changed when the temperature of the members dropped to 20 oC. For
example, the maximum stress of the member E6507 (see Fig. 17(a) for position) in the top chord
before cooling was 182.3 MPa, and reduced to 48.4 MPa after cooling. The maximum stress of the
member E11706 (see Fig. 18(a) for position) in the bottom chord was 327.5 MPa and recovered to
208.4 MPa after cooling.
However, it is interesting to note that the stresses of the members near the cooling zone in the top
chord were increased sharply due to the impact of the cooling members. As shown in Table 5, the
stress of member E8498 was increased considerable from 137.6 MPa before cooling to 226 MPa
after cooling. This phenomenon did not appear in the members within the bottom chord. This may
be due to the influence of restraint provided by the supports which were connected to the bottom
chord of the structure. It can be concluded that for the large roof steel truss structures, the water
cooling of the members near the supports can lead to a sudden increase of the stresses in the
structural members within top chord. This may contribute to the risk of the structural damage in the
fire fighting stage. This should be considered in the structural fire engineering design of large roof
steel truss structures.
5. Conclusions
This paper presents a comprehensive case study by using performance-based approach on the fire
resistance of a large space exhibition centre in Shanxi province, China under the real fire scenarios
including heating and cooling phases. The thermal and structural behaviour of the exhibition centre
were modelled using FDS simulator and finite element software ANSYS. From this study some
conclusions can be drawn as the following:
(1) The traditional ISO834 standard fire cannot be used for structural fire engineering design
of large-space structures, such as the exhibition centre. Performance-based design approach
is needed for the analysis of large steel truss roof structure in fire.
(2) The temperature field of the fire scenarios simulated by FDS shows that the space above the
fire source area has the highest temperature, and gradually reduced for the spaces away from
the fire source. For four different fire scenarios the highest fire temperatures were below

23
400 oC. Both the location and the area of the fire source have considerable influence on the
temperature field within the structures and the temperature field is non-uniform within the
large space structure.
(3) The behaviours of the structure subjected to partial cooling conditions are also complex. The
changes of the deformations and stresses of structural members are significantly affected by
the partial cooling methods and the locations of the members within the structure. The
stresses of the members near the cooling zone in the top chord can increased significantly
due to the impact of the cooling members. In contrast, the stresses of the members in the
bottom chord of the structure are changed less due to the provided supports. There have the
possibilities of the structural damage in the fire fighting stage.
(4) In order to enhance the fire resistance of large-space steel truss structures, the following
suggestions are proposed: (a) increase the cross-section of the structural member near the
supports; (b) reduce the outrigger dimension of the structure; (c) avoid piling combustible
goods near the corner of supports during service period of the structure; (4) control the area
of the fire source and arrange high exhibition platform in the high space zone.
(5) This research presented a comprehensive demonstration to show how fire resistance of a
large-space steel truss structure can be assessed based on performance-based fire design
approach step by step. The information presented in this paper is useful for practical
structural engineers for conducting the fire resistance design of a complex large space steel
structure.
Acknowledgements
This research was supported by the 2017 Research Found for Youth Science and Technology of
China University of Mining and Technology (JB179064) and the 2012 Specialized Research Fund
for the Doctoral Program of Higher Education of China (Grant No. 20120095110027). The authors
gratefully appreciate these supports.

24
References
1. Huang, J.Q., Li, G.Q. Du, Y. The revision of two-zone fire model calculating the air
temperature in large space buildings. Fire Science and Technology, 2005, 3: 279-283.
2. Zhang, C., Li, G.Q. Simple formulae for calculating the gas temperature in large enclosure fire
environment. Fire Safety Science, 2012, 21(2):84-91.
3. Taerwe, L., Bamonte, P., Both, K., Denoël, J.F., Diederichs, U., Dotreppe, J.C., Felicetti, R.,
Fellinger, J., Franssen, J. M., Gambarova, P.G., Hoj, N.P., lennon, T., Meda, A., Msaad, Y.,
Ozbolt, J., Periskic, G., Riva, P., Robert, F., Van Acker, A. Fire design of concrete
structures-structural behaviour and assessment, State-of-the-art report, fib bulletin 46,
International Federation for Structural Concrete (fib TG 4.3.2), Lausanne, 2008.
4. Richard L., Tang L., Choo, Y.S. Advanced analysis for performance-based design of steel
structures exposed to fires. Journal of Structure Engineer, 2002, 12: 1584-1594.
5. Buchanan, A. H. Fire Engineering Design Guide. New Zealand: 2001.
6. Du, Y., Li, G.Q. A new temperature–time curve for fire-resistance analysis of structures, Fire
Safety Journal, 2012, 54(1):113-120.
7. Xue, S.D., Xiong, J.L., Li, Y. Empirical formula for air temperature in large space structure
under fire. Journal of Beijing University of Technology, 2013, 39(2): 203-207.
8. Fan, S., Shu, G.P., She, G.J., Liew J.Y.R. Computational method and numerical simulation of
temperature field for large-space steel structures in fire. Advanced Steel Construction, 2014,
10(2): 151-178.
9. McGrattan, K., McDermott, R., Hostikka, S., Floyd J. Fire Dynamics Simulator (Version 5)
User’s Guide. USA, NISTIR, 2010.
10. Liu M., Zhao J., Sun C., Wang F. Anti-fire experiment and finite element analysis of steel
planar circular tubular truss, Low Temperature Architecture Technology, 2012, (2): 27-29.
11. Zhao J.S., Shen W.P. Nonlinear F.E. analysis of steel frames at elevated temperatures, Journal
of Shanghai Jiao Tong University, 1996, 30(8): 55-59.
12. Li, G.Q. Wang P.J. Wang Y.C. Behavior and design of restrained steel column in fire. Part2:
Fire Test, Journal of Constructional Steel Research, 2010, 66: 1148–1154.
13. Li, G.Q. Wang P.J. Wang Y.C. Behavior and design of restrained steel column in fire. Part1:
Parameter study, Journal of Constructional Steel Research, 2010, 66: 1138–1147.
14. Yin Y.Z., Wang Y.C. Analysis of catenary in steel beams using a simplified hand calculation
method, Part 1: theory and validation for uniform temperature distribution. Journal of
Constructional Steel Research, 2005, 61:183-211.
15. Yin Y.Z, Wang Y.C. A numerical study of large deflection behavior of restrained steel beams
at elevated temperatures. Journal of Constructional Steel Research. 2004, 60:1029-1047.
16. Chinese code for fire protection design of buildings (GB 50016-2014). China Planning Press,
Beijing, 2014 (in Chinese).
17. Technical specification for fire protection of steel structure buildings (CECS 200-2006).
Beijing: China Planning Press, 2006.
18. Standard for Smoke and Heat Venting (ANSI/NFPA 204-2006), USA, 2006.

25
19. Hu, L.H., Fong, N.K., Yang, L.Z., Chow, W.K., Li, Y.Z., Huo, R. Modeling fire-induced
smoke spread and carbon monoxide transportation in a long channel: Fire Dynamics Simulator
comparisons with measured data. Journal of Hazardous Materials, 2007, 140: 293–298.
20. Ding, J., Wang, Y.C. Realistic modelling of thermal and structural behaviour of unprotected
concrete filled tubular columns in fire. Journal of Constructional Steel Research, 2008, 64:
1086–1102.
21. Kodur, V., Dwaikat, M., Fike, R. High-temperature properties of steel for fire resistance
modeling of structures. Journal of Materials in Civil Engineering, 2010, 22(5): 423-434.
22. Yuan G., Shu Q., Huang Z., and Li Q. “An experimental investigation of properties of Q345
steel pipe at elevated temperatures”, Journal of Constructional Steel Research, 2016, 118:
41-48.
23. Chinese code for design of steel structures (GB 50017-2003). China Planning Press, Beijing,
2003 (in Chinese).
24. CEN, Eurocode 3: design of steel structures, part 1–2, Structural fire design, European
Committee for Standardization, BS EN 1993-1-2, 2005.
26
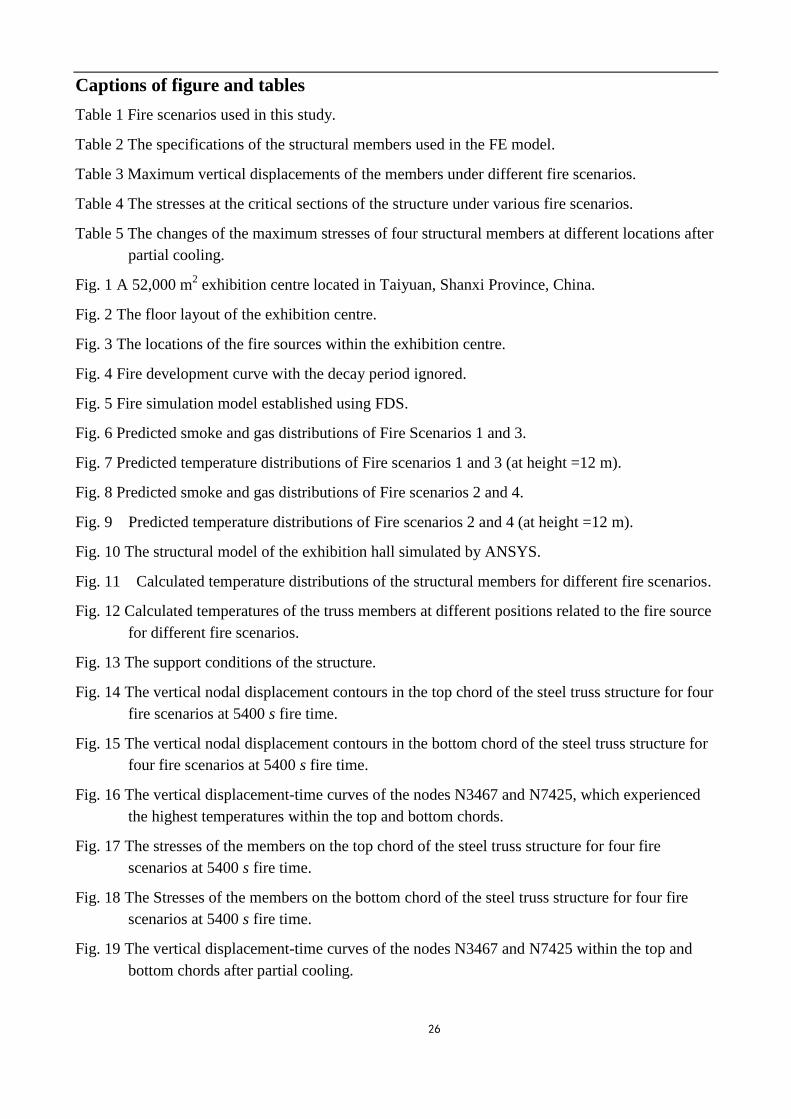
Captions of figure and tables
Table 1 Fire scenarios used in this study.
Table 2 The specifications of the structural members used in the FE model.
Table 3 Maximum vertical displacements of the members under different fire scenarios.
Table 4 The stresses at the critical sections of the structure under various fire scenarios.
Table 5 The changes of the maximum stresses of four structural members at different locations after
partial cooling.
Fig. 1 A 52,000 m2 exhibition centre located in Taiyuan, Shanxi Province, China.
Fig. 2 The floor layout of the exhibition centre.
Fig. 3 The locations of the fire sources within the exhibition centre.
Fig. 4 Fire development curve with the decay period ignored.
Fig. 5 Fire simulation model established using FDS.
Fig. 6 Predicted smoke and gas distributions of Fire Scenarios 1 and 3.
Fig. 7 Predicted temperature distributions of Fire scenarios 1 and 3 (at height =12 m).
Fig. 8 Predicted smoke and gas distributions of Fire scenarios 2 and 4.
Fig. 9 Predicted temperature distributions of Fire scenarios 2 and 4 (at height =12 m).
Fig. 10 The structural model of the exhibition hall simulated by ANSYS.
Fig. 11 Calculated temperature distributions of the structural members for different fire scenarios.
Fig. 12 Calculated temperatures of the truss members at different positions related to the fire source
for different fire scenarios.
Fig. 13 The support conditions of the structure.
Fig. 14 The vertical nodal displacement contours in the top chord of the steel truss structure for four
fire scenarios at 5400 s fire time.
Fig. 15 The vertical nodal displacement contours in the bottom chord of the steel truss structure for
four fire scenarios at 5400 s fire time.
Fig. 16 The vertical displacement-time curves of the nodes N3467 and N7425, which experienced
the highest temperatures within the top and bottom chords.
Fig. 17 The stresses of the members on the top chord of the steel truss structure for four fire
scenarios at 5400 s fire time.
Fig. 18 The Stresses of the members on the bottom chord of the steel truss structure for four fire
scenarios at 5400 s fire time.
Fig. 19 The vertical displacement-time curves of the nodes N3467 and N7425 within the top and
bottom chords after partial cooling.

27
List of tables
Table 1 Fire scenarios used in this study.
Fire
scenario
Fire source location
(see Fig. 2) Fire source
Density of HRR
(kW/m2)
Fire source area
(mm)
Fire fighting
system
1 Near outer wall(A) Exhibition
items Fast fire 100 1818 Out of work
2 Near mid-span(B) Exhibition
items Fast fire 100 1818 Out of work
3 Near outer wall(A) Exhibition
items Fast fire 100 99 Out of work
4 Near mid-span(B) Exhibition
items Fast fire 100 99 Out of work
Table 2 The specifications of the structural members used in the FE model.
Element
number
Tuble
cross-section
Element
number
Tuble
cross-section Element number
Tuble
cross-section
1-2 Φ245×12 16129 Φ800×20 16721 Φ203×8
3-17 Φ351×12 16241 Φ600×16 16722-16723 Φ180×10
18-26 Φ500×16 16353 Φ600×16 20609-20611 Φ203×8
27-32 Φ351×12 16465 Φ600×16 20612-20618 Φ140×8
33-36 Φ245×8 16577 Φ402×10 20619-20631 Φ102×5
8065 Φ800×35 16689-16690 Φ180×10 20632-20639 Φ140×8
8177 Φ402×16 16691 Φ203×8 20640-20642 Φ203×8
8289 Φ402×16 16692-16699 Φ180×10 20643 Φ299×10
8401 Φ402×16 16700-16711 Φ102×5
8513-8546 Φ351×10 16712-16720 Φ180×10

28
Table 3 Maximum vertical displacements of the members under different fire scenarios.
Fire scenario
Max. downward
displacement(mm)
Max. upward displacement
(mm)
Max. displacement change
(mm)
1 -137.5 +102.3 174.0
2 -115.7 +80.1 177.9
3 -75.9 — 62.5
4 -72.8 — 59.0
Table 4 The stresses at the critical sections of the structure under various fire scenarios.
Fire
scenarios
Location of
critical section
S (20 oC)
(MPa)
S (T)
(MPa) T (℃)
YS(T)
(MPa) S(T)/YS(T)
1
At highest T 12.1 269.1 334.4 288 0.93
At highest S 93.1 327.4 75.7 356 0.92
2
At highest T 26.2 227.8 292.6 295 0.77
At highest S 93.0 295.5 30.4 356 0.83
3
At highest T 12.1 198.4 240.2 298 0.67
At highest S 93.1 219.0 40.8 356 0.62
4
At highest T 26.2 160.5 211.2 300 0.54
At highest S 93.0 166.7 21.2 356 0.47
Notes: S is short for stress; YS is short for the yielding strength of steel; T is short for temperature.

29
Table 5 The changes of the maximum stresses of four structural members at different locations
after partial cooling.
No. of the members E6507 (top chord) E8498 (top chord) E11706 (bottom chord) E11842 (bottom chord)
Stress before cooling
(MPa) 182.3 137.6 327.5 312.5
Stress after cooling
(MPa) 48.4 226.0 208.4 312.5
30
List of figures
Fig. 1 A 52,000 m2 exhibition centre located in Taiyuan, Shanxi Province, China.
Fig. 2 The floor layout of the exhibition centre.
1#Hall
6518 m2
2# Hall 4675 m2
3# Hall 4675 m2
4#Hall 4675m2
5#Hall 4675 m2
6#Hall
6518 m2
Entrance 3693 m2
Centre 3670 m2

31
Fig. 3 The locations of the fire sources within the exhibition centre.
Fig. 4 Fire development curve with the decay period ignored.
Source B
Source A
Heat release rate, Qf
Qf,max
0 t1 Time

32
(a) Plane view of the model
(b) Elevation view of the model
Fig. 5 Fire simulation model established using FDS.
33
(a) Fire Scenario 1 at 600 s (b) Fire Scenario 1 at 5400 s
(c) Fire Scenario 3 at 600 s (d) Fire Scenario 3 at 5400 s
Fig. 6 Predicted smoke and gas distributions of Fire Scenarios 1 and 3.

34
(a) Fire Scenario 1 at 600 s (b) Fire Scenario 1 at 5400 s
(c) Fire Scenario 3 at 600 s (d) Fire Scenario 3 at 5400 s
Fig. 7 Predicted temperature distributions of Fire scenarios 1 and 3 (at height =12 m).

35
(a) Fire Scenario 2 at 600 s (b) Fire Scenario 2 at 5400 s
(c) Fire Scenario 4 at 600 s (d) Fire Scenario 4 at 5400 s
Fig. 8 Predicted smoke and gas distributions of Fire scenarios 2 and 4.

36
(a) Fire Scenario 2 at 600 s (b) Fire Scenario 2 at 5400 s
(c) Fire Scenario 4 at 600 s (d) Fire Scenario 4 at 5400 s
Fig. 9 Predicted temperature distributions of Fire scenarios 2 and 4 (at height =12 m).

37
(a) Plane view of the model
(b) Elevation view of the model

38
(c) Schematic diagram of a typical truss girder
Fig. 10 The structural model of the exhibition hall simulated by ANSYS.

39
(a) Fire Scenario 1 at 5400 s (b) Fire Scenario 2 at 5400 s
(c) Fire Scenario 3 at 5400 s (d) Fire Scenario 4 at 5400 s
Fig. 11 Calculated temperature distributions of the structural members for different fire scenarios.
(a) Truss member at Position E1 (b) Truss member at Position E2
0
50
100
150
200
250
0 60 120 180 240 300 360 420 480 540
Tem
pe
ratu
re (C
)
Time (10s)
fire 1fire 2fire 3fire 4
0
50
100
150
200
250
300
350
400
0 60 120 180 240 300 360 420 480 540
Tem
pe
ratu
re (C
)
Time (10s)
fire 1
fire 2
fire 3
fire 4
40
(c) Truss member at Position E3 (d) Truss member at Position E4
(e) Truss member at Position E5
Fig. 12 Calculated temperatures of the truss members at different positions related to the fire source
for different fire scenarios.
(a)Elevation
0
50
100
150
200
250
0 60 120 180 240 300 360 420 480 540
Tem
pe
ratu
re (C
)
Time (10s)
fire 1fire 2fire 3fire 4
0
50
100
150
200
250
0 60 120 180 240 300 360 420 480 540
Tem
pe
ratu
re (C
)
Time (10s)
fire 1
fire 2
fire 3
fire 4
0
50
100
150
200
250
0 60 120 180 240 300 360 420 480 540
Tem
pe
ratu
re (C
)
Time (10s)
fire 1
fire 2
fire 3
fire 4

41
(b)layout
Fig. 13 The support conditions of the structure.
(a) Fire Scenario 1 (b) Fire Scenario 2
(c) Fire Scenario 3 (d) Fire Scenario 4
Fig. 14 The vertical nodal displacement contours in the top chord of the steel truss structure for
four fire scenarios at 5400 s fire time.
42
(a) Fire Scenario 1 (b) Fire Scenario 2
(c) Fire Scenario 3 (d) Fire Scenario 4
Fig. 15 The vertical nodal displacement contours in the bottom chord of the steel truss
structure for four fire scenarios at 5400 s fire time.
(a) Node N3467 (b) Node N7425
Fig. 16 The vertical displacement-time curves of the nodes N3467 and N7425, which
experienced the highest temperatures within the top and bottom chords.
-80-60-40-20
020406080
100120
0 800 1600 2400 3200 4000 4800 5600 6400
De
fle
ctio
n(m
m)
Time (s)
-80
-60
-40
-20
0
20
40
60
80
100
0 800 1600 2400 3200 4000 4800 5600 6400
De
fle
ctio
n (
mm
)
Time (s)

43
(a) Fire Scenario 1 (b) Fire Scenario 2
(c) Fire Scenario 3 (d) Fire Scenario 4
Fig. 17 The stresses of the members on the top chord of the steel truss structure for four fire
scenarios at 5400 s fire time.

44
(a) Fire Scenario 1 (b) Fire Scenario 2
(c) Fire Scenario 3 (d) Fire Scenario 4
Fig. 18 The Stresses of the members on the bottom chord of the steel truss structure for four
fire scenarios at 5400 s fire time.
(a) Node N3467 (b) Node N7425
Fig. 19 The vertical displacement-time curves of the nodes N3467 and N7425 within the top
and bottom chords after partial cooling.
-80
-60
-40
-20
0
20
40
60
80
100
120
0 800 1600 2400 3200 4000 4800 5600 6400
De
fle
ctio
n (
mm
)
Time (s)
-80
-60
-40
-20
0
20
40
60
80
100
0 800 1600 2400 3200 4000 4800 5600 6400
De
fle
ctio
n (
mm
)
Time (s)