Embed Size (px)
Citation preview
Division of Structural and Construction Engineering Department of Civil, Environmental and Natural Resources Engineering
Luleå University of Technology SE – 971 87 LULEÅ
www.ltu.se/sbn
Technical report
Steel truss exposed to localized fires Experimental report from a large scale experiment with a steel truss
exposed to localized fires
Joakim Sandström, LTU; Johan Sjöström, SP
Ulf Wickström, LTU; Milan Veljkovic, LTU; Naveed Iqbal, LTU;
Johan Sundelin, Fastec
Luleå, October 2015

Introduction
1
CONTENTS
1 Introduction ......................................................................................................... 1
1.1 Background ................................................................................................... 1
1.2 Objectives and research questions ................................................................ 2
1.3 Acknowledgements ....................................................................................... 2
2 Experimental setup .............................................................................................. 3
2.1 Steel frame ..................................................................................................... 3
2.2 Roof ............................................................................................................... 5
2.3 Wall ............................................................................................................... 5
2.4 Fires ............................................................................................................... 5
2.5 Instrumentation ............................................................................................ 6
3 Results ................................................................................................................. 11
3.1 General behavior .......................................................................................... 11
3.2 Gas phase TC temperature .......................................................................... 16
3.3 Truss temperature ........................................................................................ 17
3.4 Ceiling temperature .................................................................................... 19
3.5 Column temperature ................................................................................... 21
3.6 Temperatures in the truss to beam connection. ......................................... 22
3.7 Deflections ................................................................................................... 23
4 References .......................................................................................................... 25
Appendix A.................................................................................................................. a
Steel temperature positions .................................................................................... a
Gas temperature positions ...................................................................................... b
Plate thermometer positions ................................................................................... b
Deflection meter positions ...................................................................................... d

Steel truss exposed to localized fires
2
Appendix B .................................................................................................................. e
TC temperature in the gas phase along the plume centerline and ceiling ............. e
Ceiling temperatures ............................................................................................... g
Fire exposure to the truss beam .................................................................................. i
Steel temperature in the truss beam .......................................................................... k
Steel temperature column and connection ............................................................ m
Deflection ................................................................................................................ n
Mass loss .................................................................................................................. o
Introduction
1
1 INTRODUCTION
1.1 Background A series of experiments with focus on heat transfer to structures from localized fires
have been conducted in collaboration between SP (Swedish Technical Research
Institute) and LTU (Luleå University of Technology) [1] and [2]. Localized fires, in
contrast to for example flash over, create a non-uniform environment with
differentiated thermal exposure depending to a structural element depending on
geometry and location of the fire. From this research, it has been noted that it is urgent
to harmonize the methods for presenting thermal exposure to structures. Thermal
exposure from localized fires to ceilings have been explored by Hasemi et al [4] which
led to the correlation now included in the Eurocode EC1, [5]. The thermal exposure to
the ceiling is, in this study, represented by heat flux from a localized fire to a cold
surface. The simple design models from these tests, as well as more sophisticated
combined models of fluid dynamics and finite element analysis of solid state
temperature are, however, in need of validation such as performed by Kumar et al [6].
This is especially important as most experimental work has been conducted in small
scale, hardly exceeding a ceiling height of 1 m. In addition, also with the exception of
small scale experiments [7], no tests have, to the best of our knowledge, been reported
for other common construction types like steel roof truss systems.
The main focus of these experiments, fire exposure from localized fires to a steel truss,
has been to evaluate the plume centerline temperature distributions of free burning
localized fires as well as the thermal exposure to the steel truss and ceiling in a typical
light-weight industrial building supported by steel columns and trusses. The data is to
be used for development of both simple and advanced models investigating the
response of this type of construction to thermal exposure from localized fires.
This report outlines the full experimental setup and results. In addition, some key-
features of thermal and mechanical response of the structure are highlighted.
Steel truss exposed to localized fires
2
1.2 Objectives and research questions The aim of this series of experiments with fire exposure from localized fires to a steel
truss has been to map the temperature distribution in a light steel frame building
consisting of an insulated roof sheet, a truss and a column subjected to localized fires.
The aim was also to gain better understanding of the response and thermal exposure
from localized fires to the structural steel elements. The data are presented to be used
for development of both advanced and simple methods to evaluate the response of
light-weight steel constructions exposed to localized fires.
1.3 Acknowledgements The experiment could be performed with the generous contribution of funds from
Brandforsk and the light-weight steel frame sponsored by Fastec.
As part of this project, a reference group has contributed with valuable input. The
group consisted of
Anders Ranby, Briab
André Burvall, Fastec
Björn Uppfeldt, Mekaniska Verkstäders Riksförbund
Cedrik Persson, Bengt Dahlgren AB
Emil Brodin, Fire Rescue Service in Boden Municipality
Jörgen Thor, Brandskyddslaget AB
Sven Thelandersson, LTH
Thomas Järphag, NCC
Experimental setup
3
2 EXPERIMENTAL SETUP
2.1 Steel frame
2.1.1 General
The setup used in the experiment was constructed to resemble an ordinary single story
light-weight steel frame building. This is a common construction type in Sweden due
to cost effectiveness and flexibility. The steel frame used in this experiment was
manufactured by Maku steel in Borås, Sweden and assembled on site in Trondheim,
Norway.
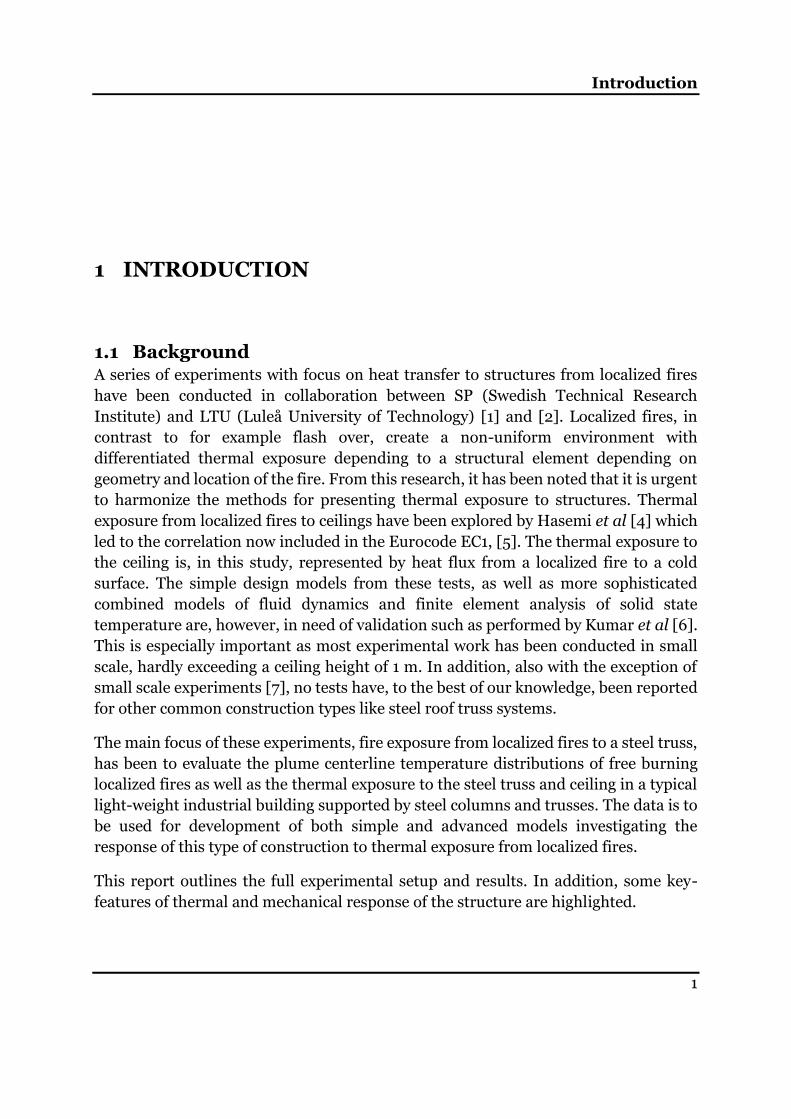
In the first and second experiments, with the fire located at the mid-span of the central
truss, no wall was present. In the third experiment, however, a wall was mounted on
the steel frame to evaluate difference in temperatures from a fire close to a wall.
Figure 1. Set up of the steel frame with default grid lines from the manufacturer. The wall in the right hand figure was used in experiment 3. Profiled steel sheet was used
on top of the frame for stabilization and for to transfer load to the trusses.
The three trusses supporting the roof were labelled F1, F2 and F31, as indicated in
Figure 1. The side where the wall was mounted is labelled B and the opposite side A.
The columns were, subsequently, labelled C1A, C1B etc. If not explicitly stated
1 The label ”F” is for “Fackverk”, the Swedish word for truss.
Steel truss exposed to localized fires
4
otherwise, any distance given along the truss or the ceiling refers to an origin in the
center of truss F2. Positive directions are towards the B-side or towards F3.
The steel frame was 10 m x 10 m with a height of 5 m. The columns were cold formed
square hollow columns with the dimension 120 mm x 120 mm x 8 mm except C1B and
C3B, which were 120 mm x 120 mm x 6 mm.
The tests were conducted in the large burn hall of SP Fire Research AS, in Trondheim,
Norway, with floor area of 590 m² and a maximum ceiling height of 36 m. All
ventilation to and from the hall was closed during the tests to avoid any external draft.
All sides of the set-up were open with the side along truss F1 closest to a wall with a
distance of 0.5 m from the outer wall of the hall. Thus smoke spread out along the
ceiling with negligible accumulation of hot gases.
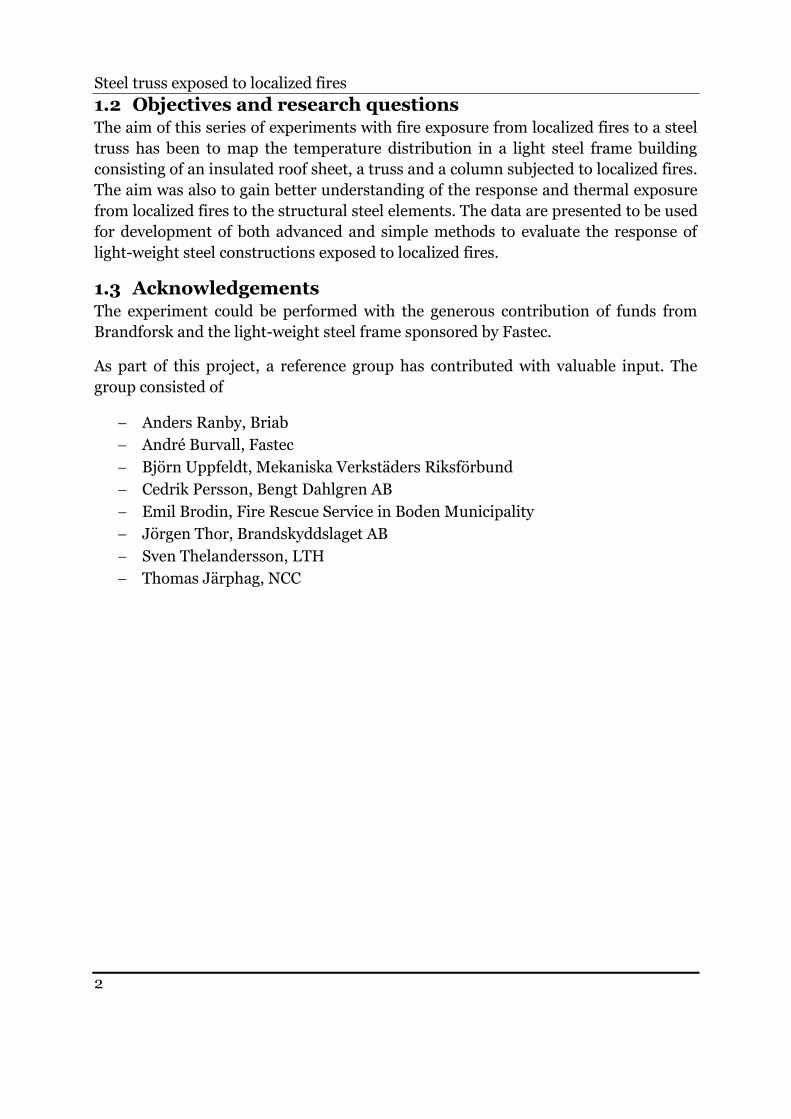
2.1.2 Steel truss
The steel truss consisted of an upper and lower chord separated by braces consisting
of verticals and diagonals, see Figure 2.
Figure 2. View of structural elements in the truss.
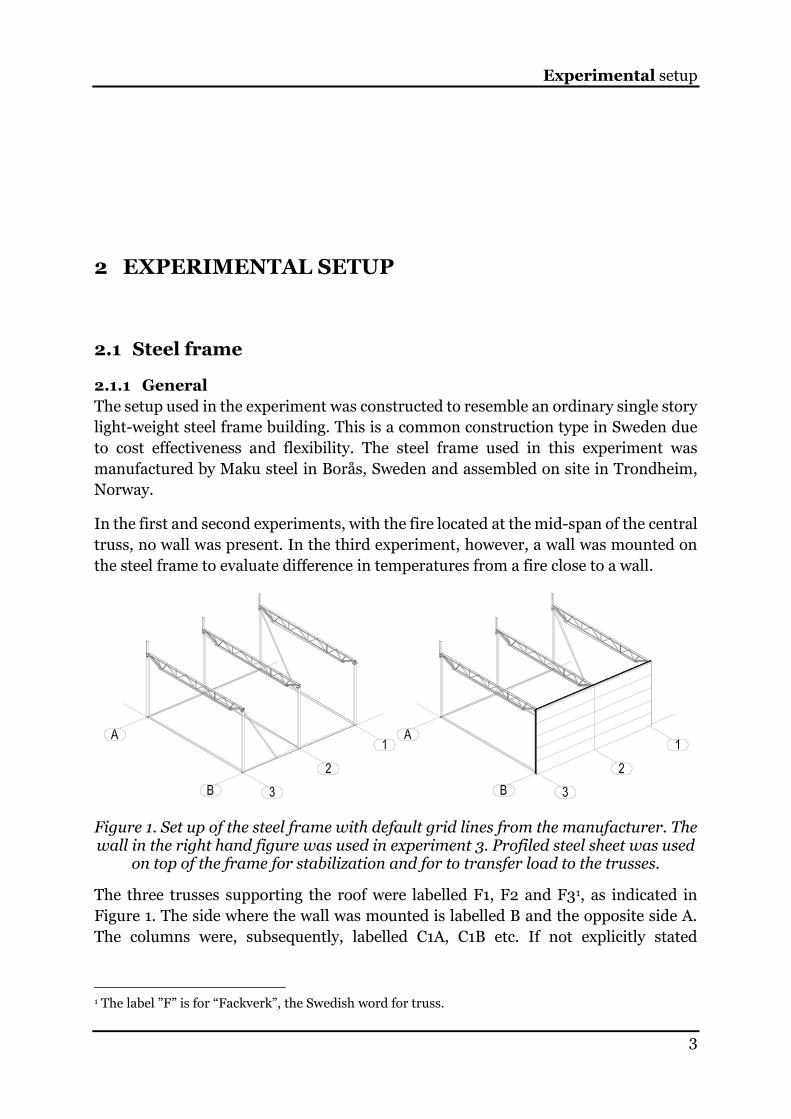
The lower and upper chord consists of angled profiles with dimensions 70 mm x 70
mm x 7 mm and the bracing consists of U-shaped profiles with dimensions 50 mm x
38 mm x 5 mm. The quality of the steel was S355.
Figure 3. Sections in the truss. Angled profiles in the lower and upper cord and U-shaped profiles in the bracing.
2.1.3 Truss to column connection
The connection between the truss and the column consists of a square hollow profile
welded to the upper cord and to a steel U-shaped profile that is bolted to the top plate
of the column. The bolt is of quality 8.8 with the dimension M24. The thickness of the
top plate is 15 mm and the bottom flange of the U-shaped profile is 5 mm thick.
Upper chord
Lower chord
Vertical
Diagonal
5
7
70 50
9 38
Experimental setup
5
Figure 4. Detail of truss to column connection.
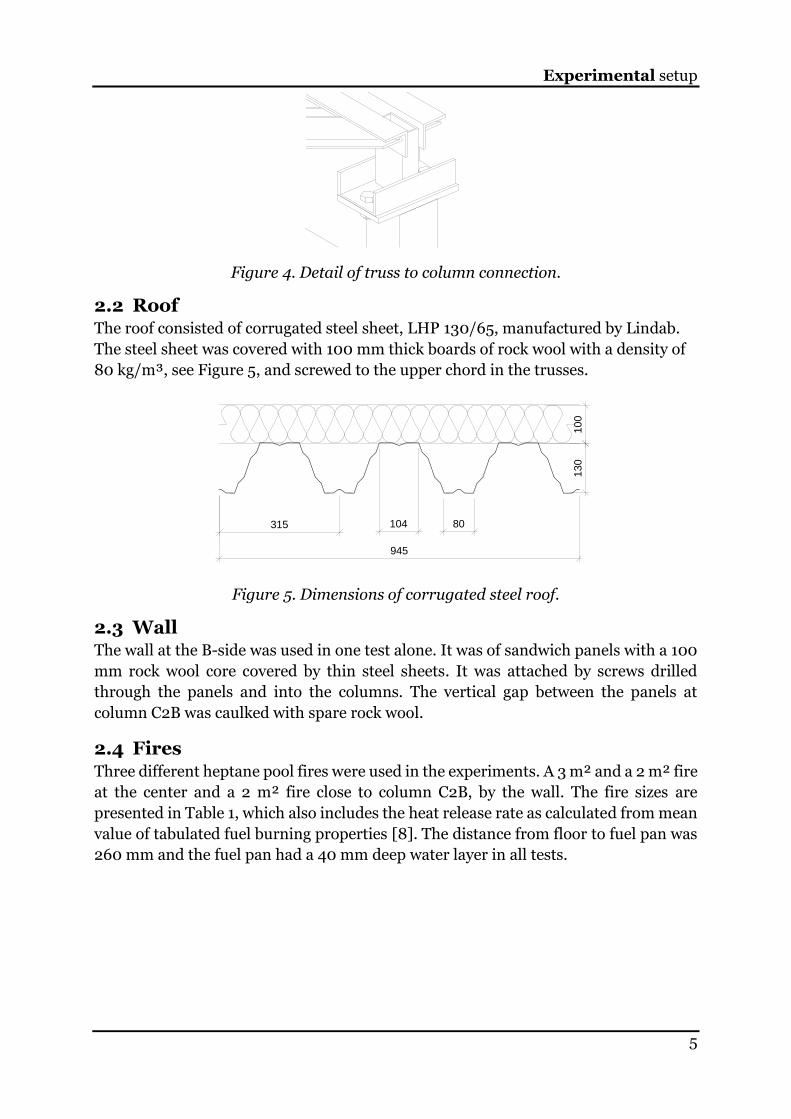
2.2 Roof The roof consisted of corrugated steel sheet, LHP 130/65, manufactured by Lindab.
The steel sheet was covered with 100 mm thick boards of rock wool with a density of
80 kg/m³, see Figure 5, and screwed to the upper chord in the trusses.
Figure 5. Dimensions of corrugated steel roof.
2.3 Wall The wall at the B-side was used in one test alone. It was of sandwich panels with a 100
mm rock wool core covered by thin steel sheets. It was attached by screws drilled
through the panels and into the columns. The vertical gap between the panels at
column C2B was caulked with spare rock wool.
2.4 Fires Three different heptane pool fires were used in the experiments. A 3 m² and a 2 m² fire
at the center and a 2 m² fire close to column C2B, by the wall. The fire sizes are
presented in Table 1, which also includes the heat release rate as calculated from mean
value of tabulated fuel burning properties [8]. The distance from floor to fuel pan was
260 mm and the fuel pan had a 40 mm deep water layer in all tests.
13
0
945
315 104 80
10
0
Steel truss exposed to localized fires
6
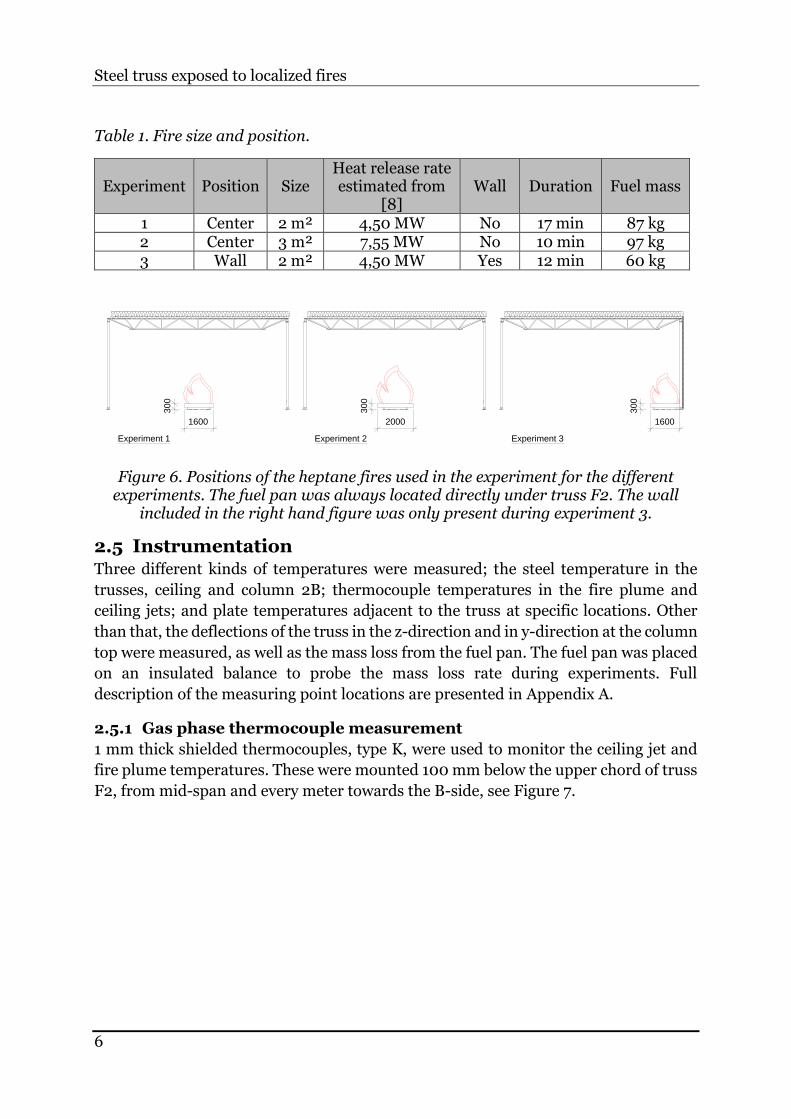
Table 1. Fire size and position.
Experiment Position Size Heat release rate estimated from
[8]
Wall Duration Fuel mass
1 Center 2 m² 4,50 MW No 17 min 87 kg 2 Center 3 m² 7,55 MW No 10 min 97 kg 3 Wall 2 m² 4,50 MW Yes 12 min 60 kg
Figure 6. Positions of the heptane fires used in the experiment for the different experiments. The fuel pan was always located directly under truss F2. The wall
included in the right hand figure was only present during experiment 3.
2.5 Instrumentation Three different kinds of temperatures were measured; the steel temperature in the
trusses, ceiling and column 2B; thermocouple temperatures in the fire plume and
ceiling jets; and plate temperatures adjacent to the truss at specific locations. Other
than that, the deflections of the truss in the z-direction and in y-direction at the column
top were measured, as well as the mass loss from the fuel pan. The fuel pan was placed
on an insulated balance to probe the mass loss rate during experiments. Full
description of the measuring point locations are presented in Appendix A.
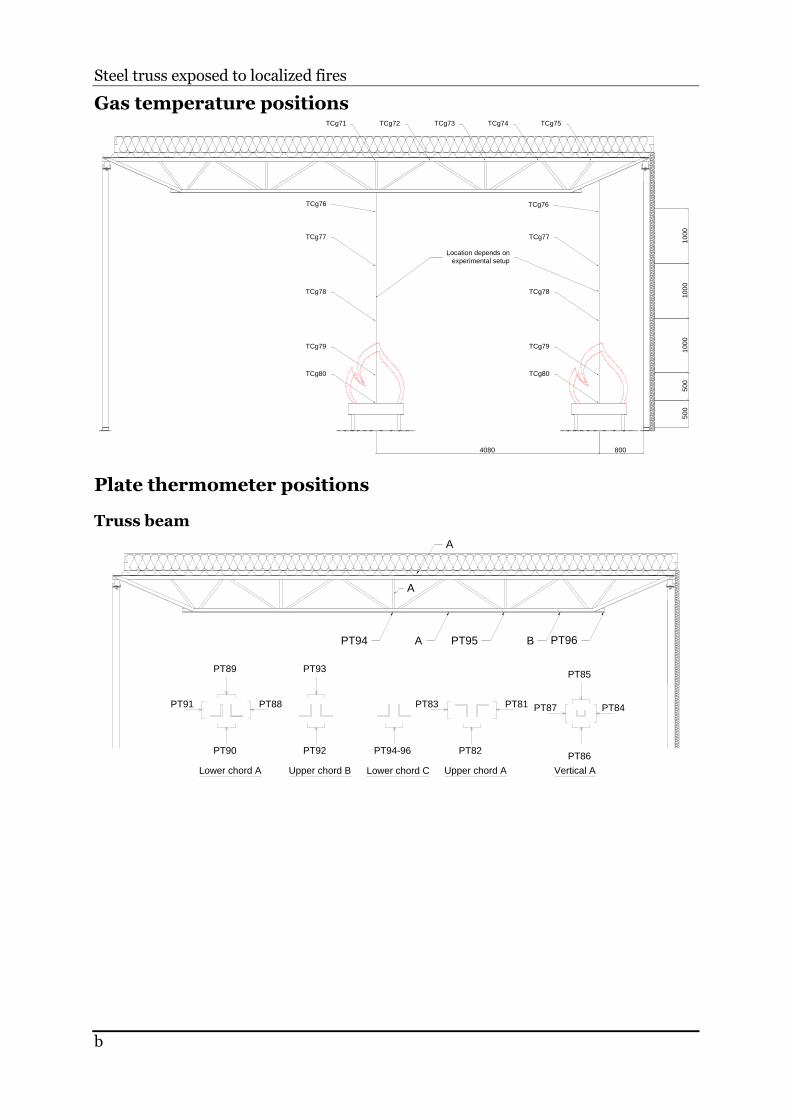
2.5.1 Gas phase thermocouple measurement
1 mm thick shielded thermocouples, type K, were used to monitor the ceiling jet and
fire plume temperatures. These were mounted 100 mm below the upper chord of truss
F2, from mid-span and every meter towards the B-side, see Figure 7.
30
0
1600
30
0
2000
30
0
1600
Experiment 1 Experiment 2 Experiment 3
Experimental setup
7
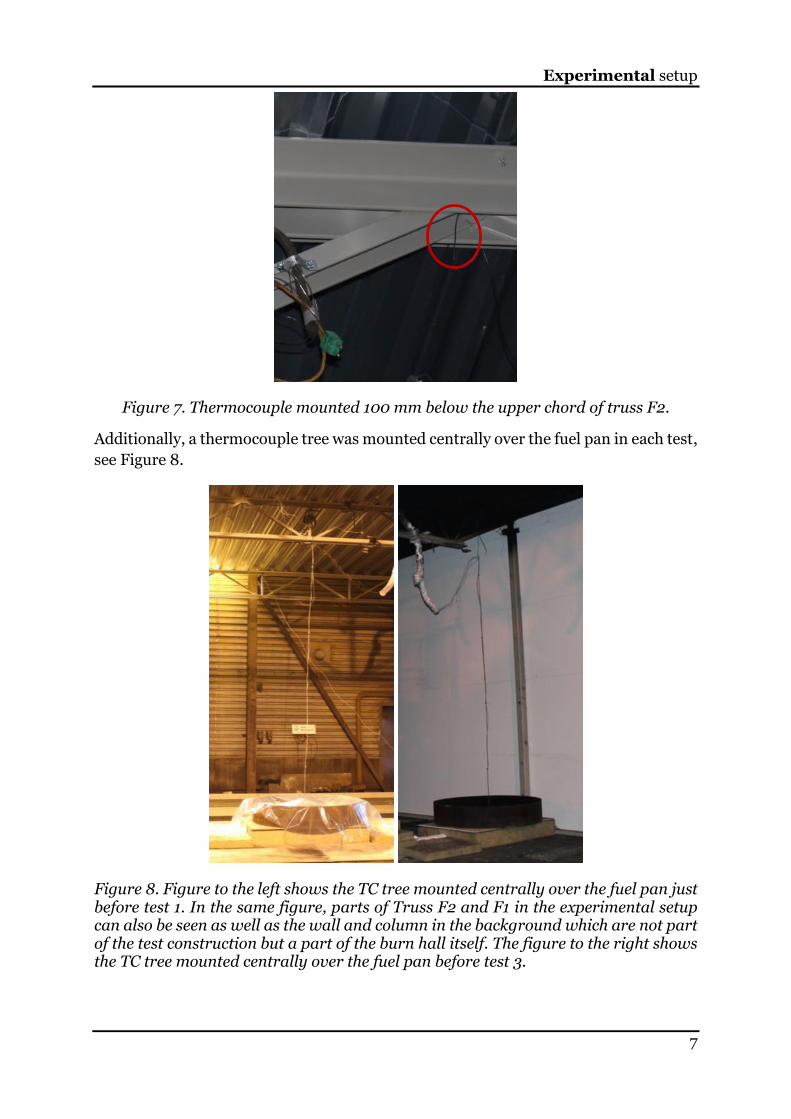
Figure 7. Thermocouple mounted 100 mm below the upper chord of truss F2.
Additionally, a thermocouple tree was mounted centrally over the fuel pan in each test,
see Figure 8.
Figure 8. Figure to the left shows the TC tree mounted centrally over the fuel pan just before test 1. In the same figure, parts of Truss F2 and F1 in the experimental setup can also be seen as well as the wall and column in the background which are not part of the test construction but a part of the burn hall itself. The figure to the right shows the TC tree mounted centrally over the fuel pan before test 3.
Steel truss exposed to localized fires
8
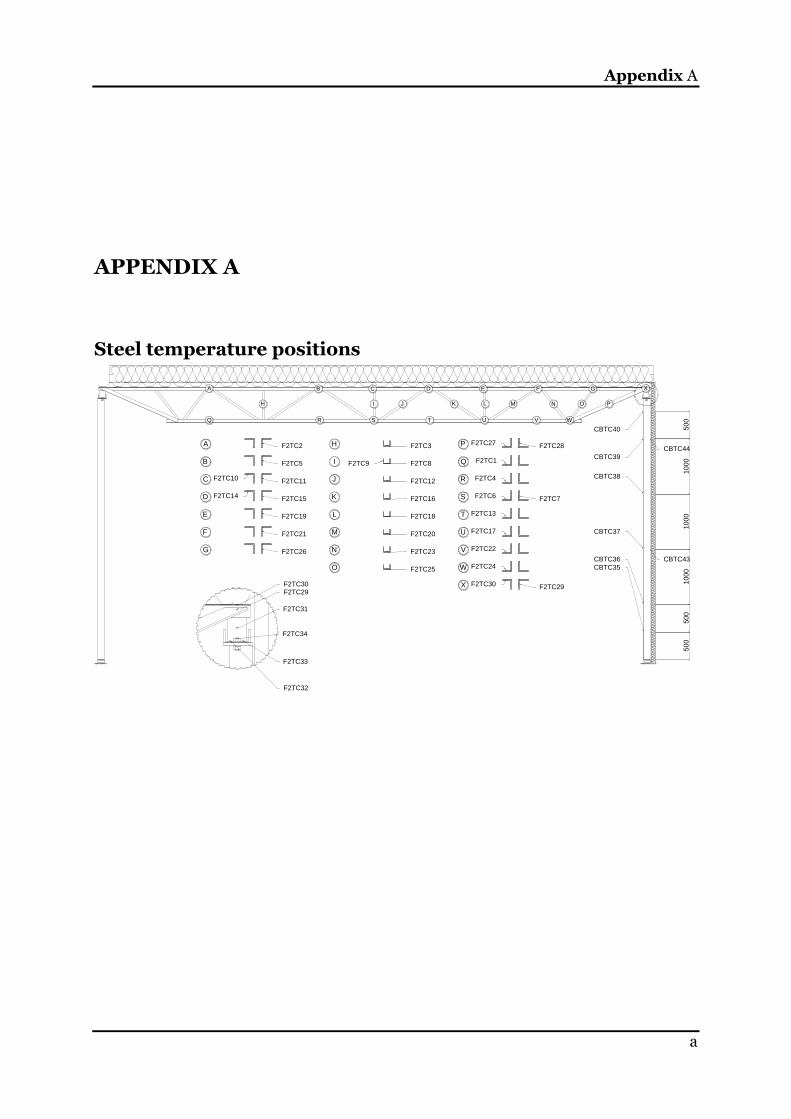
2.5.2 Steel temperature
Steel temperatures in the column were measured with shielded thermocouples, type K.
The thermocouples were peened into 3 mm deep, drilled holes. The temperatures were
probed at six different heights facing the fire and at two different heights on the
unexposed side of the column, see Appendix A. In the ceiling and truss, non-shielded
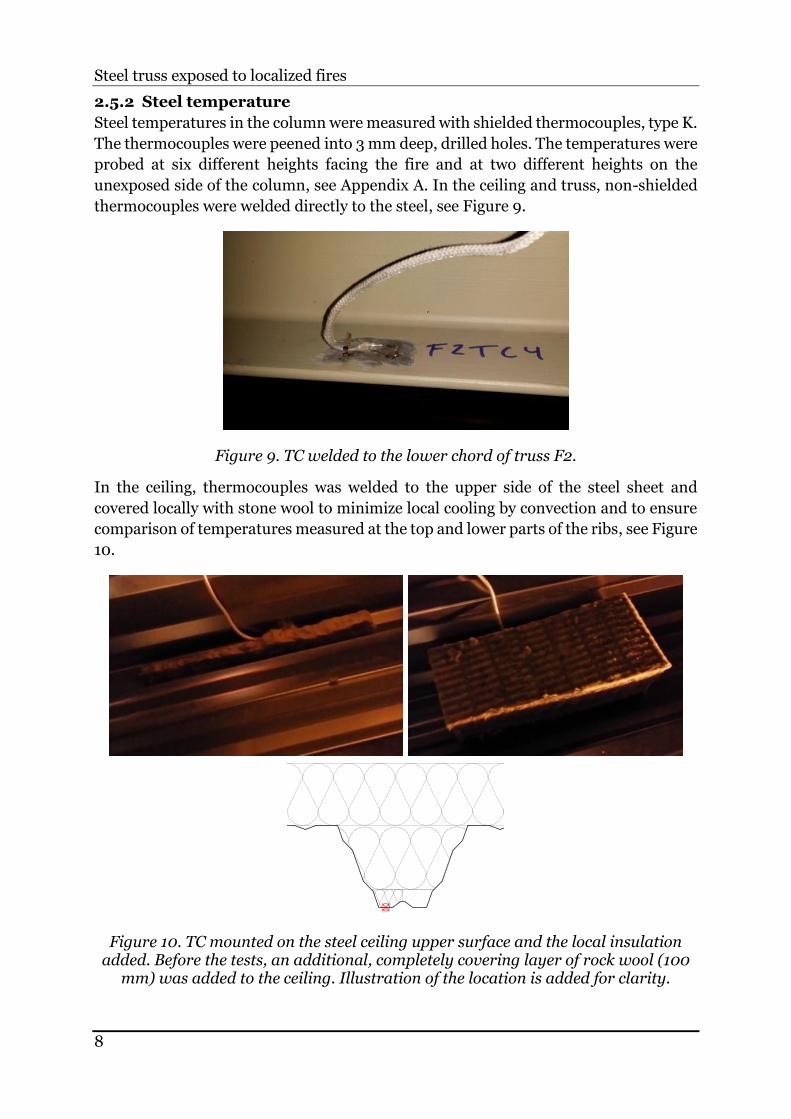
thermocouples were welded directly to the steel, see Figure 9.
Figure 9. TC welded to the lower chord of truss F2.
In the ceiling, thermocouples was welded to the upper side of the steel sheet and
covered locally with stone wool to minimize local cooling by convection and to ensure
comparison of temperatures measured at the top and lower parts of the ribs, see Figure
10.
Figure 10. TC mounted on the steel ceiling upper surface and the local insulation added. Before the tests, an additional, completely covering layer of rock wool (100
mm) was added to the ceiling. Illustration of the location is added for clarity.
Experimental setup
9
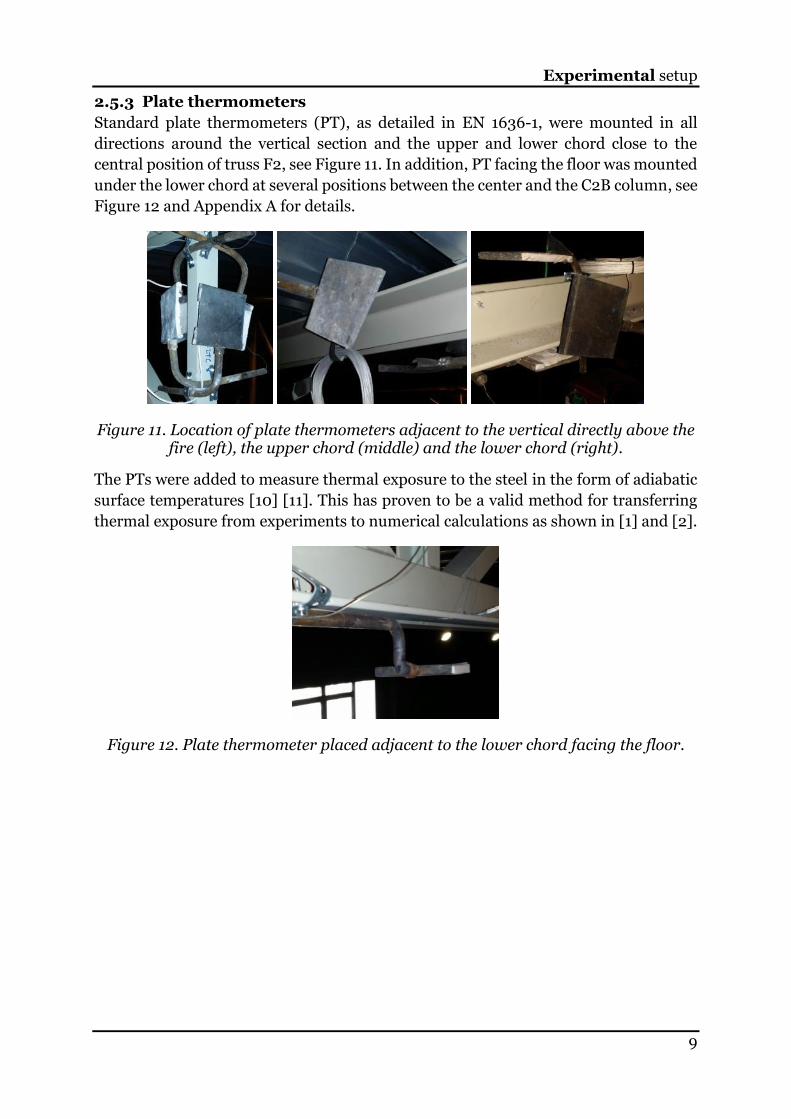
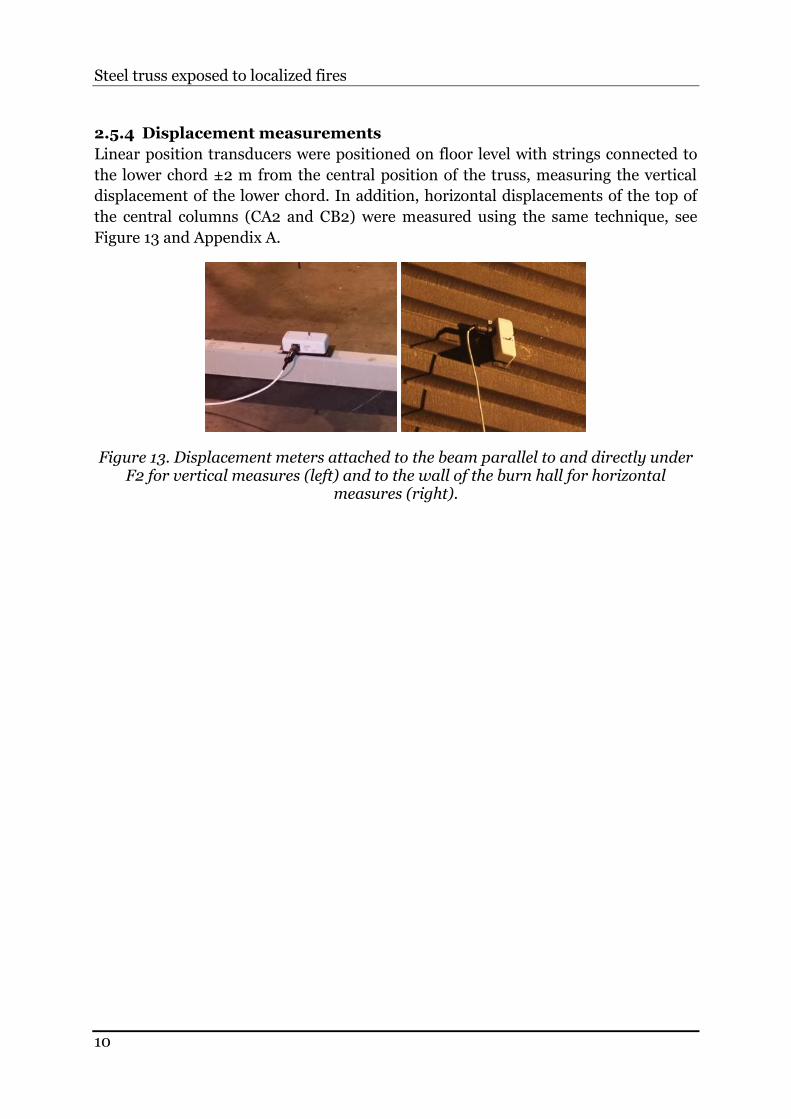
2.5.3 Plate thermometers
Standard plate thermometers (PT), as detailed in EN 1636-1, were mounted in all
directions around the vertical section and the upper and lower chord close to the
central position of truss F2, see Figure 11. In addition, PT facing the floor was mounted
under the lower chord at several positions between the center and the C2B column, see
Figure 12 and Appendix A for details.
Figure 11. Location of plate thermometers adjacent to the vertical directly above the fire (left), the upper chord (middle) and the lower chord (right).
The PTs were added to measure thermal exposure to the steel in the form of adiabatic
surface temperatures [10] [11]. This has proven to be a valid method for transferring
thermal exposure from experiments to numerical calculations as shown in [1] and [2].
Figure 12. Plate thermometer placed adjacent to the lower chord facing the floor.
Steel truss exposed to localized fires
10
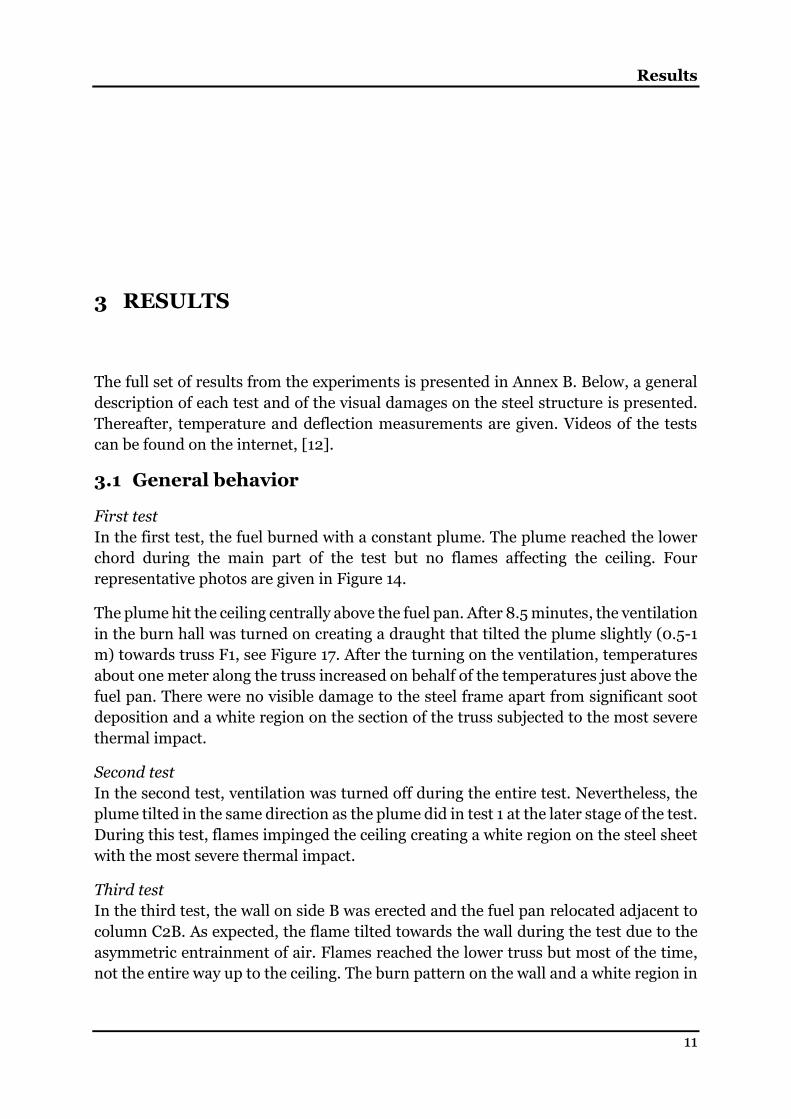
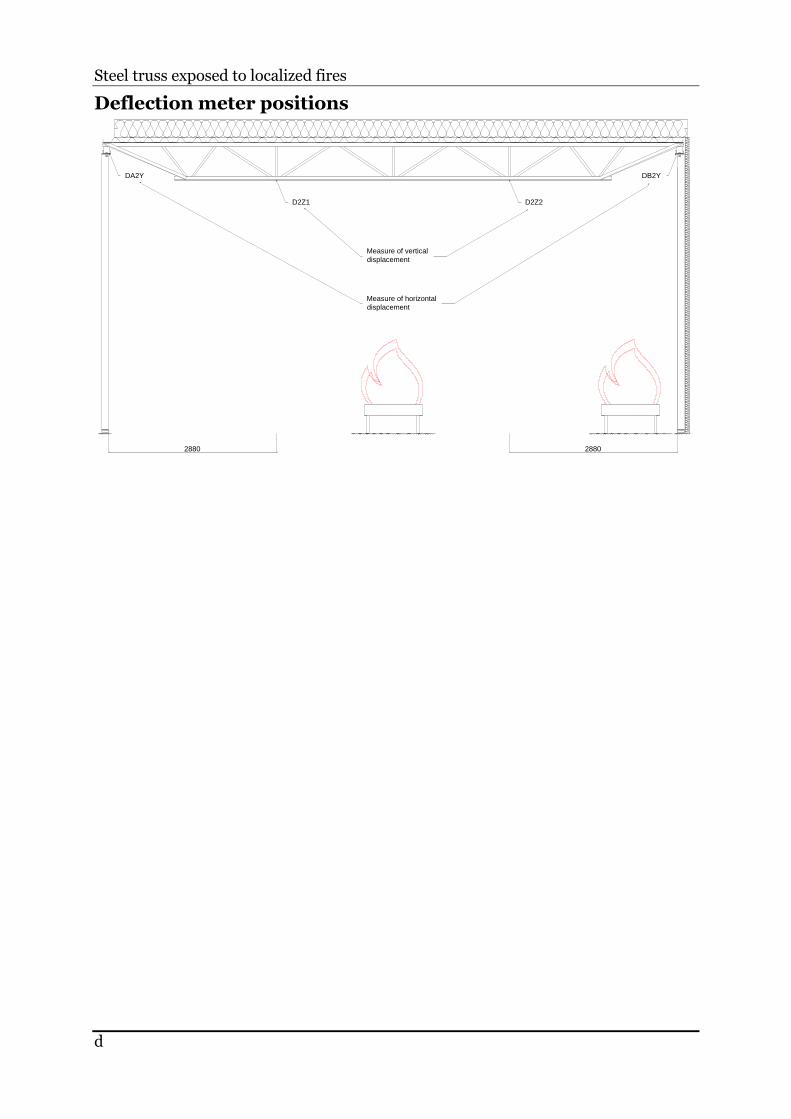
2.5.4 Displacement measurements
Linear position transducers were positioned on floor level with strings connected to
the lower chord ±2 m from the central position of the truss, measuring the vertical
displacement of the lower chord. In addition, horizontal displacements of the top of
the central columns (CA2 and CB2) were measured using the same technique, see
Figure 13 and Appendix A.
Figure 13. Displacement meters attached to the beam parallel to and directly under F2 for vertical measures (left) and to the wall of the burn hall for horizontal
measures (right).
Results
11
3 RESULTS
The full set of results from the experiments is presented in Annex B. Below, a general
description of each test and of the visual damages on the steel structure is presented.
Thereafter, temperature and deflection measurements are given. Videos of the tests
can be found on the internet, [12].
3.1 General behavior
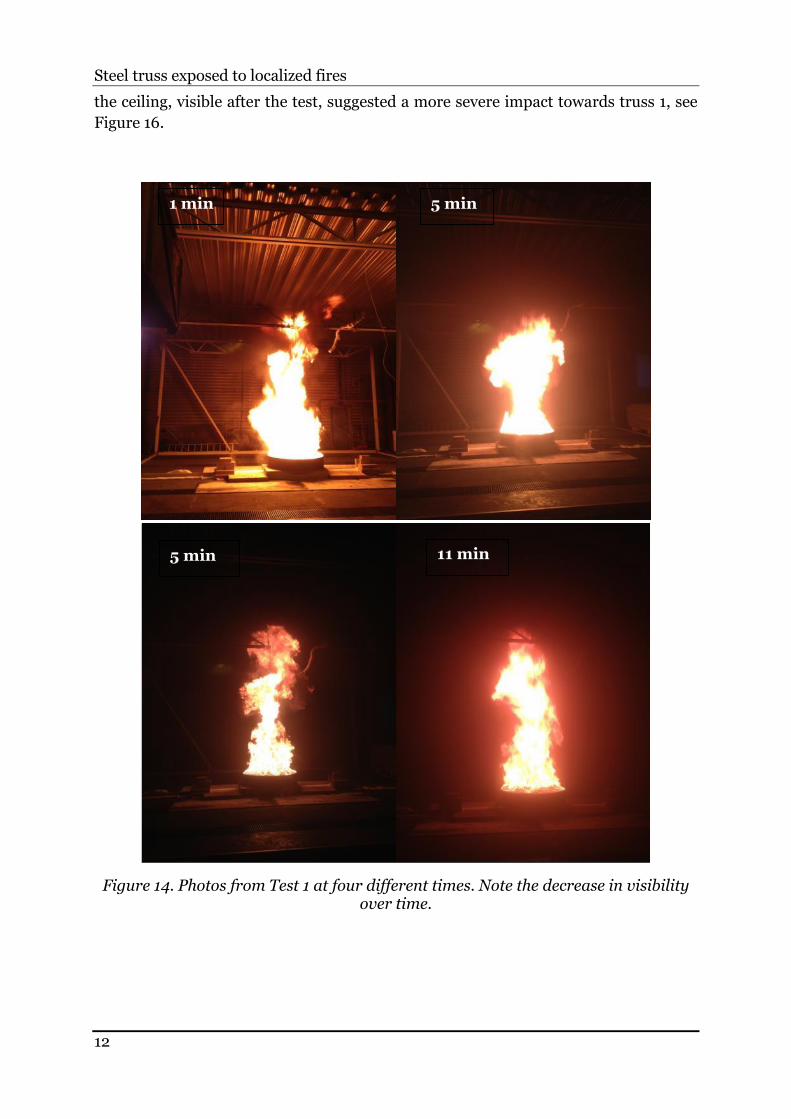
First test
In the first test, the fuel burned with a constant plume. The plume reached the lower
chord during the main part of the test but no flames affecting the ceiling. Four
representative photos are given in Figure 14.
The plume hit the ceiling centrally above the fuel pan. After 8.5 minutes, the ventilation
in the burn hall was turned on creating a draught that tilted the plume slightly (0.5-1
m) towards truss F1, see Figure 17. After the turning on the ventilation, temperatures
about one meter along the truss increased on behalf of the temperatures just above the
fuel pan. There were no visible damage to the steel frame apart from significant soot
deposition and a white region on the section of the truss subjected to the most severe
thermal impact.
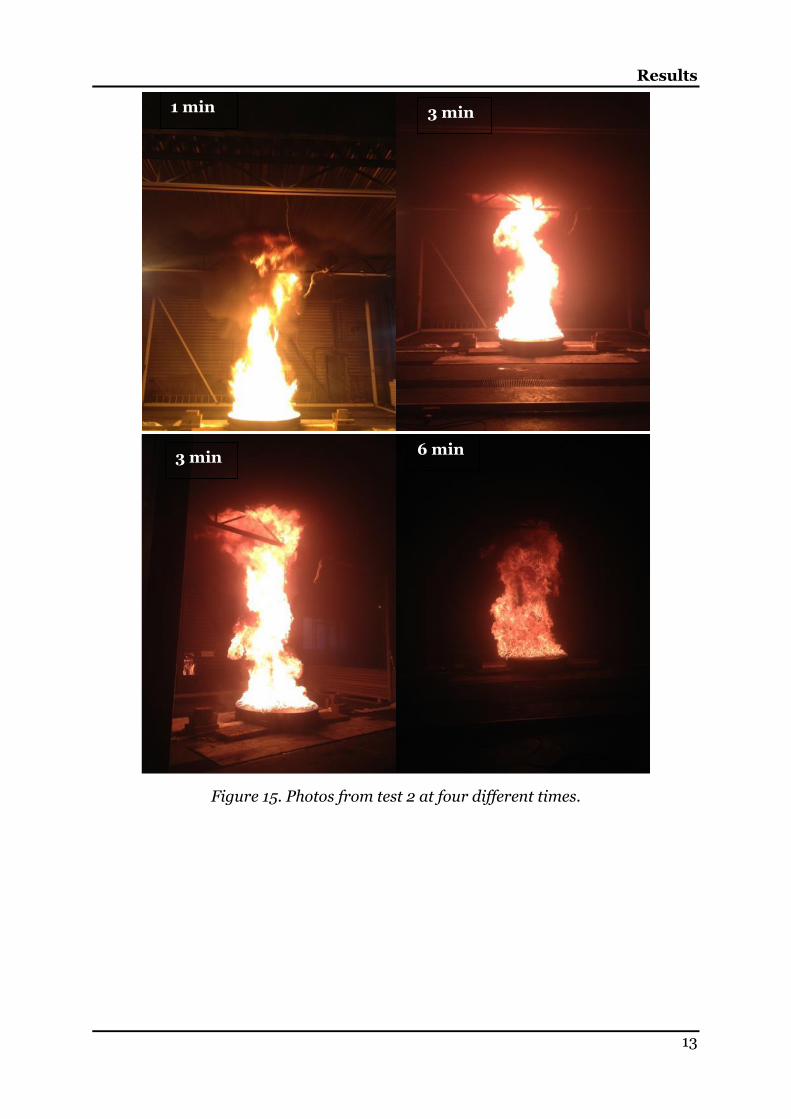
Second test
In the second test, ventilation was turned off during the entire test. Nevertheless, the
plume tilted in the same direction as the plume did in test 1 at the later stage of the test.
During this test, flames impinged the ceiling creating a white region on the steel sheet
with the most severe thermal impact.
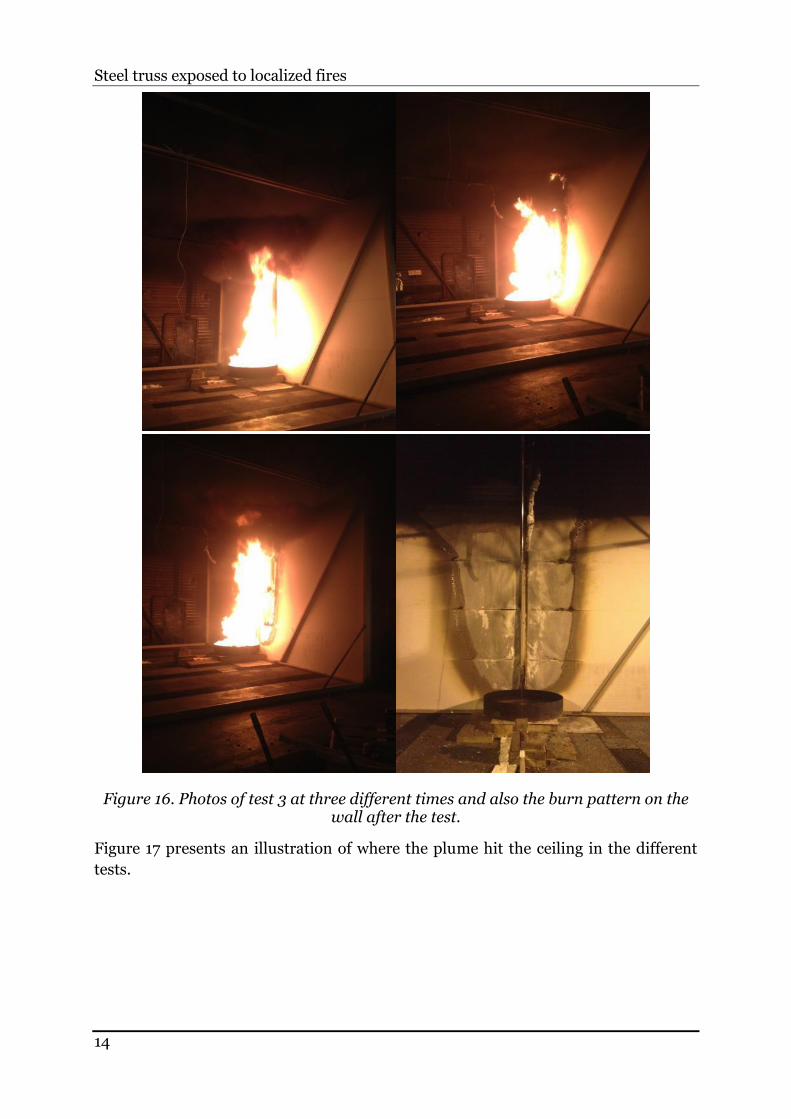
Third test
In the third test, the wall on side B was erected and the fuel pan relocated adjacent to
column C2B. As expected, the flame tilted towards the wall during the test due to the
asymmetric entrainment of air. Flames reached the lower truss but most of the time,
not the entire way up to the ceiling. The burn pattern on the wall and a white region in
Steel truss exposed to localized fires
12
the ceiling, visible after the test, suggested a more severe impact towards truss 1, see
Figure 16.
Figure 14. Photos from Test 1 at four different times. Note the decrease in visibility over time.
1 min 5 min
11 min 5 min
Results
13
Figure 15. Photos from test 2 at four different times.
3 min
3 min 1 min
6 min
Steel truss exposed to localized fires
14
Figure 16. Photos of test 3 at three different times and also the burn pattern on the wall after the test.
Figure 17 presents an illustration of where the plume hit the ceiling in the different
tests.
Results
15
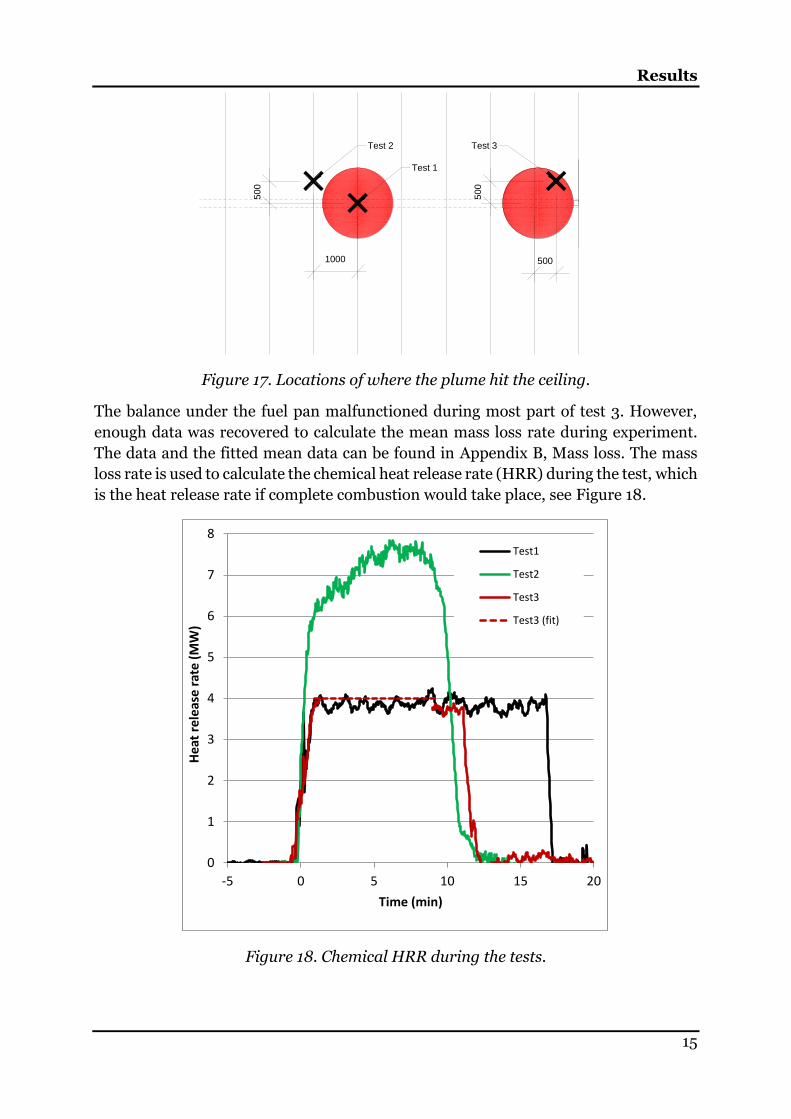
Figure 17. Locations of where the plume hit the ceiling.
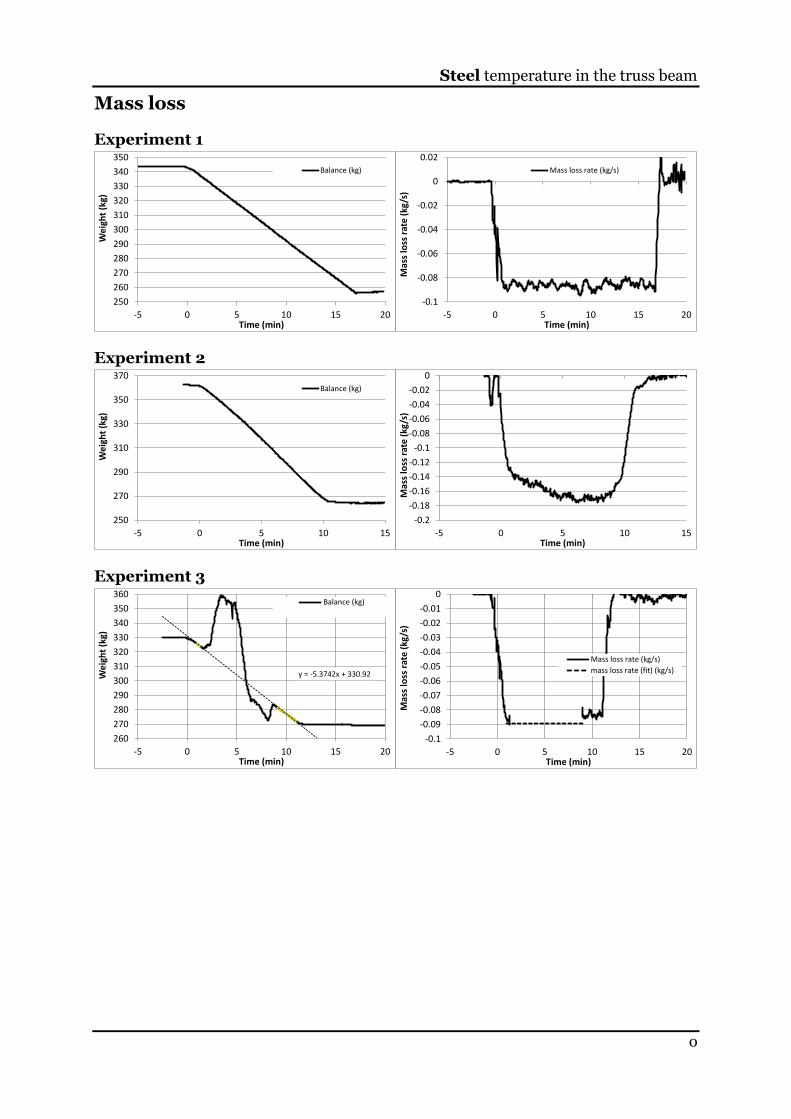
The balance under the fuel pan malfunctioned during most part of test 3. However,
enough data was recovered to calculate the mean mass loss rate during experiment.
The data and the fitted mean data can be found in Appendix B, Mass loss. The mass
loss rate is used to calculate the chemical heat release rate (HRR) during the test, which
is the heat release rate if complete combustion would take place, see Figure 18.
Figure 18. Chemical HRR during the tests.
1000500
500
500
Test 2
Test 1
Test 3
0
1
2
3
4
5
6
7
8
-5 0 5 10 15 20
Hea
t re
leas
e r
ate
(MW
)
Time (min)
Test1
Test2
Test3
Test3 (fit)
Steel truss exposed to localized fires
16
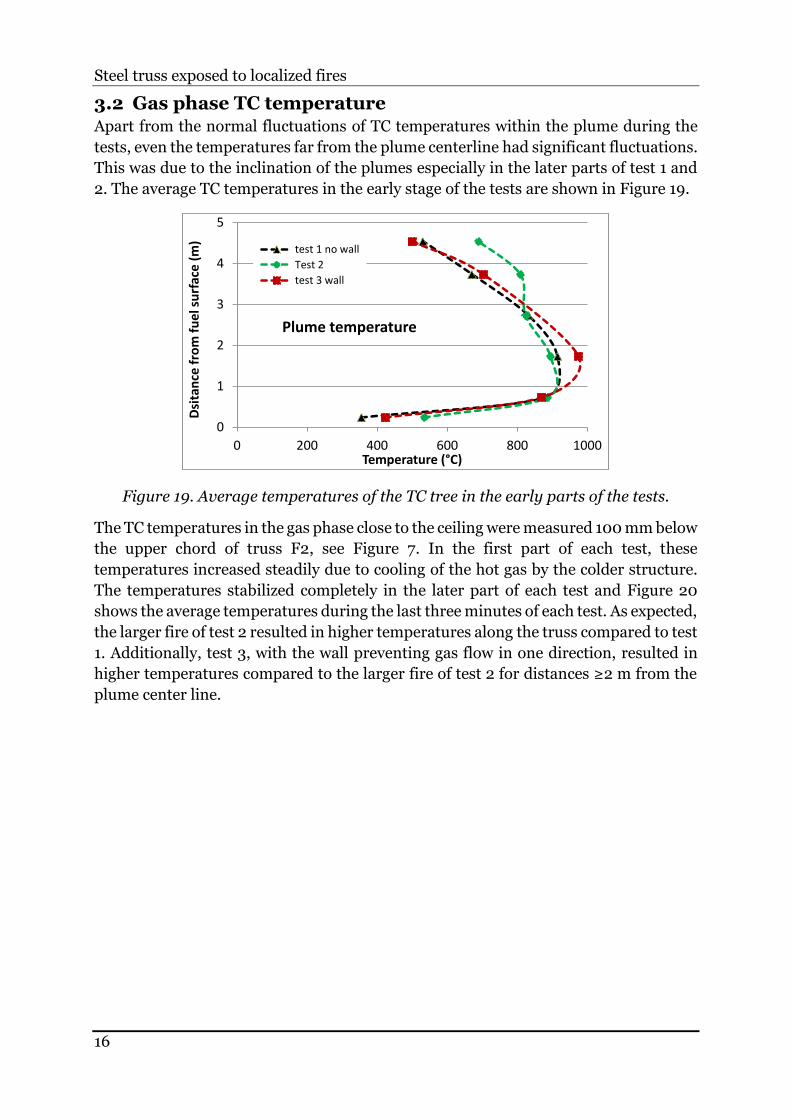
3.2 Gas phase TC temperature Apart from the normal fluctuations of TC temperatures within the plume during the
tests, even the temperatures far from the plume centerline had significant fluctuations.
This was due to the inclination of the plumes especially in the later parts of test 1 and
2. The average TC temperatures in the early stage of the tests are shown in Figure 19.
Figure 19. Average temperatures of the TC tree in the early parts of the tests.
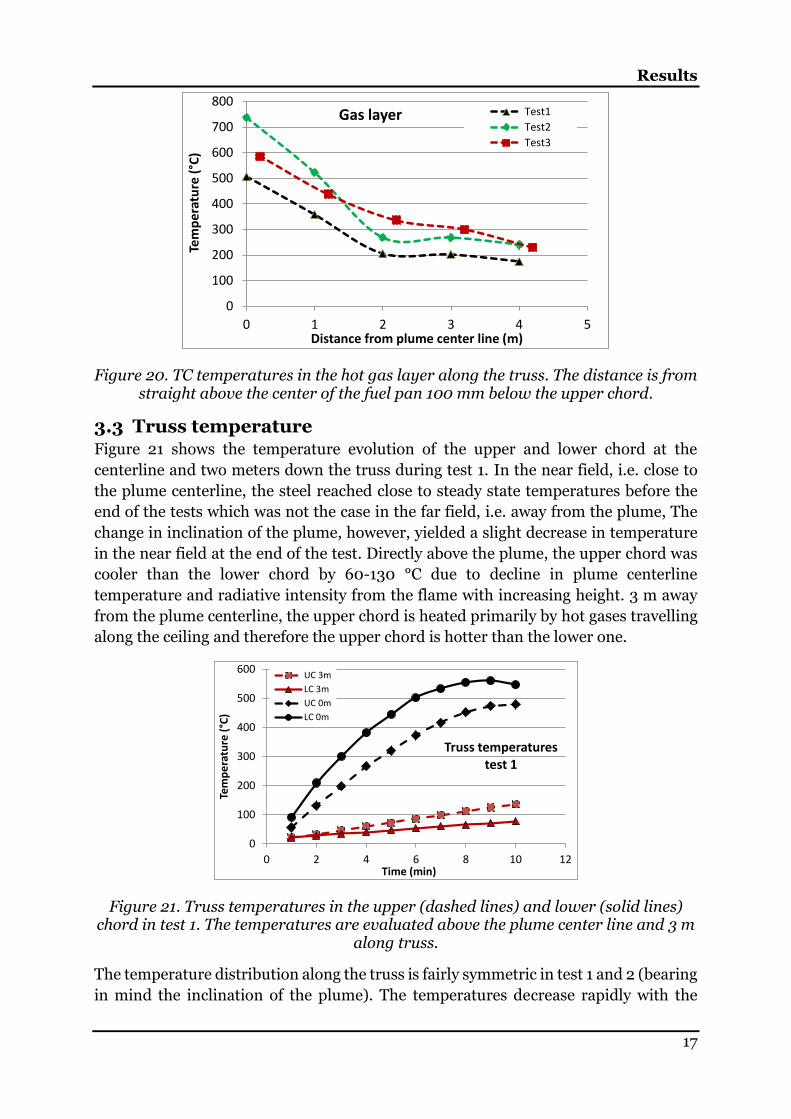
The TC temperatures in the gas phase close to the ceiling were measured 100 mm below
the upper chord of truss F2, see Figure 7. In the first part of each test, these
temperatures increased steadily due to cooling of the hot gas by the colder structure.
The temperatures stabilized completely in the later part of each test and Figure 20
shows the average temperatures during the last three minutes of each test. As expected,
the larger fire of test 2 resulted in higher temperatures along the truss compared to test
1. Additionally, test 3, with the wall preventing gas flow in one direction, resulted in
higher temperatures compared to the larger fire of test 2 for distances ≥2 m from the
plume center line.
0
1
2
3
4
5
0 200 400 600 800 1000
Dsi
tan
ce f
rom
fu
el s
urf
ace
(m
)
Temperature (°C)
Plume temperature
test 1 no wall
Test 2
test 3 wall
Results
17
Figure 20. TC temperatures in the hot gas layer along the truss. The distance is from straight above the center of the fuel pan 100 mm below the upper chord.
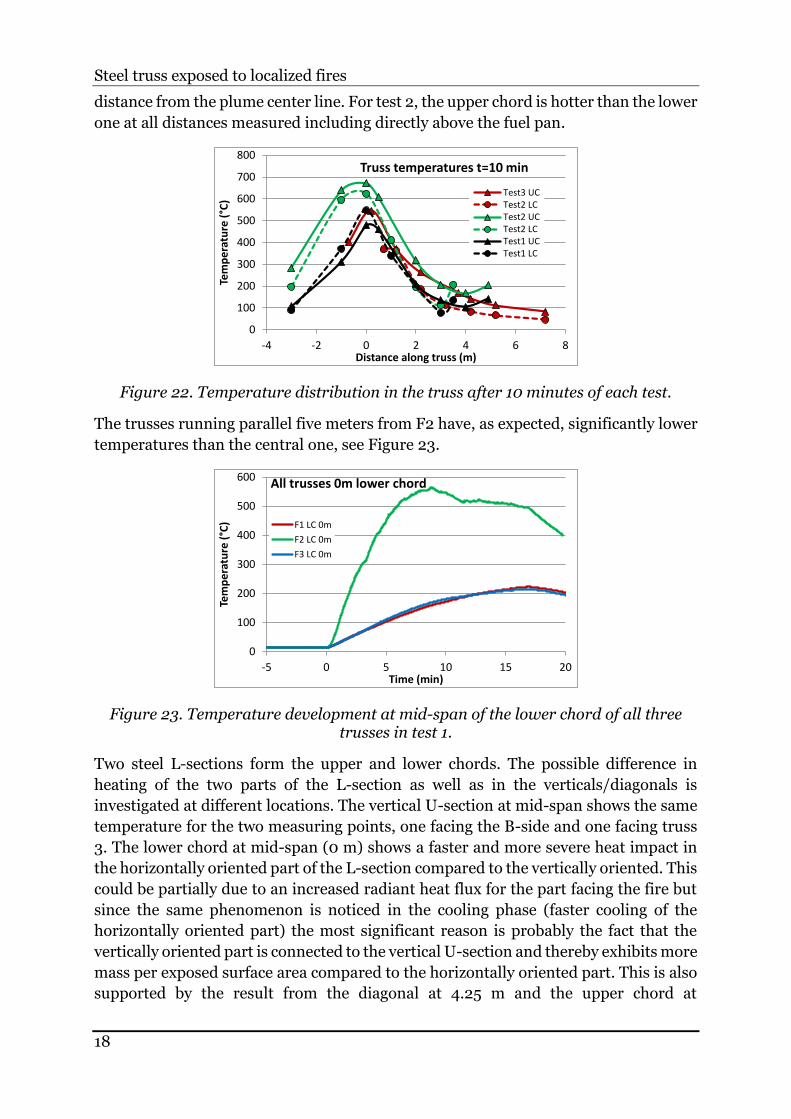
3.3 Truss temperature Figure 21 shows the temperature evolution of the upper and lower chord at the
centerline and two meters down the truss during test 1. In the near field, i.e. close to
the plume centerline, the steel reached close to steady state temperatures before the
end of the tests which was not the case in the far field, i.e. away from the plume, The
change in inclination of the plume, however, yielded a slight decrease in temperature
in the near field at the end of the test. Directly above the plume, the upper chord was
cooler than the lower chord by 60-130 °C due to decline in plume centerline
temperature and radiative intensity from the flame with increasing height. 3 m away
from the plume centerline, the upper chord is heated primarily by hot gases travelling
along the ceiling and therefore the upper chord is hotter than the lower one.
Figure 21. Truss temperatures in the upper (dashed lines) and lower (solid lines) chord in test 1. The temperatures are evaluated above the plume center line and 3 m
along truss.
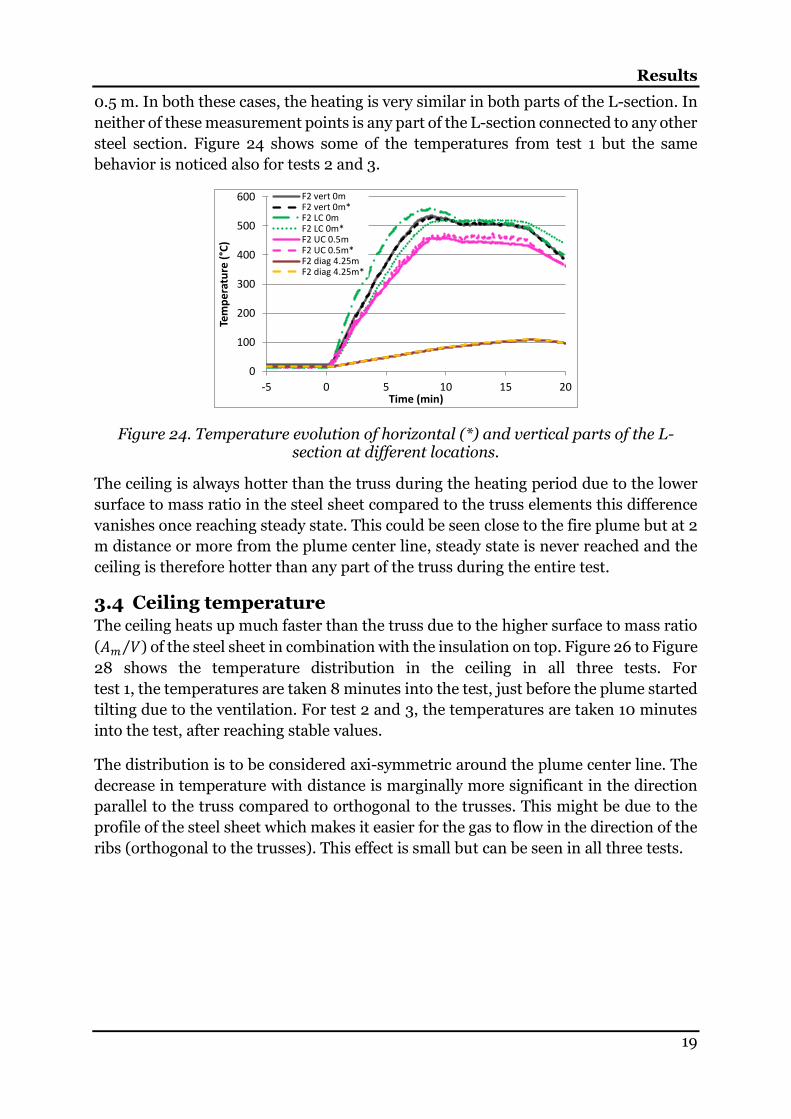
The temperature distribution along the truss is fairly symmetric in test 1 and 2 (bearing
in mind the inclination of the plume). The temperatures decrease rapidly with the
0
100
200
300
400
500
600
700
800
0 1 2 3 4 5
Tem
pe
ratu
re (
°C)
Distance from plume center line (m)
Gas layer Test1
Test2
Test3
0
100
200
300
400
500
600
0 2 4 6 8 10 12
Tem
pe
ratu
re (
°C)
Time (min)
Truss temperaturestest 1
UC 3m
LC 3m
UC 0m
LC 0m
Steel truss exposed to localized fires
18
distance from the plume center line. For test 2, the upper chord is hotter than the lower
one at all distances measured including directly above the fuel pan.
Figure 22. Temperature distribution in the truss after 10 minutes of each test.
The trusses running parallel five meters from F2 have, as expected, significantly lower
temperatures than the central one, see Figure 23.
Figure 23. Temperature development at mid-span of the lower chord of all three trusses in test 1.
Two steel L-sections form the upper and lower chords. The possible difference in
heating of the two parts of the L-section as well as in the verticals/diagonals is
investigated at different locations. The vertical U-section at mid-span shows the same
temperature for the two measuring points, one facing the B-side and one facing truss
3. The lower chord at mid-span (0 m) shows a faster and more severe heat impact in
the horizontally oriented part of the L-section compared to the vertically oriented. This
could be partially due to an increased radiant heat flux for the part facing the fire but
since the same phenomenon is noticed in the cooling phase (faster cooling of the
horizontally oriented part) the most significant reason is probably the fact that the
vertically oriented part is connected to the vertical U-section and thereby exhibits more
mass per exposed surface area compared to the horizontally oriented part. This is also
supported by the result from the diagonal at 4.25 m and the upper chord at
0
100
200
300
400
500
600
700
800
-4 -2 0 2 4 6 8
Tem
per
atu
re (
°C)
Distance along truss (m)
Truss temperatures t=10 min
Test3 UCTest2 LCTest2 UCTest2 LCTest1 UCTest1 LC
0
100
200
300
400
500
600
-5 0 5 10 15 20
Tem
pe
ratu
re (
°C)
Time (min)
All trusses 0m lower chord
F1 LC 0m
F2 LC 0m
F3 LC 0m
Results
19
0.5 m. In both these cases, the heating is very similar in both parts of the L-section. In
neither of these measurement points is any part of the L-section connected to any other
steel section. Figure 24 shows some of the temperatures from test 1 but the same
behavior is noticed also for tests 2 and 3.
Figure 24. Temperature evolution of horizontal (*) and vertical parts of the L-section at different locations.
The ceiling is always hotter than the truss during the heating period due to the lower
surface to mass ratio in the steel sheet compared to the truss elements this difference
vanishes once reaching steady state. This could be seen close to the fire plume but at 2
m distance or more from the plume center line, steady state is never reached and the
ceiling is therefore hotter than any part of the truss during the entire test.
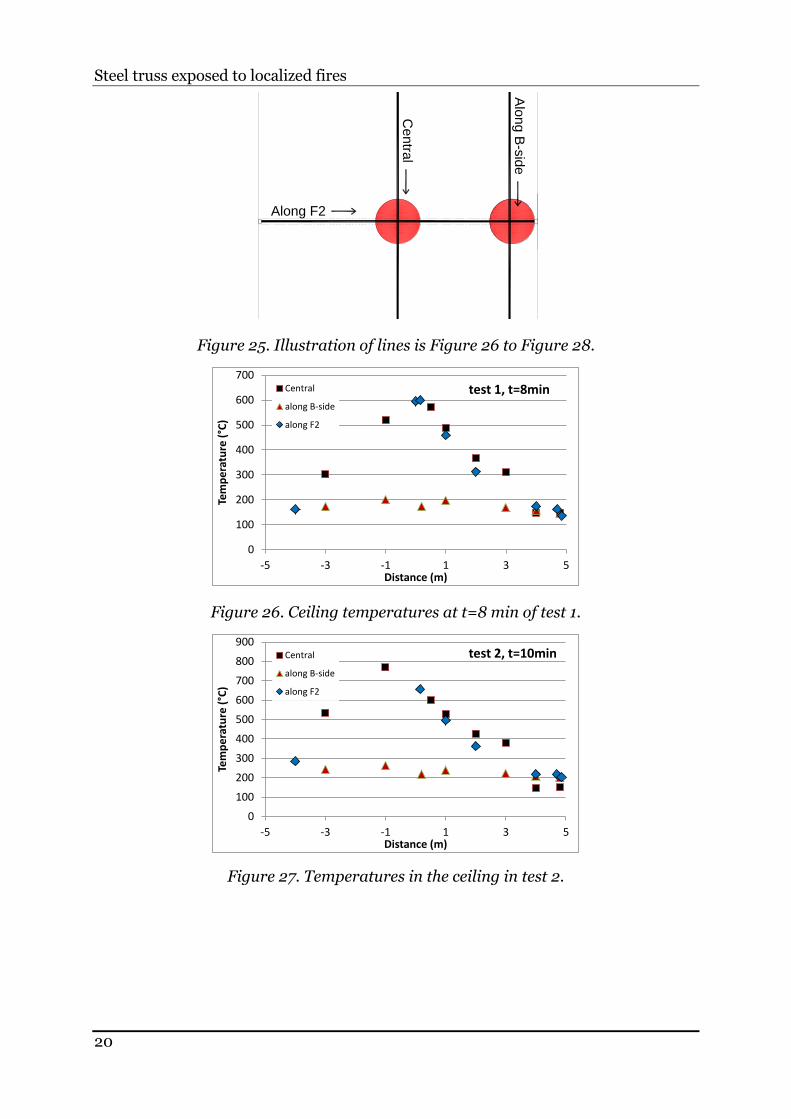
3.4 Ceiling temperature The ceiling heats up much faster than the truss due to the higher surface to mass ratio
(𝐴𝑚 𝑉⁄ ) of the steel sheet in combination with the insulation on top. Figure 26 to Figure
28 shows the temperature distribution in the ceiling in all three tests. For
test 1, the temperatures are taken 8 minutes into the test, just before the plume started
tilting due to the ventilation. For test 2 and 3, the temperatures are taken 10 minutes
into the test, after reaching stable values.
The distribution is to be considered axi-symmetric around the plume center line. The
decrease in temperature with distance is marginally more significant in the direction
parallel to the truss compared to orthogonal to the trusses. This might be due to the
profile of the steel sheet which makes it easier for the gas to flow in the direction of the
ribs (orthogonal to the trusses). This effect is small but can be seen in all three tests.
0
100
200
300
400
500
600
-5 0 5 10 15 20
Tem
per
atu
re (
°C)
Time (min)
F2 vert 0mF2 vert 0m*F2 LC 0mF2 LC 0m*F2 UC 0.5mF2 UC 0.5m*F2 diag 4.25mF2 diag 4.25m*
Steel truss exposed to localized fires
20
Figure 25. Illustration of lines is Figure 26 to Figure 28.
Figure 26. Ceiling temperatures at t=8 min of test 1.
Figure 27. Temperatures in the ceiling in test 2.
Along F2
Centra
l
Alo
ng B
-sid
e
0
100
200
300
400
500
600
700
-5 -3 -1 1 3 5
Tem
per
atu
re (
°C)
Distance (m)
test 1, t=8minCentral
along B-side
along F2
0
100
200
300
400
500
600
700
800
900
-5 -3 -1 1 3 5
Tem
per
atu
re (
°C)
Distance (m)
test 2, t=10minCentral
along B-side
along F2
Results
21
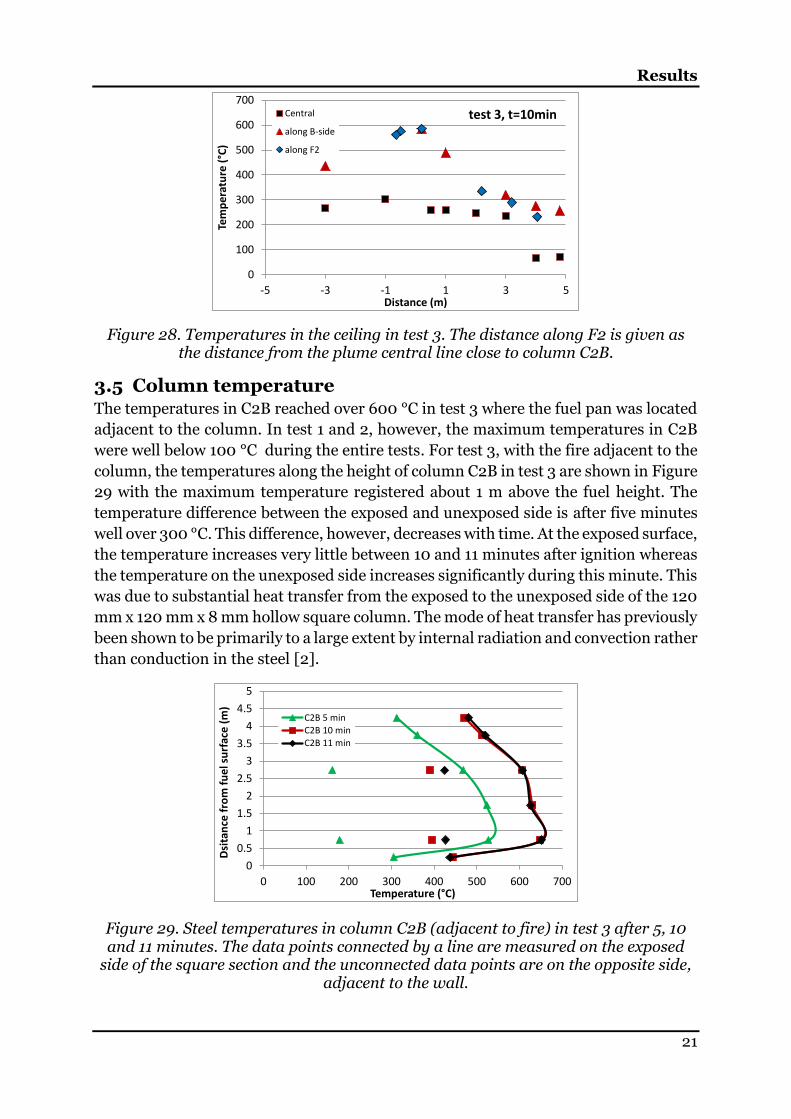
Figure 28. Temperatures in the ceiling in test 3. The distance along F2 is given as the distance from the plume central line close to column C2B.
3.5 Column temperature The temperatures in C2B reached over 600 °C in test 3 where the fuel pan was located
adjacent to the column. In test 1 and 2, however, the maximum temperatures in C2B
were well below 100 °C during the entire tests. For test 3, with the fire adjacent to the
column, the temperatures along the height of column C2B in test 3 are shown in Figure
29 with the maximum temperature registered about 1 m above the fuel height. The
temperature difference between the exposed and unexposed side is after five minutes
well over 300 °C. This difference, however, decreases with time. At the exposed surface,
the temperature increases very little between 10 and 11 minutes after ignition whereas
the temperature on the unexposed side increases significantly during this minute. This
was due to substantial heat transfer from the exposed to the unexposed side of the 120
mm x 120 mm x 8 mm hollow square column. The mode of heat transfer has previously
been shown to be primarily to a large extent by internal radiation and convection rather
than conduction in the steel [2].
Figure 29. Steel temperatures in column C2B (adjacent to fire) in test 3 after 5, 10 and 11 minutes. The data points connected by a line are measured on the exposed
side of the square section and the unconnected data points are on the opposite side, adjacent to the wall.
0
100
200
300
400
500
600
700
-5 -3 -1 1 3 5
Tem
per
atu
re (
°C)
Distance (m)
test 3, t=10minCentral
along B-side
along F2
0
0.5
1
1.5
2
2.5
3
3.5
4
4.5
5
0 100 200 300 400 500 600 700
Dsi
tan
ce f
rom
fu
el s
urf
ace
(m
)
Temperature (°C)
C2B 5 min
C2B 10 min
C2B 11 min
Steel truss exposed to localized fires
22
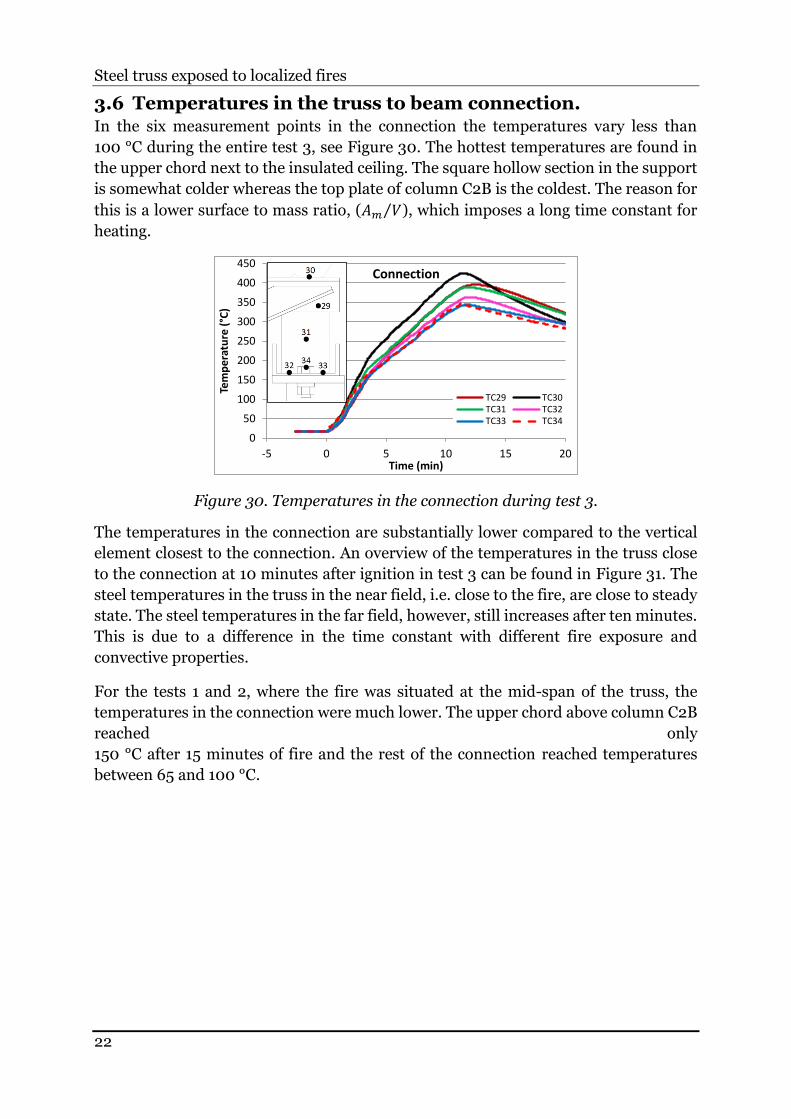
3.6 Temperatures in the truss to beam connection. In the six measurement points in the connection the temperatures vary less than
100 °C during the entire test 3, see Figure 30. The hottest temperatures are found in
the upper chord next to the insulated ceiling. The square hollow section in the support
is somewhat colder whereas the top plate of column C2B is the coldest. The reason for
this is a lower surface to mass ratio, (𝐴𝑚 𝑉⁄ ), which imposes a long time constant for
heating.
Figure 30. Temperatures in the connection during test 3.
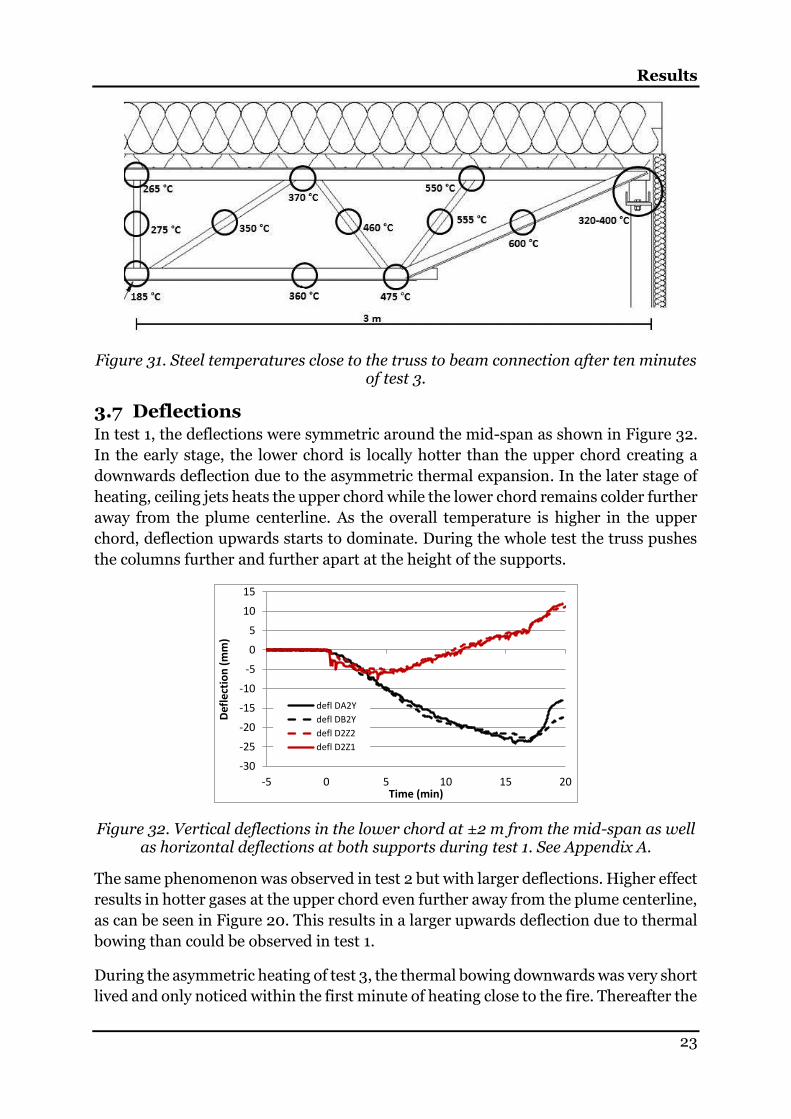
The temperatures in the connection are substantially lower compared to the vertical
element closest to the connection. An overview of the temperatures in the truss close
to the connection at 10 minutes after ignition in test 3 can be found in Figure 31. The
steel temperatures in the truss in the near field, i.e. close to the fire, are close to steady
state. The steel temperatures in the far field, however, still increases after ten minutes.
This is due to a difference in the time constant with different fire exposure and
convective properties.
For the tests 1 and 2, where the fire was situated at the mid-span of the truss, the
temperatures in the connection were much lower. The upper chord above column C2B
reached only
150 °C after 15 minutes of fire and the rest of the connection reached temperatures
between 65 and 100 °C.
0
50
100
150
200
250
300
350
400
450
-5 0 5 10 15 20
Tem
pe
ratu
re (
°C)
Time (min)
Connection
TC29 TC30TC31 TC32TC33 TC34
Results
23
Figure 31. Steel temperatures close to the truss to beam connection after ten minutes of test 3.
3.7 Deflections In test 1, the deflections were symmetric around the mid-span as shown in Figure 32.
In the early stage, the lower chord is locally hotter than the upper chord creating a
downwards deflection due to the asymmetric thermal expansion. In the later stage of
heating, ceiling jets heats the upper chord while the lower chord remains colder further
away from the plume centerline. As the overall temperature is higher in the upper
chord, deflection upwards starts to dominate. During the whole test the truss pushes
the columns further and further apart at the height of the supports.
Figure 32. Vertical deflections in the lower chord at ±2 m from the mid-span as well as horizontal deflections at both supports during test 1. See Appendix A.
The same phenomenon was observed in test 2 but with larger deflections. Higher effect
results in hotter gases at the upper chord even further away from the plume centerline,
as can be seen in Figure 20. This results in a larger upwards deflection due to thermal
bowing than could be observed in test 1.
During the asymmetric heating of test 3, the thermal bowing downwards was very short
lived and only noticed within the first minute of heating close to the fire. Thereafter the
-30
-25
-20
-15
-10
-5
0
5
10
15
-5 0 5 10 15 20
Def
lect
ion
(m
m)
Time (min)
defl DA2Y
defl DB2Y
defl D2Z2
defl D2Z1
Steel truss exposed to localized fires
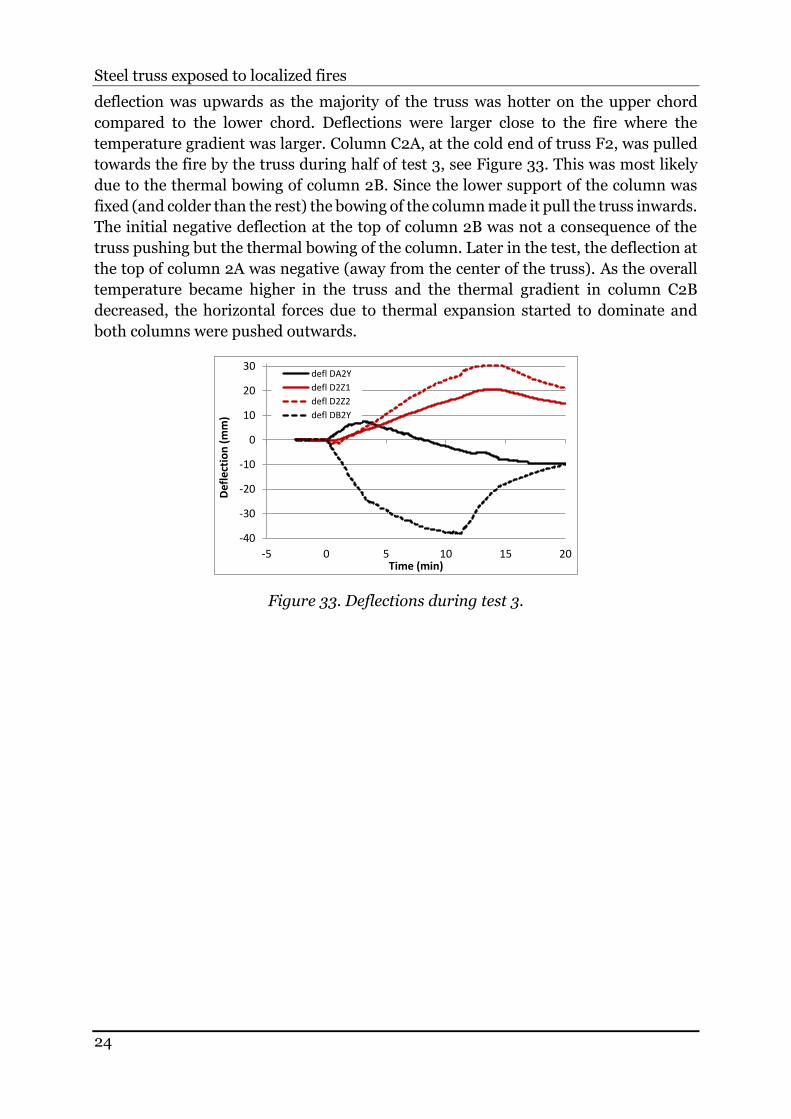
24
deflection was upwards as the majority of the truss was hotter on the upper chord
compared to the lower chord. Deflections were larger close to the fire where the
temperature gradient was larger. Column C2A, at the cold end of truss F2, was pulled
towards the fire by the truss during half of test 3, see Figure 33. This was most likely
due to the thermal bowing of column 2B. Since the lower support of the column was
fixed (and colder than the rest) the bowing of the column made it pull the truss inwards.
The initial negative deflection at the top of column 2B was not a consequence of the
truss pushing but the thermal bowing of the column. Later in the test, the deflection at
the top of column 2A was negative (away from the center of the truss). As the overall
temperature became higher in the truss and the thermal gradient in column C2B
decreased, the horizontal forces due to thermal expansion started to dominate and
both columns were pushed outwards.
Figure 33. Deflections during test 3.
-40
-30
-20
-10
0
10
20
30
-5 0 5 10 15 20
Def
lect
ion
(m
m)
Time (min)
defl DA2Y
defl D2Z1
defl D2Z2
defl DB2Y
References
25
4 REFERENCES
[1] U. Wickström, R. Jansson och H. Touvinen, ”Experiments and theory on heat
transfer and temperature analysis of fire exposed steel beams,” SP Report
2009:19, Borås, 2009.
[2] A. Byström, J. Sjöström, U. Wickström, D. Lange och M. Veljkovic, ”Large Scale
Test on a Steel Column Exposed to Localized Fire,” Journal of Structural Fire
Engineering, vol. 5, pp. 147-160, 2014.
[3] C. Gutiérrez-Montes, E. Sanmiguel-Rojas, A. Viedma och G. Rein, ”Experimental
data and numerical modeling of 1.3 and 2.3 MW fires in a 20 m cubic atrium,”
Building and Environment, vol. 44, pp. 1824-1839, 2009.
[4] Y. Hasemi, Y. Yokobayashi, T. Wakamatsu och A. V. Ptchelintsev, ”Modeling of
heating mechanism and thermal response of structural components exposed to
localized fires: a new application of diffusion flame modeling to fire safety
engineering. NIST internal report 6030,” National Institute of Standards and
Technology, Gaithersburg, Maryland, 1997.
[5] ”Eurocode 1: actions on structures — part 1-2: general actions — actions on
structures,” 2002.
[6] S. Kumar, S. Miles, S. Welch, O. Vassart, B. Zhao, A. D. Lemaire, L. M. Noordijk,
J. H. H. Fellinger och J.-M. Franssen, ”FIRESTRUC - integrating advanced three-
dimensional modelling mehodologies for predicting thermo-mechanical
behaviour of steel and composite structures subjected to natural fires, RFS-CR-
03030,” European Commission, 2006.
[7] C.-k. Chen och W. Zhang, ”Structural behaviors of steel roof truss exposed to pool
fire,” Journal of Central South University, vol. 19, pp. 2054-2060, 2012.
Steel truss exposed to localized fires
26
[8] A. Tewarson, ”Generation of Heat and Gaseous, Liquid and Solid Products in
Fires,” i SFPE Handbook of Fire Protection Engineering, 4th edition, Quincy,
MA, Natl Fire Protection Assn, 2008.
[9] ”EN 1363-1 Fire Resistance tests. General requirements,” 2012.
[10] U. Wickström, ”Adiabatic Surface Temperature and the Plate Thermometer for
Calculating Heat Transfer and Controlling Fire Resistance Furnaces,” i Fire
Safety Science 9, Karlsruhe, 2008.
[11] U. Wickström, ”The plate thermometer - a simple instrument for reaching
harmonized fire resistance tests,” Fire Technology, vol. 30, pp. 195-208, May
1994.
[12] [Online]. Available: www.later.com.
[13] U. Wickström, ”The Adiabatic Surface Temperature and the Plate Thermometer,”
i Fire safety science - Proceedings of the thenth international symposium,
Collage Park, MD, 2011.
[14] U. Wickström, D. Duthinh och K. McGrattan, ”Adiabatic Surface Temperature for
Calculating Heat Transfer to Fire Exposed Structures,” i Proceedings of the 11th
International Conference on Fire Science and Engineering - Interflam, London,
2007.
Appendix A
a
APPENDIX A
Steel temperature positions
B
J
A
Q
H
B
R
I J K L M N O P
S T U V W
C D E F G
A
C
D
E
F
G
H
I
K
L
M
N
O
P
Q
R
S
T
U
V
W
F2TC2
F2TC5
F2TC11
F2TC15
F2TC19
F2TC21
F2TC26
F2TC3
F2TC8
F2TC12
F2TC16
F2TC18
F2TC20
F2TC23
F2TC25
F2TC7F2TC14
F2TC10
F2TC9
F2TC27
F2TC1
F2TC4
F2TC6
F2TC13
F2TC17
F2TC22
F2TC24
F2TC32
F2TC33
F2TC34
F2TC31
F2TC29
CBTC35
CBTC36
CBTC37
CBTC38
CBTC40
CBTC43
CBTC44F2TC28
CBTC39
X F2TC29F2TC30F2TC30
X
50
05
00
10
00
10
00
10
00
50
0
Steel truss exposed to localized fires
b
Gas temperature positions
Plate thermometer positions
Truss beam
TCg80
TCg79
TCg78
TCg77
TCg76
TCg71 TCg72 TCg73 TCg74 TCg75
TCg80
TCg79
TCg78
TCg77
TCg76
Location depends on
experimental setup
800
50
05
00
10
00
10
00
10
00
4080
A
A
A
PT94 PT95 PT96B
Lower chord A Upper chord B Lower chord C Upper chord A Vertical A
PT93
PT92
PT89
PT90
PT85
PT86PT82
PT91 PT88 PT83 PT81 PT87 PT84
PT94-96
Appendix A
c
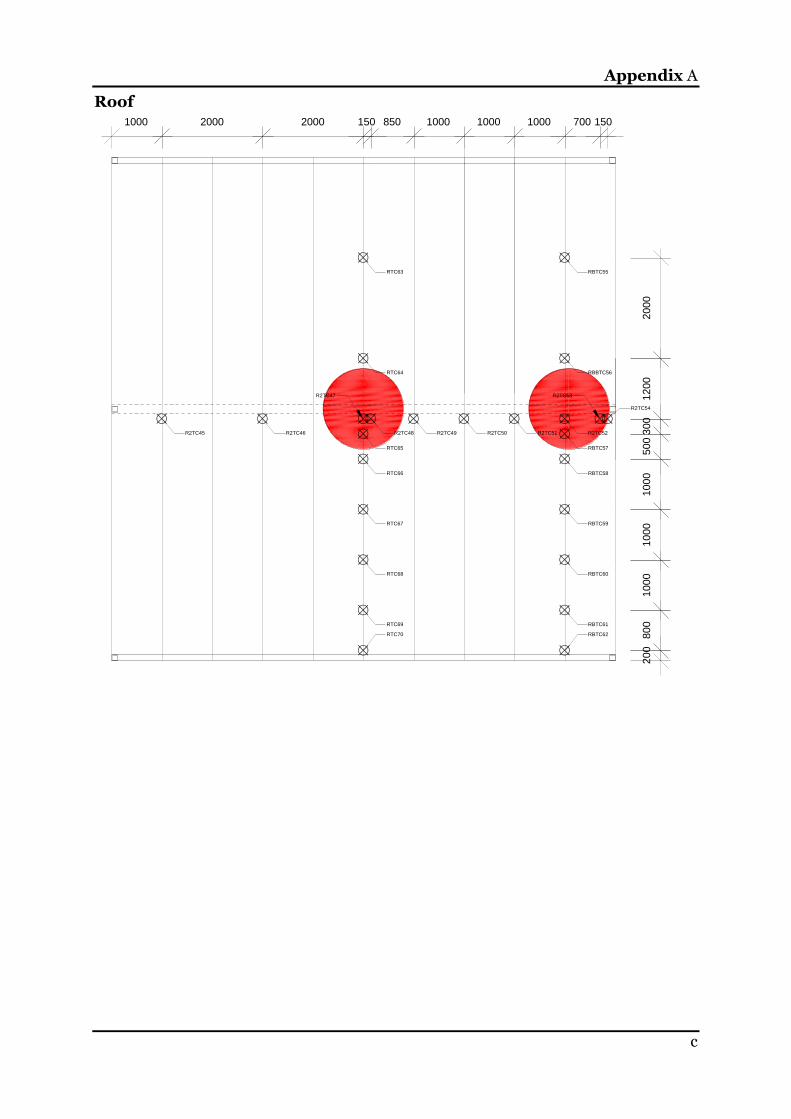
Roof
2000
1200
300
500
1000
1000
1000
800
1000 2000 2000 150 850 1000 1000 1000 700 150
R2TC45 R2TC46
R2TC47
RTC65
RTC66
RTC67
RTC68
RTC69
RTC64
RTC63 RBTC55
RBBTC56
R2TC50 R2TC51 R2TC52
R2TC54
RBTC58
RBTC59
RBTC60
RBTC61
R2TC49R2TC48
R2TC53
RBTC57
RBTC62RTC70
200
Steel truss exposed to localized fires
d
Deflection meter positions
DA2Y DB2Y
D2Z1 D2Z2
Measure of horizontal
displacement
Measure of vertical
displacement
28802880
Appendix B
e
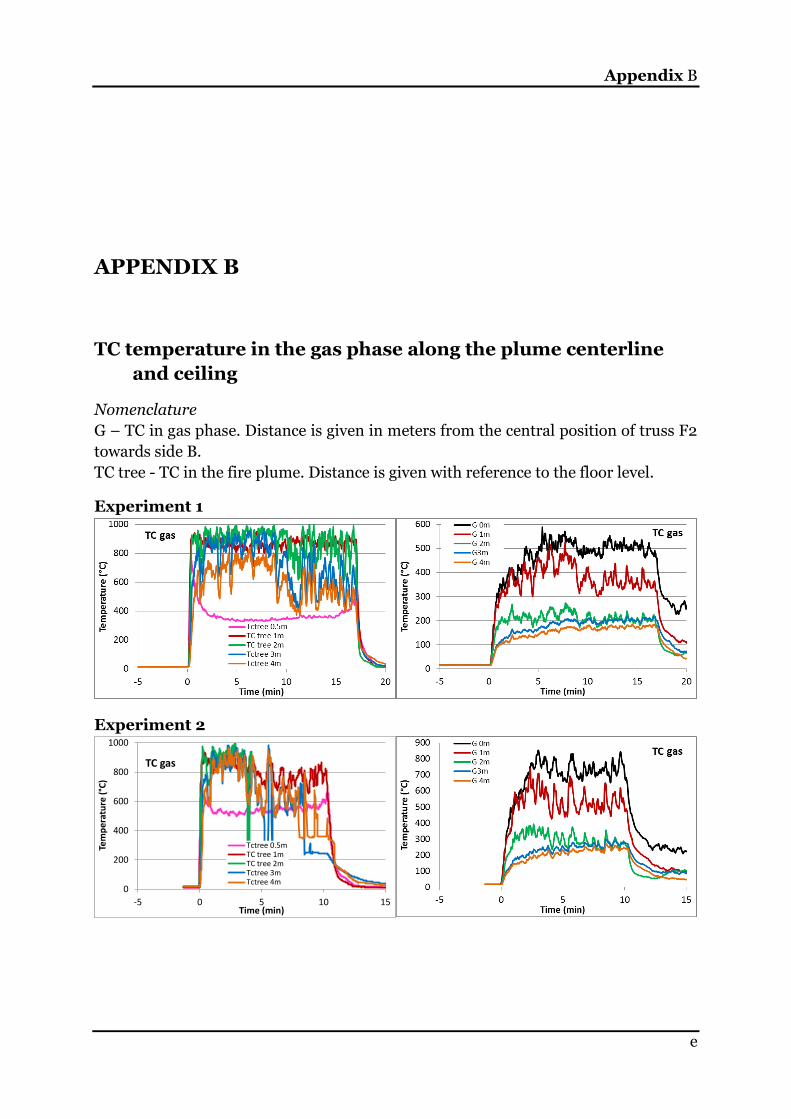
APPENDIX B
TC temperature in the gas phase along the plume centerline
and ceiling
Nomenclature
G – TC in gas phase. Distance is given in meters from the central position of truss F2
towards side B.
TC tree - TC in the fire plume. Distance is given with reference to the floor level.
Experiment 1
Experiment 2
0
200
400
600
800
1000
-5 0 5 10 15
Tem
pe
ratu
re (
°C)
Time (min)
TC gas
Tctree 0.5mTC tree 1mTC tree 2mTctree 3mTctree 4m
Steel truss exposed to localized fires
f
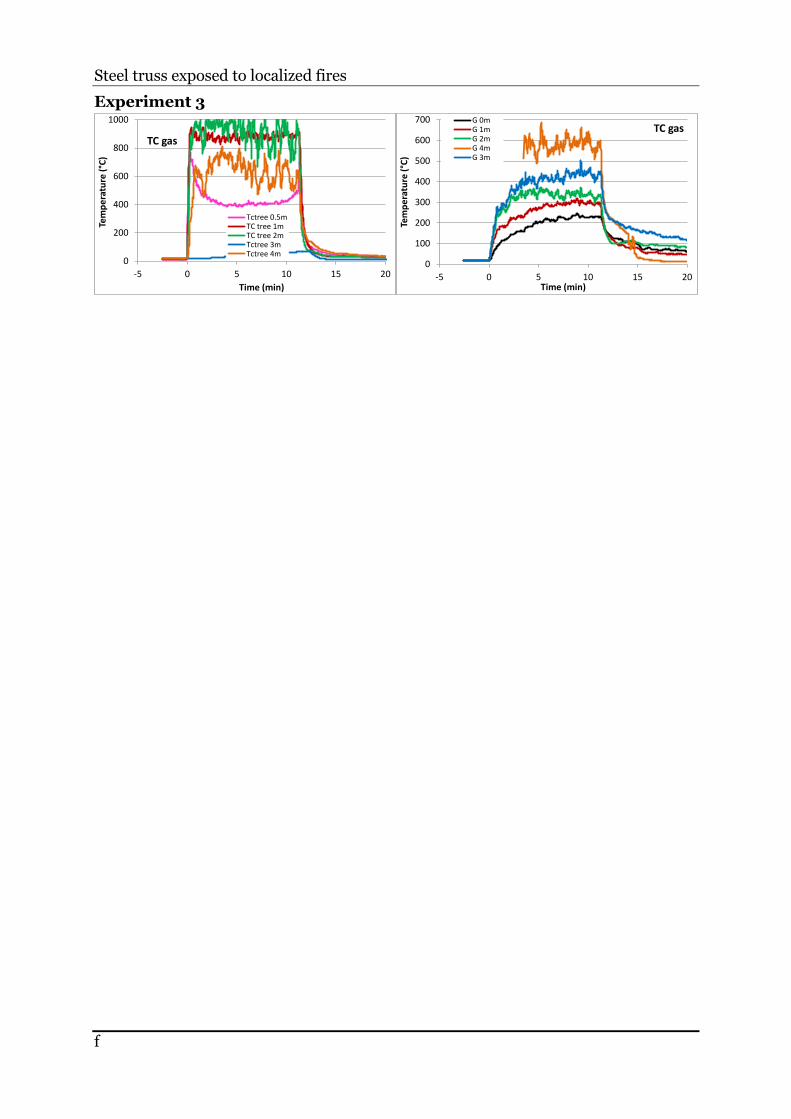
Experiment 3
0
200
400
600
800
1000
-5 0 5 10 15 20
Tem
pe
ratu
re (
°C)
Time (min)
TC gas
Tctree 0.5mTC tree 1mTC tree 2mTctree 3mTctree 4m
0
100
200
300
400
500
600
700
-5 0 5 10 15 20
Tem
per
atu
re (
°C)
Time (min)
TC gasG 0mG 1mG 2mG 4mG 3m
Appendix B
g
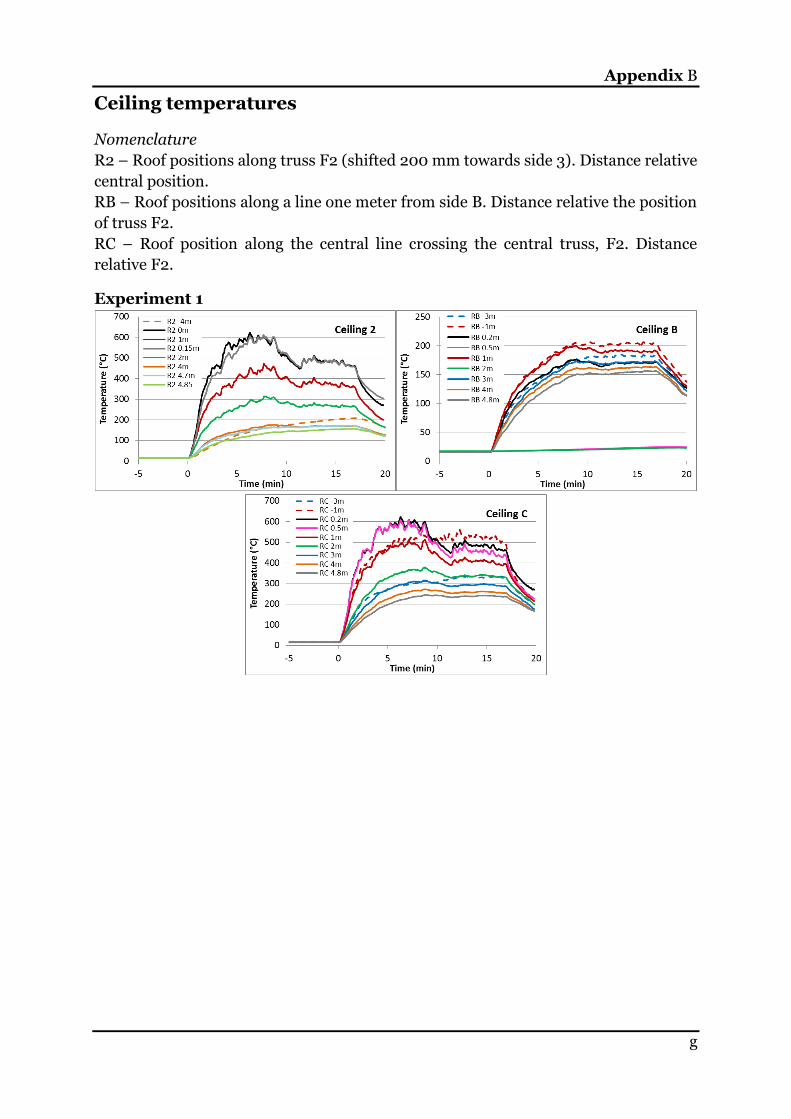
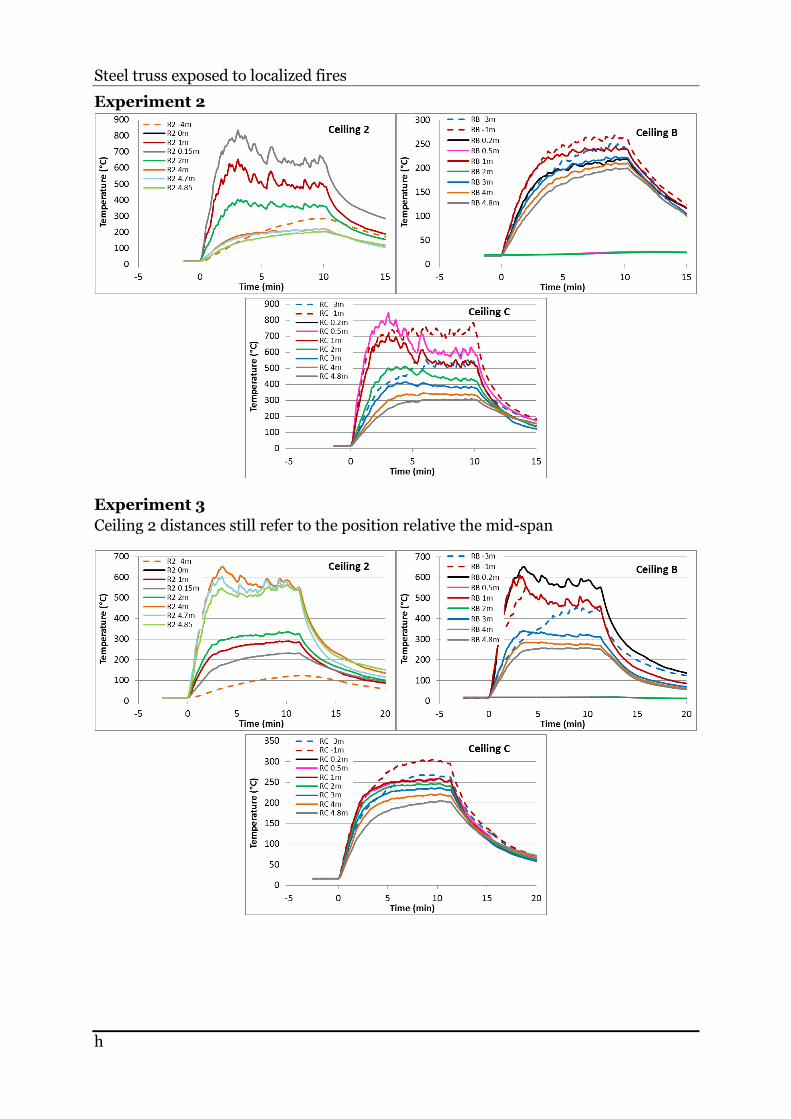
Ceiling temperatures
Nomenclature
R2 – Roof positions along truss F2 (shifted 200 mm towards side 3). Distance relative
central position.
RB – Roof positions along a line one meter from side B. Distance relative the position
of truss F2.
RC – Roof position along the central line crossing the central truss, F2. Distance
relative F2.
Experiment 1
Steel truss exposed to localized fires
h
Experiment 2
Experiment 3
Ceiling 2 distances still refer to the position relative the mid-span
Fire exposure to the truss beam
i
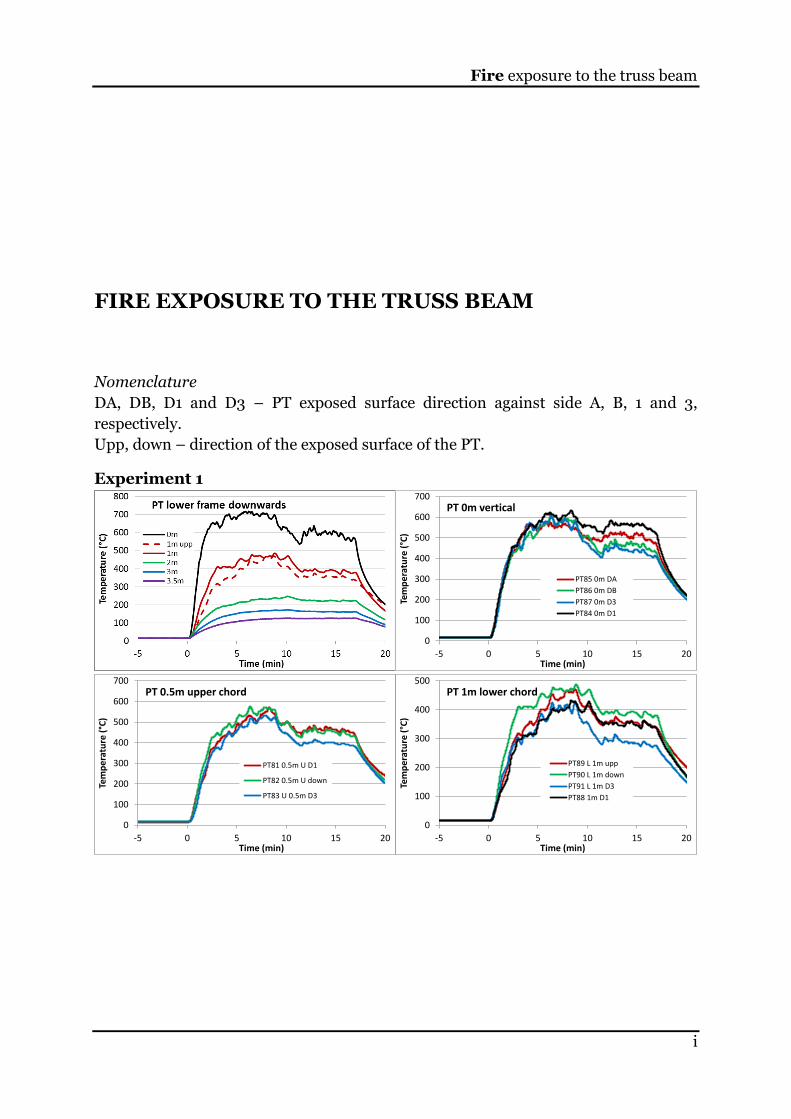
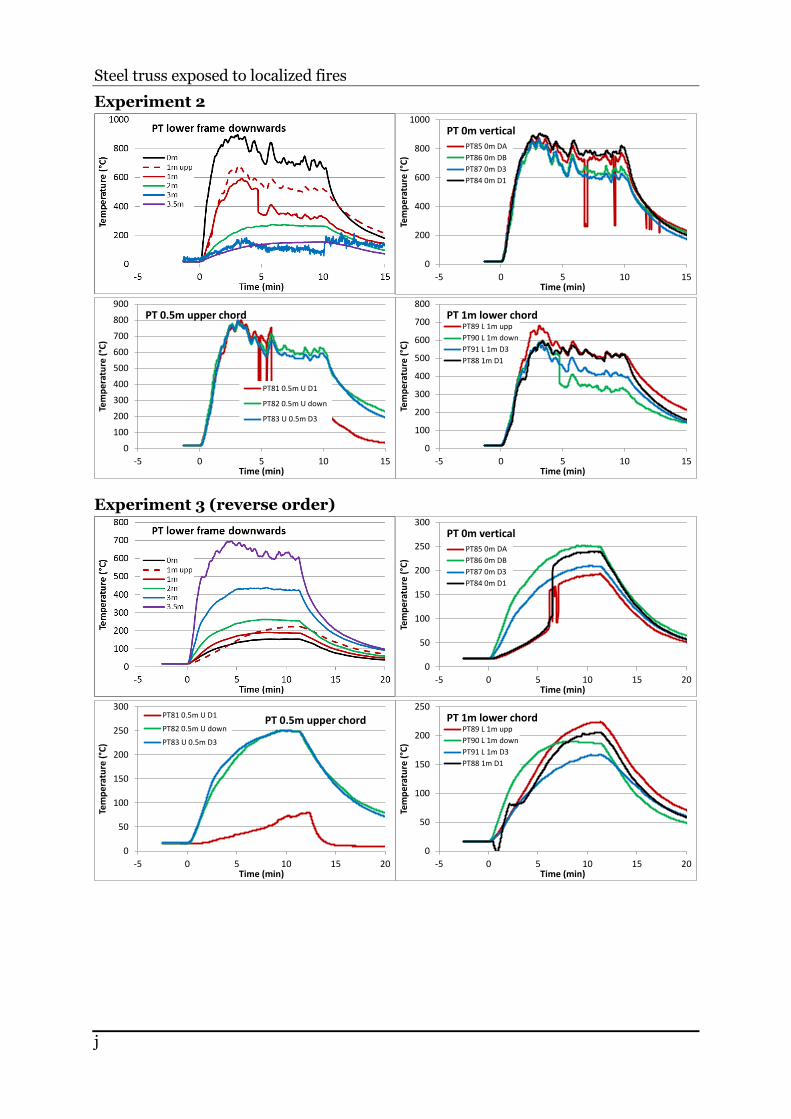
FIRE EXPOSURE TO THE TRUSS BEAM
Nomenclature
DA, DB, D1 and D3 – PT exposed surface direction against side A, B, 1 and 3,
respectively.
Upp, down – direction of the exposed surface of the PT.
Experiment 1
0
100
200
300
400
500
600
700
-5 0 5 10 15 20
Tem
pe
ratu
re (
°C)
Time (min)
PT 0m vertical
PT85 0m DA
PT86 0m DB
PT87 0m D3
PT84 0m D1
0
100
200
300
400
500
600
700
-5 0 5 10 15 20
Tem
pe
ratu
re (
°C)
Time (min)
PT 0.5m upper chord
PT81 0.5m U D1
PT82 0.5m U down
PT83 U 0.5m D3
0
100
200
300
400
500
-5 0 5 10 15 20
Tem
pe
ratu
re (
°C)
Time (min)
PT 1m lower chord
PT89 L 1m upp
PT90 L 1m down
PT91 L 1m D3
PT88 1m D1
Steel truss exposed to localized fires
j
Experiment 2
Experiment 3 (reverse order)
0
200
400
600
800
1000
-5 0 5 10 15
Tem
pe
ratu
re (
°C)
Time (min)
PT 0m verticalPT85 0m DA
PT86 0m DB
PT87 0m D3
PT84 0m D1
0
100
200
300
400
500
600
700
800
900
-5 0 5 10 15
Tem
pe
ratu
re (
°C)
Time (min)
PT 0.5m upper chord
PT81 0.5m U D1
PT82 0.5m U down
PT83 U 0.5m D3
0
100
200
300
400
500
600
700
800
-5 0 5 10 15
Tem
pe
ratu
re (
°C)
Time (min)
PT 1m lower chordPT89 L 1m upp
PT90 L 1m down
PT91 L 1m D3
PT88 1m D1
0
50
100
150
200
250
300
-5 0 5 10 15 20
Tem
pe
ratu
re (
°C)
Time (min)
PT 0m verticalPT85 0m DA
PT86 0m DB
PT87 0m D3
PT84 0m D1
0
50
100
150
200
250
300
-5 0 5 10 15 20
Tem
pe
ratu
re (
°C)
Time (min)
PT 0.5m upper chordPT81 0.5m U D1
PT82 0.5m U down
PT83 U 0.5m D3
0
50
100
150
200
250
-5 0 5 10 15 20
Tem
pe
ratu
re (
°C)
Time (min)
PT 1m lower chordPT89 L 1m upp
PT90 L 1m down
PT91 L 1m D3
PT88 1m D1
Steel temperature in the truss beam
k
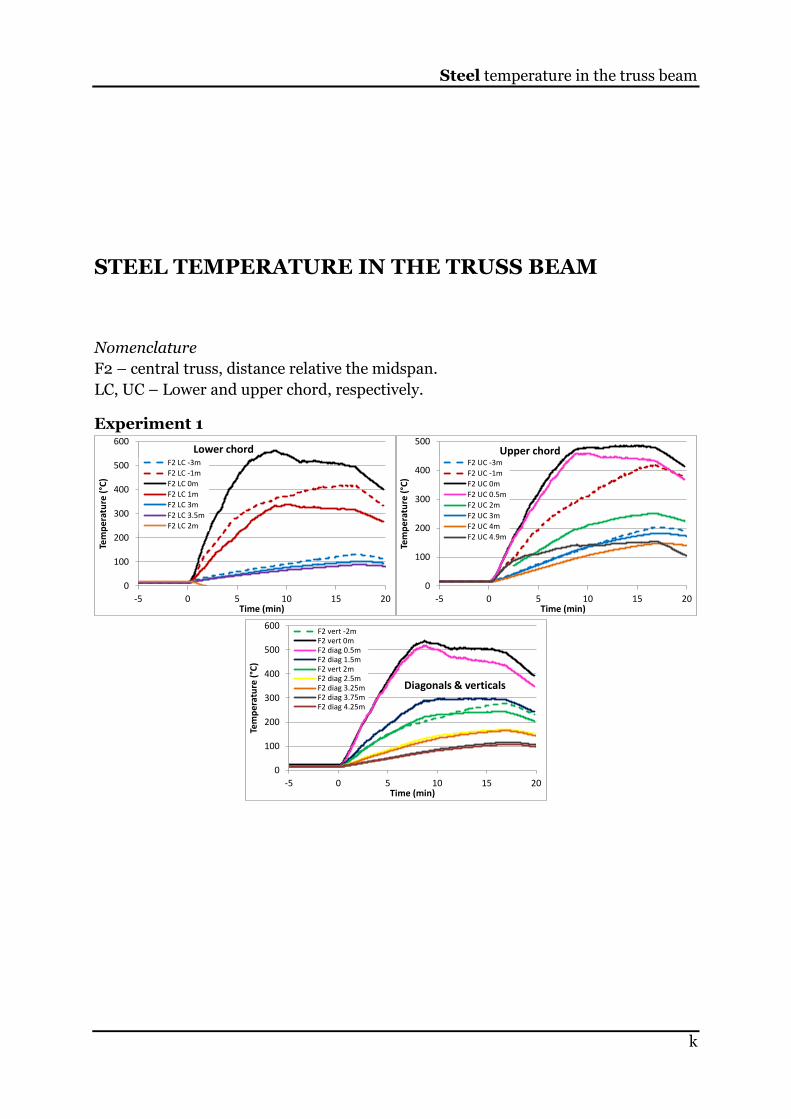
STEEL TEMPERATURE IN THE TRUSS BEAM
Nomenclature
F2 – central truss, distance relative the midspan.
LC, UC – Lower and upper chord, respectively.
Experiment 1
0
100
200
300
400
500
600
-5 0 5 10 15 20
Tem
pe
ratu
re (
°C)
Time (min)
Lower chordF2 LC -3m
F2 LC -1m
F2 LC 0m
F2 LC 1m
F2 LC 3m
F2 LC 3.5m
F2 LC 2m
0
100
200
300
400
500
-5 0 5 10 15 20
Tem
per
atu
re (
°C)
Time (min)
Upper chordF2 UC -3m
F2 UC -1m
F2 UC 0m
F2 UC 0.5m
F2 UC 2m
F2 UC 3m
F2 UC 4m
F2 UC 4.9m
0
100
200
300
400
500
600
-5 0 5 10 15 20
Tem
pe
ratu
re (
°C)
Time (min)
Diagonals & verticals
F2 vert -2mF2 vert 0mF2 diag 0.5mF2 diag 1.5mF2 vert 2mF2 diag 2.5mF2 diag 3.25mF2 diag 3.75mF2 diag 4.25m
Steel truss exposed to localized fires
l
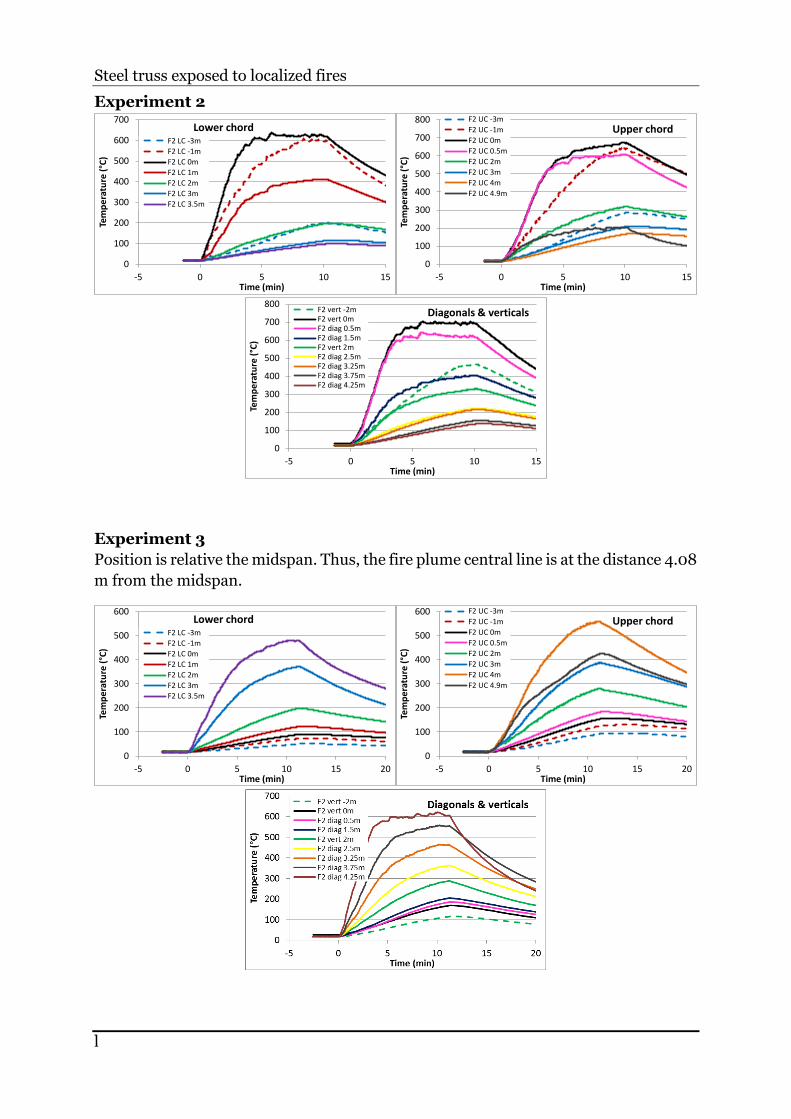
Experiment 2
Experiment 3
Position is relative the midspan. Thus, the fire plume central line is at the distance 4.08
m from the midspan.
0
100
200
300
400
500
600
700
-5 0 5 10 15
Tem
pe
ratu
re (
°C)
Time (min)
Lower chordF2 LC -3m
F2 LC -1m
F2 LC 0m
F2 LC 1m
F2 LC 2m
F2 LC 3m
F2 LC 3.5m
0
100
200
300
400
500
600
700
800
-5 0 5 10 15
Tem
per
atu
re (
°C)
Time (min)
Upper chordF2 UC -3m
F2 UC -1m
F2 UC 0m
F2 UC 0.5m
F2 UC 2m
F2 UC 3m
F2 UC 4m
F2 UC 4.9m
0
100
200
300
400
500
600
700
800
-5 0 5 10 15
Tem
per
atu
re (
°C)
Time (min)
Diagonals & verticalsF2 vert -2mF2 vert 0mF2 diag 0.5mF2 diag 1.5mF2 vert 2mF2 diag 2.5mF2 diag 3.25mF2 diag 3.75mF2 diag 4.25m
0
100
200
300
400
500
600
-5 0 5 10 15 20
Tem
pe
ratu
re (
°C)
Time (min)
Lower chordF2 LC -3m
F2 LC -1m
F2 LC 0m
F2 LC 1m
F2 LC 2m
F2 LC 3m
F2 LC 3.5m
0
100
200
300
400
500
600
-5 0 5 10 15 20
Tem
per
atu
re (
°C)
Time (min)
Upper chordF2 UC -3m
F2 UC -1m
F2 UC 0m
F2 UC 0.5m
F2 UC 2m
F2 UC 3m
F2 UC 4m
F2 UC 4.9m
Steel temperature in the truss beam
m
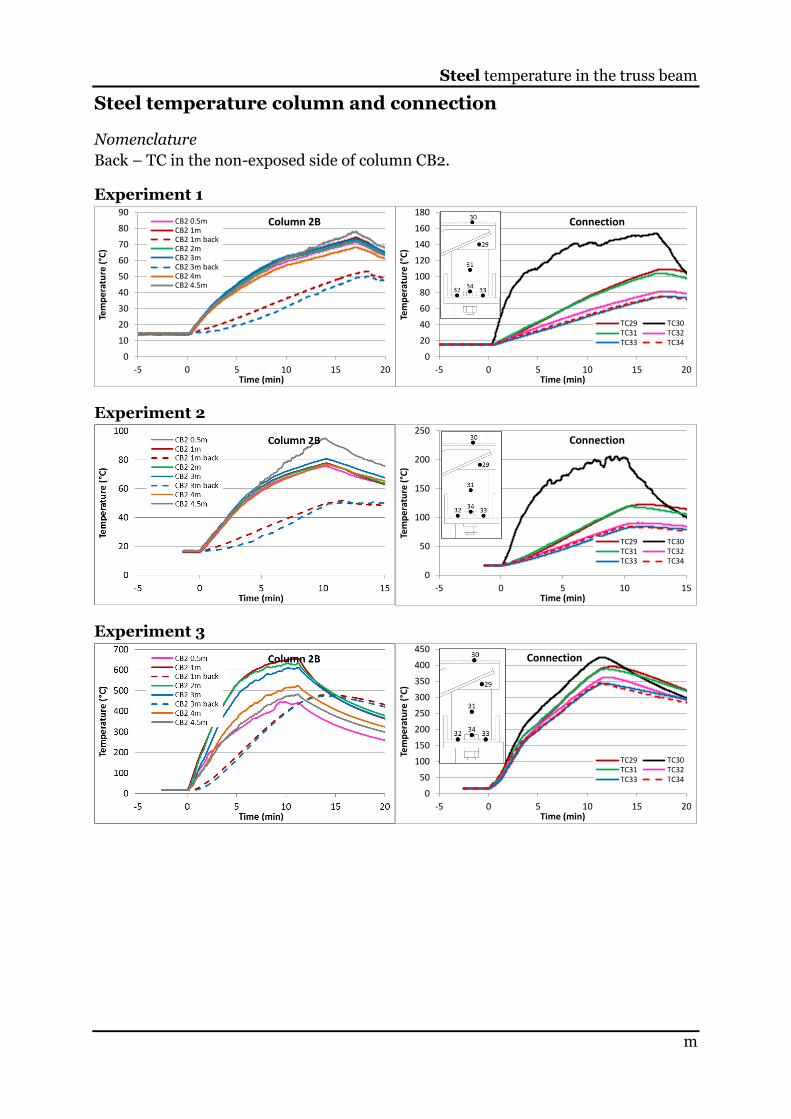
Steel temperature column and connection
Nomenclature
Back – TC in the non-exposed side of column CB2.
Experiment 1
Experiment 2
Experiment 3
0
10
20
30
40
50
60
70
80
90
-5 0 5 10 15 20
Tem
per
atu
re (
°C)
Time (min)
Column 2BCB2 0.5mCB2 1mCB2 1m backCB2 2mCB2 3mCB2 3m backCB2 4mCB2 4.5m
0
20
40
60
80
100
120
140
160
180
-5 0 5 10 15 20
Tem
pe
ratu
re (
°C)
Time (min)
Connection
TC29 TC30TC31 TC32TC33 TC34
0
50
100
150
200
250
-5 0 5 10 15
Tem
pe
ratu
re (
°C)
Time (min)
Connection
TC29 TC30TC31 TC32TC33 TC34
0
50
100
150
200
250
300
350
400
450
-5 0 5 10 15 20
Tem
pe
ratu
re (
°C)
Time (min)
Connection
TC29 TC30TC31 TC32TC33 TC34
Steel truss exposed to localized fires
n
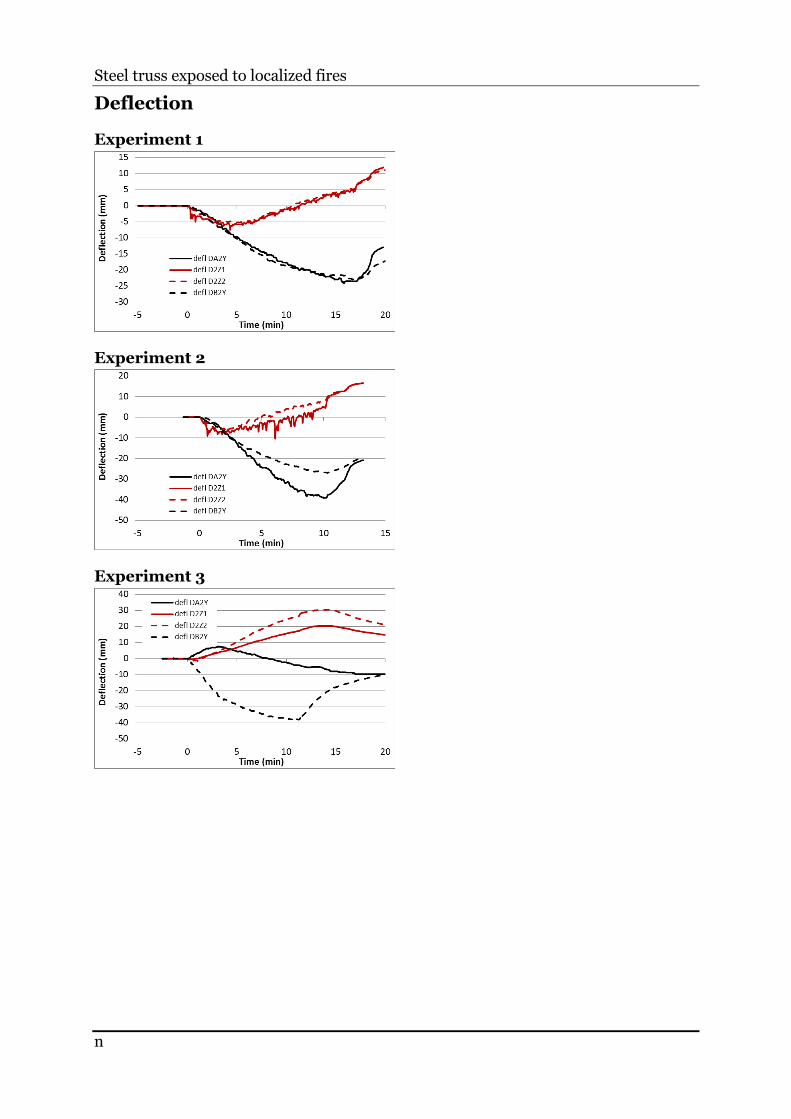
Deflection
Experiment 1
Experiment 2
Experiment 3
Steel temperature in the truss beam
o
Mass loss
Experiment 1
Experiment 2
Experiment 3
250
260
270
280
290
300
310
320
330
340
350
-5 0 5 10 15 20
Wei
ght
(kg)
Time (min)
Balance (kg)
-0.1
-0.08
-0.06
-0.04
-0.02
0
0.02
-5 0 5 10 15 20
Mas
s lo
ss r
ate
(kg
/s)
Time (min)
Mass loss rate (kg/s)
250
270
290
310
330
350
370
-5 0 5 10 15
Wei
ght
(kg)
Time (min)
Balance (kg)
-0.2
-0.18
-0.16
-0.14
-0.12
-0.1
-0.08
-0.06
-0.04
-0.02
0
-5 0 5 10 15
Mas
s lo
ss r
ate
(kg
/s)
Time (min)
y = -5.3742x + 330.92
260
270
280
290
300
310
320
330
340
350
360
-5 0 5 10 15 20
Wei
ght
(kg)
Time (min)
Balance (kg)
-0.1
-0.09
-0.08
-0.07
-0.06
-0.05
-0.04
-0.03
-0.02
-0.01
0
-5 0 5 10 15 20
Mas
s lo
ss r
ate
(kg/
s)
Time (min)
Mass loss rate (kg/s)
mass loss rate (fit) (kg/s)