Embed Size (px)
Citation preview

PERFORMANCE ASSESSMENT OF IRRIGATION
SYSTEM USING INDICATORS FOR DECISION MAKING
RIZAL SYAHYADI
FACULTY OF ENGINEERING
UNIVERSITY OF MALAYA
KUALA LUMPUR
2012
PERFORMANCE ASSESSMENT OF IRRIGATION
SYSTEM USING INDICATORS FOR DECISION MAKING
RIZAL SYAHYADI
DISSERTATION SUBMITTED IN FULFILLMENT OF
THE REQUIREMENTS FOR THE DEGREE OF
MASTER OF ENGINEERING SCIENCE
FACULTY OF ENGINEERING
UNIVERSITY OF MALAYA
KUALA LUMPUR
2012
ii
UNIVERSITI MALAYA
ORIGINAL LITERARY WORK DECLARATION
Name of Candidate : Rizal Syahyadi (I.C/Passport No:
Registration/Matric No : KGA 070054
Name of Degree : Master of Engineering Science (M.Eng.Sc.)
Title of Project Paper/Research Report/Dissertation/Thesis (“this Work”):
PERFORMANCE ASSESSMENT OF IRRIGATION SYSTEM USING
INDICATORS FOR DECISION MAKING
Field of Study: Water Resources Engineering (Civil Engineering Department)
I do solemnly and sincerely declare that:
(1) I am the sole author/writer of this Work;
(2) This Work is original;
(3) Any use of any work in which copyright exists was done by way of fair dealing and for
permitted purposes and any excerpt or extract from, or reference to or reproduction of
any copyright work has been disclosed expressly and sufficiently and the title of the
Work and its authorship have been acknowledged in this Work;
(4) I do not have any actual knowledge nor do I ought reasonably to know that the making
of this work constitutes an infringement of any copyright work;
(5) I hereby assign all and every rights in the copyright to this Work to the University of
Malaya (“UM”), who henceforth shall be owner of the copyright in this Work and that
any reproduction or use in any form or by any means whatsoever is prohibited without
the written consent of UM having been first had and obtained;
(6) I am fully aware that if in the course of making this Work I have infringed any
copyright whether intentionally or otherwise, I may be subject to legal action or any
other action as may be determined by UM.
Candidate’s Signature Date:
Subscribed and solemnly declared before,
Witness’s Signature Date:
Name:
Designation:
iii
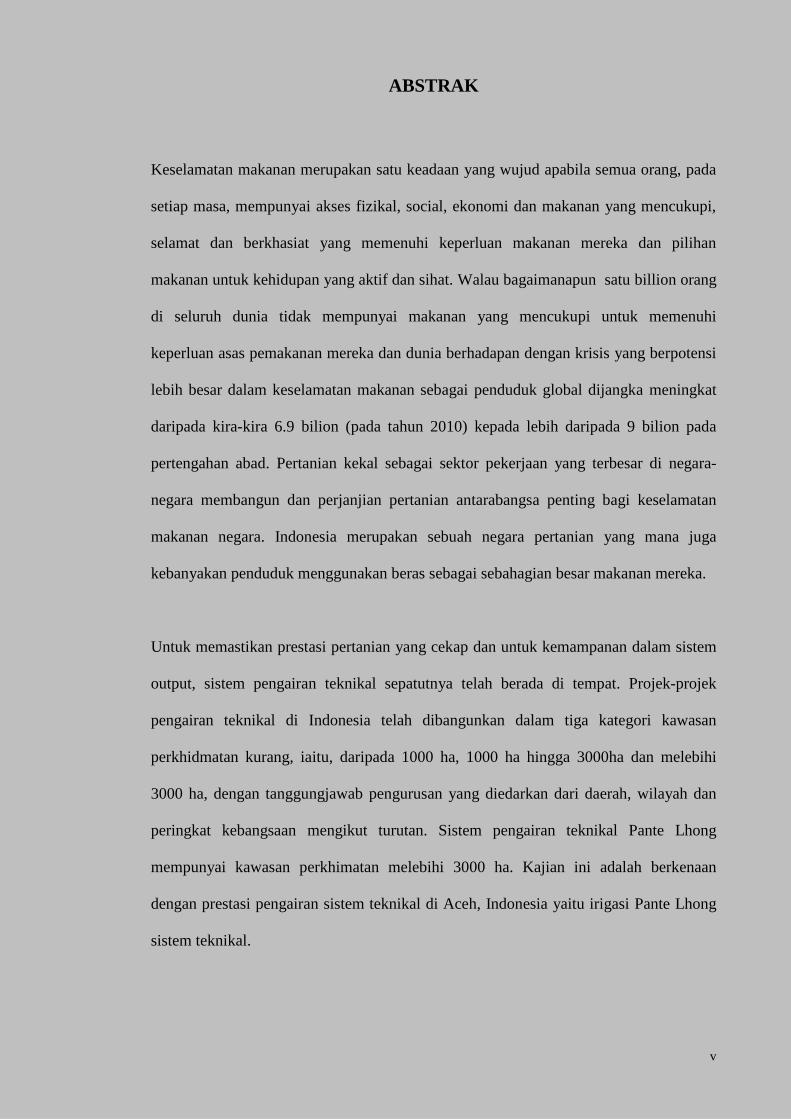
ABSTRACT
Food security is a situation that exists when all people, at all times, have physical,
social, and economic access to sufficient, safe, and nutritious food that meets their
dietary needs and food preferences for an active and healthy life. However a billion
people globally do not have adequate food to meet their basic nutritional needs and
the world faces a potentially even greater crisis as the global population is expected to
grow from about 6.9 billion (in 2010) to more than 9 billion by the mid-century.
Agriculture remains the largest employment sector in most developing countries and
international agriculture agreements are crucial to a country's food security. Indonesia is
an agricultural country where most of the population consumes rice as a major part of
their diet.
To ensure the efficient performance of agricultural and for sustainability in output
systems, a proper technical irrigation system has to be in place. Technical irrigation
projects in Indonesia have been developed in all the three categories of service areas of
less than 1000 ha, 1000 ha to 3000 ha and above 3000 ha, with management
responsibilities distributed from district, province and national levels respectively.
The Pante Lhong technical irrigation system has system area of above 3000 ha. This
study involves the assessment of the performance of technical irrigation system in Aceh,
Indonesia, namely the Pante Lhong technical irrigation system
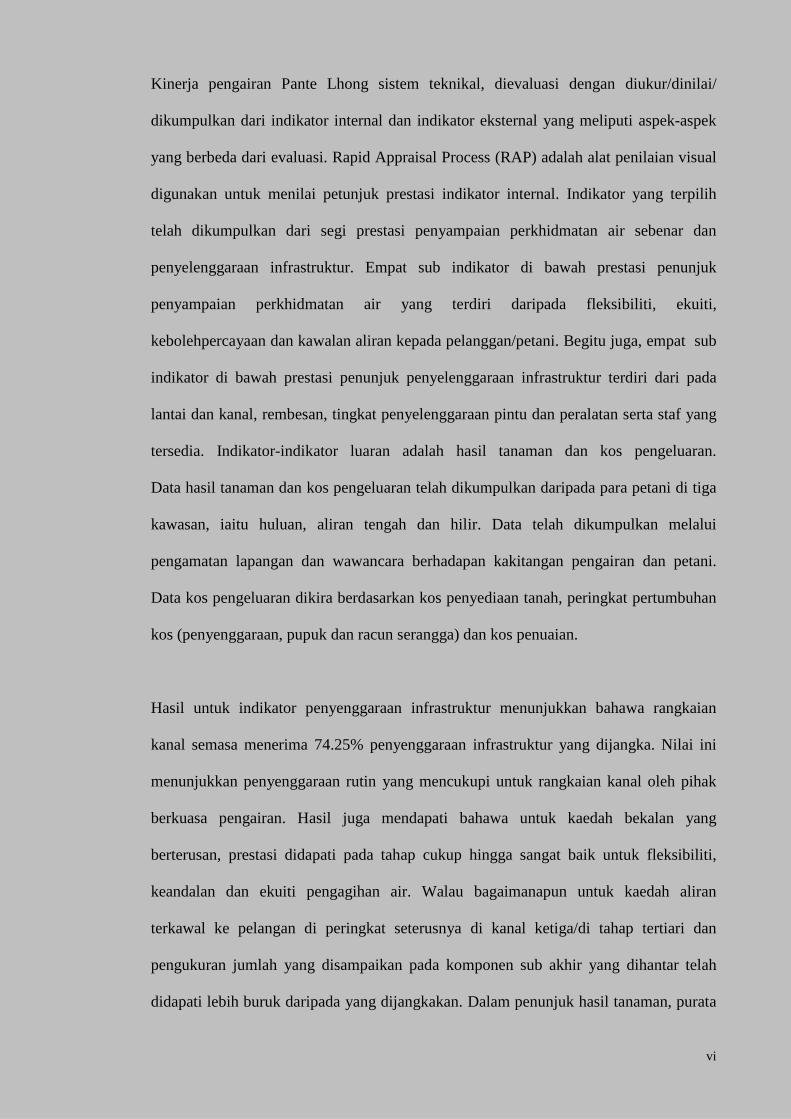
The Pante Lhong technical irrigation system performances were evaluated using
measured/rewarded/collected internal and external indicators that covered different
aspect of evaluation. The Rapid Appraisal Process (RAP) is a visual assessment tool
was used to evaluate the internal indicators performance. The selected indicators were
iv
grouped in terms of actual water delivery service performance and infrastructure
maintenance. The four sub indicators under the performance of water delivery service
indicators consists of flexibility, reliability, equity and control of flow to the
customers/farmers. Likewise, four sub indicators under the performance of
infrastructure maintenance indicator consists of floor and canal bank, seepage, level of
gate maintenance and available of proper equipment and staff. The external indicators
were crop yield and production cost. The data of crop yield and production cost
arecollected from the farmers in the three regions which were upstream, middle stream
and downstream. Data were collected through field observation and face to face
interviews with the irrigation staff and the farmers. The production cost data were
calculated based on the land preparation cost, growth stage cost (maintenance, fertilizer
and insecticide) and harvesting cost.
The results for the infrastructure maintenance indicators showed that the current canal
network received 74.25 % of the expected infrastructure maintenance. This value
demonstrated a sufficient routine maintenance for canal network by the irrigation
authority. The results also found that the continuous supply method is quite enough to
excellent performance of flexibility, reliability and equity of water distribution.
However, the control flow to farmers in the next level at third canal/tertiary level and
measurement of volumes delivered at final delivered sub components had performed at
worse than expected. In the crop yield indicator, the average maximum productivity was
3.91 ton/ha and the income generated was Rp.11.730 million rupiahs/ha (US$ 1289/ha).
The total production cost of the Pante Lhong technical irrigation system was Rp. 4.126
million rupiahs/ha (US$ 453.50/ha) and hence in term of return of investment (ROI), it
is still profitable and feasible to be developed for the farmers.
v
ABSTRAK
Keselamatan makanan merupakan satu keadaan yang wujud apabila semua orang, pada
setiap masa, mempunyai akses fizikal, social, ekonomi dan makanan yang mencukupi,
selamat dan berkhasiat yang memenuhi keperluan makanan mereka dan pilihan
makanan untuk kehidupan yang aktif dan sihat. Walau bagaimanapun satu billion orang
di seluruh dunia tidak mempunyai makanan yang mencukupi untuk memenuhi
keperluan asas pemakanan mereka dan dunia berhadapan dengan krisis yang berpotensi
lebih besar dalam keselamatan makanan sebagai penduduk global dijangka meningkat
daripada kira-kira 6.9 bilion (pada tahun 2010) kepada lebih daripada 9 bilion pada
pertengahan abad. Pertanian kekal sebagai sektor pekerjaan yang terbesar di negara-
negara membangun dan perjanjian pertanian antarabangsa penting bagi keselamatan
makanan negara. Indonesia merupakan sebuah negara pertanian yang mana juga
kebanyakan penduduk menggunakan beras sebagai sebahagian besar makanan mereka.
Untuk memastikan prestasi pertanian yang cekap dan untuk kemampanan dalam sistem
output, sistem pengairan teknikal sepatutnya telah berada di tempat. Projek-projek
pengairan teknikal di Indonesia telah dibangunkan dalam tiga kategori kawasan
perkhidmatan kurang, iaitu, daripada 1000 ha, 1000 ha hingga 3000ha dan melebihi
3000 ha, dengan tanggungjawab pengurusan yang diedarkan dari daerah, wilayah dan
peringkat kebangsaan mengikut turutan. Sistem pengairan teknikal Pante Lhong
mempunyai kawasan perkhimatan melebihi 3000 ha. Kajian ini adalah berkenaan
dengan prestasi pengairan sistem teknikal di Aceh, Indonesia yaitu irigasi Pante Lhong
sistem teknikal.
vi
Kinerja pengairan Pante Lhong sistem teknikal, dievaluasi dengan diukur/dinilai/
dikumpulkan dari indikator internal dan indikator eksternal yang meliputi aspek-aspek
yang berbeda dari evaluasi. Rapid Appraisal Process (RAP) adalah alat penilaian visual
digunakan untuk menilai petunjuk prestasi indikator internal. Indikator yang terpilih
telah dikumpulkan dari segi prestasi penyampaian perkhidmatan air sebenar dan
penyelenggaraan infrastruktur. Empat sub indikator di bawah prestasi penunjuk
penyampaian perkhidmatan air yang terdiri daripada fleksibiliti, ekuiti,
kebolehpercayaan dan kawalan aliran kepada pelanggan/petani. Begitu juga, empat sub
indikator di bawah prestasi penunjuk penyelenggaraan infrastruktur terdiri dari pada
lantai dan kanal, rembesan, tingkat penyelenggaraan pintu dan peralatan serta staf yang
tersedia. Indikator-indikator luaran adalah hasil tanaman dan kos pengeluaran.
Data hasil tanaman dan kos pengeluaran telah dikumpulkan daripada para petani di tiga
kawasan, iaitu huluan, aliran tengah dan hilir. Data telah dikumpulkan melalui
pengamatan lapangan dan wawancara berhadapan kakitangan pengairan dan petani.
Data kos pengeluaran dikira berdasarkan kos penyediaan tanah, peringkat pertumbuhan
kos (penyenggaraan, pupuk dan racun serangga) dan kos penuaian.
Hasil untuk indikator penyenggaraan infrastruktur menunjukkan bahawa rangkaian
kanal semasa menerima 74.25% penyenggaraan infrastruktur yang dijangka. Nilai ini
menunjukkan penyenggaraan rutin yang mencukupi untuk rangkaian kanal oleh pihak
berkuasa pengairan. Hasil juga mendapati bahawa untuk kaedah bekalan yang
berterusan, prestasi didapati pada tahap cukup hingga sangat baik untuk fleksibiliti,
keandalan dan ekuiti pengagihan air. Walau bagaimanapun untuk kaedah aliran
terkawal ke pelangan di peringkat seterusnya di kanal ketiga/di tahap tertiari dan
pengukuran jumlah yang disampaikan pada komponen sub akhir yang dihantar telah
didapati lebih buruk daripada yang dijangkakan. Dalam penunjuk hasil tanaman, purata

vii
produktiviti maksimum 3.91 ton/ha dan pendapatan dijanakan adalah Rp.11.730 juta
rupiah/ha. Kos pengeluaran adalah Rp. 4,126 juta rupiah/ha dan oleh itu dari segi return
of investment (ROI) masih menguntungkan dan layak untuk dimajukan bagi petani.
viii
ACKNOWLEDGEMENT
My sincere appreciation goes to my supervisor, Associate Professor Dr. Zakaria Harun,
for his assistance, enthusiasm, encourage, guidance especially the preparation of this
dissertation, invaluable help, good teaching and patience for all aspect from this
dissertation progress. I am grateful for Associate Professor Dr. Sumiani Yusoff,
co supervisor, for her motivation, and valuable advice offering, enthusiastic guidance,
lots of good ideas, her inspiration and advice. Her numerous comments, criticisms and
suggestion during the preparation of this project are gratefully praised. Mostly for their
patience on any problem that occurred during the dissertation is invaluable and
appreciated.
Recognition is directed to Faculty of Engineering and Department of Civil Engineering,
University Malaya. I am also deeply grateful to State Polytechnic of Lhokseumawe for
the leave of absence that I can pursue my study.
I am indebted to my colleagues especially Mr. Edi Majuar, Mr. Samsul Bahri, Mr.
Irwan Nurdin, and Mr. Md Salam. I also wish to express my appreciation to all other
individuals who provide earnest assistance for this research work.
Lastly, and most importantly, I wish to thank my parents, Ibrahim Basyah and Djuairiah
Umar. They born me, raised me, supported me, taught me, and loved me. I show deep
gratitude to my parents in law, M. Nur Husin and Nur Jamaliah, for their precious and
encourage. Finally, I dedicate this dissertation to my wife Nadia Sartika and my beloved
daughter, Arina Arifatunnisa for their continuous spirit, love and patience. It is an
undeniable fact that my family gave me the inspiration to complete this study.

ix
TABLE OF CONTENTS
PAGE
ORIGINAL LITERARY WORK DECLARATION ........................................... ii
ABSTRACT ............................................................................................................ iii
ABSTRAK ............................................................................................................ v
ACKNOWLEDGEMENTS ..................................................................................... viii
TABLE OF CONTENTS ........................................................................................ ix
LIST OF FIGURES ................................................................................................ xiii
LIST OF TABLES .................................................................................................. xv
LIST OF SYMBOLS AND ABREVIATIONS .................................................... xviii
CHAPTER I INTRODUCTION ..................................................................... 1
1.1 Background ............................................................................... 1
1.2 Problem Statements ................................................................. 5
1.3 Research Objective ................................................................... 7
1.4 Scope of Research ...................................................................... 7
1.5 Research Methodology .............................................................. 9
1.6 Significance of Research .......................................................... 12
1.7 Thesis Structure ......................................................................... 12
CHAPTER II LITERATURE REVIEW ......................................................... 15
2.1 Introduction ............................................................................. 15
2.2 Rice ............................................................................................ 15
2.3 Irrigation Management System .............................................. 16
x
2.4 Performance Evaluation of Irrigation System ....................... 21
2.4.1 Quantitative Field Data Measurement Based ................. 21
2.4.2 Qualitative Field Data Survey Based .............................. 25
2.5 On-Farm Irrigation System ..................................................... 37
2.6 Irrigation Structure Performance .......................................... 41
2.7 Rapid Appraisal Process Method ........................................... 43
2.8 Irrigation Management Performance in Indonesia .............. 47
2.9 Summary .................................................................................... 49
CHAPTER III RESEARCH METHODOLOGY ............................................. 51
3.1 Introduction ............................................................................. 51
3.2 Determination of Internal Indicator Performance ................ 52
3.3 External Indicator Performance ............................................. 58
3.4 Data Collection Procedure ........................................................ 59
3.5 The Characteristics of Pante Lhong Technical Irrigation
System ......................................................................................... 60
3.6 Characteristics of Sample ........................................................ 72
3.7 Summary ................................................................................... 76
CHAPTER IV RESULT AND DISCUSSION ...................................................... 78
4.1 Introduction ............................................................................. 78
4.2 Infrastructure Maintenance Performance of the System ..... 82
4.3 Water Delivery System of the System ..................................... 96
4.4 Crop Yield of the Farmer ......................................................... 110
4.5 Cost Production of the Farmer ............................................... 118
4.6 Return Of Investment (ROI) ................................................... 126
xi
4.6.1 Revenues and Costs Ratio (R/C) ..................................... 126
4.6.2 Break Even Point (BEP) .................................................. 127
4.6.3 Return OF Investment (ROI) .......................................... 128
4.7 Summary ................................................................................... 132
CHAPTER V CONCLUSIONS AND RECOMMENDATIONS .................. 133
5.1 Conclusions .............................................................................. 133
5.2 Recommendations .................................................................... 136
REFERENCES ......................................................................................................... 138
APPENDIX A ........................................................................................................... 143
A.1 SAMPLE BASE ON GENDER .................................................................... 143
A.2 SAMPLE BASE ON LEVEL OF AGE ........................................................ 143
A.3 SAMPLE BASE ON LEVEL OF EXPERIENCE ...................................... 144
A.4 SAMPLE BASE ON LEVEL OF EDUCATION ......................................... 144
A.5 SAMPLE BASE ON LEVEL OF OWNERSHIP ....................................... 145
A.6 SAMPLE BASE ON LEVEL OF FIELD SIZE ........................................... 145
APPENDIX B ........................................................................................................... 146
B.1 SAMPLE SURVEY AT BT.7 KUALA SUB DISTRICT .......................... 146
B.2 SAMPLE SURVEY AT BJb.2 KUALA RAJA SUB DISTRICT ............. 148
B.3 SAMPLE SURVEY AT BPg.1 JULI SUB DISTRICT .............................. 150
B.4 CROP YIELD AT BT.7 KUALA SUB DISTRICT .................................... 152
B.5 CROP YIELD AT BJb.2 KUALA RAJA SUB DISTRICT ....................... 154
B.6 CROP YIELD AT BPG.1 JULI SUB DISTRICT ...................................... 156

xii
B.7 PRODUCTION COST AT BT.7 KUALA SUB DISTRICT ...................... 158
B.8 PRODUCTION COST AT BJb.2 KUALA RAJA SUB DISTRICT ........ 160
B.9 PRODUCTION COST AT BPg.1 JULI SUB DISTRICT ......................... 162
xiii
LIST OF FIGURES
PAGE
Figure 1.1 A flow chart of the overall process of the research methodology ....... 11
Figure 3.1 Schematic diagram of irrigation performance indicators assessment .. 52
Figure 3.2 Study location in Sumatra Island map .................................................. 62
Figure 3.3 Study location in Aceh map .................................................................. 63
Figure 3.4 Schematic layout of Pante Lhong technical irrigation system and
sample location ..................................................................................... 64
Figure 3.5 Features of existing Pante Lhong technical irrigation system .............. 65
Figure 3.6 Features of problems of site study Pante Lhong technical irrigation
system ................................................................................................... 66
Figure 3.7 Features of gates and sediment problems of site study Pante Lhong
technical irrigation system ................................................................. 67
Figure 4.1 Left Canal System (LCS) Paya Geudebang Pante Lhong technical
irrigation system .................................................................................. 79
Figure 4.2 Right Canal System-1 (RCS-1) Paya Kareueng Pante Lhong technical
irrigation system ................................................................................... 80
Figure 4.3 Right Canal System-2 (RCS-2) Paya Kareueng Pante Lhong technical
irrigation system .................................................................................. 81
Figure 4.4 Infrastructure maintenance performances at Left Canal System (LCS)
at Pante Lhong technical irrigation system ........................................... 84
Figure 4.5 Infrastructure maintenance performance at Right Canal System-1
(RCS-1) at Pante Lhong technical irrigation system ............................ 88
Figure 4.6 Infrastructure maintenance performance at Right Canal System-2
(RCS-2) at Pante Lhong technical irrigation system ............................ 91
xiv
Figure 4.7 Average infrastructure maintenance performance ................................ 93
Figure 4.8 Water delivery service performance at LCS section third canal ......... 98
Figure 4.9 Water delivery service performance at RCS-1 section third canal ....... 100
Figure 4.10 Water delivery service performance at RCS-2 section third canal ....... 102
Figure 4.11 Water delivery service performance irrigation at tertiary level ............ 104
Figure 4.12 Water delivery service performance irrigation at LCS final delivery . 106
Figure 4.13 Average crop yield of rice at the Pante Lhong technical irrigation
system in 2007 ...................................................................................... 111
Figure 4.14 Average crop yield of rice at the Pante Lhong technical irrigation
system in 2008 ..................................................................................... 112
Figure 4.15 Average crop yield of rice at the Pante Lhong technical irrigation
system in 2009 ..................................................................................... 114
Figure 4.16 The comparison average crop yield of rice during 2007 – 2009 of
the Pante Lhong technical irrigation system to local (BPS-Aceh, 2010),
regional and national crop yield (BPS-Indonesia, 2010) ...................... 116
Figure 4.17 Production cost based on land preparation at the Pante Lhong
technical irrigation system ................................................................... 129
Figure 4.18 Production cost based on growth stage at the Pante Lhong
technical irrigation system ................................................................... 121
Figure 4.19 Production cost based on harvesting at the Pante Lhong
technical irrigation system ................................................................... 122
Figure 4.20 Production cost of the Pante Lhong technical irrigation system ......... 124
xv
LIST OF TABLES
PAGE
Table 3.1 Actual water delivery services at the tertiary canal (third canal) that
provided to its sub canals ..................................................................... 54
Table 3.2 Actual water delivery received by individual units (final delivery) .... 55
Table 3.3 Actual Infrastructure maintenance performance .................................. 57
Table 3.4 Summary characteristics of the Pante Lhong technical irrigation
system .................................................................................................. 69
Table 3.5 Summary of water gates numbers and conditions at the Pante Lhong
technical irrigation system ................................................................... 70
Table 3.6 Summary characteristics of project employees at the Pante Lhong
technical irrigation system .................................................................... 71
Table 3.7 Summary characteristics of rehabilitation, maintenance and operation
budget at the Pante Lhong technical irrigation system ......................... 72
Table 3.8 Characteristics samples based on gender at the Pante Lhong technical
irrigation system ................................................................................... 74
Table 3.9 Characteristics samples based on level of age at the Pante Lhong
technical irrigation system .................................................................... 74
Table 3.10 Characteristics samples based on level at experience of the
Pante Lhong technical irrigation system ............................................... 74
Table 3.11 Characteristics samples based on level at education of the
Pante Lhong technical irrigation system ............................................... 75
Table 3.12 Characteristics samples based on level of field size at the Pante Lhong
technical irrigation system .................................................................... 75
xvi
Table 3.12 Characteristics samples based on ownership at the Pante Lhong
technical irrigation system .................................................................... 75
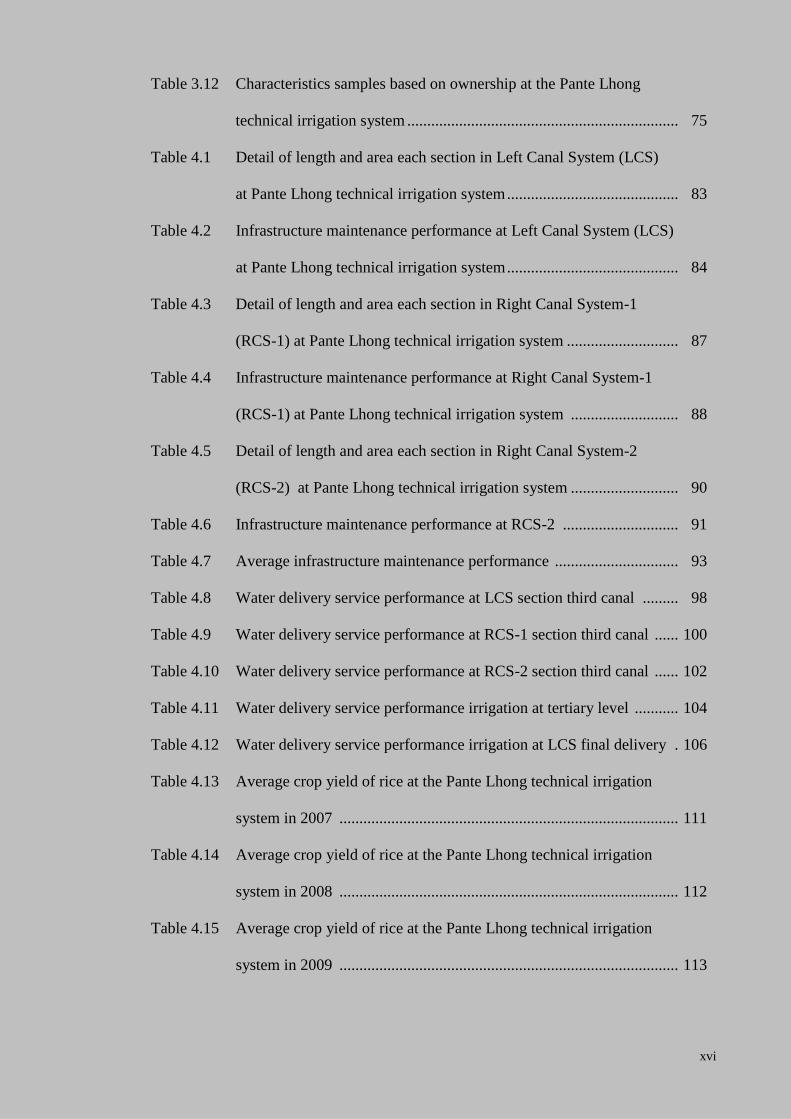
Table 4.1 Detail of length and area each section in Left Canal System (LCS)
at Pante Lhong technical irrigation system ........................................... 83
Table 4.2 Infrastructure maintenance performance at Left Canal System (LCS)
at Pante Lhong technical irrigation system ........................................... 84
Table 4.3 Detail of length and area each section in Right Canal System-1
(RCS-1) at Pante Lhong technical irrigation system ............................ 87
Table 4.4 Infrastructure maintenance performance at Right Canal System-1
(RCS-1) at Pante Lhong technical irrigation system ........................... 88
Table 4.5 Detail of length and area each section in Right Canal System-2
(RCS-2) at Pante Lhong technical irrigation system ........................... 90
Table 4.6 Infrastructure maintenance performance at RCS-2 ............................. 91
Table 4.7 Average infrastructure maintenance performance ............................... 93
Table 4.8 Water delivery service performance at LCS section third canal ......... 98
Table 4.9 Water delivery service performance at RCS-1 section third canal ...... 100
Table 4.10 Water delivery service performance at RCS-2 section third canal ...... 102
Table 4.11 Water delivery service performance irrigation at tertiary level ........... 104
Table 4.12 Water delivery service performance irrigation at LCS final delivery . 106
Table 4.13 Average crop yield of rice at the Pante Lhong technical irrigation
system in 2007 ..................................................................................... 111
Table 4.14 Average crop yield of rice at the Pante Lhong technical irrigation
system in 2008 ..................................................................................... 112
Table 4.15 Average crop yield of rice at the Pante Lhong technical irrigation
system in 2009 ..................................................................................... 113
xvii
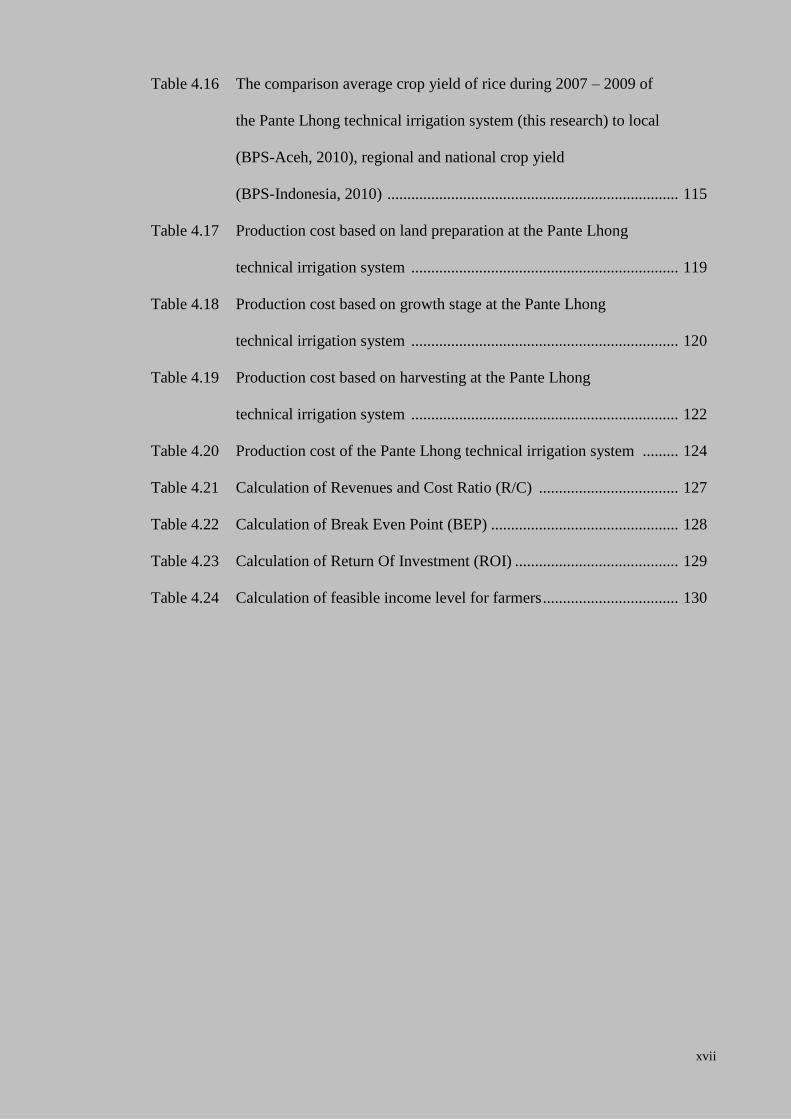
Table 4.16 The comparison average crop yield of rice during 2007 – 2009 of
the Pante Lhong technical irrigation system (this research) to local
(BPS-Aceh, 2010), regional and national crop yield
(BPS-Indonesia, 2010) ......................................................................... 115
Table 4.17 Production cost based on land preparation at the Pante Lhong
technical irrigation system ................................................................... 119
Table 4.18 Production cost based on growth stage at the Pante Lhong
technical irrigation system ................................................................... 120
Table 4.19 Production cost based on harvesting at the Pante Lhong
technical irrigation system ................................................................... 122
Table 4.20 Production cost of the Pante Lhong technical irrigation system ......... 124
Table 4.21 Calculation of Revenues and Cost Ratio (R/C) ................................... 127
Table 4.22 Calculation of Break Even Point (BEP) ............................................... 128
Table 4.23 Calculation of Return Of Investment (ROI) ......................................... 129
Table 4.24 Calculation of feasible income level for farmers .................................. 130
xviii
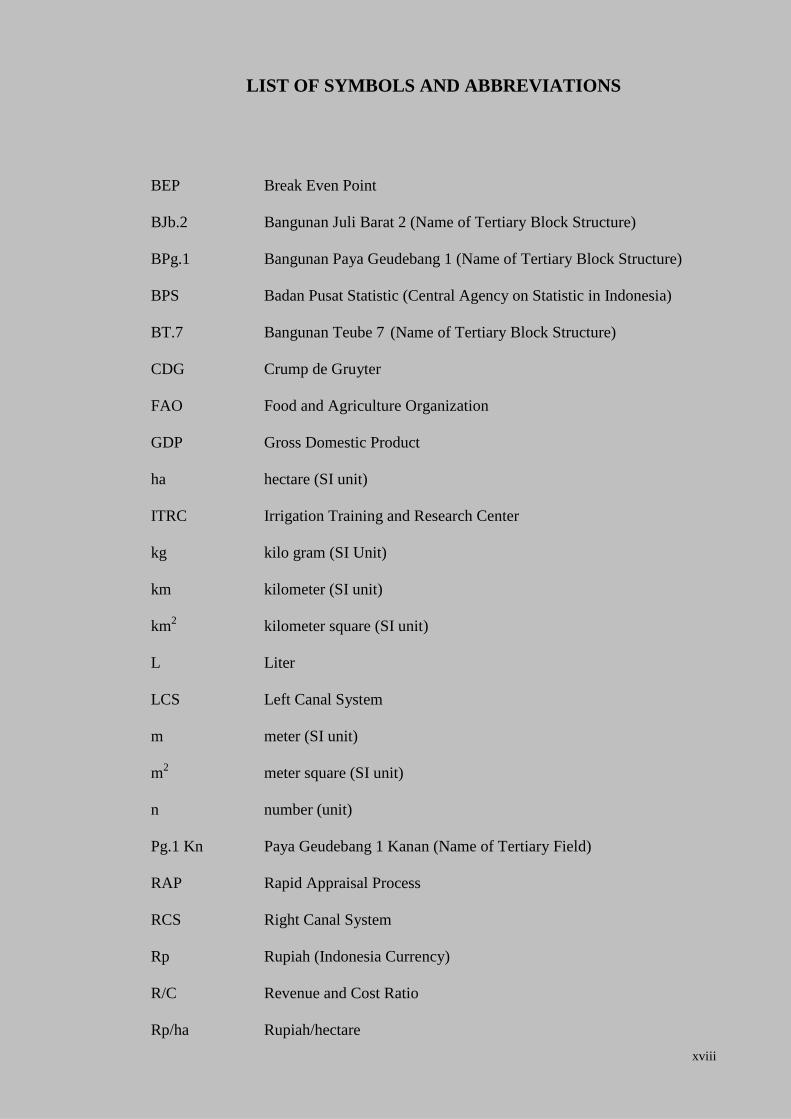
LIST OF SYMBOLS AND ABBREVIATIONS
BEP Break Even Point
BJb.2 Bangunan Juli Barat 2 (Name of Tertiary Block Structure)
BPg.1 Bangunan Paya Geudebang 1 (Name of Tertiary Block Structure)
BPS Badan Pusat Statistic (Central Agency on Statistic in Indonesia)
BT.7 Bangunan Teube 7 (Name of Tertiary Block Structure)
CDG Crump de Gruyter
FAO Food and Agriculture Organization
GDP Gross Domestic Product
ha hectare (SI unit)
ITRC Irrigation Training and Research Center
kg kilo gram (SI Unit)
km kilometer (SI unit)
km2
kilometer square (SI unit)
L Liter
LCS Left Canal System
m meter (SI unit)
m2
meter square (SI unit)
n number (unit)
Pg.1 Kn Paya Geudebang 1 Kanan (Name of Tertiary Field)
RAP Rapid Appraisal Process
RCS Right Canal System
Rp Rupiah (Indonesia Currency)
R/C Revenue and Cost Ratio
Rp/ha Rupiah/hectare
xix
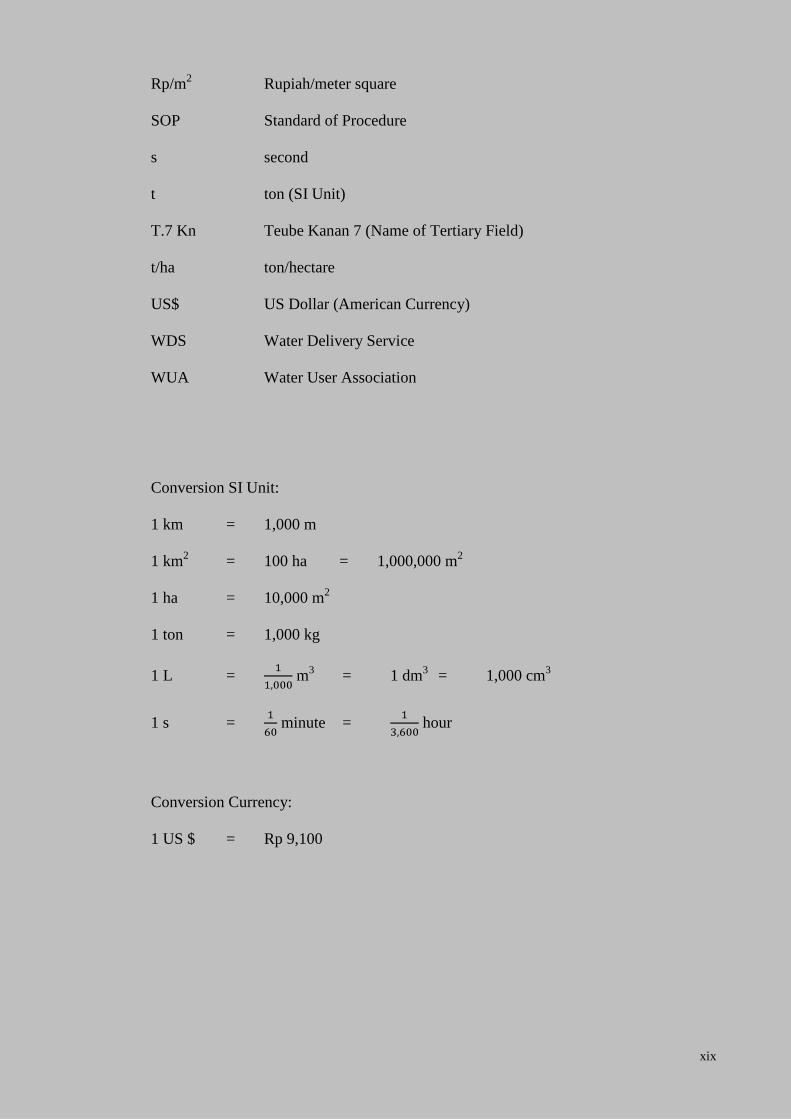
Rp/m2 Rupiah/meter square
SOP Standard of Procedure
s second
t ton (SI Unit)
T.7 Kn Teube Kanan 7 (Name of Tertiary Field)
t/ha ton/hectare
US$ US Dollar (American Currency)
WDS Water Delivery Service
WUA Water User Association
Conversion SI Unit:
1 km = 1,000 m
1 km2
= 100 ha = 1,000,000 m2
1 ha = 10,000 m2
1 ton = 1,000 kg
1 L = m3 = 1 dm
3 = 1,000 cm
3
1 s = minute = hour
Conversion Currency:
1 US $ = Rp 9,100
1
CHAPTER I
INTRODUCTION
1.1 Background
With the escalating number of population growth, the importance of food supply or food
security is a pertinent issue. The Food and Agriculture Organization (FAO) defines
food security as a situation that exists when all people, at all times, have physical,
social, and economic access to sufficient, safe, and nutritious food that meets their
dietary needs and food preferences for an active and healthy life (FAO, 2002).
However, a total of 925 million people are still estimated to be undernourished in 2010
and 578 million in Asia and Pacific, representing almost 16 percent of the population of
developing countries. The fact that nearly a billion people remain hungry even after the
recent food and financial crises, indicates a deeper structural problem that gravely
threatens the ability to achieve internationally agreed goals on hunger reduction: the
first Millennium Development Goal (MDG) and the 1996 World Food Summit goal. It
is also evident that economic growth, while essential, will not be sufficient in itself to
eliminate hunger within an acceptable period of time (FAO, 2010).
Around a billion people globally do not have adequate food to meet their basic
nutritional needs. The world faces a potentially even greater crisis in food security as
the global population is expected to grow from about 6.9 billion in 2010 to more than
9 billion by the mid-century. The FAO has predicted that demand for food will grow by
50% by 2030 and 70% by 2050. However, global supply of food calories per person
rose from 2254 kilocalories per day in 1961 to 2809 kcal in 2003. Therefore the
2
challenge, in essence, is to meet the rising demand for food in ways that are
environmentally, socially and economically sustainable, and in the face of evolving
world-wide markets and distribution mechanisms, and global climate and demographic
changes. In future, food supply (including production, processing and distribution) must
– as far as possible – use the same or less land and fewer inputs, produce less waste and
have a lower environmental impact (BBSRC, 2011).
According to the Biotechnology and Biological Sciences Research Council (BBSRC,
2011) the world food crisis has been caused by:
Global population growth, coupled with demographic chance, increasing affluence
and urbanization.
Global climate and other environmental changes that will have direct or indirect
impacts on food production.
Environmental impacts of farming and food: negative impacts can include increasing
water and land use, soil erosion and degradation.
Key resources for agriculture are limited, notably land, fresh water and energy.
Shortages of resources may be exacerbated by increasing competition, for example
from urban and industrial development.
Social drivers include urbanization, demographic change, issues of land tenure,
governance and international security, changing patterns of consumer needs.
Policies of international financial institutions and developed countries.
Agriculture remains the largest employment sector in most developing countries and
international agriculture agreements are crucial to a country's food security. Indonesia is
an agricultural country where most of the population consumes rice as a major part of
their diet. The population of Indonesia has reached 240 million people with a population
3
growth of 1.49 %. The agriculture sector still play strategic, central and dominant role
for national economic growth, because agriculture also provide a significant means of
livelihood of Indonesia’s population. Agriculture products contribute about 95.36
million US$ or 15.3% of Gross Domestic Product (GDP) and 39% the country’s
employment work in agriculture (BPS-Indonesia, 2010).
The irrigation performance in Indonesia has been reported 70 % as poor
(BPS-Indonesia, 2010). The cause of the poor irrigation performance has been blamed
on technical, financial, managerial, social and institutional causes. The rapid expansion
of the population and unstable production of the basic foodstuff is now beginning to
expose a potentially dangerous imbalance between national supply and demand for
food. To obtain continuous national supply, the government’s Department of Water
Resources Development constructs many irrigation canals to supply water to the fields
to meet the demands of the nationally irrigated rice-crop system. Most irrigation
projects in Indonesia use surface irrigation in which water is conveyed on to the land by
gravity flow. To divert and raise the water level, a diversion weir is constructed across
the river so that water can be diverted to a canal when it is required. Practically all the
irrigation works are designed to supply water to the paddy fields.
Three types of irrigation schemes are constructed in Indonesia. There are technical,
semi-technical, and people’s irrigation. Technical irrigation schemes are large works of
a permanent nature, constructed and operated by a government agency. Semi-technical
irrigation schemes are minor works, either permanent or temporary, constructed by
government and operated by the farmer themselves. People’s irrigation schemes are
minor works with temporary or no weirs, constructed by the farmers.
4
Technical irrigation projects in Indonesia have been developed in all the three categories
of service areas of less than 1000 ha, 1000 ha to 3000 ha and above 3000 ha, with
management responsibilities distributed from district, province and national levels
respectively. Irrigation areas of less than 1000 ha are considered small irrigation areas
and are the responsibility of the district authorities. Irrigation areas in the range 1000 to
3000 ha and transdistrict irrigation areas are the responsibility of the provincial
authorities. Irrigation areas of greater than 3000 ha and transprovince irrigation areas
are the responsibility of the national government (Kristianto and Sitompul, 2005).
Water management on irrigation systems had been divided into two responsibility
levels. The first level water management is done by the government through the
Irrigation Department with the level of responsibility from main structure to division
structure or tapping structure. At the second level, the responsibility of management is
given to the water user association with water place building from box tertiary or
quarter. The problem that often appear is the weakness of the water management at the
level of the user so that the distributions of water to the plot of rice field did not fulfill
the needs and the timing did not follow to the schedule that have been planned.
One of the greater irrigation system (more than 3000 ha) in Aceh Province is the Pante
Lhong technical irrigation system. The Pante Lhong technical irrigation system is
located in Bireuen City, Bireuen Regency in Aceh Province of Indonesia (5o12’18”
North - 96o42’06” East). is about 5,578 ha and includes six districts. The water
resources for the Pante Lhong technical irrigation system from the Krueng Peusangan
River and the catchment area is 1,879 km2.
5
In order to achieve irrigation objectives such as increasing the crop yield and achieving
a low cost for operation and maintenance budget, the government proposed an irrigation
reform agenda by means of increasing performance of irrigation system management.
However, as the program is still under way, the performance of Indonesian irrigation
system have not been nationally evaluated and current performance figures are not yet
available (Kristianto and Sitompul, 2005).
Field investigations on management of water at on-farm level and also irrigation
performance have been studied by different researchers in which different
methodologies and strategies have been proposed. Nevertheless, it can be concluded
that the application of best management practice could improve the irrigation
management performance.
1.2 Problem Statements
The aim of an irrigation management practice is to supply and apply the right amount of
water at the right place and at the right time (Asawa, 2005) as well as removal of excess
water (Bos et al., 2005). In practice, the irrigation scheme has an extensive system of
branched canals, numerous outlets along their length where water is distributed over
large areas causing a major challange for irrigation water management (Gorantiwar and
Smout, 2005). Thus, for this reason it requires a separate service level (Bos, 1997). To
ensure its effectiveness, all stakeholders must play their role from the irrigation office
authority, field main system operators, water user associations and farmers in operating
to maintain all elements of the system (Burt, 1996).
6
The hydraulic structures in an irrigation system function as a control in which the water
can reach the field at the proper time and in the quantities needed. Control is good when
the gate intake structures are available. To ensure equitable and efficient distribution,
measurement is required at the flow regulating point (Bosch et al., 1993). However,
the infrastructure facility is not only the single variable that affects the water delivery
service. This is because irrigation is not only about canals, peoples, or crops. It is an
interactive process among hydraulic, institution, and biological mechanisms, and the
whole result cannot be explained by any single discipline (Djibril and Diemer, 2004).
For that reason, the optimal irrigation performance cannot be achieved through technical
aspects only; such as the measurement of frequency, rate and duration of water supply.
The institutional aspects of service delivery such as the legal framework, management
decision making or social attitudes, can fundamentally undermine the proper
functioning of service provision form and are often unseen but nevertheless, a crucial
part in their relationships (Bos et al., 2005). As a result, the quality of water delivery
service is determined by several elements such as adequacy (a measure of water supply
ability to meet the water demand for optimal plant growth), reliability (a measure of the
confidence in the irrigation system to deliver water as specified by the level of service),
equity (a measure of the access to a fair share of the water resource according to the
amount specified by the water rights) and flexibility (a measure of the ability of users to
choose the frequency, rate and duration with which the irrigation water is supplied)
(Malano et al., 1999).
For the Indonesian irrigation cases, although many technical irrigation schemes had
been constructed, most of the irrigation schemes have not been nationally evaluated and
current performance figures are limited (Kristianto and Sitompul, 2005).
Therefore, a research study on the Pante Lhong technical irrigation scheme as one of
7
large-based irrigation area under the central government authority (> 3,000 hectares) is
needed to evaluate its efficacy after 18 years of operation. The research needs to be
carried out to define a methodological appraisal development for the scheme using the
primary and the secondary data available, to identify current contributing factors on the
performance reduction and could determine the required priority setting in the
improvement plans by the irrigation authority.
1.3 Research Objectives
The primary objectives of this study are presented as follows:
1. To evaluate the actual performance based on tertiary and final delivery area using
selected indicators from the RAP (Rapid Appraisal Process) method for the Pante
Lhong technical irrigation system by the continuous irrigation supply method.
2. To identify the actual crop yield based on external indicator and relevant controlled
supply internal indicator with external indicator that will result in improving the
infrastructure maintenance and water delivery service in crop yield.
3. To study the production cost for determining feasibility and return of investment
(ROI) of farming and farmer income based on the crop yield in the Pante Lhong
technical irrigation system.
1.4 Scope of Research
An irrigation system is a combination of diverse, yet related, part that form a unified
whole. To conduct this study, the canals and the farmers are selected in three region
areas, upstream, middle stream and downstream of the Pante Lhong technical irrigation
system. Each region study area is divided into three sub regions (head, middle, and tail)
8
and number sample for each area is nine samples. The amount sample each region is 27
samples and the total samples are 81 samples. The study is based on the continuous
irrigation supply method. A total of 81 farmers were selected in three regions in the
Pante Lhong technical irrigation system with a continuous irrigation supply. Besides
utilizing existing secondary datasets, data were collected through on site and field study
based on existing irrigation systems. To ensure that the data was recorded properly,
a questionnaire survey was also conducted for the farmer’s production at selected site.
The identification of infrastructure conditions in the tertiary area of the Pante Lhong
technical irrigation system was collected through field observations.
In this study, a series of indicators and sub indicators were selected from the Rapid
Appraisal Process (RAP) performance standard, which was considered to be related to
the objective of the current evaluation. The selected indicators were grouped in terms of
infrastructure maintenance and actual water delivery service. The infrastructure
maintenance performance indicators consisted of floor and canal bank, seepage, level of
gate maintenance and availability of proper equipment and staff. For the water delivery
service aspects, indicators used were flexibility, reliability, equity and control of flow to
costumers. These indicators were selected from the RAP performance standard.
Although the results of this study are limited to the location and condition of the
infrastructure, the methodology developed can be used for further study to compare
existing performance level in different systems, locations and conditions.
The scope of irrigation canals and irrigation structures in this research are located in the
tertiary and final delivery area with continuous irrigation supply method. Because the
problems in tertiary area very complex and in this area the farmers or water user
associations have responsibility to operate, adjust, manage and organize the schedule of
9
water and activity on-farm of the irrigation system. In other hand, the Pante Lhong
technical irrigation system is wide and large area to be studied. Moreover unavailability
of the secondary data about the Pante Lhong technical irrigation system cause this study
just focus on tertiary and final delivery. To collect all the parameters at each irrigation
parts (primary, secondary, tertiary and final delivery) take a long time and huge costs. In
continuous irrigation supply method, no water shortage is find during both paddy
planting seasons and the farmers may withdraw water every day from off-take
structures.
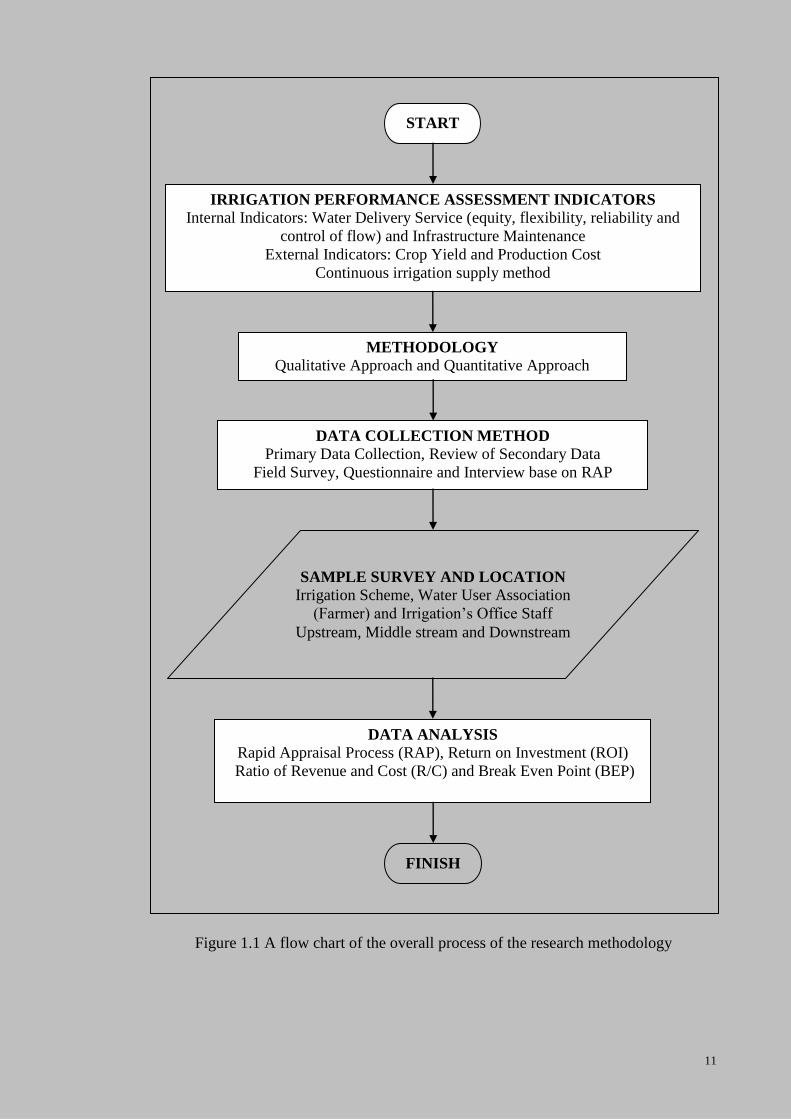
1.5 Research Methodology
The Rapid Appraisal Process (RAP) method is a visual assessment tool that provides a
systematic evaluation of the irrigation systems and internal water distribution process at
various levels. In this method, the performance is evaluated using a number of internal
indicators and external indicators that covers different aspects of evaluation (Burt and
Styles, 2004).
The internal indicators were selected from the RAP method that is considered relevant
to the current assessment of irrigation management practice performance at the canal
level. The RAP method is a performance appraisal tool to facilitate decision making,
strategic planning and management process. The present study was focused on the four
sub indicator performance of water delivery service indicator which consisted of
flexibility, reliability, equity and control of flow to the customers/farmers. Additionally,
this research also incorporated with four sub indicators performances of infrastructure
maintenance indicator, which are the floor and canal bank, seepage, level of gate
maintenance and availability of proper equipment and staff. Each of the sub component
10
indicators contained a number of criteria or statement description and related score
values. These score have a potential maximum value of 4 (best of the most desirable
condition) and a minimum possible value of 0.0 (worst or indicating least desirable).
The rating score value was classified as worst (0.0), worse (0.5), very poor (1.0), poor
(1.5), enough (2.0), quite enough (2.5), good (3.0), very good (3.5) and excellent/best
(4.0) were proposed by Burt and Fecon, (2001).
The external indicator assessed were crop yield and production cost. Crop yield data
was collected from the farmers in the three regions which were upstream, middle stream
and downstream. The crop yield data (productivity) was compared to the productivity
data at local, provincial and national level. Data on the production cost were calculated
based on land preparation cost, growth stage cost (maintenance, fertilizer and insect)
and harvesting cost. The land preparation cost consists of seed cost, preparatory and
cultivation cost. The growth stage cost involves maintenance cost, fertilizer cost and
insecticide cost. Cost for cutting, threshing and transportation (including transporting
rice from the fields to the road or home and factory) are part of the harvesting cost. The
average of cost production was used to calculate the feasibility level analysis of rice
production. Figure 1.1 shows the flowchart model depicting the overall process of the
research methodology.
11
Figure 1.1 A flow chart of the overall process of the research methodology
SAMPLE SURVEY AND LOCATION
Irrigation Scheme, Water User Association
(Farmer) and Irrigation’s Office Staff
Upstream, Middle stream and Downstream
START
IRRIGATION PERFORMANCE ASSESSMENT INDICATORS
Internal Indicators: Water Delivery Service (equity, flexibility, reliability and
control of flow) and Infrastructure Maintenance
External Indicators: Crop Yield and Production Cost
Continuous irrigation supply method
METHODOLOGY
Qualitative Approach and Quantitative Approach
DATA COLLECTION METHOD
Primary Data Collection, Review of Secondary Data
Field Survey, Questionnaire and Interview base on RAP
Method
DATA ANALYSIS
Rapid Appraisal Process (RAP), Return on Investment (ROI)
Ratio of Revenue and Cost (R/C) and Break Even Point (BEP)
FINISH

12
1.6 Significance of Research
The problems and challenges of food in the world are increasingly complex. The growth
of global population are related with growth in demand for food which in turn is related
to agriculture. On the other hand, key resources for agriculture are limited, notably land
and water. Decreasing quantity and quality of land and water resources will put a strain
on improving food productions. Thus, assessment and improvements on existing
resources related to food security is crucial, one of them being irrigation performance.
This study is an assessment of performance and productivity of irrigation system. This
is done to fulfill the research objectives which are review and identify the actual
irrigation and the actual crop yield based on internal indicators and external indicators.
Hopefully this will result in improving the infrastructure maintenance and water
delivery service in crop yield. This research is expected to improve the management and
strategic planning formulation in implementing and developing irrigation system
performance which should result in increasing crop yield (production) of food and
improve the farmer’s life. Enhancing irrigation performance should result in more
efficient water usage and increase food production which are important dimensions of
food security.
1.7 Thesis Structure
This dissertation consists of five chapters excluding the appendices, the references and
bibliography.
Chapter one briefly gives the introduction to the research, provides the background and
motivation behind the study. It covers the background, problem statement, research
13
objectives, scope of work, research methodology, significance of the research and thesis
structure.
Chapter two reviews the general literature relevant to the irrigation water management.
This chapter also focuses on the performance evaluation of irrigation projects as a
process of collecting and analyzing data obtained from both office and field surveys. In
terms of data collection, methods have been proposed both quantitative field data
measurement and qualitative data survey are utilized. It presents the on-farm
performance evaluation and on-farm measurement and survey.
Chapter three presents the methodology and data collecting procedure of this research.
The case study and site location of the Pante Lhong technical irrigation system is
discussed and included in this chapter. The chapter describes an approach to collecting
data based on field observation and face to face interview. This chapter also explains the
canals, infrastructure of the irrigation system and the history of the Pante Lhong
technical irrigation system. This chapter also details out the characteristics and farmer
sample chosen based on gender, education, field size and others related to the research.
Chapter four presents the result and discussion. This chapter will presently discuss the
internal performance indicators assessment such as floor and canal bank, seepage, level
of gate maintenance and availability of proper equipment and staff for infrastructure
maintenance indicator and flexibility, reliability, equity and control of flow to costumers
for water delivery service indicator. The external performance indicator assessments
result include are farmer production (yields) and cost of production. At this stage an
analysis was carried out to obtain the impact of the canal network to the water delivery
service performance and impact of internal indicator to external indicators. The analysis

14
was focused on the business analysis of the rice crop in Pante Lhong technical irrigation
system with continuous irrigation supply method.
Chapter five gives the conclusions derived from this research and recommendations for
future improvement. Some recommendations and suggestions are deliberated further for
clarity and discussion.
The dissertation ends with the references and bibliography used in the research. The
references are books or papers read by the author and ones directly quoted in the
dissertation. The bibliography included material which were consulted during of this
research work but not quoted directly.

15
CHAPTER II
LITERATURE REVIEW
2.1 Introduction
The literature review conducted in this chapter includes general information related to
rice and irrigation water management. This chapter highlights studies research
publications such as a quantitative field data measurement and qualitative data survey.
This chapter also review the success of irrigation management depending on planning,
operation, evaluation and farmer participation. While quality of service irrigation can be
assessed through some indicators.
2.2 Rice
According to Chandrasekaran et al. (2008) rice is hydrophytic plant and often cultivated
as a semi-aquatic crop. Rice (Oryza sativa) is a general consensus that was domesticated
somewhere in Southeast Asia. However, there are varieties and strains, which are
ground under, dry or rain fed and semi-dry conditions. For the efficient physiological
functions of the plants, a saturated condition of the soil is sufficient. It is not correct to
assume that rice crop requires standing water. The practice of maintaining a standing
sheet of water is for checking the growth of weds. Rice is essentially a crop of sub-
tropics and on higher elevations up to 6000 feet above sea level, it is also cultivated.
Besides the abundant supply of fresh water needed for irrigation, the rice growing areas
are characterized by high temperatures during the growing seasons and high
16
atmospheric humidity. High altitudes and low temperatures delay flowering and
maturity.
The conducive temperature range is from 21oC to 31
oC, although extremes over these
are also tolerated by the crop. Rice can be grown successfully on a variety of soils. The
most important requirement of the soil is its ability to hold moisture for a considerable
period. Rice alluvial soils with impervious sub-soils are ideal for the crop. Rice thrives
over a wide range of soil reaction ranging from 4.5 to 8.5 pH. The most favorable range
is 5.5 to 7 pH. Only few rice varieties possess tolerance for saline and alkaline
conditions (Chandrasekaran et al., 2008).
2.3 Irrigation Management System
Irrigation is an artificial application of the water so that crops can utilize it for
maximizing production. Based on this, the function of management is to supply the
right quantity of water at the right time and place, with the objectives of water control
and resource conservation. With these objectives, deliveries made from a tertiary
conveyance system are expected to be made in an adequate, equitable and reliable
manner such that losses at the end of lateral outlet are minimized.
The objective of irrigation system is to provide the amount of the water as needed by
crop in order to achieve its target production and economic returns. However, Dedrick
et al. (2000) explained that to meet production objectives, various resources besides
water only such as irrigation practices, weather factor, farm internal factors (e.g.,
technology, labor and financing) and farm external factors (e.g., water delivery rule,
local regulations and crop prices) are needed. Therefore, due to the complexity of
17
production system, a systematic understanding of the system performance, application
of water management to improve and assure the sustainability of irrigated agriculture, a
regional perspective to improve agriculture water management were needed.
In addition, Jahromi and Fayen (2001) argued the fundamental objective of any
irrigation system is to provide the amount of the water as needed by crop in order to
achieve its target production and economic returns. Farm irrigation systems must supply
water at adequate rates, quantities and correct times to meet farm irrigation
requirements and schedules. They divert water from a water source, convey it to
cropped areas of the farm, and distribute it over the target area (Kanber et al., 2004).
The farm irrigation systems facilitate management by providing a means of measuring
and controlling flow.
Although the primary function of irrigation is to provide water delivery service for
agriculture use, there have been a few significant effort made to measure the
characteristic and success of this function, quality of irrigation service or conveyance
manage ability while low efficiencies have been documented in various projects (Burt,
1996). Accordingly, Pereira (1997) noted that irrigation scheduling refers to when and
how much water to apply, i.e. the irrigation depths and timings. These depend not only
on the crops demand but also on the soil water reserve, climatic patterns, crop
management, and irrigation method and water availability. The farm water supply
systems play a major role when selecting the water application and the irrigation
scheduling systems.
Within irrigation schemes, Gorantiwar and Smout (2005) explained that the success of
irrigation water management depends on appropriateness of planning, operation and
18
evaluation process. In planning phase, the targets focus on distribution of land, water
allocation and water delivery schedule to different crop up to tertiary level. In operation
phase, the target focus on implementation or modified and implementation. In the
evaluation phase, data are collected and analyses to determine the performance.
Nevertheless, they added that, there is a perception that many irrigation schemes in
developing countries with huge investment in infrastructures of irrigation system do not
achieve its objectives.
Dedrick et al. (2000) explained that competition for water by users and on-farm water
mismanagement are some of key problems faced by irrigated agriculture. The
complexity of the agriculture activity and the diversity of interest affected by water
management decisions make the development of strategies to accomplish the goals a
difficult task. Therefore, there is a need for a holistic process to guide change in
irrigated agriculture that takes into account multiple stakeholder goals and priorities.
The irrigation management at tertiary level can be improved towards the better use of
available water through the existing irrigation networks using the technical (e.g.,
infrastructures) or/and non-technical aspect (e.g., establishment of water user
association organization). Some of research publications on relevant topics
are summarized as follows. For example, the Thailand government in 1999 developed a
program for the modernization of water management system (MWMS) using
Participatory Irrigation Management (PIM) concept. The main success of the projects
are as follows: (1) improvement of irrigation facilities with the farmers’ participation;
(2) providing an opportunity for discussions with farmers to enable the adjustment of
water allocation through the establishment of an Integrated Water Users’ Group
(IWUG) in the early stages of the project; (3) holding monthly meeting of the IWUG;
19
(4) developing, operating, and monitoring the water allocation plan in cooperation with
both farmers and government officials (Shioda and Onimaru, 2006).
To overcome budgetary problem, poor irrigation performance, increase level of
productivity, and cutting public expenditure, the Mexican government introduced the
Irrigation Management Transfer (IMT) program at the end of 1980s. In this program,
the government adopted the policy of transferring of the management authority from
irrigation district to water user association. The water user will be participated in the
effort to increase the productivity, improve the viability of irrigation district and
decreasing costs for both the farmers and the government. That enabled the WUAs to
function as autonomous and special purpose organizations for irrigation management
(RAP, 2006).
Similar conditions are also faced by Turkish government to overcome budget constraint
for operation purposes. After 1994, they started to transfer irrigation management from
government authority to water user association (Unal et al., 2004). Responsibilities of
WUAs include: (a) scheduling and delivering water within the WUA unit; (b)
monitoring deliveries to farms; (c) collecting operational monitoring data; (d) resolving
disputes; (e) paying irrigation pumping cost and also the farmers can widely participate
in irrigation management at a local level. This is considered as the basic element to
enhance the performance of farmer manager irrigation system for sustainability rice
production as well as the farmer may solve conflict at field level cause by water
shortage and dissatisfaction about the timeliness of water distribution (Pasaribu and
Routray, 2005).
20
Mark and Ruth (1997) explained those farmer programs are needed induce farmer
participation in irrigation systems to make important contributions to management.
Farmer participation in planning and management is a key element of most future-
oriented strategies for irrigation management improvement. Suprodjo and Sahid (1993)
stated that less farmer participation in irrigation development can cause the effect in
operation and maintenance of irrigation network, due to (1) lack of farmer
understanding on ability of irrigation network service; (2) farmer not understanding how
to operate irrigation network; and (3) lack of responsibility from farmer about the
maintenance of the sustainability of irrigation network.
The obvious dimensions of irrigation are tangible such as how much water are used,
what acreages of land were irrigated, what types of crops are grown, what forces of
change and responses are seen. However, to understand irrigation and how evolve in the
future, we must consider the more intangible (the culture of irrigation) such as the social
meaning and attitudes toward of irrigation. Furthermore, they added that understanding
local irrigation culture is often as a key to resolving conflicts and to identifying and
implementing creative practical solution to irrigation problems. Irrigation management
research, particularly in Asia, has identified important linkages between cultural,
institutional, and technological dimensions of irrigation practice (Staff, 1996).
Nevertheless, irrigation is about not only canals, people, or crops. It is an interactive
process among hydraulic, institutional, and biological mechanisms, and the resultant
whole cannot be explained by any single discipline (Djibril and Diemer, 2004).
In the past, there have been two major approaches to evaluating the overall performance
of irrigation schemes: (1) its production or return on investment and (2) its efficiency of
water use. In recent years, the International Irrigation and Drainage Community have

21
attempted to provide more useful performance parameters. Two major approaches to
performance evaluation have been to consider (1) how well service is delivered and
(2) the outcomes of irrigation in term of efficiency and productivity of resources use.
These have been referred to as internal and external performances, with internal or
process indicators measuring one and external or output indicators measuring the others.
Recent works on performance assessments have used both of these for assessing
(Bos et al., 2005).
2.4 Performance Evaluation of Irrigation System
Performance evaluation of irrigation projects is a process of collecting and analyzing
data both secondary data (official data) and field survey. In term of data collection, there
are two comman methods that have been proposed in many research publications such
as a quantitative field data measurement and qualitative data survey.
2.4.1 Quantitative Field Data
Bos et al. (2005) explained that performance measured with indicator, for which data
have been collected and recorded. The analysis of the indicators then informs us on the
level of performance. The purpose of performance assessment is to achieve efficient,
productive and effective irrigation and drainage systems by providing relevant feedback
to management at all level.
Gorantiwar and Smout (2005) described that the performance of irrigation system could
stated as the extent to which the land and water resources in the irrigation schemes
planned for allocation to different users according their spatial and temporal distribution
22
in planning and operation stages follow the objectives of the irrigation scheme. They
proposed four types of performance measurement, such as (1) economic (productivity);
(2) social (equity); (3) environmental (sustainability); and (4) management (reliability,
adequacy, efficiency and flexibility).
Renault and Vehmeyer (1999) stated that a good service cannot be provided with
unreliable infrastructure. They added that high level of reliability and flexibility are
ideal situation. However, tentative conclusion can be stated that reliability should be the
first priority in enhancing the performance of the irrigation system. As such, the system
with high reliability performance or high predictability is easier to manage. Moreover,
they added that equity is reflected in the way the irrigation service spatially distributes.
Because of the physical dependability of the downstream sectors on the upstream
sectors, the quality of downstream service is highly dependent on what happens in the
upstream part of the system.
Various criteria have been developed and used for evaluating irrigation system
performance. They include mainly social, economical and technical (hydraulic)
indicators of performance of irrigation systems. These are known as the performance
criteria of a system. They are, for instance, productivity, social stability, financial and
economic criteria, effectiveness, efficiency, equity, reliability, and general welfare
criteria (Essafi, 1995).
Daniel et al. (2007) proposed the important indicators such as adequacy, reliability,
equity, flexibility (frequency, rate and duration) and measurement of volumes can be
used to assess water delivery service at each level of irrigation network. The quality of
service to agricultural users can be specified through indicator similar to those used for
23
performance assessment, e.g. adequacy, flexibility, reliability and timeliness.
The service to farmers is usually defined with reference to three time related aspects that
are important for farming organizations: (1) allocation of water for the season or year;
(2) irrigation delivery scheduling; and (3) actual water delivery.
Vandersypen et al. (2006) analyzed hydraulic performance of the Office du Niger
irrigation system of paddy rice at tertiary level in 1995 and 2004. Major physical
rehabilitation, economic and institution reforms carried out from the 1980s to success
the project. The internal performance indicators of adequacy, efficiency, dependability
and equity were used. The indicator compared the volume of water required with the
water delivered of a certain sub region during a certain period. The instant flow rates at
the intake of canals from the samples ware measured daily during the growing season
and considered constant for that day. Adequacy assessed whether the requirement has
been met the amount of water delivered. Efficiency is a measure for the excess of water
delivered in comparison with the requirements. Dependability expresses the degree of
temporal variability of irrigation delivery compared to requirement. Equity is a measure
for the spatial uniformity of water deliveries and shows the fairness of water delivery
across delivery points. They found that the interventions and current management
practice on in the irrigation project succeeded in establishing a good adequacy of water
supply of 0.96 in 1995 and 0.92 in 2004. Efficiency is 0.51 in 1995 and 0.56 in 2004
which indicated low and no improvement. Dependability and equity is poor in
accordance to Molden and Gates’ criteria. Furthermore, they concluded that to improve
efficiency at tertiary level while maintaining the good adequacy, dependability and
equity of water delivery, investment in water management is required.
24
Jahromi and Feyen (2001) stated that the fundamental objective of any irrigation system
is to control water in such a way that it increases agricultural production. The adequate,
reliable and equitable delivery of water in irrigation canals plays an important role in the
achievement of this objective. In order to achieve effectiveness of performance analysis
and due to the nature of irrigation, the performance should assessed in a spatial and in a
time context by means of a dividing them into several sub-systems and assessing the
delivery performance at these lower levels. A hydraulic performance indicator (the ratio
of actual discharge to required discharge) at primary, secondary, and tertiary levels
provide information on spatial distribution at the higher level as well as the performance
of the structural and management components of the systems. They explained that the
values of temporal and spatial of delivery performance ratios (adequacy, equity,
reliability, and uniformity) could be determined using matrix. To indicate the degree of
variability and its uniformity at various evaluation levels, the statistical indicator such as
the coefficient of variation (standard deviation divided by the average) was used.
The measurement data of actual discharges were made in nine outlets from each
selected canal at the head (T25), middle (T27), and tail end (T29) using current meter
method. The results showed that no great difference in adequacy performance with
regard to intended amount during the different irrigation periods, but canal that located
in the tail end of the district, did not receive such an adequate amount of water as others
during the three last irrigation periods. The temporal delivery of water to the three
irrigation canals shows a difference between head and tail, and most of the outlets
located at the head (T25) and middle (T27) of canals received more than their intended
share of water. For the output values of the performance evaluation indicators show that
minimum variability could be found for the temporal average of the delivery
performance ratio at the mail level, the degree of spatial variability at the main
25
evaluation level is more than the degree of temporal variability. This means that
performance relative to reliability is better than that relative to equity. Both spatial and
temporal variability have the same uniformity, which could be due to their uniform
management. They concluded that performance variability and uniformity indicators are
both necessary for assessing and analyzing water delivery systems. Without considering
the uniformity of the spatial and temporal variability of water delivery at different
levels, proper assessment of variability performance is not possible. Application of this
approach to the Doroodzan Irrigation System revealed that it was able to deliver
adequate water according to the intended supply, and that the water was delivered
relatively more reliably than equitably in the irrigation canals of the Hamonn District.
Okada (2005) stated that except for crop yields, however, cause-effect relationships
between external factor and internal performance are not quantitatively validated.
Therefore, further research is necessary to make clear what internal factors have
significant effects on particular performance measure. Irrigation project performance
improvement planners need to properly understand the effect of farmer participation on
particular performance measures, as well as considering other internal factors that may
be relevant.
2.4.2 Qualitative Field Data
McKay and Keremane (2006) studied the institutional arrangements government water
use and distribution and also try to elicit the farmers’ perception of the Mula irrigation
scheme, India, after the transfer of management responsibilities to the WUA by
Irrigation Department. Data for the present study was obtained through face-to-face
interviews with the irrigator, member of the WUA and key-informants that included
26
official from the Irrigation Department (ID) and office bearers of the WUA. The
questionnaire used for the study was designed after considerable literature survey,
consultation with ID officials, local key researchers, and also to fulfill the project brief
from the Australian Centre for International Agricultural Research (ACIAR) project that
aimed at studying the water management institution in India. It used a number of 10
point Likert Scale translated into local language of Marathi allowing the respondents to
mark the document when asked for their perception whether they agreed or disagreed
with the propositions. Respondents were selected randomly from the list of members
provided by the secretary of the WUA, and 70 respondents were selected so as to
include at least 20 per cent of the total number of members. The data collected was
statistically analyzed using SPSS statistical software to produce frequency tabulations
and graphical representations. The results show that the chi square estimate is not
significant suggesting that the sample is the same as the population. Around 71 % of the
farmers indicated water shortage was the main reason for forming a WUA,
7 % indicated inefficiency of ID as the most important reason. Around 8 % perceived
that government policies related to water was the diver for forming a WUA. In terms of
rule for water distribution, the farmer perception was only about 13 per cent agreed that
the rule. Recording of flows is done jointly by the canal inspectors from the ID as well
as the WUA and the distribution of water to individual farmers is done by the WUA on
crop-area after comparing the quantity of water demanded (by WUA) and the amount
sanctioned (by ID) was good. Furthermore, they found that the water distribution on
volumetric basis would be better idea. Chi square estimated indicated that all farmers;
irrespective of their age group or land holdings had a similar perception about this rule.
However, the WUA official had their reason not delivering water based on volumetric
basis. Their consider that measuring the flows, computing the quantity of water and
maintaining individual farmers’ accounts were difficult.
27
Burton et al. (2003) evaluated the function of 19 User’s Associations in the Tunuyan
irrigation systems, Argentina. They studied the performance of the knowledge and
know-how of the UA’s on the basis of an 85-question questionnaire and related
interviews on distribution of water, management and control, irrigation water and social
factor. They found that to be able to maintain and modernize the irrigation system,
sufficient funds must be available. It is necessary to modernize the management
capabilities of canal inspectors and to provide support for the technical staff advising
and planning the inspectors’ decisions. This assistance should be given in such a way
that the natural leadership of the inspector and users’ participation in the UA are
supported.
Bhatta et al. (2005) studied the affect of irrigation management transfer from
government agencies to the farmer based on the field investigation during the year 1996
and 2001 of Chitwan irrigation system, Nepal. Thirty respondent farmers were selected,
three each from all ten branch canals in which three farmers each canal that portioned
from head, middle and tail region. Semi-structured questionnaire were used for data
collection on two aspects. First details on cost of production and income from
agriculture enterprise along with the yield level of rice, which is a major water
consumer, is collected from 1996 and 2001. Second, farmers are asked about their
satisfaction level to the present management by farmer-managed irrigation system
(FMIS) compared to the agency-managed irrigation systems (AMIS). Two approaches
were for data analysis: direct using Logic Model and indirect method by t-test. They
concluded that most farmers are satisfied with the management transfer and perceive
FMIS to be superior to AMIS. Over 66% of the sampled farmers believe that equity had
28
improve, around 60% believe that leakage had reduced, the rice productivity increased
by more than 30% and profits from agriculture has nearly doubled due to IMT.
Maton et al. (2005) investigated the relationship between maize irrigation strategies and
three farming sub-systems: the production system, the water resources system and the
irrigation equipment system of irrigation system in south-western France. Some 70
variables of the farming system were available for the 56 farmers. Data were analyzed
based on typologies from the three farming sub-systems and from irrigation strategies
and the link between the different typologies. Irrigation strategies were developed based
on four decision rules: when to start the main irrigation season, when to start subsequent
cycles of irrigation, a rule to delay irrigation due to precipitation and when to stop the
irrigation season. Multivariate analyses, cluster analyses, linear regressions and
regression trees were used for that purpose. The results showed that the hydraulic an
institutional context explained the difference in spatial and the variability of the
irrigation strategies mainly depends on the characteristic of the regions.
Strategic management of irrigation is similar amongst in a given area while more
operational actions differ from farmer to farmer.
Deng et al. (2005) identified and evaluated the impact of resources, particularly
irrigation, and technology on the farm production in northwestern China. The input
variables such as irrigation ratio, farm labor, fertilizer application, and farm machinery
were used. Multivariate statistical analysis (correlation and regression) was used to
characterize the temporal trends and spatial variation of farm output and input variables
in the five provincial distracts during 1978 – 1998. Correlation analysis was used to
examine the association of farm output with selected inputs, and between the inputs
themselves. The correlation analysis in this study was based on Pearson’s correlation
29
coefficient to reflect the degree of linear relationship between any two variables.
The gross value of the farm production in the region increased fivefold during the study
period, and was strongly associate with resource use and technological input. The gross
value of farm production was significantly correlated with the irrigation ratio in
Shaanxi, Gansu, and Ningxia, where the irrigation ratio was relatively low compared
with the national averages. During the study period, the application of the technological
inputs increased two to eightfold, and contributed about 45% in the growth of farming
output in the region. Farm production was also found to be significantly correlated with
labor input. Results of this study indicated that water use efficiency and irrigation
management need to be improved for future agricultural development, and further
advances in farm mechanization and technology application are key for increasing farm
production with limited water resources in this semi-arid area.
Ghosh et al. (2005) studied the irrigation performance of Mahanadi Delta Irrigation
Project in the State of Orissa, India based on farmers perspective. Methodology based
on farmer’s assessment of the utility of irrigation water supply was studied and the
concept of fuzzy set theory is applied to analyses the responses from farmers concerning
their perceptions of the irrigation service provided to them. Factors of the utility of
water delivery service in a distribution system such as tractability, convenience end
predictability were used. The tractability factor is defined as the ease with which
farmers can control and satisfactorily apply water to their land. Three sub-tractability
factors of quantity of water supply, point of water delivery and stream size were used.
Convenience is referred to the timing of water delivery as preferred by farmers to enable
them to plan their activities. Four sub convenience factors of timing of water arrival,
flow rate of water, duration of water supply and frequency of getting water were
studied. Predictability is related to the farmer’s degree of confidence with respect to
30
water supply service, or how much information is available to famers about the water
delivery schedule and the degree of uncertainty associate with this information.
Predictability can improve water use decisions and is measured using three sub-factors:
knowledge of future water supply, management decisions influenced by water supply,
and certainty of water availability. The preference of quantity or timing of water supply
varies between the farmers. The question of suitability of water volume and timing
involves the subjective judgment of farmers. Data on flow levels are sometimes not
available. Therefore, fuzzy set theory can be used to estimate the overall utility or
appropriateness of a given water supply schedule according to farmers’ perceptions.
Fuzzy set theory is used to aggregate the opinions of all sampled farmers regarding each
sub-factor and to evaluate the importance of each sub-factor with respect to
appropriateness of the water supply schedule. Considering educational level of most
farmers, they are likely to be more consistent in giving an imprecise verbal description
than if they are asked to evaluate on a rating scale. Command area of three minors
(laterals) of the branch canal was selected by random sampling method and divided into
three regions: head, middle and tail following geographic criteria. Ten farmers from
each of strata were selected at randomly. The farmers were interviewed as individuals.
Each farmer put forward his judgments with respect to each factors and sub-factors and
its importance in the form of linguistic expressions. The linguistic expressions ranged
from “very good”/”very high” to “very bad”/”very low” were used. They concluded that
the fuzzy set theory can be used to evaluate utility of irrigation service where the flow
data are not available.
Hussain et al. (2006) studied irrigation-poverty linkages, and determines how and to
what extent irrigation contributes to poverty alleviation, and whether there are any
31
spatial patterns in poverty in Indonesian irrigation systems. About 60% of the total
irrigated area is located in Java, with the island contributing around 60% to the national
rice production. However, a large number of Javanese households still live under
poverty. The present performance of irrigation is far from satisfactory as far as
distributive and welfare issue are concerned. The primary data for the study was
collected from the selected irrigation systems and from adjacent rainfall areas through
household surveys using a detailed survey questionnaire. The sample was drawn using a
multi-stage sampling method. In the first stage, each of the selected irrigation systems
was purposively divided into head, middle and tail parts. In the second stage, one to
three water user association (WUAs) were selected in each selected part of each
system/scheme. A sampling frame was developed by obtaining a complete list of farmer
members from WUAs. In the third stage, households were selected from the sampling
frame through random sampling. The selected households were interviewed with a
structured questionnaire for gathering data and information on various aspects such as
demographics, landholdings and agriculture as well as irrigation. The survey covered all
cropping seasons during the 2000 – 2001 agricultural years. The results indicated that
irrigation has significant poverty reducing impacts. Improving the performance of
irrigation systems by enhancing land and water productivity, diversifying cropping
patterns and improving water distribution across locations would help reduce poverty in
presently low productivity-high poverty parts of the systems.
Montazar and Behbahani (2007) developed and evaluated a comprehensive model of
selecting optimized irrigation systems based on different criteria and parameters
including physical, socio-economic, and environmental factors effecting system
efficiency to improve resource exploitation for agriculture of Ghazvin Irrigation
network in Iran. For their field investigation, a questionnaire was prepared and
32
distributed among 30 local irrigation experts. The questionnaire was designed in a
manner that allowed for the respondents to select from among priorities for irrigation
systems and sub-systems in each of the three study regions. Ranking the irrigation
systems and sub-systems in each region was based on the total sums of the values
obtained from questionnaires. Fifteen criteria were adopted for the selection of irrigation
systems and five criteria for the selection of irrigation sub-systems. The results from the
proposed model are in good agreement with results from the field investigations. This is
because various mutually excluded multivariate criteria were considered in the proposed
model, which guarantees a higher quality of the final solution and enhanced consistency
throughout the decision-making process.
Jahromi and Fayen (2001) stated that performance evaluation helps to determine the
degree of realization of the objectives. Many objectives have to be realized in irrigation
schemes. There appears to be reasonable agreement in the literature that the delivery of
irrigation water should be evaluated on the dimensions of adequacy, timeliness, and
equity. Other terms are also used, such as, efficiency of water use, predictability and
reliability of the water supply. The parameters adequacy, equity, and reliability, are
considered to be the main objectives of a water delivery system. A water delivery
system can be evaluated at various levels in space (outlet, course, district, etc.) and time
(day, irrigation period, season, etc.). Assessment based on different levels in space and
time demonstrates the variability performance of an irrigation system and provides a
clear picture of the subdivisions of the system.
Moreover, the performance evaluation of irrigation can be examined in two major
components, i.e. the on-farm system, supply and distribution (off-farm) system. It is
obvious that, the off-farm system should be capable of delivering water to farms with
33
sound adequacy, efficiency, dependability, and equity. These parameters are commonly
used for controlling an irrigation system performance. The performance of a system can
be defined as the measurement of the degree/level of fulfilment of the established
objectives (Kanber et al., 2004).
Gorantiwar and Smout (2005) report productivity indicators can be measured by main
gross term (total net benefits, total area irrigated, and total crop production for the single
crop case); efficiency terms (net benefits per unit area irrigated, crop production per unit
of area irrigated for a single crop, crop production per unit of water used for a single
crop, net benefits per unit of water used, and maximum irrigated area per unit of cultural
able command area). Depending on the objectives of irrigation water management in the
irrigation scheme, equity can be as area allocation, water allocation, crop production
and benefits generation. The parameter to be considered for equity in water allocation
may vary: depth, volume and discharge. Equity should enable us to know the degree of
variation in the allocation of the resources to different allocation units/farms in the
irrigation scheme and the variation in allocation of the resources in different reaches of
the scheme (head, mid and tail). The reliability is defined as the ability of the water
delivery system and the schedule to meet the schedule demand of the crop. Flexibility is
defined as the ability of water delivery schedule of the allocation plan to recover from
any changes caused in the schedule. Sustainability is the performance measure related to
upgrading, maintaining, and degrading the environment in the irrigation scheme. The
efficiencies to be considered at different levels in the irrigation scheme are described as
follow. Application efficiency or application ratio: this efficiency indicates how
efficiently the water delivered to the field is applied in the field. Distribution efficiency
or tertiary ratio: this is the efficiency of water distribution of canal network in the
allocation unit water up to the individual field.
34
Norman et al. (2000) studied on-farm water management within a traditional,
falaj irrigation system in northern Oman. In the planning and design of regional
irrigation development programs, generalized assumptions are frequently made as to the
efficiency of traditional surface irrigation systems. The selection of Falaj Hageer for
study was based on several criteria. It is a medium-to small-sized falaj system (under 10
ha) which supports 30 participant farmers and is sustained by year-round spring (any)
flow. The selection of plots well distributed within different sectors of the system (e.g.
at the head-end versus the tail-end of the channel delivery system). The period water use
monitoring from October 1995 to March 1996. Direct water use monitoring and
informal farmer interviews were employed in the assessment of on-farm water
management. Flow measuring flumes were placed at the channel water delivery outlet at
each plot, and water delivery times and flow rates were recorded during each irrigation.
They founded that on-farm ratios of crop water demand to irrigation supply (D/S) were
relatively high in Falaj Hageer. The data indicate that farmers understood how to
manage water carefully when using traditional surface irrigation methods, in so long as
flow rates (in particular, base flow rates) can be anticipated and remain within their
control.
Unal et al. (2004) examined the water delivery performance system at tertiary level of
the Menemen Left Bank Irrigation System, in the west Turkey according to the internal
indicators of adequacy, efficiency, dependability and equity indicators for the 6-month
of 1999 and 2000. These indicators were calculated from spatial and temporal
distribution of estimated irrigation water requirements and flow rates measured. The
nine selected research areas were divided in three locations, three of which are at the
head, three at the middle and three at the tail of the system. The result showed that the

35
calculated indicator average values were poor for adequacy, dependability and equity,
and fair for efficiency. The cause of the problems was affected by part from
management and physical structures aspects.
Furthermore, Vandersypen et al. (2009) studied the performance of the irrigation water
management at the tertiary level. They used field study method, random sampling,
semi-structured interviews (open questions) and farmer perceptions. Interview method
and techniques based on Flick: use a list of questions, checklist and viewpoints more
freely and precisely. Key question for central management based on their opinion on
organization, performance at tertiary area and major challenges for irrigation scheme
today. For the farmers the question revolves around irrigation problems, causes,
consequences and possible remedies. Data was collected by random sampling method
with 9 (nine) villages selected out of a total 56 areas. In each of the villages, 4 (four)
tertiary block were picked randomly. The total number of sample (n) = 36 tertiary block
(contain 299 plot). Methods used to validate and complete data were through informal
interview with 40 plot-holders from sub-sample and took place throughout 2004-2005.
The associations between variables were tested using Spearman correlations and one-
way ANOVA test using SPSS. The farmers were surveyed using question survey with
scale responses using Likert answer scale. Agricultural productivity in tons of rice
harvested per hectare was measured at the sample of tertiary block, from which a
weighted average per tertiary block was calculated. In the process harvesting, some of
the rice was lost during transportation and threshing. Field measurement and scoring
based on perception and condition.
Equally Clemmens and Molden (2007) studied the quality of service delivery related to
internal indicators and external indicators (water supply, yield, etc.) of project
36
performance. To increase the external performance (output), it is important to know
what changes in service or internal performance were required. They developed a
qualitative approach for estimating the impact of internal performance indicators on
water productivity. Data were collected to assess the performance of an irrigation
project in supplying water to agricultural water user. They used questionnaires to infer
internal process indicator, or indicator that suggest the quality of internal processes. The
internal performance indicators were used to assign statistical value and to determine
the impact on production, statistical relationships were used. The internal indicators
were divided into four sub-internal indicators dealing with flexibility, reliability, equity
and measurement/control of volume at level of service to individual fields, move
upstream to effective control and measurement, to sub-mains and main canals. Each
sub-indicator is given a score from zero (worst) to four (best) based on responses to
interview questions and somewhat subjective judgments. They found that yield losses
due to over irrigation of rice are not significant compared to over irrigation of other
non-paddy crops. The project found that the water distribution did not produce
maximum relative yield and had lower output. Substantial improvements are not
possible by making big improvements at only one level within the system. Physical or
management improvements have to be made to at all levels before substantial
improvements in performance can be seen. They concluded that a relative indicator of
adequacy was directly related to project output in $/ha or $/m3 of water. However, they
suggested that further research is needed to evaluate the appropriateness of this
approach.
Sudrajat (2000) studied about analysis of the cost of rice production with the activity
base costing (ABC) approach and the factors that affect rice production in Central Java,
Indonesia. This study used the ABC system to calculate the overhead of all activities
37
related to rice production costs, with the concept of production costs as revenue, then to
test the feasibility of rice production, of uses the approach of cost-volume-profit
analysis or also called break-even analysis. This analysis studied the factors that interact
in influencing the production. One of the significant aspects in this analysis was called
the analysis Break Even Point (BEP), where total revenues equal total costs. He found
that business of rice production profitable and feasible to be developed. Similarly,
Deptan (1999) stated that the analysis of rice production business can be calculated by
using the coefficient ratio of Revenues and Costs (C/R), and then analyzed by using the
Break Even Point (BEP). To see the potential of farming/growing rice especially in its
ability to provide incentives to farmers, is to use Return of Investment (ROI) analysis
approach. ROI is equal to income after-tax, before interest divided by the total
investment.
2.5 On-Farm Irrigation System
On-farm irrigation is often perceive as simple, i.e. the irrigation method and the need to
improve the respective irrigation efficiency, and the irrigation scheduling practices.
Very often it is claimed that a definitive improvement can only be achieved when
traditional methods be changed into sprinkler or micro-irrigation. However the reality is
more complex. Nearly 70 % of the irrigation systems in the world are in Asia. The long
term irrigation in Asia is a part of the people’s culture. The environment has been
modified and maintained by the man. A large part of the Asian landscapes are a
consequence of irrigated agriculture, namely the paddy rice basins (Pereira, 1997).
Pereira (1997) explained a farm is a complete system for producing food and fiber. This
includes many components which are managed as on unit by the farmer. The
38
characterization of this system is very different according to the discipline that
approaches the farm. However, all disciplines view the farm as the basic unit for food
and fiber production, for generating the farmer’s income from the labor and managerial
forces devoted to farming, and for contributing to the welfare of the society.
Suryavanshi et al. (2002) explained the modern irrigation management system aims at
high efficiency of water conveyance and appropriate methods of water application,
through participatory irrigation management at each stage of irrigation development.
The participatory irrigation management and efficient water delivery system to provide
timely as well as adequate water supply to each farm, shall be the main focus points in
the design and implementation of on-farm works. The efficient management of
irrigation water for maximizing productivity requires both, firstly the efficient on farm
water management and secondly the optimization of the use of water and land, through
appropriate methods of water application. The efficient on-farm water management is
related to water delivery system and allied works in the command area of outlet, which
distributes the water to each farm. The items of works pertaining to on farm water
management are termed as On-Farm Development (OFD) works.
However, the on-farm irrigation system is complex. It comprises of the supply to the
fields, the irrigation scheduling, the constraints imposed by the water supply system,
and the cropping system itself. Irrigation performances result from the combined effects
of all these factors. The physical performance is resulted from the combination of the
irrigation method (irrigation design) and the irrigation scheduling (irrigation
management). Dayton-Johnson (2003) found that good management on irrigation
system, either conducted by government or farmers, can influence the suitability of
canal operation, infrastructure maintenance and irrigation productivity.
39
Clemmens et al. (2000) reported that the performance of on-farm management can be
increased by means of appropriate application of technology, farmer education,
coordination between farm, district operation and government agency programs.
Moreover, they explained that improvement in farm water management must be
evaluated based on technical aspects and non-technical aspects (interdisciplinary studies
of farming practices) in which the strengths and weaknesses in irrigation systems and
their operation can be obtained.
Besides that, Burt (1995) explained that the improvement of performance can be
achieved by understanding the institutional constraints and hardware constraints as well
as improving services (flexibility, equity, reliability and timeless) at all layers within the
irrigation delivery system. Furthermore, Burt (2004) described that for on-farm
irrigation performances, it needs the service components, flexibility as pre-requisite for
on-farm investment and flexibility requirement of specific irrigation methods. The key
service components of water delivery are equity, reliability, and flexibility.
The flexibility subcomponents are frequency, flow rate, and duration. In general, equity
and reliability are pre-requisites for improved flexibility. Farmers must be confident that
water will be supplied when and how it is promised as a pre-condition for their
investing in improved on-farm irrigation technologies. In order to meet this promise,
a project must also have mechanisms to ensure equitable treatment among adjacent
farmers – to not do so can breed anarchy and subsequent theft of water and destruction
of structures. Although good equity and reliability of water delivery to the farms are
pre-requisites for farmers to invest in improved on-farm irrigation management and
hardware, these two service components are insufficient by themselves. Modern on-
farm irrigation management (that is, the use of irrigation scheduling that matches soil
40
and plant constraints) and modern irrigation systems also require that the water
deliveries have sufficient flexibility.
However, Burt (1995) stated that some of theoretical computer model on water delivery
system together with water balance concepts in the field have been developed to
maximize farmer initiative and crop yield. Generally, they have little or no practical use
in term of implementing a desirable schedule of water deliveries on the real time
service. He added that farmers initiative is very important to increase on-farm decision,
willingness to pay water fee and desire to maintain (or no destroy) project facilities.
To obtain success water delivery service, water scheduling must consider the degree of
flexibility (frequency, flow rate and duration) and reliability.
Burt (1996) stated that although the primary function of irrigation is to provide water
delivery service for agriculture use, there have been a few significant effort made to
measure the characteristic and success of this function, quality of irrigation service or
conveyance manageability while low efficiencies have been documented in various
projects. The management improvement can be achieve by understanding institutional
constraint and hardware constraint as well as improving service (flexibility, equity,
reliability and timeless) at all layers within the project delivery system. Furthermore,
he defined that of farm water management is the management of water by the farmer
within the field such as the design of the field irrigation system, selection of flow rate
and duration in various portions of the field. The level of service can be defined as
irrigation service that include factors such as specifications of water right of beneficiary,
the point of the delivery, flexibility in the rate of delivery, duration and frequency.
Conveyance manageability is defined as the ease in which water supply can be
manipulated to respond to changing upstream and downstream condition.

41
2.6 Irrigation Structure Performance
According to Malano and Van Hofwegen (1999), the primary concern of farmers on
irrigation supply is to produce maximum crop yield. This requires flexibility in water
supply in terms of frequency, rate and duration. Besides, the farmers needed the
reliability and predictability of the water supply. Therefore, they added that the
irrigation authority has the responsibility to provide adequate water delivery and water
distribution services to the various users. To achieve optimal productivity at scheme
level, they stated that the rules are required on how water is to be distributed, especially
in time of shortage. The organization in conjunction with users must formulate clear
rules for operations and water delivery and drainage that will be embodied in a set of
level of service specifications. They defined the concept of level of service as a set of
operational standards set by the irrigation and drainage organization in consultation with
irrigators and the governments and other affected parties to manage an irrigation and
drainage system. These specifications then become the norm against which the
operation performance of the organization can be evaluated. Moreover, Malano and Van
Hofwegen (1999) stated that the performance indicators, standards and target are
indentified to enable assessment of compliance and level of performance in the delivery
of service.
As reported by some researcher, maintenance of the canal system is directly related to
the water delivery service performance to the farmer and resources expended. There
were three possible type of performance reduction caused by physical structural
deterioration. First, poor structural maintenance standard of canal and control structure
has a negative impact on their life and the ability to perform their intended function
(Malano et al., 1999). Secondly, for canal networks that faced high deposition rates,
42
their water supply across the networks become inequitable and unreliable
(Merret, 2002). Lastly, adequacy would deteriorate as the irrigation networks degraded
gradually (Vandersypen et. al., 2006).
According to Brewer and Sakthivadivel (1999), most of canal deterioration in
government management managed irrigation system, especially in developing countries,
is caused by lack of sufficient resources of maintenance. However, this limitation can be
overcome by properly conducted cost-effective analysis on the irrigation maintenance
(Bos et al., 2005). The importance of maintenance and operational monitoring aspect to
the water supply can be found in Dayton-Johnson, 2003. He explained that the
performance of good infrastructure maintenance and frequent water supply monitoring
will affect indirectly the effectiveness of the irrigation supply.
Burton et al. (2003) defined the performance of physical structures as the degree to
which the assets (i.e canal and water control structures) are able to perform the task for
which it was designed. Clemmens and Molden (2007) stated that performance of
irrigation system can be evaluated based on two major approaches: (1) how well service
is delivered, and (2) the outcomes of irrigation in term of efficiency and productivity of
resource use. Bosch et al. (1993) stated that the hydraulic structures in irrigation system
function as a control in which the water can reach the field at the proper time and the
quantities needed. Control is good when gate intake structures are available.
To ensure equitable and efficient distribution, measurement is required at the flow
regulating point. However, Djibril and Diemer (2004) said that the infrastructure facility
is not only the single variable that affect on the water delivery service. This is because
the irrigation is not only about canals, people or crops. It is an interactive process
43
among hydraulic, institution and biological mechanism, and the resultant whole cannot
be explained by any single discipline. For this reason, Bos et al. (2005) stated that the
optimal irrigation performance cannot be achieved through technical aspects only such
as measurement of frequency, rate and duration of water supply. The institution aspects
of service delivery such as the legal framework, management decision making or social
attitudes, can fundamentally undermine the proper functioning of service provision form
an often unseen but crucial part in their relationships.
2.7 Rapid Appraisal Process Method
The Rapid Appraisal Procedure (RAP) was originally developed by the Irrigation
Training and Research Centre (ITRC) of California Polytechnic University in 1996-97
as a diagnostic and evaluation tool for a research program financed by the World Bank
on the evaluation of impact on performance of irrigation systems of the introduction of
modern control and management practices in irrigation. The conceptual framework of
the RAP for analysis of irrigation systems performance is the following: irrigation
systems operate under a set of physical and institutional constraints and with a certain
resource base. The systems are analyzed as a series of management levels, each level
providing water delivery service through the system’s internal management and control
processes to the next lower level, from the bulk water supply to the main canals down to
the individual farm or field. The service quality delivered at the interface between the
management levels can be appraised in terms of its components (equity, flexibility,
reliability) and accuracy of control and measurement, and depends on a number of
factors related to hardware design and management. With the service quality delivered
to the farm and under economic, agronomic constraints, system and farmers’
management produces results (crops yields, irrigation intensity, water use efficiency),
44
while symptoms of poor system performance and institutional constraints are
manifested as social chaos (water thefts, vandalism), poor condition of infrastructure,
poor cost recovery and weak water users associations (Fecon, 2007).
The RAP allows qualified personnel systematic and quickly to determine key indicators
of irrigation projects. Key performance indicators from RAP help to organize
perceptions and facts, thereby facilitating informed decisions regarding the potential
for water conservation within a project, specific weakness in project operation,
management, resources and hard ware and specific modernization actions that can be
taken to improve project performance. RAP has designed internal indicators under the
assumption that all employees of an irrigation project only have their jobs for one
reason-to provide service to customers. The services described in RAP are related to
three indices: (1) flexibility, composed of frequency, flow rate, duration, (2) reliability
and (3) equity. The external indicators are expressions of various forms of efficiency,
whether the efficiency are related to crop yields. Confidence intervals should be
assigned reflecting the reality that there are always uncertainties in our data and
computation techniques. In irrigation matters, one is typically concerned about 5-10%
accuracy, not 0.5 -1% accuracy ranges (Burt and Fecon, 2001).
For very simple field irrigation technique, reliability and equity are crucial. Without
good reliability and equity, there are generally social problems such as vandalism and
non-payment of water fees. Reliability and equity, then, are the cornerstones of projects
that have good social order. Some minimum level of flexibility is required. Even with
the most simple irrigation method such as paddy rice, the flow rate are completely
different at the beginning of the season (for land preparation), compared to when the
rice crop is established. And not everyone plants at the same time, meaning that the
45
irrigation project must have some flexibility built into it. To obtain high project
efficiency, the canal system must have sufficient flexibility built into it to be able to
change flows frequently in response to continually changing demands and weather.
The worksheet also introduces the concept of assigning a rating of 0 - 4 to project
characteristics, each of sub components indicators contained a number of criteria or
statement description and related score value. The score judged have a potential
maximum value of 4 (best of the most desirable condition) and a minimum possible
value of 0.0 (worst or indicating least desirable). The rating score value was classified
as worst (0.0), worse (0.5), very poor (1.0), poor (1.5), enough (2.0), quite enough
(2.5), good (3.0), very good (3.5) and excellent/best (4.0) were proposed by Burt and
Fecon (2001).
Styles and Marino (2002) evaluated water delivery performance of 16 irrigation systems
worldwide in developing country, which were selected on the basis that they had some
element of modernization either in institutional development or physical infrastructure
based on the FAO Water Report 19 data. The external indicator were derived from data
available from project files and checked for their consistency. Internal indicator were
obtained through a Rapid Appraisal Procedure (RAP) to quantify how the systems were
operated and maintained in the field through a systematic use of a rating scale for the
purpose of consistency. Factors affecting output (results) and symptoms from irrigation
projects proposed by FAO Water Report 19. A new framework for assessing the internal
process of irrigation projects were used by incorporate two major features: a Rapid
Appraisal Process (RAP) and a comprehensive set of internal indicators, which when
examined as a whole, indicate how and where irrigation investments should be targeted.
There were many factors evaluated to determine the correlation between the economic
46
indicator and the system including: (1) irrigation system performance (flexibility,
hydrology estimates, engineering, water control, drainage, quality of construction) and
(2) institutional performance (type of control, scheduling, maintenance, cost recovery,
Water User Associations, support services). Field data for project visit were obtained
through travelling down the canal system and interview with operators and supervisors
at each level of canal and meeting with WUAs to ask questions about the quality of
water delivery service to the fields. In this study, the production, water supply, and
financial indicators are considered as the external indicators. Production is defined as
the output of the irrigated area in term of the gross or net value of production measured
at local or world prices. They found that hardware modernization can drastically
improve the ease of the system operation and the degree of water delivery service
provided, which influences whether a strong water user association can exist. There is
excellent and realistic potential for improvement of water management and crop yield.
Okada et al. (2008) quantified effects of management and infrastructure improvements
on irrigation project performance. The most important indicators of irrigation project
performance are generally crop yield (ton/ha) and project irrigation efficiency (%). The
main groups interested in an irrigation project are its beneficiary farmers that interested
in attaining higher yield and associated water agencies that focused on both efficiency
and yields. The impacts of internal evaluation factors (Efs) on irrigation project
performance can be evaluated using the correlation between potential production
improvement indicators (PPII). The RAP tool can be used to diagnose internal process
irrigation projects for modernization using both qualitative and quantitative indicators.
RAP is a combination of a comprehensive questionnaire survey and field inspection to
determinate what is happening in the irrigation project both. A questionnaire was
developed to ask irrigation system experts to perform pair wise comparisons of Efs.
Overall score of the 16 irrigation projects were computed using global weights obtained
47
through local weights that individual experts determined with the questionnaire. It was
assumed that the RAP internal process indicators were too specific for irrigation system
experts who are not familiar with them to perform pair wise comparison. Two
expertise’s with occupation of consultant in irrigation and water management and one as
professor in agriculture engineering and water management were used as respondent
with their degree qualification as doctorate and have more than 20 years experience.
2.8 Irrigation Management Performance in Indonesia
Indonesia is well known as an agricultural country with dry land and wetland. Major
food crops consist of paddy, corn, cassava, sweet potato, peanut and soybean. Except
the main crop paddy, the other major food crops are known as palawija (secondary
crops: soybean, corn, cassava, sweet potato and mungbean). Subject to the availability
of water for irrigation, paddy is cultivated in both wet and dry lands. Irrigated land is
divided into four types based on its system: technical (permanent head works with
sophisticated design and line construction with control structure), semi technical (less
sophisticated design with structured networks), simple (technically simple construction
with control water gates and unlined canal) and village (similar to simple irrigation
without government interventions in management) (Pasaribu and Routray, 2005).
Pasaribu and Routray (2005) said the shortage of this crop will cause serious problems
leading to political instability and social unrest. As a political commodity, a number of
attempts have been made to improve rice production performance through the
introduction of new high yielding varieties, a balanced application of chemical fertilizer
and provision of credit. Domestic rice production was not adequate to feed the
population even with a decreasing population growth rate to 1.49% per year between
48
1990 and 2000 (BPS-Statistics Indonesia, 2011). The national stock should be filled by
importing activity to make the crop available and accessible throughout the year,
although the import of rice is gradually decreasing due to an increase in domestic
production.
A huge amount is spent on the purchase of rice and the dependency on import duty has
been considered as the main reason to promote domestic rice production. The
government commitment to increase rice production is shown through the introduction
of irrigation management in a new irrigation management system (Pasaribu and
Routray, 2005). The management of irrigation in Indonesia system is far from
satisfactory. One of the inadequacies is poor on-farm management.
In order to improve the performance of on-farm management in Indonesia, it’s requires
assessments of water service management, infrastructure, crop yield and production
cost. As a result, the quality of water delivery service is determined by several elements
such as adequacy (a measure of water supply ability to meet the water demand for
optimal plant growth), reliability (a measure of the confidence in the irrigation system to
delivery water as specified by the level of service), equity (a measure of the access to a
fair share of the water resource according to the amount specified by the water right)
and flexibility (a measure of ability of users to choose the frequency, rate and duration
with which irrigation water is supplied) (Malano et al., 1999).

49
2.9 Summary
This chapter described the irrigation water management and the success of irrigation
water management depending on the appropriateness of planning, operation and
evaluation process. The irrigation management at tertiary level can be improved towards
the better use of available water through the existing irrigation networks using the
technical (e.g., infrastructures) or/and non-technical aspect (e.g., establishment of water
user association organization). Farmer participation in irrigation systems could make
important contributions to management. Farmer participation in planning and
management is a key element of most future-oriented strategies for irrigation
management improvement.
Some researchers proposed indicators such as adequacy, reliability, equity, flexibility
(frequency, rate and duration) and measurement of volumes can be used to assess water
delivery service at each level of irrigation network. The adequate, reliable and equitable
delivery of water in irrigation canals play an important role in the achievement of the
fundamental objective of any irrigation system to control water in such a way that it
increases agricultural production.
RAP is a tool used for the analysis of the performance of irrigation system. The systems
are analyzed as a series of management levels, each level providing water delivery
service through the system’s internal management and control processes to the
individual farm or field. Internal indicators were obtained through a Rapid Appraisal
Procedure (RAP). The RAP tool can be used to diagnose internal process irrigation
projects for modernization using both qualitative and quantitative indicators. RAP was
formed through the combination of a comprehensive questionnaire survey and field
50
inspection to determinate what is happening in the irrigation project. The external
indicator were derived from data available from project files and checked for their
consistency. Productivity indicators can be measured by total net benefit, total area
irrigated and total crop production for single crop case, or net benefits per unit area
irrigated, crop production per unit of area irrigated for a single crop, crop production per
unit of water used for a single crop. The internal indicators were calculated from spatial
and temporal distribution. The selected research areas are situated in three locations at
the head, middle and tail of the irrigation system of the tertiary areas. Data is collected
by random sampling and by using field survey, questionnaire and interview with the
respondents.
51
CHAPTER III
RESEARCH METHODOLOGY
3.1 Introduction
This study is about performance of Pante Lhong technical irrigation system based on
tertiary and final delivery using the application of Rapid Appraisal Process (RAP)
indicator method and actual crop yield with cost production to analysis and determining
feasibility of the farming. Irrigation performance assessment can be evaluated by using
identified key performance indicators consisting of both internal and external indicators.
The internal indicator for this research focuses on the water delivery service
performance indicator and infrastructure maintenance performance indicator. The water
delivery service sub components are flexibility, reliability, equity and control of flow to
costumers. The identifying of the infrastructure maintenance performance conditions in
the tertiary area of irrigation system in the Pante Lhong technical irrigation system was
carried out through field observations and used sub component indicator. The sub
component indicator of infrastructure maintenance were floor and canal bank, seepage,
level of gate maintenance and availablility proper equipment. Likewise, for the external
indicator in this research, there are two parameters analysis, i.e. the crop yield and
production cost. In this method, the performance is evaluated using primary indicators
that cover many aspects of evaluation. Figure 3.1 shows the schematic diagram of the
irrigation performance indicators assessment for this research.
The characteristics of the Pante Lhong technical irrigation system has been chosen
particularly for case study the canals and infrastructure for the irrigation system. This
52
chapter explains the history of the Pante Lhong technical irrigation system and the
project employee’s authority in sub district office.
3.2 Determination of Internal Indicator Performance
Rapid Appraisal Process (RAP) is a visual assessment tool that can provide a systematic
evaluation of the irrigation system and internally water distribution process at the
various levels. The internal indicators were selected from the RAP method that was
considered relevant to the current assessment of irrigation management practice
performance in the canal levels. In this method, the performance made use of the
primary indicators that covered many aspects of the evaluation. The data of
infrastructure maintenance performance was collected at third canal/tertiary canal and
the data of water delivery service was collected at the third canal and final deliveries.
The water delivery service aspects were flexibility, reliability, equity and measurement
of volume deliveries using the RAP method. According to the RAP method, the sub
component indicator of infrastructure maintenance performance were floor and canal
bank, seepage, level of gate maintenance and available proper equipment and staff.
In general, these aspects consist of water structure condition, maintenance and water
delivery service. Each of the main indicators has sub indicators which contain a number
of criteria or statement description and related score value. These score have potential
maximum values of 4.0 (best or the most desirable condition) and a minimum possible
value of 0.0 (worst or indicating least desirable) was given based on the visual
condition/observation and direct communication with the respondents by the surveyor.
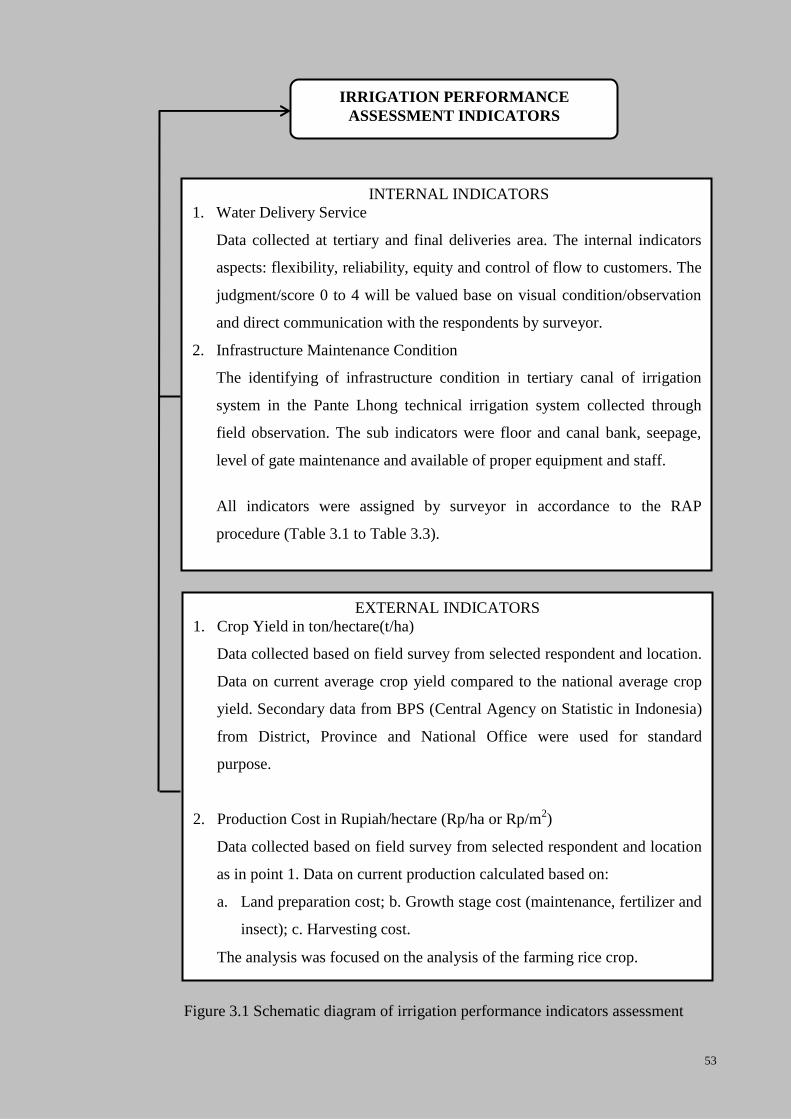
53
a
Figure 3.1 Schematic diagram of irrigation performance indicators assessment
IRRIGATION PERFORMANCE
ASSESSMENT INDICATORS
INTERNAL INDICATORS
1. Water Delivery Service
Data collected at tertiary and final deliveries area. The internal indicators
aspects: flexibility, reliability, equity and control of flow to customers. The
judgment/score 0 to 4 will be valued base on visual condition/observation
and direct communication with the respondents by surveyor.
2. Infrastructure Maintenance Condition
The identifying of infrastructure condition in tertiary canal of irrigation
system in the Pante Lhong technical irrigation system collected through
field observation. The sub indicators were floor and canal bank, seepage,
level of gate maintenance and available of proper equipment and staff.
All indicators were assigned by surveyor in accordance to the RAP
procedure (Table 3.1 to Table 3.3).
EXTERNAL INDICATORS
1. Crop Yield in ton/hectare(t/ha)
Data collected based on field survey from selected respondent and location.
Data on current average crop yield compared to the national average crop
yield. Secondary data from BPS (Central Agency on Statistic in Indonesia)
from District, Province and National Office were used for standard
purpose.
2. Production Cost in Rupiah/hectare (Rp/ha or Rp/m2)
Data collected based on field survey from selected respondent and location
as in point 1. Data on current production calculated based on:
a. Land preparation cost; b. Growth stage cost (maintenance, fertilizer and
insect); c. Harvesting cost.
The analysis was focused on the analysis of the farming rice crop.
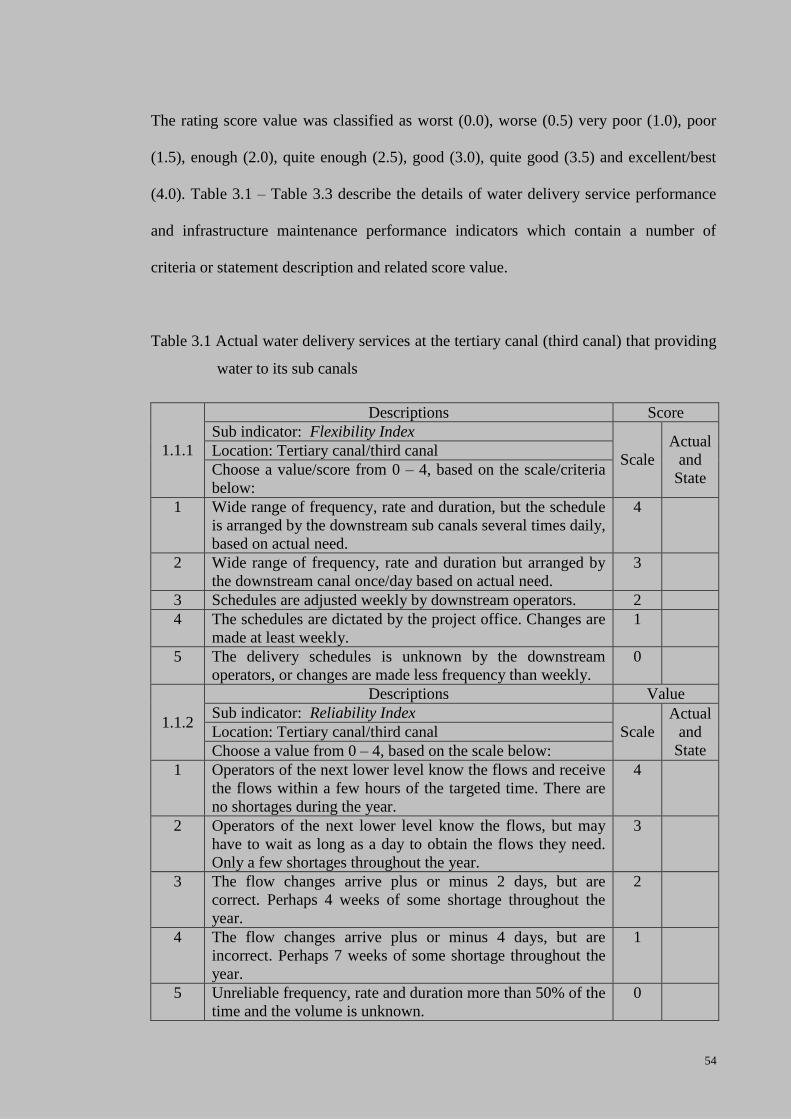
54
The rating score value was classified as worst (0.0), worse (0.5) very poor (1.0), poor
(1.5), enough (2.0), quite enough (2.5), good (3.0), quite good (3.5) and excellent/best
(4.0). Table 3.1 – Table 3.3 describe the details of water delivery service performance
and infrastructure maintenance performance indicators which contain a number of
criteria or statement description and related score value.
Table 3.1 Actual water delivery services at the tertiary canal (third canal) that providing
water to its sub canals
1.1.1
Descriptions Score
Sub indicator: Flexibility Index
Scale
Actual
and
State
Location: Tertiary canal/third canal
Choose a value/score from 0 – 4, based on the scale/criteria
below:
1 Wide range of frequency, rate and duration, but the schedule
is arranged by the downstream sub canals several times daily,
based on actual need.
4
2 Wide range of frequency, rate and duration but arranged by
the downstream canal once/day based on actual need.
3
3 Schedules are adjusted weekly by downstream operators. 2
4 The schedules are dictated by the project office. Changes are
made at least weekly.
1
5 The delivery schedules is unknown by the downstream
operators, or changes are made less frequency than weekly.
0
1.1.2
Descriptions Value
Sub indicator: Reliability Index
Scale
Actual
and
State
Location: Tertiary canal/third canal
Choose a value from 0 – 4, based on the scale below:
1 Operators of the next lower level know the flows and receive
the flows within a few hours of the targeted time. There are
no shortages during the year.
4
2 Operators of the next lower level know the flows, but may
have to wait as long as a day to obtain the flows they need.
Only a few shortages throughout the year.
3
3 The flow changes arrive plus or minus 2 days, but are
correct. Perhaps 4 weeks of some shortage throughout the
year.
2
4 The flow changes arrive plus or minus 4 days, but are
incorrect. Perhaps 7 weeks of some shortage throughout the
year.
1
5 Unreliable frequency, rate and duration more than 50% of the
time and the volume is unknown.
0

55
Table 3.1 Continued
1.1.3
Descriptions Value
Sub indicator: Equity Index
Scale
Actual
and
State
Location: Tertiary canal/third canal
Choose a value from 0 – 4, based on the scale below:
1 Points along the canal enjoy the same level of good service. 4
2 5% of the canal turnouts receive significantly poorer service
than the average.
3
3 15% of the canal turnouts receive significantly poorer service
than the average.
2
4 25% of the canal turnouts receive significantly poorer service
than the average.
1
5 Worse than 25% or there may not even be any consistent
pattern.
0
1.1.4
Descriptions Value
Sub indicator: Control of flows to customers of the next level
Scale
Actual
and
State
Location: Tertiary canal/third canal
Choose a value from 0 – 4, based on the scale below:
1 Flows are known and are controlled within 5%. 4
2 Flows are known and are controlled within 10% 3
3 Flows are not known but are controlled within 10% 2
4 Flows are controlled within 20% 1
5 Flows are controlled within 25% 0
Source: (Burt, 2003)
Note: maximum score is 4 and minimum score is 0.
Table 3.2 Actual water delivery service received by individual units (final delivery)
1.2.1
Descriptions Value
Sub indicator: Flexibility Index
Scale
Actual
and
State
Location: Final delivery
Choose a value/score from 0 – 4, based on the scale/criteria
below:
1 Unlimited frequency, rate and duration, but arranged by
users within a few days.
4
2 Fixed frequency, rate or duration, but arranged. 3
3 Dictated rotation, but it approximately matches the crop
needs.
2
4 Rotation deliveries, but on a somewhat uncertain schedule. 1
5 No establish rules. 0
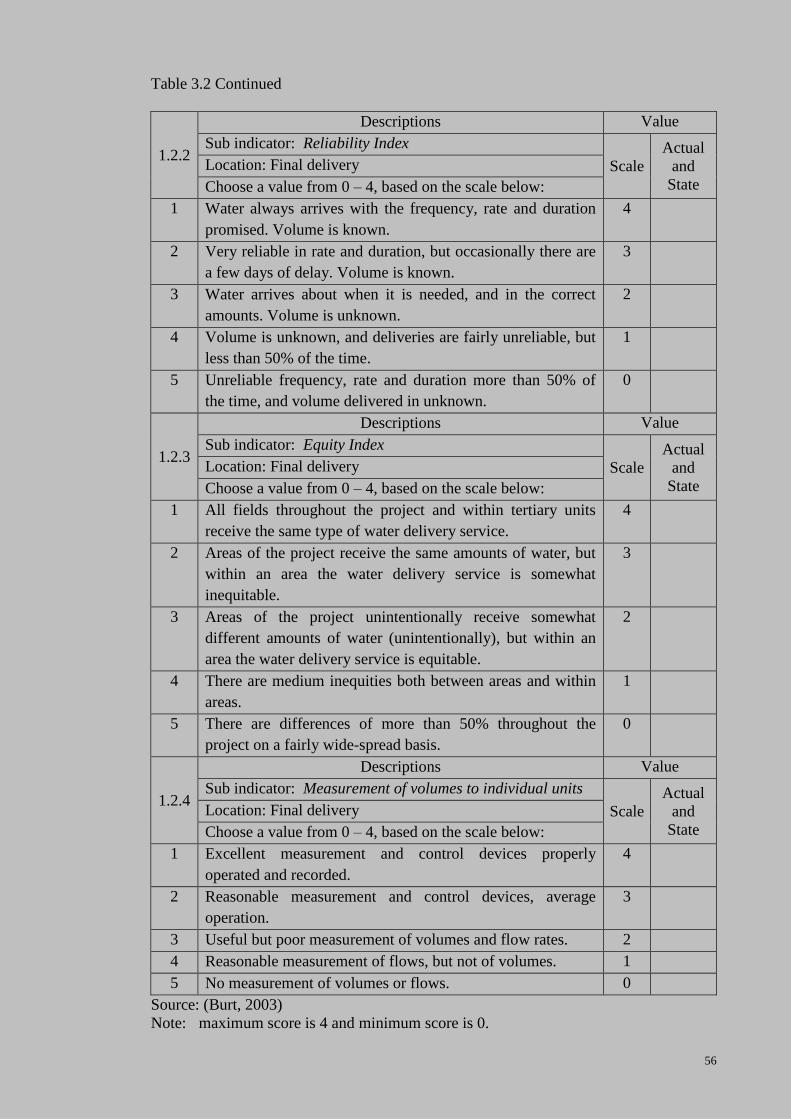
56
Table 3.2 Continued
1.2.2
Descriptions Value
Sub indicator: Reliability Index
Scale
Actual
and
State
Location: Final delivery
Choose a value from 0 – 4, based on the scale below:
1 Water always arrives with the frequency, rate and duration
promised. Volume is known.
4
2 Very reliable in rate and duration, but occasionally there are
a few days of delay. Volume is known.
3
3 Water arrives about when it is needed, and in the correct
amounts. Volume is unknown.
2
4 Volume is unknown, and deliveries are fairly unreliable, but
less than 50% of the time.
1
5 Unreliable frequency, rate and duration more than 50% of
the time, and volume delivered in unknown.
0
1.2.3
Descriptions Value
Sub indicator: Equity Index
Scale
Actual
and
State
Location: Final delivery
Choose a value from 0 – 4, based on the scale below:
1 All fields throughout the project and within tertiary units
receive the same type of water delivery service.
4
2 Areas of the project receive the same amounts of water, but
within an area the water delivery service is somewhat
inequitable.
3
3 Areas of the project unintentionally receive somewhat
different amounts of water (unintentionally), but within an
area the water delivery service is equitable.
2
4 There are medium inequities both between areas and within
areas.
1
5 There are differences of more than 50% throughout the
project on a fairly wide-spread basis.
0
1.2.4
Descriptions Value
Sub indicator: Measurement of volumes to individual units
Scale
Actual
and
State
Location: Final delivery
Choose a value from 0 – 4, based on the scale below:
1 Excellent measurement and control devices properly
operated and recorded.
4
2 Reasonable measurement and control devices, average
operation.
3
3 Useful but poor measurement of volumes and flow rates. 2
4 Reasonable measurement of flows, but not of volumes. 1
5 No measurement of volumes or flows. 0
Source: (Burt, 2003)
Note: maximum score is 4 and minimum score is 0.
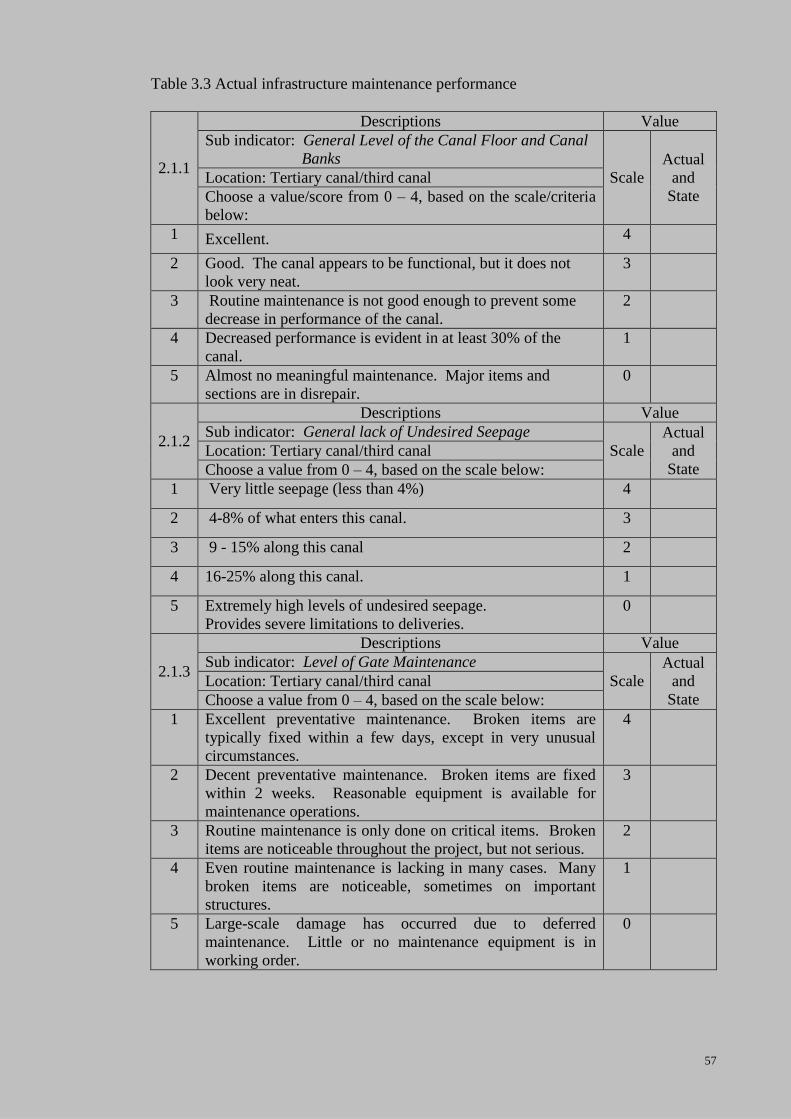
57
Table 3.3 Actual infrastructure maintenance performance
2.1.1
Descriptions Value
Sub indicator: General Level of the Canal Floor and Canal
Banks
Scale
Actual
and
State
Location: Tertiary canal/third canal
Choose a value/score from 0 – 4, based on the scale/criteria
below:
1 Excellent. 4
2 Good. The canal appears to be functional, but it does not
look very neat.
3
3 Routine maintenance is not good enough to prevent some
decrease in performance of the canal.
2
4 Decreased performance is evident in at least 30% of the
canal.
1
5 Almost no meaningful maintenance. Major items and
sections are in disrepair.
0
2.1.2
Descriptions Value
Sub indicator: General lack of Undesired Seepage
Scale
Actual
and
State
Location: Tertiary canal/third canal
Choose a value from 0 – 4, based on the scale below:
1 Very little seepage (less than 4%) 4
2 4-8% of what enters this canal. 3
3 9 - 15% along this canal 2
4 16-25% along this canal. 1
5 Extremely high levels of undesired seepage.
Provides severe limitations to deliveries.
0
2.1.3
Descriptions Value
Sub indicator: Level of Gate Maintenance
Scale
Actual
and
State
Location: Tertiary canal/third canal
Choose a value from 0 – 4, based on the scale below:
1 Excellent preventative maintenance. Broken items are
typically fixed within a few days, except in very unusual
circumstances.
4
2 Decent preventative maintenance. Broken items are fixed
within 2 weeks. Reasonable equipment is available for
maintenance operations.
3
3 Routine maintenance is only done on critical items. Broken
items are noticeable throughout the project, but not serious.
2
4 Even routine maintenance is lacking in many cases. Many
broken items are noticeable, sometimes on important
structures.
1
5 Large-scale damage has occurred due to deferred
maintenance. Little or no maintenance equipment is in
working order.
0
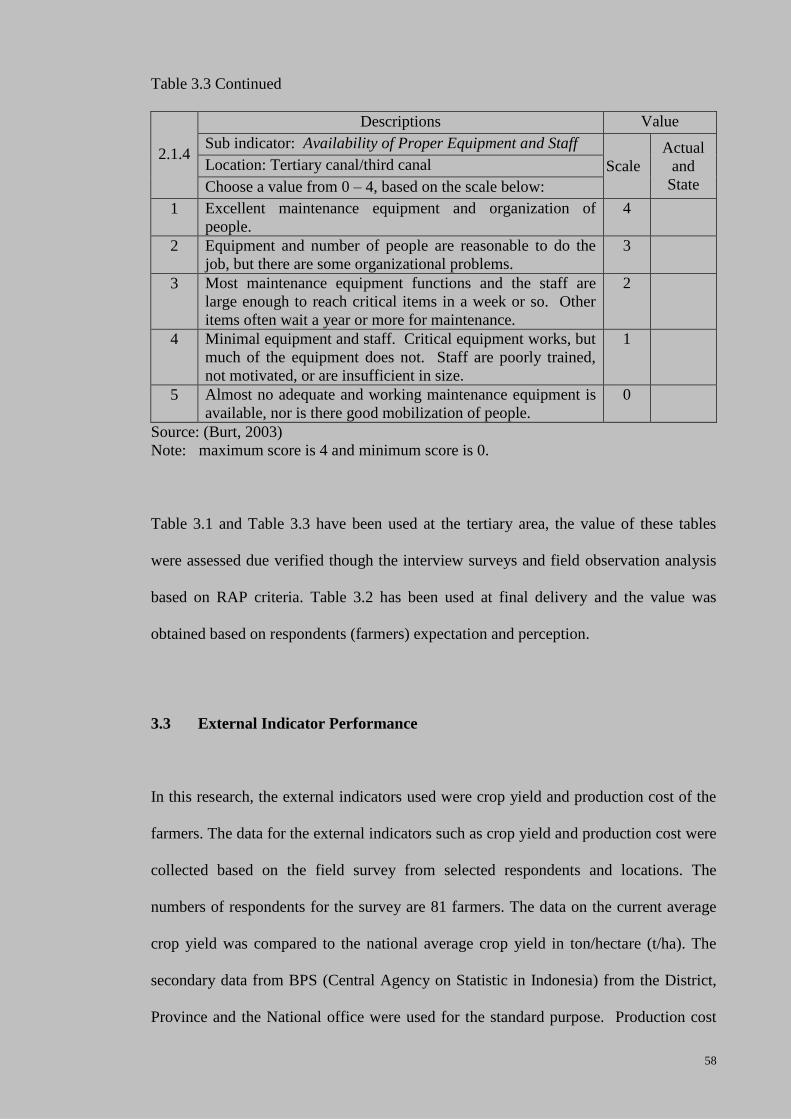
58
Table 3.3 Continued
2.1.4
Descriptions Value
Sub indicator: Availability of Proper Equipment and Staff
Scale
Actual
and
State
Location: Tertiary canal/third canal
Choose a value from 0 – 4, based on the scale below:
1 Excellent maintenance equipment and organization of
people.
4
2 Equipment and number of people are reasonable to do the
job, but there are some organizational problems.
3
3 Most maintenance equipment functions and the staff are
large enough to reach critical items in a week or so. Other
items often wait a year or more for maintenance.
2
4 Minimal equipment and staff. Critical equipment works, but
much of the equipment does not. Staff are poorly trained,
not motivated, or are insufficient in size.
1
5 Almost no adequate and working maintenance equipment is
available, nor is there good mobilization of people.
0
Source: (Burt, 2003)
Note: maximum score is 4 and minimum score is 0.
Table 3.1 and Table 3.3 have been used at the tertiary area, the value of these tables
were assessed due verified though the interview surveys and field observation analysis
based on RAP criteria. Table 3.2 has been used at final delivery and the value was
obtained based on respondents (farmers) expectation and perception.
3.3 External Indicator Performance
In this research, the external indicators used were crop yield and production cost of the
farmers. The data for the external indicators such as crop yield and production cost were
collected based on the field survey from selected respondents and locations. The
numbers of respondents for the survey are 81 farmers. The data on the current average
crop yield was compared to the national average crop yield in ton/hectare (t/ha). The
secondary data from BPS (Central Agency on Statistic in Indonesia) from the District,
Province and the National office were used for the standard purpose. Production cost
59
was calculated in Rupiah/hectare or Rupiah/m2
(Rp/ha or Rp/m2). The data on current
production calculated were based on the land preparation cost, growth stage cost and the
harvesting cost. The land preparation costs consist of the purchase cost of seed, seed
nursery fees, ground processing costs (cleaning, plowing and piracy), the cost of tractors
and the cost for the implementation of planting seeds. The growth stage of the cost
includes the cost of handling and maintenance of plants, fertilizer costs and the cost of
spraying insecticide. Cost of cutting when harvesting rice, threshing rice, the cost of
transporting crops and water fees to water usher association (WUA) were included in
the harvesting cost. The cost production was used on the analysis of the rice crop
farming.
3.4 Data Collection Procedure
In this research, data were collected based on the qualitative and quantitative methods.
The primary data were obtained based on the field surveys or observations done on the
irrigation system. Data were collected through detail interview as well as discussions
with farmers and/or heads of water user association (WUAs). The interviews were
aimed at obtaining the details on the internal processes as well as identifying the
problems related to the technical and non technical aspects. The secondary data were
obtained from the district irrigation office and other sources.
Primary data were observed from the main intake point, main diversion structure and
the 65 off-takes structures scattered along the 77.2 km concrete lining canals. Interviews
were carried out with 25 field irrigation staffs, 81 farmers and a number of WUAs. Due
to most of the primary data not being available both at the sub irrigation offices and
60
district irrigation office, the related data were prepared based on the field observations
and interviews with both irrigation staff, farmers and WUAs.
Field data were interpreted in accordance to the RAP judgment criteria for the
indicators. In this research, data of water delivery service performance and
infrastructure maintenance performance were obtained based on tertiary canal/third
canal and final delivery. The data for the crop yield and production cost were collected
based on the field survey, questionnaire and interviews with 81 farmers. The farmers
were selected from the three regions based on the irrigation structure in the Pante Lhong
technical irrigation system. Block BPg.1 with plot Pg.1.Kn represent to upstream area,
block BJb.2 with plot Jb.1.Kr represent to middle stream area and block BT.7 with plot
T.7.Kr represent to downstream area in the irrigation system. Farmers as
respondents/samples were identified based on the outlet location for each region and 27
farmers were selected as samples at each location (nine farmers at every location with
their plot (paddy field) position are at upstream, middle stream and downstream of the
canal. The farmers were selected randomly in each area and location. The irrigation
conditions in all areas of the research were continuously carried out. Statistical formula
ratio was used to analysis the data for the external indicators for characteristic of the
sample. Break Even Point (BEP) and ratio of Revenue Cost (R/C) were used analysis
was focused on the analysis profitable and feasible of the farming rice crop for farmer.
3.5 The Characteristics of Pante Lhong Technical Irrigation System
The Pante Lhong technical irrigation system is located in the Bireuen City, Bireuen
Regency in the Aceh Province of Indonesia and situated at 5o12’18” North - 96
o42’06”
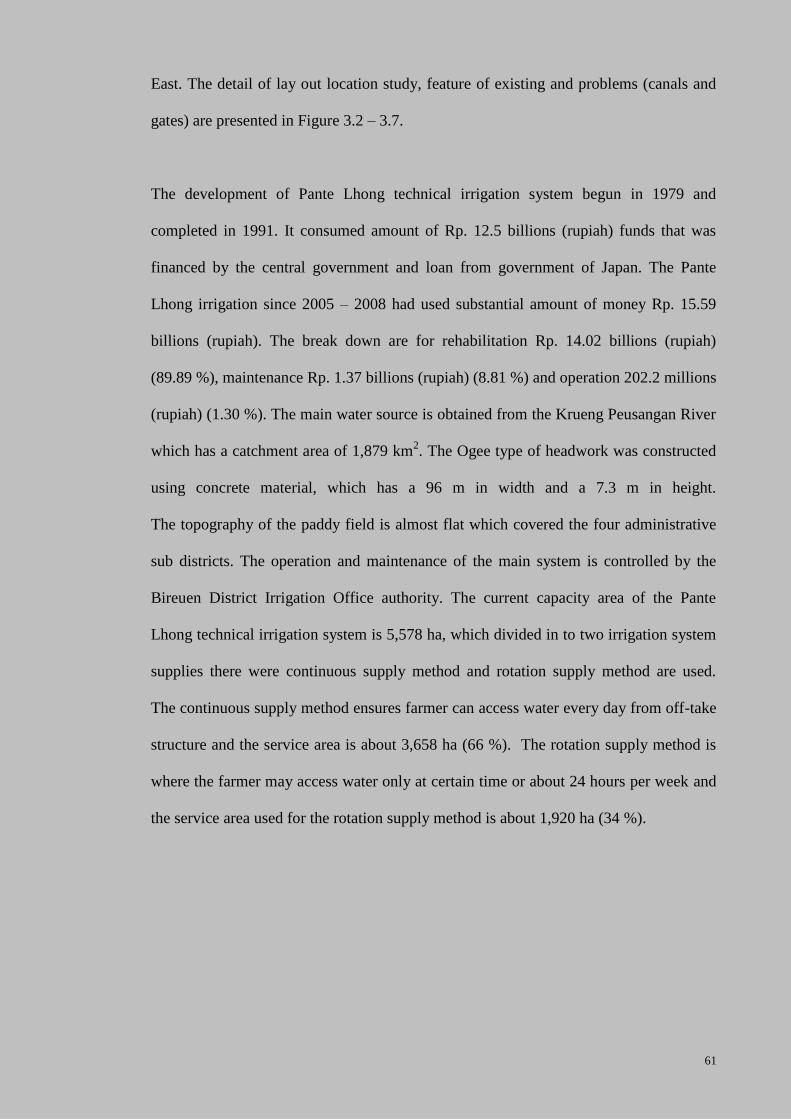
61
East. The detail of lay out location study, feature of existing and problems (canals and
gates) are presented in Figure 3.2 – 3.7.
The development of Pante Lhong technical irrigation system begun in 1979 and
completed in 1991. It consumed amount of Rp. 12.5 billions (rupiah) funds that was
financed by the central government and loan from government of Japan. The Pante
Lhong irrigation since 2005 – 2008 had used substantial amount of money Rp. 15.59
billions (rupiah). The break down are for rehabilitation Rp. 14.02 billions (rupiah)
(89.89 %), maintenance Rp. 1.37 billions (rupiah) (8.81 %) and operation 202.2 millions
(rupiah) (1.30 %). The main water source is obtained from the Krueng Peusangan River
which has a catchment area of 1,879 km2. The Ogee type of headwork was constructed
using concrete material, which has a 96 m in width and a 7.3 m in height.
The topography of the paddy field is almost flat which covered the four administrative
sub districts. The operation and maintenance of the main system is controlled by the
Bireuen District Irrigation Office authority. The current capacity area of the Pante
Lhong technical irrigation system is 5,578 ha, which divided in to two irrigation system
supplies there were continuous supply method and rotation supply method are used.
The continuous supply method ensures farmer can access water every day from off-take
structure and the service area is about 3,658 ha (66 %). The rotation supply method is
where the farmer may access water only at certain time or about 24 hours per week and
the service area used for the rotation supply method is about 1,920 ha (34 %).
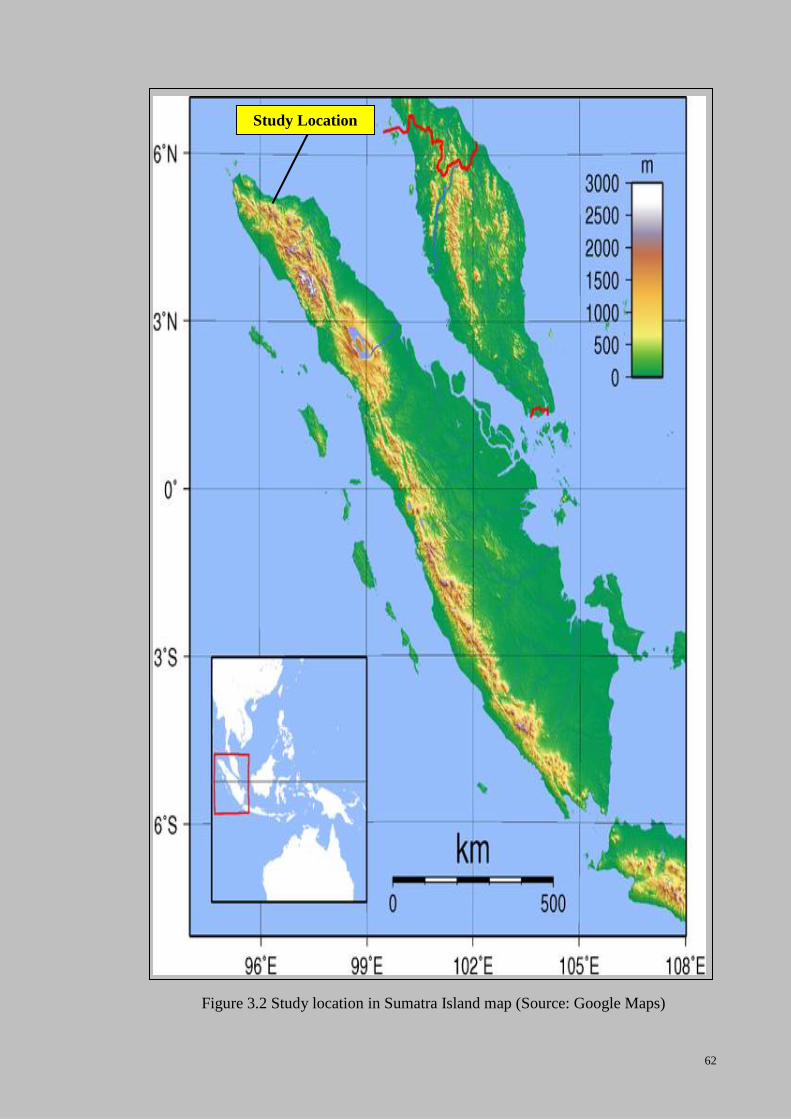
62
Figure 3.2 Study location in Sumatra Island map (Source: Google Maps)
Study Location
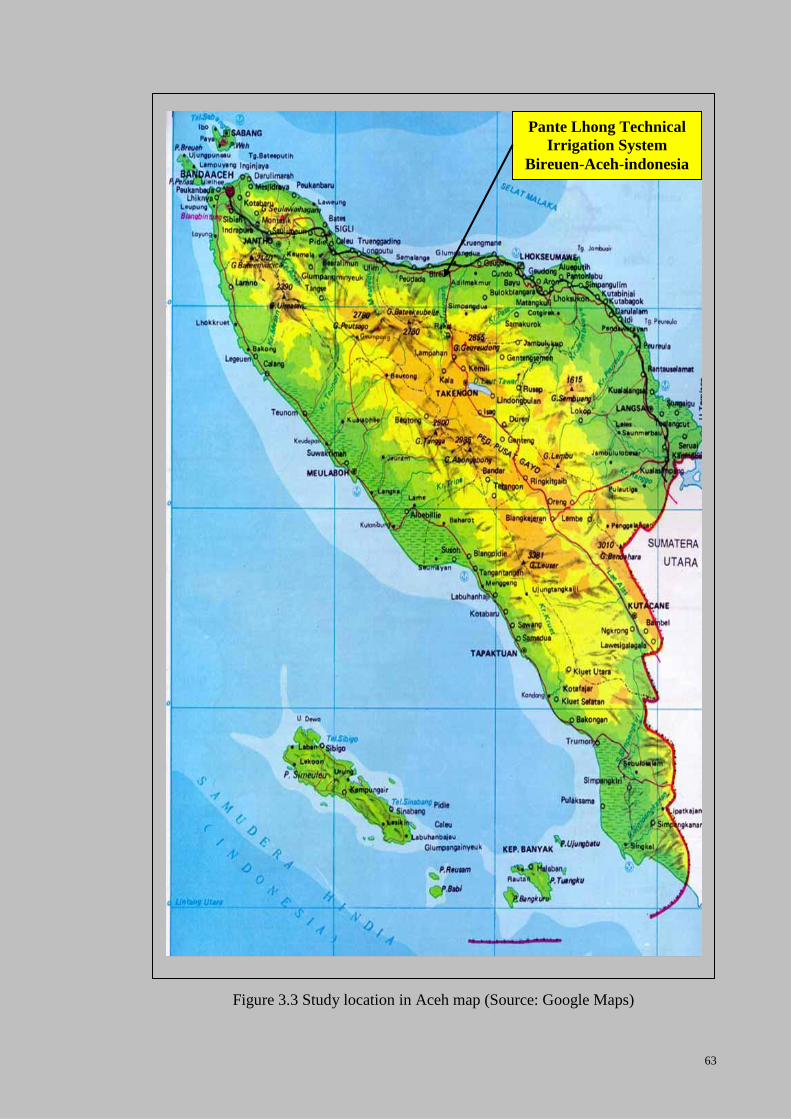
63
Figure 3.3 Study location in Aceh map (Source: Google Maps)
Pante Lhong Technical
Irrigation System
Bireuen-Aceh-indonesia
64
Pd.8.kn
40,80 21,47
62,00 32,63
Pd.7.Kr
42,30 22,26
Pd.6.Kn
15,70 8,26
Pd.6.Kn
8,2615,70
Pd.5.Kn
36,0468,48
A = 102,80 HaQ = 54,68 Lt/dt
L = 1.000,00 M'
A = 145,80 HaQ = 77,18 Lt/dt
L = 1.835,00 M'
A = 213,50 HaQ = 113,58 Lt/dt
L = 1.107,00 M'
BPd.8Pd.8.Kn BPd.7 BPd.6
40,80 21,47
SP.s
40,80 21,47
SPI.Kr
40,80 21,47
40,80 21,47
Pd.4.Kr
5,5510,55
A = 281,98 HaQ = 149,99 Lt/dt
L = 1.189,00 M'
Pd.3.Kn
11,8422,50
BPd.5 BPd.4 BPd.3
A = 292,53 HaQ = 155,60 Lt/dt
L = 793,00 M'
Pd.2.Kr
23,9545,50
U.1.Kr
72,16137,10
U.1.Kn
48,1691,50
A = 315,03 HaQ = 167,57 Lt/dt
L = 1.075,00 M'
A = 228,60 Ha
Q = 121,57 Lt/dtL = 1.500,00 M'
Pd.1.Kr
15,90 8,37
Pd.2.Kn
49,60 26,11
BU.1
BPd.2 BPd.1
A = 638,73 HaQ = 339,75 Lt/dt
L = 675,00 M'
SPI.Kn
SPI Kn
40,80 21,47
SPj .1 Kr
40,80 21,47
SPj .1 Kn
40,80 21,47
SPL. Kn
40,80 21,47
SM.m
Pd.8.Kr
15,9530,30
PAYA JAGAT
T.2 Kr
16,6331,60
BPd.0
T.0 Kn
15,3229,10Box T.1
T.7.Kn
32,6862,10
T.6.Kn
57,47109,20
T.5.KR
28,6354,40
Br.1 Kr
34,0864,75
BT.7 BT.6 BT.5 BT.4 BT.3
22,8943,50
Br.1 Kn
43,50
Jb.2 Kr
22,89
22,4742,70
Jb.1.Kr
BJb.2
BJb.1
A = 94,25 Ha
Q = 50,13 Lt/dtL = 1.675,00 M'
A = 136,95 HaQ = 72,85 Lt/dtL = 428,00 M'
A = 500,00 HaQ = 265,96 Lt/dtL = 1.020,00 M'
BT.2
16,1630,70
T.1.Kn
BT.1
A = 531,60 Ha
Q = 282,77 Lt/dtL = 875,00 M'
PAYA G E UDEBANG
A = 562,30 Ha
Q = 299,10 Lt/dtL = 923,00 M'
A = 108,25 Ha
Q = 57,58 Lt/dtL = 532,00 M'
Sp.
PA
YA
JA
GA
T
A = 654,63 Ha
Q = 348,21 Lt/dtL = 1.075,00 M'
A = 684,93 HaQ = 364,32 Lt/dt
L = 325,00 M'
A = 1.327,33 Ha
Q = 706,03 Lt/dtL = 2.022,00 M'
Pg.1.Kr
15,90 8,37
A = 1.303,23 Ha
Q = 693,21 Lt/dt
L = 402,00 M'
BPg.2
BPg.1
Pg.1.Kn
16,1930,77
Pg.2.Kn
12,6824,10
BPg.3
Pg.3.Kn
29,4756,00
P.1.Kn
16,0030,40
Pk.1.Kn
36,6869,70
A = 3.995,25 Ha
Q = 2.125,13 Lt/dt
L = 1.171,00 M'
A = 1.398,70 HaQ = 743,99 Lt/dtL = 1.263,00 M' P.1.Kr
5,5310,50
A = 624,95 HaQ = 332,42 Lt/dtL = 1.241,00 M'
G.1.Kr
8,0515,30
A = 565,75 Ha
Q = 300,93 Lt/dtL = 1.046,00 M'
G.2.Kr
6,0515,30
Jb.2.Kn
26,7156,75
G.4.Kn
8,5516,25
G.5.Kn
15,5329,50
G.6.Kr
52,5099,75
A =155,50 HaQ = 82,71 Lt/dt
L = 1.239,00 M'
G.3.Kr
48,3791,90
A =139,25 HaQ = 74,07 Lt/dt
L = 512,00 M'
B.1.Kr
67,47128,10
A =109,75 Ha
Q = 58,38 Lt/dtL = 685,00 M'
G.6.Kn
5,2610,00
A = 4.064,95 Ha
Q = 2.162,21 Lt/dtL = 690,00 M'
BPK.1
BP.1
BPK.2
A = 5.504,55 HaQ = 2.927,95 Lt/dt
L = 8,168,00 M'
BENDUNG PANTE LHONG
Sp. TEUBE
Sp.
PA
YA
LA
OT
B.1.Kn
55,30 29,11
BB.1
BG.6
BG.5
BG.4 BG.3
G.3.Kn
15,90 8,37
A = 183,50 Ha
Q = 197,61 Lt/dtL = 2.096,00 M'
A = 446,80 Ha
Q = 237,66 Lt/dtL = 512,00 M'
G.2.Kn
107,45 56,55
G.1.Kn
43,90 23,11
BG.2
BG.1
BPK.3
PK.1.Kn
19,1636,40
CK.3.Kn
45,3786,20
BCK.3
CK.2.Kn
8,1115,40
BCK.2
A = 101,60 Ha
Q = 54,04 Lt/dtL = 407,00 M'
A = 86,20 Ha
Q = 45,85 Lt/dt
L = 1.218,00 M'
BPK.4
PK.1.Kn
A = 3.370,30 HaQ = 1.792,71 Lt/dt
L = 1.200,00 M'
A = 3.390,30 HaQ = 1.773,35 Lt/dt
L = 1.050,00 M'
CK.1.Kr
4,489,20
CK.1.Kn
156,90 82,58
A = 101,60 HaQ = 54,04 Lt/dtL = 407,00 M'
PAYA KAREUNG
BCK.1
BCK.0
L = 1.100,00 M'
A = 416,20 Ha
Q = 221,38 Lt/dtL = 492,00 M'
PL.1.Kr
44,0083,60
BPL.1
Sbr.Kn
13,7426,10
13,7426,10
A = 3.307,80 HaQ = 1.759,47 Lt/dt
L = 1.388,00 M'
SSBr.1
Sp. P
AY
A K
AR
EU
NG
T.1
T.0
PL2.T1.Kn
43,7483,10
BPL.2
Cb.1.Kr
29,8956,80
A = 148,50 HaQ = 78,99 Lt/dtL = 676,00 M'
SOFYAN
48,2691,70
T.1
BCb.1
Cb.1.Kn
33,1663,00
C.2.Kr
24,0045,60
C.1.Kr
PL.2.Kn
12,6824,10
IRVAN ZAHARI
A = 2.808,00 HaQ = 1.493,62 Lt/dt
L = 1.026,00 M'
A = 2.700,00 HaQ = 1.436,60 Lt/dt
L = 633,00 M'
SP.1 Kr
26,10 13,73
SUb.1 Kn
BSUb
BSp.0
26,10 13,73
PAYA PIE
SPb.1 Kn
BSP.b
26,10 13,73
PAYA BARU
7,1616,30
C.3.Kr
158,80 83,58
C.3.Kn
BC.3
A = 172,40 HaQ = 91,70 Lt/dt
L = 1.200,00 M'
15,40 8,11
C.2.Kn
A = 250,80 HaQ = 133,40 Lt/dtL = 1.326,00 M'
BC.2
BC.1
A = 296,40 HaQ = 157,66 Lt/dtL = 1.202,00 M'
PL.4.Kn
BPL.3 BPL.4
A = 2.404,40 HaQ = 1.278,94 Lt/dt
L = 682,00 M'
A = 2.363,70 HaQ = 1.257,29 Lt/dt
L = 981,00 M'
PL.4.Kn
5,7410,90
SP.1 Kn
BSP.g
26,10 13,74
PAYA BO
BSA.u
26,10 13,73
SAu.1 Kr
BSA.p
26,10 13,73
SAu.1 Kr
PAYA AL UE PING
T.0
A = 168,30 HaQ = 89,52 Lt/dt
L = 1.225,00 M'
BPL.5
PL.5.Kn
16,6831,70
145,30 76,43
PL.5 T0.Kr
23,00 12,11
29,80 15,68
PL.5 T0.Kn
PL.5.Kn
16,6831,70
62,70 33,00
PL.6 T0.Kr
111,20 58,83
PL.6 T0.Kn
T.1
A = 173,90 HaQ = 92,50 Lt/dt
L = 962,00 M'
BPL.6
9,70 5,11
PL.7a.Kn
BPL.7a
A = 2.163,70 HaQ = 1.159,90 Lt/dt
L = 1.525,00 M'
A = 1.940,70 HaQ = 1.032,29 Lt/dt
L = 804,00 M'
81,60 42,95
PL.7 T0.Kr
T.1
BPL.7
A = 1.817,70 HaQ = 966,86 Lt/dt
L = 1.956,00 M'
L = 1.166,00 M'
SPm.1 Kn
26,10 13,74
BSP.m
44,10 23,21
Pu.2.Kr
31,70 16,68
15,60 8,21
Pu.1.Kr
PL.7.Kn
137,40 72,32
Pu.3.Kr
153,20 80,63
Pu.4.Kr
106,40 56,00
Pu.4.KrT.1
A = 108,10 HaQ = 57,50 Lt/dtL = 2.704,00 M'
106,10 56,89
Pu.4 T0.Kn
BPU.4
A = 367,10 Ha
Q = 195,59 Lt/dtL = 509,00 M'
BPU.3
A = 505,10 Ha
Q = 268,67 Lt/dtL = 1.239,00 M'
BPU.2
A = 549,20 Ha
Q = 292,13 Lt/dtL = 1.142,00 M'
16,6331,60
Pu.1.Kn
A = 596,40 HaQ = 317,23 Lt/dt
L = 1.550,00 M'
43,40 22,84
PL.8.Kn
BPL.8
48,6892,50
Mb.2.Kr
71,79136,40
Mb.2.Kn
8,3715,90
Mb.2.Kr
T.1
53,79102,20
Mb.1.Kr
30,3357,63
SRd.Kr
BMb.2 BSRd
170,00 89,47
Mb.1 T1 Kn
A = 107,00 HaQ = 90,43 Lt/dtL = 2.605,00 M'
107,90 56,79
Km.2 T1 Kr
30,4257,80
KM.2 Kr
A = 107,00 HaQ = 90,43 Lt/dtL = 2.605,00 M'
A = 244,80 Ha
Q = 130,21 Lt/dtL = 1.000,00 M'
A = 302,43 Ha
Q = 160,87 Lt/dtL = 345,00 M'
A = 472,43 Ha
Q = 251,29 Lt/dtL = 334,00 M'
A = 741,30 HaQ = 394,31 Lt/dtL = 1.273,00 M'
A = 95,50 Ha
Q = 49,20 Lt/dtL = 850,00 M'
BMb.1
60,40 31,79
Bj.5 Kr
47,30 24,89
Bj.4 Kr
46,30 24,37
Bj.3 Kr
103,17 54,30
KM.2 Kn
15,80 8,32
50,80 26,74
BJ.1 Kr
BJ.2 Kr
153,50 80,79
BJ.5 T1 Kn
BKM.1
BBJ.1A = 436,60 HaQ = 232,23 Lt/dtL = 359,00 M'
A = 385,80 Ha
Q = 205,21 Lt/dtL = 663,00 M'
A = 354,10 Ha
Q = 188,35 Lt/dtL = 852,00 M'
BBJ.2
BBJ.3
8,3715,90
BJ.2 Kn
BBJ.4
A = 307,80 HaQ = 163,72 Lt/dt
L = 1.719,00 M'
A = 244,60 HaQ = 130,11 Lt/dtL = 1.035,00 M'
BBJ.5 16,1630,70
BJ.5 Kn
8,3715,90
BJ.4 Kn
A = 1.117,90 HaQ = 626,54 Lt/dt
L = 5,047,00 M'
Legend :
Name of Tert iry FieldArea of Tertiry FieldDesign Debit Lt/dt
Turn Out
Cross Regulat or
Tert iary Box
Dam
Primary Canal
Secondary Canal
Tertiary Can
Disposal Canal
Reservoir
SU
PL
ESI K
E T
AM
B.
Sp. BATEE
Sp. JEUMPA
Sp. B
IR
EU
N
JANUAR, A.Md
Sp. BANJIR ASIN
Sp. T
AN
OH
MIR
AH
Sp. J
AN
GK
A
Sp. B
UG
AK
Sp. G
AN
DA
PU
RA
Sp. LIPAH
T.1 T.1
T.1
8,3715,90
SPg.1 Kr
BSPg.1
BKM.2
38424067
3687
Sample Location
Sample Location
Sample Location
Figure 3.4 Schematic layout of Pante Lhong technical irrigation system and sample location
BJb.2 (Jb.2Kr)
BT.7 (T.7Kn)
BP.1 (Pg.1Kn)
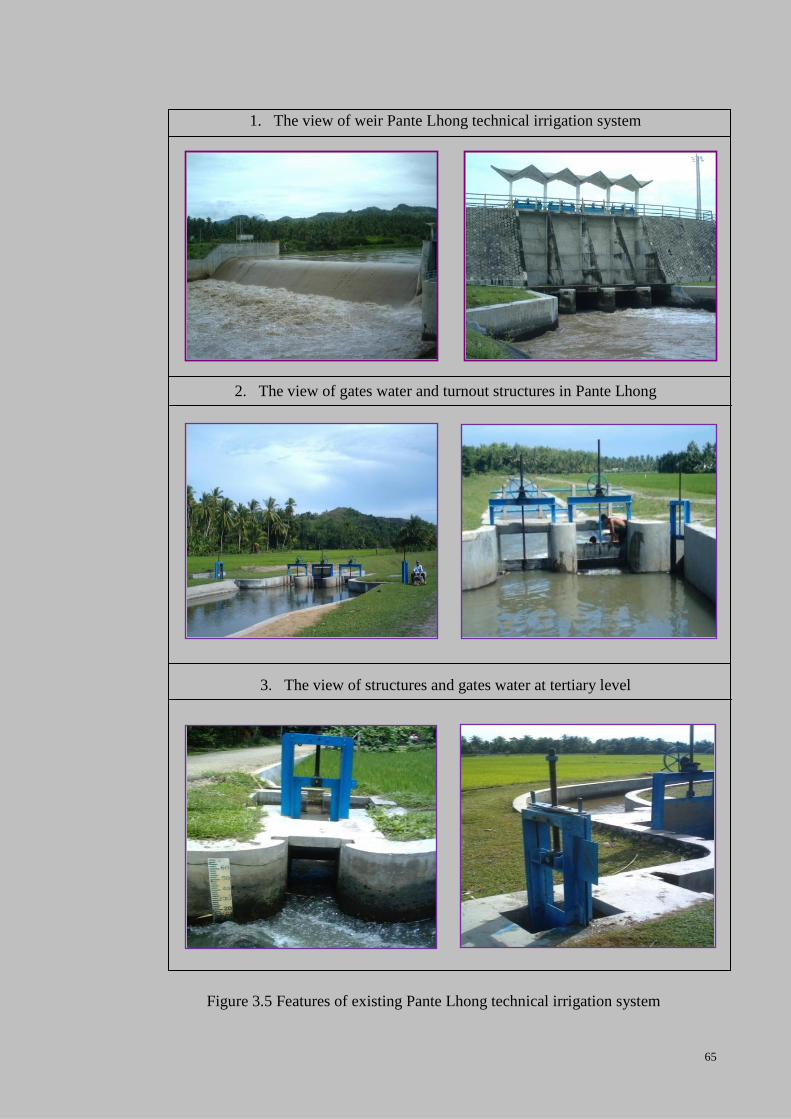
65
1. The view of weir Pante Lhong technical irrigation system
2. The view of gates water and turnout structures in Pante Lhong
3. The view of structures and gates water at tertiary level
Figure 3.5 Features of existing Pante Lhong technical irrigation system
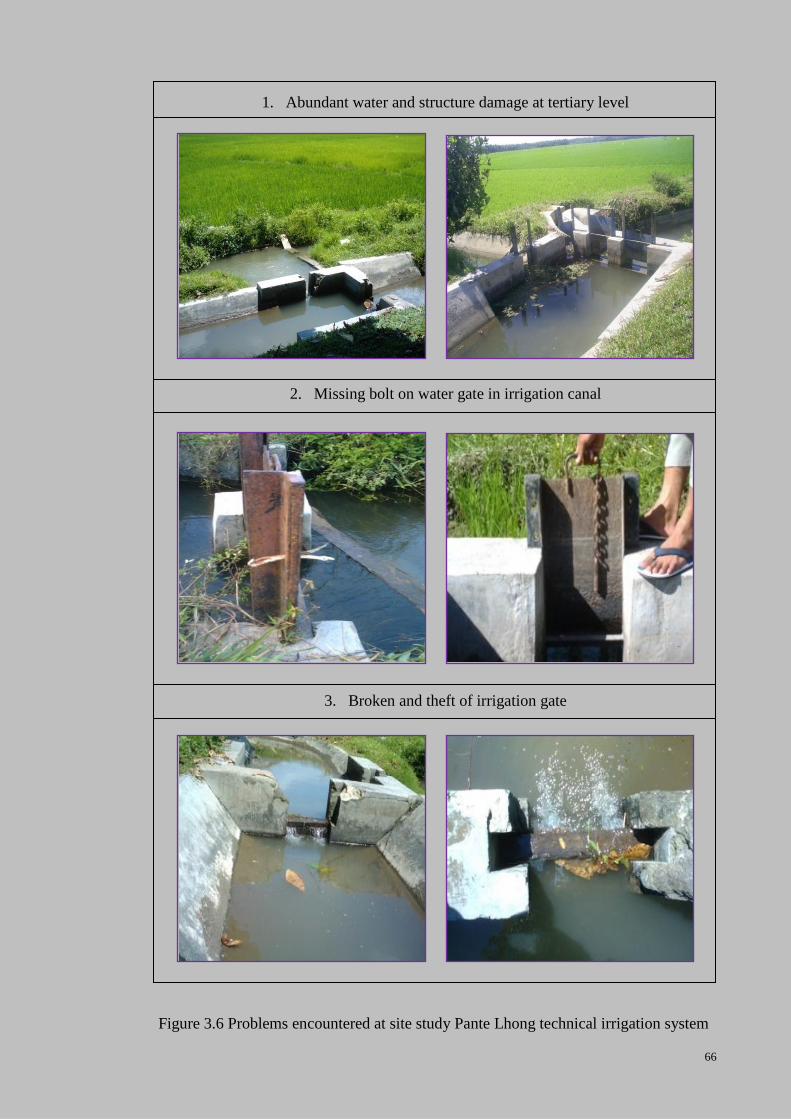
66
1. Abundant water and structure damage at tertiary level
2. Missing bolt on water gate in irrigation canal
3. Broken and theft of irrigation gate
Figure 3.6 Problems encountered at site study Pante Lhong technical irrigation system
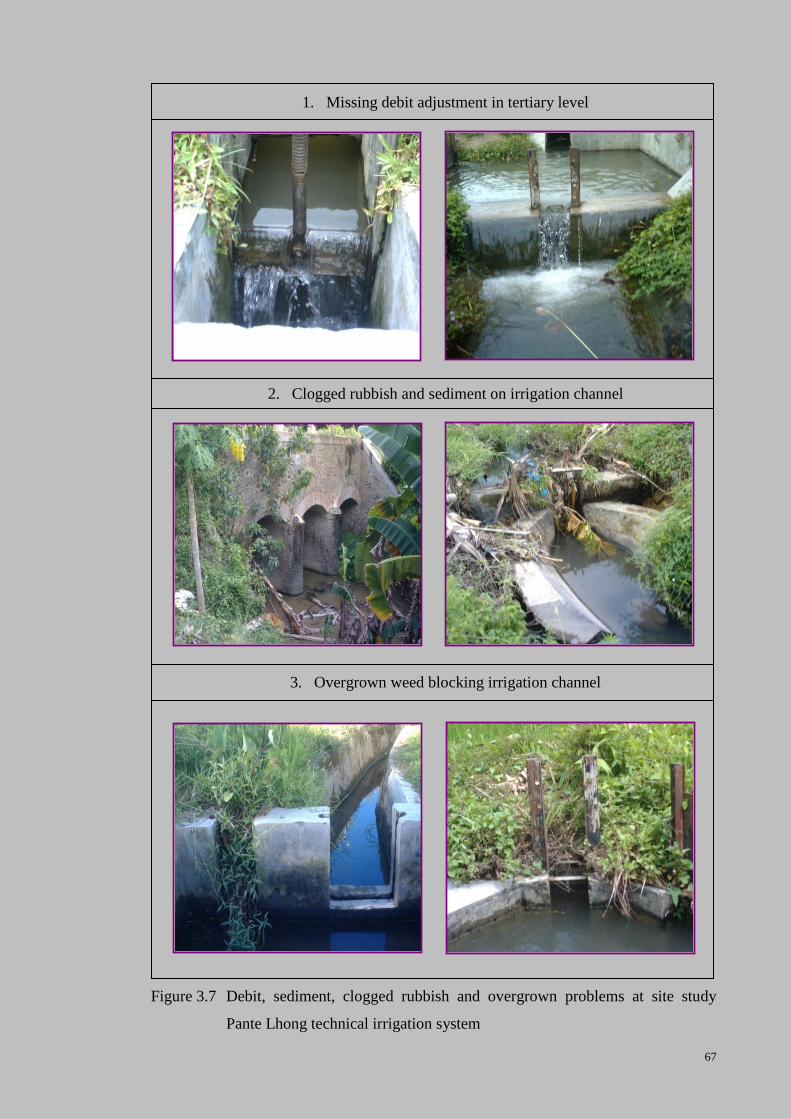
67
1. Missing debit adjustment in tertiary level
2. Clogged rubbish and sediment on irrigation channel
3. Overgrown weed blocking irrigation channel
Figure 3.7 Debit, sediment, clogged rubbish and overgrown problems at site study
Pante Lhong technical irrigation system
68
For the daily activities, the authority is assisted by two irrigation office sub districts;
there was Bireuen sub district irrigation office and Peusangan sub district irrigation
office. At each sub district level, the canal network is supervised by a head of sub
district office, currently, operated by three gate coordinators and a number of gate
operators. The main systems were concrete lined materials which have a trapezoidal and
flume cross section. The primary canal supply water to the two major secondary canal
of the left bank and the right bank canal. The left bank secondary canal supplies water
to the Paya Geudebang and the Bate secondary canal to irrigate the paddy areas
877.3 ha and 533 ha, respectively. The right bank secondary canal delivers to the Paya
Kareueng and the Geudong canal systems, with the service areas of 3542.2 ha and
624.95 ha, respectively.
The irrigation water is supplied on a continuous regime basis during February and June
and August to December planting seasons. To control the amount of water allocation
to the downstream canal systems, the permanent off-take structures were built which
consist of two types of steel plate gates. The first type is called sliding plate gate that
functions to control discharge to the continuing secondary canal. The secondary type is
called the Crump de Gruyter (CDG) sliding gate that is used to divert water from the
secondary to the tertiary canals. The numbers of water gates in the Pante Lhong
technical irrigation system are 179 units and are divided into sliding gates at 113 units
and Crump de Gruyter (CDG) at 67 units. The water gates that were functional at 156
unit (87.15 %), number of gates were damaged due to lack of the maintenance at 7 units
(3.91 %) and number of gates damaged due to vandalism were 16 units (8.94 %). The
details of characteristics of samples study is summarized in Table 3.4 and the details of
the water gates condition is summarized in Table 3.5.
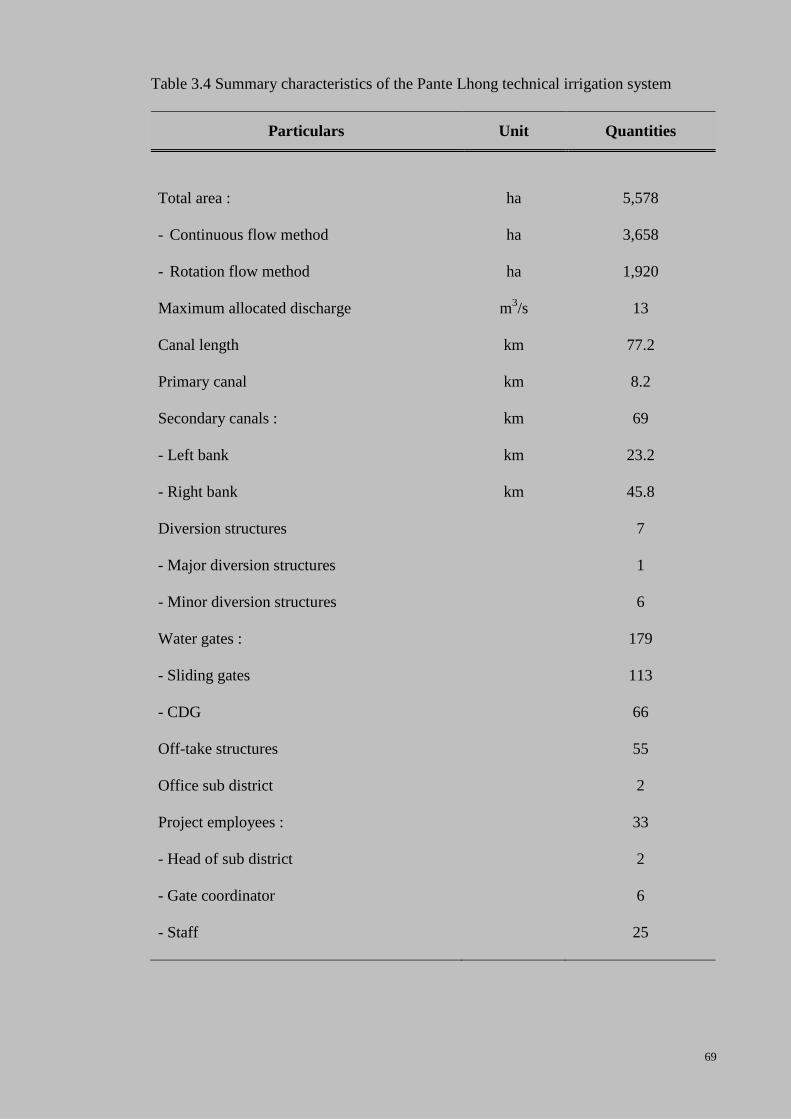
69
Table 3.4 Summary characteristics of the Pante Lhong technical irrigation system
Particulars Unit Quantities
Total area :
- Continuous flow method
- Rotation flow method
ha
ha
ha
5,578
3,658
1,920
Maximum allocated discharge m3/s 13
Canal length km 77.2
Primary canal km 8.2
Secondary canals : km 69
- Left bank km 23.2
- Right bank km 45.8
Diversion structures 7
- Major diversion structures 1
- Minor diversion structures 6
Water gates : 179
- Sliding gates 113
- CDG 66
Off-take structures 55
Office sub district 2
Project employees : 33
- Head of sub district 2
- Gate coordinator 6
- Staff
25
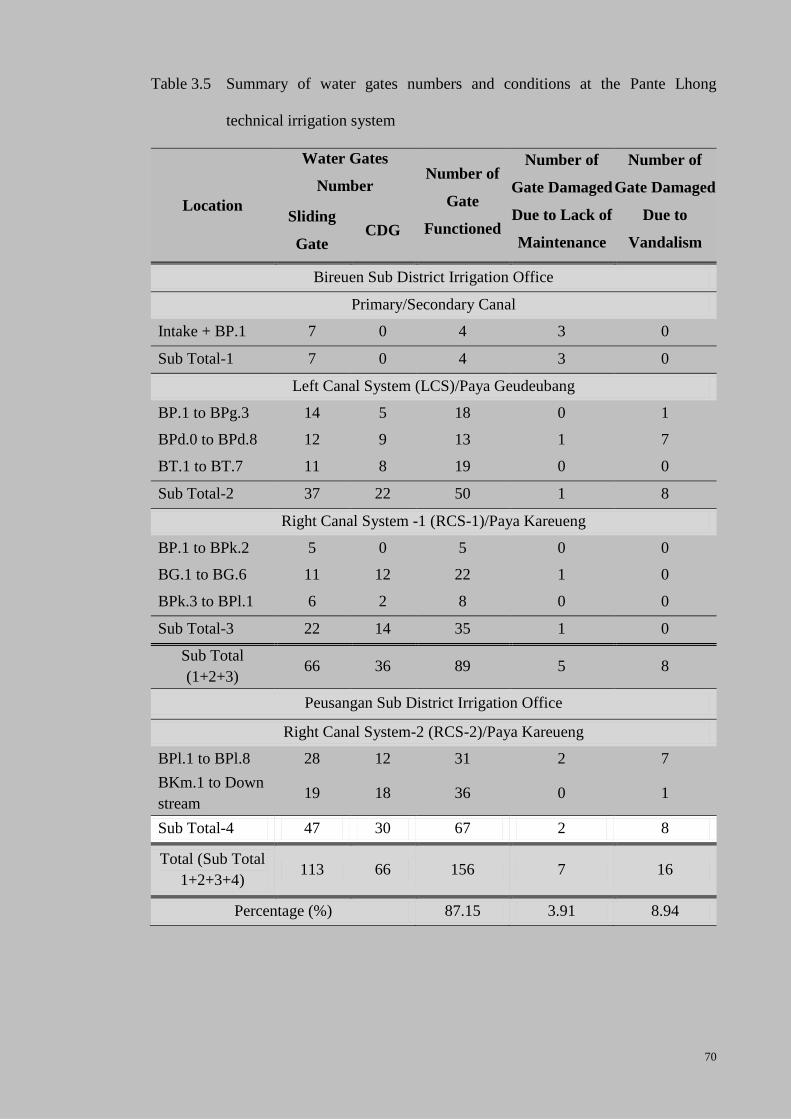
70
Table 3.5 Summary of water gates numbers and conditions at the Pante Lhong
technical irrigation system
Location
Water Gates
Number Number of
Gate
Functioned
Number of
Gate Damaged
Due to Lack of
Maintenance
Number of
Gate Damaged
Due to
Vandalism
Sliding
Gate CDG
Bireuen Sub District Irrigation Office
Primary/Secondary Canal
Intake + BP.1 7 0 4 3 0
Sub Total-1 7 0 4 3 0
Left Canal System (LCS)/Paya Geudeubang
BP.1 to BPg.3 14 5 18 0 1
BPd.0 to BPd.8 12 9 13 1 7
BT.1 to BT.7 11 8 19 0 0
Sub Total-2 37 22 50 1 8
Right Canal System -1 (RCS-1)/Paya Kareueng
BP.1 to BPk.2 5 0 5 0 0
BG.1 to BG.6 11 12 22 1 0
BPk.3 to BPl.1 6 2 8 0 0
Sub Total-3 22 14 35 1 0
Sub Total
(1+2+3) 66 36 89 5 8
Peusangan Sub District Irrigation Office
Right Canal System-2 (RCS-2)/Paya Kareueng
BPl.1 to BPl.8 28 12 31 2 7
BKm.1 to Down
stream 19 18 36 0 1
Sub Total-4 47 30 67 2 8
Total (Sub Total
1+2+3+4) 113 66 156 7 16
Percentage (%) 87.15 3.91 8.94
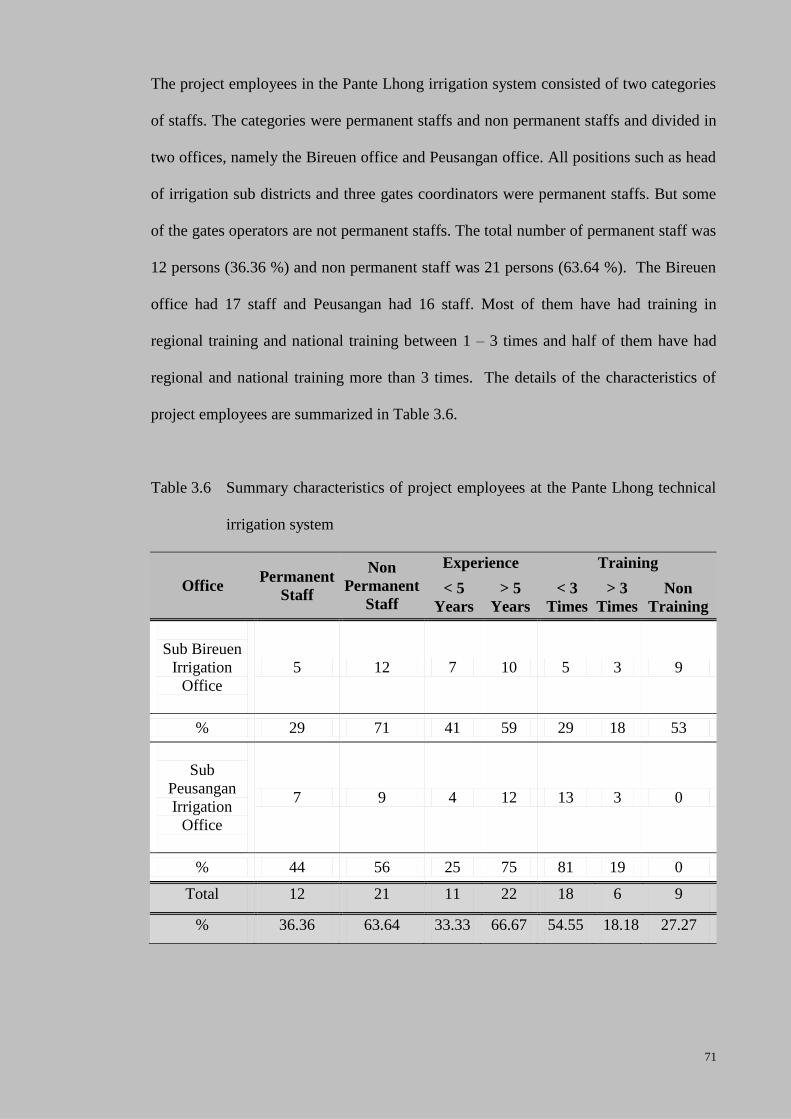
71
The project employees in the Pante Lhong irrigation system consisted of two categories
of staffs. The categories were permanent staffs and non permanent staffs and divided in
two offices, namely the Bireuen office and Peusangan office. All positions such as head
of irrigation sub districts and three gates coordinators were permanent staffs. But some
of the gates operators are not permanent staffs. The total number of permanent staff was
12 persons (36.36 %) and non permanent staff was 21 persons (63.64 %). The Bireuen
office had 17 staff and Peusangan had 16 staff. Most of them have had training in
regional training and national training between 1 – 3 times and half of them have had
regional and national training more than 3 times. The details of the characteristics of
project employees are summarized in Table 3.6.
Table 3.6 Summary characteristics of project employees at the Pante Lhong technical
irrigation system
Office Permanent
Staff
Non
Permanent
Staff
Experience Training
< 5
Years
> 5
Years
< 3
Times
> 3
Times
Non
Training
Sub Bireuen
Irrigation
Office
5 12 7 10 5 3 9
% 29 71 41 59 29 18 53
Sub
Peusangan
Irrigation
Office
7 9 4 12 13 3 0
% 44 56 25 75 81 19 0
Total 12 21 11 22 18 6 9
% 36.36 63.64 33.33 66.67 54.55 18.18 27.27
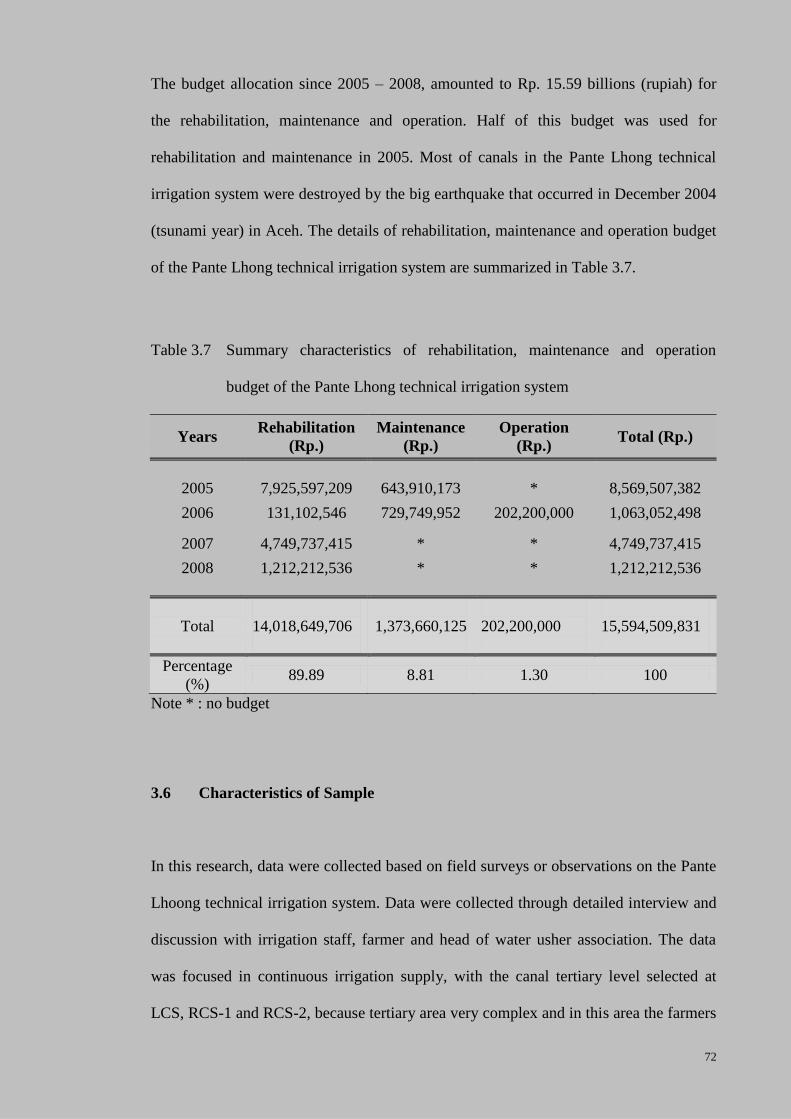
72
The budget allocation since 2005 – 2008, amounted to Rp. 15.59 billions (rupiah) for
the rehabilitation, maintenance and operation. Half of this budget was used for
rehabilitation and maintenance in 2005. Most of canals in the Pante Lhong technical
irrigation system were destroyed by the big earthquake that occurred in December 2004
(tsunami year) in Aceh. The details of rehabilitation, maintenance and operation budget
of the Pante Lhong technical irrigation system are summarized in Table 3.7.
Table 3.7 Summary characteristics of rehabilitation, maintenance and operation
budget of the Pante Lhong technical irrigation system
Years Rehabilitation
(Rp.)
Maintenance
(Rp.)
Operation
(Rp.) Total (Rp.)
2005
7,925,597,209
643,910,173
*
8,569,507,382
2006 131,102,546 729,749,952 202,200,000 1,063,052,498
2007 4,749,737,415 * * 4,749,737,415
2008
1,212,212,536
*
*
1,212,212,536
Total
14,018,649,706
1,373,660,125
202,200,000
15,594,509,831
Percentage
(%) 89.89 8.81 1.30 100
Note * : no budget
3.6 Characteristics of Sample
In this research, data were collected based on field surveys or observations on the Pante
Lhoong technical irrigation system. Data were collected through detailed interview and
discussion with irrigation staff, farmer and head of water usher association. The data
was focused in continuous irrigation supply, with the canal tertiary level selected at
LCS, RCS-1 and RCS-2, because tertiary area very complex and in this area the farmers
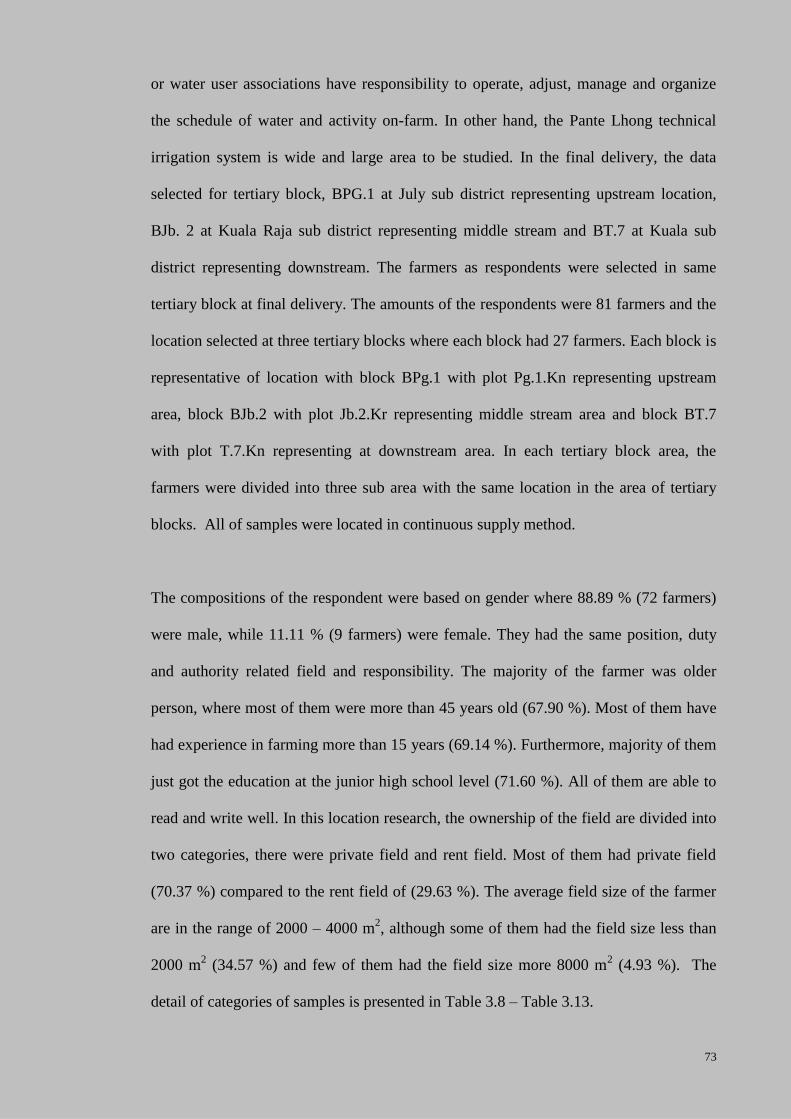
73
or water user associations have responsibility to operate, adjust, manage and organize
the schedule of water and activity on-farm. In other hand, the Pante Lhong technical
irrigation system is wide and large area to be studied. In the final delivery, the data
selected for tertiary block, BPG.1 at July sub district representing upstream location,
BJb. 2 at Kuala Raja sub district representing middle stream and BT.7 at Kuala sub
district representing downstream. The farmers as respondents were selected in same
tertiary block at final delivery. The amounts of the respondents were 81 farmers and the
location selected at three tertiary blocks where each block had 27 farmers. Each block is
representative of location with block BPg.1 with plot Pg.1.Kn representing upstream
area, block BJb.2 with plot Jb.2.Kr representing middle stream area and block BT.7
with plot T.7.Kn representing at downstream area. In each tertiary block area, the
farmers were divided into three sub area with the same location in the area of tertiary
blocks. All of samples were located in continuous supply method.
The compositions of the respondent were based on gender where 88.89 % (72 farmers)
were male, while 11.11 % (9 farmers) were female. They had the same position, duty
and authority related field and responsibility. The majority of the farmer was older
person, where most of them were more than 45 years old (67.90 %). Most of them have
had experience in farming more than 15 years (69.14 %). Furthermore, majority of them
just got the education at the junior high school level (71.60 %). All of them are able to
read and write well. In this location research, the ownership of the field are divided into
two categories, there were private field and rent field. Most of them had private field
(70.37 %) compared to the rent field of (29.63 %). The average field size of the farmer
are in the range of 2000 – 4000 m2, although some of them had the field size less than
2000 m2 (34.57 %) and few of them had the field size more 8000 m
2 (4.93 %). The
detail of categories of samples is presented in Table 3.8 – Table 3.13.
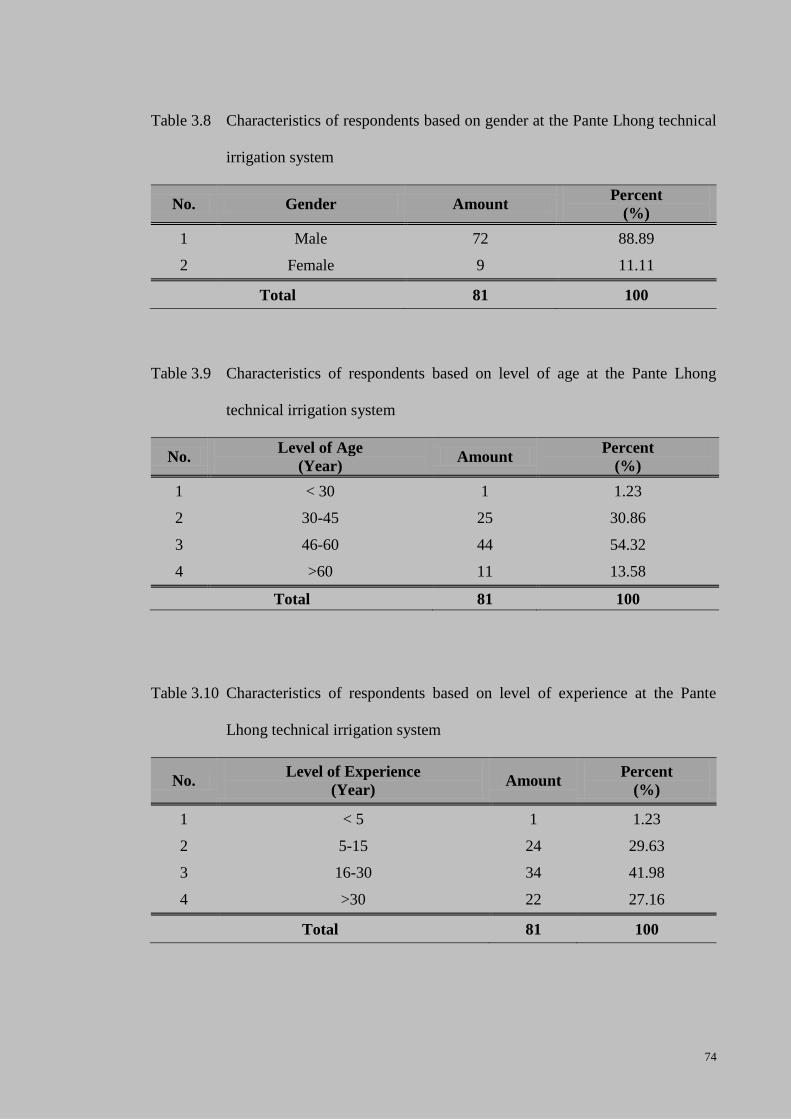
74
Table 3.8 Characteristics of respondents based on gender at the Pante Lhong technical
irrigation system
No. Gender Amount Percent
(%)
1 Male 72 88.89
2 Female 9 11.11
Total 81 100
Table 3.9 Characteristics of respondents based on level of age at the Pante Lhong
technical irrigation system
No. Level of Age
(Year) Amount
Percent
(%)
1 < 30 1 1.23
2 30-45 25 30.86
3 46-60 44 54.32
4 >60 11 13.58
Total 81 100
Table 3.10 Characteristics of respondents based on level of experience at the Pante
Lhong technical irrigation system
No. Level of Experience
(Year) Amount
Percent
(%)
1 < 5 1 1.23
2 5-15 24 29.63
3 16-30 34 41.98
4 >30 22 27.16
Total 81 100
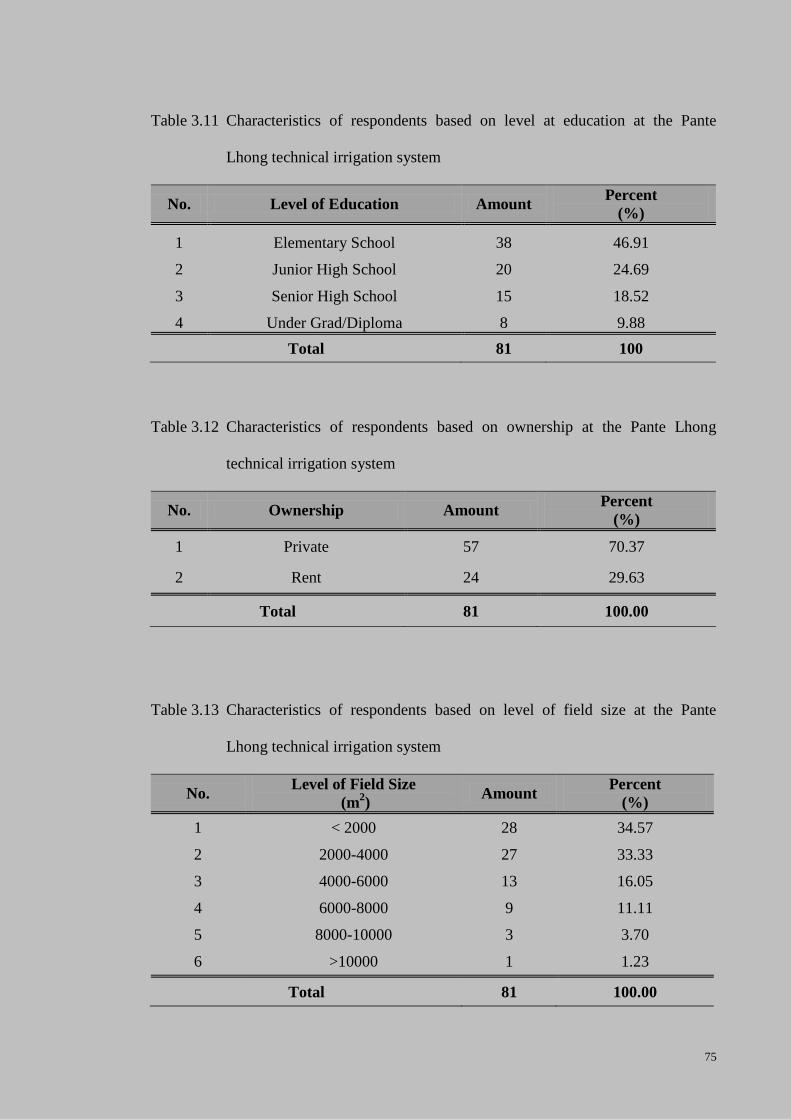
75
Table 3.11 Characteristics of respondents based on level at education at the Pante
Lhong technical irrigation system
No. Level of Education Amount Percent
(%)
1 Elementary School 38 46.91
2 Junior High School 20 24.69
3 Senior High School 15 18.52
4 Under Grad/Diploma 8 9.88
Total 81 100
Table 3.12 Characteristics of respondents based on ownership at the Pante Lhong
technical irrigation system
No. Ownership Amount Percent
(%)
1 Private 57 70.37
2 Rent 24 29.63
Total 81 100.00
Table 3.13 Characteristics of respondents based on level of field size at the Pante
Lhong technical irrigation system
No. Level of Field Size
(m2)
Amount Percent
(%)
1 < 2000 28 34.57
2 2000-4000 27 33.33
3 4000-6000 13 16.05
4 6000-8000 9 11.11
5 8000-10000 3 3.70
6 >10000 1 1.23
Total 81 100.00
76
3.7 Summary
Irrigation performance assessment can be evaluated by identifing key performance
indicators consisting of both internal and external indicators. The internal indicators
were selected from the RAP method that was considered relevant to the current
assessment of the irrigation management practice performance at the canal levels. The
internal indicator data were obtained based on field survey or observation on the
irrigation canal network. The data for the external indicators such as crop yield and
production cost were collected based on the field survey from the selected respondents
and locations. The data were collected based on the qualitative and quantitative
methods. Data collected based on field data were collected through field survey, deep
interview as well as discussions survey from selected respondents, locations and used
questionnaire.
The Pante Lhong technical irrigation system selected as the case study covered a total
area of 5,578 Ha. There are two types of irrigation supplies system i.e. the continuous
supply method and the rotation supply method. The continuous supply has service area
of about 3,658 ha (66 %). The rotation supply method has the service area of about
1,920 ha (34 %). The operation and maintenance of the main system are a controlled by
the Bireuen District Irrigation Office authority. For the daily activities, the authority is
assisted by two irrigation office sub district. The number of gates that are functioning
are 156 units (87.15 %) while 23 units (12.85 %) were damaged. A major part of the
budget for the Pante Lhong technical irrigation system had been used for the
maintenance of the irrigation system especially for the canal.
77
The data was focused in the continuous irrigation supply region, with the canal tertiary
level at LCS, RCS-1 and RCS-2. In the final delivery, the data selected for tertiary
block, BPG.1 at July sub district representing upstream location, BJb. 2 at Kuala Raja
sub district representing middle stream and BT.7 at Kuala sub district representing
downstream. The total number of the farmers samples were 81 farmers which were
chosen randomly.
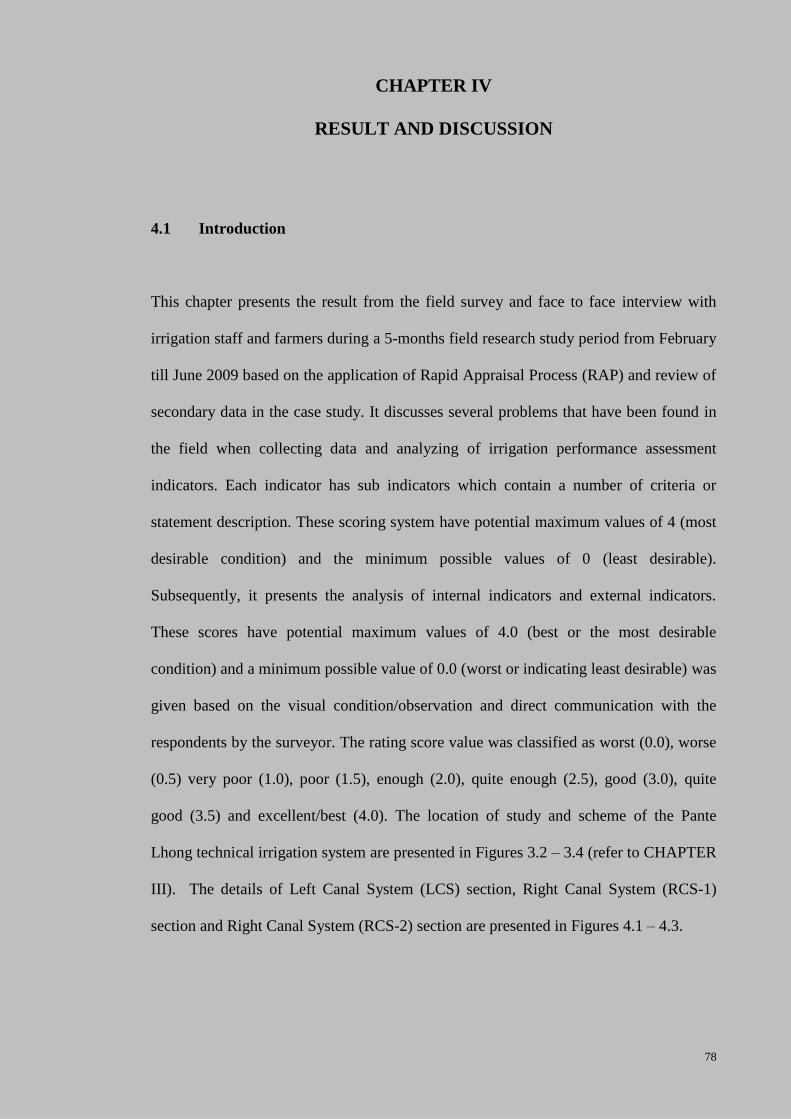
78
CHAPTER IV
RESULT AND DISCUSSION
4.1 Introduction
This chapter presents the result from the field survey and face to face interview with
irrigation staff and farmers during a 5-months field research study period from February
till June 2009 based on the application of Rapid Appraisal Process (RAP) and review of
secondary data in the case study. It discusses several problems that have been found in
the field when collecting data and analyzing of irrigation performance assessment
indicators. Each indicator has sub indicators which contain a number of criteria or
statement description. These scoring system have potential maximum values of 4 (most
desirable condition) and the minimum possible values of 0 (least desirable).
Subsequently, it presents the analysis of internal indicators and external indicators.
These scores have potential maximum values of 4.0 (best or the most desirable
condition) and a minimum possible value of 0.0 (worst or indicating least desirable) was
given based on the visual condition/observation and direct communication with the
respondents by the surveyor. The rating score value was classified as worst (0.0), worse
(0.5) very poor (1.0), poor (1.5), enough (2.0), quite enough (2.5), good (3.0), quite
good (3.5) and excellent/best (4.0). The location of study and scheme of the Pante
Lhong technical irrigation system are presented in Figures 3.2 – 3.4 (refer to CHAPTER
III). The details of Left Canal System (LCS) section, Right Canal System (RCS-1)
section and Right Canal System (RCS-2) section are presented in Figures 4.1 – 4.3.
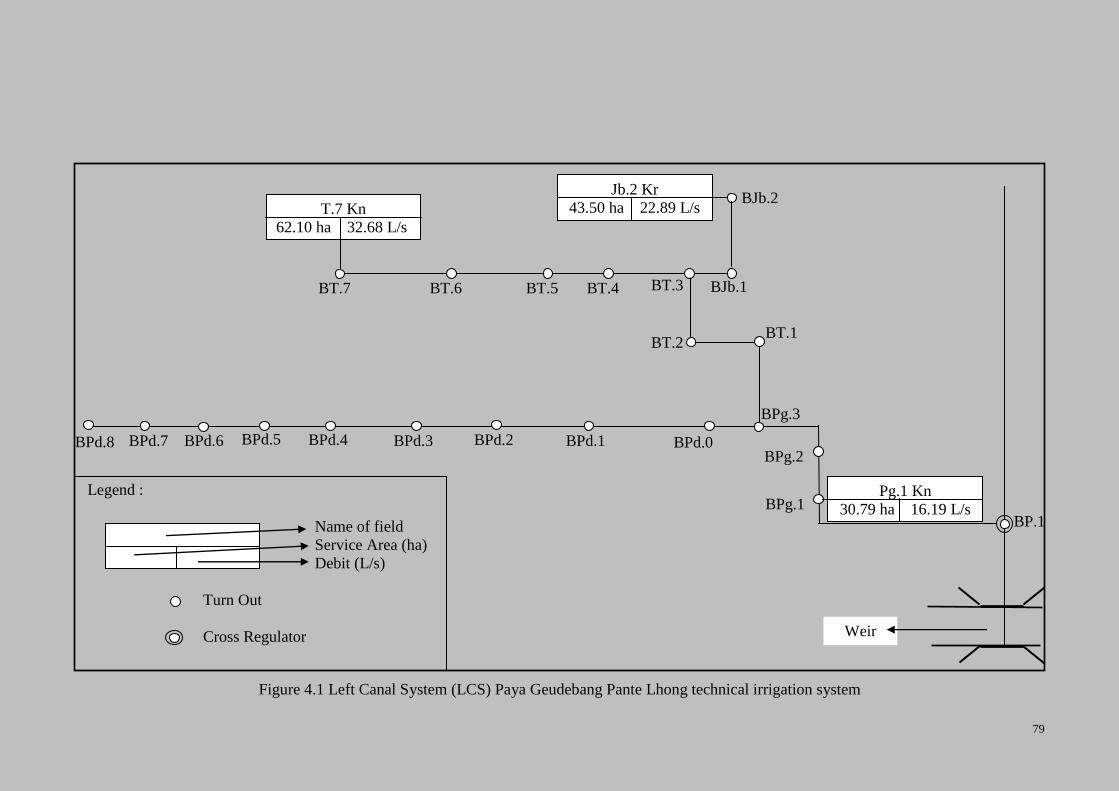
79
Legend :
Name of field
Service Area (ha)
Debit (L/s)
Turn Out
Cross Regulator
Figure 4.1 Left Canal System (LCS) Paya Geudebang Pante Lhong technical irrigation system
Weir
BP.1 BPg.1
BPg.2
BPg.3
BT.1 BT.2
BPd.0
BJb.2
BPd.8 BPd.7 BPd.6 BPd.1 BPd.2 BPd.3 BPd.4 BPd.5
BT.3 BT.4 BT.5 BT.6 BT.7 BJb.1
Pg.1 Kn
30.79 ha 16.19 L/s
T.7 Kn
62.10 ha 32.68 L/s
Jb.2 Kr
43.50 ha 22.89 L/s
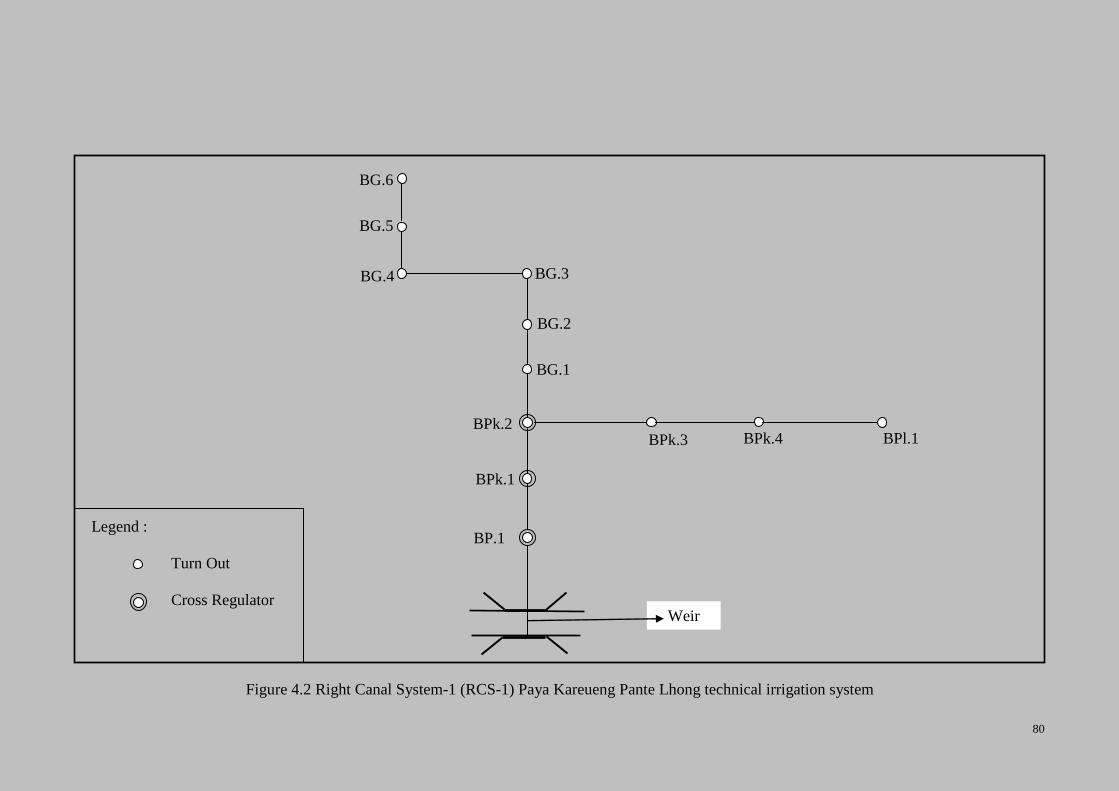
80
Legend :
Turn Out
Cross Regulator
Figure 4.2 Right Canal System-1 (RCS-1) Paya Kareueng Pante Lhong technical irrigation system
Weir
BPk.4
BG.2
BPk.3
BP.1
BPk.2
BG.5
BG.6
BG.4 BG.3
BG.1
BPk.1
BPl.1
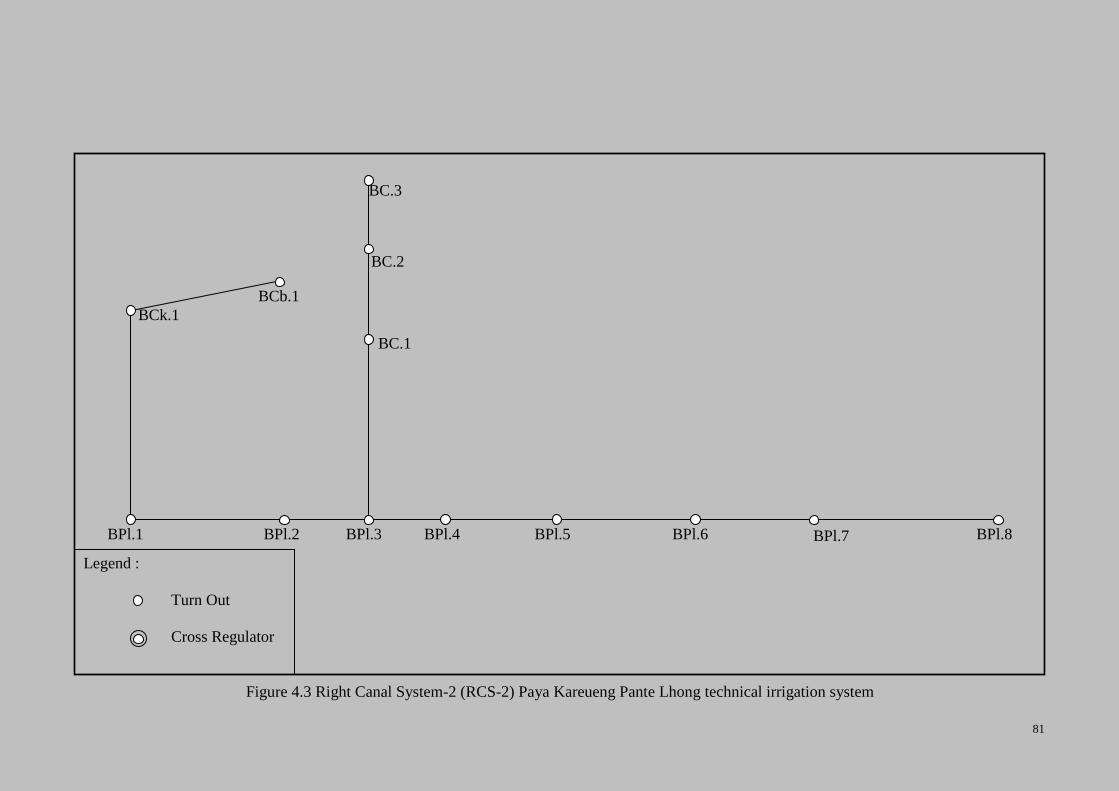
81
Legend :
Turn Out
Cross Regulator
Figure 4.3 Right Canal System-2 (RCS-2) Paya Kareueng Pante Lhong technical irrigation system
BC.1
BPl.6 BPl.1
BCk.1
BPl.3 BPl.7
BPl.8 BPl.4 BPl.5 BPl.2
BCb.1
BC.2
BC.3
82
4.2 Infrastructure Maintenance Performance of the System
The infrastructure maintenance is one of the RAP internal performance indicators. The
sub internal indicators valued for infrastructure performance were floor and canal bank,
seepage, level of gate maintenance and availability of proper equipment and staff. Table
4.1 – 4.4 and Figure 4.4 – 4.7 shows the infrastructure maintenance performances of
LCS, RCS-1 and RCS-2 based on survey and measurement using RAP method.
The details of sub indicators infrastructure maintenance component which contain a
number of criteria or statement description and its related score values is shown in
Table 3.3.
To evaluate LCS section, the LCS was divided into three sections, namely BP.1 to
BPg.3, BPg.3 to BPd.8 and BPg.3 to BT.7 (refer to Figure 4.1). Each section has sub
section and the detail of length and area of each section is shown in Table 4.1.
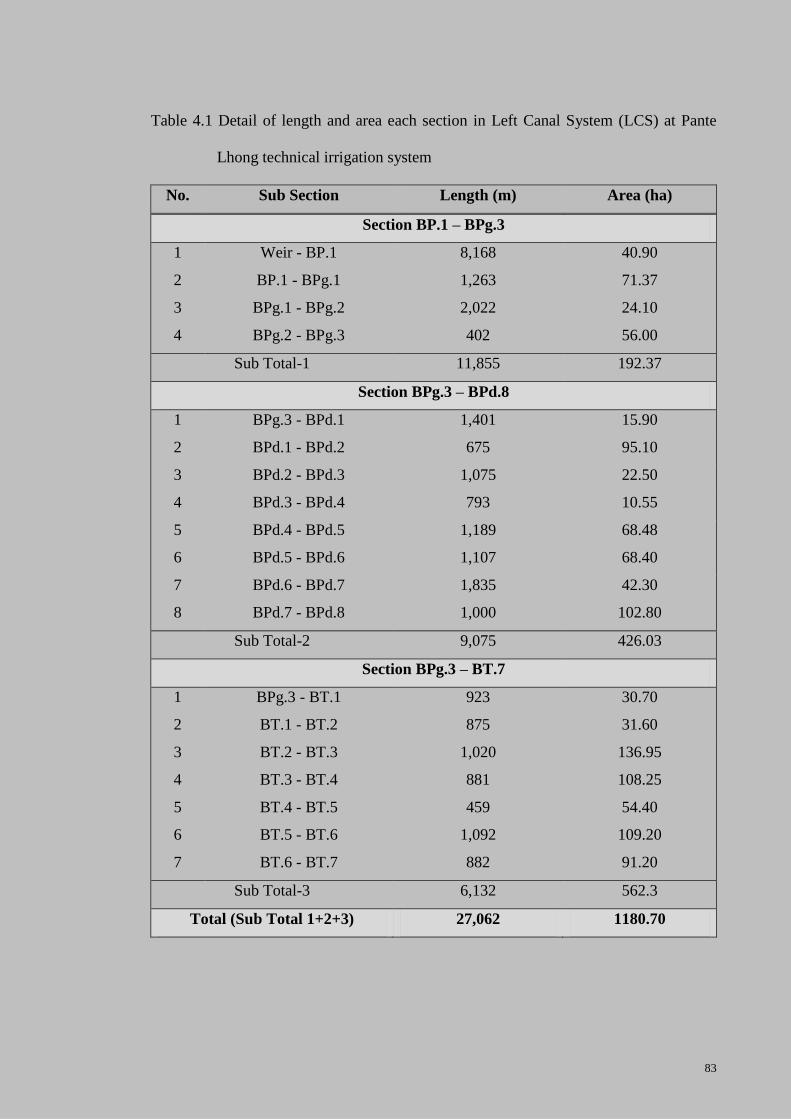
83
Table 4.1 Detail of length and area each section in Left Canal System (LCS) at Pante
Lhong technical irrigation system
No. Sub Section Length (m) Area (ha)
Section BP.1 – BPg.3
1 Weir - BP.1 8,168 40.90
2 BP.1 - BPg.1 1,263 71.37
3 BPg.1 - BPg.2 2,022 24.10
4 BPg.2 - BPg.3 402 56.00
Sub Total-1 11,855 192.37
Section BPg.3 – BPd.8
1 BPg.3 - BPd.1 1,401 15.90
2 BPd.1 - BPd.2 675 95.10
3 BPd.2 - BPd.3 1,075 22.50
4 BPd.3 - BPd.4 793 10.55
5 BPd.4 - BPd.5 1,189 68.48
6 BPd.5 - BPd.6 1,107 68.40
7 BPd.6 - BPd.7 1,835 42.30
8 BPd.7 - BPd.8 1,000 102.80
Sub Total-2 9,075 426.03
Section BPg.3 – BT.7
1 BPg.3 - BT.1 923 30.70
2 BT.1 - BT.2 875 31.60
3 BT.2 - BT.3 1,020 136.95
4 BT.3 - BT.4 881 108.25
5 BT.4 - BT.5 459 54.40
6 BT.5 - BT.6 1,092 109.20
7 BT.6 - BT.7 882 91.20
Sub Total-3 6,132 562.3
Total (Sub Total 1+2+3) 27,062 1180.70
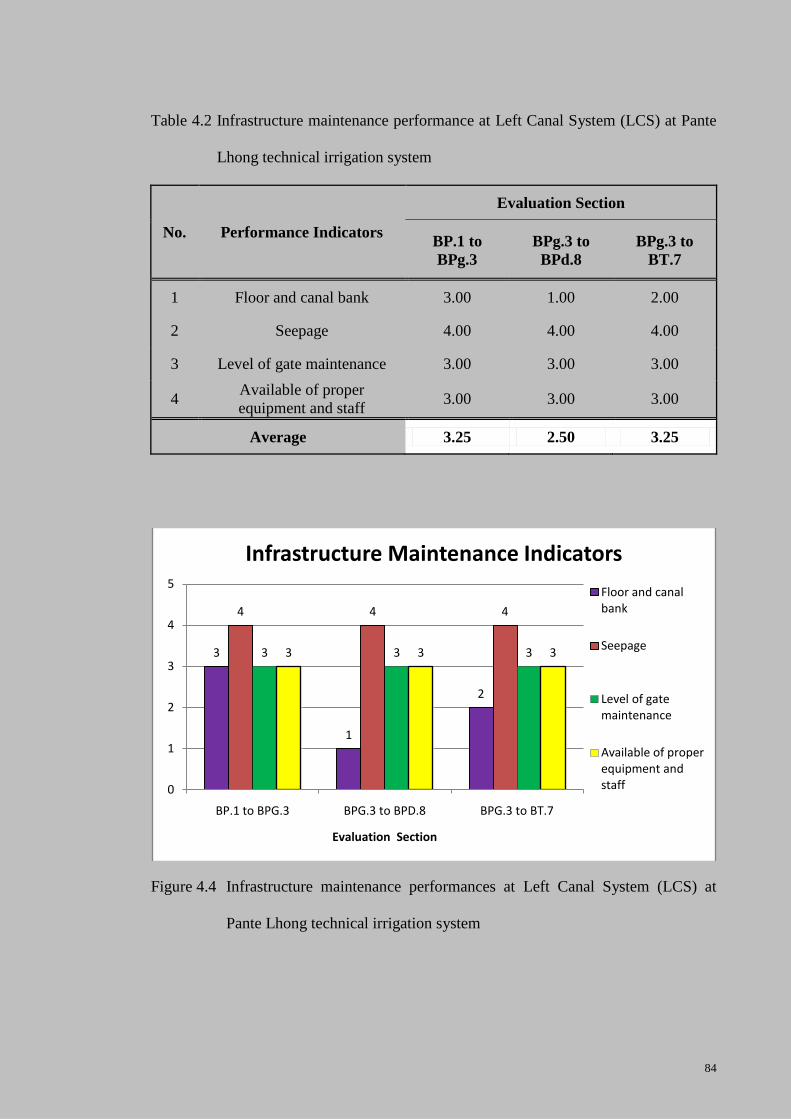
84
Table 4.2 Infrastructure maintenance performance at Left Canal System (LCS) at Pante
Lhong technical irrigation system
No. Performance Indicators
Evaluation Section
BP.1 to
BPg.3
BPg.3 to
BPd.8
BPg.3 to
BT.7
1 Floor and canal bank 3.00 1.00 2.00
2 Seepage 4.00 4.00 4.00
3 Level of gate maintenance 3.00 3.00 3.00
4 Available of proper
equipment and staff 3.00 3.00 3.00
Average 3.25 2.50 3.25
Figure 4.4 Infrastructure maintenance performances at Left Canal System (LCS) at
Pante Lhong technical irrigation system
3
1
2
4 4 4
3 3 33 3 3
0
1
2
3
4
5
BP.1 to BPG.3 BPG.3 to BPD.8 BPG.3 to BT.7
Evaluation Section
Infrastructure Maintenance Indicators
Floor and canal bank
Seepage
Level of gate maintenance
Available of proper equipment and staff
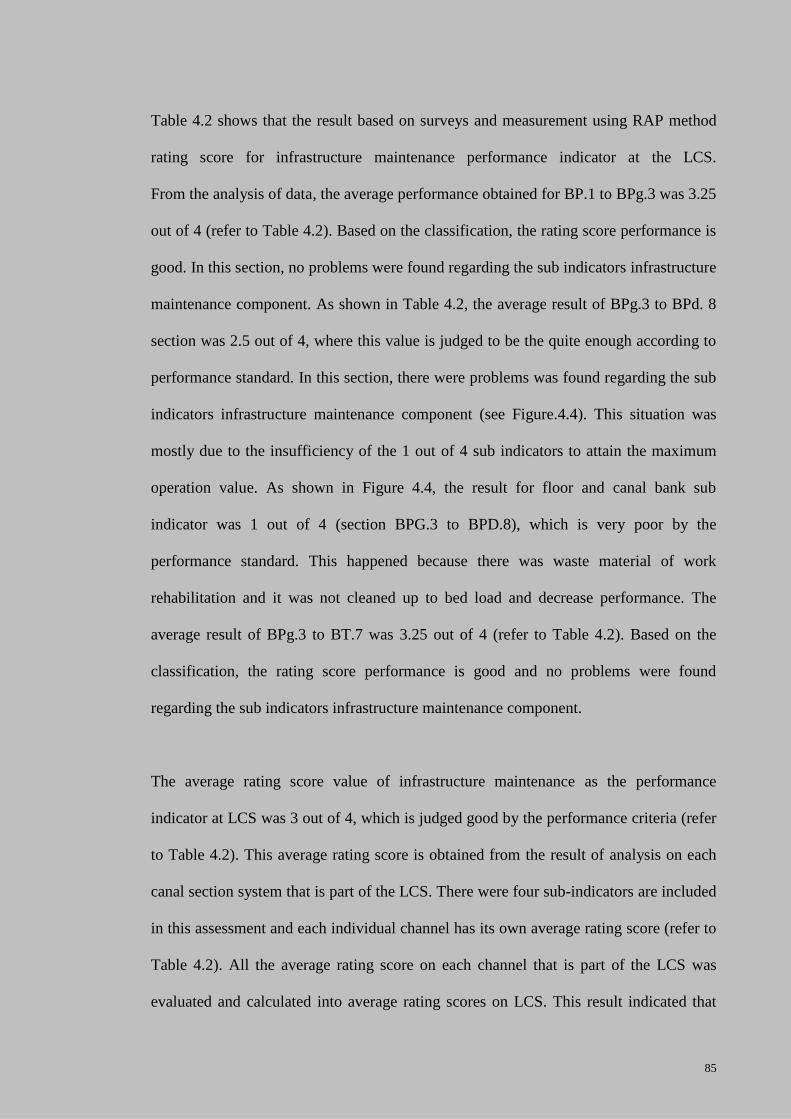
85
Table 4.2 shows that the result based on surveys and measurement using RAP method
rating score for infrastructure maintenance performance indicator at the LCS.
From the analysis of data, the average performance obtained for BP.1 to BPg.3 was 3.25
out of 4 (refer to Table 4.2). Based on the classification, the rating score performance is
good. In this section, no problems were found regarding the sub indicators infrastructure
maintenance component. As shown in Table 4.2, the average result of BPg.3 to BPd. 8
section was 2.5 out of 4, where this value is judged to be the quite enough according to
performance standard. In this section, there were problems was found regarding the sub
indicators infrastructure maintenance component (see Figure.4.4). This situation was
mostly due to the insufficiency of the 1 out of 4 sub indicators to attain the maximum
operation value. As shown in Figure 4.4, the result for floor and canal bank sub
indicator was 1 out of 4 (section BPG.3 to BPD.8), which is very poor by the
performance standard. This happened because there was waste material of work
rehabilitation and it was not cleaned up to bed load and decrease performance. The
average result of BPg.3 to BT.7 was 3.25 out of 4 (refer to Table 4.2). Based on the
classification, the rating score performance is good and no problems were found
regarding the sub indicators infrastructure maintenance component.
The average rating score value of infrastructure maintenance as the performance
indicator at LCS was 3 out of 4, which is judged good by the performance criteria (refer
to Table 4.2). This average rating score is obtained from the result of analysis on each
canal section system that is part of the LCS. There were four sub-indicators are included
in this assessment and each individual channel has its own average rating score (refer to
Table 4.2). All the average rating score on each channel that is part of the LCS was
evaluated and calculated into average rating scores on LCS. This result indicated that
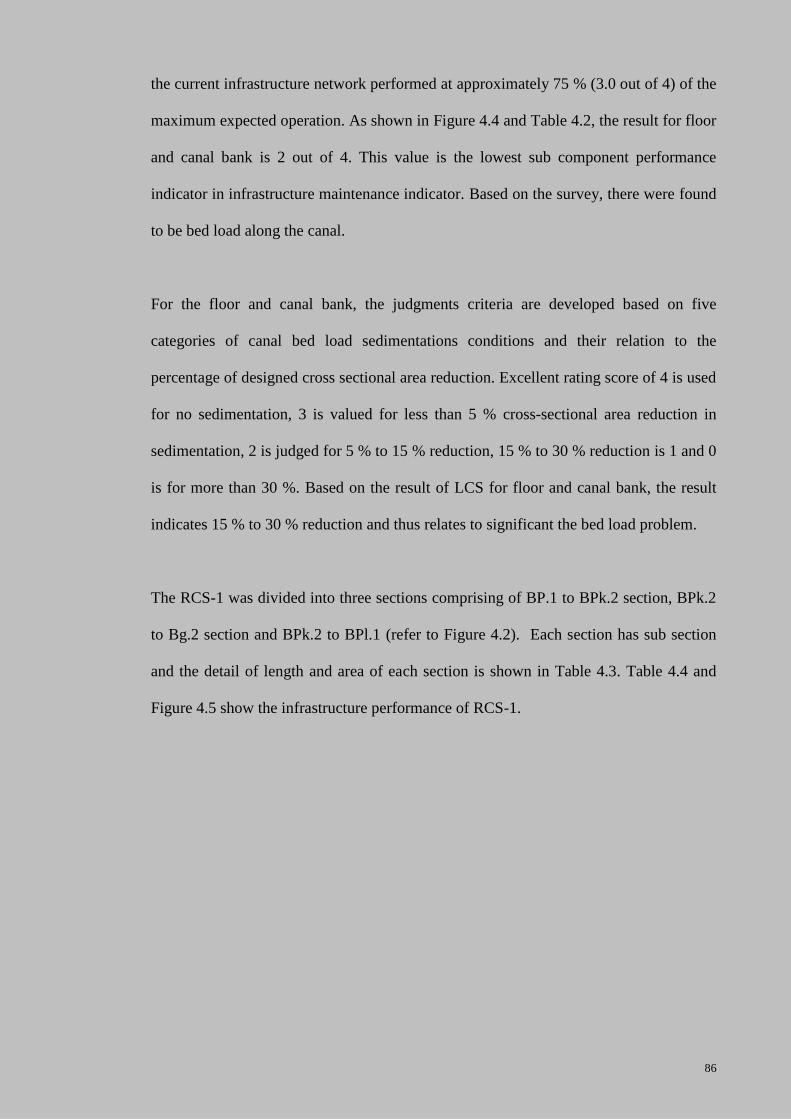
86
the current infrastructure network performed at approximately 75 % (3.0 out of 4) of the
maximum expected operation. As shown in Figure 4.4 and Table 4.2, the result for floor
and canal bank is 2 out of 4. This value is the lowest sub component performance
indicator in infrastructure maintenance indicator. Based on the survey, there were found
to be bed load along the canal.
For the floor and canal bank, the judgments criteria are developed based on five
categories of canal bed load sedimentations conditions and their relation to the
percentage of designed cross sectional area reduction. Excellent rating score of 4 is used
for no sedimentation, 3 is valued for less than 5 % cross-sectional area reduction in
sedimentation, 2 is judged for 5 % to 15 % reduction, 15 % to 30 % reduction is 1 and 0
is for more than 30 %. Based on the result of LCS for floor and canal bank, the result
indicates 15 % to 30 % reduction and thus relates to significant the bed load problem.
The RCS-1 was divided into three sections comprising of BP.1 to BPk.2 section, BPk.2
to Bg.2 section and BPk.2 to BPl.1 (refer to Figure 4.2). Each section has sub section
and the detail of length and area of each section is shown in Table 4.3. Table 4.4 and
Figure 4.5 show the infrastructure performance of RCS-1.
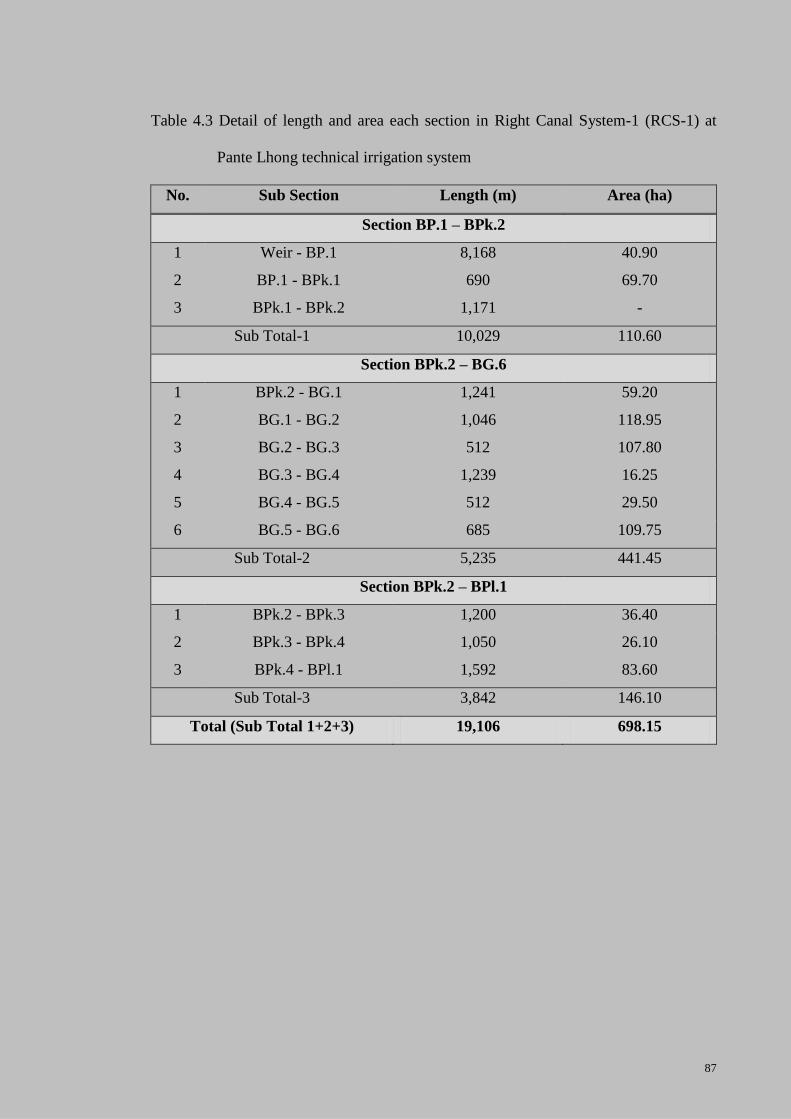
87
Table 4.3 Detail of length and area each section in Right Canal System-1 (RCS-1) at
Pante Lhong technical irrigation system
No. Sub Section Length (m) Area (ha)
Section BP.1 – BPk.2
1 Weir - BP.1 8,168 40.90
2 BP.1 - BPk.1 690 69.70
3 BPk.1 - BPk.2 1,171 -
Sub Total-1 10,029 110.60
Section BPk.2 – BG.6
1 BPk.2 - BG.1 1,241 59.20
2 BG.1 - BG.2 1,046 118.95
3 BG.2 - BG.3 512 107.80
4 BG.3 - BG.4 1,239 16.25
5 BG.4 - BG.5 512 29.50
6 BG.5 - BG.6 685 109.75
Sub Total-2 5,235 441.45
Section BPk.2 – BPl.1
1 BPk.2 - BPk.3 1,200 36.40
2 BPk.3 - BPk.4 1,050 26.10
3 BPk.4 - BPl.1 1,592 83.60
Sub Total-3 3,842 146.10
Total (Sub Total 1+2+3) 19,106 698.15
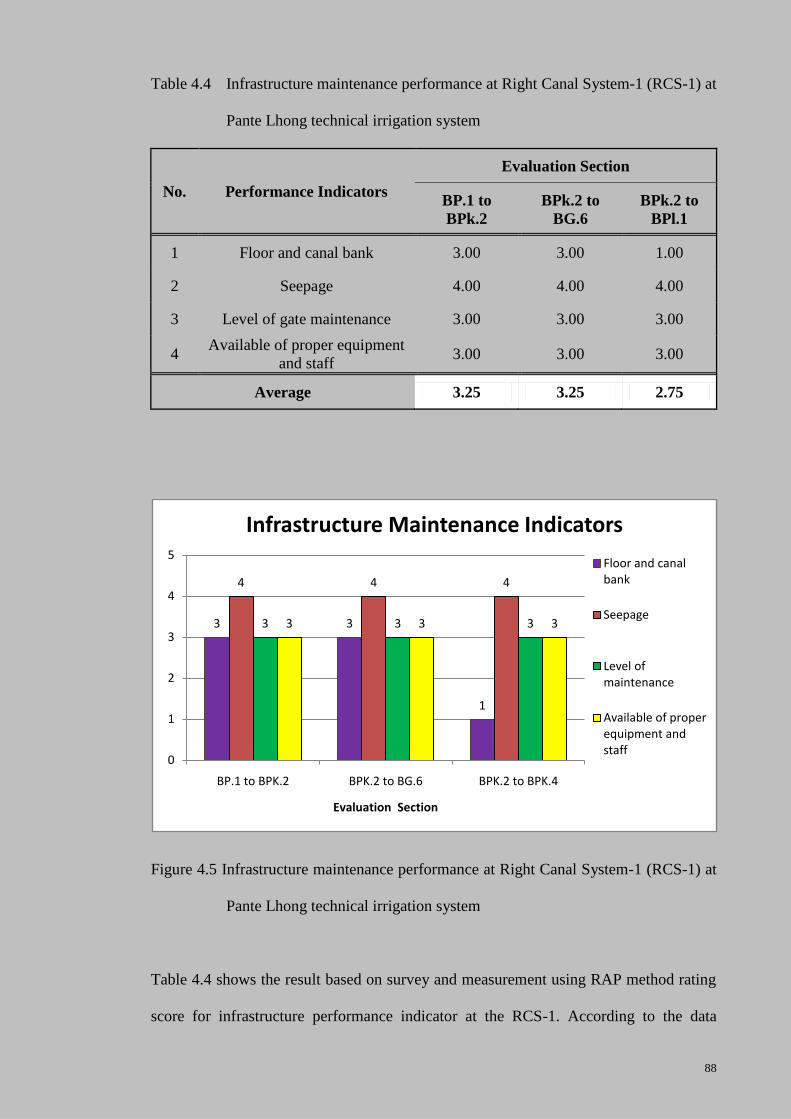
88
Table 4.4 Infrastructure maintenance performance at Right Canal System-1 (RCS-1) at
Pante Lhong technical irrigation system
No. Performance Indicators
Evaluation Section
BP.1 to
BPk.2
BPk.2 to
BG.6
BPk.2 to
BPl.1
1 Floor and canal bank 3.00 3.00 1.00
2 Seepage 4.00 4.00 4.00
3 Level of gate maintenance 3.00 3.00 3.00
4 Available of proper equipment
and staff 3.00 3.00 3.00
Average 3.25 3.25 2.75
Figure 4.5 Infrastructure maintenance performance at Right Canal System-1 (RCS-1) at
Pante Lhong technical irrigation system
Table 4.4 shows the result based on survey and measurement using RAP method rating
score for infrastructure performance indicator at the RCS-1. According to the data
3 3
1
4 4 4
3 3 33 3 3
0
1
2
3
4
5
BP.1 to BPK.2 BPK.2 to BG.6 BPK.2 to BPK.4
Evaluation Section
Infrastructure Maintenance Indicators
Floor and canal bank
Seepage
Level of maintenance
Available of proper equipment and staff

89
analysis, the average performance of BP.1 to BPk.2 obtained that was 3.25 out of 4
(refer to Table 4.4). Based on the classification, the rating score performance is
considered good. In this section, no problem was found regarding the sub indicators
infrastructure maintenance component.
The average result of BPk.2 to BG.7 was 3.25 out of 4 (refer to Table 4.4). Based on the
classification, the rating score performance is good and no problems were found
regarding the sub indicators infrastructure maintenance component. As shown in Table
4.2, the average result of BPk.2 to BPl. 1 section was 2.75 out of 4, which this value is
judged to be the quite enough according to performance standard. In this section, the
problem found was regarding the sub indicators infrastructure maintenance component
(see Figure.4.6). This situation was mostly due to the insufficiency of the 1 out of 4 sub
indicators to attain the maximum operation value. As shown in Figure 4.5, the result for
floor and canal bank sub indicator was 1 out of 4, which is very poor by the
performance standard.
The average rating score value of infrastructure performance at RCS-1 was 3.08 out of 4
(Table 4.4) or indicating that RCS-1 is operated and managed with 77 % of the expected
serviceability. This average rating score is obtained from survey and measurement with
the RAP method and average score of each canal system that is part of the RCS-1.
According to the performance criteria, this value is judged as good. The excellent rating
score of 4 was obtained for seepage sub indicator (see Figure 4.5). Figure 4.5 shows that
at BPk.2 to BPl.1, the sub indicator performance for floor and canal banks score value is
1 which is 25 % (1 out of 4) of the expected performance value. This result showed
there are significant problems with bed load with 15 % - 30 % cross sectional area
reduction in sedimentation.
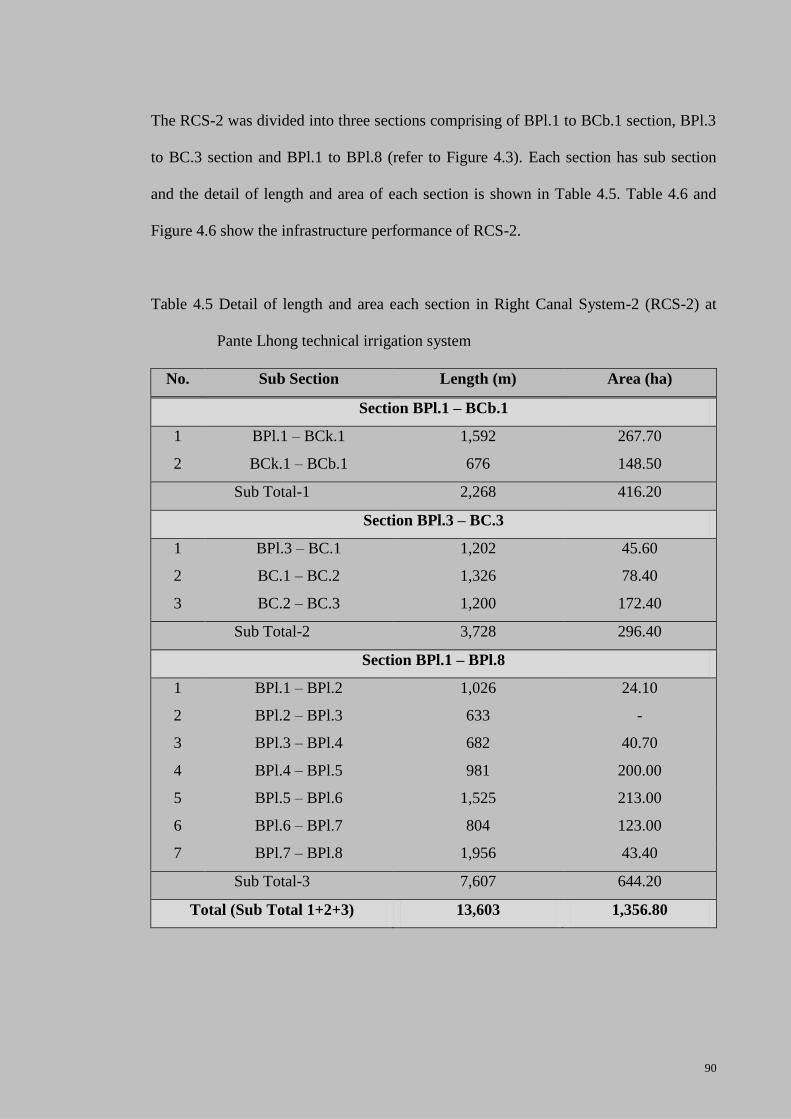
90
The RCS-2 was divided into three sections comprising of BPl.1 to BCb.1 section, BPl.3
to BC.3 section and BPl.1 to BPl.8 (refer to Figure 4.3). Each section has sub section
and the detail of length and area of each section is shown in Table 4.5. Table 4.6 and
Figure 4.6 show the infrastructure performance of RCS-2.
Table 4.5 Detail of length and area each section in Right Canal System-2 (RCS-2) at
Pante Lhong technical irrigation system
No. Sub Section Length (m) Area (ha)
Section BPl.1 – BCb.1
1 BPl.1 – BCk.1 1,592 267.70
2 BCk.1 – BCb.1 676 148.50
Sub Total-1 2,268 416.20
Section BPl.3 – BC.3
1 BPl.3 – BC.1 1,202 45.60
2 BC.1 – BC.2 1,326 78.40
3 BC.2 – BC.3 1,200 172.40
Sub Total-2 3,728 296.40
Section BPl.1 – BPl.8
1 BPl.1 – BPl.2 1,026 24.10
2 BPl.2 – BPl.3 633 -
3 BPl.3 – BPl.4 682 40.70
4 BPl.4 – BPl.5 981 200.00
5 BPl.5 – BPl.6 1,525 213.00
6 BPl.6 – BPl.7 804 123.00
7 BPl.7 – BPl.8 1,956 43.40
Sub Total-3 7,607 644.20
Total (Sub Total 1+2+3) 13,603 1,356.80

91
Table 4.6 Infrastructure maintenance performance at Right Canal System-2 (RCS-2) at
Pante Lhong technical irrigation system
No. Performance Indicators
Evaluation Section
BPl.1 to
BCb.1
BPl.3 to
BC.3
BPl.1 to
BPl.8
1 Floor and canal bank 1.00 2.00 1.00
2 Seepage 4.00 4.00 4.00
3 Level of gate maintenance 3.00 3.00 3.00
4 Available of proper equipment
and staff 3.00 3.00 3.00
Average 2.75 3.25 2.50
Figure 4.6 Infrastructure maintenance performance at Right Canal System-2 (RCS-2) at
Pante Lhong technical irrigation system
Table 4.6 shows the result based on survey and measurement using RAP method rating
score for infrastructure performance indicator at the RCS-2. From the data analysis the
average performance of BPl.1 to BCb.1 was 2.75 out of 4 (refer to Table 4.6). Based on
1
2
1
4 4 4
3 3 33 3 3
0
1
2
3
4
5
BPL.1 to BCB.1 BPL.3 to BC.3 BPL.1 to BPL.8
Evaluation Section
Infrastructure Maintenance Indicators
Floor and canal bank
Seepage
Level of maintenance
Available of proper equipment and staff
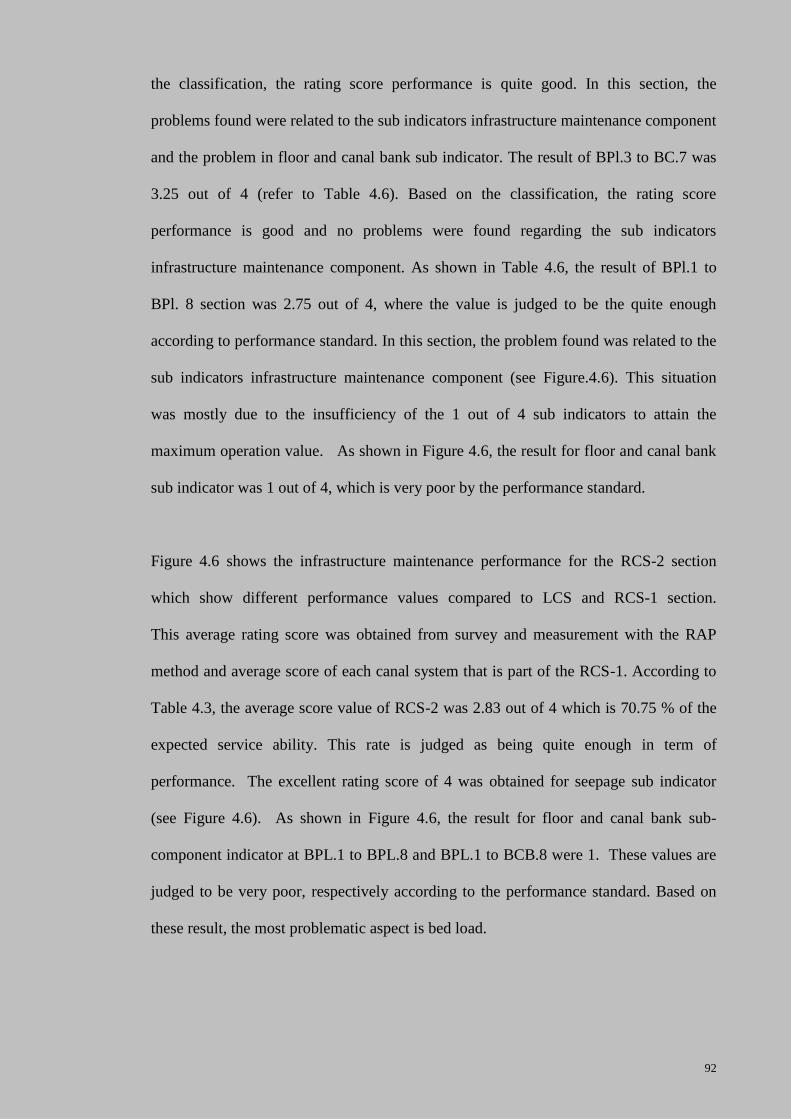
92
the classification, the rating score performance is quite good. In this section, the
problems found were related to the sub indicators infrastructure maintenance component
and the problem in floor and canal bank sub indicator. The result of BPl.3 to BC.7 was
3.25 out of 4 (refer to Table 4.6). Based on the classification, the rating score
performance is good and no problems were found regarding the sub indicators
infrastructure maintenance component. As shown in Table 4.6, the result of BPl.1 to
BPl. 8 section was 2.75 out of 4, where the value is judged to be the quite enough
according to performance standard. In this section, the problem found was related to the
sub indicators infrastructure maintenance component (see Figure.4.6). This situation
was mostly due to the insufficiency of the 1 out of 4 sub indicators to attain the
maximum operation value. As shown in Figure 4.6, the result for floor and canal bank
sub indicator was 1 out of 4, which is very poor by the performance standard.
Figure 4.6 shows the infrastructure maintenance performance for the RCS-2 section
which show different performance values compared to LCS and RCS-1 section.
This average rating score was obtained from survey and measurement with the RAP
method and average score of each canal system that is part of the RCS-1. According to
Table 4.3, the average score value of RCS-2 was 2.83 out of 4 which is 70.75 % of the
expected service ability. This rate is judged as being quite enough in term of
performance. The excellent rating score of 4 was obtained for seepage sub indicator
(see Figure 4.6). As shown in Figure 4.6, the result for floor and canal bank sub-
component indicator at BPL.1 to BPL.8 and BPL.1 to BCB.8 were 1. These values are
judged to be very poor, respectively according to the performance standard. Based on
these result, the most problematic aspect is bed load.
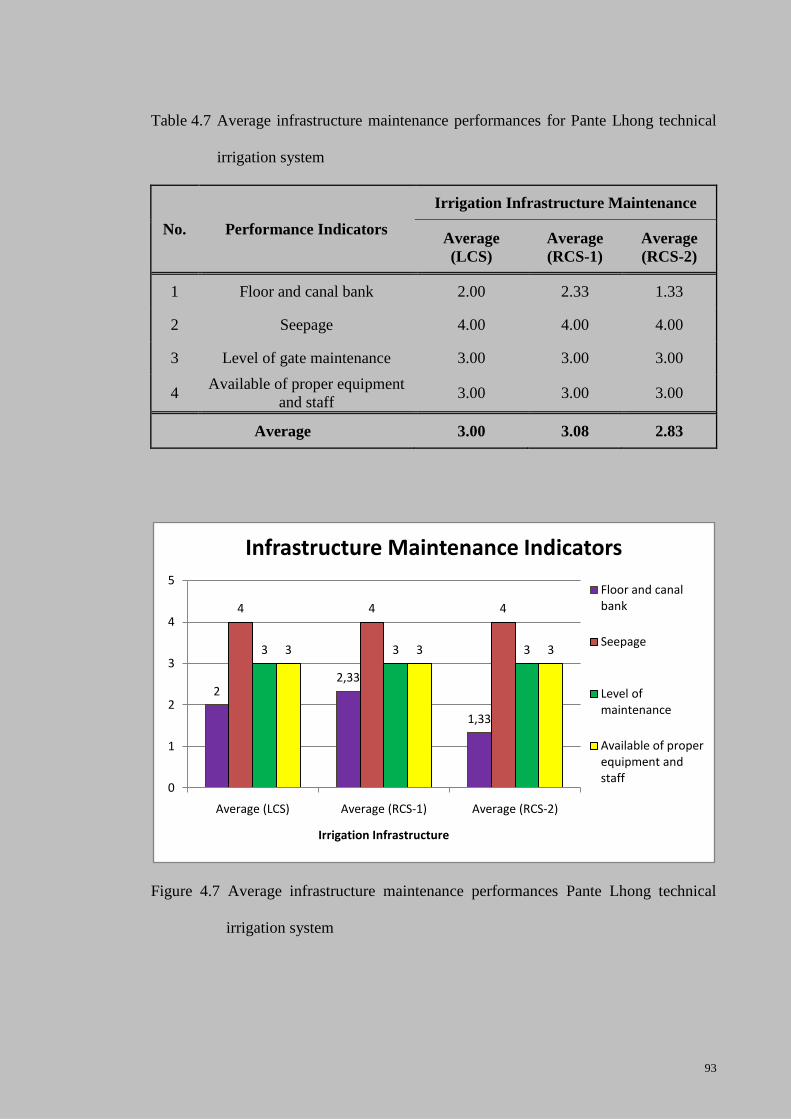
93
Table 4.7 Average infrastructure maintenance performances for Pante Lhong technical
irrigation system
No. Performance Indicators
Irrigation Infrastructure Maintenance
Average
(LCS)
Average
(RCS-1)
Average
(RCS-2)
1 Floor and canal bank 2.00 2.33 1.33
2 Seepage 4.00 4.00 4.00
3 Level of gate maintenance 3.00 3.00 3.00
4 Available of proper equipment
and staff 3.00 3.00 3.00
Average 3.00 3.08 2.83
Figure 4.7 Average infrastructure maintenance performances Pante Lhong technical
irrigation system
22,33
1,33
4 4 4
3 3 33 3 3
0
1
2
3
4
5
Average (LCS) Average (RCS-1) Average (RCS-2)
Irrigation Infrastructure
Infrastructure Maintenance Indicators
Floor and canal bank
Seepage
Level of maintenance
Available of proper equipment and staff
94
The average value for the infrastructure performance indicator was 2.97 out of 4 which
is about 74.25 % of expected serviceability (see Table 4.7), and the rate is judged as
being quite enough by the performance criteria. This average result was obtained from
the analysis of average performance of LCS, RCS-1 and RCS-2. Figure 4.7 and Table
4.7 show that the infrastructure has poor (1.89 out of 4) performance on the floor and
canal bank while, three other sub indicators have a good score of 3 (out of 4) to
excellent performance score of 4. For the floor and canal bank sub indicator, the value
of the ranking criteria is considered based on the sedimentation in the hydraulic canal
cross sectional area in which the effect on the reduction of normal cross sectional area is
recorded in percentages (i.e., a reduction of 5 to 20 % is valued as 2 and a reduction 20
% - 30 % or even more is valued at 1), in which the amount of sedimentation in the
canal cannot be removed manually but must be done by heavy equipment. A reduction
in cross sectional area of less than 5 % sedimentation can be cleaned manually by in
routine maintenance. During interviews and field survey, it was found that the reason
for the low performance of floor and canal bank is the bed load problem. These poor
conditions could be the main cause for the floor and canal bank having a low average
ranking score value of 1.89 (poor performance). The high sedimentation content in the
water supply was basically transported from surface run-off into the system, especially
when the water passes through and causes erosion of hill area during the rainy season.
However, the current canal system has a rating score value of 4 (excellent performance)
for seepage. The reason is most of the concrete lined canals exhibited good condition.
For the lined canal, there are some concrete cracks that causes the reduction of water
level or water depth (4 %, 5 % to 9 %, 10 % to 15 % and more than 16 % is valued with
a ranking score of 4, 3, 2, and 1 respectively). Another ways to assess seepage is based
95
on visual observations of the concrete lined canal surface, to observe whether surface
cracking has an effect on the level of water reduction is correlated to the RAP ranking
criteria (refer to Figure 3.5 – 3.7). The maintenance level is assessed based on routine
maintenance that is conducted by the gate operator. The decision was made based on the
visual observation on the gate condition and discussion with the gate operators. The gate
was damaged due to vandalism (gate component lost such as gate plate and staff gauge)
and is outside the consideration for performance assessment (refer to Figure 3.5 – 3.7).
Following Asawa (2005) for maintenance criteria, the current canal network conditions
might be classified as a deferred type of maintenance. In this situation, the deterioration
of the canal adversely affects the hydraulic performance. Moreover, he added that for
accumulated deferred maintenance, the canal system might deteriorate so much that
could lead to rehabilitation and maintenance. For maintenance, the Bireuen irrigation
authority has been contracted to excavate the bed load from canals amounting to a total
of 11,707 m3 (Office, 2005) and 5,953 m
3 (Office, 2006) of sediment removed, which
cost Rp. 643 million rupiahs (US$ 70,659) and Rp. 729 million rupiahs (US$ 80110) in
2005 and 2006, respectively. During these years, the authority spent a total of
Rp. 1.3 billion rupiahs (US$ 142,857) or equivalent to Rp. 246 thousand rupiahs/ha
(US$ 27/ha). This value is 1.64 times higher than the national maintenance standard
cost of Rp. 150 thousand rupiahs/ha (US$ 16.5). On the other hand, the current
evaluation in May 2009 found that the significant canal bed load was estimated to be
about 1,722 m3 from a total 19 sediment locations from a total of 69 km canal length.
Current findings are considered important to the irrigation districts office. As reported
by some researcher (Malano et al., 1999; Merret, 2002; Vandersypen et al., 2006),
maintenance of the canal system depends on the farmers and resources expended, which
96
directly relates to the water delivery service performance. For example, there are three
possible types of performance reduction which are caused by physical and structural
deterioration. Firstly, poor structural maintenance of canal and control structure has a
negative impact on their life and the ability to perform their intended function (Malano
et al., 1999). Secondly, for canal networks that faced high deposition rates, their water
supply across the network becomes inequitable and unreliable (Merret, 2002). Lastly,
adequacy would deteriorate as the irrigation networks degrade gradually over time
(Vandersypen et al., 2006).
According to Brewer and Sakthivadivel (1999), most of canal deterioration occuring in
government managed irrigation system, especially in developing countries were due to
lack of sufficient resources for maintenance. However this limitation can be overcomed
by properly conducting cost-effective analysis on irrigation maintenance (Bos et al.,
2005). It can be achieved through good practice of tracing the root cause of the
problems. The importance of maintenance and operational monitoring aspects on the
water supply can be found in Dayton Johnson (2003). He explained that performance of
good infrastructure maintenance and frequent water supply monitoring will indirectly
affect the effectiveness of the irrigation supply and contributes directly to the irrigation
service delivery performance.
4.3 Water Delivery Service Performance of the System
At this stage of evaluation, a series of indicators and sub indicators were selected from
the RAP performance standard. The internal indicator performance was water delivery
service and the sub internal indicators performance were flexibility, reliability, equity
and control of flow to costumers. An analysis was carried out to obtain the impact of the
97
canal network performance on the delivery service performance. The analysis was
focused on the continuous irrigation supply in the tertiary system delivery service and
final delivery service (refer to 1.4 Scope of Research). The tertiary area are very
complex and in this area the farmers or water user associations have responsibility to
operate, adjust, manage and organize the schedule of water and activity on-farm. In
continuous irrigation supply method, no water shortage was found during both paddy
planting seasons and the farmers may withdraw water every day from off-take
structures. The following sections describe the results that had been discovered through
the survey of water delivery service performance at LCS section. The result is presented
in Table 4.8 and Figure 4.8.
Table 4.8 shows that the result based on surveys, measurement and interview with the
farmer and field staff using RAP method rating score for water delivery service
performance indicator at the LCS and the score as average score section from each sub
section. The details of sub indicators water delivery service which contain a number of
criteria or statement description and related score value can be referred to Table 3.1. To
evaluate of this section, the LCS was divided into three sections comprising of BP.1 to
BPg.3 section, BPg.3 to BPd.8 section and BPg.3 to BT.7 (refer to Figure 4.1). From the
analysis of the data, the average performance obtained for BP.1 to BPg.3 was found to
be 2.75 out of 4 (refer to Table 4.8). Based on the classification, the rating score
performance is quite enough. In this section, the problem found was regarding the sub
indicators water delivery service performance component (see Figure.4.8). This
situation was mostly due to the insufficiency of the 1 out of 4 sub indicators to attain the
maximum operation value. As shown in Figure 4.8, the result for control of flow to
customers sub indicator was and 0.5 out 4, which is worse by the performance standard.
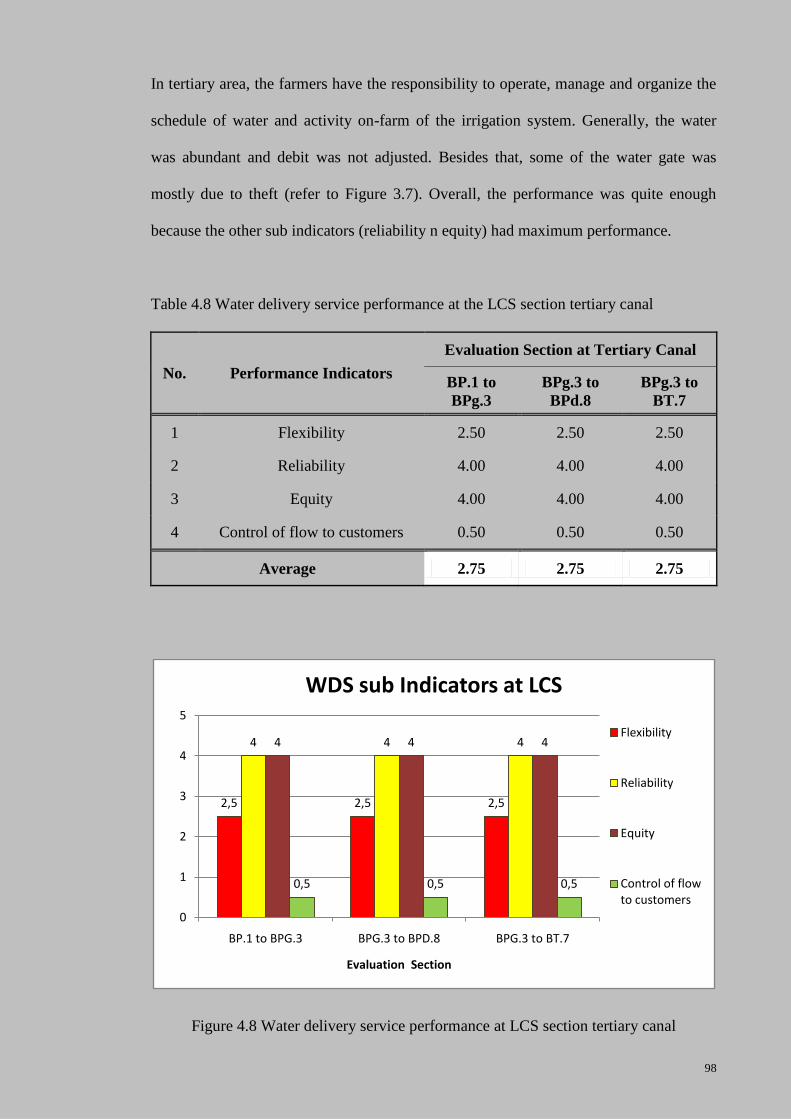
98
In tertiary area, the farmers have the responsibility to operate, manage and organize the
schedule of water and activity on-farm of the irrigation system. Generally, the water
was abundant and debit was not adjusted. Besides that, some of the water gate was
mostly due to theft (refer to Figure 3.7). Overall, the performance was quite enough
because the other sub indicators (reliability n equity) had maximum performance.
Table 4.8 Water delivery service performance at the LCS section tertiary canal
No. Performance Indicators
Evaluation Section at Tertiary Canal
BP.1 to
BPg.3
BPg.3 to
BPd.8
BPg.3 to
BT.7
1 Flexibility 2.50 2.50 2.50
2 Reliability 4.00 4.00 4.00
3 Equity 4.00 4.00 4.00
4 Control of flow to customers 0.50 0.50 0.50
Average 2.75 2.75 2.75
Figure 4.8 Water delivery service performance at LCS section tertiary canal
2,5 2,5 2,5
4 4 44 4 4
0,5 0,5 0,5
0
1
2
3
4
5
BP.1 to BPG.3 BPG.3 to BPD.8 BPG.3 to BT.7
Evaluation Section
WDS sub Indicators at LCS
Flexibility
Reliability
Equity
Control of flow to customers
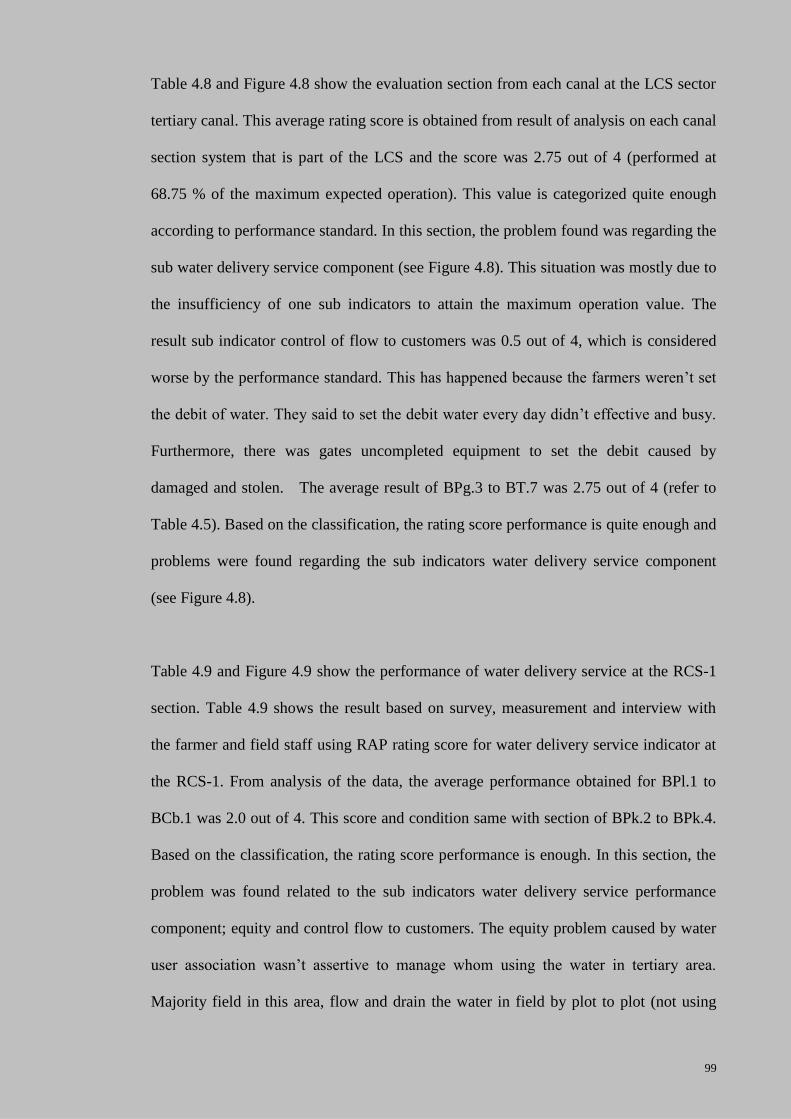
99
Table 4.8 and Figure 4.8 show the evaluation section from each canal at the LCS sector
tertiary canal. This average rating score is obtained from result of analysis on each canal
section system that is part of the LCS and the score was 2.75 out of 4 (performed at
68.75 % of the maximum expected operation). This value is categorized quite enough
according to performance standard. In this section, the problem found was regarding the
sub water delivery service component (see Figure 4.8). This situation was mostly due to
the insufficiency of one sub indicators to attain the maximum operation value. The
result sub indicator control of flow to customers was 0.5 out of 4, which is considered
worse by the performance standard. This has happened because the farmers weren’t set
the debit of water. They said to set the debit water every day didn’t effective and busy.
Furthermore, there was gates uncompleted equipment to set the debit caused by
damaged and stolen. The average result of BPg.3 to BT.7 was 2.75 out of 4 (refer to
Table 4.5). Based on the classification, the rating score performance is quite enough and
problems were found regarding the sub indicators water delivery service component
(see Figure 4.8).
Table 4.9 and Figure 4.9 show the performance of water delivery service at the RCS-1
section. Table 4.9 shows the result based on survey, measurement and interview with
the farmer and field staff using RAP rating score for water delivery service indicator at
the RCS-1. From analysis of the data, the average performance obtained for BPl.1 to
BCb.1 was 2.0 out of 4. This score and condition same with section of BPk.2 to BPk.4.
Based on the classification, the rating score performance is enough. In this section, the
problem was found related to the sub indicators water delivery service performance
component; equity and control flow to customers. The equity problem caused by water
user association wasn’t assertive to manage whom using the water in tertiary area.
Majority field in this area, flow and drain the water in field by plot to plot (not using
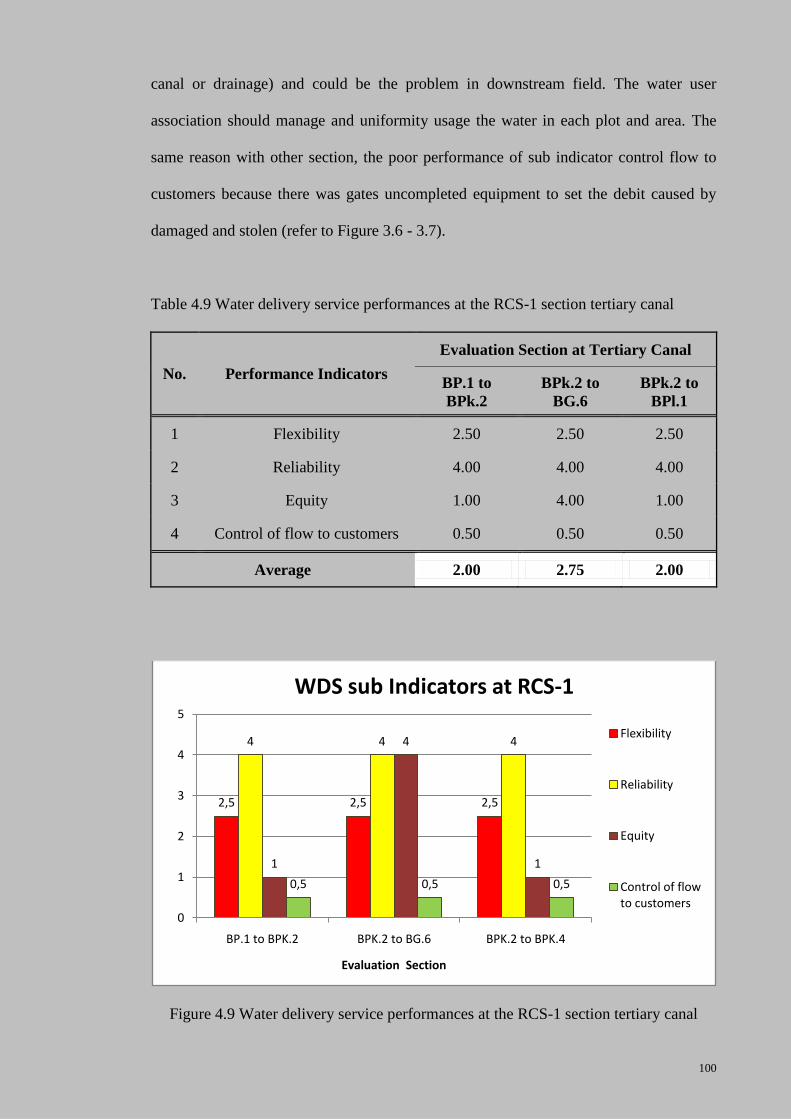
100
canal or drainage) and could be the problem in downstream field. The water user
association should manage and uniformity usage the water in each plot and area. The
same reason with other section, the poor performance of sub indicator control flow to
customers because there was gates uncompleted equipment to set the debit caused by
damaged and stolen (refer to Figure 3.6 - 3.7).
Table 4.9 Water delivery service performances at the RCS-1 section tertiary canal
No. Performance Indicators
Evaluation Section at Tertiary Canal
BP.1 to
BPk.2
BPk.2 to
BG.6
BPk.2 to
BPl.1
1 Flexibility 2.50 2.50 2.50
2 Reliability 4.00 4.00 4.00
3 Equity 1.00 4.00 1.00
4 Control of flow to customers 0.50 0.50 0.50
Average 2.00 2.75 2.00
Figure 4.9 Water delivery service performances at the RCS-1 section tertiary canal
2,5 2,5 2,5
4 4 4
1
4
1
0,5 0,5 0,5
0
1
2
3
4
5
BP.1 to BPK.2 BPK.2 to BG.6 BPK.2 to BPK.4
Evaluation Section
WDS sub Indicators at RCS-1
Flexibility
Reliability
Equity
Control of flow to customers
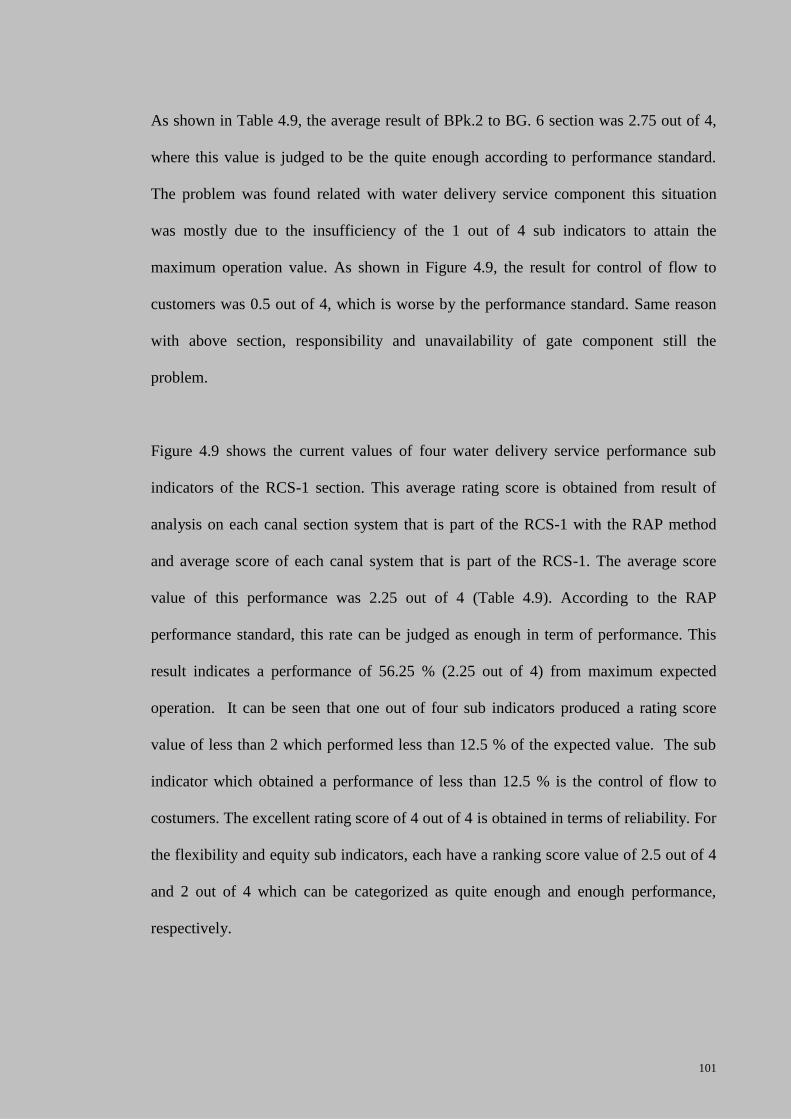
101
As shown in Table 4.9, the average result of BPk.2 to BG. 6 section was 2.75 out of 4,
where this value is judged to be the quite enough according to performance standard.
The problem was found related with water delivery service component this situation
was mostly due to the insufficiency of the 1 out of 4 sub indicators to attain the
maximum operation value. As shown in Figure 4.9, the result for control of flow to
customers was 0.5 out of 4, which is worse by the performance standard. Same reason
with above section, responsibility and unavailability of gate component still the
problem.
Figure 4.9 shows the current values of four water delivery service performance sub
indicators of the RCS-1 section. This average rating score is obtained from result of
analysis on each canal section system that is part of the RCS-1 with the RAP method
and average score of each canal system that is part of the RCS-1. The average score
value of this performance was 2.25 out of 4 (Table 4.9). According to the RAP
performance standard, this rate can be judged as enough in term of performance. This
result indicates a performance of 56.25 % (2.25 out of 4) from maximum expected
operation. It can be seen that one out of four sub indicators produced a rating score
value of less than 2 which performed less than 12.5 % of the expected value. The sub
indicator which obtained a performance of less than 12.5 % is the control of flow to
costumers. The excellent rating score of 4 out of 4 is obtained in terms of reliability. For
the flexibility and equity sub indicators, each have a ranking score value of 2.5 out of 4
and 2 out of 4 which can be categorized as quite enough and enough performance,
respectively.
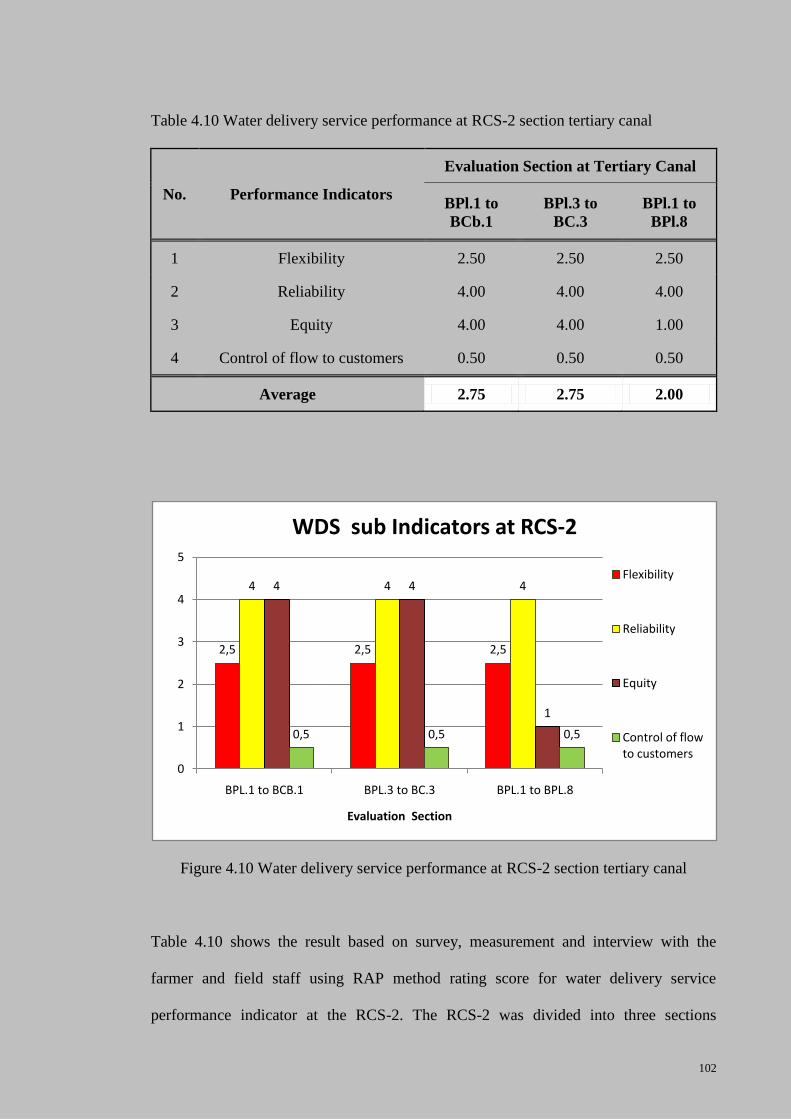
102
Table 4.10 Water delivery service performance at RCS-2 section tertiary canal
No. Performance Indicators
Evaluation Section at Tertiary Canal
BPl.1 to
BCb.1
BPl.3 to
BC.3
BPl.1 to
BPl.8
1 Flexibility 2.50 2.50 2.50
2 Reliability 4.00 4.00 4.00
3 Equity 4.00 4.00 1.00
4 Control of flow to customers 0.50 0.50 0.50
Average 2.75 2.75 2.00
Figure 4.10 Water delivery service performance at RCS-2 section tertiary canal
Table 4.10 shows the result based on survey, measurement and interview with the
farmer and field staff using RAP method rating score for water delivery service
performance indicator at the RCS-2. The RCS-2 was divided into three sections
2,5 2,5 2,5
4 4 44 4
1
0,5 0,5 0,5
0
1
2
3
4
5
BPL.1 to BCB.1 BPL.3 to BC.3 BPL.1 to BPL.8
Evaluation Section
WDS sub Indicators at RCS-2
Flexibility
Reliability
Equity
Control of flow to customers

103
comprised of BPl.1 to BCb.1 section, BPl.3 to BC.3 section and BPl.1 to BPl.8 (refer to
Figure 4.10). From the analysis of the data, the average performance obtained for BPl.1
to BCb.1 was 2.75 out of 4 and the rating score performance is quite enough. In this
section, the problem was found regarding the sub indicators water delivery service
performance component. The poor performance of control of flow to customers sub
indicator influence the performance of this section. These were performance and
condition same with section BPl.3 to BC. 3. The average results of BPl.3 to BC. 3
section was 2.75 out of 4, which this value is judged to be the quite enough according to
performance standard. The problem in this sub indicator caused by the farmer didn’t
want to adjust the water in gates.
The average result of BPl.1 to BPl.8 was 2.0 out of 4 (refer to Table 4.10). Based on the
classification, the rating score performance is enough and problems were found
regarding the sub indicators water delivery service component (see Figure.4.10). This
situation was mostly due to the insufficiency of the 1 out of 4 sub indicators to attain the
maximum operation value. As shown in Figure 4.10, the result for control of flow to
customers was 0.5 out of 4, which is worse by the performance standard.
Figure 4.10 shows that different performance values at the RCS-2 section was observed.
This average rating score is obtained from result of analysis on each canal section
system that is part of the RCS-2. The excellent rating score of 4 was obtained for the
reliability sub indicator. The average score value for the operational performance was
2.50 out of 4, which can be judged as quite enough which is 62.50 % of the maximum
expected operation. This is mainly due to the poor performance of the control of flow to
customers sub indicators, which scoring 0.5 out of 4 or 12.5 % of the expected value.
The flexibility and equity sub indicators have a ranking score value of 2.5 and 3
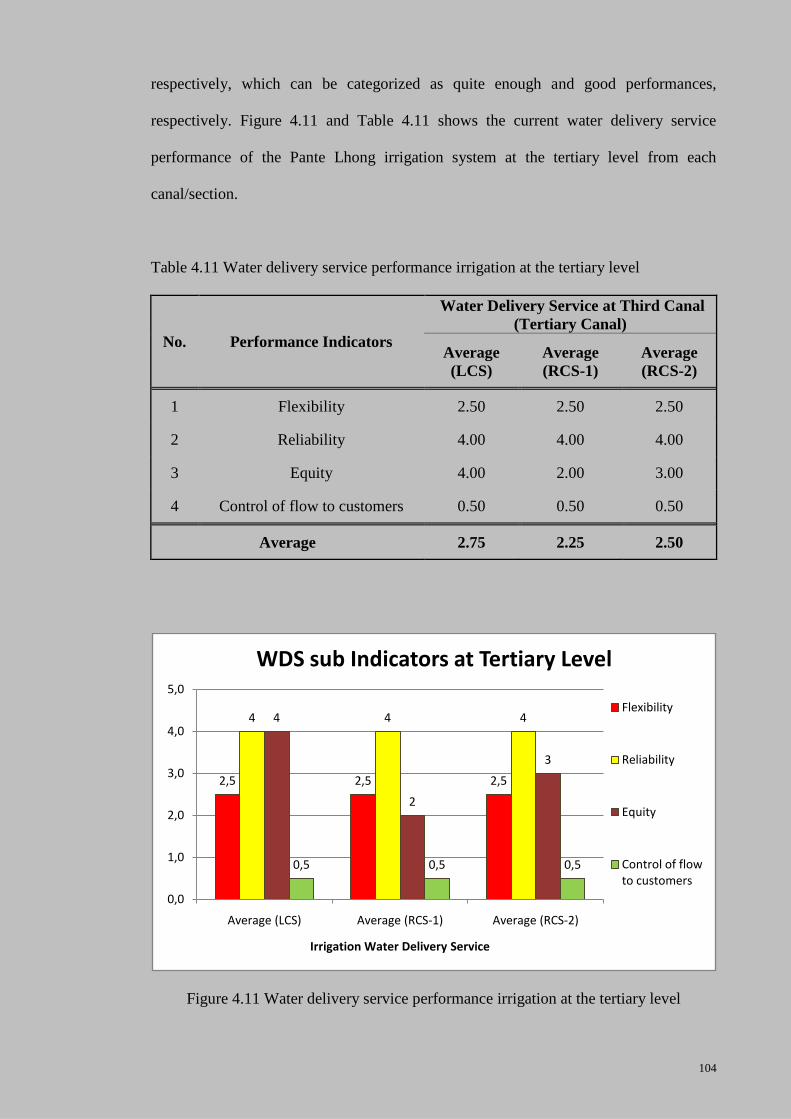
104
respectively, which can be categorized as quite enough and good performances,
respectively. Figure 4.11 and Table 4.11 shows the current water delivery service
performance of the Pante Lhong irrigation system at the tertiary level from each
canal/section.
Table 4.11 Water delivery service performance irrigation at the tertiary level
No. Performance Indicators
Water Delivery Service at Third Canal
(Tertiary Canal)
Average
(LCS)
Average
(RCS-1)
Average
(RCS-2)
1 Flexibility 2.50 2.50 2.50
2 Reliability 4.00 4.00 4.00
3 Equity 4.00 2.00 3.00
4 Control of flow to customers 0.50 0.50 0.50
Average 2.75 2.25 2.50
Figure 4.11 Water delivery service performance irrigation at the tertiary level
2,5 2,5 2,5
4 4 44
2
3
0,5 0,5 0,5
0,0
1,0
2,0
3,0
4,0
5,0
Average (LCS) Average (RCS-1) Average (RCS-2)
Irrigation Water Delivery Service
WDS sub Indicators at Tertiary Level
Flexibility
Reliability
Equity
Control of flow to customers
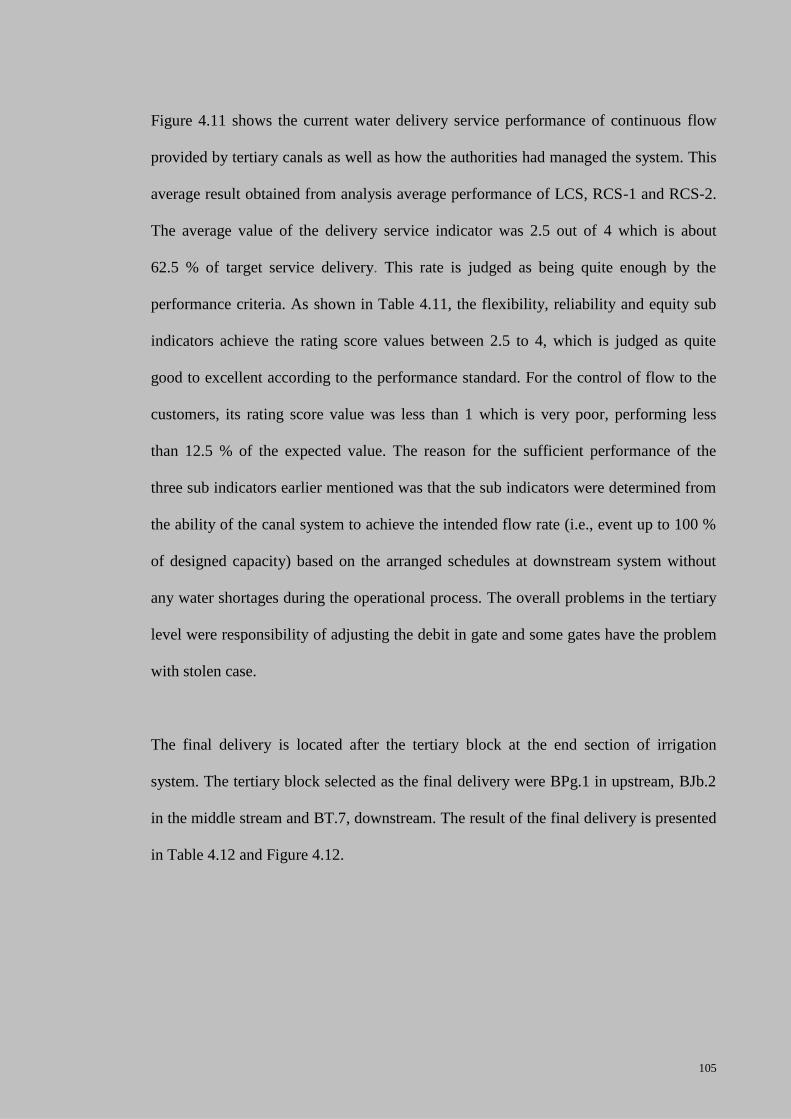
105
Figure 4.11 shows the current water delivery service performance of continuous flow
provided by tertiary canals as well as how the authorities had managed the system. This
average result obtained from analysis average performance of LCS, RCS-1 and RCS-2.
The average value of the delivery service indicator was 2.5 out of 4 which is about
62.5 % of target service delivery. This rate is judged as being quite enough by the
performance criteria. As shown in Table 4.11, the flexibility, reliability and equity sub
indicators achieve the rating score values between 2.5 to 4, which is judged as quite
good to excellent according to the performance standard. For the control of flow to the
customers, its rating score value was less than 1 which is very poor, performing less
than 12.5 % of the expected value. The reason for the sufficient performance of the
three sub indicators earlier mentioned was that the sub indicators were determined from
the ability of the canal system to achieve the intended flow rate (i.e., event up to 100 %
of designed capacity) based on the arranged schedules at downstream system without
any water shortages during the operational process. The overall problems in the tertiary
level were responsibility of adjusting the debit in gate and some gates have the problem
with stolen case.
The final delivery is located after the tertiary block at the end section of irrigation
system. The tertiary block selected as the final delivery were BPg.1 in upstream, BJb.2
in the middle stream and BT.7, downstream. The result of the final delivery is presented
in Table 4.12 and Figure 4.12.
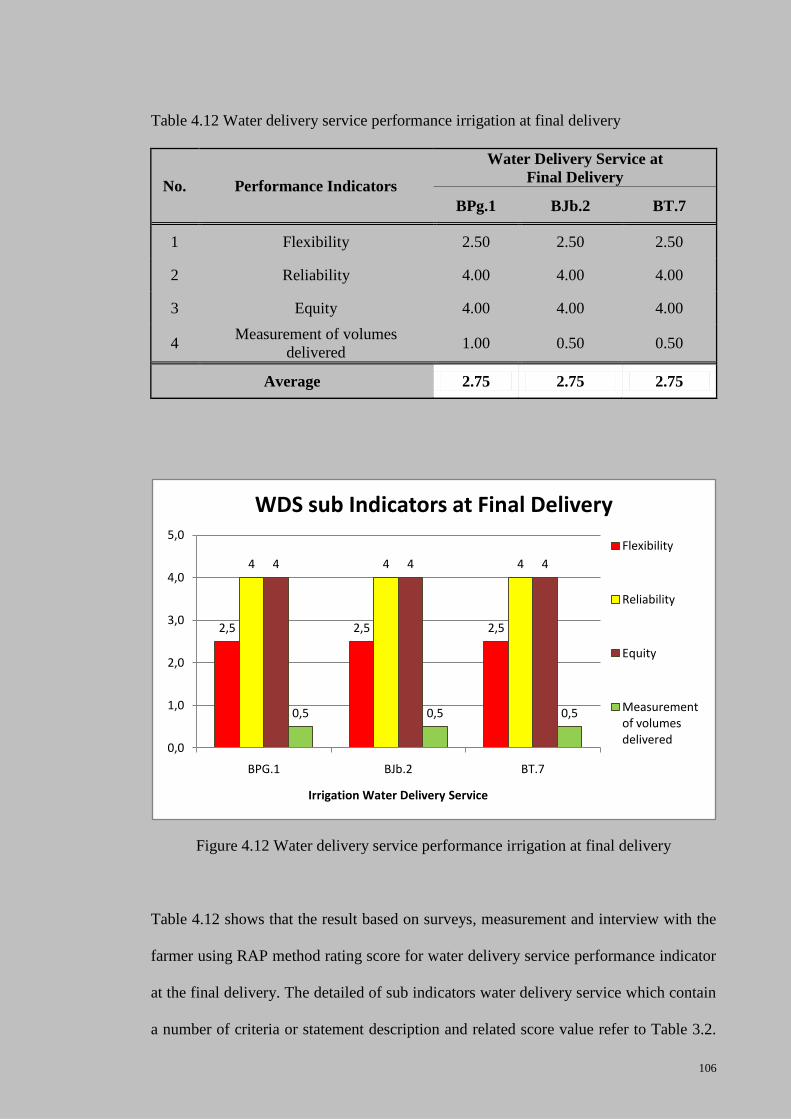
106
Table 4.12 Water delivery service performance irrigation at final delivery
No. Performance Indicators
Water Delivery Service at
Final Delivery
BPg.1 BJb.2 BT.7
1 Flexibility 2.50 2.50 2.50
2 Reliability 4.00 4.00 4.00
3 Equity 4.00 4.00 4.00
4 Measurement of volumes
delivered 1.00 0.50 0.50
Average 2.75 2.75 2.75
Figure 4.12 Water delivery service performance irrigation at final delivery
Table 4.12 shows that the result based on surveys, measurement and interview with the
farmer using RAP method rating score for water delivery service performance indicator
at the final delivery. The detailed of sub indicators water delivery service which contain
a number of criteria or statement description and related score value refer to Table 3.2.
2,5 2,5 2,5
4 4 44 4 4
0,5 0,5 0,5
0,0
1,0
2,0
3,0
4,0
5,0
BPG.1 BJb.2 BT.7
Irrigation Water Delivery Service
WDS sub Indicators at Final Delivery
Flexibility
Reliability
Equity
Measurement of volumes delivered
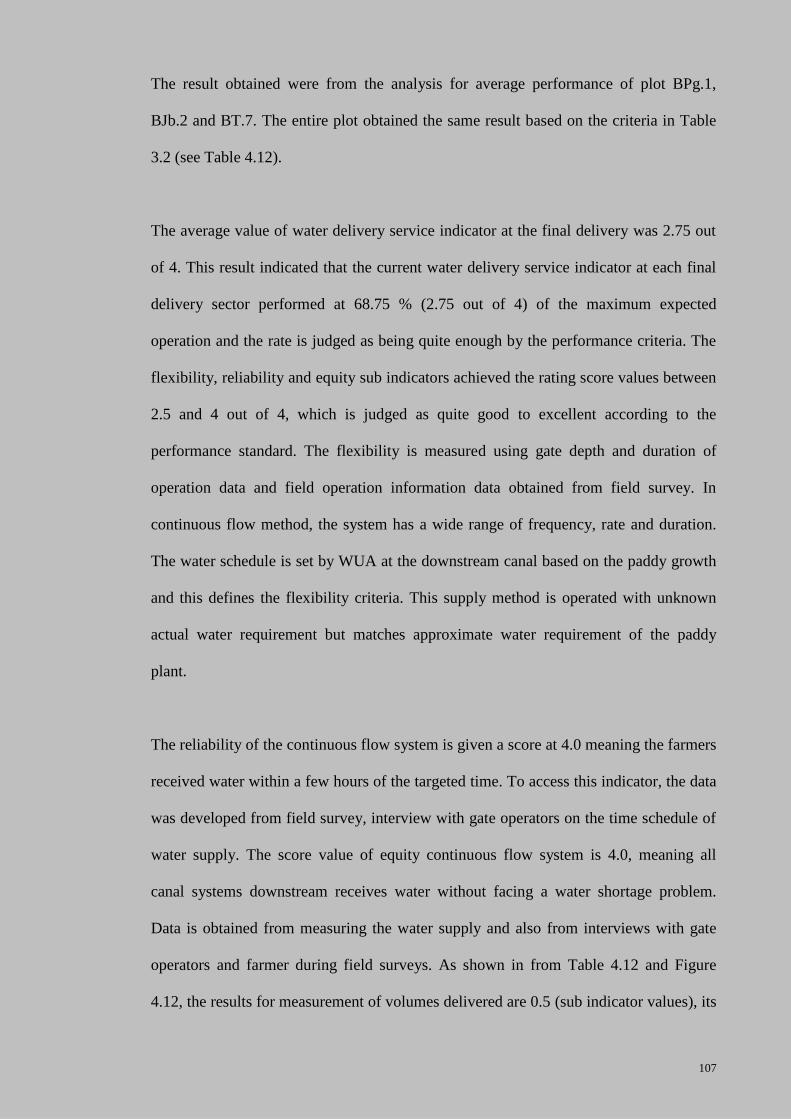
107
The result obtained were from the analysis for average performance of plot BPg.1,
BJb.2 and BT.7. The entire plot obtained the same result based on the criteria in Table
3.2 (see Table 4.12).
The average value of water delivery service indicator at the final delivery was 2.75 out
of 4. This result indicated that the current water delivery service indicator at each final
delivery sector performed at 68.75 % (2.75 out of 4) of the maximum expected
operation and the rate is judged as being quite enough by the performance criteria. The
flexibility, reliability and equity sub indicators achieved the rating score values between
2.5 and 4 out of 4, which is judged as quite good to excellent according to the
performance standard. The flexibility is measured using gate depth and duration of
operation data and field operation information data obtained from field survey. In
continuous flow method, the system has a wide range of frequency, rate and duration.
The water schedule is set by WUA at the downstream canal based on the paddy growth
and this defines the flexibility criteria. This supply method is operated with unknown
actual water requirement but matches approximate water requirement of the paddy
plant.
The reliability of the continuous flow system is given a score at 4.0 meaning the farmers
received water within a few hours of the targeted time. To access this indicator, the data
was developed from field survey, interview with gate operators on the time schedule of
water supply. The score value of equity continuous flow system is 4.0, meaning all
canal systems downstream receives water without facing a water shortage problem.
Data is obtained from measuring the water supply and also from interviews with gate
operators and farmer during field surveys. As shown in from Table 4.12 and Figure
4.12, the results for measurement of volumes delivered are 0.5 (sub indicator values), its
108
rating score value was less than 1 which is very poor, performing less than 12.5 % of
maximum target service delivery. This value is judged as bad, according to the
performance standard. These are not water measurements conducted at gate, gate
calibration, standard of procedure and gate measurement. The field survey indicates that
much water excess in the drainage system was observed visually as 20 % oversupply.
The value of 0.5 is relevant.
Based on the above evaluation, inability of the system to perform at the expected level
of service is mainly due to the control structures failure to deliver intended flow rate to
the downstream costumers as indicated by the very low rating score of 0.5. The main
reason is due to the fact that the water requirement was not calculated, application of
fixed supply method and no water measurement was done at the gate structures. It
means that the frequency, rate and duration schedule is adjusted by the downstream gate
operators/gate keepers weekly or even more at longer intervals. Generally, it depends on
the fluctuation of water used by farmers.
Therefore, although the water was abundantly available at the sources but the system
was unable to perform at maximum flexibility (2.5 out of 4) and produced overflow of
approximately 20 to 25 % as indicated by the amount of the water excess found in the
drainage canal system during operation. In general, the results show that the
performance of the water delivery service is a measure of internal processes in which
the impact the physical canal and water control conditions are factors, and it showed
how the authorities actually operated, maintained and managed the irrigation system.
However, a localized water control at the tail-end section of the Paya Geudebang/LCS
was found during the field survey. As explained in the previous section, poor
109
maintenance of the floor and canal banks (sub indicator) was considered as the main
contributing factor to the canal reduction in capacity. Nevertheless, the field survey
showed that different crop plan schedule practiced by farmers between the tertiary
blocks gave an improvement on the peak flow reduction. Field observation and
interviews with gate operators found that most of the continuous supply areas were
performing in excess of the requirement. It explains the effect of poor water
measurement performance to the costumers as well as the crop planned schedules at the
tertiary block not being properly followed by the farmers. In this situation, the excess
water caused by over supply was diverted to the tertiary drainage system.
These findings indicate that satisfactory service of reliability and equity (sub
performance indicators) were achieved through over supply. This condition might lead
to poor efficiency performance of the canal network (Unal et al., 2004). Renault and
Vehmeyer (1999) stated that good service cannot be provided with unreliable
infrastructure. They added that high level of reliability and flexibility are ideal situation.
The condition to achieve obviously, if can be concluded that reliability should be the
first priority in enhancing the performance of the irrigation system. As such, the system
with high reliability performance or high predictability is easier to manage. Moreover,
they added that equity is reflected in the way the irrigation service is spatially
distributed. Because of the physical dependability of the downstream sectors on the
upstream sectors, the quality of downstream service is highly dependent on what
happens in the upstream part of the system.
In relation to the interviews, it was found that the field staff with permanent status or as
public servants was 36.36 %, while 63.64 % were working under yearly contract status
(Table 3.6). Most of them upgraded their status usually based on length of service (more
110
than 5 years). From the investigation, it was found that the social aspect is considered
important in relation to the indicators performance. This is due to the fact that their
status relates to the amount of monthly payment, where the contract staff received less
in comparison to the permanent staff. As a result, some of them had part time activities
to overcome their financial problem. The field staff performance is directly or directly
related to the on-farm irrigation performance. Dayton-Johnson (2003) found that good
management on the irrigation system, either conducted by government or farmers,
influence the suitability of the canal operation, infrastructure maintenance and irrigation
productivity.
4.4 Crop Yield of the Farmer
The data of crop yield (productivity) was collected based on the field survey from the
selected respondents and location. The unit of measurement used for crop yield is
ton/hectare (t/ha). The number of the respondents was 81 farmers and the location was
selected at three tertiary blocks and each block consist of 27 farmers. Each block was
representative of location with block BPg.1, plot Pg.1.Kn representing the upstream
area, block BJb.2 with plot Jb.2.Kr representing the middle stream area and block BT.7
with plot T.7.Kn representing the downstream area. In each tertiary block area, the
farmers were divided into three sub areas with the same location in the area of tertiary
blocks. All of the respondents were located in the continuous supply area. The details
of the respondents are provided in APPENDIX B.
During the study, the data was collected through field observation, face to face
interview and questionnaires. The data obtained was based on the productivity/crop
yield in ton/ha during the period of 2007 -2009. The data from each farm was collected
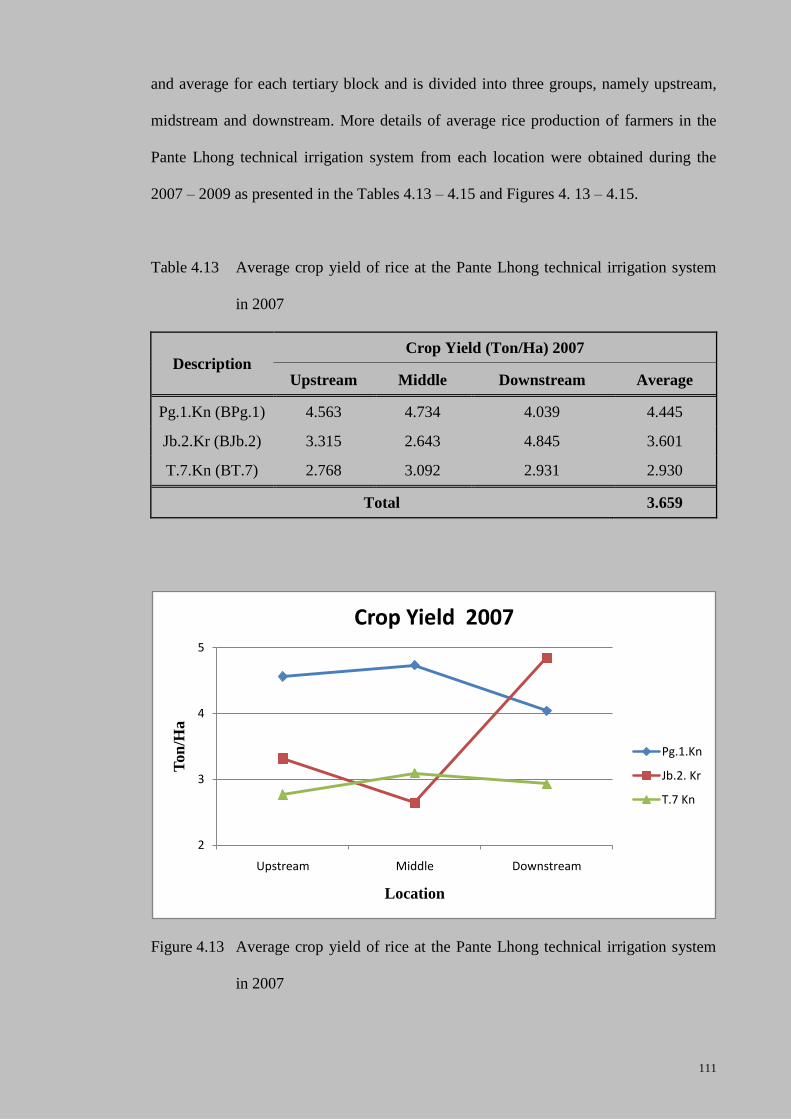
111
and average for each tertiary block and is divided into three groups, namely upstream,
midstream and downstream. More details of average rice production of farmers in the
Pante Lhong technical irrigation system from each location were obtained during the
2007 – 2009 as presented in the Tables 4.13 – 4.15 and Figures 4. 13 – 4.15.
Table 4.13 Average crop yield of rice at the Pante Lhong technical irrigation system
in 2007
Description Crop Yield (Ton/Ha) 2007
Upstream Middle Downstream Average
Pg.1.Kn (BPg.1) 4.563 4.734 4.039 4.445
Jb.2.Kr (BJb.2) 3.315 2.643 4.845 3.601
T.7.Kn (BT.7) 2.768 3.092 2.931 2.930
Total 3.659
Figure 4.13 Average crop yield of rice at the Pante Lhong technical irrigation system
in 2007
2
3
4
5
Upstream Middle Downstream
Ton
/Ha
Location
Crop Yield 2007
Pg.1.Kn
Jb.2. Kr
T.7 Kn
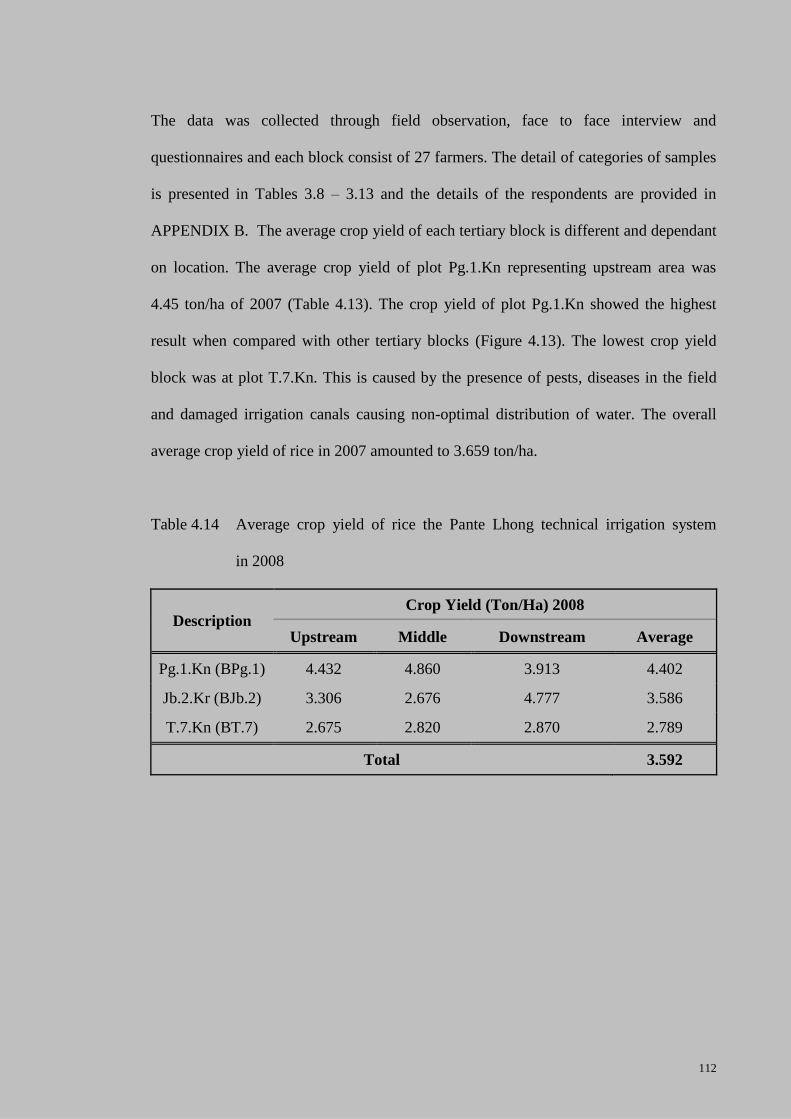
112
The data was collected through field observation, face to face interview and
questionnaires and each block consist of 27 farmers. The detail of categories of samples
is presented in Tables 3.8 – 3.13 and the details of the respondents are provided in
APPENDIX B. The average crop yield of each tertiary block is different and dependant
on location. The average crop yield of plot Pg.1.Kn representing upstream area was
4.45 ton/ha of 2007 (Table 4.13). The crop yield of plot Pg.1.Kn showed the highest
result when compared with other tertiary blocks (Figure 4.13). The lowest crop yield
block was at plot T.7.Kn. This is caused by the presence of pests, diseases in the field
and damaged irrigation canals causing non-optimal distribution of water. The overall
average crop yield of rice in 2007 amounted to 3.659 ton/ha.
Table 4.14 Average crop yield of rice the Pante Lhong technical irrigation system
in 2008
Description Crop Yield (Ton/Ha) 2008
Upstream Middle Downstream Average
Pg.1.Kn (BPg.1) 4.432 4.860 3.913 4.402
Jb.2.Kr (BJb.2) 3.306 2.676 4.777 3.586
T.7.Kn (BT.7) 2.675 2.820 2.870 2.789
Total 3.592
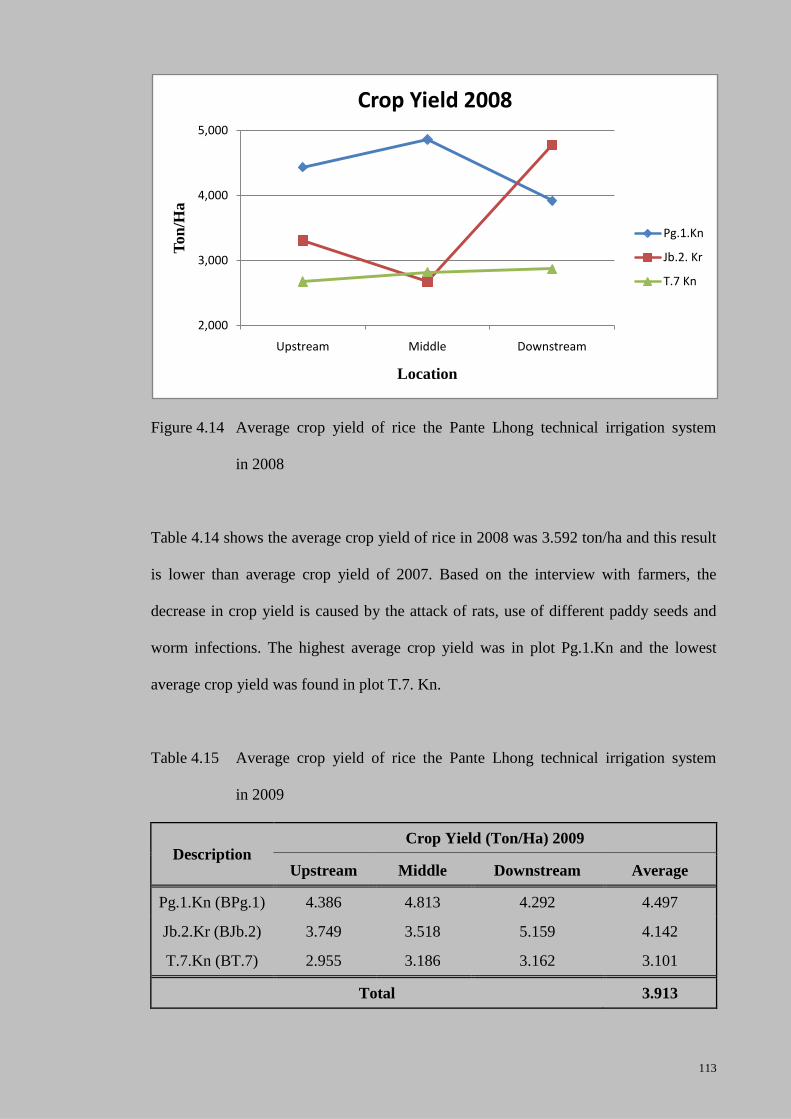
113
Figure 4.14 Average crop yield of rice the Pante Lhong technical irrigation system
in 2008
Table 4.14 shows the average crop yield of rice in 2008 was 3.592 ton/ha and this result
is lower than average crop yield of 2007. Based on the interview with farmers, the
decrease in crop yield is caused by the attack of rats, use of different paddy seeds and
worm infections. The highest average crop yield was in plot Pg.1.Kn and the lowest
average crop yield was found in plot T.7. Kn.
Table 4.15 Average crop yield of rice the Pante Lhong technical irrigation system
in 2009
Description Crop Yield (Ton/Ha) 2009
Upstream Middle Downstream Average
Pg.1.Kn (BPg.1) 4.386 4.813 4.292 4.497
Jb.2.Kr (BJb.2) 3.749 3.518 5.159 4.142
T.7.Kn (BT.7) 2.955 3.186 3.162 3.101
Total 3.913
2,000
3,000
4,000
5,000
Upstream Middle Downstream
Ton
/Ha
Location
Crop Yield 2008
Pg.1.Kn
Jb.2. Kr
T.7 Kn
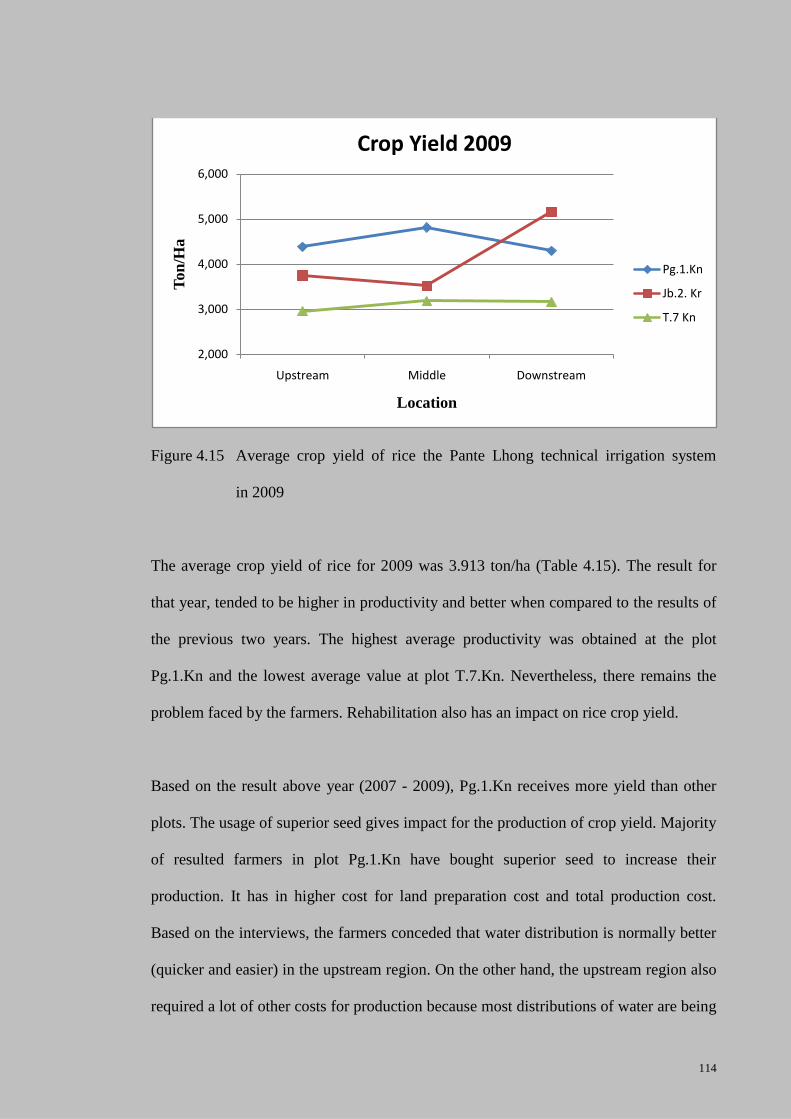
114
Figure 4.15 Average crop yield of rice the Pante Lhong technical irrigation system
in 2009
The average crop yield of rice for 2009 was 3.913 ton/ha (Table 4.15). The result for
that year, tended to be higher in productivity and better when compared to the results of
the previous two years. The highest average productivity was obtained at the plot
Pg.1.Kn and the lowest average value at plot T.7.Kn. Nevertheless, there remains the
problem faced by the farmers. Rehabilitation also has an impact on rice crop yield.
Based on the result above year (2007 - 2009), Pg.1.Kn receives more yield than other
plots. The usage of superior seed gives impact for the production of crop yield. Majority
of resulted farmers in plot Pg.1.Kn have bought superior seed to increase their
production. It has in higher cost for land preparation cost and total production cost.
Based on the interviews, the farmers conceded that water distribution is normally better
(quicker and easier) in the upstream region. On the other hand, the upstream region also
required a lot of other costs for production because most distributions of water are being
2,000
3,000
4,000
5,000
6,000
Upstream Middle Downstream
Ton
/Ha
Location
Crop Yield 2009
Pg.1.Kn
Jb.2. Kr
T.7 Kn
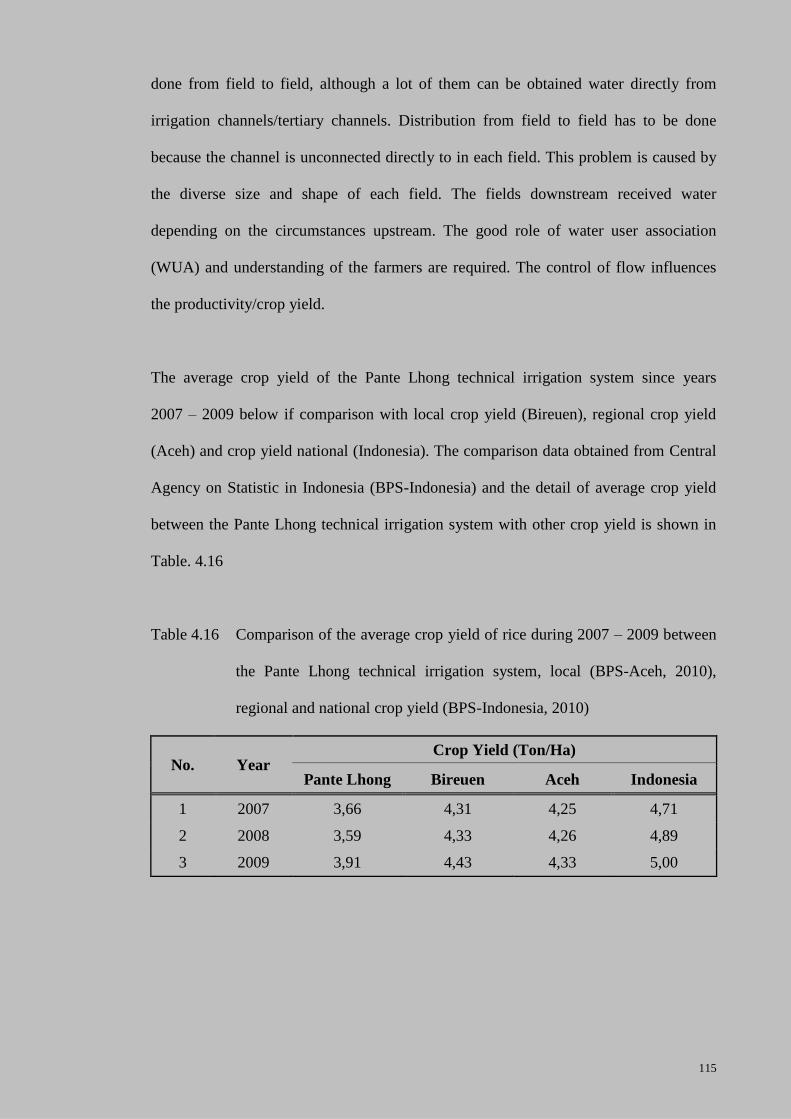
115
done from field to field, although a lot of them can be obtained water directly from
irrigation channels/tertiary channels. Distribution from field to field has to be done
because the channel is unconnected directly to in each field. This problem is caused by
the diverse size and shape of each field. The fields downstream received water
depending on the circumstances upstream. The good role of water user association
(WUA) and understanding of the farmers are required. The control of flow influences
the productivity/crop yield.
The average crop yield of the Pante Lhong technical irrigation system since years
2007 – 2009 below if comparison with local crop yield (Bireuen), regional crop yield
(Aceh) and crop yield national (Indonesia). The comparison data obtained from Central
Agency on Statistic in Indonesia (BPS-Indonesia) and the detail of average crop yield
between the Pante Lhong technical irrigation system with other crop yield is shown in
Table. 4.16
Table 4.16 Comparison of the average crop yield of rice during 2007 – 2009 between
the Pante Lhong technical irrigation system, local (BPS-Aceh, 2010),
regional and national crop yield (BPS-Indonesia, 2010)
No. Year Crop Yield (Ton/Ha)
Pante Lhong Bireuen Aceh Indonesia
1 2007 3,66 4,31 4,25 4,71
2 2008 3,59 4,33 4,26 4,89
3 2009 3,91 4,43 4,33 5,00
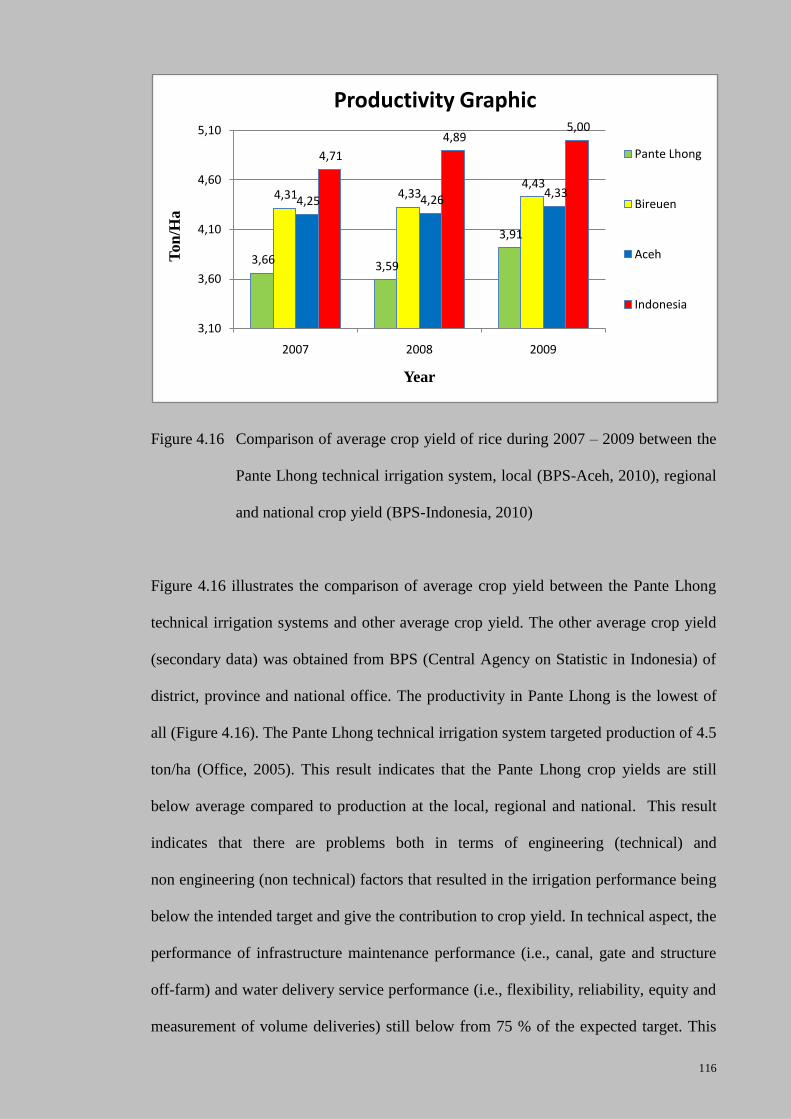
116
Figure 4.16 Comparison of average crop yield of rice during 2007 – 2009 between the
Pante Lhong technical irrigation system, local (BPS-Aceh, 2010), regional
and national crop yield (BPS-Indonesia, 2010)
Figure 4.16 illustrates the comparison of average crop yield between the Pante Lhong
technical irrigation systems and other average crop yield. The other average crop yield
(secondary data) was obtained from BPS (Central Agency on Statistic in Indonesia) of
district, province and national office. The productivity in Pante Lhong is the lowest of
all (Figure 4.16). The Pante Lhong technical irrigation system targeted production of 4.5
ton/ha (Office, 2005). This result indicates that the Pante Lhong crop yields are still
below average compared to production at the local, regional and national. This result
indicates that there are problems both in terms of engineering (technical) and
non engineering (non technical) factors that resulted in the irrigation performance being
below the intended target and give the contribution to crop yield. In technical aspect, the
performance of infrastructure maintenance performance (i.e., canal, gate and structure
off-farm) and water delivery service performance (i.e., flexibility, reliability, equity and
measurement of volume deliveries) still below from 75 % of the expected target. This
3,66 3,59
3,91
4,31 4,33 4,43
4,25 4,26 4,33
4,71
4,89 5,00
3,10
3,60
4,10
4,60
5,10
2007 2008 2009
Ton
/Ha
Year
Productivity Graphic
Pante Lhong
Bireuen
Aceh
Indonesia
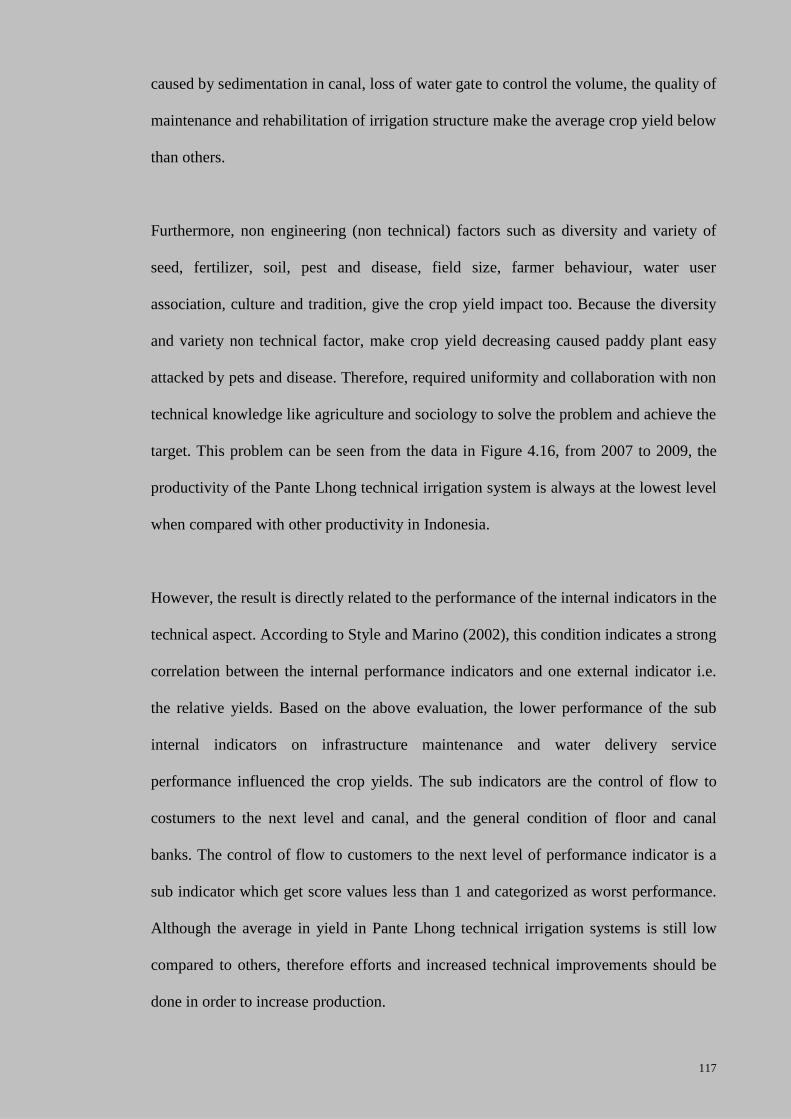
117
caused by sedimentation in canal, loss of water gate to control the volume, the quality of
maintenance and rehabilitation of irrigation structure make the average crop yield below
than others.
Furthermore, non engineering (non technical) factors such as diversity and variety of
seed, fertilizer, soil, pest and disease, field size, farmer behaviour, water user
association, culture and tradition, give the crop yield impact too. Because the diversity
and variety non technical factor, make crop yield decreasing caused paddy plant easy
attacked by pets and disease. Therefore, required uniformity and collaboration with non
technical knowledge like agriculture and sociology to solve the problem and achieve the
target. This problem can be seen from the data in Figure 4.16, from 2007 to 2009, the
productivity of the Pante Lhong technical irrigation system is always at the lowest level
when compared with other productivity in Indonesia.
However, the result is directly related to the performance of the internal indicators in the
technical aspect. According to Style and Marino (2002), this condition indicates a strong
correlation between the internal performance indicators and one external indicator i.e.
the relative yields. Based on the above evaluation, the lower performance of the sub
internal indicators on infrastructure maintenance and water delivery service
performance influenced the crop yields. The sub indicators are the control of flow to
costumers to the next level and canal, and the general condition of floor and canal
banks. The control of flow to customers to the next level of performance indicator is a
sub indicator which get score values less than 1 and categorized as worst performance.
Although the average in yield in Pante Lhong technical irrigation systems is still low
compared to others, therefore efforts and increased technical improvements should be
done in order to increase production.
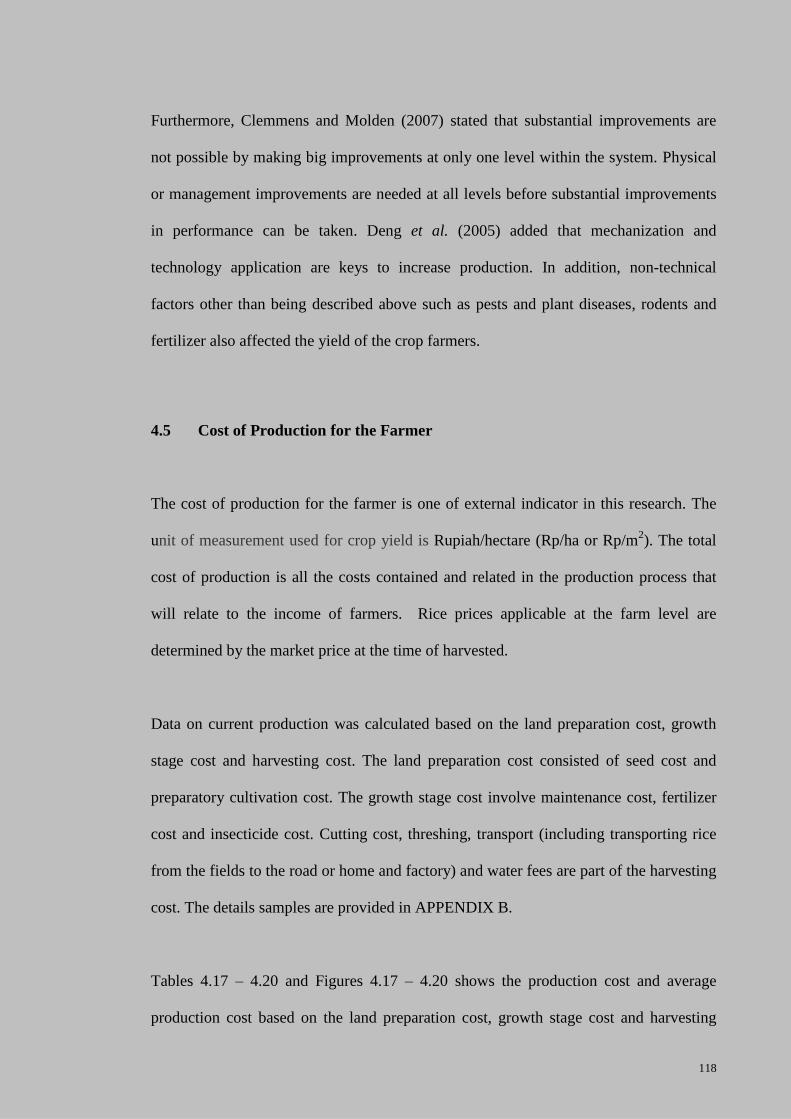
118
Furthermore, Clemmens and Molden (2007) stated that substantial improvements are
not possible by making big improvements at only one level within the system. Physical
or management improvements are needed at all levels before substantial improvements
in performance can be taken. Deng et al. (2005) added that mechanization and
technology application are keys to increase production. In addition, non-technical
factors other than being described above such as pests and plant diseases, rodents and
fertilizer also affected the yield of the crop farmers.
4.5 Cost of Production for the Farmer
The cost of production for the farmer is one of external indicator in this research. The
unit of measurement used for crop yield is Rupiah/hectare (Rp/ha or Rp/m2). The total
cost of production is all the costs contained and related in the production process that
will relate to the income of farmers. Rice prices applicable at the farm level are
determined by the market price at the time of harvested.
Data on current production was calculated based on the land preparation cost, growth
stage cost and harvesting cost. The land preparation cost consisted of seed cost and
preparatory cultivation cost. The growth stage cost involve maintenance cost, fertilizer
cost and insecticide cost. Cutting cost, threshing, transport (including transporting rice
from the fields to the road or home and factory) and water fees are part of the harvesting
cost. The details samples are provided in APPENDIX B.
Tables 4.17 – 4.20 and Figures 4.17 – 4.20 shows the production cost and average
production cost based on the land preparation cost, growth stage cost and harvesting
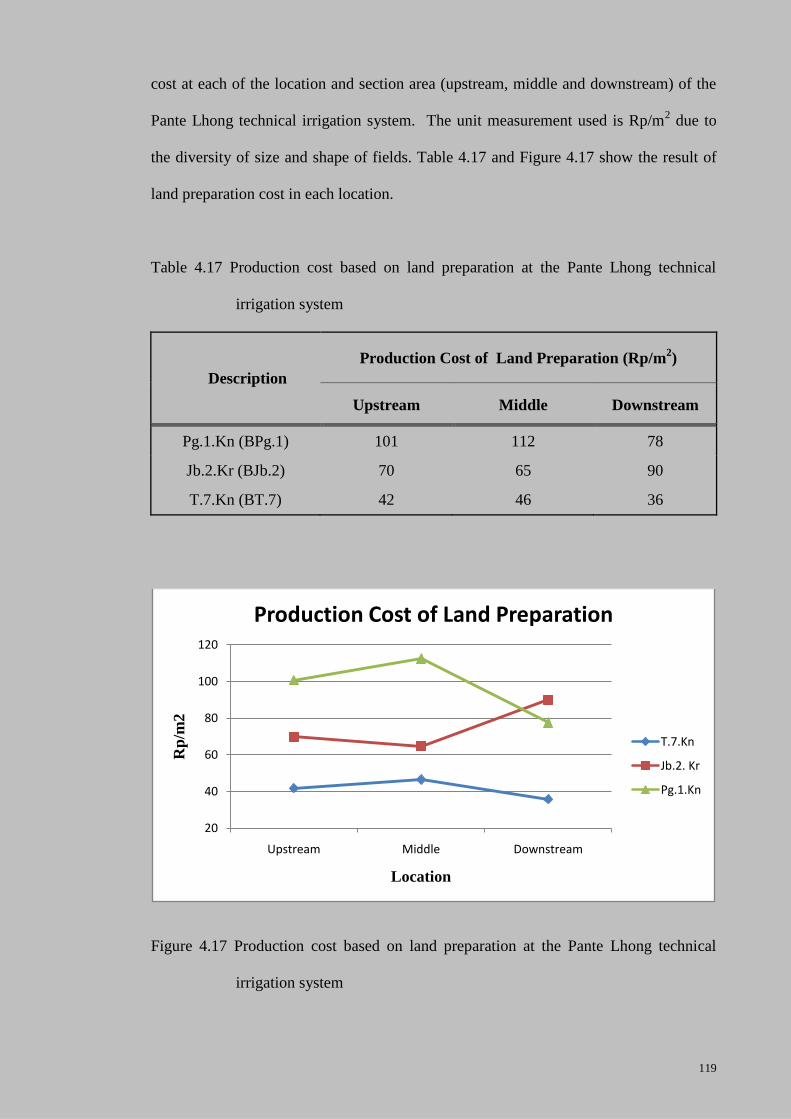
119
cost at each of the location and section area (upstream, middle and downstream) of the
Pante Lhong technical irrigation system. The unit measurement used is Rp/m2 due to
the diversity of size and shape of fields. Table 4.17 and Figure 4.17 show the result of
land preparation cost in each location.
Table 4.17 Production cost based on land preparation at the Pante Lhong technical
irrigation system
Description
Production Cost of Land Preparation (Rp/m2)
Upstream Middle Downstream
Pg.1.Kn (BPg.1) 101 112 78
Jb.2.Kr (BJb.2) 70 65 90
T.7.Kn (BT.7) 42 46 36
Figure 4.17 Production cost based on land preparation at the Pante Lhong technical
irrigation system
20
40
60
80
100
120
Upstream Middle Downstream
Rp
/m2
Location
Production Cost of Land Preparation
T.7.Kn
Jb.2. Kr
Pg.1.Kn
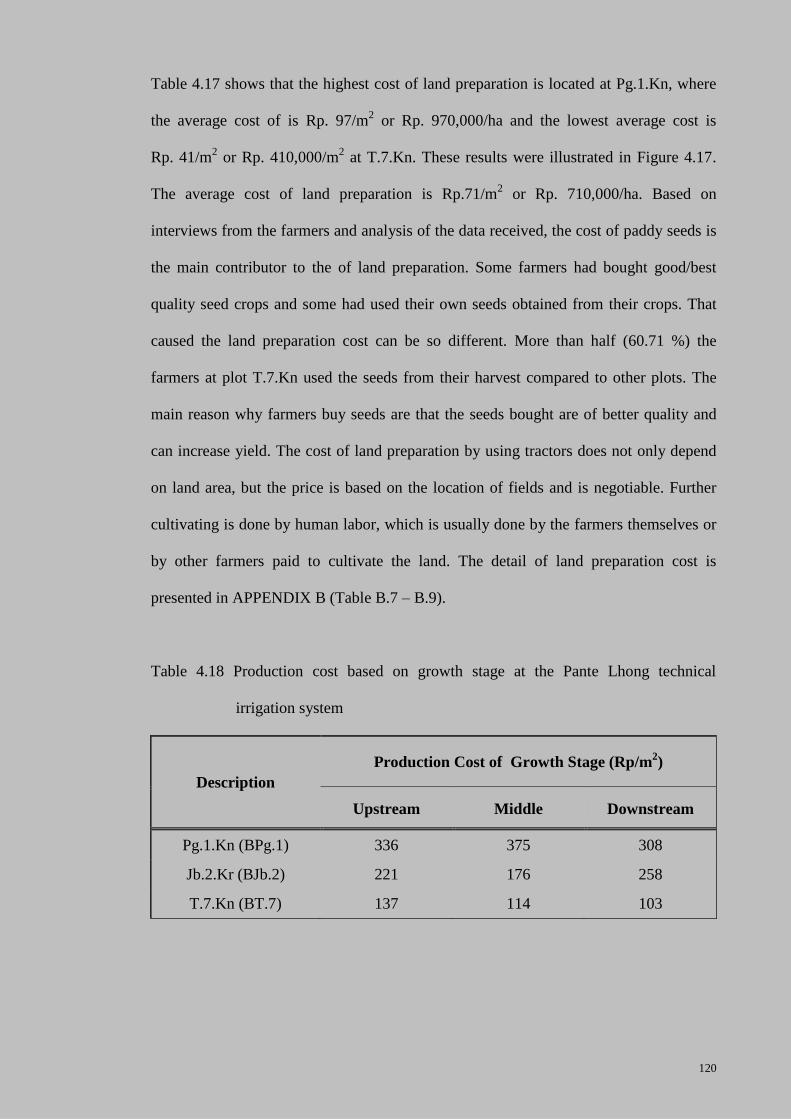
120
Table 4.17 shows that the highest cost of land preparation is located at Pg.1.Kn, where
the average cost of is Rp. 97/m2 or Rp. 970,000/ha and the lowest average cost is
Rp. 41/m2 or Rp. 410,000/m
2 at T.7.Kn. These results were illustrated in Figure 4.17.
The average cost of land preparation is Rp.71/m2 or Rp. 710,000/ha. Based on
interviews from the farmers and analysis of the data received, the cost of paddy seeds is
the main contributor to the of land preparation. Some farmers had bought good/best
quality seed crops and some had used their own seeds obtained from their crops. That
caused the land preparation cost can be so different. More than half (60.71 %) the
farmers at plot T.7.Kn used the seeds from their harvest compared to other plots. The
main reason why farmers buy seeds are that the seeds bought are of better quality and
can increase yield. The cost of land preparation by using tractors does not only depend
on land area, but the price is based on the location of fields and is negotiable. Further
cultivating is done by human labor, which is usually done by the farmers themselves or
by other farmers paid to cultivate the land. The detail of land preparation cost is
presented in APPENDIX B (Table B.7 – B.9).
Table 4.18 Production cost based on growth stage at the Pante Lhong technical
irrigation system
Description
Production Cost of Growth Stage (Rp/m2)
Upstream Middle Downstream
Pg.1.Kn (BPg.1) 336 375 308
Jb.2.Kr (BJb.2) 221 176 258
T.7.Kn (BT.7) 137 114 103
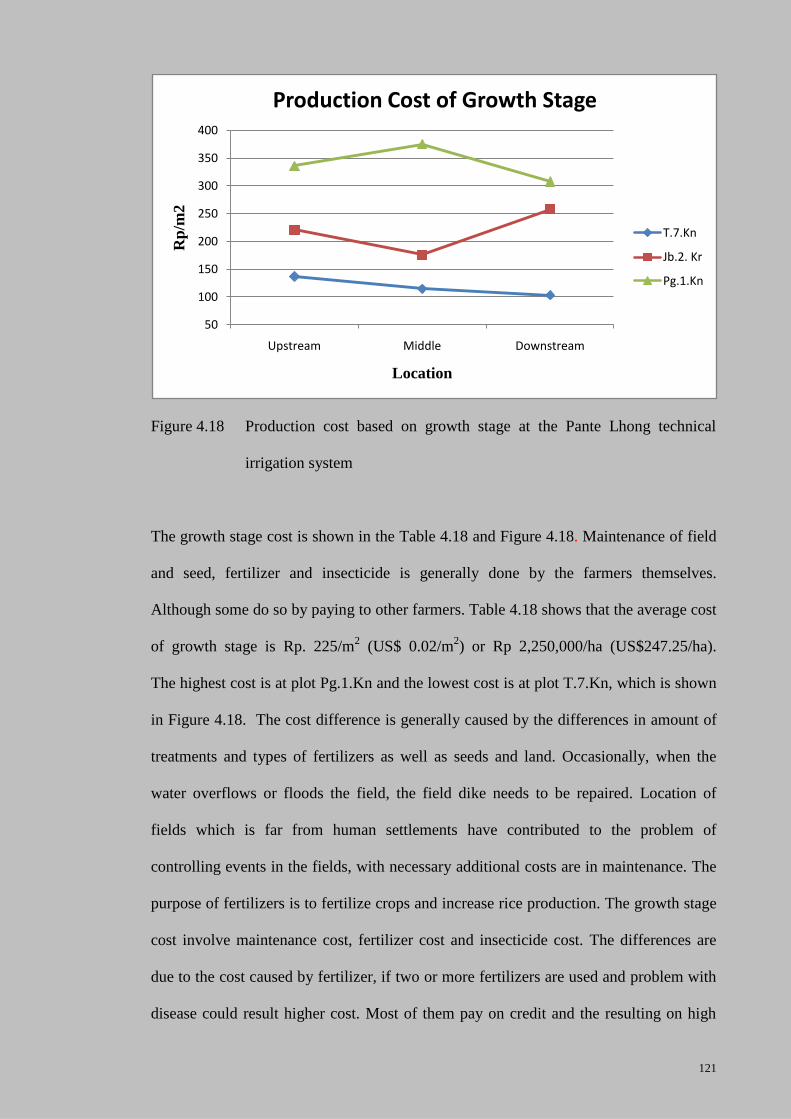
121
Figure 4.18 Production cost based on growth stage at the Pante Lhong technical
irrigation system
The growth stage cost is shown in the Table 4.18 and Figure 4.18. Maintenance of field
and seed, fertilizer and insecticide is generally done by the farmers themselves.
Although some do so by paying to other farmers. Table 4.18 shows that the average cost
of growth stage is Rp. 225/m2 (US$ 0.02/m
2) or Rp 2,250,000/ha (US$247.25/ha).
The highest cost is at plot Pg.1.Kn and the lowest cost is at plot T.7.Kn, which is shown
in Figure 4.18. The cost difference is generally caused by the differences in amount of
treatments and types of fertilizers as well as seeds and land. Occasionally, when the
water overflows or floods the field, the field dike needs to be repaired. Location of
fields which is far from human settlements have contributed to the problem of
controlling events in the fields, with necessary additional costs are in maintenance. The
purpose of fertilizers is to fertilize crops and increase rice production. The growth stage
cost involve maintenance cost, fertilizer cost and insecticide cost. The differences are
due to the cost caused by fertilizer, if two or more fertilizers are used and problem with
disease could result higher cost. Most of them pay on credit and the resulting on high
50
100
150
200
250
300
350
400
Upstream Middle Downstream
Rp
/m2
Location
Production Cost of Growth Stage
T.7.Kn
Jb.2. Kr
Pg.1.Kn
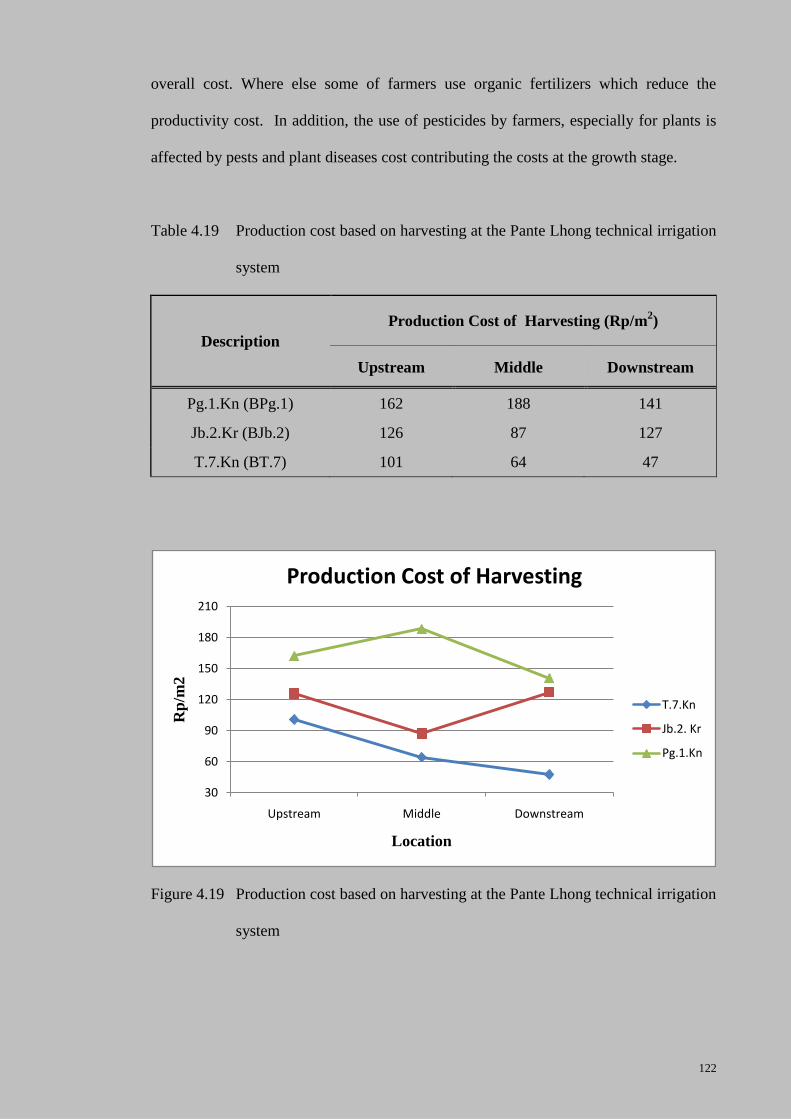
122
overall cost. Where else some of farmers use organic fertilizers which reduce the
productivity cost. In addition, the use of pesticides by farmers, especially for plants is
affected by pests and plant diseases cost contributing the costs at the growth stage.
Table 4.19 Production cost based on harvesting at the Pante Lhong technical irrigation
system
Description
Production Cost of Harvesting (Rp/m2)
Upstream Middle Downstream
Pg.1.Kn (BPg.1) 162 188 141
Jb.2.Kr (BJb.2) 126 87 127
T.7.Kn (BT.7) 101 64 47
Figure 4.19 Production cost based on harvesting at the Pante Lhong technical irrigation
system
30
60
90
120
150
180
210
Upstream Middle Downstream
Rp
/m2
Location
Production Cost of Harvesting
T.7.Kn
Jb.2. Kr
Pg.1.Kn
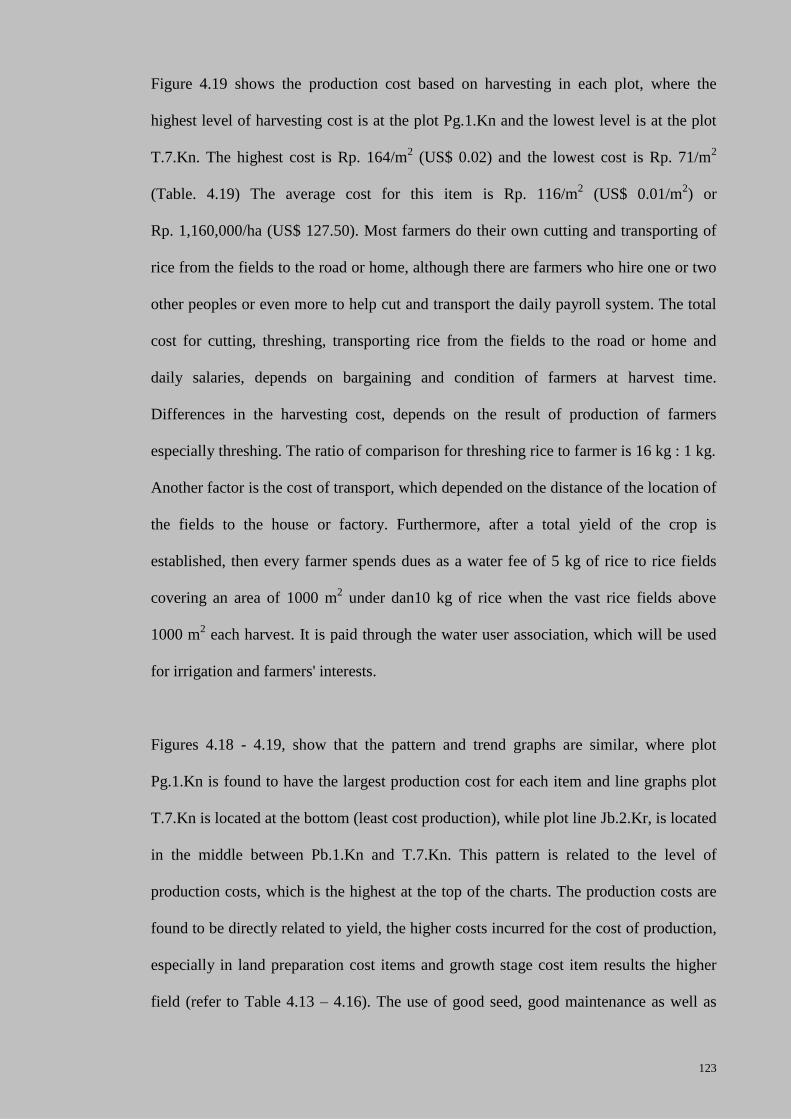
123
Figure 4.19 shows the production cost based on harvesting in each plot, where the
highest level of harvesting cost is at the plot Pg.1.Kn and the lowest level is at the plot
T.7.Kn. The highest cost is Rp. 164/m2 (US$ 0.02) and the lowest cost is Rp. 71/m
2
(Table. 4.19) The average cost for this item is Rp. 116/m2 (US$ 0.01/m
2) or
Rp. 1,160,000/ha (US$ 127.50). Most farmers do their own cutting and transporting of
rice from the fields to the road or home, although there are farmers who hire one or two
other peoples or even more to help cut and transport the daily payroll system. The total
cost for cutting, threshing, transporting rice from the fields to the road or home and
daily salaries, depends on bargaining and condition of farmers at harvest time.
Differences in the harvesting cost, depends on the result of production of farmers
especially threshing. The ratio of comparison for threshing rice to farmer is 16 kg : 1 kg.
Another factor is the cost of transport, which depended on the distance of the location of
the fields to the house or factory. Furthermore, after a total yield of the crop is
established, then every farmer spends dues as a water fee of 5 kg of rice to rice fields
covering an area of 1000 m2 under dan10 kg of rice when the vast rice fields above
1000 m2 each harvest. It is paid through the water user association, which will be used
for irrigation and farmers' interests.
Figures 4.18 - 4.19, show that the pattern and trend graphs are similar, where plot
Pg.1.Kn is found to have the largest production cost for each item and line graphs plot
T.7.Kn is located at the bottom (least cost production), while plot line Jb.2.Kr, is located
in the middle between Pb.1.Kn and T.7.Kn. This pattern is related to the level of
production costs, which is the highest at the top of the charts. The production costs are
found to be directly related to yield, the higher costs incurred for the cost of production,
especially in land preparation cost items and growth stage cost item results the higher
field (refer to Table 4.13 – 4.16). The use of good seed, good maintenance as well as
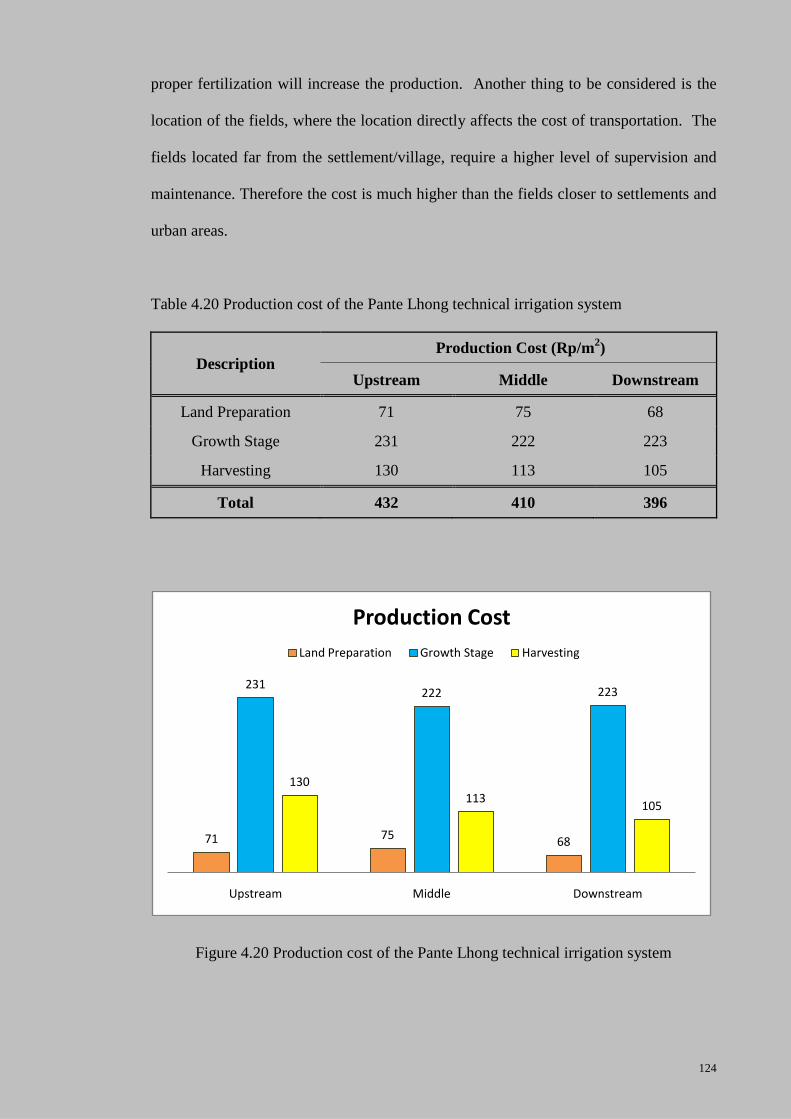
124
proper fertilization will increase the production. Another thing to be considered is the
location of the fields, where the location directly affects the cost of transportation. The
fields located far from the settlement/village, require a higher level of supervision and
maintenance. Therefore the cost is much higher than the fields closer to settlements and
urban areas.
Table 4.20 Production cost of the Pante Lhong technical irrigation system
Description Production Cost (Rp/m
2)
Upstream Middle Downstream
Land Preparation 71 75 68
Growth Stage 231 222 223
Harvesting 130 113 105
Total 432 410 396
Figure 4.20 Production cost of the Pante Lhong technical irrigation system
71 7568
231222 223
130113
105
Upstream Middle Downstream
Production Cost
Land Preparation Growth Stage Harvesting
125
The average production cost of the Pante Lhong technical irrigation system is
Rp. 412.67/m2 (US$ 0.05/m2) (Table 4.20) or Rp. 4,126,700/ha (US$ 453.48/ha).
This average value is derived from the sum of land preparation cost, growth stage and
harvesting cost, based on location (upstream, middle and downstream). Following
Sudrajat (2000), total revenues costs equal total revenues, thus the average cost of
Rp. 4,126,700 (US$ 453.48/ha) in the total cost production and price of rice used is the
market price at that time. The revenues could be used to obtain the ratio of R/C and the
result of R/C should for feasible and profitable farming (Deptan, 1999).
Therefore, the crop yield (productivity) that was produced by farmers in 2009 which
covered one hectare of land in one cycle of production in 105 days of the growing
season the average yield of rice is 3,910 kg or 3.91 ton (Table 4.16). The range price of
rice in 2009 is between Rp. 2,600/kg - Rp. 3,400/kg (US$ 0.28/kg – US$ 0.37/kg)
depending on market condition and the middle value taken is Rp. 3,000/kg
(US$ 0.33/kg). Accordingly, the income gained is Rp. 11,730,000 (US$1,289) where
only a few farmers 8.64 % that did not sell their crops due to their own consumption and
the remaining 91.36 % sold for profit and also used their crops for own consumption.
Moreover, the advantages of the rice farming are derived from the calculation of base
price multiplied by the average rice yield then divided by the total production cost. The
results of the analysis showed that the amount of the average profit earned by farmers is
Rp. 7,603,300/ha (US$ 835.50/ha) for each harvest or Rp. 72,412/ha/day
(US$ 8/ha/day). In the Pante Lhong technical irrigation system, the ownership of fields
are divided into two groups, private ownership was 70.37 % and those renting
ownership was 29.63 % (refer to Table 3.12). As for the farmer with rent ownership,
126
their profit is shared with the land owner where the workers took 2/3 part (70%) and 1/3
part (30%) for owner, where all production costs are covered by workers.
4.6 Return Of Investment (ROI)
The Return Of Investment (ROI) is a performance measure used to evaluate the
efficiency of an investment or to compare the efficiency of a number of different
investments. To calculate the ROI, the income after-tax of an investment, before interest
is divided by the cost of the investment and the result is expressed as a percentage or a
ratio. In this study, the ROI analysis approach is to evaluate the potential of farming
(growing rice) especially in its ability to provide income and incentive to farmer. The
Break Even Point (BEP) and ratio of Revenues and Cost are used to evaluate the
feasibility of the farming. The detailed calculation of R/C, BEP and ROI are shown
below.
4.6.1 Revenues and Costs Ratio (R/C)
In this research, the efficiency used is calculated as the coefficient ratio of revenues and
costs (R/C). Based on this comparison it is found that the R/C ratio is 2.84 meaning that
it is feasible to perform farming and the farmer will gain profit for Rp. 2,840 (US$ 0.31)
of each Rp, 1.000 (US$ 0.11) issued. The detail calculation of the Revenues and Costs
Ratio (R/C) is presented in Table 4.21.
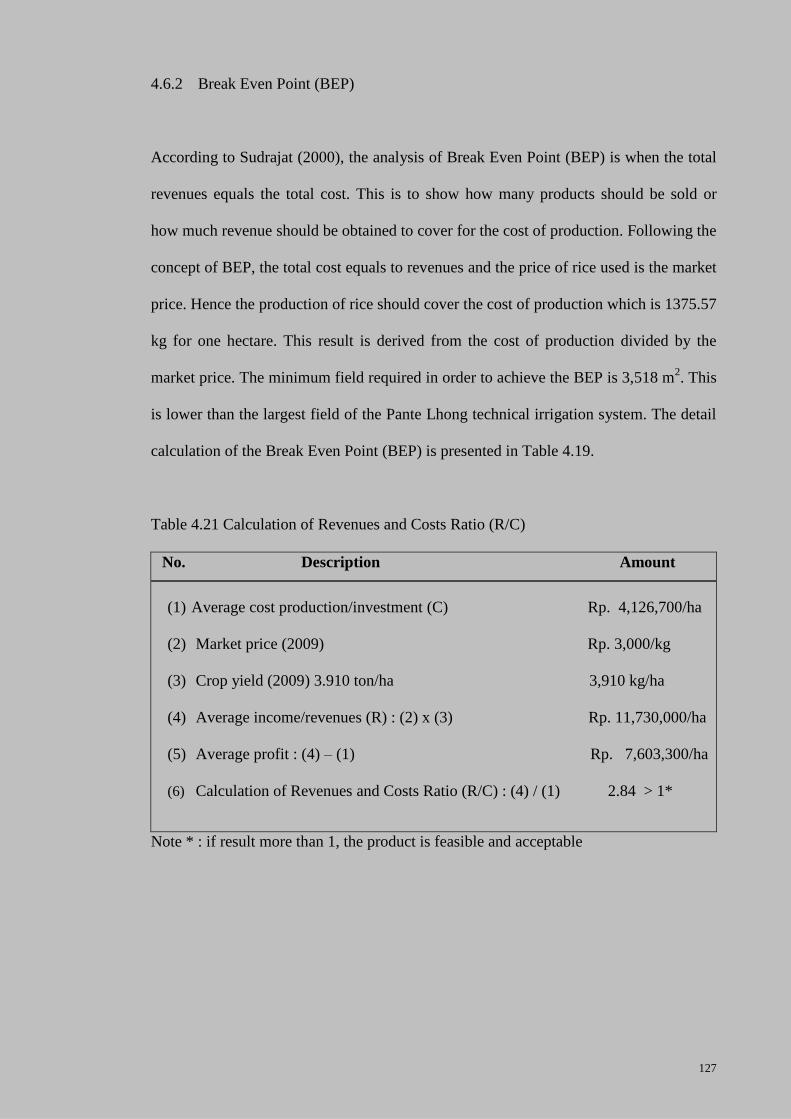
127
4.6.2 Break Even Point (BEP)
According to Sudrajat (2000), the analysis of Break Even Point (BEP) is when the total
revenues equals the total cost. This is to show how many products should be sold or
how much revenue should be obtained to cover for the cost of production. Following the
concept of BEP, the total cost equals to revenues and the price of rice used is the market
price. Hence the production of rice should cover the cost of production which is 1375.57
kg for one hectare. This result is derived from the cost of production divided by the
market price. The minimum field required in order to achieve the BEP is 3,518 m2. This
is lower than the largest field of the Pante Lhong technical irrigation system. The detail
calculation of the Break Even Point (BEP) is presented in Table 4.19.
Table 4.21 Calculation of Revenues and Costs Ratio (R/C)
No. Description Amount
(1) Average cost production/investment (C) Rp. 4,126,700/ha
(2) Market price (2009) Rp. 3,000/kg
(3) Crop yield (2009) 3.910 ton/ha 3,910 kg/ha
(4) Average income/revenues (R) : (2) x (3) Rp. 11,730,000/ha
(5) Average profit : (4) – (1) Rp. 7,603,300/ha
(6) Calculation of Revenues and Costs Ratio (R/C) : (4) / (1) 2.84 > 1*
Note * : if result more than 1, the product is feasible and acceptable
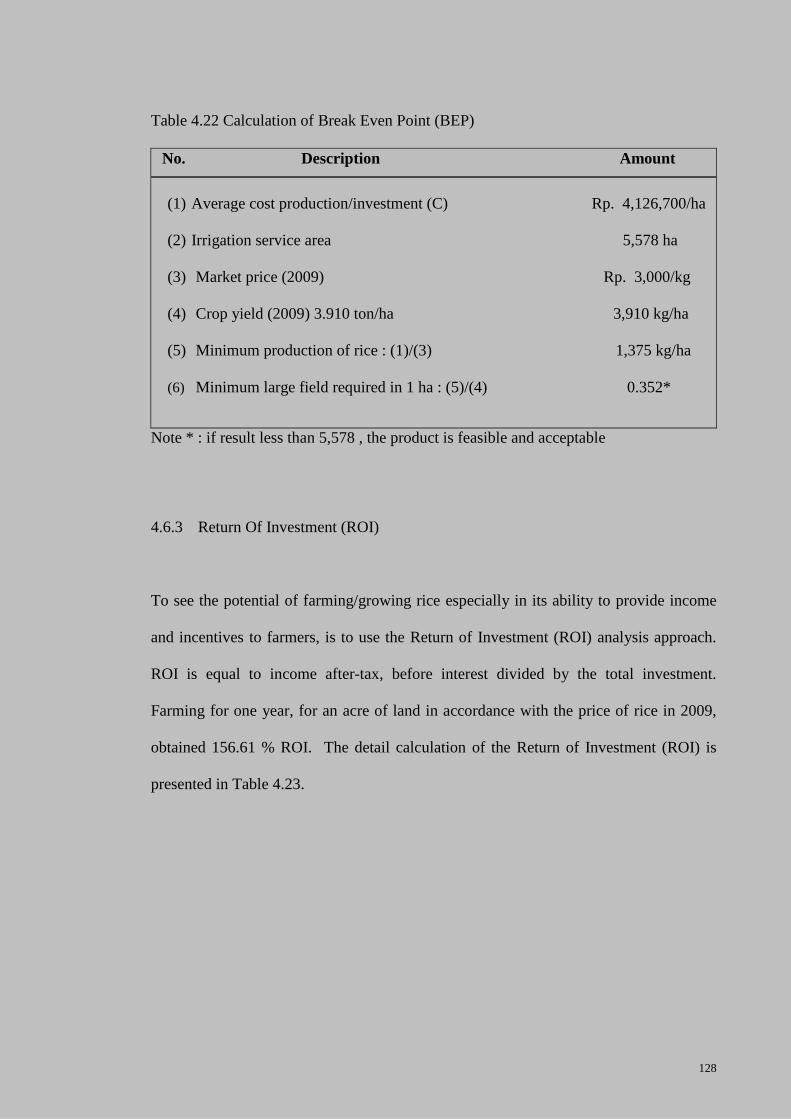
128
Table 4.22 Calculation of Break Even Point (BEP)
No. Description Amount
(1) Average cost production/investment (C) Rp. 4,126,700/ha
(2) Irrigation service area 5,578 ha
(3) Market price (2009) Rp. 3,000/kg
(4) Crop yield (2009) 3.910 ton/ha 3,910 kg/ha
(5) Minimum production of rice : (1)/(3) 1,375 kg/ha
(6) Minimum large field required in 1 ha : (5)/(4) 0.352*
Note * : if result less than 5,578 , the product is feasible and acceptable
4.6.3 Return Of Investment (ROI)
To see the potential of farming/growing rice especially in its ability to provide income
and incentives to farmers, is to use the Return of Investment (ROI) analysis approach.
ROI is equal to income after-tax, before interest divided by the total investment.
Farming for one year, for an acre of land in accordance with the price of rice in 2009,
obtained 156.61 % ROI. The detail calculation of the Return of Investment (ROI) is
presented in Table 4.23.
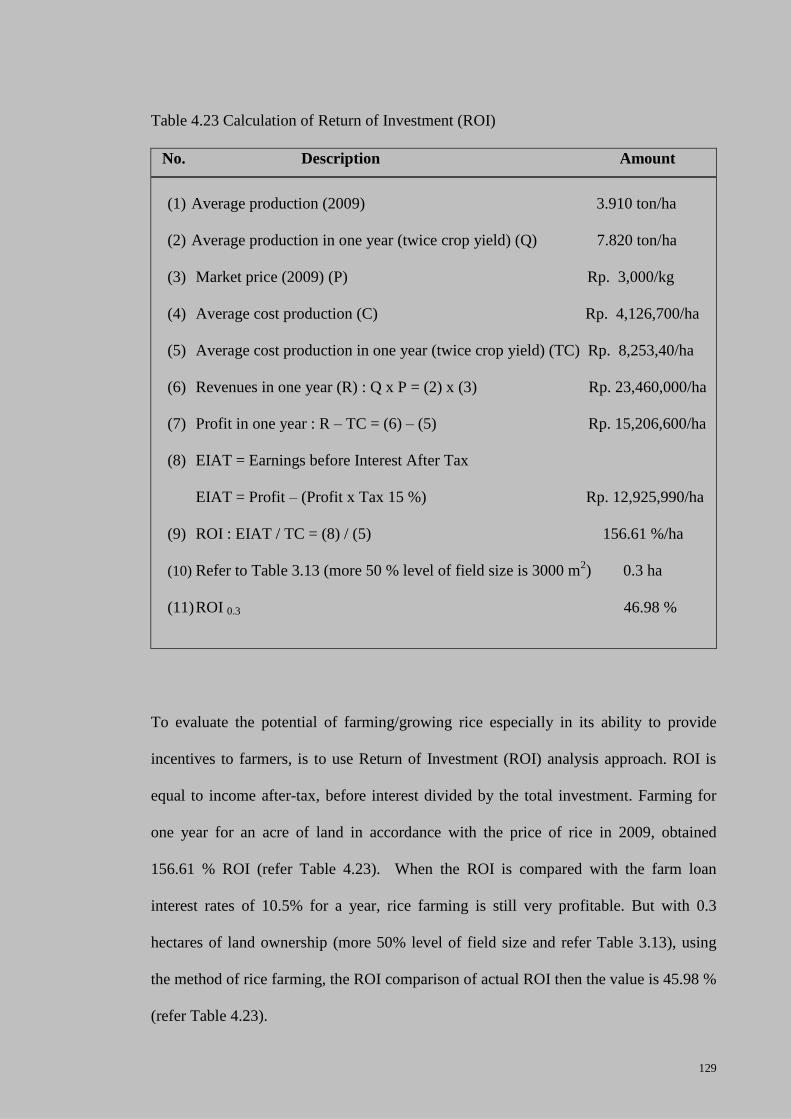
129
Table 4.23 Calculation of Return of Investment (ROI)
No. Description Amount
(1) Average production (2009) 3.910 ton/ha
(2) Average production in one year (twice crop yield) (Q) 7.820 ton/ha
(3) Market price (2009) (P) Rp. 3,000/kg
(4) Average cost production (C) Rp. 4,126,700/ha
(5) Average cost production in one year (twice crop yield) (TC) Rp. 8,253,40/ha
(6) Revenues in one year (R) : Q x P = (2) x (3) Rp. 23,460,000/ha
(7) Profit in one year : R – TC = (6) – (5) Rp. 15,206,600/ha
(8) EIAT = Earnings before Interest After Tax
EIAT = Profit – (Profit x Tax 15 %) Rp. 12,925,990/ha
(9) ROI : EIAT / TC = (8) / (5) 156.61 %/ha
(10) Refer to Table 3.13 (more 50 % level of field size is 3000 m2) 0.3 ha
(11) ROI 0.3 46.98 %
To evaluate the potential of farming/growing rice especially in its ability to provide
incentives to farmers, is to use Return of Investment (ROI) analysis approach. ROI is
equal to income after-tax, before interest divided by the total investment. Farming for
one year for an acre of land in accordance with the price of rice in 2009, obtained
156.61 % ROI (refer Table 4.23). When the ROI is compared with the farm loan
interest rates of 10.5% for a year, rice farming is still very profitable. But with 0.3
hectares of land ownership (more 50% level of field size and refer Table 3.13), using
the method of rice farming, the ROI comparison of actual ROI then the value is 45.98 %
(refer Table 4.23).
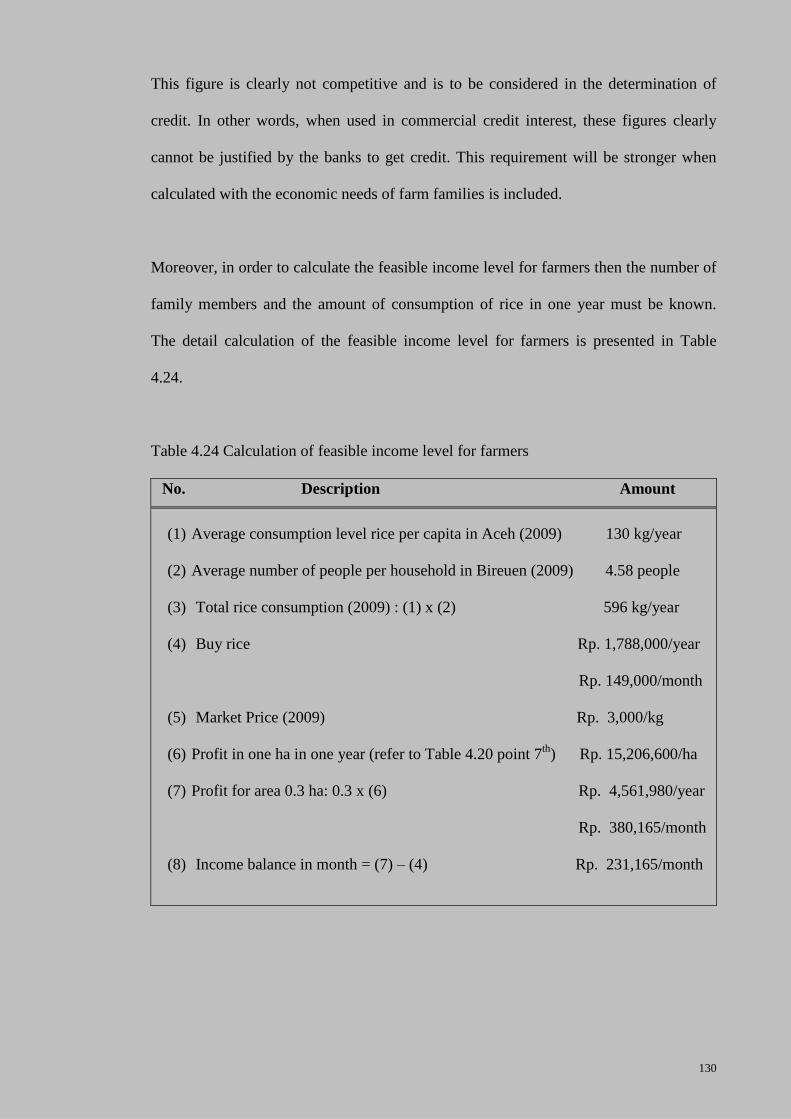
130
This figure is clearly not competitive and is to be considered in the determination of
credit. In other words, when used in commercial credit interest, these figures clearly
cannot be justified by the banks to get credit. This requirement will be stronger when
calculated with the economic needs of farm families is included.
Moreover, in order to calculate the feasible income level for farmers then the number of
family members and the amount of consumption of rice in one year must be known.
The detail calculation of the feasible income level for farmers is presented in Table
4.24.
Table 4.24 Calculation of feasible income level for farmers
No. Description Amount
(1) Average consumption level rice per capita in Aceh (2009) 130 kg/year
(2) Average number of people per household in Bireuen (2009) 4.58 people
(3) Total rice consumption (2009) : (1) x (2) 596 kg/year
(4) Buy rice Rp. 1,788,000/year
Rp. 149,000/month
(5) Market Price (2009) Rp. 3,000/kg
(6) Profit in one ha in one year (refer to Table 4.20 point 7th
) Rp. 15,206,600/ha
(7) Profit for area 0.3 ha: 0.3 x (6) Rp. 4,561,980/year
Rp. 380,165/month
(8) Income balance in month = (7) – (4) Rp. 231,165/month
131
According to BPS data for Aceh in 2009, rice consumption levels per capita in Aceh is
130 kg per year with average number of people per household 4.58 people per family.
The average total rice consumed by a family is 596 kg per year. Minimum income that
must be obtained by the farmers to be able to buy rice demand is Rp. 1,788,000/year
(US$ 196.48/year) or Rp. 149,000/month (US$16.37/month). Land area used as the
basic assumptions to calculate the income eligibility level is 3000 m2 or 0.3 ha, because
more than 50% farmers have the fields 3000 m2 (Table 3.13). Based on Table 4.24, the
average income of farmers per year in is Rp. 23,460,000/ha (US$ 2,578/ha), assuming
they planted rice twice in a year in one hectare. Based on land area assumption of
0.3 ha, the income earned by farmers is Rp. 4,561,980/year (US$ 501.31/year) or
Rp. 380,165/month (US$ 41.78/month). Thus the majority of farmers are only able to
earn a profit of Rp. 231,165/month (US$ 25.40/month). Therefore, farming is still
profitable.
The way to increase the farmer’s income is to increase the production level. As
mentioned earlier, production is closely related to the technical factors and non-
technical factors. In relation to the technical aspect, production is directly related to the
performance of the internal indicators. According to Style and Marino (2002) this
condition indicated a strongly correlation between the internal performance indicators
and one external indicator, i.e. the relative yields, where the internal or process
indicators measuring one aspect, and external or output indicators measuring the others
(Clemmens and Molden, 2007). Therefore improvements of various aspects and
indicators are needed for the well being of the farmer and his family.
132
4.6 Summary
The average value of the infrastructure maintenance performance was 2.97 out of 4,
meaning the system performed at about 74.25 % of the targeted service delivery. This
rate is judged as being quite enough by the performance standard, with the main
contributing factor caused by the bed load in the canal system. The average value of the
delivery service indicator was 2.5 out of 4 or about 62.5 % of target service delivery and
the average value of water delivery service indicator at the final delivery was 2.75 out of
4 and performed at 68.75 % of the maximum expected operation. These results indicate
that current water delivery service indicator at each level is judged as being quite
enough by the performance criteria. The inability of the system to perform at the
expected level of service is mainly contributed by the failure of control structures to
deliver the intended flow rate to the downstream costumers as indicated by the very low
rating score value.
The Pante Lhong technical irrigation system targeted crop yield was 4.5 ton/ha which
was not meet. This result shows that there are problems both in terms of engineering
(technical) and non-engineering (non technical). From the technical aspect, the
external/crop yield result is directly related to the performance of the internal indicators.
The average production cost of the Pante Lhong technical irrigation system is
Rp. 412.67/m2 (US$ 0.05/m
2) (Table 4. 17) or Rp. 4,126,700/ha (US$ 453.48/ha). Based
on this comparison it is found that the R/C ratio is 2.84. This means, paddy farming is
still a profitable venture to be developed and feasible for farmers to perform farming
with an average profit of Rp. 231,165/month (US$ 25.40/month).
133
CHAPTER V
CONCLUSIONS AND RECOMENDATIONS
5.1 Conclusions
This research is very closely related to the improved performance of irrigation and crop
yield. The increasing performance of irrigation, will lead to the increase of the crop
yield. The increasing of crop yield will give impact and benefit to improving the living
standard of the farmers and Indonesia’s economy because agriculture is activity and
output constitute a major contribution to Indonesia's GDP and eventually being able to
fulfill food supply to the world community. This research has also added some
knowledge and methods in terms of assessment and improvement of performance of an
irrigation system. Based on the evaluation of various performance indicators, the
following conclusions can be drawn:
1. The results of infrastructure maintenance indicators using the RAP method
showed that the infrastructure performances indicator was 2.97 out of 4,
meaning the system performed about at 74.25 % of the expected infrastructure
maintenance. This rate was judged as being quite enough by the performance
criteria. This value demonstrated a sufficient routine maintenance for canal
network is required by the irrigation authority. However, the floor and canal
bank (sub indicator) has a rating score value of less than 2 which is less than 50
% of the maximum possible value, which is judged as poor. The performance of
the Pante Lhong technical irrigation is still below target.
134
2. The results found that the average value of the water delivery service indicator at
the tertiary canal was 2.5 out of 4 or the system performed at about 62.5 % of
the target service delivery. This rate was judged as being quite enough by the
performance criteria. The results also found that the sub indicator of flexibility,
reliability and equity of water distribution achieved was judged as quite enough
to excellent according to the performance standard. These findings indicated that
satisfactory reliability of service and equity sub indicators were achieved
through the practice of oversupply. However, for the sub indicator of flow to the
next level sub performance was only at 12.5 % of the expected performance
which is judged as rather low. The performance of the Pante Lhong technical
irrigation is still below target.
3. The average value of water delivery service indicator obtained at the final
delivery was 2.75 out of 4. This result indicate that the current water delivery
service indicator at each final delivery sector performed at 68.75 % of the
maximum possible operation and the rate is judged as being quite enough by the
performance criteria. The performance of the Pante Lhong technical irrigation is
below target. The results for measurement of volume delivered were less than 1
constituting a very poor performance which was equivalent to less than 12.5 %
of the expected value.
4. For the crop yield indicator, the average maximum productivity for yield was
3.913 ton/ha. The results revealed that the productivity level was low relative to
the irrigation objective and this result indicate that the Pante Lhong technical
irrigation system crop yield was still below average when compared to the
production standard at the local, regional and national levels. However, this
135
result is directly related to the performance of the internal indicators in the
technical aspect.
5. According to the production level the total income was Rp.11,730,000/ha
(US$ 1289/ha) and the production cost at the Pante Lhong technical irrigation
system was Rp. 4,126,700/ha (US$ 453.48/ha). The amount of the average profit
earned by farmers was Rp. 7,603,300/ha (US$ 835.53) for each harvest.
Therefore, it can be concluded that paddy farming is still profitable and feasible.
This conclusion results from the analysis of the coefficient ratio of Revenues and
Costs (R/C) of more than 1, the majority of farmers were able to obtain profit
monthly with the minimum field size of 3,158 m2 was required to achieve the
Break Even Point (BEP) and Return on Investment (ROI) was obtained
156.61 %. Farming is therefore still profitable and feasible to be developed.
6. The Internal Indicators comprising of infrastructure maintenance performance
and water delivery service performance influence and correlate with external
indicators related to crop yield and production cost. The performance of
irrigation is determined by the canal conditions and crop yield. These findings
indicate that irrespective of the water supply method, the performance of
irrigation was determined by the main system performance (i.e., canal, structure
and gate) and crop yield.
Based on the conclusions obtained above, all the objectives set for this research as
referred to in section 1.3 have been fully carried out and the results successfully
achieved.
136
5.2 Recommendations
The recommendation given will be presented in two sections where the first section is
related to the research scope finding, it’s for future works that can be carried out. The
following recommendation can be given:
1. For future research, to improve the findings the number of locations, sample and
respondents should be increased. More data can then be analyzed and used
where the results obtained would be more representative of the actual scenario.
2. For improvement on the research of rotation supply method, the institutional
aspects related to the staffs and water user association should included in the
assessment as part of the internal indicator of irrigation systems.
3. The present study manages to collect data for a period of two growing seasons.
As an enhancement to the data collection it is suggested that it be carried out for
more number of growing seasons, i.g. 4 numbers. This will improve the
evaluation for comparative performance and the output in each cropping season.
Based on the research in the Pante Lhong technical irrigation system and the results,
further recommendation related to the farming activities is outlined as below:
1. The Pante Lhong technical irrigation system has to increase its performance with
proper evaluation of the irrigation system component to achieve the target
production and the target service performance.
137
2. The use of RAP method depended on the understanding of the operator surveyor
of the content of the RAP and knowledge of irrigation. However, the later value
will be subjective to engineering interpretation.
3. There should be further research on the Pante Lhong technical irrigation system
using other methods and systems, for comparison to be made between the
methods used and relevance of its applicability.
4. The irrigation assessment especially for large irrigation (more than 3000 ha) is
necessary to determine the extent of regulation, use, and maintenance of the
water. Improvements in strategic planning and enhancements in irrigation
performance will increase the efficiency in water use and thus increase the food
production which are important dimensions of food security.
Hopefully the findings conclusions, recommendations and suggestions obtained and
outlined may be useful input for further research, and to provide improve knowledge
and contribution in evaluating and increasing the production of irrigation system.
138
REFERENCES
Asawa, G. L. (2005). Irrigation and Water Resources Engineering. New Delhi: New
Age International (P) Ltd., Publishers.
BBSRC. (2011). Global Food Security Strategic Plan 2011-2016 [Electronic Version],
from www.foodsecurity.ac.uk
Bhatta, K. P., Ishida, A., Taniguchi, K., and Sharma, R. (2005). Performance of
Agency-Managed and Farmer-Managed Irrigation Systems: A Comparative
Case Study at Chitwan, Nepal Journal of Irrigation and Drainage Systems Vol.
20 p. 177 – 191.
Bos, M. G. (1997). Performance Indicators for Irrigation and Drainage. Irrigation and
Drainage Systems, Vol. 11, p 119 – 137.
Bos, M. G., Burton, M. A., and Molden, D. J. (2005). Irrigation and Drainage
Performance Assessment: Practical Guidelines. UK: CABI Publishing.
Bosch, V., Hoevenaars, J., Brouwer, C., and Hatcho, N. (1993). Irrigation Water
Management. In Training Manual No. 8, Structures for Water Control and
Distribution (pp. 76 pp.). Roma,: Provisional Edition, FAO.
BPS-Aceh. (2010). Aceh Dalam Angka 2010 (Aceh in Figures 2010) Banda Aceh,
Indonesia: Badan Pusat Statistik Provinsi Aceh.
BPS-Indonesia. (2010). The National Productivity of Paddy in Indonesia (Publication.,
from Central Agency on Statistic in Indonesia: http://www.bps.go.id/.
Brewer, J. D., and Sakthivadivel, R. (1999). Maintenance Management Process: A Key
Factor in Maintenance Improvement under Resource Constraint. Irrigation and
Drainage Systems, Vol. 13, p. 207-227.
Burt, C. (2003). Rapid Appraisal Process (RAP) and Benchmarking Explanation and
Tools. Retrieved. from (http://www.watercontrol.org/tools/rap-eng-
2002/files/RapidAppraisalProcess(RAP)_and_Benchmarking_revised_April_
18_2003_doc).
Burt, C., and Fecon. T. (2001). Rapid Appraisal Process (RAP) and Benchmarking:
Explanation and Tools Paper presented at the Food and Agriculture
Organization of the United Nations, FAO Regional Office for the Asia and
Pacific. from www.watercontrol.org.
Burt, C. M. (1995). Guideline for Establishing Irrigation Scheduling Policy. Paper
presented at the Theme V: Interaction between Water Delivery and Irrigation
Scheduling ICID FAO Workshop, 12-13 September 1995. from
www.itrc.org/papers/guideforestirrschpolicies/guideforestirrschpolicies.pdf.
139
Burt, C. M. (1996). Modern Water Control and Management Practices in Irrigation:
Methodology and Criteria for Evaluating the Impact on Performance. Paper
presented at the Proceeding of the Expert Consultation on Modernization of
Irrigation Schemes: Past Experience and Future Options, 26-29 November
1996, Bangkok, Thailand.
Burt, C. M. (2004). Irrigation District Modernization in The U.S and Worldwide Paper
presented at the Irrigation Systems Performance Proceedings of 2nd
WASAMED (WAter SAving in MEDiterranean agriculture) Workshop , 24-28
June 2004, Hammamet, Tunisia.
Burt, M. C., and Styles, S. W. (2004). Conceptualizing Irrigation Project Modernization
Through Benchmarking and The Rapid Appraisal Process. Irrigation and
Drainage Systems, Vol. 53, p. 145-154.
Burton, M., Newcombe, W., Dedja, Y., and Ey, T. (2003). Development and
Application of Simplified Asset Management Procedures for Transferred
Irrigation Systems. Jounal of Irrigation and Drainage Systems, Vol. 17 p. 87 -
108.
Chandrasekaran, B., Annaduran, K., and Kavimani, R. (2008). Rice Science. India:
Pawan Kumar Scientific Publisher.
Clemmens, A. J., and Molden, D. J. (2007). Water User and Productivity of Irrigation
Systems. Journal of Irrigation Science Vol. 25, p. 247 – 261.
Clemmens, A. J., Dedrick, A. J., Clyma, W., and Ware, R. E. (2000). On-Farm System
Performance in The Maricopa-Stanfield Irrigation and Drainage District Area.
Journal of Irrigation and Drainage Systems, Vol. 14, p. 93–120.
Daniel, R., Thierry, F., and Robina, W. (2007). Modernizing Irrigation Management –
the MASSCOTE Approach: Mapping System and Services for Canal Operation
Techniques. FAO Irrigation and Drainage Paper Food and Agriculture
Organization of The United Nations, No. 63, 238 pp.
Dayton-Johnson, J. (2003). Small-Holder and Water Resources: A Review Essay on
The Economic of Locally-Managed Irrigation. Oxford Development Studies,
Vol. 31, p. 315-339.
Dedrick, A. R., Baustista, E., Clyma, W., Levine, D. B., Rish, S. A., and Clemmens, A.
J. (2000). Diagnostic Analysis of the Maricopa-Stanfield Irrigation and Drainage
Area. Journal of Irrigation and Drainage Systems, Vol. 14, p. 41 – 67.
Dedrick, A. R., Bautista, E., Clyma, W., Levine, D. B., and Rish, S. A. (2000). The
Management Improvement Program (MIP) A Process for Improving the
Performance of Irrigated Agriculture. Journal of Irrigation and Drainage
Systems, Vol. 14, p. 5 - 39.
Deng, X., Luo, Y., Dong, S., Yang, X. (2005). Impact of Resources and Technology on
Farm Production in Northwestern China Journal of Agricultural Systems Vol.
84 p. 155 – 169.
140
Deptan. (1999). Analisisi Padi Sawah di Kabupaten Pandeglang. Retrieved. from
www.deptan.go.id/daerah_new/banten/pandeglang/artikel_07_htm.
Djibril, A., and Diemer, G. (2004). Making a Large Irrigation Scheme Work: A Case
Study from Mali [Electronic Version], 156 pp,
Essafi, B. (1995). In Advanced Short Course On-Farm Water Management: Socio-
economic and Environmental Aspects, June 4-18,1995, Farm Water
Management: Technical Aspects (pp. 1-28). Adana.
FAO. (2002). The State of Food Security in the World In. Rome, Italy: Food and
Agriculture Organization of the United Nations Viale delle Terme di Caracalla.
FAO. (2010). The State of Food Insecurity in the World Addressing Food Insecurity in
Protracted Crises Roma: Food and Agriculture Organization (FAO) of the
United Nation.
Fecon, T. (2007). Performance of Large Rice-Based Irrigation System in Southeast
Asia: Results and Lesson from Learned from The Application of The Rapid
Appraisal Process in the FAO Training Program. Paper presented at the Proc. of
the Regional Workshop on the Future of Large Rice-Based Irrigation Systems in
Southeast Asia, 26 – 28 October 2005 Vietnam.
Ghosh, S., Singh, R., and Kundu, D. K. (2005). Evaluation of Irrigation-Service Utility
from The Perspective of Farmers Journal of Water Resources Management Vol.
19 p. 467 – 482.
Gorantiwar, S. D., and Smout, I. K. (2005). Performance Assessment of Irrigation
Water Management of Heterogeneous Irrigation Scheme: 1. A Framework for
Evaluation. Irrigation and Drainage Systems, Vol. 19 p. 1 – 36.
Hussain, I., Wijerathna, D., Arif, S. S., Murtiningrum, Mawardi, A., and Suparmi.
(2006). Irrigation, Productivity and Poverty Linkages in Irrigation Systems in
Java, Indonesia Journal of Water Resources Management Vol. 20 p. 313 – 336.
Jahromi, S. S., and Fayen, J. (2001). Spatial and Temporal Variability performance of
Water Delivery in Irrigation Schemes Journal of Irrigation and Drainage
Systems Vol. 15, p. 215 – 233.
Kanber, R., Ünlü, M, Cakmak, E. H, and Üzün, M. (2004). Irrigation Systems
Performance: Turkey Country Report. Paper presented at the Irrigation Systems
Performance Proceedings of 2nd WASAMED (WAter SAving in
MEDiterranean agriculture) Workshop, 24-28 June 2004, Hammamet, Tunisia.
Kristianto, K., and Sitompul, T. M. (2005). Present Performance of Large Rice Based
Irrigation Systems in Indonesia. Paper presented at the Proc. of the Regional
Work Shop on the Future of Large Rice-Based Irrigation Systems in Southeast
Asia, 26 – 28 October 2005 Vietnam.
Malano, H., Chien, N. V., and Turral, H. N. (1999). Asset Management for Irrigation
and Drainage Infrastructure: Principles and Case Study. Irrigation and Drainage
Systems, 13, p. 109 – 129.
141
Malano, H. M., and Van Hofwegen, P. J. M. (1999). Management of Irrigation and
Drainage Systems – A Service Approach. Netherlands: A. A. Balkema.
Mark, S., and Ruth, M (1997). Irrigation Management Institution in Transition: a Look
Back, a Look Forward Journal of Irrigation and Drainage Systems, Vol. 11, p.
139 – 156.
Maton, L., Leenhardt, D., Goulard, M., and Bergez, J. E (2005). Assessing The
Irrigation Strategies Over a Wide Geographical Area from Structural Data About
Farming Systems Journal of Agriculture Systems, Vol. 86 p. 293 – 311.
McKay, J., and Keremane, G. B (2006). Farmers’ Perception on Self Created Water
Management Rules in a Pioneer Scheme: The Mula Irrigation Scheme, India
Journal of Irrigation and Drainage Systems Vol. 20 p. 205 – 223.
Merret, S. (2002). Water for Agriculture: Irrigation Economics in International
Perpective [Electronic Version], 235 pp.
Montazar, A., and Behbahani, S. M. (2007). Development of An Optimised Irrigation
System Selection Model Using Analytical Hierarchy Process Journal of
Biosystems Engineering, Vol. 98 p. 155 – 165.
Norman, W. R., Shayya, W. H, AL-Ghafri, A.S and McCann (2000). Aflaj Irrigation
and On-Farm Water Management in Northern Oman. Journal of Irrigation and
Drainage Systems Vol. 14 p. 35-48.
Office, W. R. (2005). Project Contract Documents Water Resources Office, Aceh
Province, Indonesia.
Office, W. R. (2006). Project Contract Documents. Water Resources Office, Aceh
Province, Indonesia.
Okada, H. (2005). Application of The Analytic Hierarchy Process to Irrigation Project
Improvement. University of California, California.
Okada, H., Styles, S. W., and Grismer, M. E. (2008). Application of The Analytic
Hierarchy Process to Irrigation Project Improvement, Part I. Impacts of
Irrigation Project Internal Processes on Crop Yields Journal of Agricultural
Water Management Vol. 95 p. 199 – 201.
Pasaribu, S. M., and Routray, J. K. (2005). Performance of Farmer-Managed Irrigation
Systems for Rice Production in East Java Province, Indonesia. Journal of Water
Resources Development Vol. 21, p. 473 – 491.
Pereira, L. S. (1997). On-Farm Systems : A Discussion on ICID Strategies. Paper
presented at the The International Executive Council of the International
Commission on Irrigation and Drainage (ICID), Oxford, UK, 12 September
1997.
RAP, E. (2006). The Success of A Policy Model: Irrigation Management Transfer in
Mexico. Journal of Development Studies, Vol. 42 p. 1301 – 1324.
142
Renault, D., and Vehmeyer, P. W. (1999). On Reliability in Irrigation Service
Preliminary Concept and Application. Irrigation and Drainage Concept, Vol.
13, p. 75-103.
Schmidhuber, J., and Tubiello N. F. (2007). Global Food Security Under Climate
Change. Proceeding of the National Academy of Sciences of the United States of
America (PNAS), Vol. 104(No.50), pp. 19703-19708.
Shioda, K., and Onimaru, T (2006). Successful Factors and Activation Theory/Concept
of Water Uses’ Organization – Based on the MWMS Project in Thailand Article
(DOI 10.1007/s10333-006-0062-6) in Journal of Paddy Water Environ, p. 13.
Staff, N. R. C. (1996). New Era for Irrigation. Washington, D. C: National Academy
Press.
Styles, S. W., and Marino, M. A. . (2002). Water Delivery Service as A Determinant of
Irrigation Project Performance. Paper presented at the In Proceding of 18th
Congress, International Comission on Irrigation & Drainage (ICID) 26 July
2002, Montreal, Canada.
Sudrajat, I. (2000). Analisis Harga Pokok Beras dengan Pendekatan ABC dan Factor
yang Mempengaruhi Produksi Beras di Jawa Tengah. Dipenegoro University,
Semarang, Indonesia.
Suprodjo, P., and Sahid, S. (1993). Perspektif dari Pengembangan Managemen Sumber
Air dan Irigasi untuk Pembangunan Pertanian. Yogyakarta, Indonesia:
Kumpulan Karangan, Liberty, Yogyakarta.
Suryavanshi, A. R., Kore, A. R, Ghote, R. B, Holsambre, D. G, Patki, V. V, Kulkarni,
C. B, Lavekar, S.G, and Deshpande, A. B (2002). Approach To Planning
Construction and Maintenance Of On-Farm Development Works. Mumbai,
India: India Irrigation Department Mumbai.
Unal, H. B., Asik, S., Avci, M., Yasar, S., and Akkuzu, E. (2004). Performance of
Water Delivery System at Tertiary Canal Level: A Case Study of the Menement
Left Bank Irrigation System, Gediz Basin, Turkey Journal of Agricultural Water
Management, Vol. 65, p. 144 – 152.
Vandersypen, K., Bengaly, K., Keita, A. C. T., Sidibe, S., Raes, D., and Jamin, J. Y.
(2006). Irrigation Performance at Tertiary Level in The Rice Scheme of The
Office du Niger (Mali): Adequate Water Delivery Through Over-Supply Journal
of Agricultural Water Management Vol. 83 p. 144 – 152.
Vandersypen, K., Verbist, B., Keita, A. C. T., Sidibe, S., and Raes, D. (2009). Lingking
Performance and Collective Action - the Case of the Office du Niger Irrigation
Scheme in Mali. Journal of Agricultural Water Management Vol. 23, p. 153 –
168.
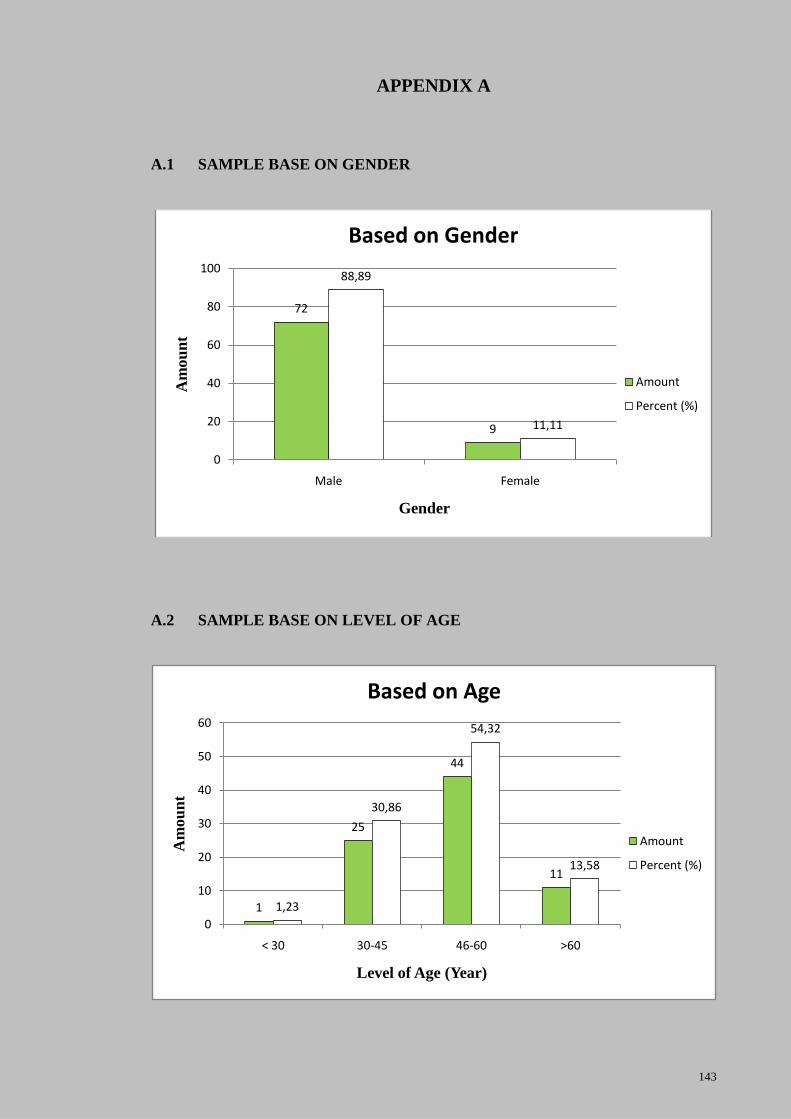
143
APPENDIX A
A.1 SAMPLE BASE ON GENDER
A.2 SAMPLE BASE ON LEVEL OF AGE
72
9
88,89
11,11
0
20
40
60
80
100
Male Female
Am
ou
nt
Gender
Based on Gender
Amount
Percent (%)
1
25
44
11
1,23
30,86
54,32
13,58
0
10
20
30
40
50
60
< 30 30-45 46-60 >60
Am
ou
nt
Level of Age (Year)
Based on Age
Amount
Percent (%)
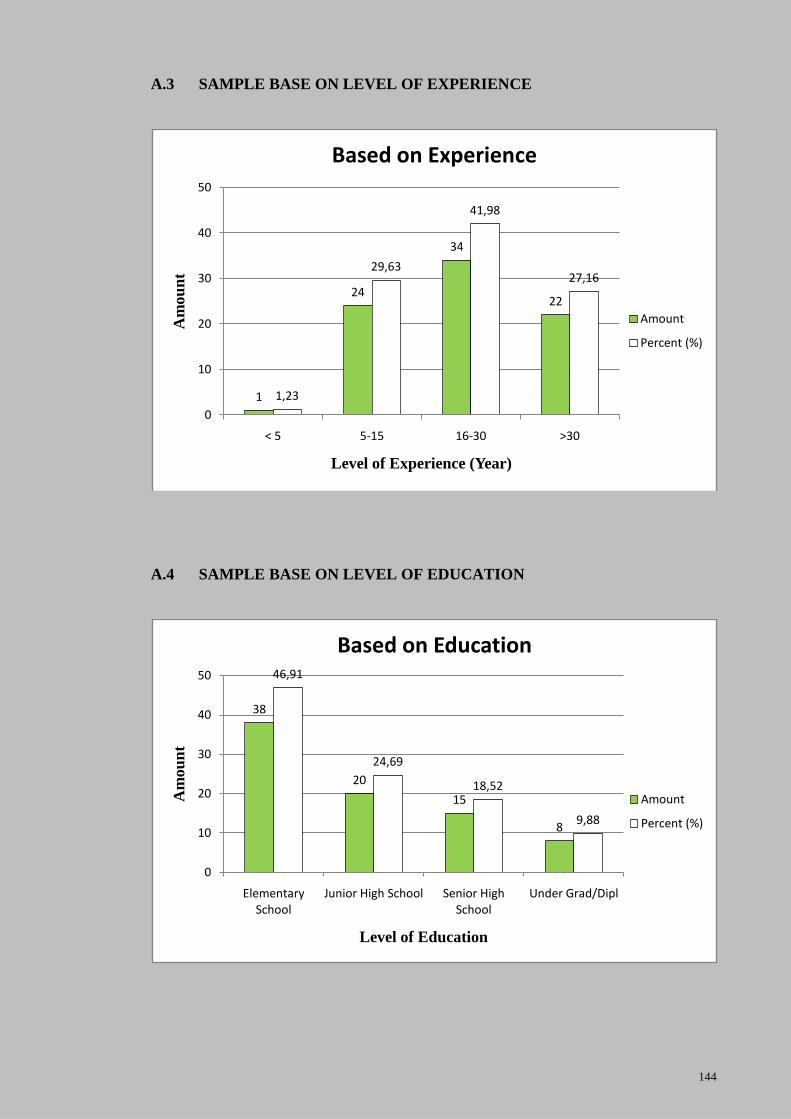
144
A.3 SAMPLE BASE ON LEVEL OF EXPERIENCE
A.4 SAMPLE BASE ON LEVEL OF EDUCATION
1
24
34
22
1,23
29,63
41,98
27,16
0
10
20
30
40
50
< 5 5-15 16-30 >30
Am
ou
nt
Level of Experience (Year)
Based on Experience
Amount
Percent (%)
38
20
15
8
46,91
24,69
18,52
9,88
0
10
20
30
40
50
Elementary School
Junior High School Senior High School
Under Grad/Dipl
Am
ou
nt
Level of Education
Based on Education
Amount
Percent (%)
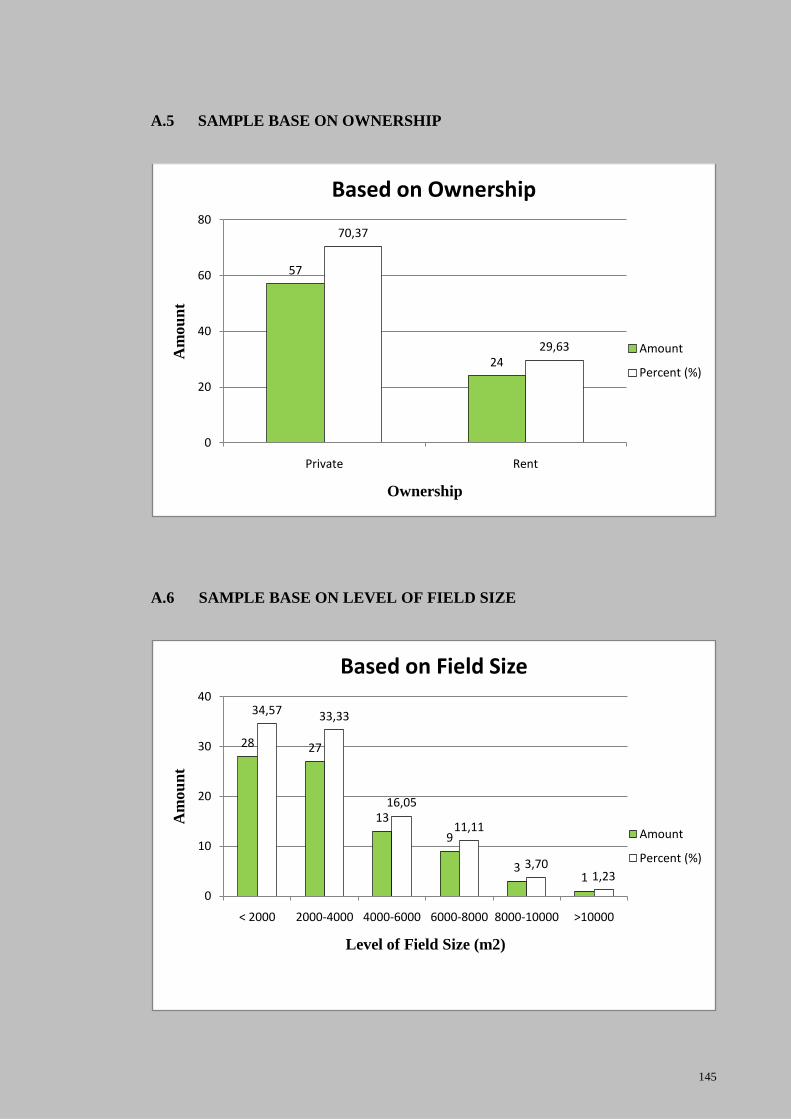
145
A.5 SAMPLE BASE ON OWNERSHIP
A.6 SAMPLE BASE ON LEVEL OF FIELD SIZE
57
24
70,37
29,63
0
20
40
60
80
Private Rent
Am
ou
nt
Ownership
Based on Ownership
Amount
Percent (%)
28 27
13
9
31
34,57 33,33
16,05
11,11
3,701,23
0
10
20
30
40
< 2000 2000-4000 4000-6000 6000-8000 8000-10000 >10000
Am
ou
nt
Level of Field Size (m2)
Based on Field Size
Amount
Percent (%)
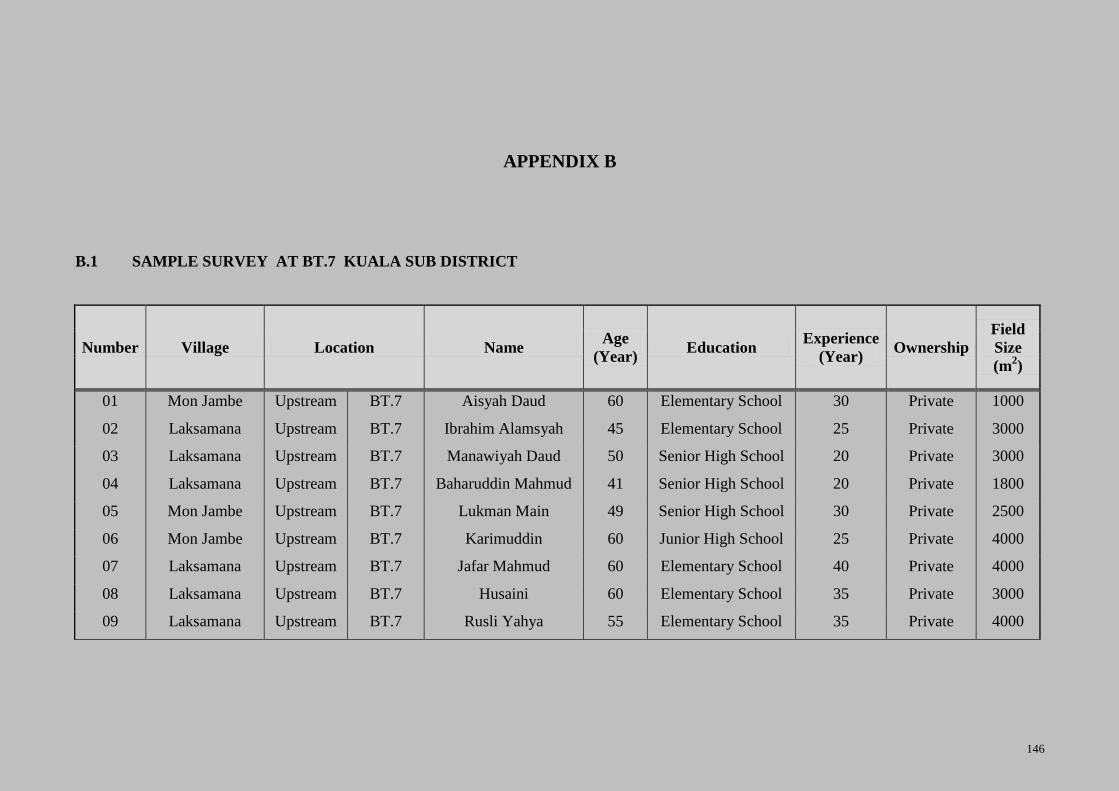
146
APPENDIX B
B.1 SAMPLE SURVEY AT BT.7 KUALA SUB DISTRICT
Number Village Location Name Age
(Year) Education
Experience
(Year) Ownership
Field
Size
(m2)
01 Mon Jambe Upstream BT.7 Aisyah Daud 60 Elementary School 30 Private 1000
02 Laksamana Upstream BT.7 Ibrahim Alamsyah 45 Elementary School 25 Private 3000
03 Laksamana Upstream BT.7 Manawiyah Daud 50 Senior High School 20 Private 3000
04 Laksamana Upstream BT.7 Baharuddin Mahmud 41 Senior High School 20 Private 1800
05 Mon Jambe Upstream BT.7 Lukman Main 49 Senior High School 30 Private 2500
06 Mon Jambe Upstream BT.7 Karimuddin 60 Junior High School 25 Private 4000
07 Laksamana Upstream BT.7 Jafar Mahmud 60 Elementary School 40 Private 4000
08 Laksamana Upstream BT.7 Husaini 60 Elementary School 35 Private 3000
09 Laksamana Upstream BT.7 Rusli Yahya 55 Elementary School 35 Private 4000
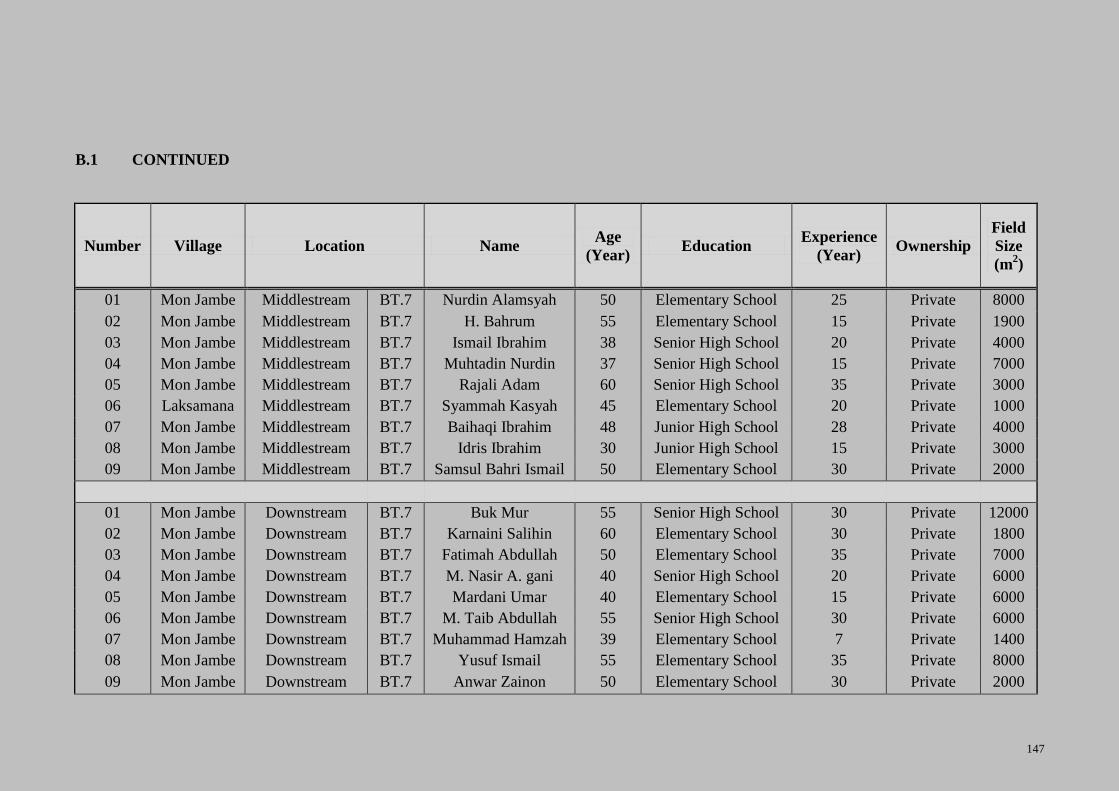
147
B.1 CONTINUED
Number Village Location Name Age
(Year) Education
Experience
(Year) Ownership
Field
Size
(m2)
01 Mon Jambe Middlestream BT.7 Nurdin Alamsyah 50 Elementary School 25 Private 8000
02 Mon Jambe Middlestream BT.7 H. Bahrum 55 Elementary School 15 Private 1900
03 Mon Jambe Middlestream BT.7 Ismail Ibrahim 38 Senior High School 20 Private 4000
04 Mon Jambe Middlestream BT.7 Muhtadin Nurdin 37 Senior High School 15 Private 7000
05 Mon Jambe Middlestream BT.7 Rajali Adam 60 Senior High School 35 Private 3000
06 Laksamana Middlestream BT.7 Syammah Kasyah 45 Elementary School 20 Private 1000
07 Mon Jambe Middlestream BT.7 Baihaqi Ibrahim 48 Junior High School 28 Private 4000
08 Mon Jambe Middlestream BT.7 Idris Ibrahim 30 Junior High School 15 Private 3000
09 Mon Jambe Middlestream BT.7 Samsul Bahri Ismail 50 Elementary School 30 Private 2000
01 Mon Jambe Downstream BT.7 Buk Mur 55 Senior High School 30 Private 12000
02 Mon Jambe Downstream BT.7 Karnaini Salihin 60 Elementary School 30 Private 1800
03 Mon Jambe Downstream BT.7 Fatimah Abdullah 50 Elementary School 35 Private 7000
04 Mon Jambe Downstream BT.7 M. Nasir A. gani 40 Senior High School 20 Private 6000
05 Mon Jambe Downstream BT.7 Mardani Umar 40 Elementary School 15 Private 6000
06 Mon Jambe Downstream BT.7 M. Taib Abdullah 55 Senior High School 30 Private 6000
07 Mon Jambe Downstream BT.7 Muhammad Hamzah 39 Elementary School 7 Private 1400
08 Mon Jambe Downstream BT.7 Yusuf Ismail 55 Elementary School 35 Private 8000
09 Mon Jambe Downstream BT.7 Anwar Zainon 50 Elementary School 30 Private 2000
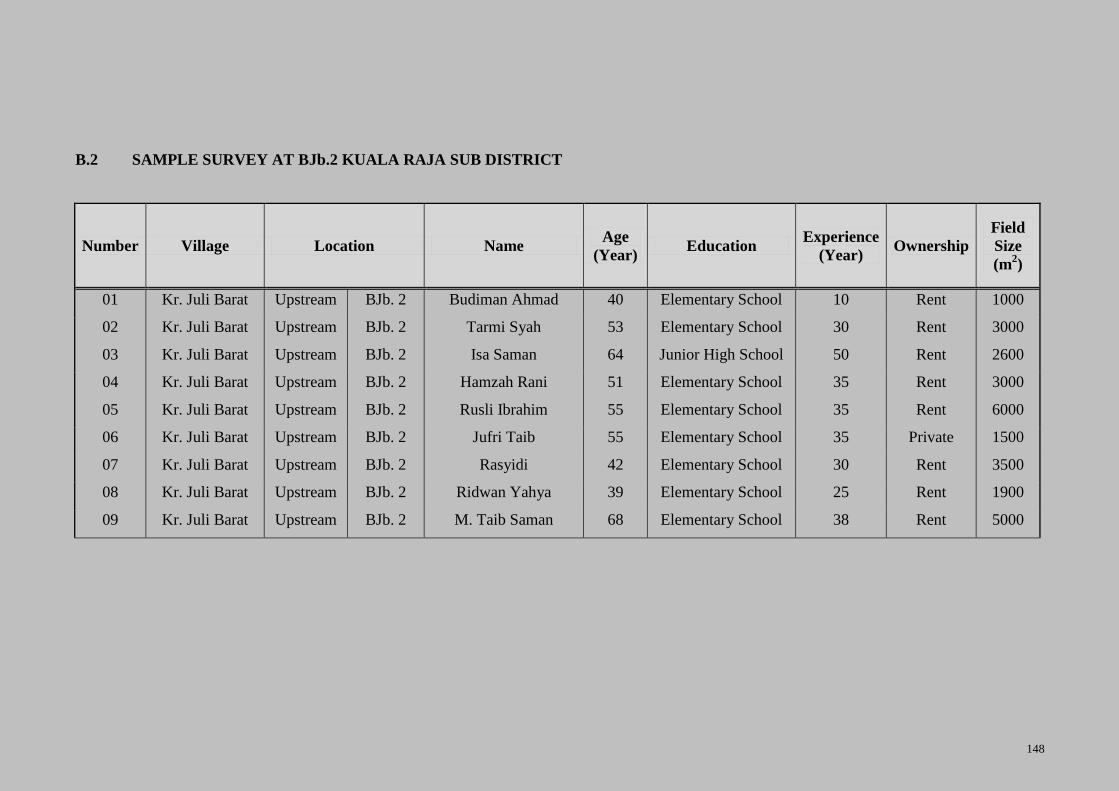
148
B.2 SAMPLE SURVEY AT BJb.2 KUALA RAJA SUB DISTRICT
Number Village Location Name Age
(Year) Education
Experience
(Year) Ownership
Field
Size
(m2)
01 Kr. Juli Barat Upstream BJb. 2 Budiman Ahmad 40 Elementary School 10 Rent 1000
02 Kr. Juli Barat Upstream BJb. 2 Tarmi Syah 53 Elementary School 30 Rent 3000
03 Kr. Juli Barat Upstream BJb. 2 Isa Saman 64 Junior High School 50 Rent 2600
04 Kr. Juli Barat Upstream BJb. 2 Hamzah Rani 51 Elementary School 35 Rent 3000
05 Kr. Juli Barat Upstream BJb. 2 Rusli Ibrahim 55 Elementary School 35 Rent 6000
06 Kr. Juli Barat Upstream BJb. 2 Jufri Taib 55 Elementary School 35 Private 1500
07 Kr. Juli Barat Upstream BJb. 2 Rasyidi 42 Elementary School 30 Rent 3500
08 Kr. Juli Barat Upstream BJb. 2 Ridwan Yahya 39 Elementary School 25 Rent 1900
09 Kr. Juli Barat Upstream BJb. 2 M. Taib Saman 68 Elementary School 38 Rent 5000
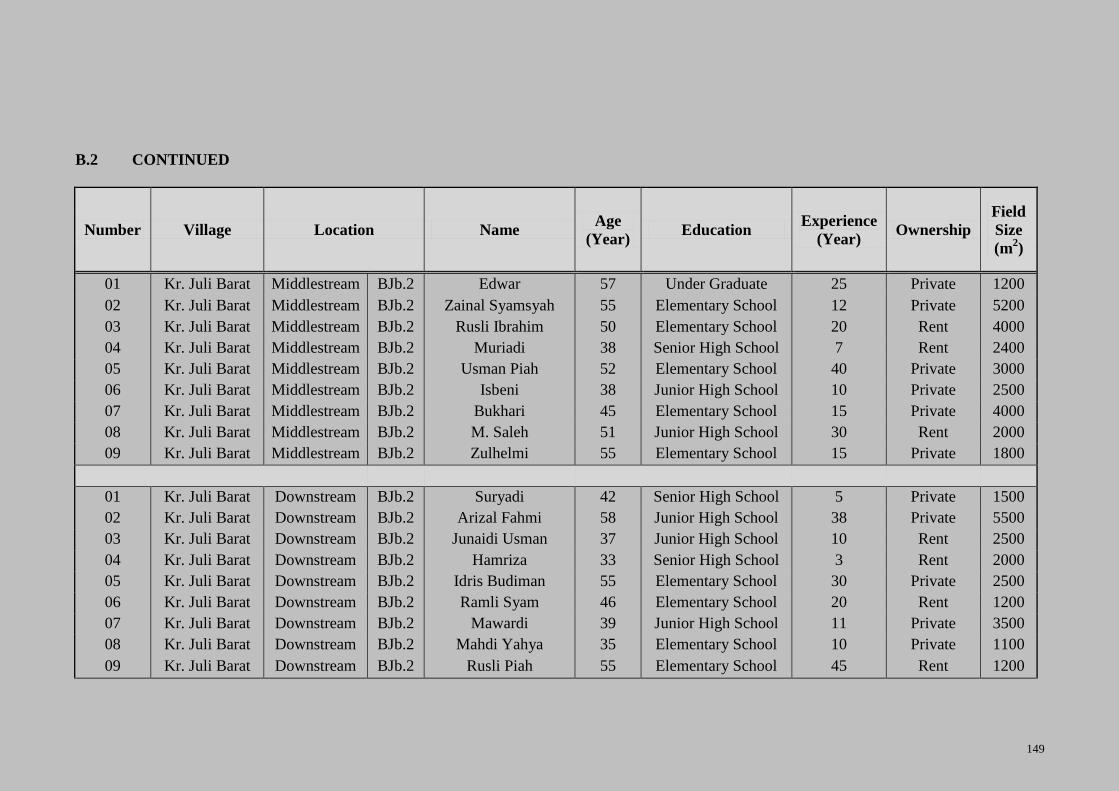
149
B.2 CONTINUED
Number Village Location Name Age
(Year) Education
Experience
(Year) Ownership
Field
Size
(m2)
01 Kr. Juli Barat Middlestream BJb.2 Edwar 57 Under Graduate 25 Private 1200
02 Kr. Juli Barat Middlestream BJb.2 Zainal Syamsyah 55 Elementary School 12 Private 5200
03 Kr. Juli Barat Middlestream BJb.2 Rusli Ibrahim 50 Elementary School 20 Rent 4000
04 Kr. Juli Barat Middlestream BJb.2 Muriadi 38 Senior High School 7 Rent 2400
05 Kr. Juli Barat Middlestream BJb.2 Usman Piah 52 Elementary School 40 Private 3000
06 Kr. Juli Barat Middlestream BJb.2 Isbeni 38 Junior High School 10 Private 2500
07 Kr. Juli Barat Middlestream BJb.2 Bukhari 45 Elementary School 15 Private 4000
08 Kr. Juli Barat Middlestream BJb.2 M. Saleh 51 Junior High School 30 Rent 2000
09 Kr. Juli Barat Middlestream BJb.2 Zulhelmi 55 Elementary School 15 Private 1800
01 Kr. Juli Barat Downstream BJb.2 Suryadi 42 Senior High School 5 Private 1500
02 Kr. Juli Barat Downstream BJb.2 Arizal Fahmi 58 Junior High School 38 Private 5500
03 Kr. Juli Barat Downstream BJb.2 Junaidi Usman 37 Junior High School 10 Rent 2500
04 Kr. Juli Barat Downstream BJb.2 Hamriza 33 Senior High School 3 Rent 2000
05 Kr. Juli Barat Downstream BJb.2 Idris Budiman 55 Elementary School 30 Private 2500
06 Kr. Juli Barat Downstream BJb.2 Ramli Syam 46 Elementary School 20 Rent 1200
07 Kr. Juli Barat Downstream BJb.2 Mawardi 39 Junior High School 11 Private 3500
08 Kr. Juli Barat Downstream BJb.2 Mahdi Yahya 35 Elementary School 10 Private 1100
09 Kr. Juli Barat Downstream BJb.2 Rusli Piah 55 Elementary School 45 Rent 1200
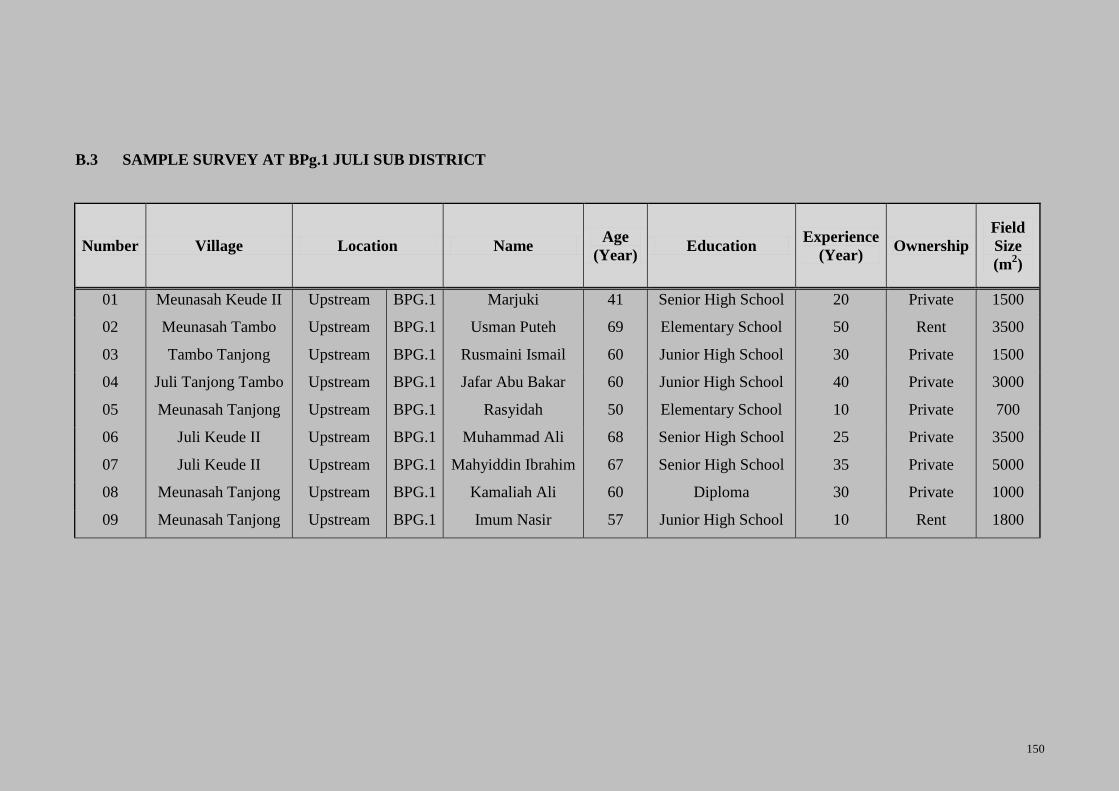
150
B.3 SAMPLE SURVEY AT BPg.1 JULI SUB DISTRICT
Number Village Location Name Age
(Year) Education
Experience
(Year) Ownership
Field
Size
(m2)
01 Meunasah Keude II Upstream BPG.1 Marjuki 41 Senior High School 20 Private 1500
02 Meunasah Tambo Upstream BPG.1 Usman Puteh 69 Elementary School 50 Rent 3500
03 Tambo Tanjong Upstream BPG.1 Rusmaini Ismail 60 Junior High School 30 Private 1500
04 Juli Tanjong Tambo Upstream BPG.1 Jafar Abu Bakar 60 Junior High School 40 Private 3000
05 Meunasah Tanjong Upstream BPG.1 Rasyidah 50 Elementary School 10 Private 700
06 Juli Keude II Upstream BPG.1 Muhammad Ali 68 Senior High School 25 Private 3500
07 Juli Keude II Upstream BPG.1 Mahyiddin Ibrahim 67 Senior High School 35 Private 5000
08 Meunasah Tanjong Upstream BPG.1 Kamaliah Ali 60 Diploma 30 Private 1000
09 Meunasah Tanjong Upstream BPG.1 Imum Nasir 57 Junior High School 10 Rent 1800
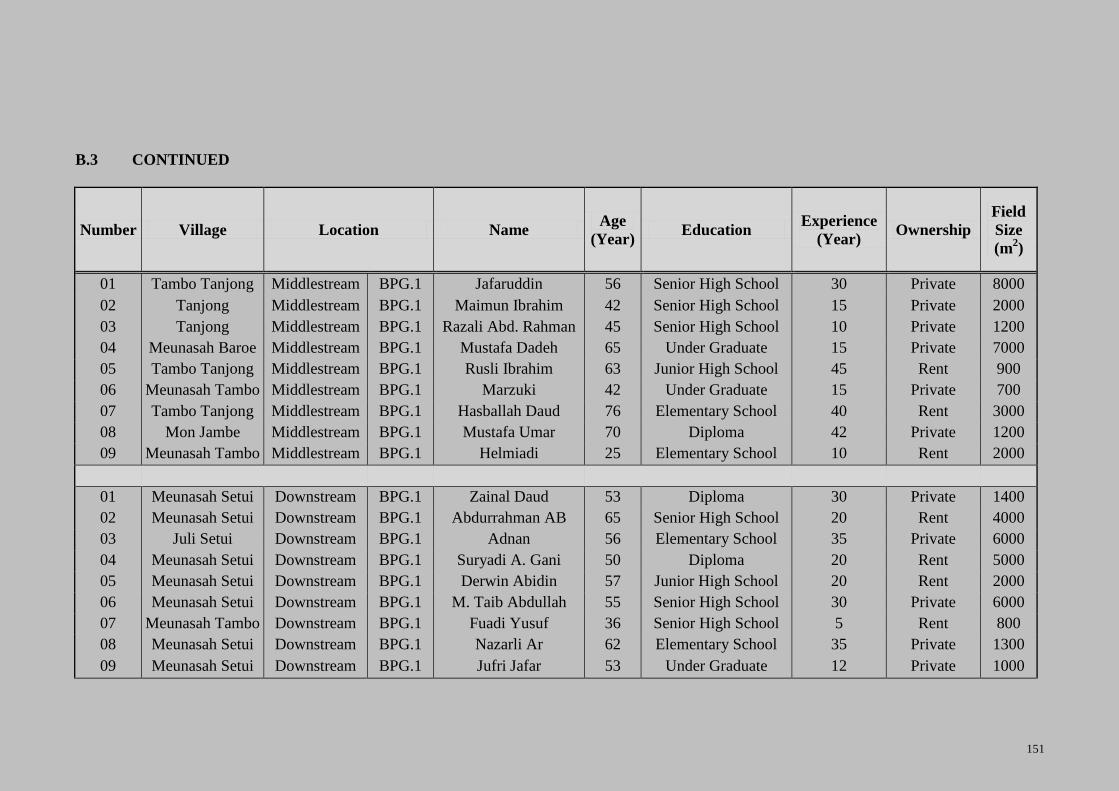
151
B.3 CONTINUED
Number Village Location Name Age
(Year) Education
Experience
(Year) Ownership
Field
Size
(m2)
01 Tambo Tanjong Middlestream BPG.1 Jafaruddin 56 Senior High School 30 Private 8000
02 Tanjong Middlestream BPG.1 Maimun Ibrahim 42 Senior High School 15 Private 2000
03 Tanjong Middlestream BPG.1 Razali Abd. Rahman 45 Senior High School 10 Private 1200
04 Meunasah Baroe Middlestream BPG.1 Mustafa Dadeh 65 Under Graduate 15 Private 7000
05 Tambo Tanjong Middlestream BPG.1 Rusli Ibrahim 63 Junior High School 45 Rent 900
06 Meunasah Tambo Middlestream BPG.1 Marzuki 42 Under Graduate 15 Private 700
07 Tambo Tanjong Middlestream BPG.1 Hasballah Daud 76 Elementary School 40 Rent 3000
08 Mon Jambe Middlestream BPG.1 Mustafa Umar 70 Diploma 42 Private 1200
09 Meunasah Tambo Middlestream BPG.1 Helmiadi 25 Elementary School 10 Rent 2000
01 Meunasah Setui Downstream BPG.1 Zainal Daud 53 Diploma 30 Private 1400
02 Meunasah Setui Downstream BPG.1 Abdurrahman AB 65 Senior High School 20 Rent 4000
03 Juli Setui Downstream BPG.1 Adnan 56 Elementary School 35 Private 6000
04 Meunasah Setui Downstream BPG.1 Suryadi A. Gani 50 Diploma 20 Rent 5000
05 Meunasah Setui Downstream BPG.1 Derwin Abidin 57 Junior High School 20 Rent 2000
06 Meunasah Setui Downstream BPG.1 M. Taib Abdullah 55 Senior High School 30 Private 6000
07 Meunasah Tambo Downstream BPG.1 Fuadi Yusuf 36 Senior High School 5 Rent 800
08 Meunasah Setui Downstream BPG.1 Nazarli Ar 62 Elementary School 35 Private 1300
09 Meunasah Setui Downstream BPG.1 Jufri Jafar 53 Under Graduate 12 Private 1000
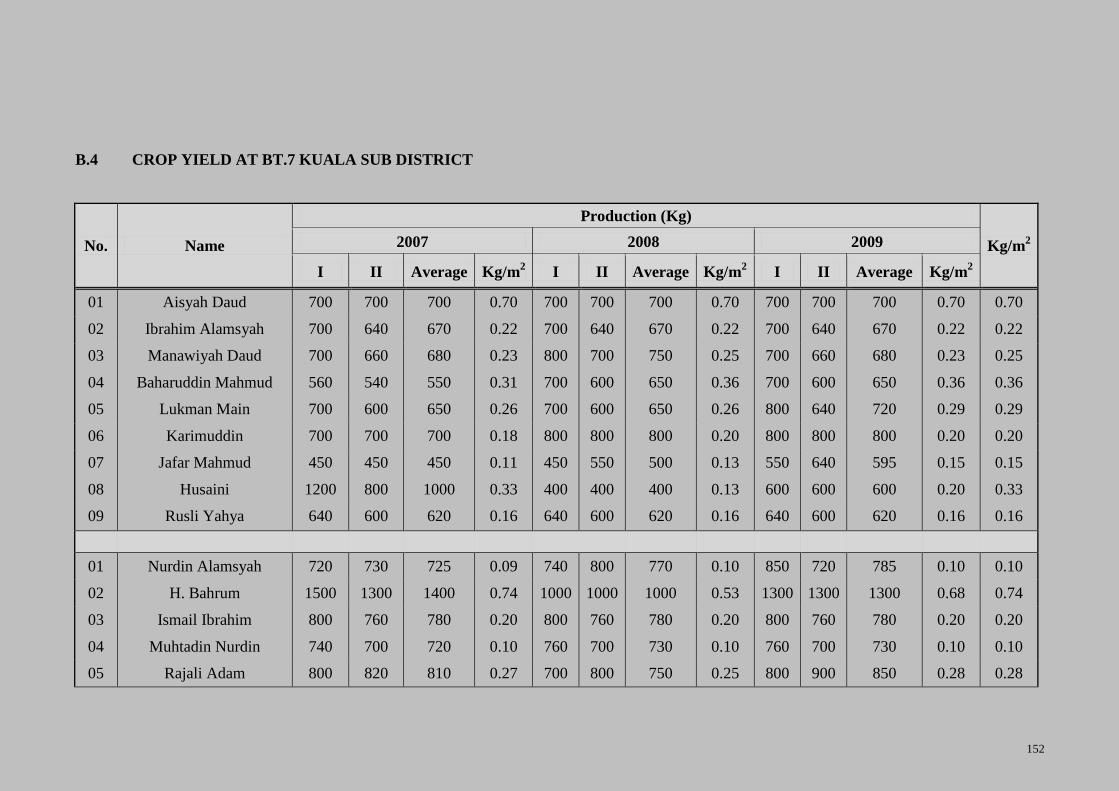
152
B.4 CROP YIELD AT BT.7 KUALA SUB DISTRICT
No. Name
Production (Kg)
Kg/m2 2007 2008 2009
I II Average Kg/m2 I II Average Kg/m
2 I II Average Kg/m
2
01 Aisyah Daud 700 700 700 0.70 700 700 700 0.70 700 700 700 0.70 0.70
02 Ibrahim Alamsyah 700 640 670 0.22 700 640 670 0.22 700 640 670 0.22 0.22
03 Manawiyah Daud 700 660 680 0.23 800 700 750 0.25 700 660 680 0.23 0.25
04 Baharuddin Mahmud 560 540 550 0.31 700 600 650 0.36 700 600 650 0.36 0.36
05 Lukman Main 700 600 650 0.26 700 600 650 0.26 800 640 720 0.29 0.29
06 Karimuddin 700 700 700 0.18 800 800 800 0.20 800 800 800 0.20 0.20
07 Jafar Mahmud 450 450 450 0.11 450 550 500 0.13 550 640 595 0.15 0.15
08 Husaini 1200 800 1000 0.33 400 400 400 0.13 600 600 600 0.20 0.33
09 Rusli Yahya 640 600 620 0.16 640 600 620 0.16 640 600 620 0.16 0.16
01 Nurdin Alamsyah 720 730 725 0.09 740 800 770 0.10 850 720 785 0.10 0.10
02 H. Bahrum 1500 1300 1400 0.74 1000 1000 1000 0.53 1300 1300 1300 0.68 0.74
03 Ismail Ibrahim 800 760 780 0.20 800 760 780 0.20 800 760 780 0.20 0.20
04 Muhtadin Nurdin 740 700 720 0.10 760 700 730 0.10 760 700 730 0.10 0.10
05 Rajali Adam 800 820 810 0.27 700 800 750 0.25 800 900 850 0.28 0.28

153
B.4 CONTINUED
No. Name
Production (Kg)
Kg/m2 2007 2008 2009
I II Average Kg/m2 I II Average Kg/m
2 I II Average Kg/m
2
06 Syammah Kasyah 720 540 630 0.63 540 580 560 0.56 600 540 570 0.57 0.63
07 Baihaqi Ibrahim 860 880 870 0.22 880 770 825 0.21 900 860 880 0.22 0.22
08 Idris Ibrahim 700 740 720 0.24 700 740 720 0.24 700 740 720 0.24 0.24
09 Samsul Bahri Ismail 600 600 600 0.30 720 720 720 0.36 600 700 650 0.33 0.36
01 Buk Mur 700 700 700 0.06 680 700 690 0.06 700 700 700 0.06 0.06
02 Karnaini Salihin 1200 1200 1200 0.67 1100 1100 1100 0.61 1200 1300 1250 0.69 0.69
03 Fatimah Abdullah 700 740 720 0.10 700 740 720 0.10 700 740 720 0.10 0.10
04 M. Nasir A. gani 560 600 580 0.10 640 660 650 0.11 820 740 780 0.13 0.13
05 Mardani Umar 600 600 600 0.10 600 600 600 0.10 800 700 750 0.13 0.13
06 M. Taib Abdullah 3200 3200 3200 0.53 2400 3400 2900 0.48 3600 3400 3500 0.58 0.58
07 Muhammad Hamzah 900 800 850 0.61 800 800 800 0.57 800 900 850 0.61 0.61
08 Yusuf Ismail 780 780 780 0.10 780 800 790 0.10 760 760 760 0.10 0.10
09 Anwar Zainon 700 800 750 0.38 900 900 900 0.45 800 800 800 0.40 0.45

154
B.5 CROP YIELD AT BJb.2 KUALA RAJA SUB DISTRICT
No. Name
Production (Kg)
Kg/m2 2007 2008 2009
I II Average Kg/m2 I II Average Kg/m
2 I II Average Kg/m
2
01 Budiman Ahmad 600 800 700 0.70 600 800 700 0.70 800 1000 900 0.90 0.90
02 Tarmi Syah 500 500 500 0.17 500 500 500 0.17 400 240 320 0.11 0.17
03 Isa Saman 1200 1100 1150 0.44 1400 1640 1520 0.58 1600 1560 1580 0.61 0.61
04 Hamzah Rani - - - - - 600 600 0.20 540 600 570 0.19 0.20
05 Rusli Ibrahim 640 800 720 0.12 600 760 680 0.11 600 700 650 0.11 0.12
06 Jufri Taib 700 700 700 0.47 700 400 550 0.37 700 700 700 0.47 0.47
07 Rasyidi 1400 1400 1400 0.40 1600 1600 1600 0.46 2000 500 1250 0.36 0.46
08 Ridwan Yahya 500 360 430 0.23 600 400 500 0.26 540 700 620 0.33 0.33
09 M. Taib Saman 600 700 650 0.13 600 640 620 0.12 560 600 580 0.12 0.13
01 Edwar - - - - - - - - 850 720 785 0.65 0.65
02 Zainal Syamsyah - - - - 2400 1840 2120 0.41 960 1800 1380 0.27 0.41
03 Rusli Ibrahim 920 450 685 0.17 520 720 620 0.16 640 600 620 0.16 0.17
04 Muriadi 800 800 800 0.33 800 680 740 0.31 800 800 800 0.33 0.33
05 Usman Piah 700 700 700 0.23 700 500 600 0.20 550 700 625 021 0.23
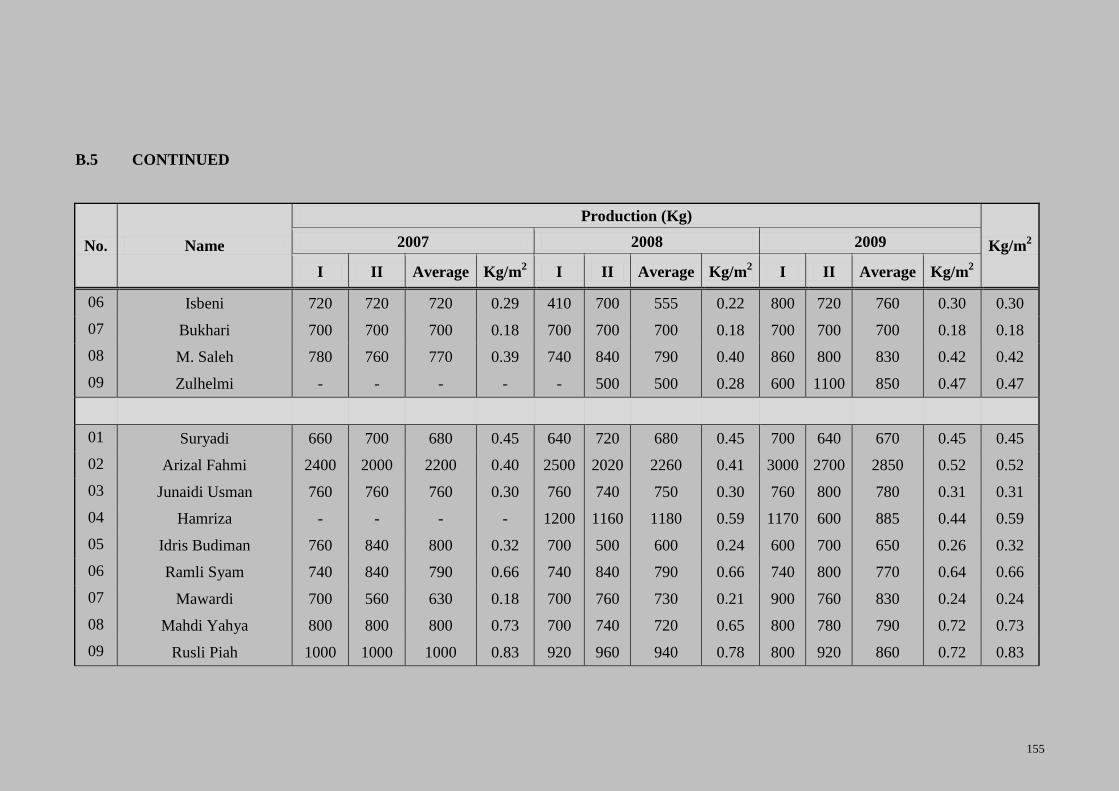
155
B.5 CONTINUED
No. Name
Production (Kg)
Kg/m2 2007 2008 2009
I II Average Kg/m2 I II Average Kg/m
2 I II Average Kg/m
2
06 Isbeni 720 720 720 0.29 410 700 555 0.22 800 720 760 0.30 0.30
07 Bukhari 700 700 700 0.18 700 700 700 0.18 700 700 700 0.18 0.18
08 M. Saleh 780 760 770 0.39 740 840 790 0.40 860 800 830 0.42 0.42
09 Zulhelmi - - - - - 500 500 0.28 600 1100 850 0.47 0.47
01 Suryadi 660 700 680 0.45 640 720 680 0.45 700 640 670 0.45 0.45
02 Arizal Fahmi 2400 2000 2200 0.40 2500 2020 2260 0.41 3000 2700 2850 0.52 0.52
03 Junaidi Usman 760 760 760 0.30 760 740 750 0.30 760 800 780 0.31 0.31
04 Hamriza - - - - 1200 1160 1180 0.59 1170 600 885 0.44 0.59
05 Idris Budiman 760 840 800 0.32 700 500 600 0.24 600 700 650 0.26 0.32
06 Ramli Syam 740 840 790 0.66 740 840 790 0.66 740 800 770 0.64 0.66
07 Mawardi 700 560 630 0.18 700 760 730 0.21 900 760 830 0.24 0.24
08 Mahdi Yahya 800 800 800 0.73 700 740 720 0.65 800 780 790 0.72 0.73
09 Rusli Piah 1000 1000 1000 0.83 920 960 940 0.78 800 920 860 0.72 0.83
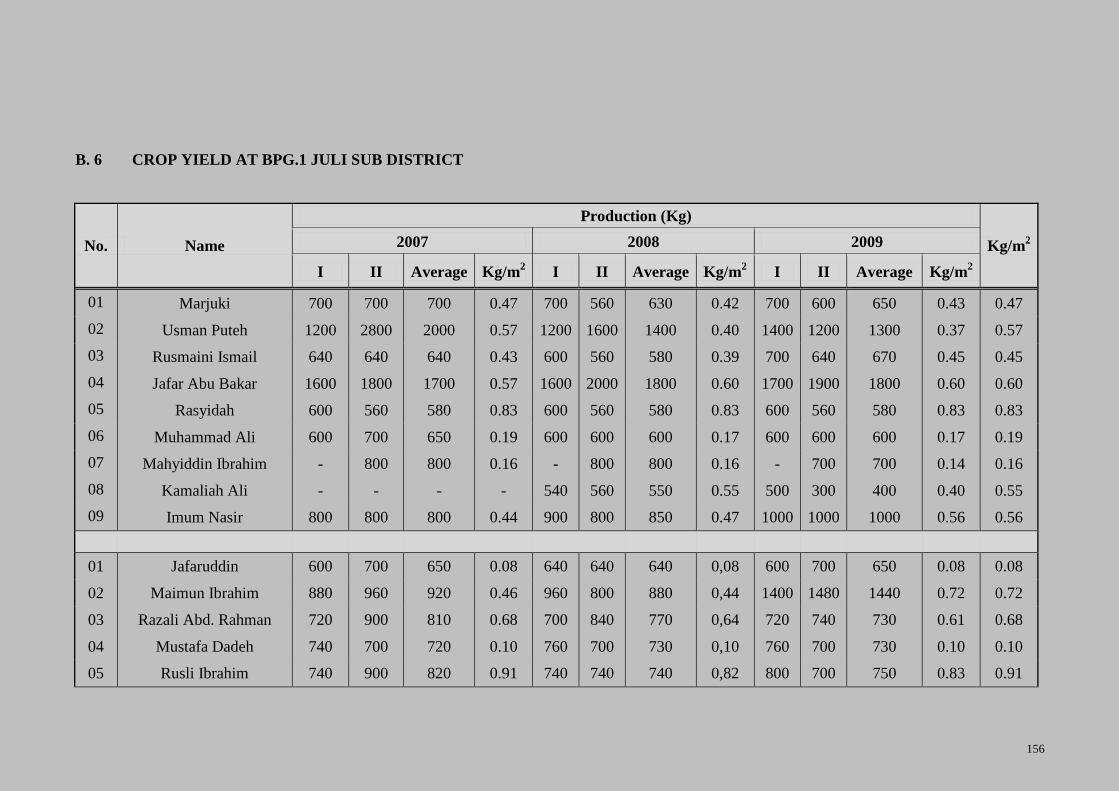
156
B. 6 CROP YIELD AT BPG.1 JULI SUB DISTRICT
No. Name
Production (Kg)
Kg/m2 2007 2008 2009
I II Average Kg/m2 I II Average Kg/m
2 I II Average Kg/m
2
01 Marjuki 700 700 700 0.47 700 560 630 0.42 700 600 650 0.43 0.47
02 Usman Puteh 1200 2800 2000 0.57 1200 1600 1400 0.40 1400 1200 1300 0.37 0.57
03 Rusmaini Ismail 640 640 640 0.43 600 560 580 0.39 700 640 670 0.45 0.45
04 Jafar Abu Bakar 1600 1800 1700 0.57 1600 2000 1800 0.60 1700 1900 1800 0.60 0.60
05 Rasyidah 600 560 580 0.83 600 560 580 0.83 600 560 580 0.83 0.83
06 Muhammad Ali 600 700 650 0.19 600 600 600 0.17 600 600 600 0.17 0.19
07 Mahyiddin Ibrahim - 800 800 0.16 - 800 800 0.16 - 700 700 0.14 0.16
08 Kamaliah Ali - - - - 540 560 550 0.55 500 300 400 0.40 0.55
09 Imum Nasir 800 800 800 0.44 900 800 850 0.47 1000 1000 1000 0.56 0.56
01 Jafaruddin 600 700 650 0.08 640 640 640 0,08 600 700 650 0.08 0.08
02 Maimun Ibrahim 880 960 920 0.46 960 800 880 0,44 1400 1480 1440 0.72 0.72
03 Razali Abd. Rahman 720 900 810 0.68 700 840 770 0,64 720 740 730 0.61 0.68
04 Mustafa Dadeh 740 700 720 0.10 760 700 730 0,10 760 700 730 0.10 0.10
05 Rusli Ibrahim 740 900 820 0.91 740 740 740 0,82 800 700 750 0.83 0.91
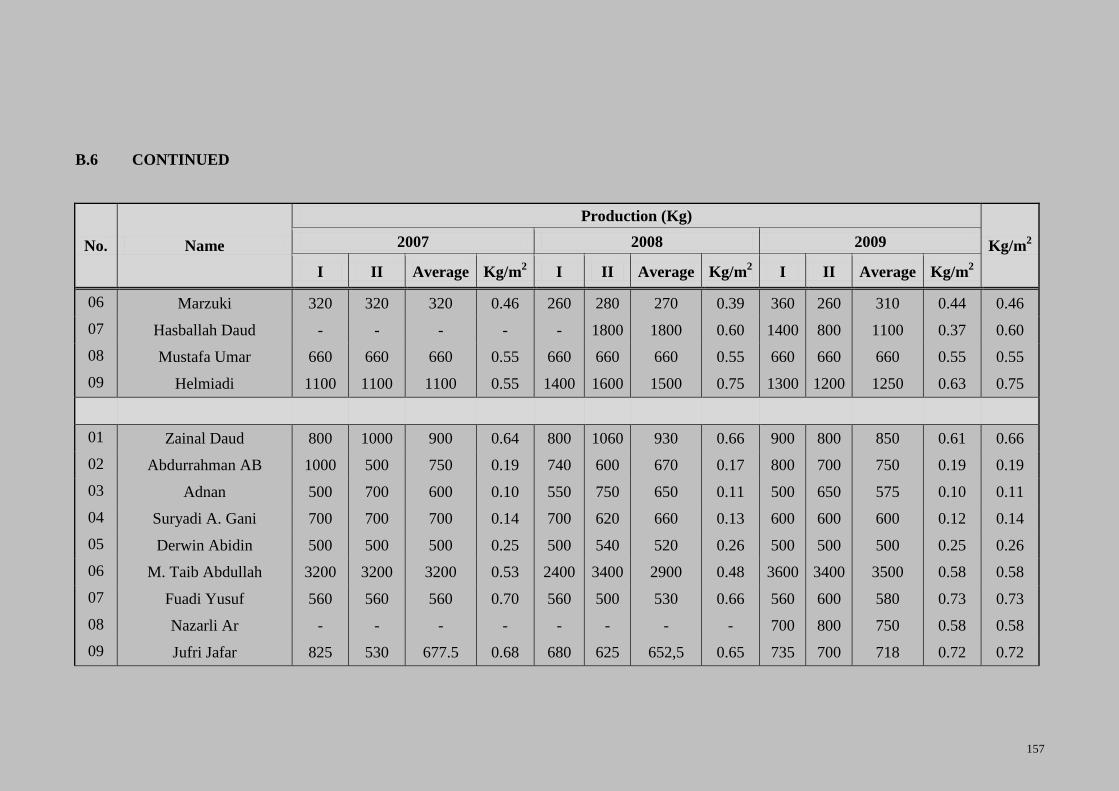
157
B.6 CONTINUED
No. Name
Production (Kg)
Kg/m2 2007 2008 2009
I II Average Kg/m2 I II Average Kg/m
2 I II Average Kg/m
2
06 Marzuki 320 320 320 0.46 260 280 270 0.39 360 260 310 0.44 0.46
07 Hasballah Daud - - - - - 1800 1800 0.60 1400 800 1100 0.37 0.60
08 Mustafa Umar 660 660 660 0.55 660 660 660 0.55 660 660 660 0.55 0.55
09 Helmiadi 1100 1100 1100 0.55 1400 1600 1500 0.75 1300 1200 1250 0.63 0.75
01 Zainal Daud 800 1000 900 0.64 800 1060 930 0.66 900 800 850 0.61 0.66
02 Abdurrahman AB 1000 500 750 0.19 740 600 670 0.17 800 700 750 0.19 0.19
03 Adnan 500 700 600 0.10 550 750 650 0.11 500 650 575 0.10 0.11
04 Suryadi A. Gani 700 700 700 0.14 700 620 660 0.13 600 600 600 0.12 0.14
05 Derwin Abidin 500 500 500 0.25 500 540 520 0.26 500 500 500 0.25 0.26
06 M. Taib Abdullah 3200 3200 3200 0.53 2400 3400 2900 0.48 3600 3400 3500 0.58 0.58
07 Fuadi Yusuf 560 560 560 0.70 560 500 530 0.66 560 600 580 0.73 0.73
08 Nazarli Ar - - - - - - - - 700 800 750 0.58 0.58
09 Jufri Jafar 825 530 677.5 0.68 680 625 652,5 0.65 735 700 718 0.72 0.72
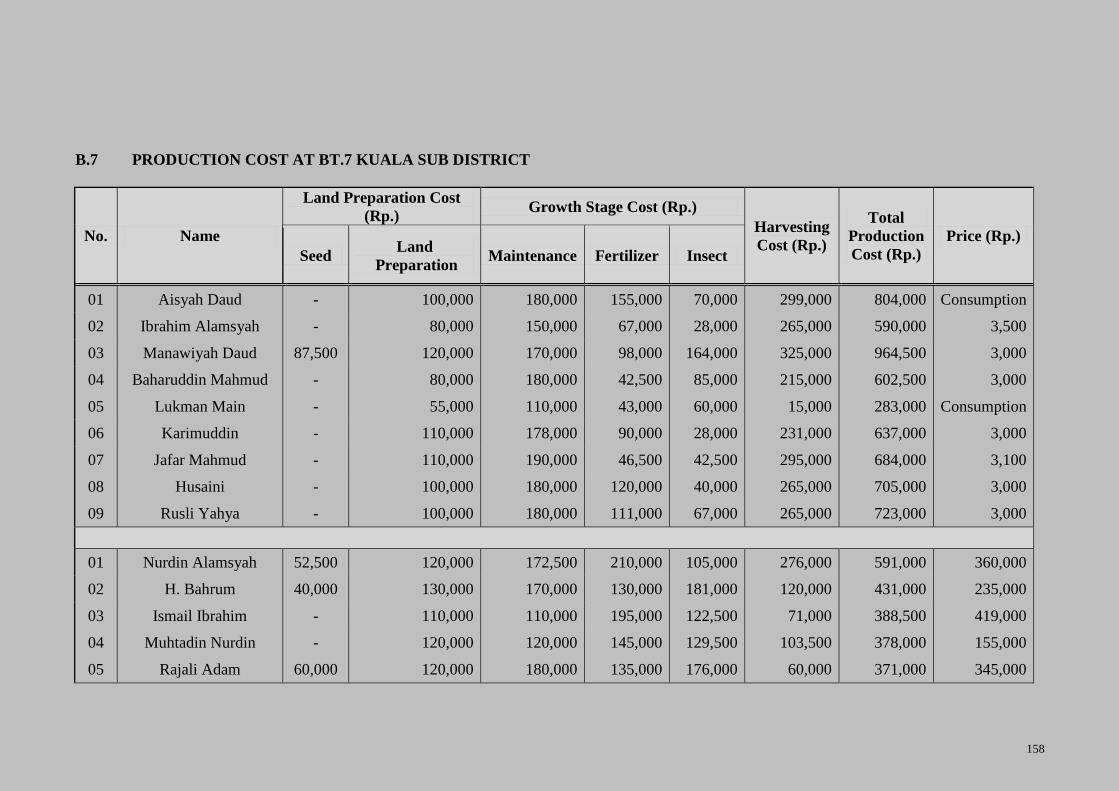
158
B.7 PRODUCTION COST AT BT.7 KUALA SUB DISTRICT
No. Name
Land Preparation Cost
(Rp.) Growth Stage Cost (Rp.)
Harvesting
Cost (Rp.)
Total
Production
Cost (Rp.)
Price (Rp.)
Seed Land
Preparation Maintenance Fertilizer Insect
01 Aisyah Daud - 100,000 180,000 155,000 70,000 299,000 804,000 Consumption
02 Ibrahim Alamsyah - 80,000 150,000 67,000 28,000 265,000 590,000 3,500
03 Manawiyah Daud 87,500 120,000 170,000 98,000 164,000 325,000 964,500 3,000
04 Baharuddin Mahmud - 80,000 180,000 42,500 85,000 215,000 602,500 3,000
05 Lukman Main - 55,000 110,000 43,000 60,000 15,000 283,000 Consumption
06 Karimuddin - 110,000 178,000 90,000 28,000 231,000 637,000 3,000
07 Jafar Mahmud - 110,000 190,000 46,500 42,500 295,000 684,000 3,100
08 Husaini - 100,000 180,000 120,000 40,000 265,000 705,000 3,000
09 Rusli Yahya - 100,000 180,000 111,000 67,000 265,000 723,000 3,000
01 Nurdin Alamsyah 52,500 120,000 172,500 210,000 105,000 276,000 591,000 360,000
02 H. Bahrum 40,000 130,000 170,000 130,000 181,000 120,000 431,000 235,000
03 Ismail Ibrahim - 110,000 110,000 195,000 122,500 71,000 388,500 419,000
04 Muhtadin Nurdin - 120,000 120,000 145,000 129,500 103,500 378,000 155,000
05 Rajali Adam 60,000 120,000 180,000 135,000 176,000 60,000 371,000 345,000
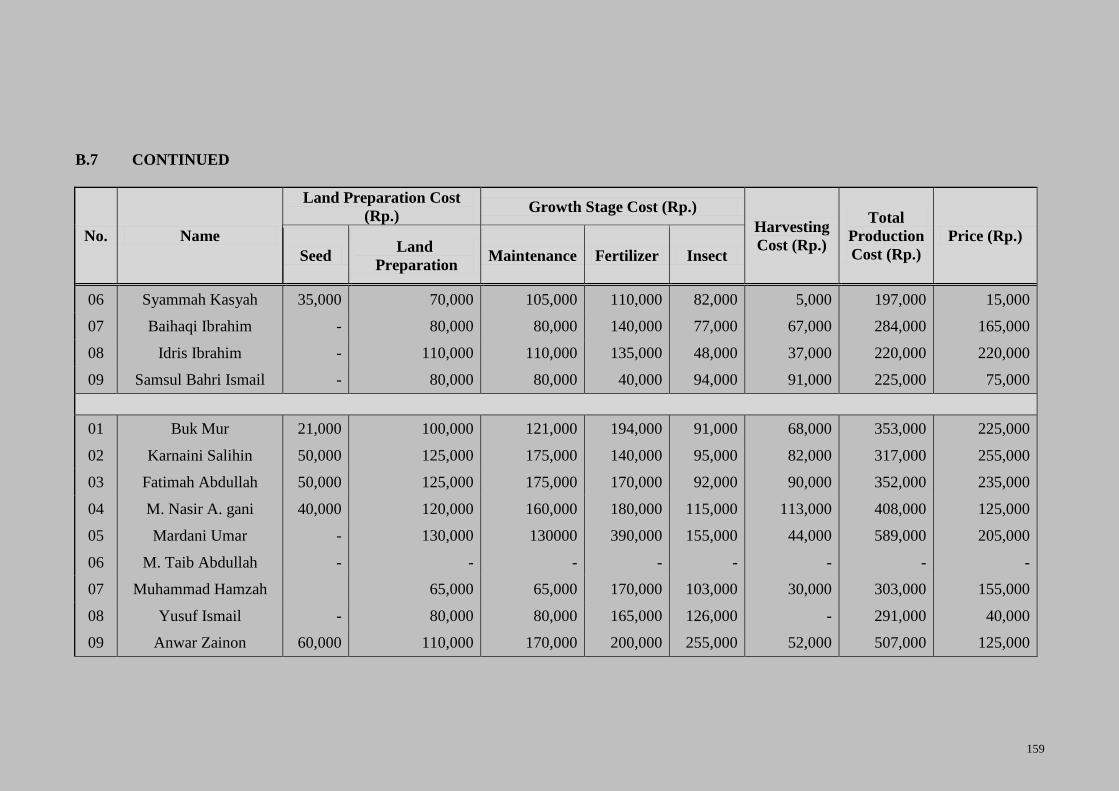
159
B.7 CONTINUED
No. Name
Land Preparation Cost
(Rp.) Growth Stage Cost (Rp.)
Harvesting
Cost (Rp.)
Total
Production
Cost (Rp.)
Price (Rp.)
Seed Land
Preparation Maintenance Fertilizer Insect
06 Syammah Kasyah 35,000 70,000 105,000 110,000 82,000 5,000 197,000 15,000
07 Baihaqi Ibrahim - 80,000 80,000 140,000 77,000 67,000 284,000 165,000
08 Idris Ibrahim - 110,000 110,000 135,000 48,000 37,000 220,000 220,000
09 Samsul Bahri Ismail - 80,000 80,000 40,000 94,000 91,000 225,000 75,000
01 Buk Mur 21,000 100,000 121,000 194,000 91,000 68,000 353,000 225,000
02 Karnaini Salihin 50,000 125,000 175,000 140,000 95,000 82,000 317,000 255,000
03 Fatimah Abdullah 50,000 125,000 175,000 170,000 92,000 90,000 352,000 235,000
04 M. Nasir A. gani 40,000 120,000 160,000 180,000 115,000 113,000 408,000 125,000
05 Mardani Umar - 130,000 130000 390,000 155,000 44,000 589,000 205,000
06 M. Taib Abdullah - - - - - - - -
07 Muhammad Hamzah
65,000 65,000 170,000 103,000 30,000 303,000 155,000
08 Yusuf Ismail - 80,000 80,000 165,000 126,000 - 291,000 40,000
09 Anwar Zainon 60,000 110,000 170,000 200,000 255,000 52,000 507,000 125,000
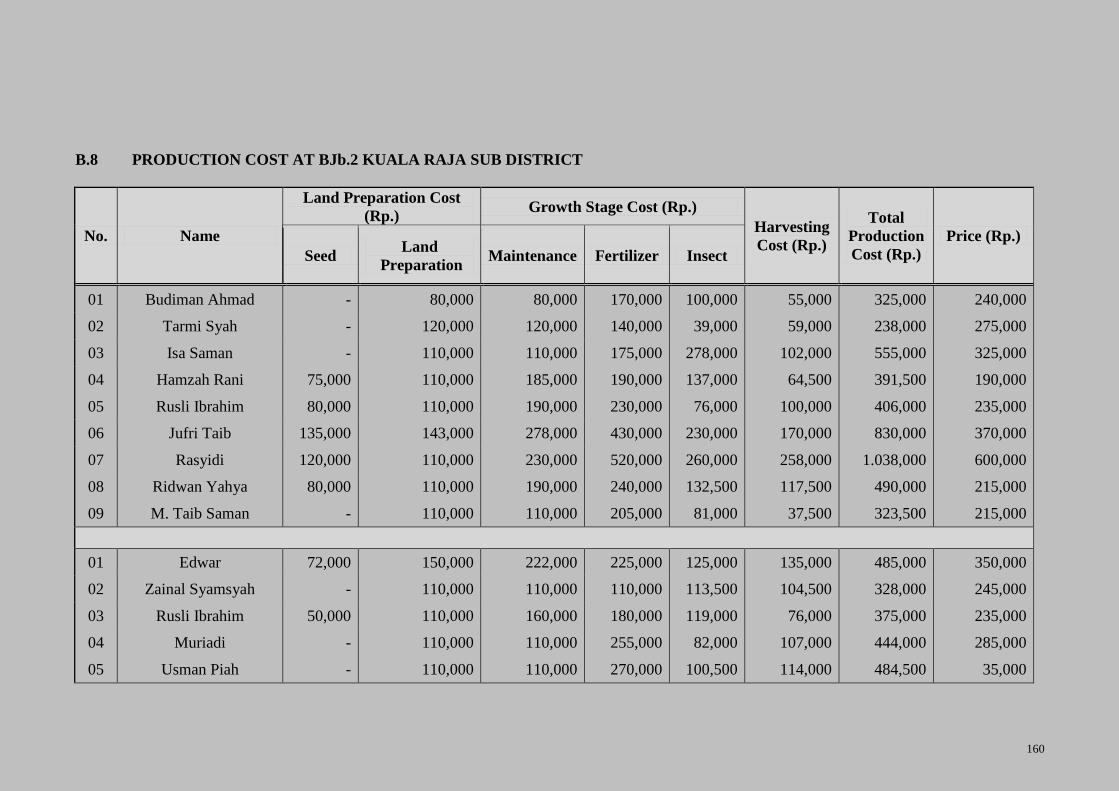
160
B.8 PRODUCTION COST AT BJb.2 KUALA RAJA SUB DISTRICT
No. Name
Land Preparation Cost
(Rp.) Growth Stage Cost (Rp.)
Harvesting
Cost (Rp.)
Total
Production
Cost (Rp.)
Price (Rp.)
Seed Land
Preparation Maintenance Fertilizer Insect
01 Budiman Ahmad - 80,000 80,000 170,000 100,000 55,000 325,000 240,000
02 Tarmi Syah - 120,000 120,000 140,000 39,000 59,000 238,000 275,000
03 Isa Saman - 110,000 110,000 175,000 278,000 102,000 555,000 325,000
04 Hamzah Rani 75,000 110,000 185,000 190,000 137,000 64,500 391,500 190,000
05 Rusli Ibrahim 80,000 110,000 190,000 230,000 76,000 100,000 406,000 235,000
06 Jufri Taib 135,000 143,000 278,000 430,000 230,000 170,000 830,000 370,000
07 Rasyidi 120,000 110,000 230,000 520,000 260,000 258,000 1.038,000 600,000
08 Ridwan Yahya 80,000 110,000 190,000 240,000 132,500 117,500 490,000 215,000
09 M. Taib Saman - 110,000 110,000 205,000 81,000 37,500 323,500 215,000
01 Edwar 72,000 150,000 222,000 225,000 125,000 135,000 485,000 350,000
02 Zainal Syamsyah - 110,000 110,000 110,000 113,500 104,500 328,000 245,000
03 Rusli Ibrahim 50,000 110,000 160,000 180,000 119,000 76,000 375,000 235,000
04 Muriadi - 110,000 110,000 255,000 82,000 107,000 444,000 285,000
05 Usman Piah - 110,000 110,000 270,000 100,500 114,000 484,500 35,000

161
B.8 CONTINUED
No. Name
Land Preparation Cost
(Rp.) Growth Stage Cost (Rp.)
Harvesting
Cost (Rp.)
Total
Production
Cost (Rp.)
Price (Rp.)
Seed Land
Preparation Maintenance Fertilizer Insect
06 Isbeni 120,000 110,000 230,000 182,000 150,000 100,000 432,000 120,000
07 Bukhari - 100,000 100,000 240,000 75,000 92,000 407,000 115,000
08 M. Saleh 42,000 110,000 152,000 230,000 99,500 38,000 367,500 255,000
09 Zulhelmi - 110,000 110,000 220,000 72,000 96,000 388,000 95,000
01 Suryadi 70,000 110,000 180,000 180,000 134,000 153,000 467,000 305,000
02 Arizal Fahmi - 130,000 130,000 180,000 177,500 159,000 516,500 85,000
03 Junaidi Usman - 110,000 110,000 200,000 144,000 142,000 486,000 275,000
04 Hamriza 62,000 110,000 172,000 150,000 103,500 136,000 389,500 285,000
05 Idris Budiman 70,000 110,000 180,000 140,000 107,000 110,000 357,000 190,000
06 Ramli Syam 100,000 130,000 230,000 220,000 180,000 90,000 490,000 240,000
07 Mawardi 80,000 110,000 190,000 200,000 105,000 50,000 355,000 195,000
08 Mahdi Yahya - 125,000 125,000 230,000 170,000 82,000 482,000 270,000
09 Rusli Piah - 125,000 125,000 240,000 145,000 140,000 525,000 115,000
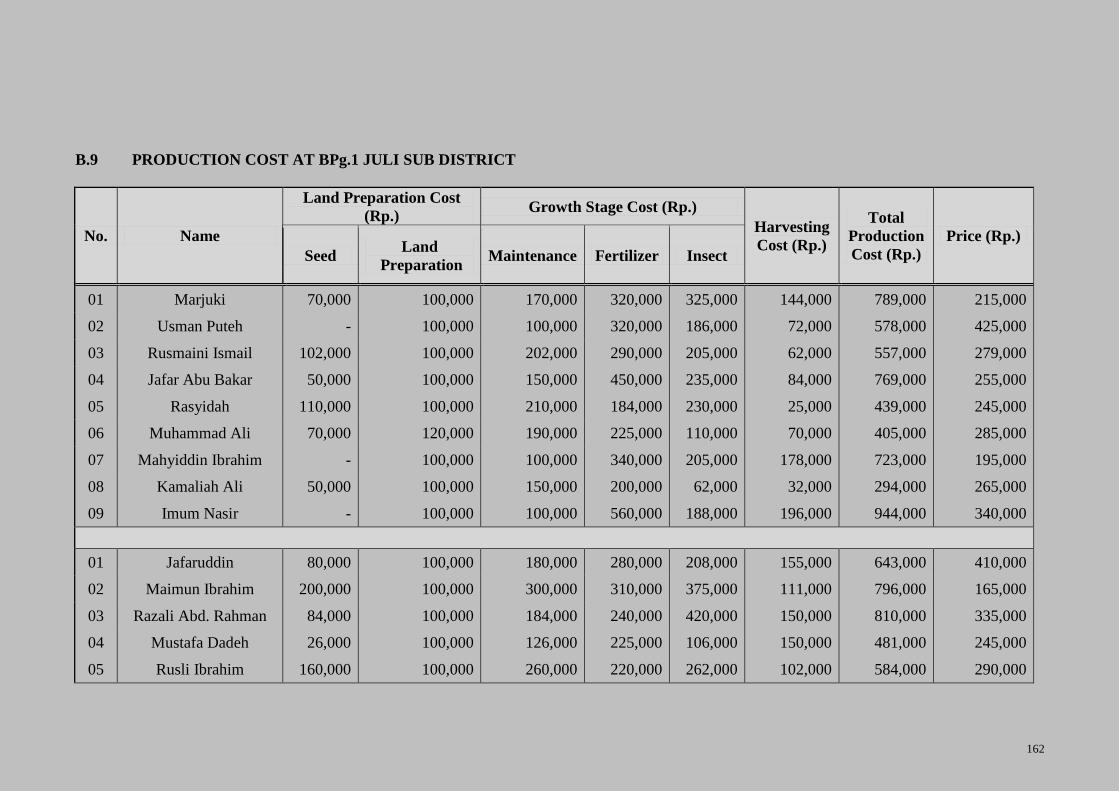
162
B.9 PRODUCTION COST AT BPg.1 JULI SUB DISTRICT
No. Name
Land Preparation Cost
(Rp.) Growth Stage Cost (Rp.)
Harvesting
Cost (Rp.)
Total
Production
Cost (Rp.)
Price (Rp.)
Seed Land
Preparation Maintenance Fertilizer Insect
01 Marjuki 70,000 100,000 170,000 320,000 325,000 144,000 789,000 215,000
02 Usman Puteh - 100,000 100,000 320,000 186,000 72,000 578,000 425,000
03 Rusmaini Ismail 102,000 100,000 202,000 290,000 205,000 62,000 557,000 279,000
04 Jafar Abu Bakar 50,000 100,000 150,000 450,000 235,000 84,000 769,000 255,000
05 Rasyidah 110,000 100,000 210,000 184,000 230,000 25,000 439,000 245,000
06 Muhammad Ali 70,000 120,000 190,000 225,000 110,000 70,000 405,000 285,000
07 Mahyiddin Ibrahim - 100,000 100,000 340,000 205,000 178,000 723,000 195,000
08 Kamaliah Ali 50,000 100,000 150,000 200,000 62,000 32,000 294,000 265,000
09 Imum Nasir - 100,000 100,000 560,000 188,000 196,000 944,000 340,000
01 Jafaruddin 80,000 100,000 180,000 280,000 208,000 155,000 643,000 410,000
02 Maimun Ibrahim 200,000 100,000 300,000 310,000 375,000 111,000 796,000 165,000
03 Razali Abd. Rahman 84,000 100,000 184,000 240,000 420,000 150,000 810,000 335,000
04 Mustafa Dadeh 26,000 100,000 126,000 225,000 106,000 150,000 481,000 245,000
05 Rusli Ibrahim 160,000 100,000 260,000 220,000 262,000 102,000 584,000 290,000
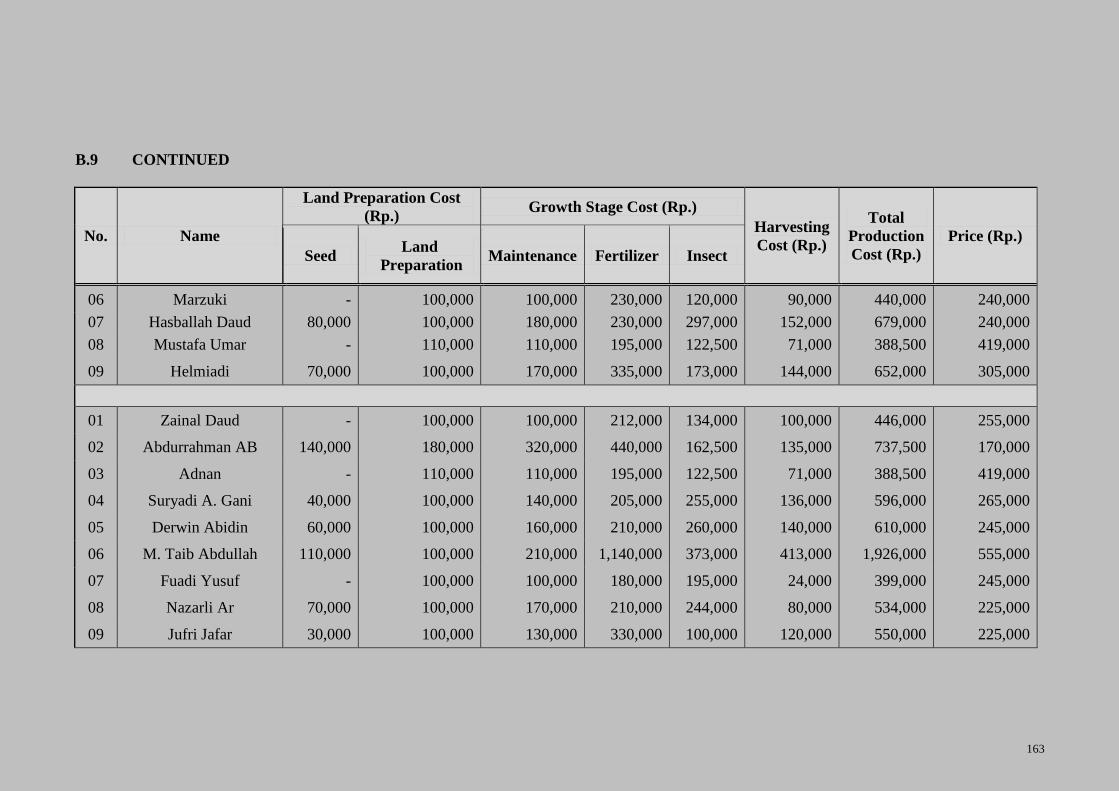
163
B.9 CONTINUED
No. Name
Land Preparation Cost
(Rp.) Growth Stage Cost (Rp.)
Harvesting
Cost (Rp.)
Total
Production
Cost (Rp.)
Price (Rp.)
Seed Land
Preparation Maintenance Fertilizer Insect
06 Marzuki - 100,000 100,000 230,000 120,000 90,000 440,000 240,000
07 Hasballah Daud 80,000 100,000 180,000 230,000 297,000 152,000 679,000 240,000
08 Mustafa Umar - 110,000 110,000 195,000 122,500 71,000 388,500 419,000
09 Helmiadi 70,000 100,000 170,000 335,000 173,000 144,000 652,000 305,000
01 Zainal Daud - 100,000 100,000 212,000 134,000 100,000 446,000 255,000
02 Abdurrahman AB 140,000 180,000 320,000 440,000 162,500 135,000 737,500 170,000
03 Adnan - 110,000 110,000 195,000 122,500 71,000 388,500 419,000
04 Suryadi A. Gani 40,000 100,000 140,000 205,000 255,000 136,000 596,000 265,000
05 Derwin Abidin 60,000 100,000 160,000 210,000 260,000 140,000 610,000 245,000
06 M. Taib Abdullah 110,000 100,000 210,000 1,140,000 373,000 413,000 1,926,000 555,000
07 Fuadi Yusuf - 100,000 100,000 180,000 195,000 24,000 399,000 245,000
08 Nazarli Ar 70,000 100,000 170,000 210,000 244,000 80,000 534,000 225,000
09 Jufri Jafar 30,000 100,000 130,000 330,000 100,000 120,000 550,000 225,000

164