Embed Size (px)
Citation preview
Performance assessment & Performance assessment & benchmarking benchmarking
IBNET as toolIBNET as toolfor utility management and policy for utility management and policy
decisionmakersdecisionmakers
Caroline van den BergCaroline van den BergNovember 24, 2008November 24, 2008

What is IBNET?What is IBNET? IBNET started as an initiative to collect data on IBNET started as an initiative to collect data on
performance of WSS utilities to improve policy performance of WSS utilities to improve policy dialogue in the early/mid-1990sdialogue in the early/mid-1990s
Since then, it has developed in three separate Since then, it has developed in three separate products that can be found atproducts that can be found at www.ib-net.orgwww.ib-net.org

The Elements of IBNETThe Elements of IBNET
1.1. IBNET ToolkitIBNET Toolkit is a suite of software and guidance is a suite of software and guidance documents to help utilities compile, analyze and documents to help utilities compile, analyze and share performance information share performance information
2.2. IBNET websiteIBNET website includes a searchable database includes a searchable database with indicators from more than 2500 utilities from with indicators from more than 2500 utilities from more than 80+ countries:more than 80+ countries:
Toolkit can be downloaded in different languagesToolkit can be downloaded in different languages Database with indicator search mechanism & Database with indicator search mechanism &
reporting formatsreporting formats A section with links and resources to assist A section with links and resources to assist
measurement and benchmarkingmeasurement and benchmarking3.3. IBNET helpdesk at IBNET helpdesk at [email protected]@worldbank.org

Basic principles of IBNETBasic principles of IBNET
Focus on utilities, while also of use for Focus on utilities, while also of use for governments, consumer regulators, consumer governments, consumer regulators, consumer organizations, donors organizations, donors
Voluntary participationVoluntary participation Easy to implement tool, focusing on a basic set of Easy to implement tool, focusing on a basic set of
performance indicators: create a common performance indicators: create a common language between financial and operational stafflanguage between financial and operational staff
Low cost toolLow cost tool Learning by doing approachLearning by doing approach Information on indicators is easily accessible – Information on indicators is easily accessible –
sharing lessons between utilitiessharing lessons between utilities

What IBNET can tell you?What IBNET can tell you? Understanding utility performance on the basis Understanding utility performance on the basis
of a set of objective indicators:of a set of objective indicators: performance of the individual utility over timeperformance of the individual utility over time performance of the individual utility with other performance of the individual utility with other
utilities operating in the sector, or similar utilities utilities operating in the sector, or similar utilities elsewhere in the worldelsewhere in the world
Analysis to see how the performance of the Analysis to see how the performance of the utility and/or the sector can be improved upon utility and/or the sector can be improved upon
Advanced research and comparisons:Advanced research and comparisons: Trends in utility performance (benchmarking)Trends in utility performance (benchmarking) Development of new indicators that reflect the Development of new indicators that reflect the
specific utility needs/sector needsspecific utility needs/sector needs Econometric work -- frontier and productivity Econometric work -- frontier and productivity
analysisanalysis

Utility Utility managersmanagers and and IBNET dataIBNET data
Common language for technical and financial Common language for technical and financial staff staff
Performance assessment:Performance assessment: Set-up baseline: where are we now?: detecting Set-up baseline: where are we now?: detecting
weaknessesweaknesses Set-up performance objectives: where we want Set-up performance objectives: where we want
to go?: setting priorities and targetsto go?: setting priorities and targets Performance monitoring: are we getting there?Performance monitoring: are we getting there?
Advocacy – detect what impedes progress and Advocacy – detect what impedes progress and what has to be done to overcome the what has to be done to overcome the impedimentsimpediments
Comparisons between utilities, best practices, Comparisons between utilities, best practices, tool for analysistool for analysis

Basic Analytical Tools in IBNETBasic Analytical Tools in IBNET

Utility ScorecardUtility Scorecard
2002 200494 97
38 32
233 208
N/ A 165
N/ A 50
N/ A 68.0
N/ A 15
1.29 0.16
N/ A N/ A
1.32 0.58
9 30
N/ A N/ A
1.02 3.5524.1 Operating Cost Coverage (ratio) 3.63
23.1 Collection Period (Days) 22
23.2 Collection Ratio (%) N/ A
12.3 Staff W/ 1000 W pop served (W/ 1000 W pop served) N/ A
18.1 Average Revenue W&WW (US$/ m3 water sold) 1.58
8.1 % Sold that is Metered (%) 90
11.1 Operational Cost W&WW (US$/ m3 water sold) 0.43
6.1 Non Revenue Water (%) 50
6.2 Non Revenue Water (m3/ km/ day) 39.0
4.1 Total Water Consumption (l/ person/ day) 180
4.7 Residential Consumption (l/ person/ day) 144
1.1 Water Coverage (%) 97
2.1 Sewerage Coverage (%) 35
Utility ReportCosta Rica, Costa Rica National Utility, AyA (Utility Code: 999071)
Indicator 2003

Benchmarking utilities: Benchmarking utilities: Operational Cost Coverage Ratio – multi-city, Operational Cost Coverage Ratio – multi-city,
large utilitieslarge utilities

Country scorecardCountry scorecard

Sector ScorecardSector Scorecard
Examples of Other Analyses: Examples of Other Analyses: The Case of MoldovaThe Case of Moldova

Impact on efficiency Impact on efficiency improvements: convergenceimprovements: convergence
Staff RatioStaff Ratio
1996 1997 1998 1999 2000 2001 2002 2003 2004 2005 2006 2007
Year
10.00
20.00
30.00

Impact on efficiency Impact on efficiency improvements: convergence improvements: convergence
(2)(2)
2003 2004 2005 2006 2007
Year
50.00
75.00
100.00
125.00
150.00
Collection Ratio
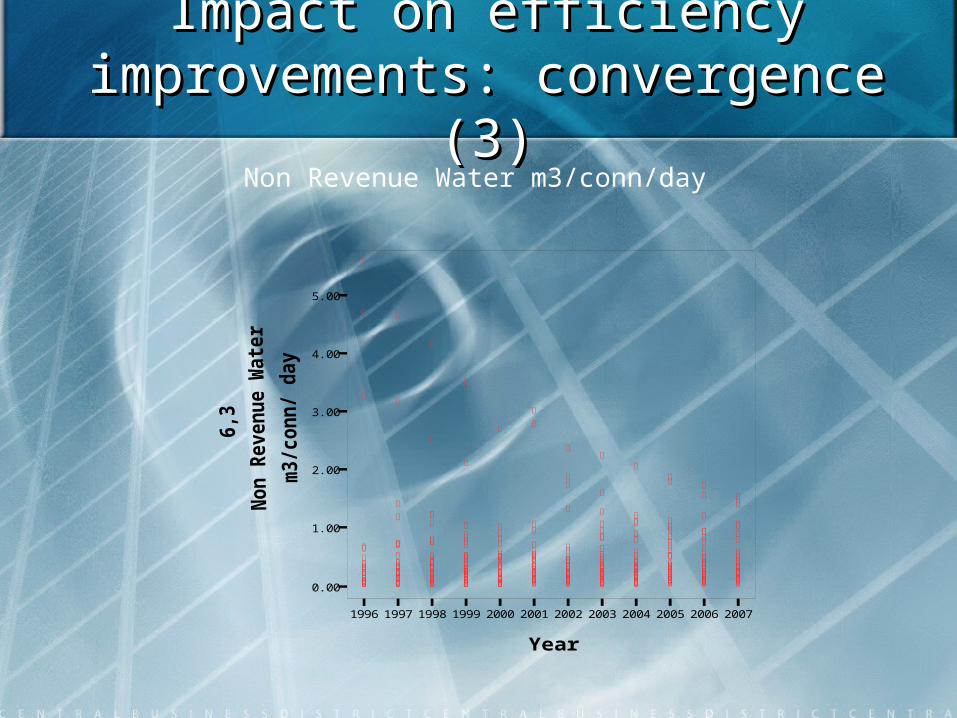
Impact on efficiency Impact on efficiency improvements: convergence improvements: convergence
(3)(3)
1996 1997 1998 1999 2000 2001 2002 2003 2004 2005 2006 2007
Year
0.00
1.00
2.00
3.00
4.00
5.00
Non Revenue Water m3/conn/day

Impact on efficiency Impact on efficiency improvements improvements
Two impacts:Two impacts: Efficiency levels: trend Efficiency levels: trend
is going in the right is going in the right direction;direction;
Convergence of Convergence of performance: the performance: the “bad” performing “bad” performing utilities get betterutilities get better
Benchmarking as tool Benchmarking as tool for yardstick for yardstick competition pays offcompetition pays off
1996 1997 1998 1999 2000 2001 2002 2003 2004 2005 2006 2007
Year
0.00
50.00
100.00
150.00
200.00
24,1
Op
erat
ing
Co
st C
ove
rag
e
rati
o

Impact on policy Impact on policy developmentdevelopment
Sector reform has Sector reform has been pushed been pushed supported by supported by benchmarkingbenchmarking
The efficiency of the The efficiency of the sector has increased sector has increased as implicit subsidies as implicit subsidies have declined have declined significantly over significantly over timetime
Implicit Subsidies, $US million
0
5
10
15
20
25
30
35
40
45
2000 2001 2002 2003 2004 2005 2006 2007
implicit subsidy - unaccounted losses implciit subsidy - tariffs below costs
implicit subsidy - collection failures

Examples of Other Analyses: Examples of Other Analyses: The Impact of the Triple CrisisThe Impact of the Triple Crisis

Impact of the Triple CrisisImpact of the Triple Crisis
O&M Cost per m3 water soldO&M Cost per m3 water sold
2000 2001 2002 2003 2004 2005 2006 2007
YEAR
0.00
0.50
1.00
1.50
2.00

Demand for IBNETDemand for IBNET
Even though no major dissemination has taken place Even though no major dissemination has taken place so far, with the push for dissemination, access to so far, with the push for dissemination, access to website has grown significantly from 7,000 hits in website has grown significantly from 7,000 hits in Sep05 to about 80,000 in Oct08Sep05 to about 80,000 in Oct08
Use of IBNET data in projects, reports and other Use of IBNET data in projects, reports and other publications in-and outside the Bankpublications in-and outside the Bank
Use of IBNET by countries to improve their Use of IBNET by countries to improve their benchmarkingbenchmarking
Standard tool for assessment of utility performance in Standard tool for assessment of utility performance in Moldova, and Latin America’s ADERASAMoldova, and Latin America’s ADERASA
Use of IBNET by countries to improve their Use of IBNET by countries to improve their benchmarkingbenchmarking
Working with many different partners – both national Working with many different partners – both national and regional partnersand regional partners

Issues in IBNETIssues in IBNET
Data collection issues:Data collection issues: Use of standardized data definitions and data Use of standardized data definitions and data
tools to ensure comparability of data within tools to ensure comparability of data within and between countriesand between countries
Looking for national partners that can collect Looking for national partners that can collect data and ensure future data collection data and ensure future data collection efforts: the benefits of institutionalizationefforts: the benefits of institutionalization
Data quality requires a lot of attention: Data quality requires a lot of attention: Capacity building with data collecting Capacity building with data collecting
agencies: process takes timeagencies: process takes time Control mechanisms to check on Control mechanisms to check on
inconsistencies in the collected datainconsistencies in the collected data Need for follow-up on data collection with Need for follow-up on data collection with
analysis of collected data and actual analysis of collected data and actual assistance to utilities wherever is neededassistance to utilities wherever is needed

ConclusionsConclusions By providing access to comparative By providing access to comparative
information key stakeholders will get the information key stakeholders will get the information to do their jobs betterinformation to do their jobs better:: Utility managers and employees can identify Utility managers and employees can identify
areas for improvement, adopt realistic targets areas for improvement, adopt realistic targets and—not least—convince authorities of the and—not least—convince authorities of the need for change;need for change;
Governments can monitor and adjust sector Governments can monitor and adjust sector policies and programs;policies and programs;
Regulators can ensure that customers get Regulators can ensure that customers get value, and providers have incentives to value, and providers have incentives to perform;perform;
Customer groups and NGOs can exercise Customer groups and NGOs can exercise “voice” in an informed way;“voice” in an informed way;
Conclusions (2)Conclusions (2) IBNET:IBNET:
Use of IBNET as a tool with a tested Use of IBNET as a tool with a tested methodology with adjustments and expansionsmethodology with adjustments and expansions
Sharing data to ensure that learning and Sharing data to ensure that learning and communication can take placecommunication can take place
We hope to ensure your participation in IBNET – We hope to ensure your participation in IBNET – directly or indirectly so that this tool can help directly or indirectly so that this tool can help to improve the sector to provide better and to improve the sector to provide better and more universal access to its servicesmore universal access to its services
Collaboration with WOP – we hope that WOP Collaboration with WOP – we hope that WOP can move the agenda forward with focusing on can move the agenda forward with focusing on 1.1. further analysis with secondary data links; and further analysis with secondary data links; and 2.2. create the link with performance improvements create the link with performance improvements

THANK YOUTHANK YOU
For more information, please For more information, please contact:contact:
Caroline van den Berg Caroline van den Berg ([email protected])([email protected])
Alexandar Danilenko ([email protected])Alexandar Danilenko ([email protected])