Embed Size (px)
Citation preview
0
PERFORMANCE AND EMISSION CHARACTERISTICS OF AN
AUTOMOTIVE DIESEL ENGINE USING BIODIESEL FUEL
WITH THE INFLUENCE OF AIR INTAKE VARIABLES
by
RIZALMAN MAMAT
A thesis submitted to
The University of Birmingham
for the degree of
DOCTOR OF PHILOSOPHY
School of Mechanical Engineering
The University of Birmingham
November 2009

University of Birmingham Research Archive
e-theses repository This unpublished thesis/dissertation is copyright of the author and/or third parties. The intellectual property rights of the author or third parties in respect of this work are as defined by The Copyright Designs and Patents Act 1988 or as modified by any successor legislation. Any use made of information contained in this thesis/dissertation must be in accordance with that legislation and must be properly acknowledged. Further distribution or reproduction in any format is prohibited without the permission of the copyright holder.
1
ABSTRACT
The air induction system plays a major role by providing necessary air charge
for combustion to take place in an engine cylinder. The pressure drop across the air
intake manifold is known to have a significant effect on the indicated power of the
internal combustion engine. Most car manufacturers locate the air grill at the front of
a vehicle to enhance the volumetric efficiency. However due to wading performance,
for a sport utility vehicle like a Land Rover Freelander the air grill is located at the
side of the front tyre. The air speed at the grill side is high and creates negative
pressure, thus reducing the volumetric efficiency. Therefore, a thorough study of the
design of the air induction system (AIS) with negative pressure at the air grill is vital,
in order to fully understand the flow behavior in this AIS. Moreover, when the engine
is equipped with turbocharger, the performance of the air intake system is also
affected by the exhaust parameter which depends on the combustions of fuel in the
engine cylinder. The properties of biodiesel are slightly different in density, viscosity
and cetane number. These parameters are potentially affecting the combustion in
engine cylinder. Thus, the investigation of the effect of fuel on the air intake system is
vital for the study of the diesel engine operating with biodiesel. The analysis of the
combustion of biodiesel in a V6 diesel engine includes the ignition delay, rate of heat
release, in-cylinder peak pressure as well as the exhaust emissions.
The study consists of 3 parts; (1) three-dimensional CFD analysis on the
performance of the Land Rover Freelander AIS, (2) one-dimensional analysis of a V6
diesel engine with the effect of the AIS, (3) experimental study of a V6 diesel engine
operating with RME and ULSD; The three-dimensional analyses on the performance
2
of a Freelander AIS have been conducted to study the effect of negative pressure on
pressure-drop in the intake manifold. The results show that the magnitude of negative
pressure gives significant effect not just to pressure drop but also to the flow behavior
in the intake manifold. The steady flow tests on the actual intake manifold of a
Freelander model have been conducted to validate the simulation outcome. The
results show good agreement between experiment and simulation.
In order to improve understanding on the flow wave action on the intake
manifold of a V6 diesel engine, one-dimensional engine simulations have been
conducted using commercial Ricardo WAVE v7.2 software. The result shows good
agreement between simulation and experiment. The simulation result shows a
significant affect on the wave action as pressure drop increases from zero to 20% in
the intake manifold.
The research continued further to investigate the effect of air induction
parameters in the V6 diesel engine such as pressure drop and flow temperature on the
performance and emissions of the engine. The effect of intake flow parameter to the
engine when operated with RME has been studied and the comparisons have been
made when ULSD is used as base fuel. The experimental results show that in general,
the engine operating with RME produces lower power and higher bsfc due to low
energy content of RME as compared to ULSD. The emissions of NOx are slightly
higher, but lower CO and HC are produced. The pressure drop along the AIS has
significantly affected the performance as well as emissions of the engine. The
performance of the diesel engine drops significantly as the pressure drop increases and
exhaust emissions increase considerably.
3
ACKNOWLEDGEMENTS
I would like to express my gratitude and sincere thanks to my supervisor
Professor Hongming Xu for his guidance, support and encouragement throughout my
study. I also would like to thank my associate supervisor Professor Miroslaw Lech
Wyszynski for his passions toward the remarkable end of my study.
I would also like to thank my sponsors:
• The Malaysia Government for the provision of my Ph.D. scholarship
• Jaguar Land Rover (JLR) for financial and technical support towards the
research project,
o Dr J. Qiao and Dr Steven Pierson (Jaguar Cars Limited) for their
technical assistance
o Dr Adrian Gaylard (Land Rover Gaydon) for the provision of the 3D
geometry of the Land Rover air intake system
• Shell Global Solutions UK through Dr R. F. Cracknell for the supply of
ULSD and RME test fuels;
I gratefully acknowledge Dr. Athanasios Tsolakis for his helpful discussion
during this project. I would like to acknowledge Dr Mingshan Wei and Dr Xin Shi for
long discussion and advice on developing the one-dimensional model. A special
thank you goes to my colleagues Dr S. Chuepeng, Dr. A. F. Mahrous, Dr. K.
Theinnoi, Mr Nik Rosli Abdullah, and friends in FPS group for their fruitful
discussions, friendship and help.
Rizalman Mamat
November 2009

4
I wish to dedicate this thesis…
To my parents
To my beloved wife and lovely kids: Nur Dania, Nur Najah and Haziq
To my brothers and sisters,
And friends
5
TABLE OF CONTENTS
CHAPTER 1 INTRODUCTION
1.1 Background 24
1.1.1 Diesel Engine Technology 25
1.1.2 Alternative Fuels for Diesel Engines 28
1.1.3 Combustion in Diesel Engines 29
1.2 Objectives and Approaches 31
1.3 Thesis Outline 33
CHAPTER 2 LITERATURE REVIEW
2.1 Air Intake System for Diesel Engines in a Vehicle 34
2.1.1 System Component and Development 37
2.1.2 Optimisation of AIS by Computational Fluid Dynamics 42
2.1.3 One-Dimensional Modelling of an Air Intake System 46
2.2 Biodiesel as an Alternative Fuel
2.2.1 Biodiesel Production, Policies and Standardisation 47
2.2.2 Performance and Emissions of Biodiesel as Fuel in ICE 50
2.3 Exhaust Emissions from the Combustion of Biodiesel
2.3.1 Oxides of Nitrogen 53
2.3.2 Carbon Monoxide 55
2.3.3 Unburned Hydrocarbons 56
2.3.4 Particulate Matter 57
2.4 Summary 58
6
CHAPTER 3 RESEARCH METHODOLOGY
3.1 Setup of CFD Models 59
3.1.1 Governing Equations 60
3.1.2 Turbulence Model 64
3.1.3 Modelling Approach 67
3.1.4 Grid Generation 68
3.2 Experimental System and Techniques
3.2.1 Steady Flow Test 72
3.2.1.1 Purpose of Steady Flow Testing 72
3.2.1.2 Design and Setup of Steady
Flow Test Bench 73
3.2.2 The engine Performance Characteristic 80
3.2.3 Diesel Engine Test Setup
3.2.3.1 Engine Test Bench 83
3.2.3.2 Engine Fuel System 87
3.2.3.3 Engine Cooling System 88
3.2.3.4 Exhaust Emissions Measurement 90
3.2.3.5 Data Acquisition System 91
3.3 Summary 96
7
CHAPTER 4 CFD MODELLING OF AIR INTAKE SYSTEM AND
VALIDATION
4.1 Introduction 97
4.2 Problem Definitions 97
4.3 Boundary Conditions 100
4.4 Result & Discussions 102
4.4.1 Simulation under Static Entry Flow 103
4.4.2 Tangential Velocity Magnitude 107
4.4.3 Grid Sensitivity Test 110
4.5 Summary 111
CHAPTER 5 ONE DIMENSIONAL MODELLING OF A V6 DIESEL
ENGINE AND VALIDATION
5.1 Introduction 112
5.2 Engine Model Setup 112
5.2.1 General Parameter of Diesel Engine 114
5.2.2 Heat Transfer and Combustion Model 116
5.2.3 Engine Valves, Injection Timing and Turbocharger
Set-up 122
5.3 Simulation Results and Data Validation
5.3.1 Simulation Result and Validation at Full Load Curve 124
5.3.2 Simulation Results with Variable Boost Pressure 128
5.4 Summary 135
8
CHAPTER 6 ENGINE PERFORMANCE AND EMISSIONS WITH
BIODIESEL
6.1 Introduction 136
6.2 Engine Test Conditions 137
6.3 Engine Testing at Low Load and Part Load 138
6.4 Diesel Engine Operating with RME and ULSD 144
6.5 Effect of Fuel Temperatures 148
6.6 Effect of Multiple Injection 158
6.7 Summary 168
CHAPTER 7 EFFECT OF AIR INTAKE VARIABLES TO THE ENGINES
PERFORMANCE AND EMISSIONS
7.1 Effect of Boost Pressure Drop 170
7.1.1 Engine Performance 173
7.1.2 Exhaust Gas Emissions 178
7.2 Effect of Charge Air Temperature 181
7.2.1 Engine performance 187
7.2.2 Exhaust Gas Emission 189
7.3 Summary 191
9
CHAPTER 8 CONCLUSION AND RECOMMENDATIONS
8.1 Conclusion Remarks 194
8.1.1 Influence of Negative Pressure on Induction Grill 194
8.1.2 One-Dimensional Analysis of Air Induction System 194
8.1.3 Engine Performance and Emissions of a Diesel Engine
Operating with ULSD and RME 195
8.1.4 The Effect of Intake Charge Pressure Drop and Temperature on
Engine Performance 196
8.2 Recommendation for Future Work 198
8.2.1 The Modifications of Current Design of a Freelander Air Intake
System 198
8.2.2 The Effect of EGR Rate and Exhaust Gas Temperature to the
Intake Charge 198
8.2.3 Transient Operation on Diesel Engine Operating with ULSD
and RME 199
REFERENCE 200
APPENDIX 215
10
LIST OF ABBREVIATIONS
AIS Air induction system
BMEP Brake mean effective pressure [Bar]
bsfc Brake specific fuel consumption [kg/kWh]
BSN Bosch smoke number [BSN]
BV Butterfly valve
CAD Crank angle degree [degree]
CFD Computational fluid dynamics
CO Carbon monoxide
CO2 Carbon dioxide
COV Coefficient of variation
COVIMEP Coefficient of variation in IMEP
COVPmax Coefficient of variation in peak cylinder pressure
DI Direct injection
EGR Exhaust gas recirculation
EMS Engine management system
EPSP Exhaust port static pressure [Pa]
EU European Union
FAME Fatty acid methyl ester
GUI Graphic user interface
HC Hydrocarbon
HCCI Homogeneous charge compression ignition
HCLD Heated chemiluminescent detector
HCN Hydrogen cynide
HFID Heated flame ionisation detector
IMEP Indicated mean effective pressure [Bar]
IPSP Intake port static pressure [Pa]
IWG Inch water gauge [In]
JLR Jaguar-Land Rover
11
LHV Lower heating value [kJ/kg]
Ltd Limited
MAIM Metal intake manifold
MDA Measure Data Analyzer
MFB Mass fraction burn [%]
NDIR Non-dispersive infrared
NEDC New European Driving Cycle
NI National Instrument
NH3 Ammonia
NO Nitric oxide
NO2 Nitrogen dioxide
NOx Nitrogen oxides
N2O Nitrogen dioxide
NVH Noise vibration and harness
PAH Polycyclic aromatic hydrocarbon
PAIM Plastic air intake manifold
PM Particulate matter
RME Rapeseed methyl ester
RH Relative humidity [%]
RME Rapeseed ethyl ester
RoHR Rate of heat release [J/CAD]
SI Spark ignition
SOC Start of combustion [CAD]
SOI Start of injection [CAD]
THC Total hydrocarbon
TDC Top dead centre
ULSD Ultra low sulphur diesel
VA Virtual array
VGT Variable geometry turbocharger
VPA Valve plate angle [degree]
12
LIST OF SYMBOL
D Engine cylinder bore [m]
df Diffusive fuel fraction
g Gravity [m/s2]
Hg Heat transfer coefficient [W/m2k]
K Kelvin [K]
N Engine speed [rpm]
NB Brake engine speed [rpm]
O2 Oxygen
p Pressure [Pa]
Pb Engine brake power [W]
Pdrop Pressure drop [Pa]
pf Premixed fuel fraction
Pmot Cylinder pressure at motored condition [Pa]
Pr Reference pressure [Pa]
Q Heat release [J]
Rswirl Swirl ratio
t Time [s]
T Temperature [K]
Tb Brake torque [Nm]
tf Tail fuel fraction
Tr Reference temperature [K]
u Local velocity at x-axis [m/s2]
v Local velocity at y-axis [m/s2]
V Volume [m3]
vc Characteristic velocity [m/s2]
Vd Volume displacement [m3]
vm Mean piston speed [m/s]
Vr Reference volume [m3]
vs Swirl velocity [m/s]
13
w Local velocity at z-axis [m/s]
ε Dissipation rate [m2/s3]
µ Viscosity [Pa.s]
λ Air excess ratio
τ Shear stress [Pa]
κ Kinetic energy [kg.m2/s2]
mf Fuel mass flow rate [kg/s]
ηth Engine thermal efficiency [%]
ρ Density [kg/m3]
γ Ratio of specific heat
∆θdelay Ignition delay [s]
θb Start of combustion [CAD]
Φ Equivalence ratio
14
LIST OF FIGURES
Figure 2.1 Schematic diagram of typical AIS system for diesel engine
Figure 2.2 Intake duct system with porous material
Figure 2.3 Example of variable intake manifold (a) Six cylinder variable intake
manifold, DaimlerChrysler. (b) Four cylinder variable intake manifold,
Opel. (c) Six cylinder variable intake manifold, Volkswagon. (d) Four
cylinder variable intake manifold, Volkswagon.
Figure 2.4 Optimisation of intake port by CFD
Figure 2.5 The pressure level and streaklines of the airbox (Vita, 2002)
Figure 2.6 Coefficient of pressure in the surface of Audi 100 II and Audi 100 III.
Figure 2.7 Chemical reaction of triglyceride and methanol to produce biodiesel
Figure 3.1 Simulation flow chart
Figure 3.2 Three dimensional geometry of the Freelander air intake system.
Figure 3.3 Close view of Freelander intake grill
Figure 3.4 Two different grid with y-y’ axis marked on the cross section of the
‘bridge’.
Figure 3.5 Shows the velocity magnitude at Y-Y’ axis for Grid 1 and Grid 2.
Figure 3.6 Commercial steady flow test bench (a) SuperFlow (Superflow 2008),
(b) Cussons (Cussons 2008)
Figure 3.7 Schematic diagram of steady flow test bench.
Figure 3.8 Performance curve for SECOMAK pump model 587/2
Figure 3.9 Photograph of the Freelander air intake grill.
Figure 3.10 Pressure measurement locations on intake duct
Figure 3.11 Incline manometer model Type 504 by Airflow Instrument Ltd.
Figure 3.12 Photograph of the orifice plate by Roxspur Measurement &
Instrumentation Ltd
Figure 3.13 Photograph of steady flow test bench
15
Figure 3.14 Typical p-V diagram of a four-stroke cycle (Heywood 1988)
Figure 3.15 Photograph of test engine
Figure 3.16 Dynamometer and controller system
Figure 3.17 Schematic diagram of fueling system on a V6 diesel engine
Figure 3.18 Schematic diagram of a cooling system on a V6 diesel engine
Figure 3.19 Exhaust gas analyzer, (a) AVL DiGAS 440 and
(b) CEB200 exhaust gas analyzer
Figure 3.20 Arrangement of a National Instrument DAQ Card, connector box and
PC
Figure 3.21 GUI of LabVIEW code for data display and record
Figure 3.22 Schematic diagram of V6 diesel engine system
Figure 3.23 AVL Piezo Amplifier
Figure 3.24 GUI of LabVIEW 4 to analyse the in-cylinder pressure
Figure 3.25 Main panel of INCA GUI to monitor the engine operation
Figure 4.1 Freelander travel under specific level of the water (Motortorque 2008).
Figure 4.2 Pressure distributions on Freelander vehicle body
Figure 4.3 Velocity vector of fluid flow around the vehicle body
Figure 4.4 Pressure drop measured on five different locations at different mass
flow-rate.
Figure 4.5 Velocity vector on x-z plane inside the duct [m/s]
Figure 4.6 Contour of static pressure on x-z plane inside the duct [Pa]
Figure 4.7 Contour of static pressure on intake grill [Pa]
Figure 4.8 Path lines color by particle ID
Figure 4.9 Pressure drop measured and calculated at P2 against different mass
flow rates.
Figure 4.10 Contours of static pressure on (a) x-z plane inside the duct (b) grill
surface
Figure 4.11 Vectors of velocity on the grill side
Figure 4.12 Path lines colored by particle ID.
Figure 5.1 Ricardo WAVE software graphic user interface panel
16
Figure 5.2 Schematic diagram of the engine model.
Figure 5.3 The preloaded component of engine component available
from elements panel
Figure 5.4 Valve lift profile for the V6 engine
Figure 5.5 Valve lift profile in Ricardo WAVE software (a) intake valve lift
profile, (b) exhaust valve lift profile
Figure 5.6 Injection strategies for the V6 engine
Figure 5.7 Compressor map of a VGT turbocharger (GT15)
Figure 5.8 Power and torque curve
Figure 5.9 Calibration of mass air flow and bsfc.
Figure 5.10 Intake port static pressure responses as VPA altered.
Figure 5.11 Breathing performance (a) Engine air flow; (b) Total volumetric of the
engine under varies intake pressure
Figure 5.12 Engine performances as a function of engine speed, (a) engine brake
power, (b) engine brake torque
Figure 5.13 Engine performances as a function of engine speed. (a) Brake thermal
efficiency and (b) maximum of in-cylinder pressure
Figure 5.14 Exhauat properties (a) Exhaust gas temperature and
(b) exhaust port static pressure
Figure 5.15 Engine fueling and pumping performance (a) bsfc
(b) brake mean effective pressure
Figure 6.1 The 16 test operating conditions from NEDC (Chuepeng 2008).
Figure 6.2 Air excess ratio and fuel injection pressure against test mode
Figure 6.3 Start of injection for pilot and main injection against test mode
Figure 6.4 Brake specific fuel consumption and engine thermal efficiency against
test mode
Figure 6.5 In-cylinder pressure profile against crank angle degree
Figure 6.6 Emission of NOx and a comparison with peak pressure as a functions
of test mode.
Figure 6.7 Carbon monoxide and total hydrocarbon against test mode.
17
Figure 6.8 Cylinder pressure and rate of heat release for ULSD and RME at
engine speed of 1550rpm, 67 Nm brake torque
Figure 6.9 Ignition delay and peak pressure for ULSD and RME at engine speed
of 1550rpm.
Figure 6.10 Emissions of NOx and THC for ULSD and RME fuelling at engine
speed of 1550rpm
Figure 6.11 Emissions of particulate matter, engine running at 1550 rpm, 3.1 bar
BMEP
Figure 6.12 Response of injection pressure in the engine as a consequence of EGR
mode and fuel temperature. E1 and E0 represent the EGR mode ON
and OFF respectively
Figure 6.13 In-cylinder pressure and rate of heat release for three different fuel
temperatures.
Figure 6.14 Maximum of in-cylinder pressure
Figure 6.15 Close-up view of in-cylinder pressure during the main injection period.
Figure 6.16 Close-up view of rate of heat release during premixed combustion.
Figure 6.17 Brake specific fuel consumption
Figure 6.18 Engine efficiency
Figure 6.19 Emissions of NOx
Figure 6.20 Emissions of CO in the exhaust gas as a function of fuel temperature
Figure 6.21 Emissions of THC in the exhaust gas as a function of fuel temperature
Figure 6.22 Manifold absolute pressures
Figure 6.23 EGR controlled by the EMS
Figure 6.24 Peak pressure and thermal efficiency at different modes of injection
and EGR operation
Figure 6.25 Brake specific fuel consumption at 1550 rpm, brake torque 67 Nm
Figure 6.26 Cylinder pressure and rate of heat release at 1550 rpm,
brake torque 67 Nm
Figure 6.27 Mass fraction burn at 1550 rpm, brake torque 67 Nm
Figure 6.28 Emissions of NOx at 1550 rpm, brake torque 67 Nm
Figure 6.29 Emissions of unburned hydrocarbons at 1550 rpm, brake torque 67 Nm
Figure 6.30 Emission of carbon monoxide at 1550 rpm, brake torque 67 Nm
18
Figure 6.31 Emission of particulate matter at 1550 rpm, brake torque 67 Nm
Figure 7.1 Air flow rate at engine speed of 1550rpm (a) low load, BMEP 3.1bar ,
(b) part load, BMEP 4.7bar
Figure 7.2 Fuel flow rate at engine speed of 1550rpm (a) low load, BMEP 3.1bar ,
(b) part load, BMEP 4.7bar
Figure 7.3 Cylinder pressure for ULSD and RME at different pressure drops at
engine speed of 1550rpm (BMEP 4.7bar)
Figure 7.4 Ignition delay as consequences of pressure drop and engine load at
engine speed of 1550rpm; (a) low load, BMEP 3.1bar (b) part load,
BMEP 4.7bar
Figure 7.5 Brake specific fuel consumption at engine speed of 1550rpm; (a) low
load, BMEP 3.1bar (b) part load, BMEP 4.7bar
Figure 7.6 Efficiency of the engine at engine speed of 1550rpm; (a) low load,
BMEP 3.1bar (b) part load, BMEP 4.7bar
Figure 7.7 Exhaust emissions of NOx at engine speed of 1550rpm (a) low load,
BMEP 3.1bar (b) part load, BMEP 4.7bar
Figure 7.8 Emissions of carbon monoxide at engine speed of 1550rpm (a) low
load, BMEP 3.1bar (b) part load, BMEP 4.7bar
Figure 7.9 Emissions of total hydrocarbon at engine speed of 1550rpm; (a) low
load, BMEP 3.1bar (b) part load, BMEP 4.7bar
Figure 7.10 Fuel flow rate at engine speed of 1550rpm (a) low load, BMEP 3.1bar
(b) part load, BMEP 4.7bar
Figure 7.11 Air flow rate at engine speed of 1550rpm (a) low load, BMEP 3.1bar
(b) part load, BMEP 4.7bar
Figure 7.12 Engine excess air ratio at engine speed of 1550rpm (a) low load,
BMEP 3.1bar (b) part load, BMEP 4.7bar
19
Figure 7.13 Fuel injection pressure at engine speed of 1550rpm (a) low load,
BMEP 3.1bar (b) part load, BMEP 4.7bar
Figure 7.14 Brake specific fuel consumption at engine speed of 1550rpm (a) low
load, BMEP 3.1bar (b) part load, BMEP 4.7bar
Figure 7.15 Engine efficiency at engine speed of 1550rpm (a) low load, BMEP
3.1bar (b) part load, BMEP 4.7bar
Figure 7.16 Exhaust emission of NOx at engine speed of 1550rpm (a) low load,
BMEP 3.1bar (b) part load, BMEP 4.7bar
Figure 7.17 Exhaust emission of CO at engine speed of 1550rpm (a) low load,
BMEP 3.1bar (b) part load, BMEP 4.7bar
Figure 7.18 Exhaust emission of THC at engine speed of 1550rpm (a) low load,
BMEP 3.1bar (b) part load, BMEP 4.7bar
20
LIST OF TABLES
Table 3.1 Specification of wind tunnel
Table 3.2 Specification of test engine
Table 3.3 Specification of dynamometer
Table 3.4 Fuel properties
Table 4.1 Boundary conditions for numerical analysis at different air speeds
Table 4.2 Experimental against predicted pressure drop at location P2.
Table 4.3 Simulation results of mass flow rate
Table 5.1 Detail parameter of a Lion V6 diesel engine
Table 5.2 Comparison of the test and simulation result
Table 5.3 Mass air flow and bsfc of a V6 diesel engine
Table 5.4 Valve plate angle and intake port static pressure
Table 6.1 Engine operating conditions
Table 6.2 Parameters of injection in different modes
Table 7.1. Pressure drop in air intake systems
Table 7.2. Boost temperature in air intake systems
21
List of Publications
1. Performance and Emission Characteristics of High Performance Diesel
Engine Operating with Biodiesel.
R. Mamat, H.M. Xu, M.L.Wyszynski (2008), Graduate School Poster &
Networking Conference, 11 June 2008, The University of Birmingham, United
Kingdom
2. CFD Analysis of Air Intake System with Negative Pressure on Intake Grill
R. Mamat, A.F.Mahrous, H.M. Xu, M.L.Wyszynski (2008), SAE International
Powertrains, Fuels and Lubricants Congress, June 23-25, 2008, Shanghai, China.
SAE 2008-01-1643
3. Effect of Exhaust Gas Temperature on Engine Performance and Emissions
of a Conventional V6 Diesel Engine Operating on Biodiesel & Diesel Fuel
with Exhaust Gas Recirculation (EGR)
R. Mamat, S. Chuepeng, H.M. Xu, M.L.Wyszynski (2008), United Kingdom-
Malaysia Engineering Congress 2008, London, 14-15 July 2008
4. Optimising the Airflow of a Land Rover Air Intake System
R. Mamat, H.M. Xu, M.L.Wyszynski (2008), Universities Internal Combustion
Engines Group Conference (UnICEG), Poster presentation, 17 December 2008,
The University of Birmingham, United Kingdom
5. Effect of Air Intake Pressure Drop on Performance and Emissions of a
Diesel Engine Operating with Biodiesel and Ultra Low Sulphur Diesel
(ULSD)
R. Mamat, N.R.Abdullah, H.M. Xu, M.L.Wyszynski A.Tsolakis (2009),
International Conference on Renewable Energy and Power Quality, 15-17 April
2009, Valencia, Spain
22
6. Effect of Fuel Temperature on Combustion and Emissions of a Common
Rail Diesel Engine
R. Mamat, N.R.Abdullah, H.M. Xu, M.L.Wyszynski, A.Tsolakis (2009) 2009
SAE International Powertrains, Fuels and Lubricants Meeting June 15-17, 2009
Florence, Italy, SAE Paper No. 2009-01-1896
7. Effect of Exhaust Gas Recirculation (EGR) with Multiple Injections on
Combustion Pattern in a Common Rail Diesel Engine
R. Mamat, N.R.Abdullah, H.M. Xu, M.L.Wyszynski, A.Tsolakis (2009), 12th
EAEC European Automotive Congress 2009, 29th June - 1st July 2009,
Bratislava, Slovak Republic.
8. Optimization of High Injection Pressure and EGR on Engine Performance
and Emissions using V6 Common Rail Diesel Engine,
N.R.Abdullah, R. Mamat, A.Tsolakis, M.L.Wyszynski, H.M. Xu (2009) 9th
International Conference on Engines and Vehicles. September 13-18, 2009
Capri, Naples, Italy. SAE Paper No. 2009-24-0049
9. Contributions of Injection Duration (dSOI) to the Engine Performance and
Emissions in Multiple Injections V6 Diesel Engine Operating with a
Variation of Injection Pressure
N.R.Abdullah, R. Mamat, A.Tsolakis, M.L.Wyszynski, H.M. Xu (2009), Journal
of KONES Internal Combustion Engines, European Science Society of
Powertrain and Transport Publication. (Journal Accepted)
10. Influence of Boost Temperature on a Common Rail Diesel Engine
Operating with Biodiesel
R. Mamat, N.R.Abdullah, H.M. Xu, M.L.Wyszynski, A.Tsolakis (2009) FISITA
2010 World Automotive Congress May 30 - June 4, 2010, Budapest, Hungary
(Abstract submitted)

23
11. Modelling of a V6 Diesel Engine Operating with Biodiesel in One-
Dimensional Engine Simulation
R. Mamat, N.R.Abdullah, Jun Zhang, H.M. Xu, M.L.Wyszynski, A.Tsolakis
(2009) Prepared for Journal of Automobile Engineering
24
CHAPTER 1
INTRODUCTION
The first chapter of the thesis is devoted to the general overview of a diesel
engine, in relation to the combustion and emissions. The chapter presents the
operation of a diesel engine with alternative fuel, specifically biodiesel. It also
discusses the air intake system and its evolution to meet the current demand on
emission regulation without compromising on performance issues. At the end of the
chapter, the objectives of the research and thesis outline are presented.
1.1 Background
Automotive engines are one of the major sources of pollutant, which is
harmful to living creatures and causes damage to the environment (Liu 1999; Hester et
al. 2004). The transportation sector accounted for 21% of all CO2 emissions
worldwide in 2002 which is the major cause to the global warming issues. In recent
years, many countries have applied stringent emission standards to automotive
manufacturers. Therefore, modern diesel engines are equipped with many features
such as EGR and common rail fuel injection system to control their emissions while
maintaining or improving the performance of the engine. Furthermore, the future
25
generation of diesel engine should be able to work with alternative fuels such as
biodiesel and alcohol due to limited sources of fossil diesel fuel, and environmental
concern. Much research has been conducted on biodiesel as an alternative to the diesel
engine fuels (Kawano et al. 2006; Chuepeng et al. 2007; Szybist et al. 2007; Tsolakis
et al. 2007; Zheng et al. 2008).
1.1.1 Diesel Engine Technology
The diesel engine was named after Dr Rudolf Diesel who in 1897 invented an
engine with direct injection of liquid fuel into the combustion chamber. The engine
was originally designed to work with peanut oil. The diesel engine is also known as a
compression ignition (CI) engine due to its principles of cycles. The ignition of fuel
in the combustion chamber occurs due to high temperature and pressure during the
compression stroke. The diesel engine is not throttled the amount of fresh air enters
the engine as Otto cycles is used to control the output power. Instead, the power is
controlled by the amount of fuel injected into the cylinder. Thus designing a good air
induction system (AIS) is vital to a diesel engine to achieve higher engine
performance.
Diesel engine performance is well known to be limited by the formation of
smoke, which forms if there is inadequate mixing of the fuel and air (Ferguson 2001).
Therefore, much research has been conducted on optimisation of the AIS as well as
the combustion chamber to improve the diesel mixing process. Many attempts have
been conducted to improve emissions by new techniques and devices such as exhaust
26
gas recirculation system (EGR), after treatment technology, catalytic converter.
Others have tried with alternative fuels such as biodiesel and alcohol.
EGR technology is one of the most promising techniques to reduce emissions
especially NOx. A number of reports can be found in the literature (mainly
experimental) dealing with the effects of EGR to reduce NOx in diesel engines and
have proved the effectiveness of this technique (Ladommatos et al. 1998; Yang et al.
2002; Zheng et al. 2004; Kawano et al. 2007). There are three renowned explanations
on how the EGR reduces the NOx emissions. The EGR increases the ignition delay,
increases the heat capacity of the intake charge and dilutes the intake charge with inert
gas component (Pierpont et al. 1995). The detailed explanation on this subject can be
found in many books and technical papers (Heywood 1988; Abd-Alla 2002; Musculus
2004; Maiboom et al. 2008).
The injection system of diesel engines also evolved a step further to achieve
higher engine performance and lower the exhaust gas emissions. One of the advanced
fuel injection systems is known as common-rail fuel injection. The main advantage of
common rail system is its ability to vary injection pressure and timing over broad
scale (Kimberley 2004). The quality of combustion process in diesel engines is highly
dependent on fuel injection parameters (Heywood 1988). The diesel fuel injections
systems produce an heterogeneous spray process in the combustion chamber.
Therefore, accurate control over fuel injection, and thus spray formation, is crucial for
diesel engines to increase their performance and lower the emission level. The design
of the common rail fuel injection system, with its flexible control of injection into
multiple injections, allows the engine and the injection system to be synchronized to
27
achieve the optimum conditions. The common-rail system thus plays a major role in
increasing specific power output, lowering fuel consumption and decreasing noise and
exhaust emissions from diesel engines (Kimberley 2004). The use of multi injection
in diesel combustion is practical to reduce NOx and has been proved by many groups
especially by Reitz and his colleagues (Patterson et al. 1994; Montgomery et al. 1996).
The extensive research on the Perkins Engine recently, also proved that the
combination of EGR and high pressure fuel injection (up to 1600 bar) on a
1.0litre/cylinder engine has demonstrated the capability of achieving less than 3.0 g/
kWh NOx and 0.08 g/kWh particulate without the need for exhaust after-treatment
(Dennis et al. 1999).
The essential function of the engine air intake system is to provide sufficient
air to be mixed with fuel in the engine combustion chamber. The fundamental design
of the air intake system has not changed too much since when it was used in internal
combustion engines. The system normally comprises of dirty duct, air box, air
cleaner, clean duct, intake manifold plenum, and intake manifold runner.
Engine performance is sensitive to induction depression especially for Internal
Combustion (IC) engines running without a turbocharger or supercharger.
Turbocharger is widely used to increase the performance of the diesel engine. The
engine operating without turbocharger suffers from a pressure drop of the air
induction system. A positive pressure at the end of the grill would help to overcome
such a drawback. Thus, most car manufacturers position the grill at the front of the
vehicle to maximize the capability of the engine to consume more air. Furthermore,
drawing air from the front of the vehicle can minimize the interior noise contribution
28
from the intake orifice. However, for those vehicles which have been designed to
travel off-road, particularly in specific water levels, the air intake should be capable
enough to cruise without sucking water into the engine. In the series of Range Rover
vehicles, for instance, the grill intake currently points rearwards to the vehicle. Under
wind tunnel conditions, aerodynamics tests have recorded a slightly negative
depression in this area, a characteristic that can increase pressure drop on the air
intake system.
The pressure drop across the air intake system is known to have a significant
influence on the indicated power of the IC engine. The pressure drop is created due
to the suction generated by the descending piston in the case of a naturally aspirated
engine. The pressure drop along the intake system is very dependant on engine speed
and load, the flow resistance of different elements in the system, the cross sectional
area through which the fresh charge moves, and the charge density (EPA).
1.1.2 Alternative Fuels for Diesel Engines
The exhaust emissions generally result from the combustion of fossil fuel in
vehicle engines. Moreover, the mineral diesel fuel itself is toxic and may cause long
term adverse effects to the aquatic environment. Experimental studies have found that
the polycyclic aromatic hydrocarbons contained in diesel may induce skin cancer, as
reported on gas oil safety data sheet by BP Oil UK Ltd (BP 1998). Therefore,
research on new alternative fuels is very important to overcome these problems.
29
Biodiesel is one of the most important renewable energy resources, which is
produced from vegetable oil or animal fat by transesterification of triacylglycerols,
yielding monoalkyl esters of long-chain fatty acids with short-chain alcohols (Meng et
al. 2008). The main benefit of biodiesel is that it is ‘carbon neutral’. Although the
engines running on biodiesel produce more CO2 compared to conventional diesel
fuels, if the analysis includes the carbon cycle, the use of biodiesel actually emits less
CO2 to the atmosphere. The biodiesel could be used on it own or blended with
conventional fossil fuel without having to make any modification to the standard
diesel engines because biodiesel has comparable properties to diesel (Agarwal 2007;
Tsolakis et al. 2007).
The advantage of biodiesel has been reported by many researchers as
renewable energy, non-toxic, biodegradable and sulphur free (Labeckas et al. 2006;
Bozbas 2008). In addition, a mixture of biodiesel with standard diesel fuel improves
the lubricating properties of the fuel and reduced cylinder friction (Nwafor 2004).
1.1.3 Combustion in Diesel Engines
The combustion process in compression ignition (CI) engines is very
complicated. Much research has been conducted to study the behaviour of the
combustion process in an engine cylinder. In a CI engine, the combustion started just
after a few crank angle degree of start of injection. The chemical reaction occurrs in
an engine cylinder which produce diffusion flame at the interface between fuel and
30
air. The heat release begins and increases as a rapid burning spreads through
combustion chamber and decreases as the available oxygen is depleted.
The combustion process can be classified in two phases. Premixed
combustion and mixing controlled combustion. The liquid fuel supplied to the engine
is compressed into a finely atomized state, vaporized, and penetrates into the hot and
highly compressed air in the combustion chamber. The combustion starts when the
local temperature reaches or goes above the auto-ignition temperature. The time
interval between the start of injection (SOI) and the start of combustion (SOC) is
derived as ignition delay. This parameter plays an important role to the quality of
combustion in a diesel engine.
The initial combustion of the fuel vapour-air mixture is derived as the
premixed combustion phase. The remaining combustion process is called the mixing
controlled combustion phase. In diesel combustion, the double peak shape of heat
release rate appears as a result of two phase combustion occurred during combustion
stroke. The first peak occurs during the premixed combustion. The heat release curve
in the premixed combustion phase is relatively independent of engine load as the
initial mixing is independent of engine injection duration. The second peak of the
heat release curve resulted from the mixing controlled combustion phase. The
magnitude and duration of the mixing controlled heat release is proportional to the
duration of injection. The heat release curve is normally derived from the cylinder
pressure data generally from -20 degree BTDC to 40 degree ATDC.
31
Cylinder pressure is one of the crucial parameters to be measured to gain deep
understanding on quantitative information on the progress of combustion in the engine
cylinder (Heywood 1988; Senatore et al. 2000). The assumptions made on the
calculation of heat release rate are including quasi static (temperature & pressure),
uniform gases in cylinder, with no dissociation of the chemical compounds present
after combustion, cylinder engine is considered closed system and specific heat of the
gaseous mixture are calculated as a function of temperature. The shape of the heat
release rate which represents different behaviors of combustion varies with engine
design, speed and load (Lilly 1984).
1.2 Objectives and Approaches
The main objective of this research is to conduct a computational and
experimental study of the effect of air induction systems and biodiesel to the
performance and emission level of a diesel engine. The study is divided into two
major categories where the study has been conducted on AIS on off-engine mode and
with the engine respectively. The volumetric efficiency is a measure of the
performance of the AIS. This dimensionless number is depending on many factors in a
very complicated modern diesel engine. One of the major factors which reduce the
volumetric efficiency is the pressure difference between in-cylinder pressure and
intake orifice. This pressure difference is resulted from the aerodynamic force on the
vehicle skin and its magnitude depends on the speed of the vehicle. The study has
been conducted on this variable by CFD commercial code FLUENT and the
computational models will be validated against experimental data. The experimental
32
works on the AIS have been conducted on a state-of-the-art in-house design steady
flow test bench.
The fuel is known to have an affect to the performance of an air induction
system as explain in detail by Heywood (Heywood 1988). The exhaust temperature
and pressure is highly influenced by the combustion progress of fuels in the engine
cylinder. These parameters are definitely affecting the volumetric efficiency of the
engine especially when the engine is equipped with turbocharger. Therefore this
study includes the effect of the AIS variable to the engine operating with biodiesel as
compared to ULSD as a base fuel. Further analyses have been conducted on
combustion such as rate of heat release and mass fraction burn. The effect of these
variables on emission levels is also discussed as consequences of the combustion.
The second stage of the study is to artificially simulate the pressure drop on
AIS on a diesel engine operating at low load and part load conditions. As an
extension to the research, several variables that affected the AIS performance have
been investigated. These variables include
• Effect of pressure drop
• Effect of air intake temperature
• Effect of EGR.
33
1.3 Thesis Outline
This thesis is devoted to the study of the air intake flow conditions and their
contributions and effect to the performance and emission of a diesel engine operating
with fossil diesel and biodiesel. Therefore thesis topics are categorized as
introduction to diesel AIS, Computational Fluid Dynamics (CFD), steady-flow test,
combustion in a diesel engine, emission and biodiesel as an alternative fuel.
Following this first chapter, which is intended to review the general knowledge
and problem statement of the entire subject in the study, Chapter 2 is intended to
review the fundamental topics covered in the study through a literature survey. These
include computational as well as empirical solutions to the study. The research
methodology approach of AIS modelling and steady flow test are addressed in
Chapter 3. This chapter discusses details on the steady flow test rig setup as well as
the diesel engine setup. The 3D model is validated and discussed with steady flow
test results in Chapter 4. Chapter 5 is concerned with the 1D modelling of a Lion V6
engine and the validation results with experimental works. Chapter 6 is concerned
with the general overview of a diesel engine operation with biodiesel fuel. The results
include the performance and emissions measure both on ULSD and biodiesel.
Chapter 7 is dealing with the effect of inlet temperature and pressure as the main
intake manifold variable on a diesel engine operating with ULSD and biodiesel.
Chapter 7 is also concerned with the effect of EGR and its effect on the pressure and
temperature on AIS. The main conclusions of the presented work together with
recommendations for future investigations are covered in Chapter 8.
34
CHAPTER 2
LITERATURE REVIEW
This chapter presents an introduction to the air intake system and the
development of the technology to increase the performance of the air intake system.
This chapter also describes the optimisation of the air intake system by computational
fluid dynamics. In addition, the chapter discusses fundamental studies on diesel
combustion and emissions with the effect of air intake system parameter. The chapter
also covers application of biodiesel as alternative fuel to modern diesel engines.
2.1 Air Intake System for Diesel Engines
The basic function of an AIS is to deliver fresh air to the engine cylinder. The
design of an AIS comes in many different lengths, shapes & geometry. Typical
materials used to construct an AIS are cast aluminium, plastic, rubber (silicone) or
composite materials (fiberglass, carbon fiber or kevlar). The main intentions of AIS
design is to provide the cylinder with fresh air as much as possible so that more fuel
can be injected thus more power produced from the engine. The geometry of an AIS
has a strong influence on the volumetric efficiency in IC engines (Heywood 1988;
35
Winterbone et al. 1999). Therefore, intake manifold design must be carefully
engineered and tuned to provide the greatest efficiency. Modern design of an AIS for
diesel engines consists of many components which are necessary for a variety of
reasons. The most common components are EGR, turbocharger, intercooler, quarter-
wave resonator, porous material duct and airbox. Several of these components will be
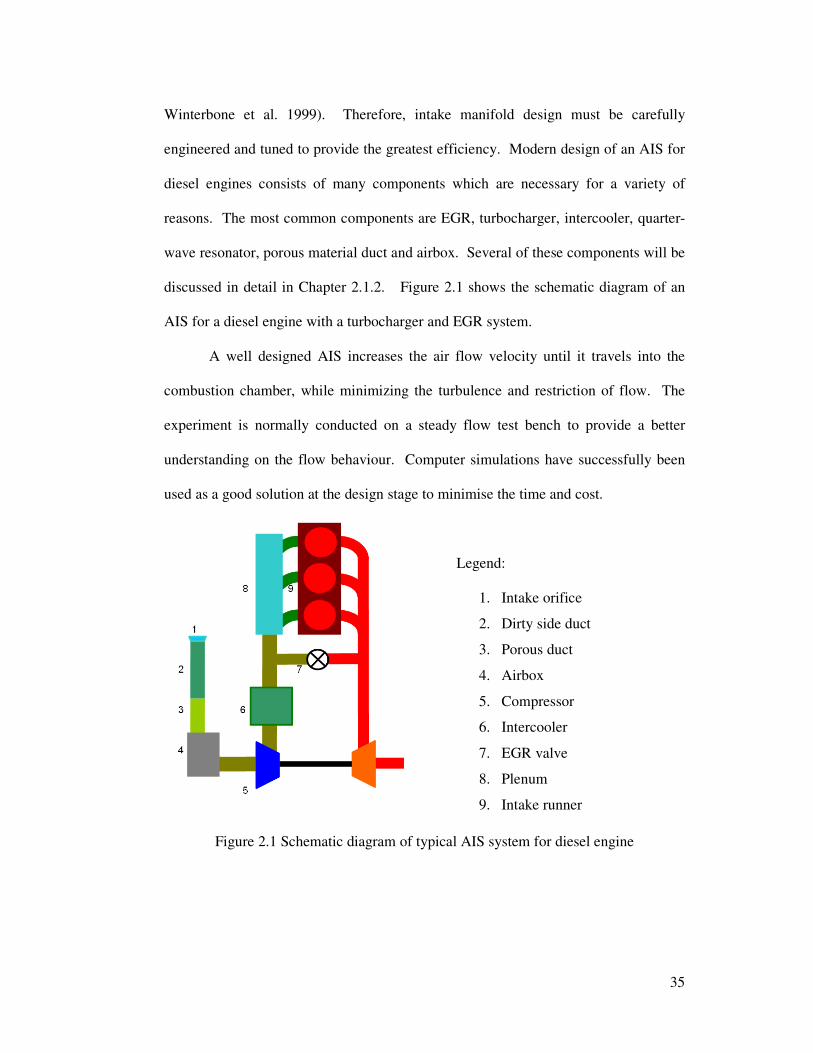
discussed in detail in Chapter 2.1.2. Figure 2.1 shows the schematic diagram of an
AIS for a diesel engine with a turbocharger and EGR system.
A well designed AIS increases the air flow velocity until it travels into the
combustion chamber, while minimizing the turbulence and restriction of flow. The
experiment is normally conducted on a steady flow test bench to provide a better
understanding on the flow behaviour. Computer simulations have successfully been
used as a good solution at the design stage to minimise the time and cost.
Legend:
1. Intake orifice
2. Dirty side duct
3. Porous duct
4. Airbox
5. Compressor
6. Intercooler
7. EGR valve
8. Plenum
9. Intake runner
Figure 2.1 Schematic diagram of typical AIS system for diesel engine
36
Modern design of an AIS has to meet the customer requirements, higher
efficiency and legislation. Criteria for a good AIS design can be summarized as
follows;
• High volumetric efficiency
• Low noise level (good NVH)
• Light weight design
• Low cost of material and production
• High thermal insulation.
Therefore, much research is conducted on designing new systems of intake
manifold with the new strategies to maximise the performance of the vehicles air
intake system. In general, the potential strategies used in designing an AIS are as
follows;
• Improve internal surface roughness of AIS to reduce air resistance
• Increase the diameter of intake manifold
• Reduce sharp corner, thus providing straight flow
• Tuning the length of intake manifold to provide optimum air flow base on
engine speed
• Choose the right place for intake orifice to get clean air (without dust), cooler
air and high pressure spot.
37
2.1.1 System Component and Development
The designer faces a challenge to design a good AIS based on many factors,
not only just on performance, but also in terms of production practicality, cost
effectiveness, material selection and limited space in the engine compartment.
Recently, a plastic air intake manifold (PAIM) has been adopted into almost all
modern ICE engines (Tanaka et al. 2007). The advantages of the PAIM are light mass
weight, low cost, high thermal-insulation efficiency. PAIM, which has a complex
design for stability and production reasons, often has a better characteristic in the low
frequency band (Paffrath et al. 1999). Recent studies have shown that the PAIM also
reduces air pressure loss compared with a metal air intake manifold (Tanaka et al.
2007). This is because the surface roughness of a PAIM is much better than a MAIM.
The production nature of the MAIM through sand casting, resulted in the poor surface
finish.
However, a PAIM also has disadvantages such as low burst pressure, higher
noise and vibration under certain engine speed and conditions. Recently, research has
been conducted to improve the properties of a PAIM by the used of CAE (Tanaka et
al. 2007). With regard to NVH, a plastic intake manifold is considered somewhat
negative since it is less rigid and less dense than an aluminium one (Lee 1998).
Much research activity has been conducted to improve the NVH behaviour of
the PAIM (Lee 1998; Siavoshani et al. 2001; Song et al. 2005). Most used CAE
successfully to understand the behaviour of the PAIM under specific engine load and
speed. Many AIS today include a silencer to minimize the noise entering the vehicle
cabin. However, silencers impede air flow and create turbulence which reduces
38
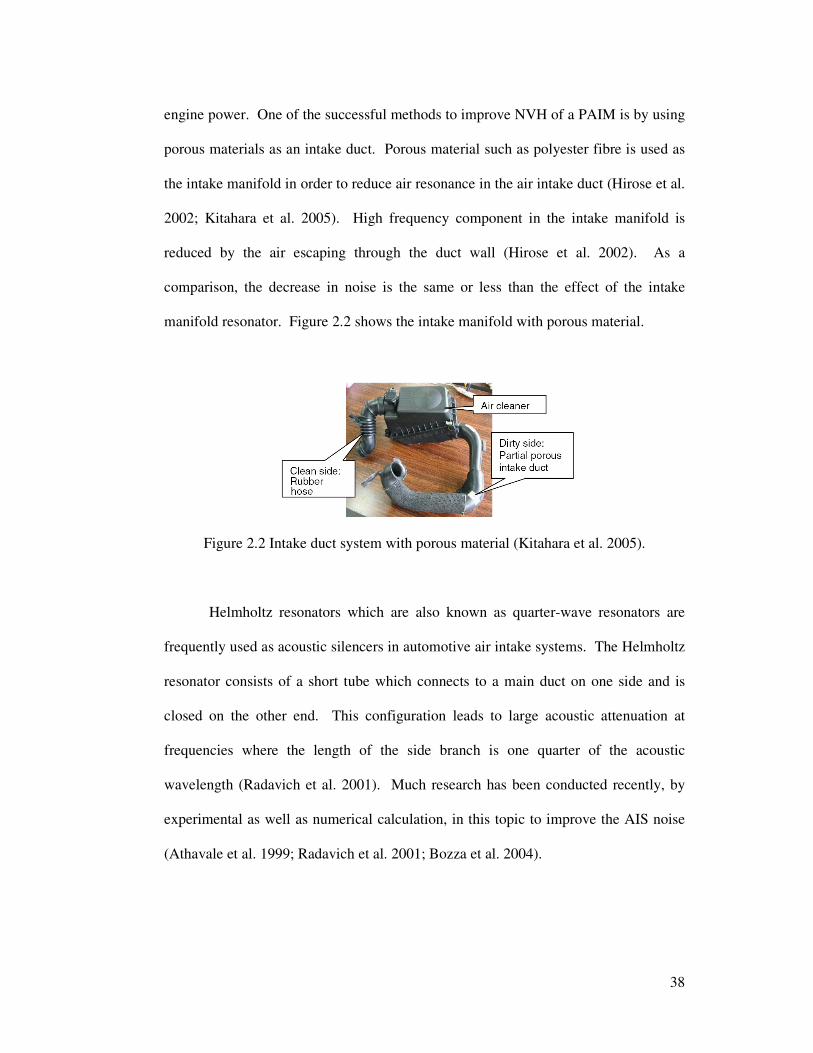
engine power. One of the successful methods to improve NVH of a PAIM is by using
porous materials as an intake duct. Porous material such as polyester fibre is used as
the intake manifold in order to reduce air resonance in the air intake duct (Hirose et al.
2002; Kitahara et al. 2005). High frequency component in the intake manifold is
reduced by the air escaping through the duct wall (Hirose et al. 2002). As a
comparison, the decrease in noise is the same or less than the effect of the intake
manifold resonator. Figure 2.2 shows the intake manifold with porous material.
Figure 2.2 Intake duct system with porous material (Kitahara et al. 2005).
Helmholtz resonators which are also known as quarter-wave resonators are
frequently used as acoustic silencers in automotive air intake systems. The Helmholtz
resonator consists of a short tube which connects to a main duct on one side and is
closed on the other end. This configuration leads to large acoustic attenuation at
frequencies where the length of the side branch is one quarter of the acoustic
wavelength (Radavich et al. 2001). Much research has been conducted recently, by
experimental as well as numerical calculation, in this topic to improve the AIS noise
(Athavale et al. 1999; Radavich et al. 2001; Bozza et al. 2004).
39
The firing order of the engine and the valve timing lead to a transient pressure
excitation at the runner outlets of an air intake manifold for an internal combustion
engine. The resulting pressure waves in the intake port have a significant effect on
volumetric efficiency. This natural air overcharge occurs at specific engine speed that
corresponds to a perfect timing between the intake valve closing and the maximum
pressure at the intake valve. Many attempts have been made to improve cylinder
filling by making greater effect of kinetic energy and pressure waves. Experiments by
Smith and Morisson in 1962 have proved that the different length of the manifold pipe
gives a significant effect on cylinder filling (Smith 1971). The standard intake
manifold has its geometry optimized for high speed power, or low speed, depending
on the normal drive of the car. Variable intake manifolds introduce one or two more
stages to deal with different engine speeds by changing their geometry.
The variable intake manifold system is also known as variable length intake
manifold or resonance intake manifold. However, it is usually named by the
manufacturer under their own trade mark such as Porsche’s VarioRam, Mitsubishi’s
Cyclone, Volvo V-VIS and Mazda’s VICS. Generally, a variable intake manifold
employs two intake manifolds with different length to serve each cylinder. However,
recently the variable intake manifold is designed to enhance the performance of AIS at
all engine speed. The intake manifold with extra length causes greater drop below
atmospheric pressure in cylinder pressure, followed by an increased rate of pressure
recovery (Smith 1971). This resulted in the higher final pressure which gives better
cylinder filling, thus improves torque output. The effect is obvious at low to mid
range of crank angle speed, whereas at high speed, there is insufficient time for ram
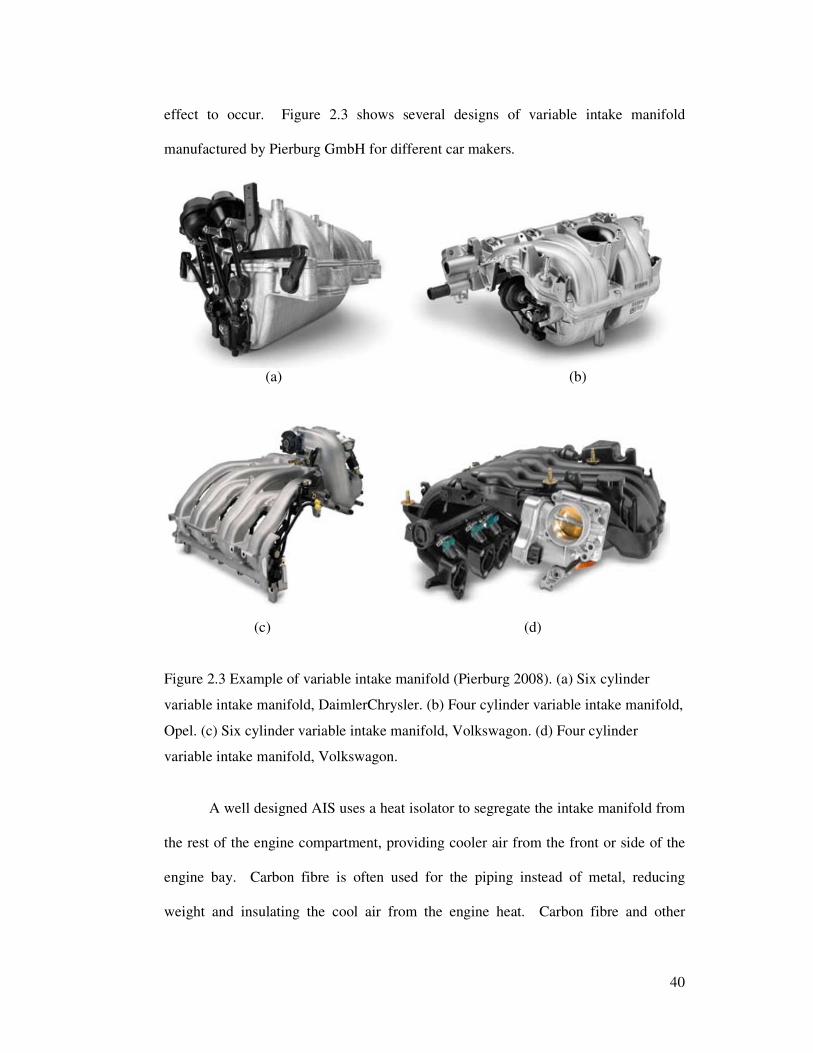
40
effect to occur. Figure 2.3 shows several designs of variable intake manifold
manufactured by Pierburg GmbH for different car makers.
(a) (b)
(c) (d)
Figure 2.3 Example of variable intake manifold (Pierburg 2008). (a) Six cylinder
variable intake manifold, DaimlerChrysler. (b) Four cylinder variable intake manifold,
Opel. (c) Six cylinder variable intake manifold, Volkswagon. (d) Four cylinder
variable intake manifold, Volkswagon.
A well designed AIS uses a heat isolator to segregate the intake manifold from
the rest of the engine compartment, providing cooler air from the front or side of the
engine bay. Carbon fibre is often used for the piping instead of metal, reducing
weight and insulating the cool air from the engine heat. Carbon fibre and other
41
advanced composites (such as Kevlar) are expensive, and can be more aesthetic rather
than functional. Mathew and his colleagues have investigated the use of Nylon 6,6
glass reinforced composite material for an AIS. The study includes the evaluations of
this composite material in terms of the intake manifolds material key requirements
such as thermal, heat aging, fatigue, impact, creep, stress and chemical resistance
including multi fuels (Mathew et al. 1999). He suggests that nylon glass reinforced
composite material is suitable for intake manifold applications as it has good
properties such as strength and toughness, and excellent retention of properties after
heat aging (Mathew et al. 1999). While another study by Chao has shown that nylon
composite also has good NVH characteristic (Chao et al. 1999). Due to many
advantages of composite material, it has become more and more popular choice
among AIS designers. In the high-volume (Original Equipment Manufacturer) OEM
market, injection molded composite intake manifolds have been growing steadily in
application for the past 20 years (Agnew et al. 2004).
Much research has been conducted to improve the intake port geometry in
cylinder heads. This is due to the fact that the intake port and inlet valve area is the
smallest flow passageway on an AIS where the biggest pressure drop occurrs. The
port design determines the volumetric efficiency and in-cylinder charge motion of the
engine which influences the thermodynamic properties directly related to the power
output, emissions, fuel consumption and NVH properties (Gaikwad et al. 2008).
Much research has been published on investigating the intake port geometry
especially on how its influence the swirl and tumble flow behaviour in an in-cylinder
engine (Kawashima et al. 1998; O'Connor et al. 1998; Li et al. 2000; Bevan et al.
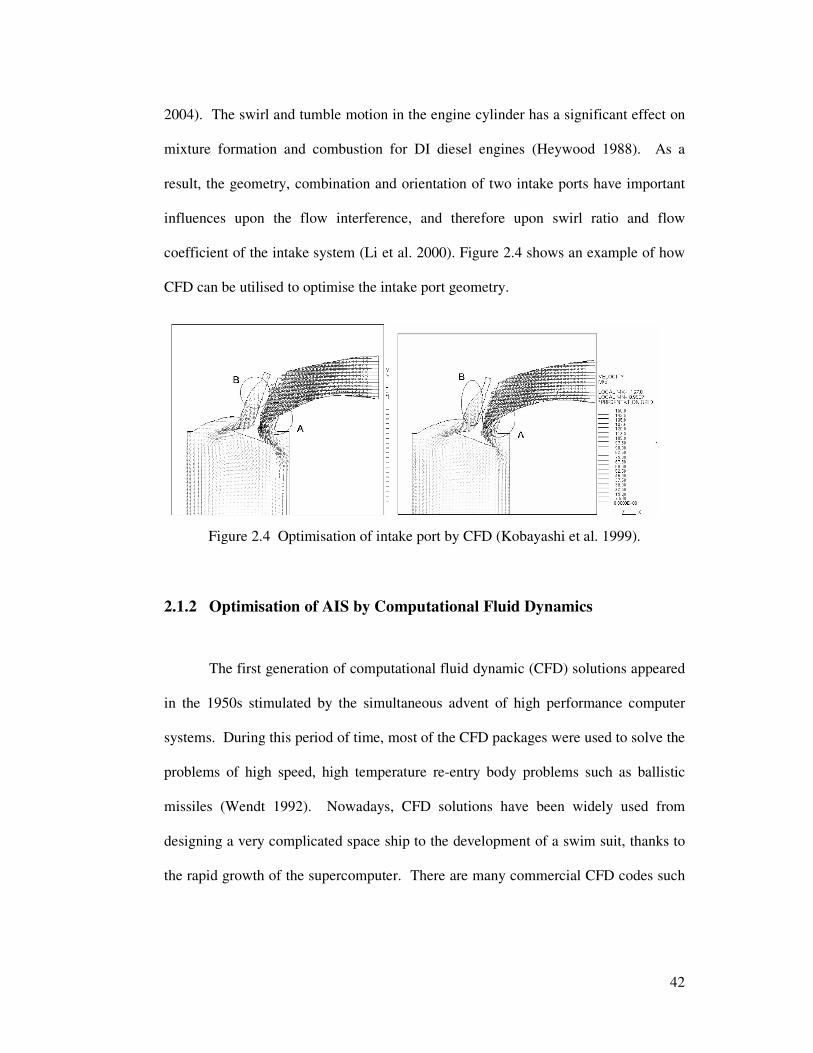
42
2004). The swirl and tumble motion in the engine cylinder has a significant effect on
mixture formation and combustion for DI diesel engines (Heywood 1988). As a
result, the geometry, combination and orientation of two intake ports have important
influences upon the flow interference, and therefore upon swirl ratio and flow
coefficient of the intake system (Li et al. 2000). Figure 2.4 shows an example of how
CFD can be utilised to optimise the intake port geometry.
Figure 2.4 Optimisation of intake port by CFD (Kobayashi et al. 1999).
2.1.2 Optimisation of AIS by Computational Fluid Dynamics
The first generation of computational fluid dynamic (CFD) solutions appeared
in the 1950s stimulated by the simultaneous advent of high performance computer
systems. During this period of time, most of the CFD packages were used to solve the
problems of high speed, high temperature re-entry body problems such as ballistic
missiles (Wendt 1992). Nowadays, CFD solutions have been widely used from
designing a very complicated space ship to the development of a swim suit, thanks to
the rapid growth of the supercomputer. There are many commercial CFD codes such
43
as FLUENT, CFX and Star-CD. These commercial codes have made as easy as
possible to use to minimize the time in solving fluid flow problems.
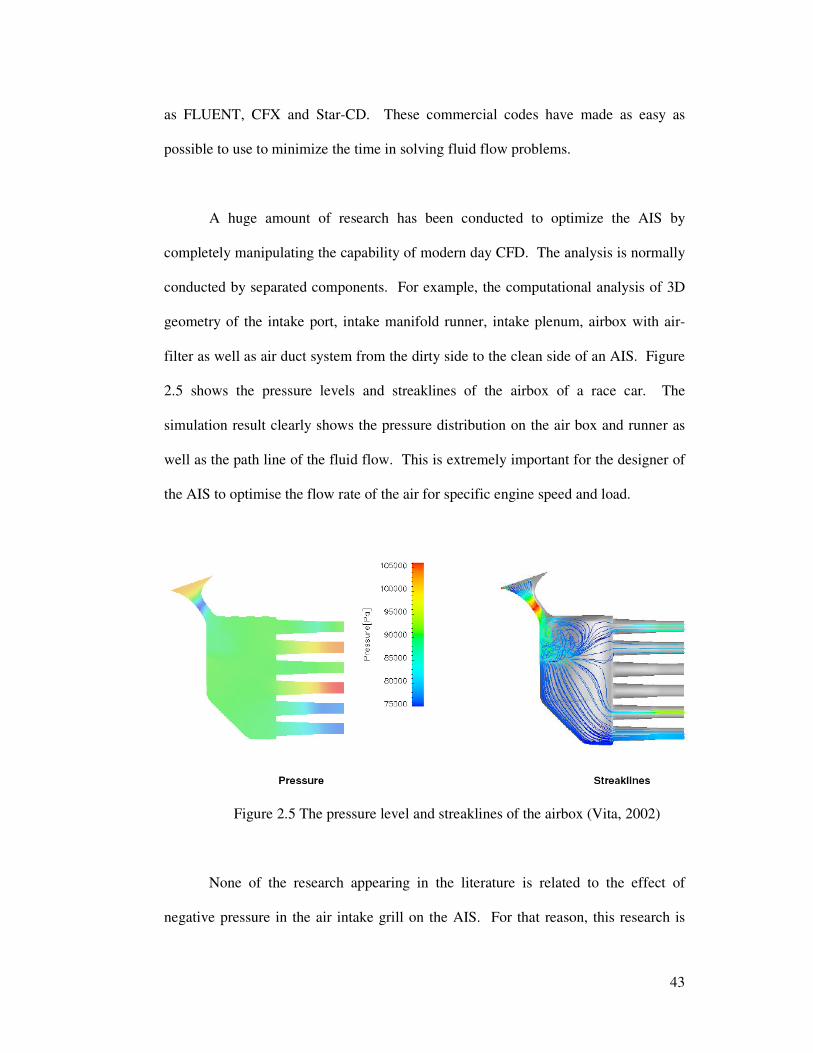
A huge amount of research has been conducted to optimize the AIS by
completely manipulating the capability of modern day CFD. The analysis is normally
conducted by separated components. For example, the computational analysis of 3D
geometry of the intake port, intake manifold runner, intake plenum, airbox with air-
filter as well as air duct system from the dirty side to the clean side of an AIS. Figure
2.5 shows the pressure levels and streaklines of the airbox of a race car. The
simulation result clearly shows the pressure distribution on the air box and runner as
well as the path line of the fluid flow. This is extremely important for the designer of
the AIS to optimise the flow rate of the air for specific engine speed and load.
Figure 2.5 The pressure level and streaklines of the airbox (Vita, 2002)
None of the research appearing in the literature is related to the effect of
negative pressure in the air intake grill on the AIS. For that reason, this research is
44
intended to study the effect of static pressure due to aerodynamic force on the vehicle
surfaces to the performance of the AIS. This is one of the resistance factors on an AIS
that have been studied by numerical analysis in this thesis. The cross flow velocity
magnitude and vector are consequences of the magnitude of ambient air velocity flow.
This numerical analysis is simulating the vehicle travel on the road at specified speed.
The AIS of a Freelander consists of an intake grill, intake orifice, dirty side
duct, porous duct, airbox with air filter, clean side duct and quarter-wave resonator.
The CFD analysis has been conducted in two stages. First, the simulation only
focuses on the grill, intake orifice and dirty side duct. This is to simplify the initial
simulation process. Thus, any unexpected error that occurs can be treated
instantaneously. Secondly, the simulation is for the whole AIS so that the flow
behaviour over the inside duct can be visualized qualitatively.
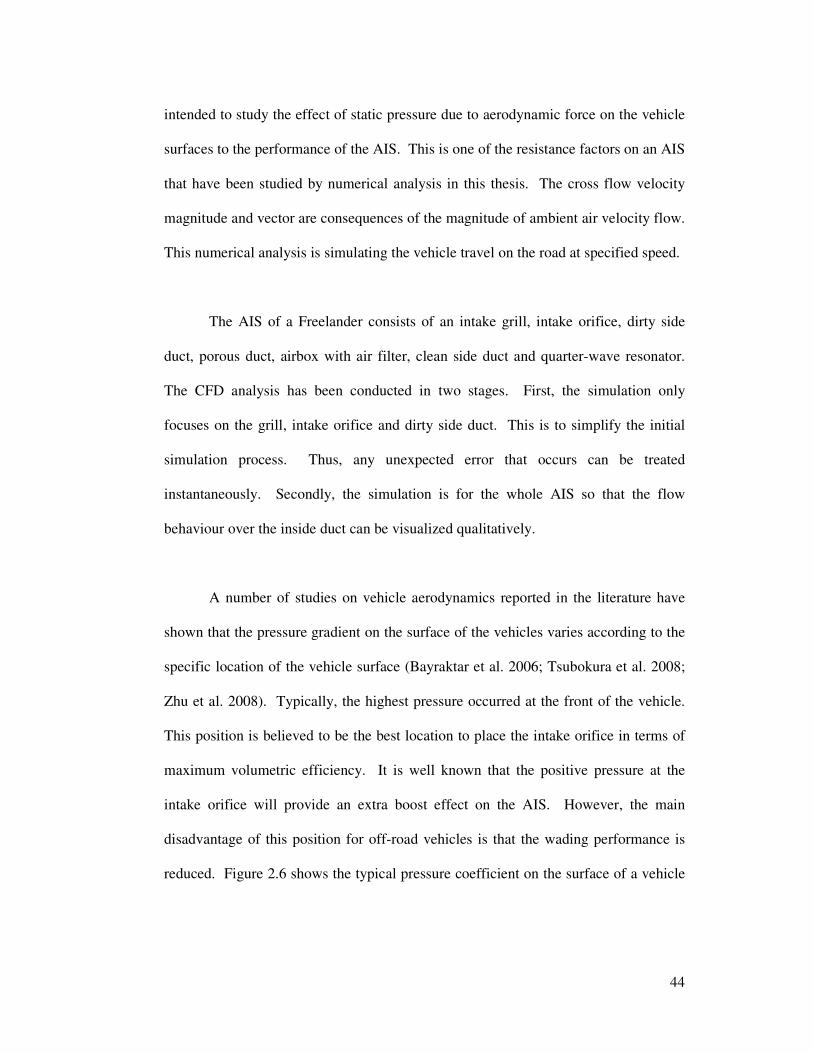
A number of studies on vehicle aerodynamics reported in the literature have
shown that the pressure gradient on the surface of the vehicles varies according to the
specific location of the vehicle surface (Bayraktar et al. 2006; Tsubokura et al. 2008;
Zhu et al. 2008). Typically, the highest pressure occurred at the front of the vehicle.
This position is believed to be the best location to place the intake orifice in terms of
maximum volumetric efficiency. It is well known that the positive pressure at the
intake orifice will provide an extra boost effect on the AIS. However, the main
disadvantage of this position for off-road vehicles is that the wading performance is
reduced. Figure 2.6 shows the typical pressure coefficient on the surface of a vehicle
45
(Audi 100 and Audi 100 II). It clearly shows that the maximum pressure occurred at
the front of the vehicle
Figure 2.6 Coefficient of pressure in the surface of Audi 100 II
and Audi 100 III. (Hucho, 1998)
The result from the simulations of the vehicle body clearly shows that the
highest pressure was measured on the front of the vehicle. However, due to several
factors, the designer has chosen to locate the intake orifice on the surface side of the
vehicle near the top of the side fender. The static pressure in this position has a lower
than atmospheric pressure level. As this pressure gradient depends on the velocity of
the ambient air, therefore the volumetric efficiency also depends on ambient air speed.
2.1.3 One-dimensional Modelling of an Air Intake System
46
The application of computer simulation techniques to improve internal
combustion engines has been rapidly expanding over the last decade. These
techniques offer reliable predictions on the effect of engine parameters on engine
performance. Moreover, the computational simulation presents information on
physical quantities that are quite difficult to measure. One-dimensional (1D)
modelling of engine performance and gas dynamic is widely used in automotive
industries to reduce development lead-time and risk while improving the quality of the
engines (Venugopalan et al. 2005; Alcini et al. 2006; Inagaki et al. 2008). There is a
lot of available software on the market which offers 1D solutions such as Ricardo
WAVE, AVL Boost and GT Power. All of this software offers a wide range of
advanced tools to help to improve the speed, accuracy and quality of simulation.
Many of the engine parameters such as intake and exhaust manifold, valves, injector,
compression ratio, and engine geometry can be altered to determine their effects on
engine performance. The Ricardo WAVE engine model like many other one-
dimensional software is a time-dependent simulation of in cylinder processes where
the solutions are based on the equations of mass and energy. The software provides
fully integrated time-dependent fluid dynamic and thermodynamic calculations using
a one-dimensional formulation.
Many research reports have been published which have successfully used the
software to optimise the engines. Chen and his colleagues have used the 1D
simulation code to develop a comprehensive model for the liquid fuel spray (Chen et
al. 2004). The fuel spray model consists of droplet dynamics and evaporation, spray-
wall impingement, wall film dynamics and evaporation in one-dimensional gas flow
47
calculation. The result from the simulation was validated with measurement data,
including the single droplet evaporation, spray tip penetration and engine transient
operations. Gilkes and his colleagues have used the Ricardo WAVE software to
analyse the transient performance of a turbocharged diesel engine (Gilkes et al. 2008).
The engine was equipped with the two point air injection system. The effect of the
system was carefully studied on transient performance of the engine. The simulation
results have been compared with experimental works in terms of engine performance,
compressor performance and emission output of the engine. The model has shown
that the two point injection system significantly improved both the engine
performance and emission level. Bai and his colleagues have been working on 1D
simulation on a diesel engine (Bai et al. 2008). The research was intended to study the
effects of compression ratio, fuel supply advance angle and valve timing system on
performance of a diesel engine. The simulation results were compared with
experimental data which show good agreements between experiment and simulation.
2.2 Biodiesel as an Alternative Fuel
2.2.1 Biodiesel Production, Policies and Standardisation
Biodiesels are available alternative fuels which have a promising future as a
substitute for conventional diesel. In general, the production of biodiesel is normally
based upon locally available sources. Suitable feedstocks include soybean, sunflower,
cottonseed, rapeseed, palm oil, jatropha seed, tallow (animal fat) or even waste
48
cooking oil. In the US, most biodiesel is derived from soy bean while in Europe,
rapeseed is the largest source for biodiesel production.
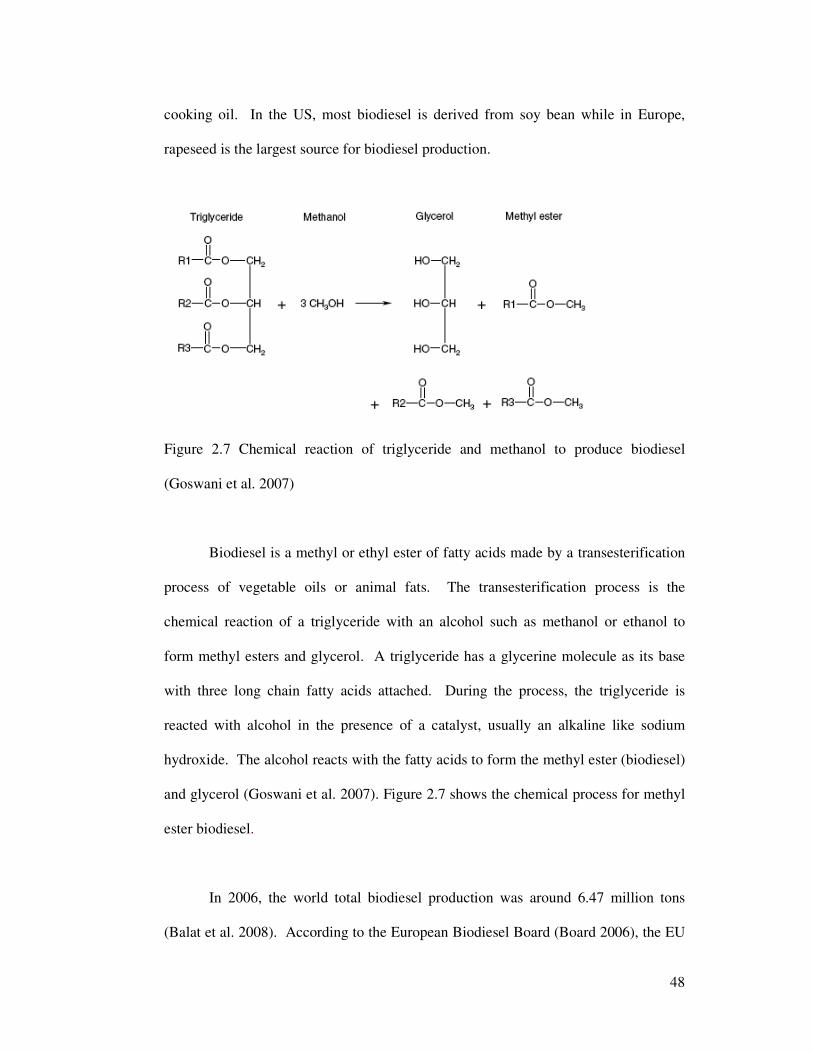
Figure 2.7 Chemical reaction of triglyceride and methanol to produce biodiesel
(Goswani et al. 2007)
Biodiesel is a methyl or ethyl ester of fatty acids made by a transesterification
process of vegetable oils or animal fats. The transesterification process is the
chemical reaction of a triglyceride with an alcohol such as methanol or ethanol to
form methyl esters and glycerol. A triglyceride has a glycerine molecule as its base
with three long chain fatty acids attached. During the process, the triglyceride is
reacted with alcohol in the presence of a catalyst, usually an alkaline like sodium
hydroxide. The alcohol reacts with the fatty acids to form the methyl ester (biodiesel)
and glycerol (Goswani et al. 2007). Figure 2.7 shows the chemical process for methyl
ester biodiesel.
In 2006, the world total biodiesel production was around 6.47 million tons
(Balat et al. 2008). According to the European Biodiesel Board (Board 2006), the EU
49
countries contributed 4.89 million tons in the same year, where Germany leads the
production followed by France and Italy. Germany produced 2.662 million tons of
biodiesel which contributed about 42% of world total biodiesel production in 2006
(Board 2006). Currently, biodiesel is the main biofuel produced and consumed in the
EU (EBB 2008). Biodiesel accounted for nearly 80% of EU biofuel production (Balat
et al. 2008). There are 185 fully operational biodiesel plants currently available
through out Europe, while many others are under constructions (Board 2006). In EU
countries, taxes normally make up 50% or more to the retail price of diesel. However,
the European Parliament has adopted a 90% tax exemption for biodiesel in 1994 to
promote the public used of biodiesel (Balat et al. 2008).
The biofuel directive set an indicative target of 5.75 % replacement of
conventional transport fossil fuels with biofuels by December 2010 (Transport 2004).
In 2006 The European Parliament and the Council of the European Union encouraged
the public to use biodiesel as an alternative especially for the transport sector. This is
due to the fact that the transportation sector accounted for 21% of all CO2 emissions
worldwide in 2002. Currently, 95% of all energy for the transportation sector comes
from fossil fuel (Kreith et al. 2007). The use of biodiesel in the transport sector may
not be just to reduce the emissions but also to shrink the dependence upon imported
energy and influence the fuel market for transport and hence to secure the energy
supply for Europe.
Biodiesel is normally characterized by its properties of density, viscosity, low
heating value, cetane number, cloud and pour points, characteristics of distillation, and
50
flash and combustion points. Pure RME or blends with ULSD may reduce the
calorific value of the fuel thus may lead to reduced engine power and increased fuel
consumption (Rakopoulos et al. 2006). The cetane numbers of RME and ULSD are
about the same but the volatility of RME is slightly higher for RME which may affect
the ignition delay and increase the amount of fuel for rapid combustion and boost the
combustion temperature, thus producing higher NOx levels (Labeckas et al. 2006).
2.2.2 Performance and Emissions of Biodiesel as Fuel in ICE
The future generation of diesel engines must also be able to work with
alternative fuels such as biodiesel and alcohol blends due to shortage of fossil diesel
and environmental concerns. The performance of biodiesel is slightly lower than that
of diesel fuel, when the similar quantity of air and fuel is introduced into the cylinder
(Senatore et al. 2000). There is almost no difference between the performance of
RME and ULSD when the comparison is made on a similar relative equivalence ratio
(Senatore et al. 2000). Much research has been conducted on a diesel engine
operating with biodiesel as an alternative to the diesel fuel (Kawano et al. 2006;
Chuepeng et al. 2007; Szybist et al. 2007; Tsolakis et al. 2007; Zheng et al. 2008;
Tompkins et al. 2009; Yoon et al. 2009). Most of the researchers have agreed that
biodiesel fuel could be used on its own or blended with conventional fossil fuel
without having to make any modification to the standard diesel engine because
biodiesel has properties similar to mineral diesel (Agarwal 2007; Tsolakis et al. 2007).
Although the energy density of biodiesel is lower than that of diesel fuel, there is
almost no difference between the performance of RME and ULSD fuelled engines if
51
the comparison is made for similar relative air/fuel ratios (lambda) used in the engines
(Senatore et al. 2000).
A research conducted by Labeckas and Slavinskas on a four cylinder diesel
engine operated with RME and fuel blend with mineral diesel. The engine was
natural aspirated, water cooled with toroidal type compression-ignition combustion
chamber in the piston heads. The test was conducted at five different engine speeds
which were 1400rpm, 1600rpm, 1800rpm, 2000rpm and 2200rpm. They conclude
that the diesel engine operating with RME consumed more fuel and low thermal
efficiency relative to the diesel fuel (Labeckas et al. 2006). The diesel engine is
normally equipped with turbocharger to enhance it capability to allow more air entrain
the engine cylinder. The turbocharger in general is a pump driven by the energy of
the exhaust gas flow. The exhaust gas flow through the turbine rotates the turbine,
which is in turn used to drive the compressor. The pressure in a compressor is
controlled by the waste gate to ensure that the pressure in the cylinder is not too high.
Alton et al. (Altõn et al. 2001) have conducted a study on a single cylinder
diesel engine operating with various types of vegetable oil and their methyl esters.
They worked with biodiesel fuels from different sources such as raw sunflower oil,
raw cottonseed oil, raw soybean oil and their methyl esters, refined corn oil, distilled
opium poppy oil and refined rapeseed oil. The results demonstrated that all fuels
performed well on a single cylinder diesel engine with just 18% variations on
maximum engine power and 10% variations of maximum engine torque.
52
The experimental work conducted on a diesel engine have proved that the
combustion of biodiesel affect the volumetric efficiency of the AIS. This is due to the
exhaust temperature of a diesel engine is highly related to the combustion event in
engine cylinder and the type of fuel used in the engines. On the other hand, the
volumetric efficiency is affected by the exhaust temperature (Balusamy et al. 2007).
Hasimoglu has conducted experimental work on a four cylinder turbo charged diesel
engine operating with biodiesel and mineral diesel. He concluded that the volumetric
efficiency of the engine was improved when the engine operated with biodiesel. The
combustions of biodiesel emitted less heat due to lower of LCV and therefore lower
exhaust gas temperature as compared to mineral diesel. Hence less heat transferred
into the engine parts like intake manifold (Hasimoglu et al. 2008). This resulted to
increase the volumetric efficiency of the air intake system. Kandasamy et. al have
conducted a research on a single cylinder diesel engine operating with biodiesel and
mineral diesel (Kandasamy et al. 2008). They concluded that the variation of
volumetric efficiency is highly related to the exhaust temperature. The volumetric
efficiency of the engine operating with biodiesel is lower due to the lower of exhaust
gas temperature. The low-retained exhaust gas resulted to decrease the temperature of
the air intake and vice versa.
2.3 Exhaust Emissions from the Combustion of Diesel and
Biodiesel Fuel
Transport for many years has had a significant effect upon air pollution since
the inception of the internal combustion engine and especially after major
commercialisation. The exhaust emissions generally result from the combustion of
53
fossil fuel in vehicle engines. Diesel fossil fuel is toxic and may cause long term
adverse effects to the aquatic environment. In diesel engines, the pollutant formation
processes are strongly dependent on the fuel distribution and how that distribution
changes with time due to mixing (Heywood 1988). In general, previous results show
that diesel engines fuelled with biodiesel emit a lower amount of unburned
hydrocarbon (HC), particulate matter (PM) and carbon monoxide (CO) as compared
to fossil diesel whereas NOx emissions are slightly increased (Senatore et al. 2000;
Lapuerta et al. 2002; Labeckas et al. 2006; Horn et al. 2007; Szybist et al. 2007).
Demirbas in his report suggested that the combustion of biodiesel alone provides over
a 90% reduction in total unburned hydrocarbons (HC) and a 75-90% reduction in
polycyclic aromatic hydrocarbons (PAHs) (Demirbas 2007). The results from
previous experiments on biodiesel and their blends with ULSD in a single cylinder
engine show that an increased proportion of biodiesel blend resulted in higher NOx,
reduced smoke and increased brake specific fuel consumption (Chuepeng et al. 2007).
2.3.1 Oxides of Nitrogen
The major pathway of NOx formation is thermal NOx, fuel NOx and prompt
NOx (Heywood 1988; Kutz 2006). Thermal NOx refers to NOx produced during high
temperature oxidation of the diatomic nitrogen found in combustion air and simply
derived via the well-known Zeldovich mechanism (Baukal 2001). The formation rate
is principally a function of temperature and the exposure period of nitrogen at that
temperature (Horn et al. 2007; Keating 2007). The fuel NOx formed when the
54
combustion of fuel which contains organo-nitrogen compounds occur. During
combustion, the nitrogen bound in the fuel is released as a free radical and eventually
forms free N2, or NO. High quality gaseous fuel has no organically bound nitrogen
which produces an ignorable amount of NOx through this process. Conversely, fuel
NOx is vital to revision for residual fuel oil, coal or waste fuel used that may contain a
considerable amount of organically bound nitrogen (Baukal 2001).
The prompt NOx is attributed to the reaction of atmospheric nitrogen, N2, with
radicals such as C, CH, and CH2 fragments derived from fuel. The reaction took place
in the earlier stage of combustion and produced fixed species of nitrogen such as
nitrogen monohydride (NH), hydrogen cyanide (HCN), dihydrogen cyanide (H2CN)
and cyano radical (CN-) which can oxidize to NO. Prompt NOX is commonly
important in the low temperature combustion process.
NOx formed by the combustion of fuel in an internal combustion engine
typically consists of nitric oxide (NO) and nitrogen dioxide (NO2) where the nitric
oxide is dominant with a small amount of NO2 (Heywood 1988). The formation of
NOx is mostly from nitrogen in the air but some liquid fuels contain nitrogen such as
NH3, NC and HCN thus contributes higher potential on producing more NOx
(Ganesan 2003). It is well known that this emission gas was highly dependent on
post-combustion gas temperature, duration of gas exposure to this high temperature
combustion and the species in post-combustion gases which are highly related to
equivalent ratio, φ (Keating 2007).
55
The higher NOx emissions for biodiesel as compared to ULSD can be related
to the advance of injection timing which automatically occurs in engine cylinder with
pump-in-line fuel systems to obtain higher volumetric delivery per stroke (Labeckas et
al. 2006). Previous research has revealed that the NOx emissions as a function of the
timing at which the maximum heat release rates and the maximum cylinder
temperature occurred where the later the maximum heat release or maximum
temperature occurs, the lower the NOx will be (Szybist et al. 2007). This fact is inline
with the NOx formation process in that the earlier the maximum temperature is
achieved, the longer the conditions are conducive for NOx formation (Szybist et al.
2007).
2.3.2 Carbon Monoxide
Carbon monoxide (CO) emissions from IC engines are primarily controlled by
the fuel/air equivalence ratio (Heywood 1988). The CO concentration in the exhaust
tail pipe increases steadily with increasing equivalence ratio. Since CO emissions are
closely related to fuel rich combustion, therefore, spark ignition engines produce a
significant amount of CO emission compared with diesel engines. The diesel engine
is often operating well on the lean side of stoichiometric ratio especially at low load.
The concentration of CO for diesel engines encountered the range from just a few part
per million at low load to around 3000ppm at high loads (Lilly 1984). Lower
volumetric efficiency of air intake system resulted to increase the emission of CO in
the exhaust gas. This is due to the incomplete combustion in engine cylinder.
56
2.3.3 Unburned hydrocarbons
Hydrocarbons (HC) are grouped into categories based on their chemical
structure such as paraffin (alkanes), olefins (alkenes), acetylenes (alkynes), or cyclic
hydrocarbons (Bohac et al. 2001). Hydrocarbon emissions are the consequence of
incomplete combustion of the hydrocarbon fuel. The compression ignition engine
produces less HC as compared to SI engines due to its operation with an overall fuel-
lean equivalence ratio (Ganesan 2003). The combustion of diesel fuel in compression
ignition engines involved complex heterogeneous processes. Although the
combustion of diesel fuel takes place in fuel-lean conditions, incomplete combustion
still occurred. Due to non-homogeneity of the fuel mixture, some local spots in the
combustion chamber will be too lean to completely combust (Ganesan 2003). The
amount of unburned HC resulting from this overlean regions is dependent on the
amount of fuel injected during the ignition delay, the mixing rate with air during this
period, and the extent to which prevailing cylinder conditions are conducive to
autoignition (Heywood 1988). HC emissions are also reported as sensitive to engine
temperature where these emissions decrease as the engine temperature increase
(Heywood 1988). Fuel also has an effect on HC emissions where the fuel with lower
end boiling point produces higher HC (Lilly 1984). CI engines also produce HC
emissions from wall deposit absorption, oil film absorption and crevice volume
(Ganesan 2003).
57
2.3.4 Particulate matter
Particulate matter is defined as any material other than water, in the exhaust of
an internal combustion engine which can be filtered after dilution with ambient air
(Lilly 1984). Most of the PM is generated from incomplete combustion of diesel fuel
but some comes from lubricating oil components which vaporize and then react during
combustion (Heywood 1988). The individual structure of PM is principally clusters
of many small spheres or spherules of carbon. The PM emissions consist of absorbed
and condensed high molecular weight organic compounds which include unburned
hydrocarbons, oxygenated hydrocarbons (ketones, esters, ethers, organic acids) and
polynuclear aromatic hydrocarbons (Heywood 1988).
The combustion of biodiesel produces less PM as compared to fossil diesel.
The reductions of PM could be explained by the increase in oxygen content in the fuel
which contributes to complete fuel oxidation even in locally fuel rich zones, and by
the lower final boiling point which guarantees a complete evaporation of the liquid
fuel (Lapuerta et al. 2002).
58
2.4 Summary
In the presented chapter, the general evolution of an AIS is discussed. The
improvement of an AIS is not just to increase the engine performance, but also helpful
to improve combustion quality in order to meet the requirement of emission
legislation. The AIS of Land Rover vehicles is designed to fulfil the requirement of
wading performances. Therefore, the intake grill is located at the side of the vehicle.
There is no research available in the literature on this particular air induction grill,
especially the effect of negative pressure on the induction grill surface. Therefore, a
further investigation into this phenomenon has been carried out within the presented
thesis. Some researchers have successfully used a steady flow test rig to improve the
AIS but some researchers used simulation software such as Ricardo WAVE and
Fluent to investigate the flow behaviour on the AIS.
From the literature review, it is found that the experimental work on a diesel
engine is very important to study the effect of fuel specifically RME on to the
performance of air induction system. This is very significant for the new design of
diesel engine which equipped with modern technologies such as VGT turbocharger,
EGR system and common-rail fuel injection system. The combustion of biodiesel in
engine cylinder produces a lower of exhaust temperature resulted to alter the
performance of air induction system.
59
CHAPTER 3
RESEARCH METHODOLOGY
This chapter is mainly concerned with both simulation and experimental
solution approach to investigate the performance characteristic of an AIS. The first
half of the chapter deals with the set-up of the boundary conditions of the geometry of
the AIS provided by Jaguar Land Rover, solver selection and post-processing
techniques to predict the flow behaviour of the AIS. The second half of the chapter
deals with the experimental set-up for the steady flow test and engine test with
biodiesel fuel. The selection of apparatus and measuring devices used in the test rig
are discussed in detail.
3.1 Setup of CFD Models
Computational fluid dynamic is a numerical tool for simulating the
complicated fluid flow, heat transfer and chemical reactions in any fluid flow domain.
The first generation of CFD solutions appeared in the 1950s stimulated by the
simultaneous advent of high performance computer systems. Recently, this tool has
been widely used in all flow problems due to many factors. One obvious reason is the
dramatic increase in computer power that is available at affordable cost. In fact, the
60
results of modelling can be viewed quickly and easily compared to the time and cost
required by the experimental work. There are many commercial CFD codes such as
FLUENT, CFX and Star-CD. These commercial codes have been made as easy as
possible to minimize the time and cost of simulation work.
3.1.1 Governing Equations
The substantial derivative is mathematical notation that is important to derive
the governing equation in fluid dynamics. The substantial derivative operator in
vector notation can be summarized as follows;
DdivV
Dt t
∂= +
∂
r (3.1)
Where,
u v wdivV
x y z
∂ ∂ ∂= + +
∂ ∂ ∂
r (3.2)
D/Dt is the substantial derivative which is physically the time rate of change following
a moving fluid element. The symbol of u, v and w is the velocity in the direction of
axis x, y and z respectively. ∂/∂t is called the local derivative, which is physically the
tie rate of change at a fixed point. The term divVr
is called the convective derivative,
which is physically the time of change due to the movement of the fluid element from
one location to another in the flow field where the flow properties are spatially
different. This particle derivative will be used in the rest of the chapter to present the
Navier-Stoke equations in conservative form.
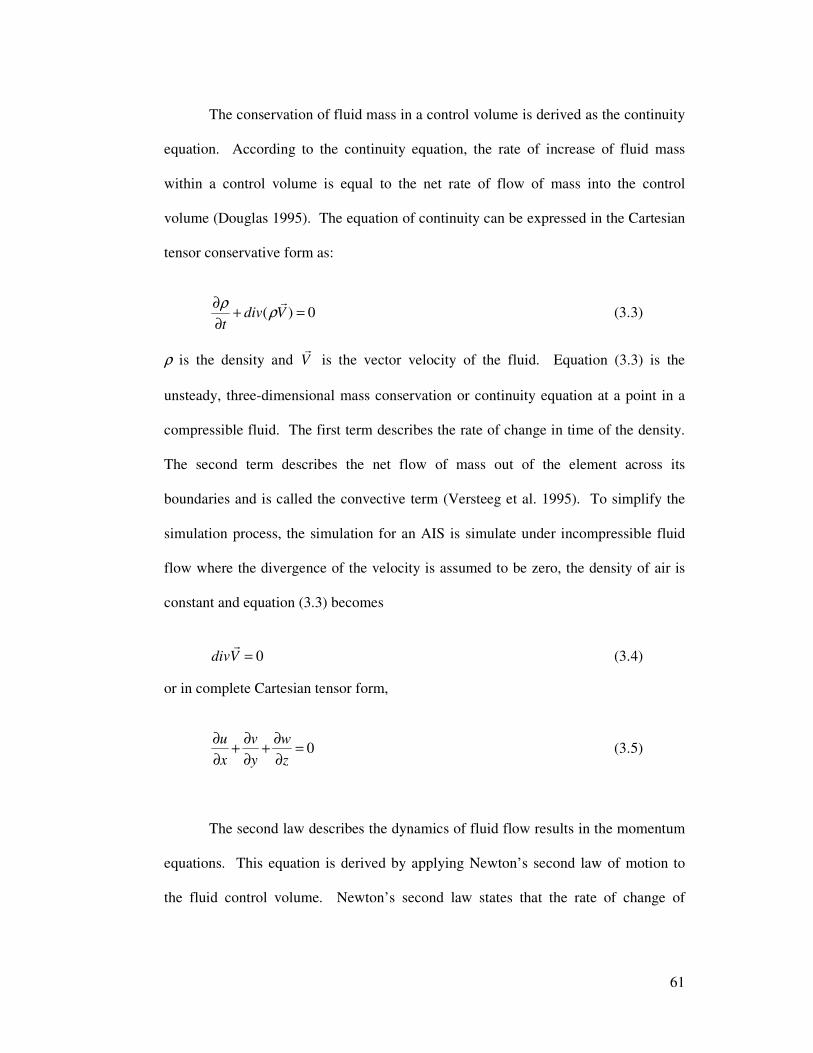
61
The conservation of fluid mass in a control volume is derived as the continuity
equation. According to the continuity equation, the rate of increase of fluid mass
within a control volume is equal to the net rate of flow of mass into the control
volume (Douglas 1995). The equation of continuity can be expressed in the Cartesian
tensor conservative form as:
( ) 0div Vt
ρρ
∂+ =
∂
r (3.3)
ρ is the density and Vr
is the vector velocity of the fluid. Equation (3.3) is the
unsteady, three-dimensional mass conservation or continuity equation at a point in a
compressible fluid. The first term describes the rate of change in time of the density.
The second term describes the net flow of mass out of the element across its
boundaries and is called the convective term (Versteeg et al. 1995). To simplify the
simulation process, the simulation for an AIS is simulate under incompressible fluid
flow where the divergence of the velocity is assumed to be zero, the density of air is
constant and equation (3.3) becomes
0divV =r
(3.4)
or in complete Cartesian tensor form,
0u v w
x y z
∂ ∂ ∂+ + =
∂ ∂ ∂ (3.5)
The second law describes the dynamics of fluid flow results in the momentum
equations. This equation is derived by applying Newton’s second law of motion to
the fluid control volume. Newton’s second law states that the rate of change of
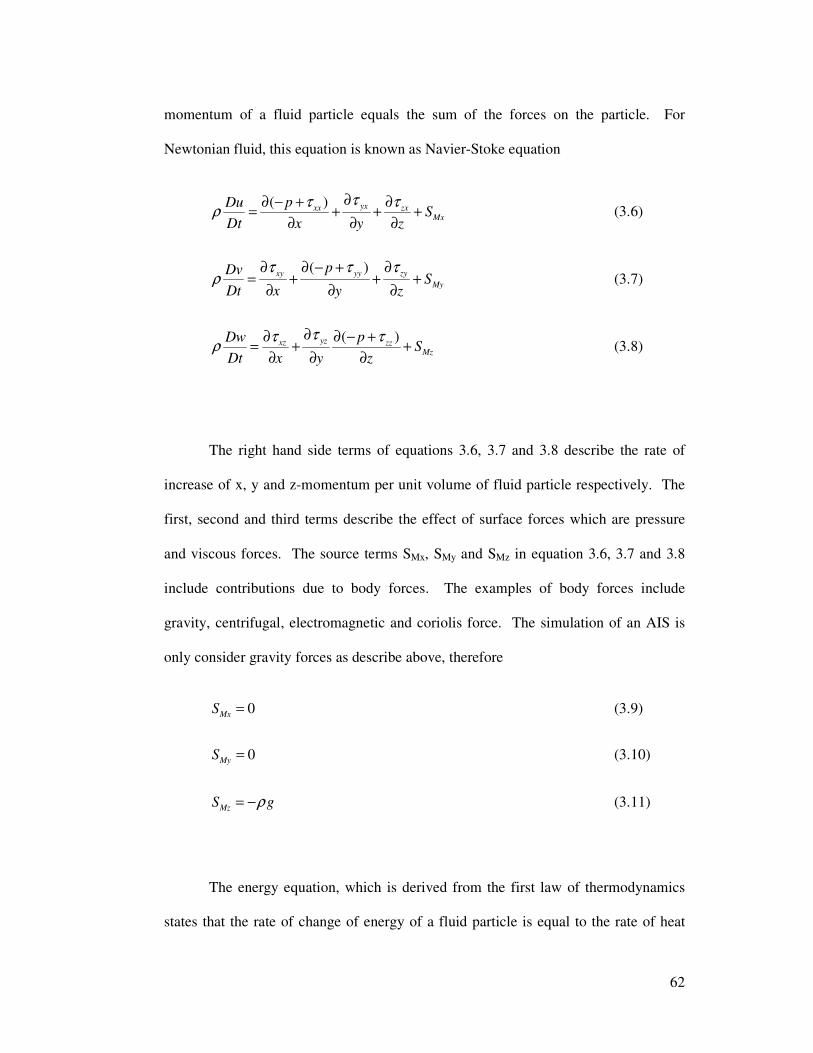
62
momentum of a fluid particle equals the sum of the forces on the particle. For
Newtonian fluid, this equation is known as Navier-Stoke equation
( ) yxxx zxMx
pDuS
Dt x y z
ττ τρ
∂∂ − + ∂= + + +
∂ ∂ ∂ (3.6)
( )xy yy zy
My
pDvS
Dt x y z
τ τ τρ
∂ ∂ − + ∂= + + +
∂ ∂ ∂ (3.7)
( )yzxz zzMz
pDwS
Dt x y z
ττ τρ
∂∂ ∂ − += + +
∂ ∂ ∂ (3.8)
The right hand side terms of equations 3.6, 3.7 and 3.8 describe the rate of
increase of x, y and z-momentum per unit volume of fluid particle respectively. The
first, second and third terms describe the effect of surface forces which are pressure
and viscous forces. The source terms SMx, SMy and SMz in equation 3.6, 3.7 and 3.8
include contributions due to body forces. The examples of body forces include
gravity, centrifugal, electromagnetic and coriolis force. The simulation of an AIS is
only consider gravity forces as describe above, therefore
0MxS = (3.9)
0MyS = (3.10)
MzS gρ= − (3.11)
The energy equation, which is derived from the first law of thermodynamics
states that the rate of change of energy of a fluid particle is equal to the rate of heat
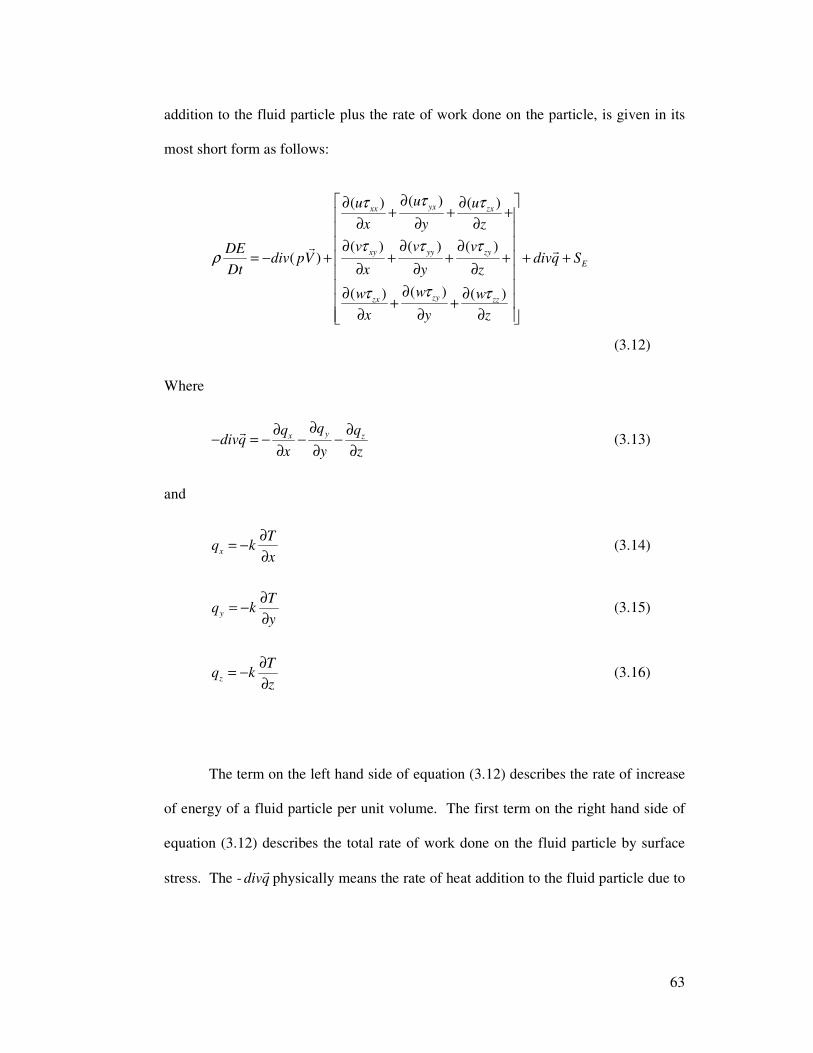
63
addition to the fluid particle plus the rate of work done on the particle, is given in its
most short form as follows:
( )( ) ( )
( ) ( ) ( )( )
( )( ) ( )
yxxx zx
xy yy zy
E
zyzx zz
uu u
x y z
v v vDEdiv pV divq S
Dt x y z
ww w
x y z
ττ τ
τ τ τρ
ττ τ
∂ ∂ ∂+ + +
∂ ∂ ∂ ∂ ∂ ∂
= − + + + + + + ∂ ∂ ∂
∂∂ ∂ + +
∂ ∂ ∂
r r
(3.12)
Where
yx zqq q
divqx y z
∂∂ ∂− = − − −
∂ ∂ ∂
r (3.13)
and
x
Tq k
x
∂= −
∂ (3.14)
y
Tq k
y
∂= −
∂ (3.15)
z
Tq k
z
∂= −
∂ (3.16)
The term on the left hand side of equation (3.12) describes the rate of increase
of energy of a fluid particle per unit volume. The first term on the right hand side of
equation (3.12) describes the total rate of work done on the fluid particle by surface
stress. The - divqr
physically means the rate of heat addition to the fluid particle due to
64
heat conduction. The final form of equation (3.12), SE defines a potential energy
changes as a source term.
3.1.2 Turbulence Model
Virtually all flows of practical engineering interest are turbulent (Wilcox
1994). Turbulent flows are extremely complex where the flows characterized by the
fluctuating of velocity fields. The fluctuations of the velocity field mix transported
quantities such as momentum, energy, and species concentration. As a consequence
these transported quantities fluctuate simultaneously. Turbulent flow is a fluid
behaviour of chaotic, stochastic property changes. This includes low momentum
diffusion, high momentum convection, and rapid deviation of pressure and velocity in
space and time. The interaction is very complex because it is rotational, fully three
dimensional and time dependent.
Turbulence modelling is the area of physical modelling where a simpler
mathematical model than the full time dependent Navier-Stokes Equations is used to
forecast the effects of turbulence. There are various mathematical models available
nowadays to solve the turbulent flow. However, there is no single turbulence model
collectively accepted for all turbulence flow problems. The choice of turbulence
model will depend on considerations such as the physics encompassed in the flow, the
established practice for a specific class of problem, the level of accuracy required, the
available computational resources, and the amount of time available for the simulation
(Fluent 2005). Therefore, understanding on the specific turbulence problems such as
65
capabilities and limitations of the various options is essential to certify that the
turbulence model chosen is the best.
The simulation works on the AIS have been conducted on standard turbulence
k-ε code on FLUENT 6.2. The software runs on The University of Birmingham
servers. The computations have been carried out using only one processor of a single
node of a 6-node HP J-Class load sharing server. Each node has a minimum of 8 GB
RAM and 2 CPUs which are PA-RISC chips running at 750 MHz. The J-Class server
is a J6700 model connected via a fibre optics channel to a virtual array (VA) storage
subsystem. The VA is mounted via a clustered NAS 9000 (MS Windows based)
system (Mahrous 2008).
The k-ε model is widely used to solve turbulence flow problems. The model is
developed by two additional transport-equations to represent the turbulence properties
of the flow. The model is proved to solve the free shear layer flows with relatively
small pressure gradient. The model is good for wall-bounded and internal flow
especially when the mean pressure gradient is small. The accuracy of the calculation
made by k-ε model is well accepted. The flow inside the modern AIS is complex and
mostly turbulent at all engine speeds as well as for all manifold design and geometry.
It involves a complicated combination of small-scale and large-scale flow structures
such as turbulent shear layers, jets, and boundary layers. The standard k-ε code by
FLUENT is successfully used by many researcher to visualize the flow characteristic
of different kind of AIS (Safari et al. 2003; Devi et al. 2004; Ling et al. 2006; Siqueira
et al. 2006).
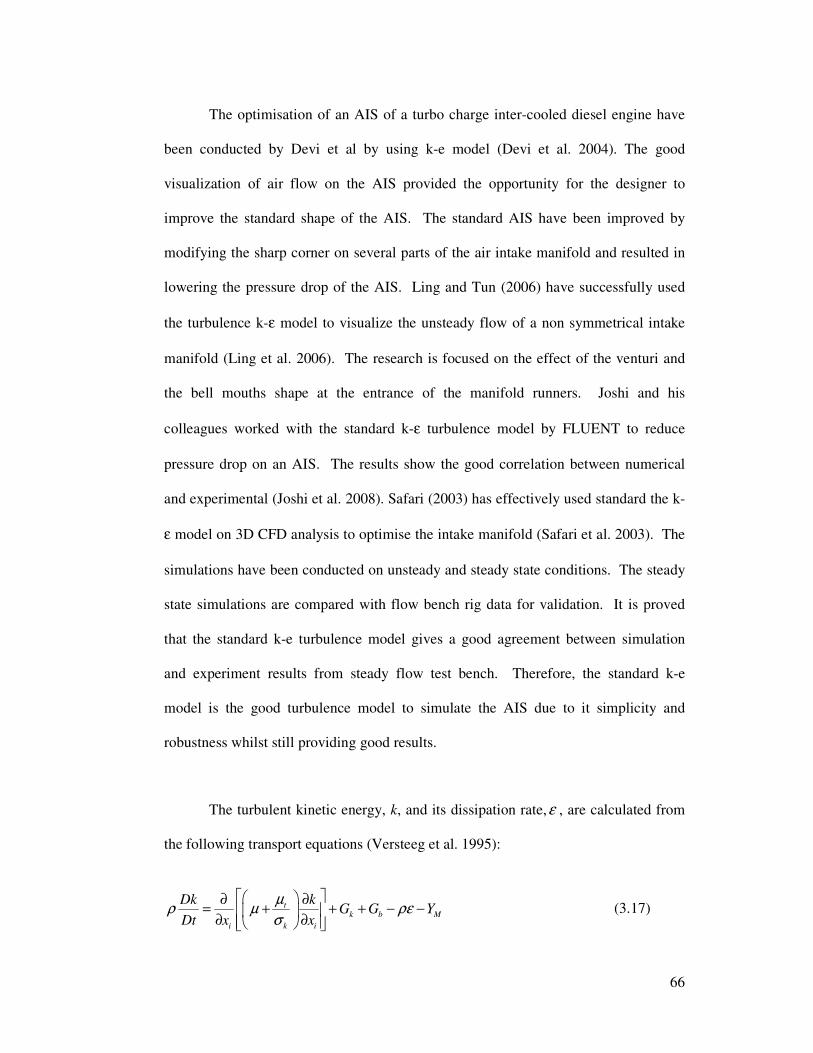
66
The optimisation of an AIS of a turbo charge inter-cooled diesel engine have
been conducted by Devi et al by using k-e model (Devi et al. 2004). The good
visualization of air flow on the AIS provided the opportunity for the designer to
improve the standard shape of the AIS. The standard AIS have been improved by
modifying the sharp corner on several parts of the air intake manifold and resulted in
lowering the pressure drop of the AIS. Ling and Tun (2006) have successfully used
the turbulence k-ε model to visualize the unsteady flow of a non symmetrical intake
manifold (Ling et al. 2006). The research is focused on the effect of the venturi and
the bell mouths shape at the entrance of the manifold runners. Joshi and his
colleagues worked with the standard k-ε turbulence model by FLUENT to reduce
pressure drop on an AIS. The results show the good correlation between numerical
and experimental (Joshi et al. 2008). Safari (2003) has effectively used standard the k-
ε model on 3D CFD analysis to optimise the intake manifold (Safari et al. 2003). The
simulations have been conducted on unsteady and steady state conditions. The steady
state simulations are compared with flow bench rig data for validation. It is proved
that the standard k-e turbulence model gives a good agreement between simulation
and experiment results from steady flow test bench. Therefore, the standard k-e
model is the good turbulence model to simulate the AIS due to it simplicity and
robustness whilst still providing good results.
The turbulent kinetic energy, k, and its dissipation rate,ε , are calculated from
the following transport equations (Versteeg et al. 1995):
tk b M
i k i
Dk kG G Y
Dt x x
µρ µ ρε
σ
∂ ∂= + + + − −
∂ ∂ (3.17)
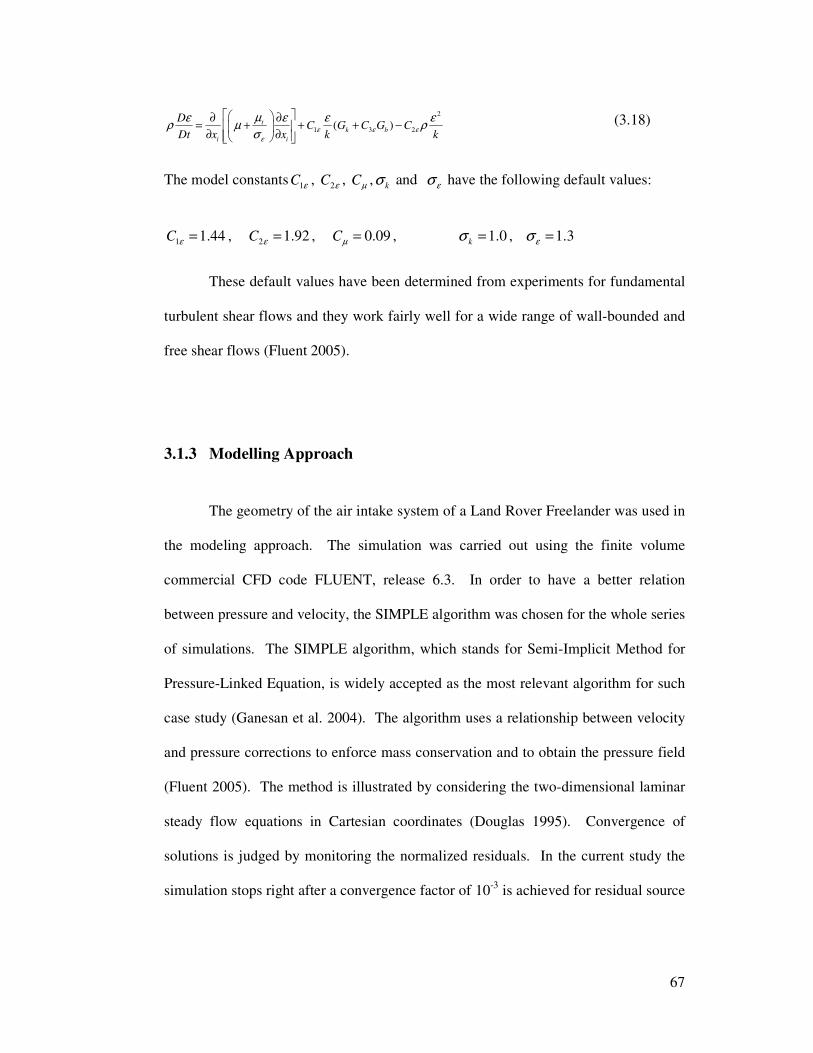
67
2
1 3 2( )tk b
i i
DC G C G C
Dt x x k kε ε ε
ε
µε ε ε ερ µ ρ
σ
∂ ∂= + + + −
∂ ∂
(3.18)
The model constants 1C ε , 2C ε , Cµ ,kσ and εσ have the following default values:
1 1.44C ε = , 2 1.92C ε = , 0.09Cµ = , 1.0kσ = , 1.3εσ =
These default values have been determined from experiments for fundamental
turbulent shear flows and they work fairly well for a wide range of wall-bounded and
free shear flows (Fluent 2005).
3.1.3 Modelling Approach
The geometry of the air intake system of a Land Rover Freelander was used in
the modeling approach. The simulation was carried out using the finite volume
commercial CFD code FLUENT, release 6.3. In order to have a better relation
between pressure and velocity, the SIMPLE algorithm was chosen for the whole series
of simulations. The SIMPLE algorithm, which stands for Semi-Implicit Method for
Pressure-Linked Equation, is widely accepted as the most relevant algorithm for such
case study (Ganesan et al. 2004). The algorithm uses a relationship between velocity
and pressure corrections to enforce mass conservation and to obtain the pressure field
(Fluent 2005). The method is illustrated by considering the two-dimensional laminar
steady flow equations in Cartesian coordinates (Douglas 1995). Convergence of
solutions is judged by monitoring the normalized residuals. In the current study the
simulation stops right after a convergence factor of 10-3 is achieved for residual source
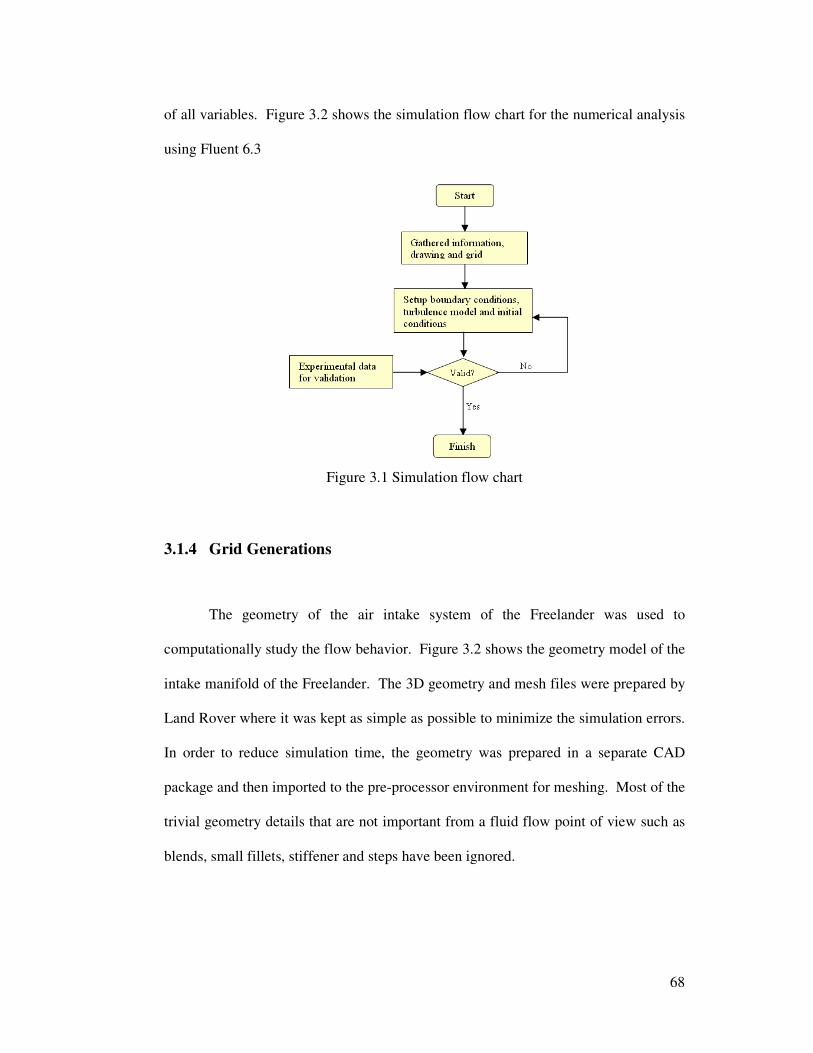
68
of all variables. Figure 3.2 shows the simulation flow chart for the numerical analysis
using Fluent 6.3
Figure 3.1 Simulation flow chart
3.1.4 Grid Generations
The geometry of the air intake system of the Freelander was used to
computationally study the flow behavior. Figure 3.2 shows the geometry model of the
intake manifold of the Freelander. The 3D geometry and mesh files were prepared by
Land Rover where it was kept as simple as possible to minimize the simulation errors.
In order to reduce simulation time, the geometry was prepared in a separate CAD
package and then imported to the pre-processor environment for meshing. Most of the
trivial geometry details that are not important from a fluid flow point of view such as
blends, small fillets, stiffener and steps have been ignored.
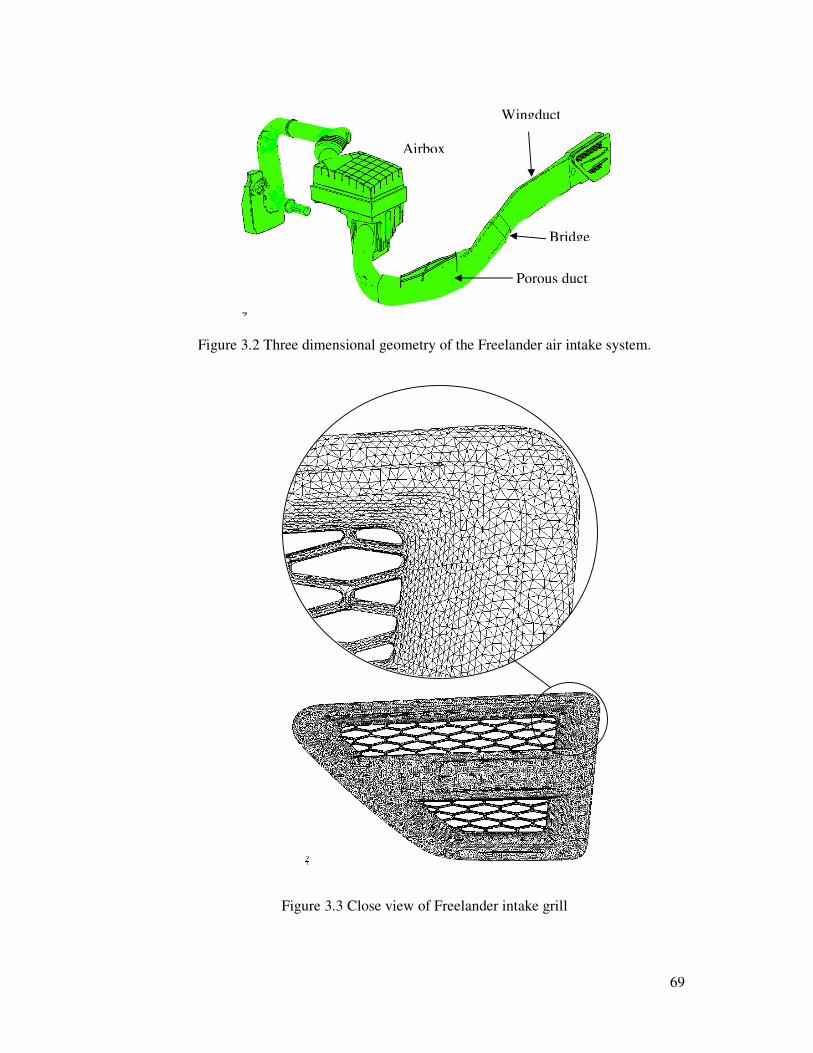
69
Figure 3.2 Three dimensional geometry of the Freelander air intake system.
Figure 3.3 Close view of Freelander intake grill
Wingduct
Porous duct
Bridge
Airbox
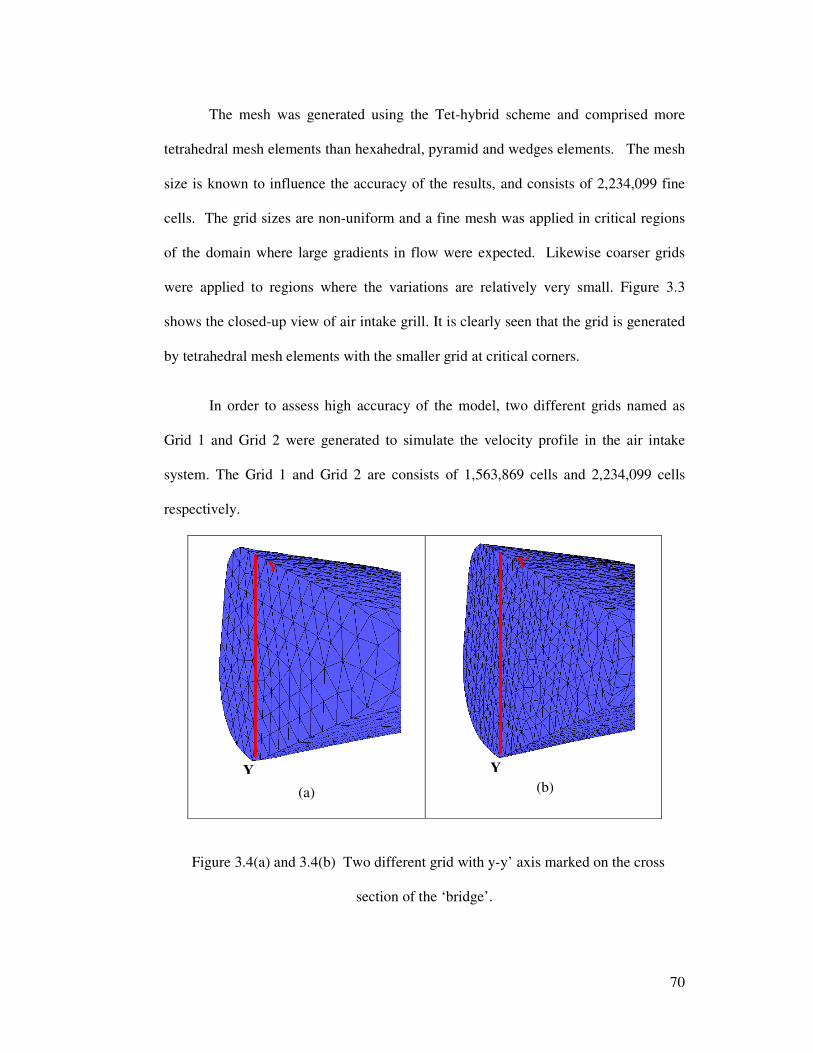
70
The mesh was generated using the Tet-hybrid scheme and comprised more
tetrahedral mesh elements than hexahedral, pyramid and wedges elements. The mesh
size is known to influence the accuracy of the results, and consists of 2,234,099 fine
cells. The grid sizes are non-uniform and a fine mesh was applied in critical regions
of the domain where large gradients in flow were expected. Likewise coarser grids
were applied to regions where the variations are relatively very small. Figure 3.3
shows the closed-up view of air intake grill. It is clearly seen that the grid is generated
by tetrahedral mesh elements with the smaller grid at critical corners.
In order to assess high accuracy of the model, two different grids named as
Grid 1 and Grid 2 were generated to simulate the velocity profile in the air intake
system. The Grid 1 and Grid 2 are consists of 1,563,869 cells and 2,234,099 cells
respectively.
(a)
(b)
Figure 3.4(a) and 3.4(b) Two different grid with y-y’ axis marked on the cross
section of the ‘bridge’.
Y
Y Y
Y
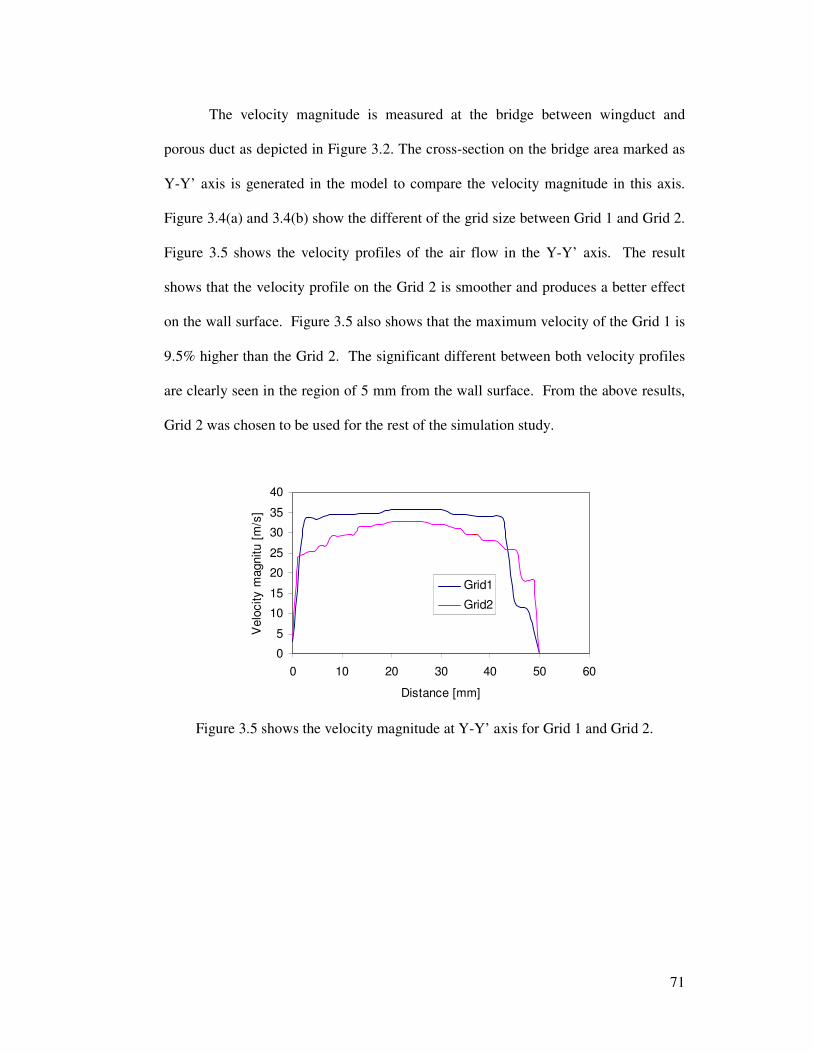
71
The velocity magnitude is measured at the bridge between wingduct and
porous duct as depicted in Figure 3.2. The cross-section on the bridge area marked as
Y-Y’ axis is generated in the model to compare the velocity magnitude in this axis.
Figure 3.4(a) and 3.4(b) show the different of the grid size between Grid 1 and Grid 2.
Figure 3.5 shows the velocity profiles of the air flow in the Y-Y’ axis. The result
shows that the velocity profile on the Grid 2 is smoother and produces a better effect
on the wall surface. Figure 3.5 also shows that the maximum velocity of the Grid 1 is
9.5% higher than the Grid 2. The significant different between both velocity profiles
are clearly seen in the region of 5 mm from the wall surface. From the above results,
Grid 2 was chosen to be used for the rest of the simulation study.
0
5
10
15
20
25
30
35
40
0 10 20 30 40 50 60
Distance [mm]
Velo
city m
agnitu [
m/s
]
Grid1
Grid2
Figure 3.5 shows the velocity magnitude at Y-Y’ axis for Grid 1 and Grid 2.
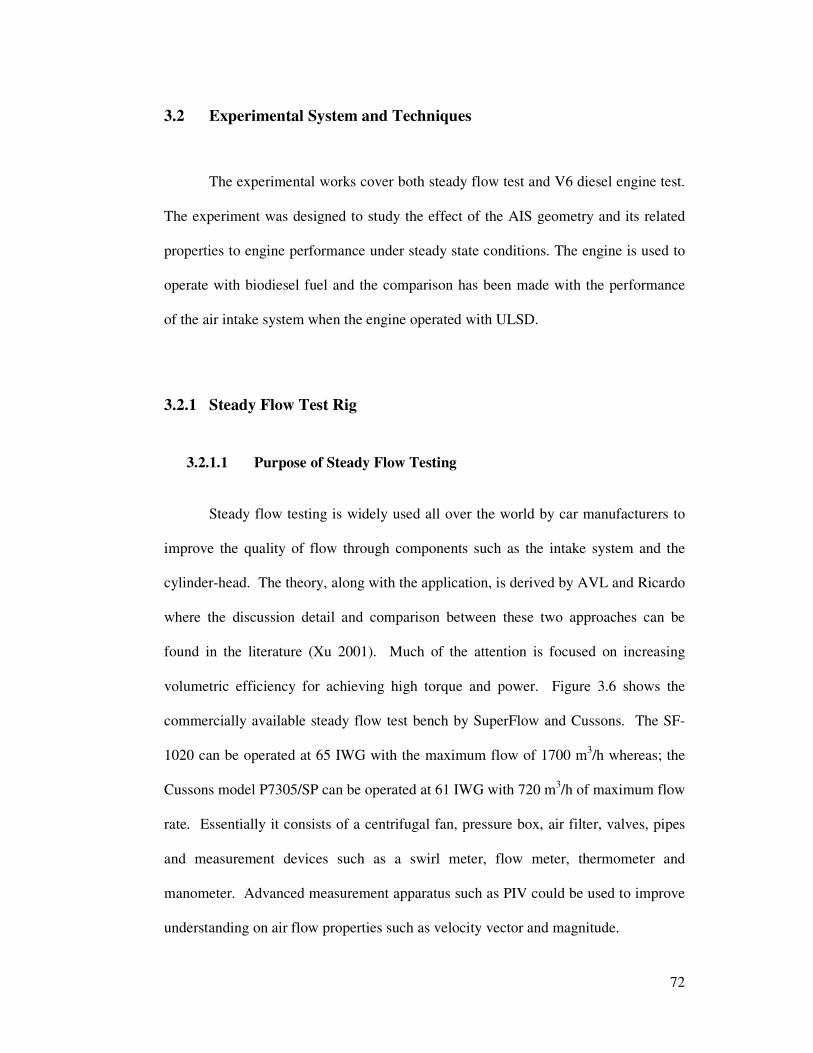
72
3.2 Experimental System and Techniques
The experimental works cover both steady flow test and V6 diesel engine test.
The experiment was designed to study the effect of the AIS geometry and its related
properties to engine performance under steady state conditions. The engine is used to
operate with biodiesel fuel and the comparison has been made with the performance
of the air intake system when the engine operated with ULSD.
3.2.1 Steady Flow Test Rig
3.2.1.1 Purpose of Steady Flow Testing
Steady flow testing is widely used all over the world by car manufacturers to
improve the quality of flow through components such as the intake system and the
cylinder-head. The theory, along with the application, is derived by AVL and Ricardo
where the discussion detail and comparison between these two approaches can be
found in the literature (Xu 2001). Much of the attention is focused on increasing
volumetric efficiency for achieving high torque and power. Figure 3.6 shows the
commercially available steady flow test bench by SuperFlow and Cussons. The SF-
1020 can be operated at 65 IWG with the maximum flow of 1700 m3/h whereas; the
Cussons model P7305/SP can be operated at 61 IWG with 720 m3/h of maximum flow
rate. Essentially it consists of a centrifugal fan, pressure box, air filter, valves, pipes
and measurement devices such as a swirl meter, flow meter, thermometer and
manometer. Advanced measurement apparatus such as PIV could be used to improve
understanding on air flow properties such as velocity vector and magnitude.
73
Measurements of pressure drop along the air intake system could be performed
by the use of a standard test bed. These measurements are carried out on complete air
intake system together with the cylinder head and ports. This is particularly important
for direct injection engines where the port is shaped to generate the required degree of
swirl within the cylinder (Lilly 1984). However for the purpose of the current study,
where the research is focused on the pressure drop at the intake duct and grill, it is not
compulsory to test the intake duct with a cylinder head.
(a)
(b)
Figure 3.6 Commercial steady flow test bench (a) SuperFlow (Superflow 2008), (b)
Cussons (Cussons 2008)
3.2.1.2 Design and Setup of Steady Flow Test Bench
The steady flow test bench used in this study was designed, fabricated and
tested in the Thermo-Fluid Laboratory at Birmingham University. Two commercial
standard steady flow test benches have been used as the bench mark; SF-1020 by
SuperFlow Ltd and P7305/SP by Cussons Ltd. The specification details of SF-1020
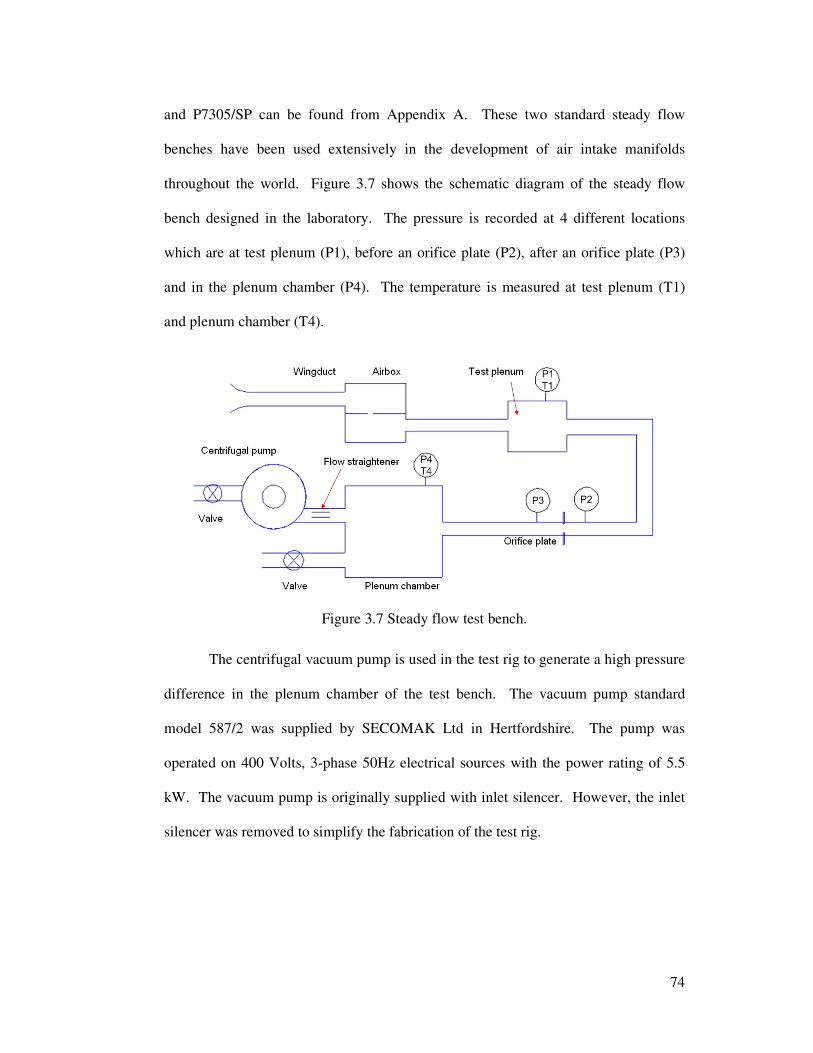
74
and P7305/SP can be found from Appendix A. These two standard steady flow
benches have been used extensively in the development of air intake manifolds
throughout the world. Figure 3.7 shows the schematic diagram of the steady flow
bench designed in the laboratory. The pressure is recorded at 4 different locations
which are at test plenum (P1), before an orifice plate (P2), after an orifice plate (P3)
and in the plenum chamber (P4). The temperature is measured at test plenum (T1)
and plenum chamber (T4).
Figure 3.7 Steady flow test bench.
The centrifugal vacuum pump is used in the test rig to generate a high pressure
difference in the plenum chamber of the test bench. The vacuum pump standard
model 587/2 was supplied by SECOMAK Ltd in Hertfordshire. The pump was
operated on 400 Volts, 3-phase 50Hz electrical sources with the power rating of 5.5
kW. The vacuum pump is originally supplied with inlet silencer. However, the inlet
silencer was removed to simplify the fabrication of the test rig.
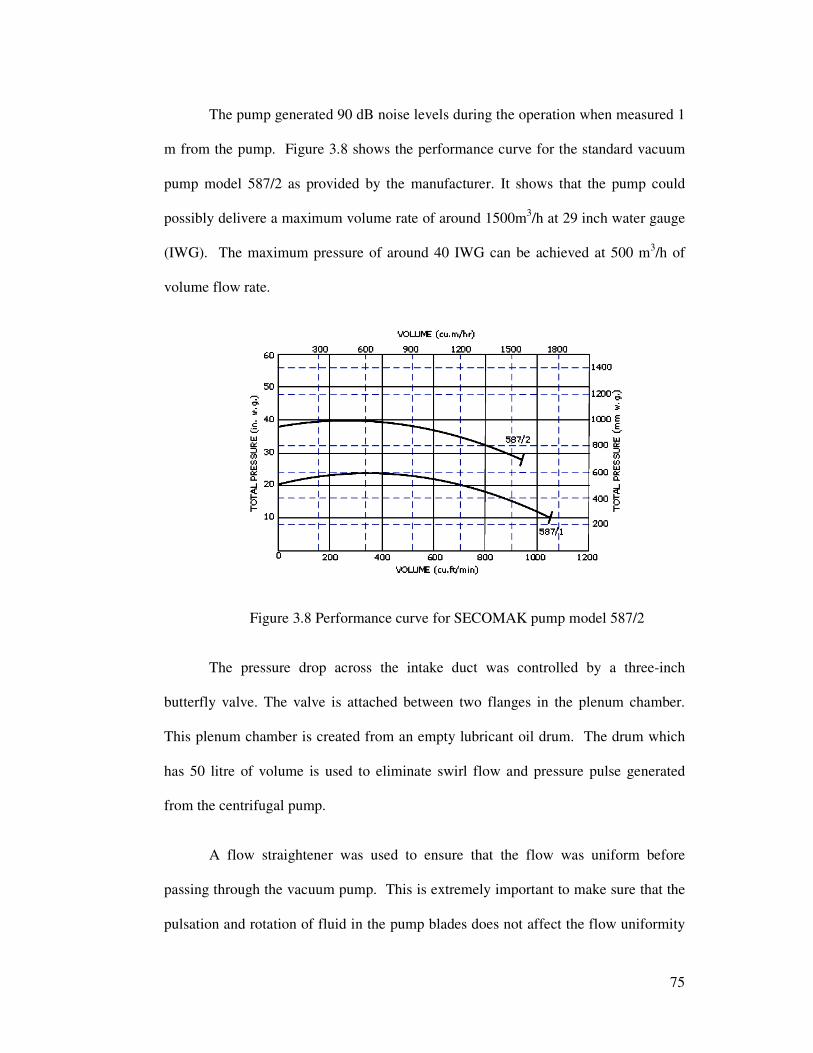
75
The pump generated 90 dB noise levels during the operation when measured 1
m from the pump. Figure 3.8 shows the performance curve for the standard vacuum
pump model 587/2 as provided by the manufacturer. It shows that the pump could
possibly delivere a maximum volume rate of around 1500m3/h at 29 inch water gauge
(IWG). The maximum pressure of around 40 IWG can be achieved at 500 m3/h of
volume flow rate.
Figure 3.8 Performance curve for SECOMAK pump model 587/2
The pressure drop across the intake duct was controlled by a three-inch
butterfly valve. The valve is attached between two flanges in the plenum chamber.
This plenum chamber is created from an empty lubricant oil drum. The drum which
has 50 litre of volume is used to eliminate swirl flow and pressure pulse generated
from the centrifugal pump.
A flow straightener was used to ensure that the flow was uniform before
passing through the vacuum pump. This is extremely important to make sure that the
pulsation and rotation of fluid in the pump blades does not affect the flow uniformity
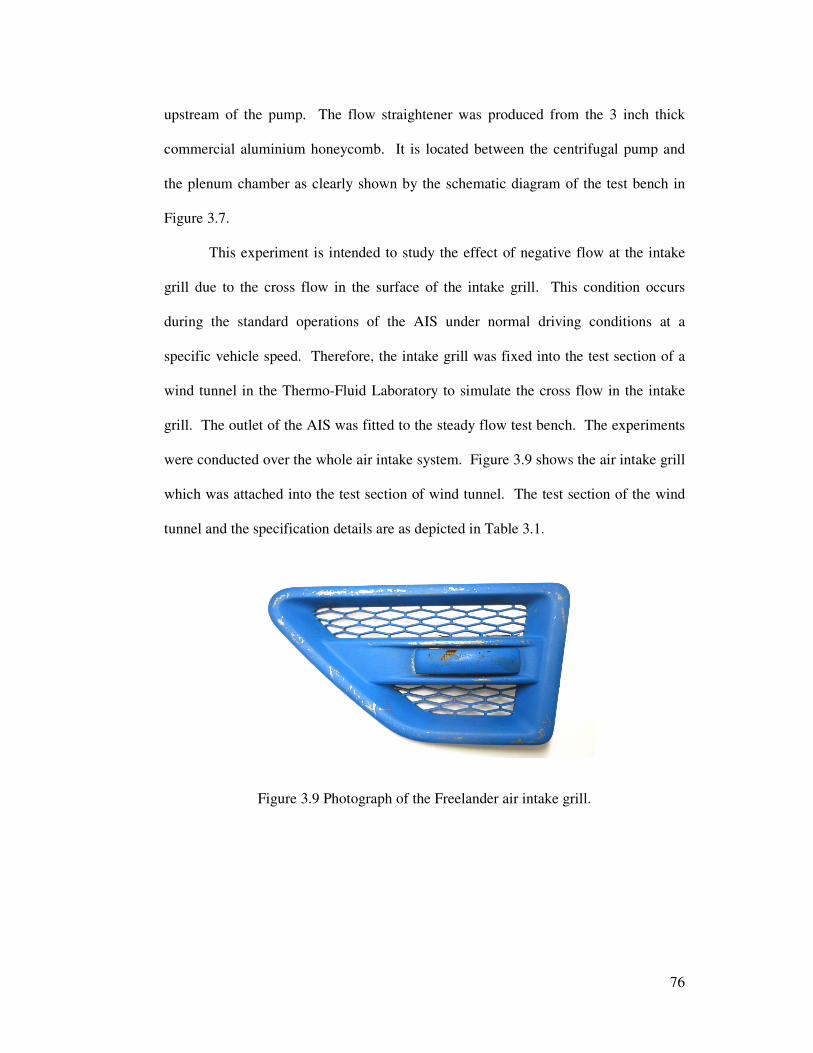
76
upstream of the pump. The flow straightener was produced from the 3 inch thick
commercial aluminium honeycomb. It is located between the centrifugal pump and
the plenum chamber as clearly shown by the schematic diagram of the test bench in
Figure 3.7.
This experiment is intended to study the effect of negative flow at the intake
grill due to the cross flow in the surface of the intake grill. This condition occurs
during the standard operations of the AIS under normal driving conditions at a
specific vehicle speed. Therefore, the intake grill was fixed into the test section of a
wind tunnel in the Thermo-Fluid Laboratory to simulate the cross flow in the intake
grill. The outlet of the AIS was fitted to the steady flow test bench. The experiments
were conducted over the whole air intake system. Figure 3.9 shows the air intake grill
which was attached into the test section of wind tunnel. The test section of the wind
tunnel and the specification details are as depicted in Table 3.1.
Figure 3.9 Photograph of the Freelander air intake grill.
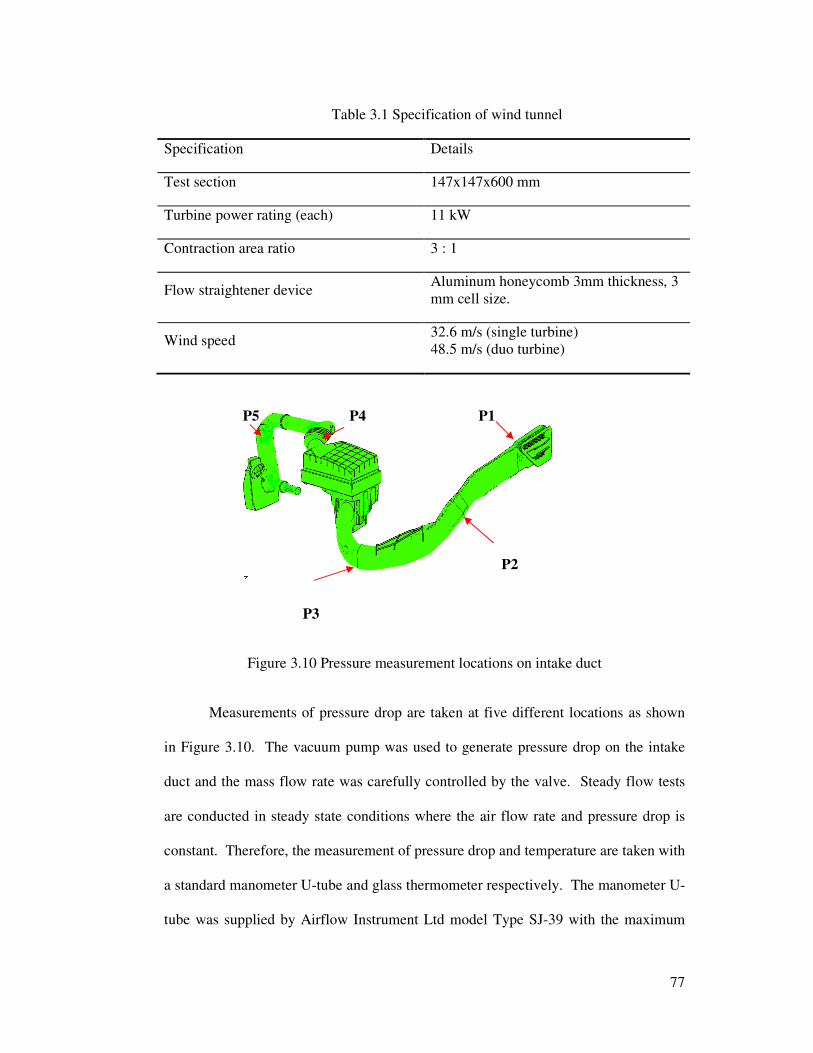
77
Table 3.1 Specification of wind tunnel
Specification Details
Test section 147x147x600 mm
Turbine power rating (each) 11 kW
Contraction area ratio 3 : 1
Flow straightener device Aluminum honeycomb 3mm thickness, 3 mm cell size.
Wind speed 32.6 m/s (single turbine) 48.5 m/s (duo turbine)
P5 P4 P1
P2
P3
Figure 3.10 Pressure measurement locations on intake duct
Measurements of pressure drop are taken at five different locations as shown
in Figure 3.10. The vacuum pump was used to generate pressure drop on the intake
duct and the mass flow rate was carefully controlled by the valve. Steady flow tests
are conducted in steady state conditions where the air flow rate and pressure drop is
constant. Therefore, the measurement of pressure drop and temperature are taken with
a standard manometer U-tube and glass thermometer respectively. The manometer U-
tube was supplied by Airflow Instrument Ltd model Type SJ-39 with the maximum
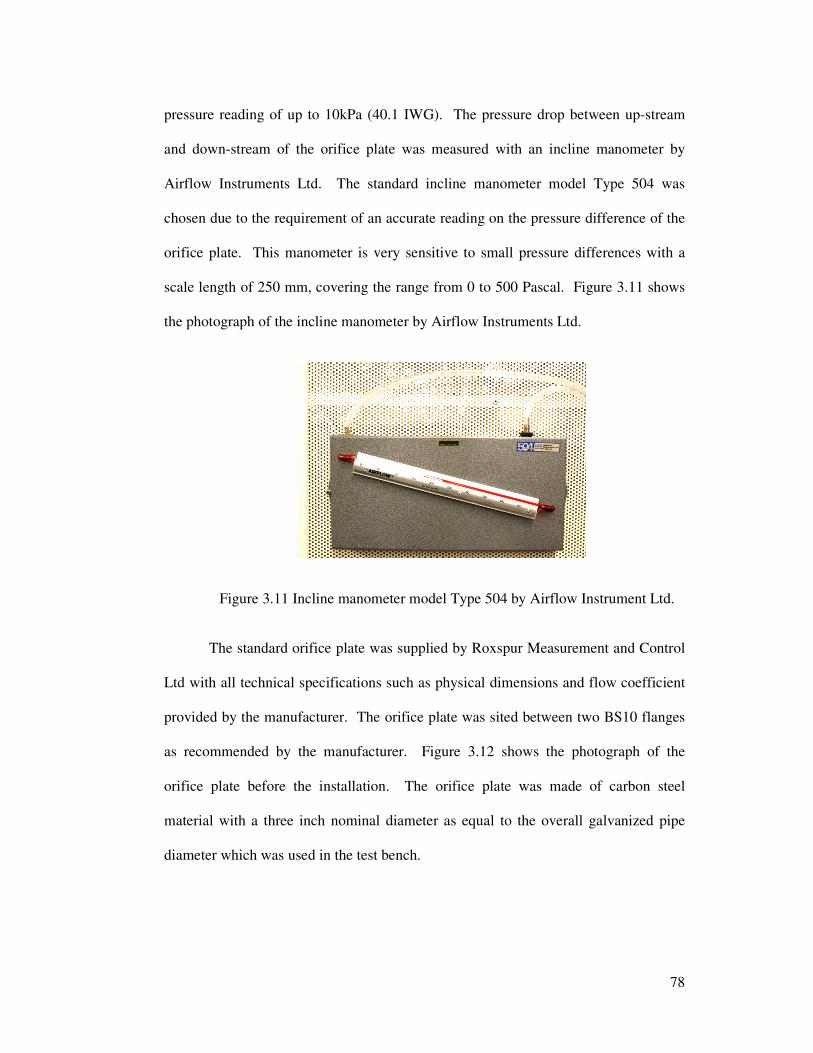
78
pressure reading of up to 10kPa (40.1 IWG). The pressure drop between up-stream
and down-stream of the orifice plate was measured with an incline manometer by
Airflow Instruments Ltd. The standard incline manometer model Type 504 was
chosen due to the requirement of an accurate reading on the pressure difference of the
orifice plate. This manometer is very sensitive to small pressure differences with a
scale length of 250 mm, covering the range from 0 to 500 Pascal. Figure 3.11 shows
the photograph of the incline manometer by Airflow Instruments Ltd.
Figure 3.11 Incline manometer model Type 504 by Airflow Instrument Ltd.
The standard orifice plate was supplied by Roxspur Measurement and Control
Ltd with all technical specifications such as physical dimensions and flow coefficient
provided by the manufacturer. The orifice plate was sited between two BS10 flanges
as recommended by the manufacturer. Figure 3.12 shows the photograph of the
orifice plate before the installation. The orifice plate was made of carbon steel
material with a three inch nominal diameter as equal to the overall galvanized pipe
diameter which was used in the test bench.
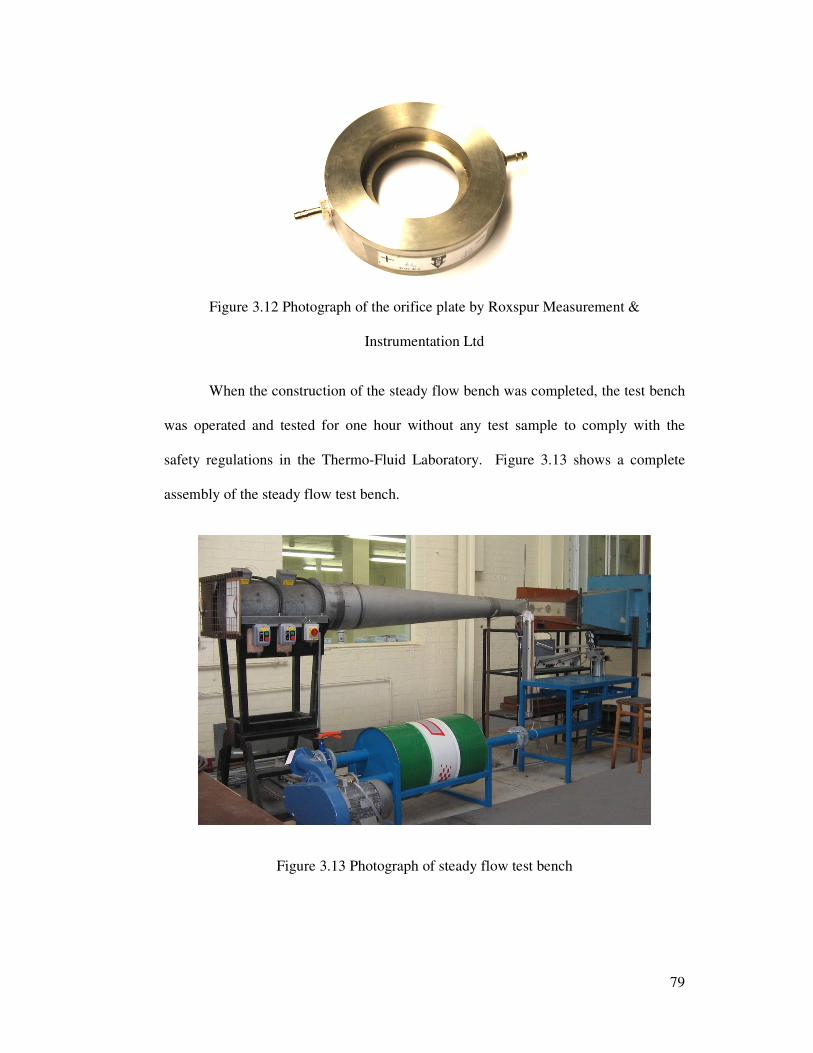
79
Figure 3.12 Photograph of the orifice plate by Roxspur Measurement &
Instrumentation Ltd
When the construction of the steady flow bench was completed, the test bench
was operated and tested for one hour without any test sample to comply with the
safety regulations in the Thermo-Fluid Laboratory. Figure 3.13 shows a complete
assembly of the steady flow test bench.
Figure 3.13 Photograph of steady flow test bench
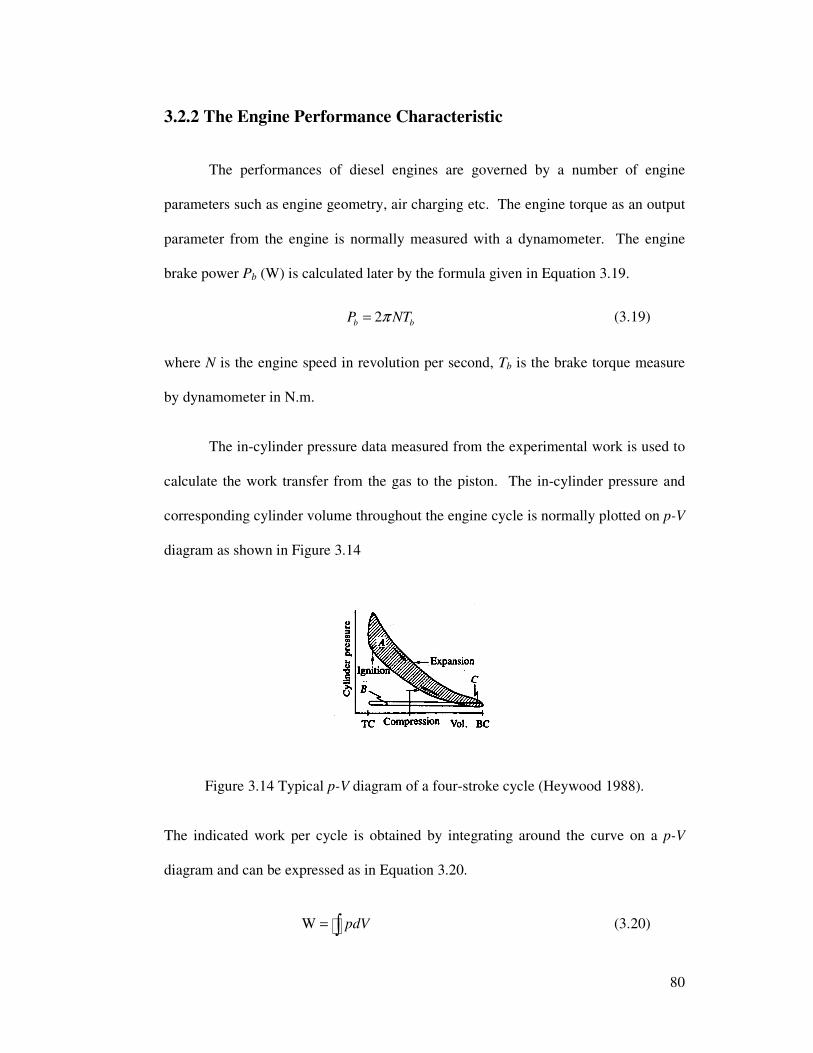
80
3.2.2 The Engine Performance Characteristic
The performances of diesel engines are governed by a number of engine
parameters such as engine geometry, air charging etc. The engine torque as an output
parameter from the engine is normally measured with a dynamometer. The engine
brake power Pb (W) is calculated later by the formula given in Equation 3.19.
2b bP NTπ= (3.19)
where N is the engine speed in revolution per second, Tb is the brake torque measure
by dynamometer in N.m.
The in-cylinder pressure data measured from the experimental work is used to
calculate the work transfer from the gas to the piston. The in-cylinder pressure and
corresponding cylinder volume throughout the engine cycle is normally plotted on p-V
diagram as shown in Figure 3.14
Figure 3.14 Typical p-V diagram of a four-stroke cycle (Heywood 1988).
The indicated work per cycle is obtained by integrating around the curve on a p-V
diagram and can be expressed as in Equation 3.20.
W pdV= ∫� (3.20)
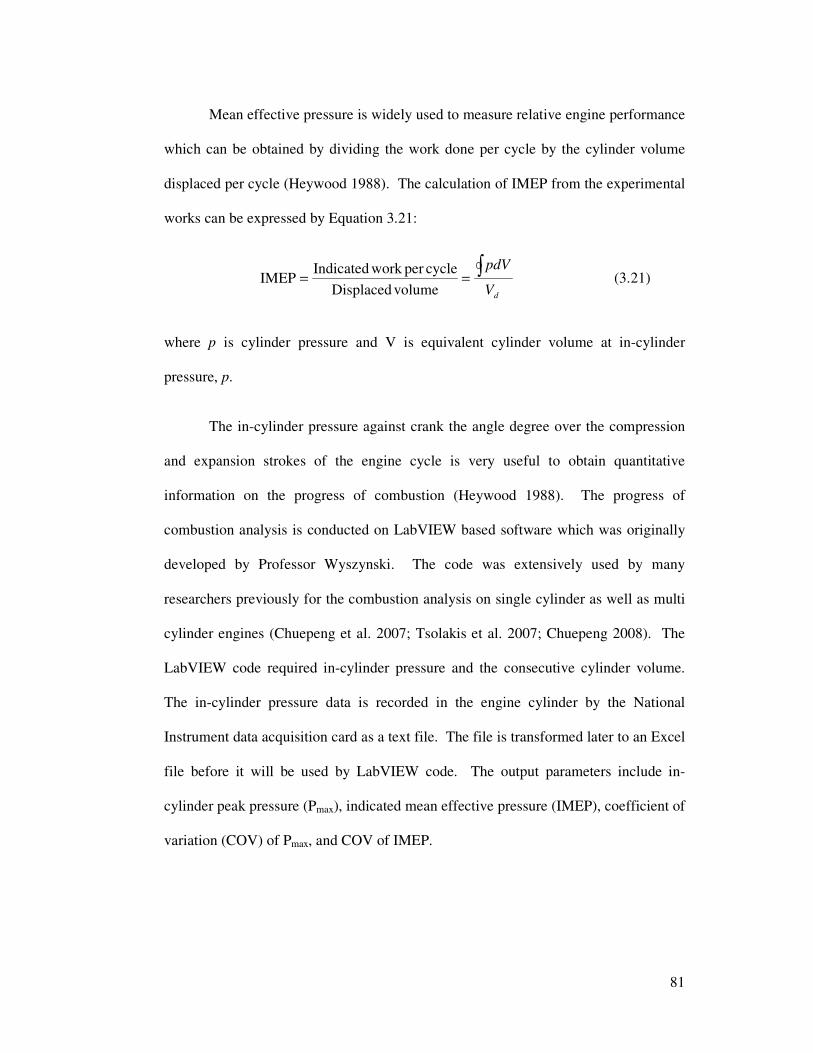
81
Mean effective pressure is widely used to measure relative engine performance
which can be obtained by dividing the work done per cycle by the cylinder volume
displaced per cycle (Heywood 1988). The calculation of IMEP from the experimental
works can be expressed by Equation 3.21:
dV
pdV∫==
volumeDisplaced
cycleperworkIndicatedIMEP (3.21)
where p is cylinder pressure and V is equivalent cylinder volume at in-cylinder
pressure, p.
The in-cylinder pressure against crank the angle degree over the compression
and expansion strokes of the engine cycle is very useful to obtain quantitative
information on the progress of combustion (Heywood 1988). The progress of
combustion analysis is conducted on LabVIEW based software which was originally
developed by Professor Wyszynski. The code was extensively used by many
researchers previously for the combustion analysis on single cylinder as well as multi
cylinder engines (Chuepeng et al. 2007; Tsolakis et al. 2007; Chuepeng 2008). The
LabVIEW code required in-cylinder pressure and the consecutive cylinder volume.
The in-cylinder pressure data is recorded in the engine cylinder by the National
Instrument data acquisition card as a text file. The file is transformed later to an Excel
file before it will be used by LabVIEW code. The output parameters include in-
cylinder peak pressure (Pmax), indicated mean effective pressure (IMEP), coefficient of
variation (COV) of Pmax, and COV of IMEP.
82
The in-cylinder pressure is finally used to analyse the detail of heat release rate
and mass fraction burn. The heat release rate dQ/dθ is calculated using the equation
(Heywood 1988).
θγθγ
γ
θ d
dpV
d
dVp
d
dQ
1
1
1 −+
−= (3.22)
where γ is the ratio of specific heats which are calculated from the actual p-V diagram
(cp/cv), V is the instantaneous volume of the engine cylinder and p is the instantaneous
cylinder pressure. The brake specific fuel consumption (bsfc, in g/kWh) is the mass
fuel flow rate per unit power output of the engine. The calculation of bsfc is given by
Equation 3.23:
b
f
P
m&=bsfc (3.23)
The thermal efficiency is a dimensionless number to measure the performance
of the engines. The engine thermal efficiency ηth is given by:
100)LHV(
(%) ×=f
b
thm
P
&η (3.24)
where fm& is the fuel mass flow rate per cycle, Pb is the brake power.
The volumetric efficiency is a parameter used to measure the effectiveness of
an engine’s induction system. It is defined as the ratio of the actual volume flow rate
of air into the intake system divided by the rate which volume is displaced by the
piston (Heywood 1988).
83
,
2 a
v
a i d
m
V Nη
ρ=
&
(3.25)
Where, am�
is air mass flow rate (kg/s), ,a iρ is the air density (kg/m3) Vd is
displacement volume of the engine (m3) and N is the engine speed (revolution per
second). Equivalently, the volumetric efficiency can also be defined as the ratio of the
actual mass flow per cycle to the mass calculated from the product of the swept
volume and an arbitrary reference density (Smith et al. 1999).
Most modern diesel engines are equipped with EGR systems where the
fraction of the engine exhaust gases is recycled to the intake to dilute the fresh air
mixture for control of NOx emissions (Heywood 1988). The volumetric percentage of
the EGR rate are calculated by
,
,
EGR (vol.%) 100a i m
a i
V V
V
−= ×
& &
& (3.26)
where ,a iV& is the measured intake air flow rates and and mV& is the mass flow rate
measure of the mixture between fresh air and exhaust gas.
3.2.2 Diesel Engine Test Setup
3.2.2.1 Engine Test Bench
The experimental work was performed on a Jaguar V6 diesel engine to
investigate the contributions of AIS onto the engine performance and emission when it
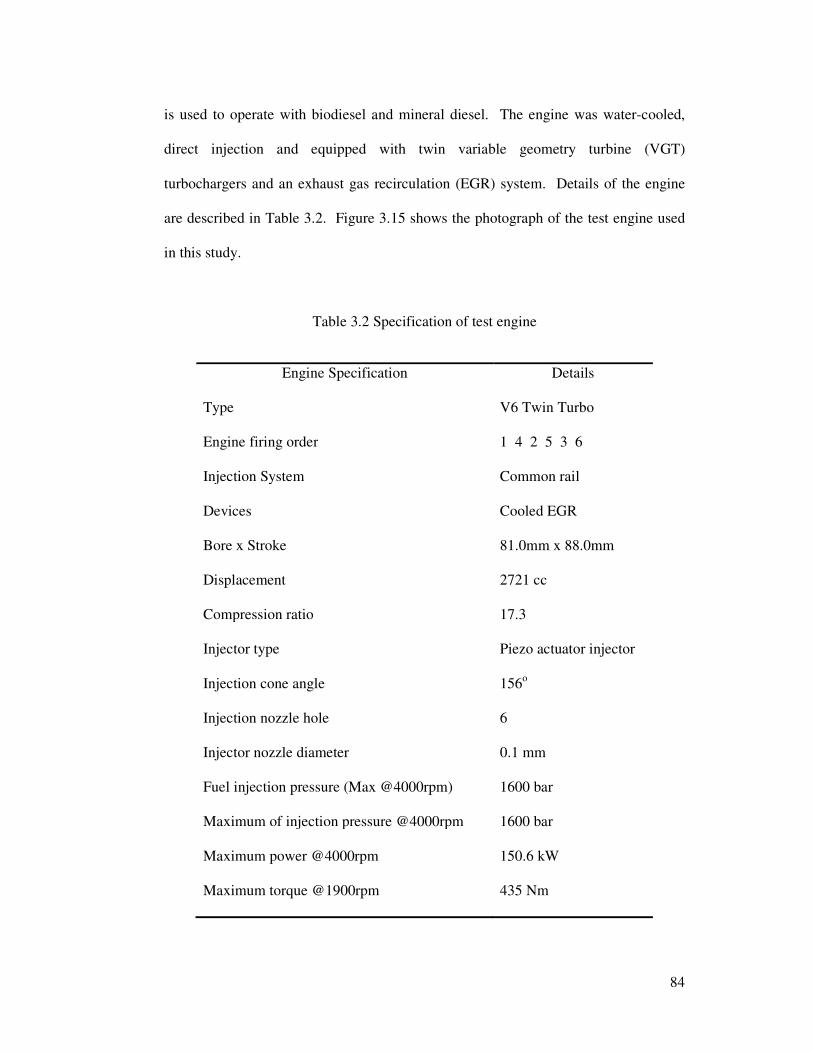
84
is used to operate with biodiesel and mineral diesel. The engine was water-cooled,
direct injection and equipped with twin variable geometry turbine (VGT)
turbochargers and an exhaust gas recirculation (EGR) system. Details of the engine
are described in Table 3.2. Figure 3.15 shows the photograph of the test engine used
in this study.
Table 3.2 Specification of test engine
Engine Specification Details
Type V6 Twin Turbo
Engine firing order 1 4 2 5 3 6
Injection System Common rail
Devices Cooled EGR
Bore x Stroke 81.0mm x 88.0mm
Displacement 2721 cc
Compression ratio 17.3
Injector type Piezo actuator injector
Injection cone angle 156o
Injection nozzle hole 6
Injector nozzle diameter 0.1 mm
Fuel injection pressure (Max @4000rpm) 1600 bar
Maximum of injection pressure @4000rpm 1600 bar
Maximum power @4000rpm 150.6 kW
Maximum torque @1900rpm 435 Nm
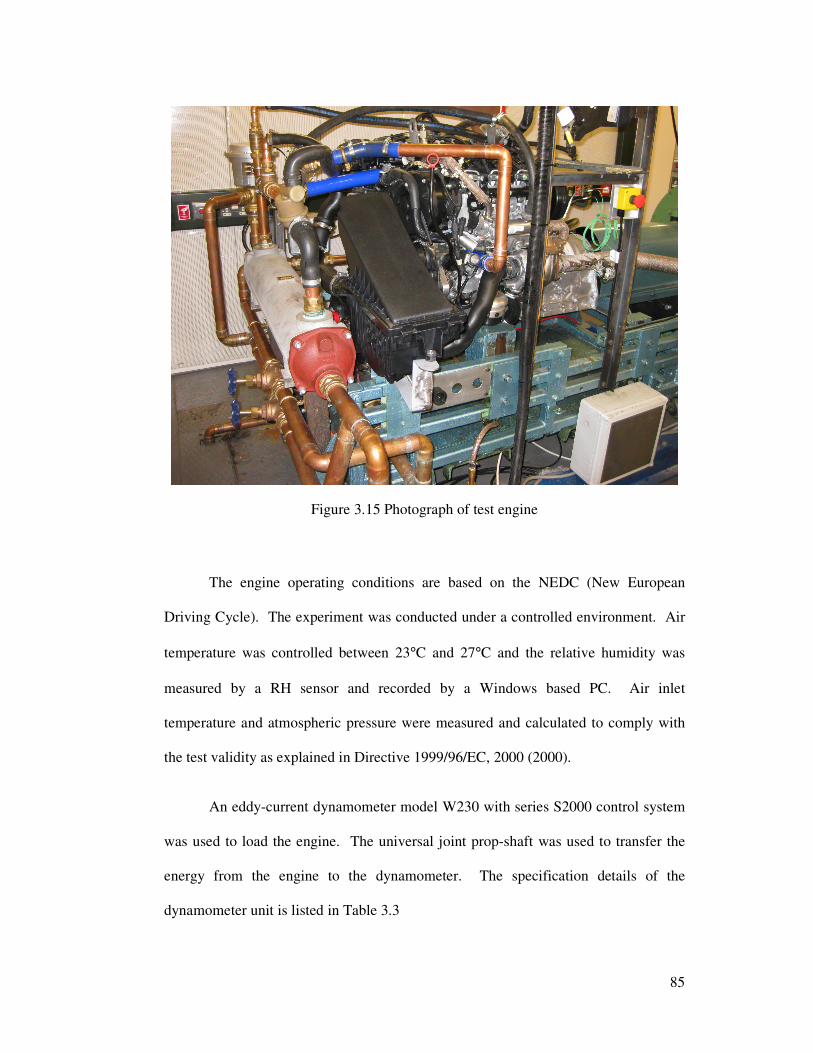
85
Figure 3.15 Photograph of test engine
The engine operating conditions are based on the NEDC (New European
Driving Cycle). The experiment was conducted under a controlled environment. Air
temperature was controlled between 23°C and 27°C and the relative humidity was
measured by a RH sensor and recorded by a Windows based PC. Air inlet
temperature and atmospheric pressure were measured and calculated to comply with
the test validity as explained in Directive 1999/96/EC, 2000 (2000).
An eddy-current dynamometer model W230 with series S2000 control system
was used to load the engine. The universal joint prop-shaft was used to transfer the
energy from the engine to the dynamometer. The specification details of the
dynamometer unit is listed in Table 3.3
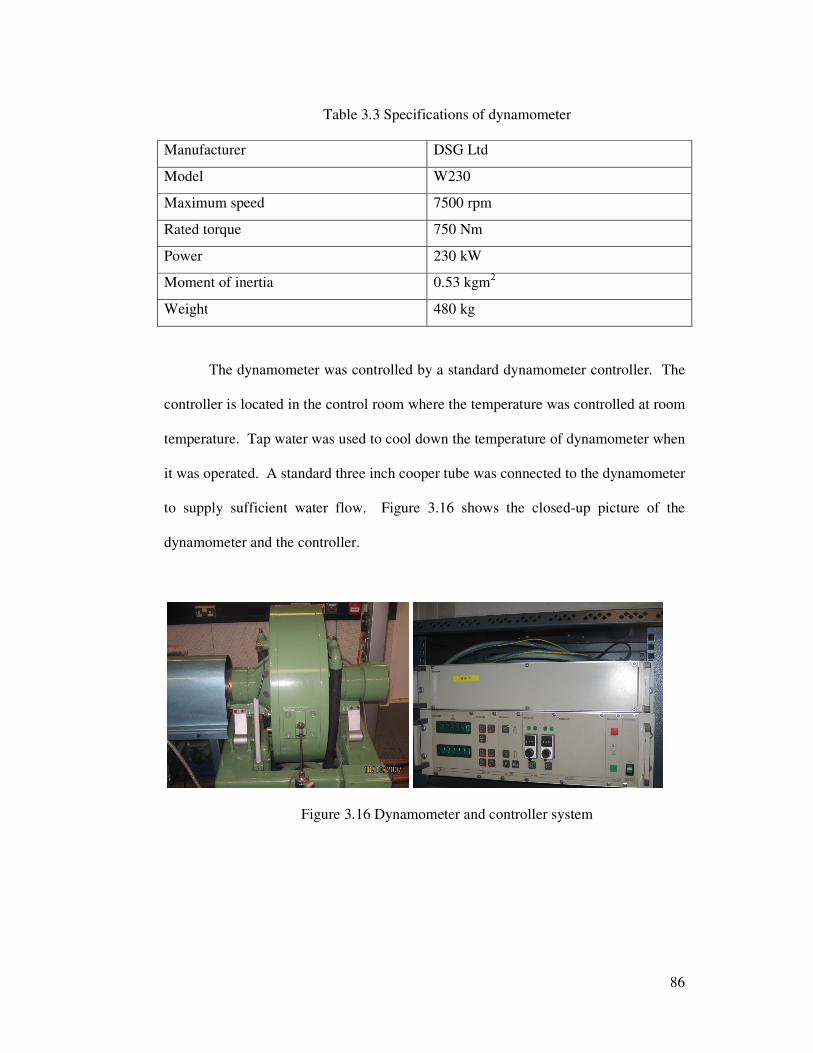
86
Table 3.3 Specifications of dynamometer
Manufacturer DSG Ltd
Model W230
Maximum speed 7500 rpm
Rated torque 750 Nm
Power 230 kW
Moment of inertia 0.53 kgm2
Weight 480 kg
The dynamometer was controlled by a standard dynamometer controller. The
controller is located in the control room where the temperature was controlled at room
temperature. Tap water was used to cool down the temperature of dynamometer when
it was operated. A standard three inch cooper tube was connected to the dynamometer
to supply sufficient water flow. Figure 3.16 shows the closed-up picture of the
dynamometer and the controller.
Figure 3.16 Dynamometer and controller system
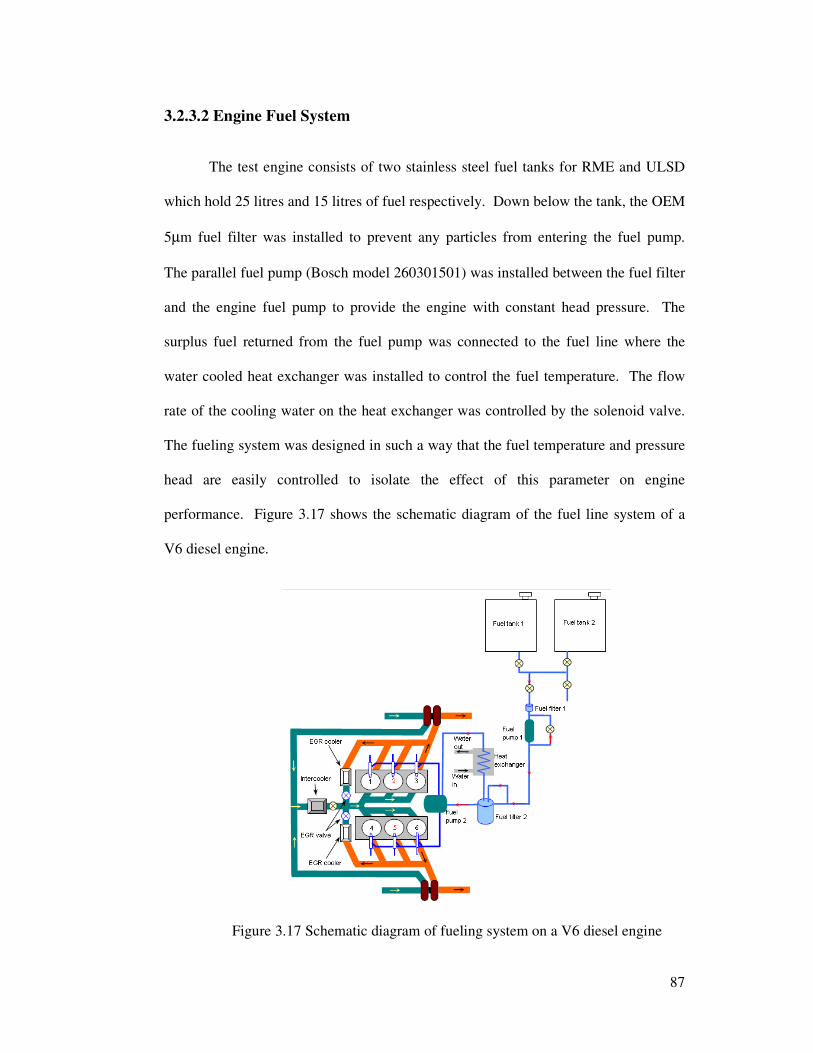
87
3.2.3.2 Engine Fuel System
The test engine consists of two stainless steel fuel tanks for RME and ULSD
which hold 25 litres and 15 litres of fuel respectively. Down below the tank, the OEM
5µm fuel filter was installed to prevent any particles from entering the fuel pump.
The parallel fuel pump (Bosch model 260301501) was installed between the fuel filter
and the engine fuel pump to provide the engine with constant head pressure. The
surplus fuel returned from the fuel pump was connected to the fuel line where the
water cooled heat exchanger was installed to control the fuel temperature. The flow
rate of the cooling water on the heat exchanger was controlled by the solenoid valve.
The fueling system was designed in such a way that the fuel temperature and pressure
head are easily controlled to isolate the effect of this parameter on engine
performance. Figure 3.17 shows the schematic diagram of the fuel line system of a
V6 diesel engine.
Figure 3.17 Schematic diagram of fueling system on a V6 diesel engine
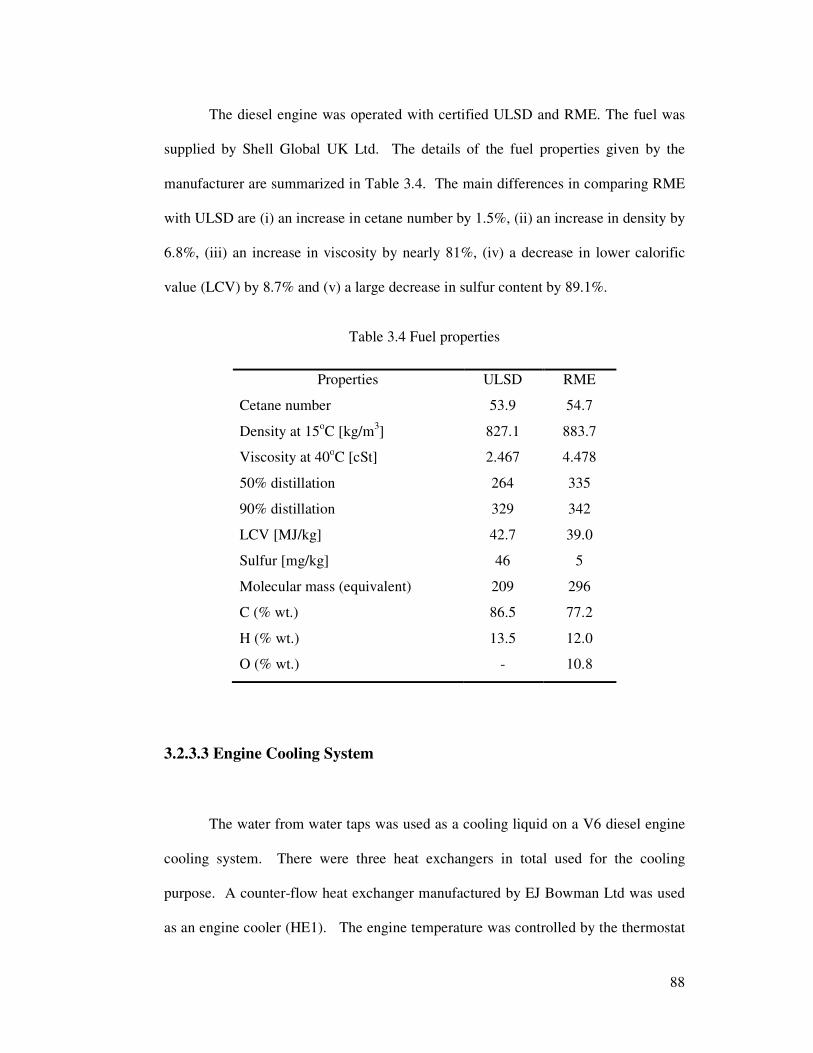
88
The diesel engine was operated with certified ULSD and RME. The fuel was
supplied by Shell Global UK Ltd. The details of the fuel properties given by the
manufacturer are summarized in Table 3.4. The main differences in comparing RME
with ULSD are (i) an increase in cetane number by 1.5%, (ii) an increase in density by
6.8%, (iii) an increase in viscosity by nearly 81%, (iv) a decrease in lower calorific
value (LCV) by 8.7% and (v) a large decrease in sulfur content by 89.1%.
Table 3.4 Fuel properties
Properties ULSD RME
Cetane number 53.9 54.7
Density at 15oC [kg/m3] 827.1 883.7
Viscosity at 40oC [cSt] 2.467 4.478
50% distillation 264 335
90% distillation 329 342
LCV [MJ/kg] 42.7 39.0
Sulfur [mg/kg] 46 5
Molecular mass (equivalent) 209 296
C (% wt.) 86.5 77.2
H (% wt.) 13.5 12.0
O (% wt.) - 10.8
3.2.3.3 Engine Cooling System
The water from water taps was used as a cooling liquid on a V6 diesel engine
cooling system. There were three heat exchangers in total used for the cooling
purpose. A counter-flow heat exchanger manufactured by EJ Bowman Ltd was used
as an engine cooler (HE1). The engine temperature was controlled by the thermostat
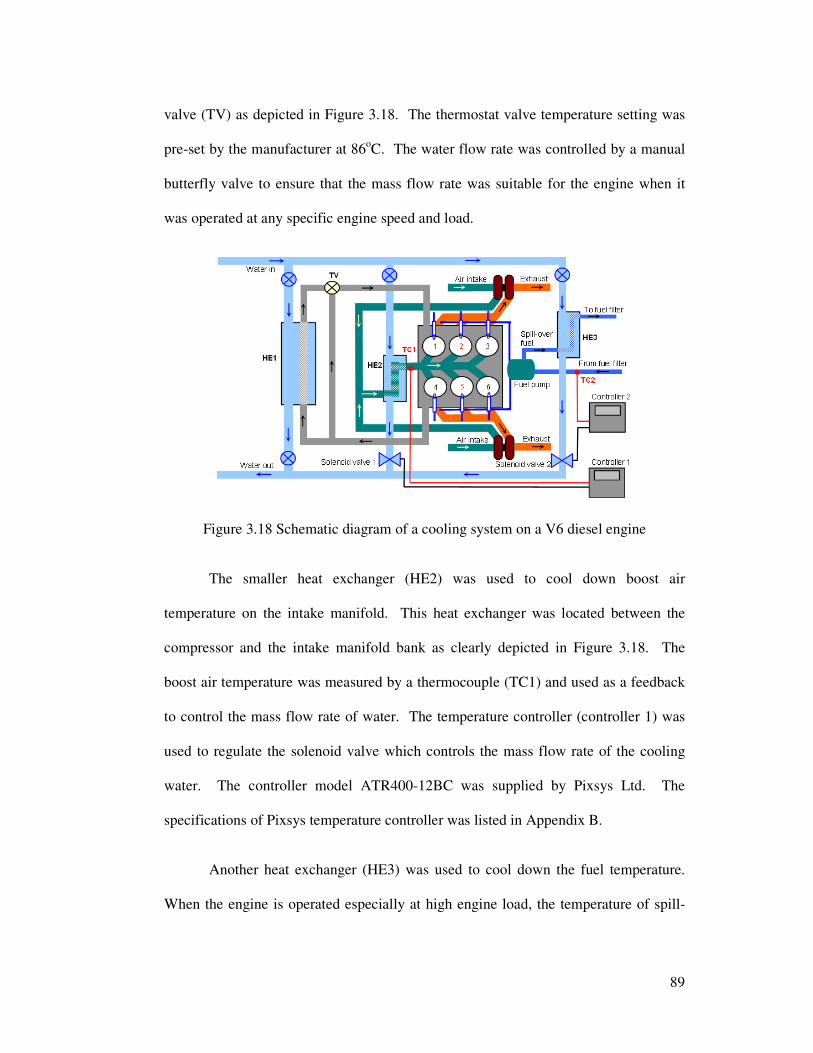
89
valve (TV) as depicted in Figure 3.18. The thermostat valve temperature setting was
pre-set by the manufacturer at 86oC. The water flow rate was controlled by a manual
butterfly valve to ensure that the mass flow rate was suitable for the engine when it
was operated at any specific engine speed and load.
Figure 3.18 Schematic diagram of a cooling system on a V6 diesel engine
The smaller heat exchanger (HE2) was used to cool down boost air
temperature on the intake manifold. This heat exchanger was located between the
compressor and the intake manifold bank as clearly depicted in Figure 3.18. The
boost air temperature was measured by a thermocouple (TC1) and used as a feedback
to control the mass flow rate of water. The temperature controller (controller 1) was
used to regulate the solenoid valve which controls the mass flow rate of the cooling
water. The controller model ATR400-12BC was supplied by Pixsys Ltd. The
specifications of Pixsys temperature controller was listed in Appendix B.
Another heat exchanger (HE3) was used to cool down the fuel temperature.
When the engine is operated especially at high engine load, the temperature of spill-
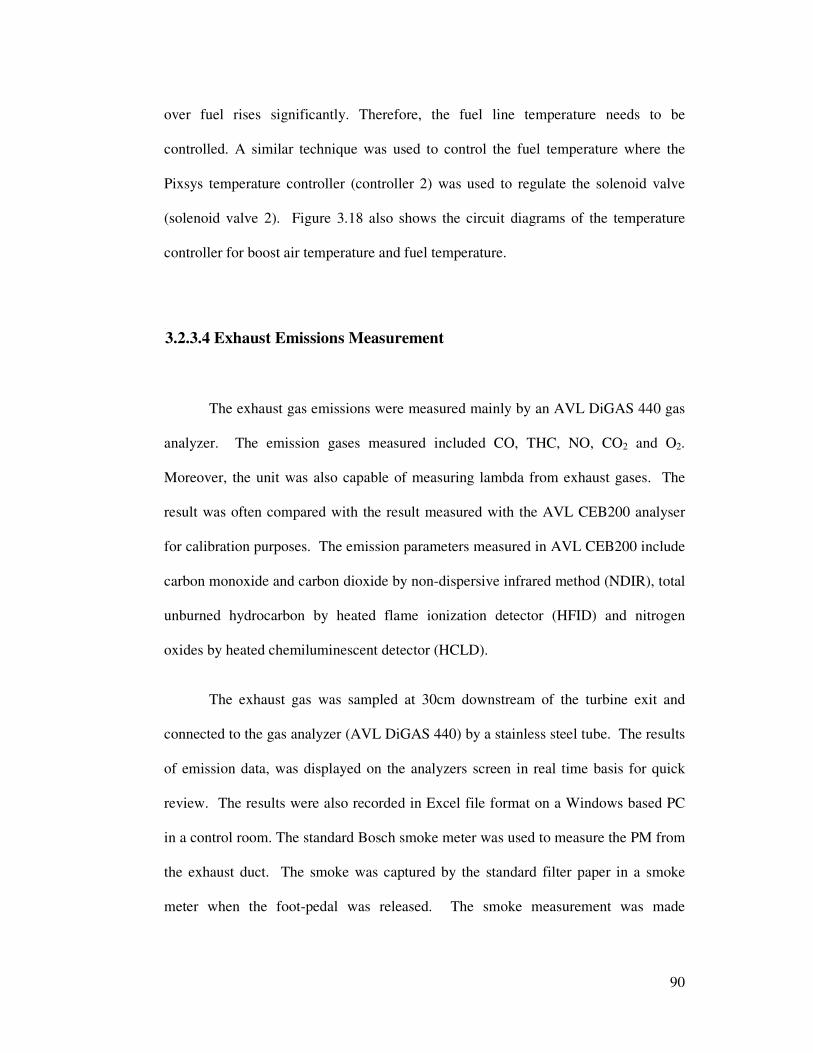
90
over fuel rises significantly. Therefore, the fuel line temperature needs to be
controlled. A similar technique was used to control the fuel temperature where the
Pixsys temperature controller (controller 2) was used to regulate the solenoid valve
(solenoid valve 2). Figure 3.18 also shows the circuit diagrams of the temperature
controller for boost air temperature and fuel temperature.
3.2.3.4 Exhaust Emissions Measurement
The exhaust gas emissions were measured mainly by an AVL DiGAS 440 gas
analyzer. The emission gases measured included CO, THC, NO, CO2 and O2.
Moreover, the unit was also capable of measuring lambda from exhaust gases. The
result was often compared with the result measured with the AVL CEB200 analyser
for calibration purposes. The emission parameters measured in AVL CEB200 include
carbon monoxide and carbon dioxide by non-dispersive infrared method (NDIR), total
unburned hydrocarbon by heated flame ionization detector (HFID) and nitrogen
oxides by heated chemiluminescent detector (HCLD).
The exhaust gas was sampled at 30cm downstream of the turbine exit and
connected to the gas analyzer (AVL DiGAS 440) by a stainless steel tube. The results
of emission data, was displayed on the analyzers screen in real time basis for quick
review. The results were also recorded in Excel file format on a Windows based PC
in a control room. The standard Bosch smoke meter was used to measure the PM from
the exhaust duct. The smoke was captured by the standard filter paper in a smoke
meter when the foot-pedal was released. The smoke measurement was made
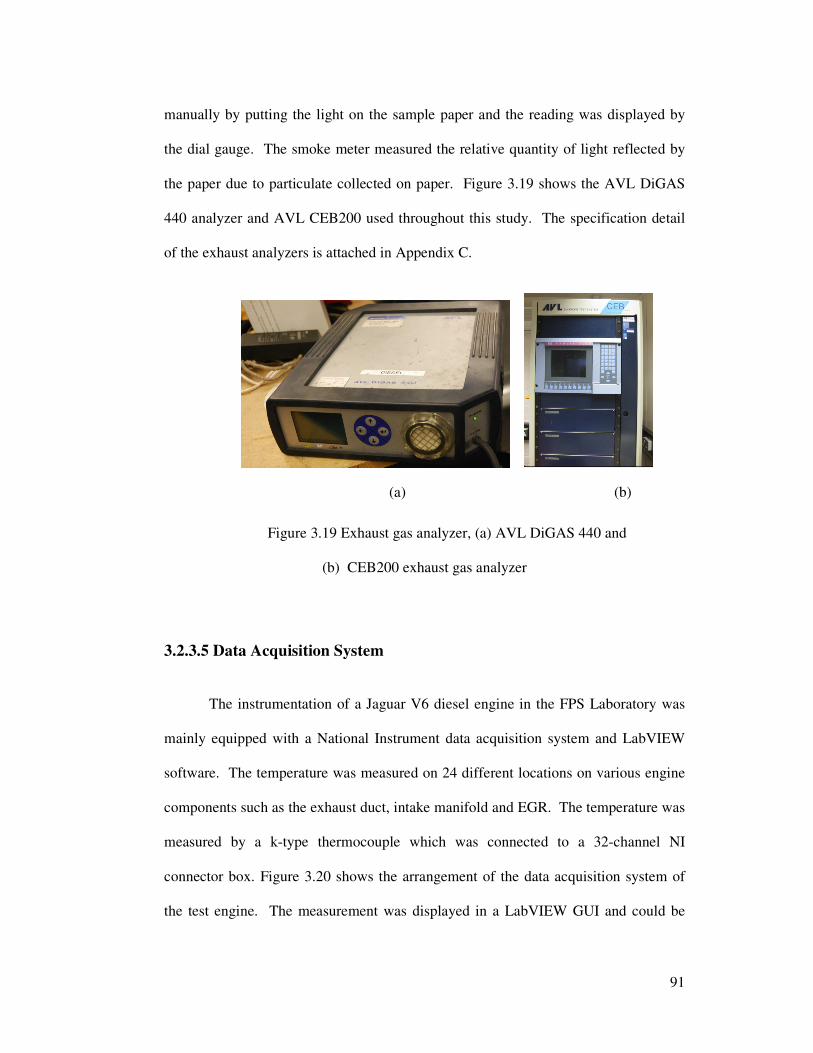
91
manually by putting the light on the sample paper and the reading was displayed by
the dial gauge. The smoke meter measured the relative quantity of light reflected by
the paper due to particulate collected on paper. Figure 3.19 shows the AVL DiGAS
440 analyzer and AVL CEB200 used throughout this study. The specification detail
of the exhaust analyzers is attached in Appendix C.
(a) (b)
Figure 3.19 Exhaust gas analyzer, (a) AVL DiGAS 440 and
(b) CEB200 exhaust gas analyzer
3.2.3.5 Data Acquisition System
The instrumentation of a Jaguar V6 diesel engine in the FPS Laboratory was
mainly equipped with a National Instrument data acquisition system and LabVIEW
software. The temperature was measured on 24 different locations on various engine
components such as the exhaust duct, intake manifold and EGR. The temperature was
measured by a k-type thermocouple which was connected to a 32-channel NI
connector box. Figure 3.20 shows the arrangement of the data acquisition system of
the test engine. The measurement was displayed in a LabVIEW GUI and could be
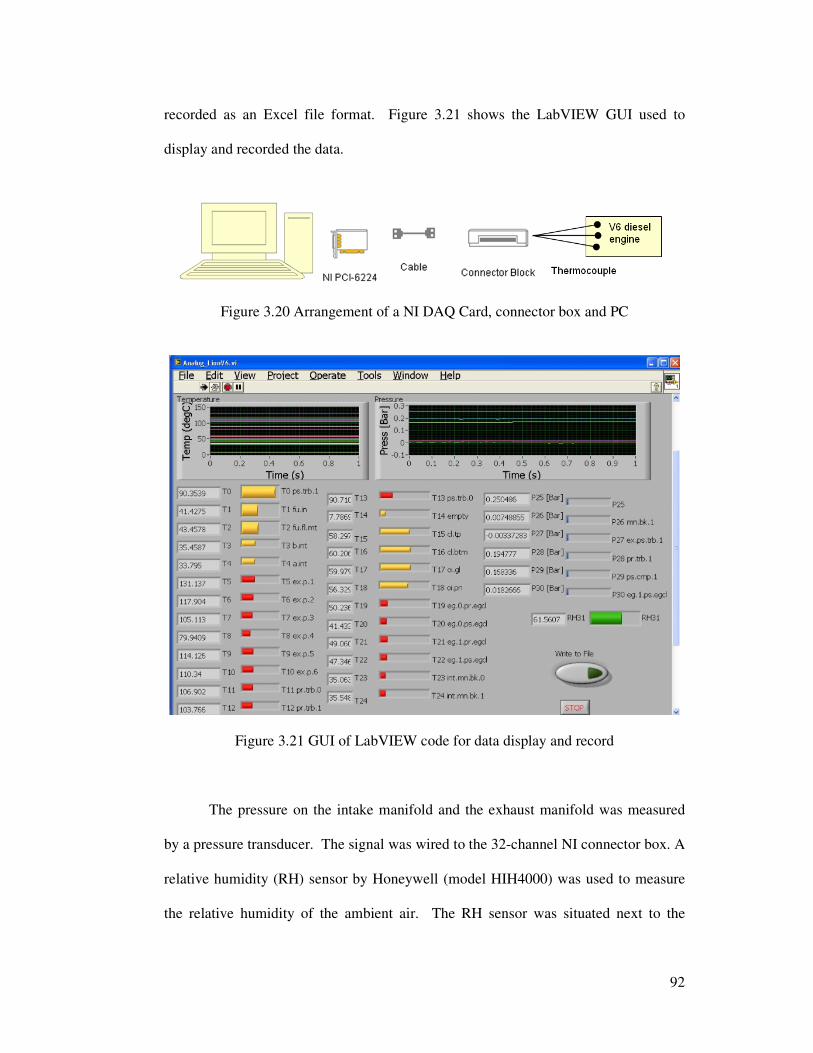
92
recorded as an Excel file format. Figure 3.21 shows the LabVIEW GUI used to
display and recorded the data.
Figure 3.20 Arrangement of a NI DAQ Card, connector box and PC
Figure 3.21 GUI of LabVIEW code for data display and record
The pressure on the intake manifold and the exhaust manifold was measured
by a pressure transducer. The signal was wired to the 32-channel NI connector box. A
relative humidity (RH) sensor by Honeywell (model HIH4000) was used to measure
the relative humidity of the ambient air. The RH sensor was situated next to the
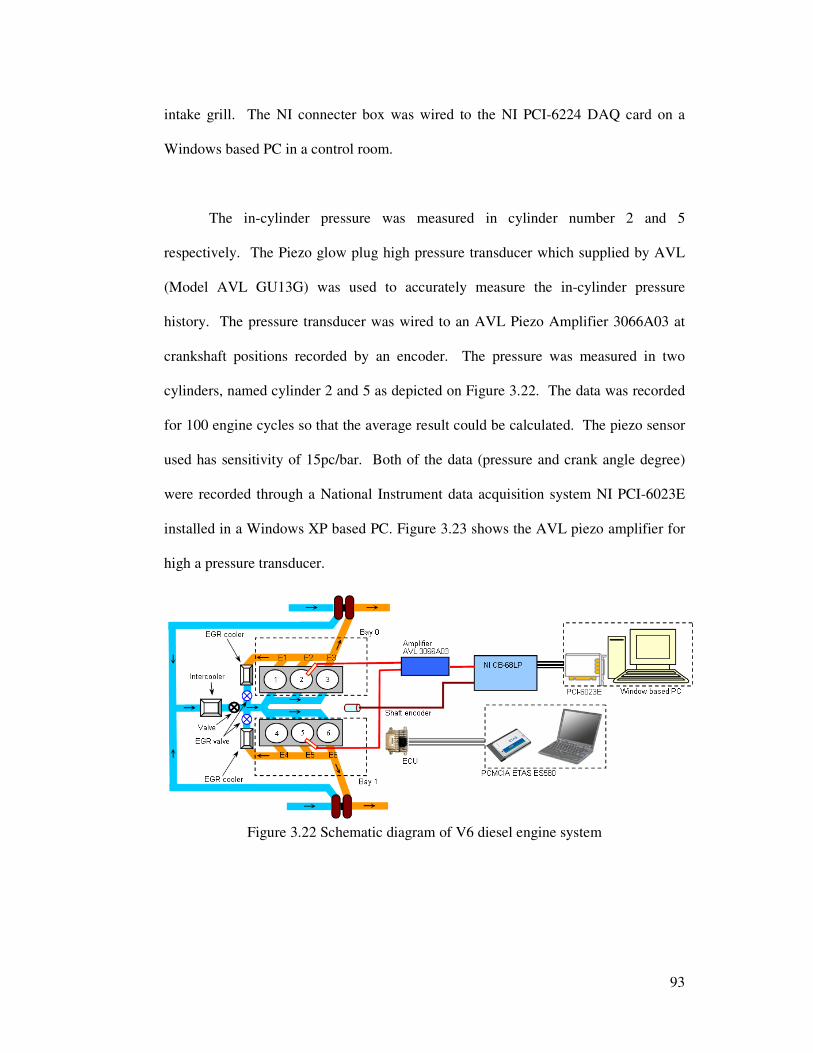
93
intake grill. The NI connecter box was wired to the NI PCI-6224 DAQ card on a
Windows based PC in a control room.
The in-cylinder pressure was measured in cylinder number 2 and 5
respectively. The Piezo glow plug high pressure transducer which supplied by AVL
(Model AVL GU13G) was used to accurately measure the in-cylinder pressure
history. The pressure transducer was wired to an AVL Piezo Amplifier 3066A03 at
crankshaft positions recorded by an encoder. The pressure was measured in two
cylinders, named cylinder 2 and 5 as depicted on Figure 3.22. The data was recorded
for 100 engine cycles so that the average result could be calculated. The piezo sensor
used has sensitivity of 15pc/bar. Both of the data (pressure and crank angle degree)
were recorded through a National Instrument data acquisition system NI PCI-6023E
installed in a Windows XP based PC. Figure 3.23 shows the AVL piezo amplifier for
high a pressure transducer.
Figure 3.22 Schematic diagram of V6 diesel engine system
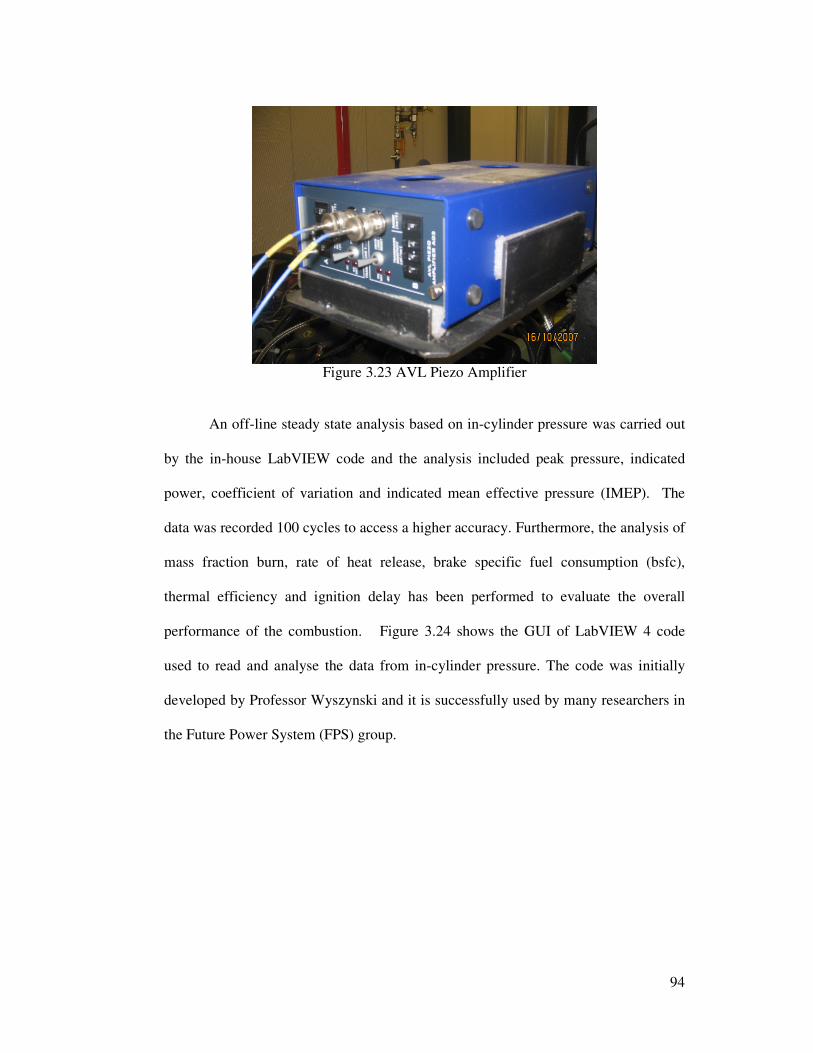
94
Figure 3.23 AVL Piezo Amplifier
An off-line steady state analysis based on in-cylinder pressure was carried out
by the in-house LabVIEW code and the analysis included peak pressure, indicated
power, coefficient of variation and indicated mean effective pressure (IMEP). The
data was recorded 100 cycles to access a higher accuracy. Furthermore, the analysis of
mass fraction burn, rate of heat release, brake specific fuel consumption (bsfc),
thermal efficiency and ignition delay has been performed to evaluate the overall
performance of the combustion. Figure 3.24 shows the GUI of LabVIEW 4 code
used to read and analyse the data from in-cylinder pressure. The code was initially
developed by Professor Wyszynski and it is successfully used by many researchers in
the Future Power System (FPS) group.
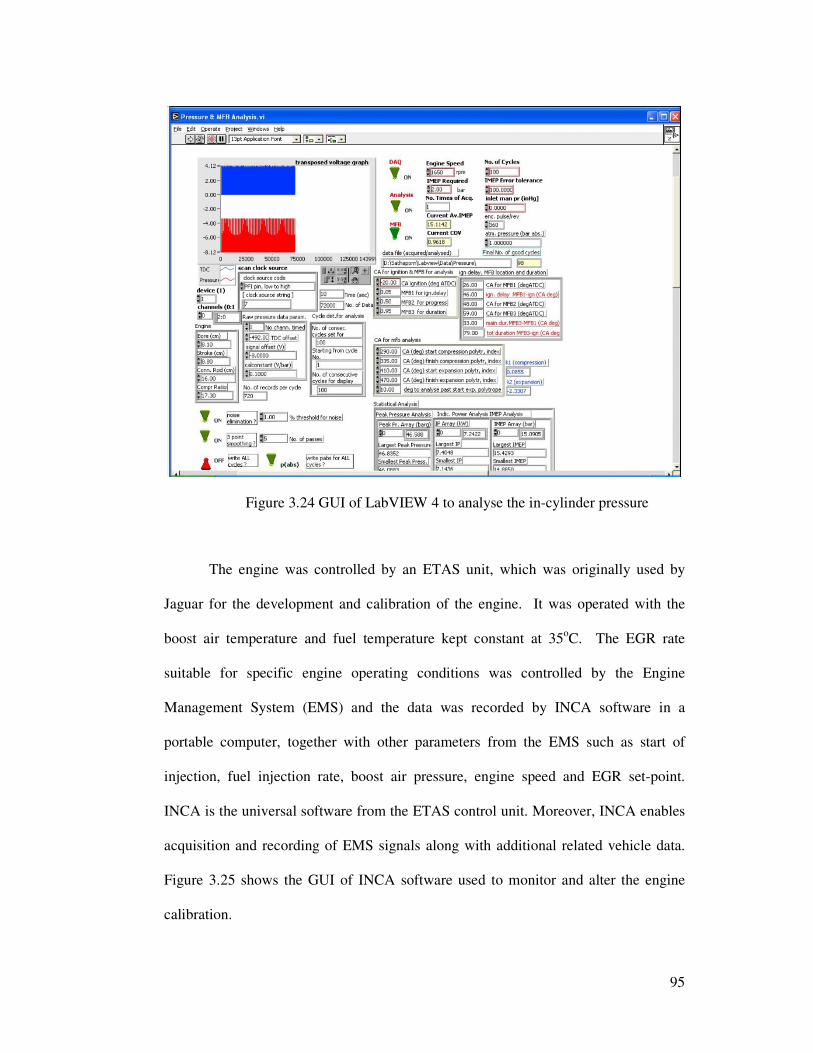
95
Figure 3.24 GUI of LabVIEW 4 to analyse the in-cylinder pressure
The engine was controlled by an ETAS unit, which was originally used by
Jaguar for the development and calibration of the engine. It was operated with the
boost air temperature and fuel temperature kept constant at 35oC. The EGR rate
suitable for specific engine operating conditions was controlled by the Engine
Management System (EMS) and the data was recorded by INCA software in a
portable computer, together with other parameters from the EMS such as start of
injection, fuel injection rate, boost air pressure, engine speed and EGR set-point.
INCA is the universal software from the ETAS control unit. Moreover, INCA enables
acquisition and recording of EMS signals along with additional related vehicle data.
Figure 3.25 shows the GUI of INCA software used to monitor and alter the engine
calibration.
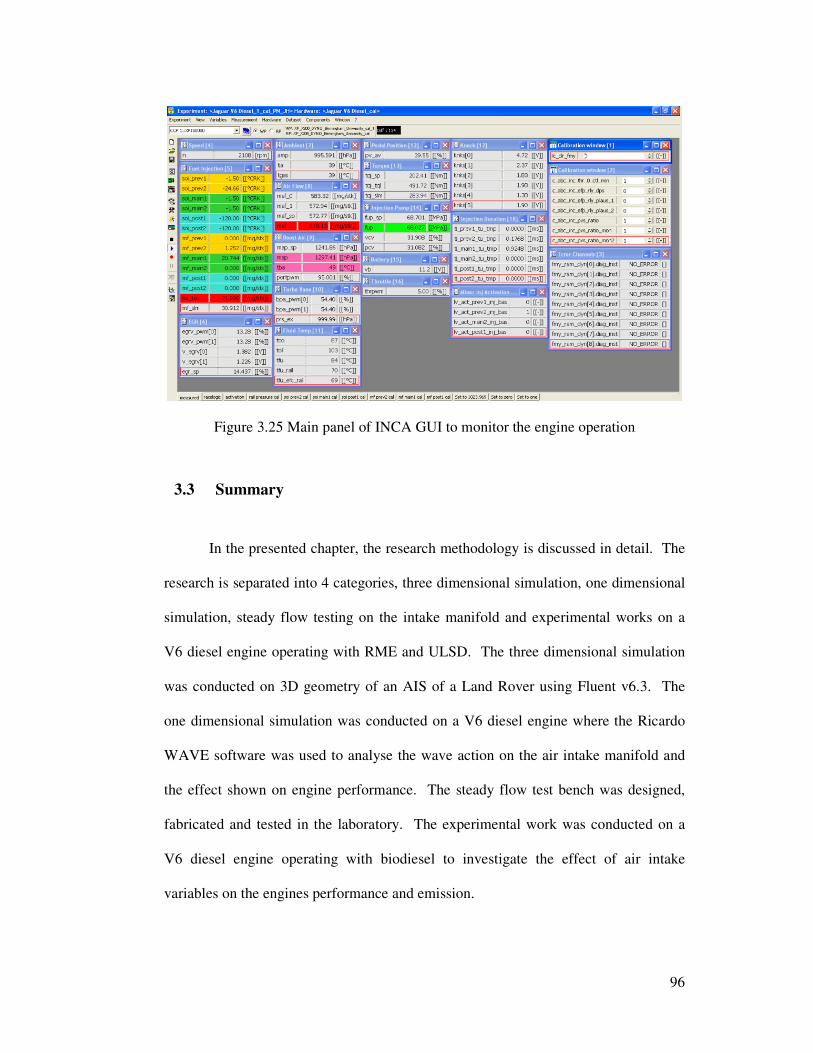
96
Figure 3.25 Main panel of INCA GUI to monitor the engine operation
3.3 Summary
In the presented chapter, the research methodology is discussed in detail. The
research is separated into 4 categories, three dimensional simulation, one dimensional
simulation, steady flow testing on the intake manifold and experimental works on a
V6 diesel engine operating with RME and ULSD. The three dimensional simulation
was conducted on 3D geometry of an AIS of a Land Rover using Fluent v6.3. The
one dimensional simulation was conducted on a V6 diesel engine where the Ricardo
WAVE software was used to analyse the wave action on the air intake manifold and
the effect shown on engine performance. The steady flow test bench was designed,
fabricated and tested in the laboratory. The experimental work was conducted on a
V6 diesel engine operating with biodiesel to investigate the effect of air intake
variables on the engines performance and emission.
97
CHAPTER 4
CFD MODELLING OF AIR INTAKE SYSTEM AND
VALIDATION
4.1 Introduction
The objective of the air intake modelling is to predict and analyze the flow
through the intake system where the intake grill is positioned behind the front wheel
arch of the vehicle. In most of the vehicles used today, the grill of the air intake is
located at the front side to acquire the benefit of ram effect. In some cases, however,
the grill is located behind the vehicle to improve wading performance. The study was
focused on different flow speeds and vectors on the grill at high load operation where
the air speed at the grill side is high and creates negative pressure. The CFD results
are validated against experimental data of the steady flow test bench.
4.2 Problem Definitions
Engine performance is sensitive to induction depression especially for Internal
Combustion (IC) engines running without a turbocharger or supercharger. Most
engine intake systems consist of dirty duct, air box, air cleaner, clean duct, intake
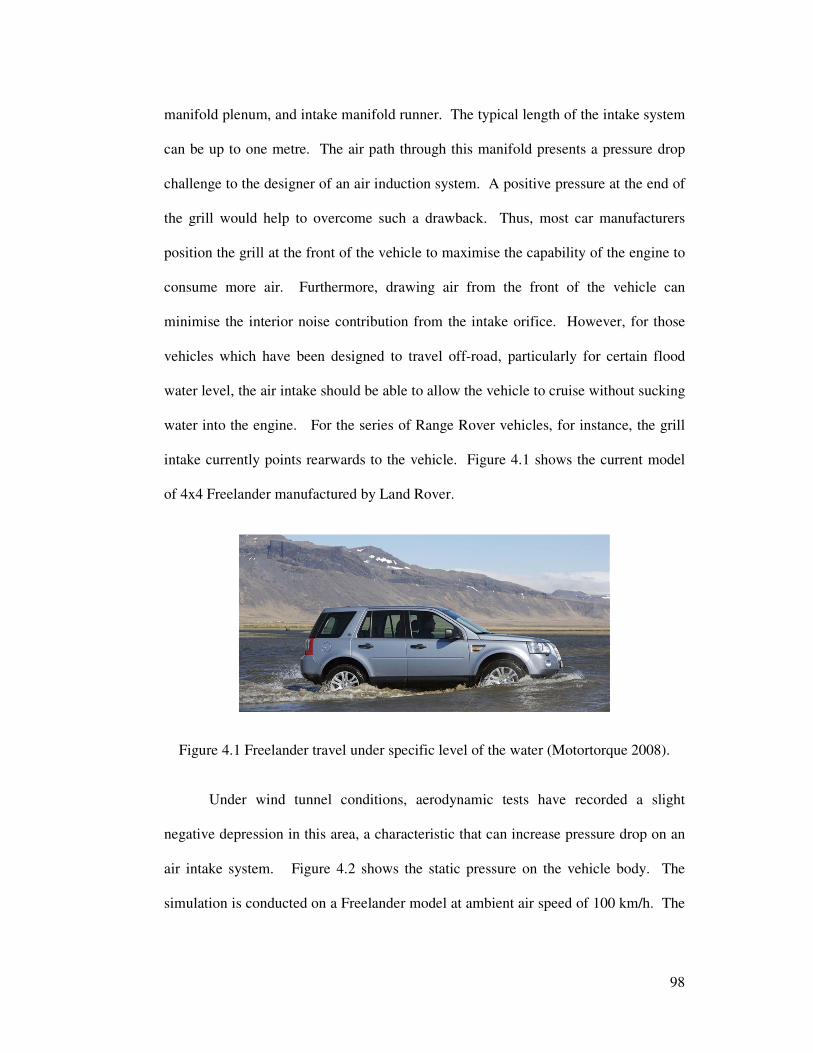
98
manifold plenum, and intake manifold runner. The typical length of the intake system
can be up to one metre. The air path through this manifold presents a pressure drop
challenge to the designer of an air induction system. A positive pressure at the end of
the grill would help to overcome such a drawback. Thus, most car manufacturers
position the grill at the front of the vehicle to maximise the capability of the engine to
consume more air. Furthermore, drawing air from the front of the vehicle can
minimise the interior noise contribution from the intake orifice. However, for those
vehicles which have been designed to travel off-road, particularly for certain flood
water level, the air intake should be able to allow the vehicle to cruise without sucking
water into the engine. For the series of Range Rover vehicles, for instance, the grill
intake currently points rearwards to the vehicle. Figure 4.1 shows the current model
of 4x4 Freelander manufactured by Land Rover.
Figure 4.1 Freelander travel under specific level of the water (Motortorque 2008).
Under wind tunnel conditions, aerodynamic tests have recorded a slight
negative depression in this area, a characteristic that can increase pressure drop on an
air intake system. Figure 4.2 shows the static pressure on the vehicle body. The
simulation is conducted on a Freelander model at ambient air speed of 100 km/h. The
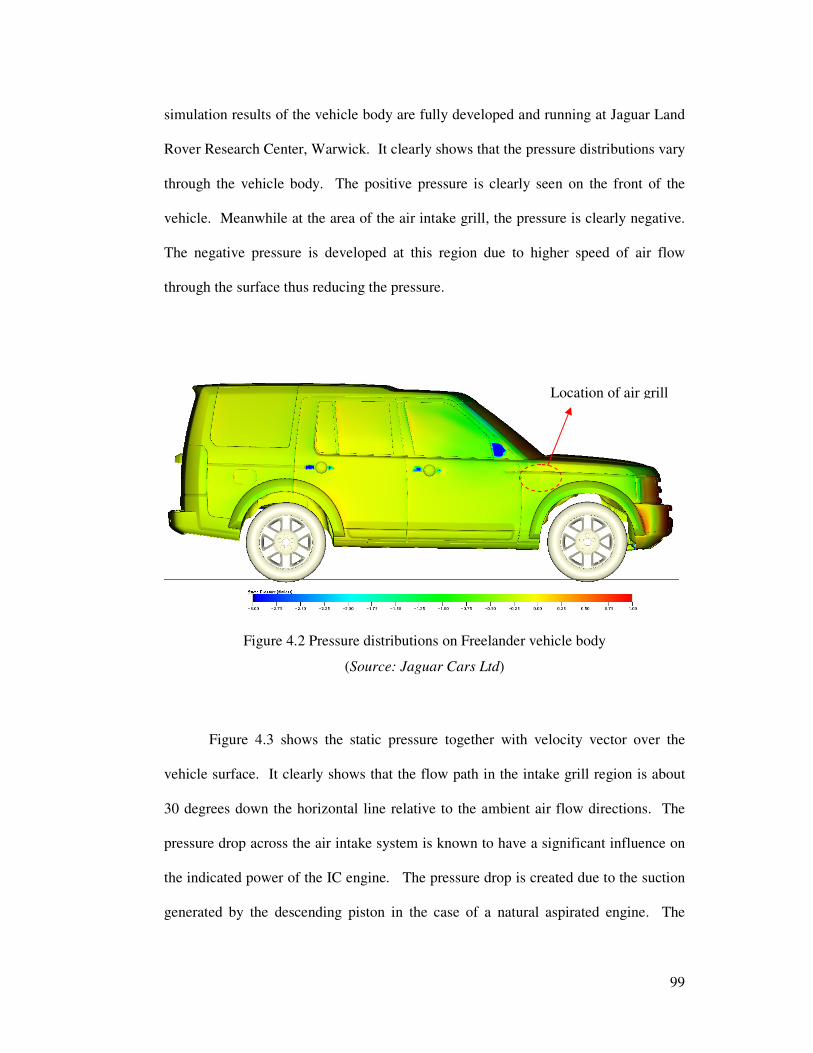
99
simulation results of the vehicle body are fully developed and running at Jaguar Land
Rover Research Center, Warwick. It clearly shows that the pressure distributions vary
through the vehicle body. The positive pressure is clearly seen on the front of the
vehicle. Meanwhile at the area of the air intake grill, the pressure is clearly negative.
The negative pressure is developed at this region due to higher speed of air flow
through the surface thus reducing the pressure.
Figure 4.2 Pressure distributions on Freelander vehicle body
(Source: Jaguar Cars Ltd)
Figure 4.3 shows the static pressure together with velocity vector over the
vehicle surface. It clearly shows that the flow path in the intake grill region is about
30 degrees down the horizontal line relative to the ambient air flow directions. The
pressure drop across the air intake system is known to have a significant influence on
the indicated power of the IC engine. The pressure drop is created due to the suction
generated by the descending piston in the case of a natural aspirated engine. The
Location of air grill
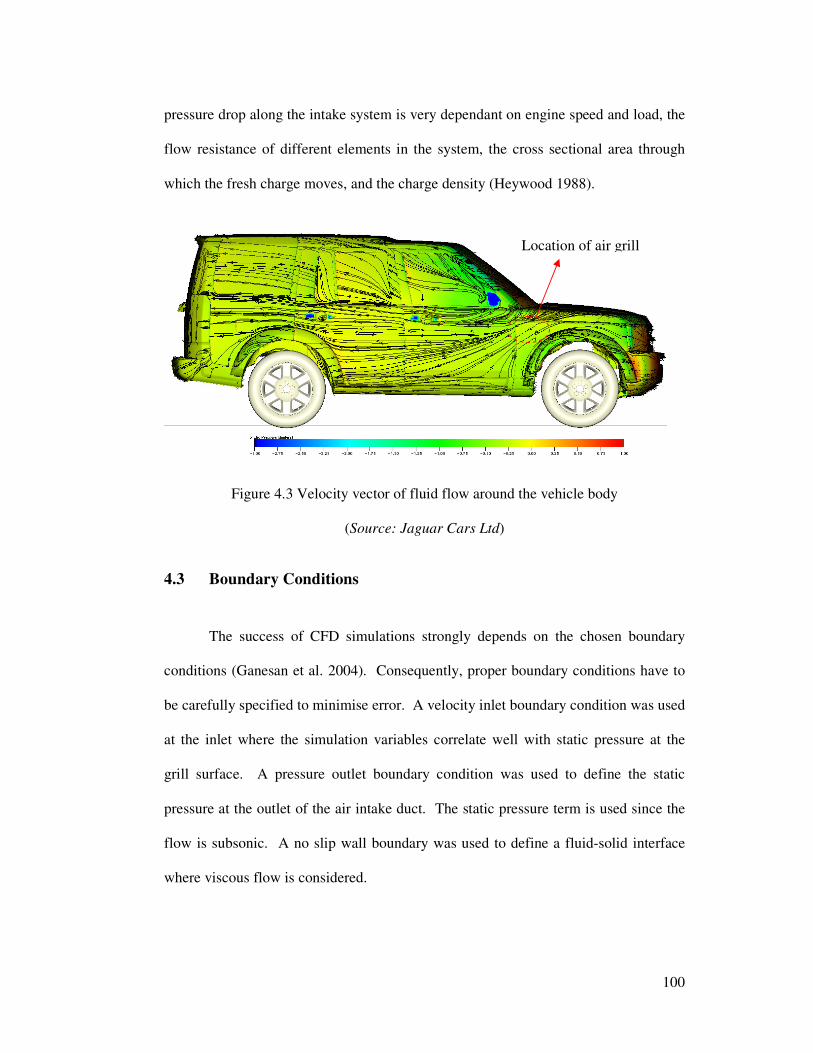
100
pressure drop along the intake system is very dependant on engine speed and load, the
flow resistance of different elements in the system, the cross sectional area through
which the fresh charge moves, and the charge density (Heywood 1988).
Figure 4.3 Velocity vector of fluid flow around the vehicle body
(Source: Jaguar Cars Ltd)
4.3 Boundary Conditions
The success of CFD simulations strongly depends on the chosen boundary
conditions (Ganesan et al. 2004). Consequently, proper boundary conditions have to
be carefully specified to minimise error. A velocity inlet boundary condition was used
at the inlet where the simulation variables correlate well with static pressure at the
grill surface. A pressure outlet boundary condition was used to define the static
pressure at the outlet of the air intake duct. The static pressure term is used since the
flow is subsonic. A no slip wall boundary was used to define a fluid-solid interface
where viscous flow is considered.
Location of air grill
101
The air filter in the airbox is modelled as a porous media. The porous media
model offered by FLUENT have covered a wide variety of problems, including flows
through packed beds, fibrous mat, perforated plates, flow distributors, and tube banks.
In this approach, porous media are modelled by the addition of a momentum source
term to the standard fluid flow equations. This momentum sink contributes to the
pressure gradient in the porous cell zone, creating a pressure drop that is proportional
to the fluid velocity (or velocity squared) in the cell (Fluent 2005). For the simplicity
of the analysis, the viscous resistance and inertial resistance are estimated as 420x1010
and 120 respectively. These values are considered appropriate to this numerical
analysis as the focus of the study is not on the filter itself but more on the flow
behaviour of the air intake system due to the geometrical properties of the intake grill.
Porosity of the filter is assumed to be uniform.
The simulations were ran under two different entry conditions. First phase:
static air at the grill entry. Second phase: imposed tangential velocity at the grill
entry. Under static conditions, the simulation was conducted for different mass flow
rates to visualize the pressure drop across the intake grill and duct. The mass flow
rates were 0.29, 0.3, 0.34 and 0.37 kg/s and are consistent with the experimental
measurements. These mass flow rates were chosen to study the effect of high
Reynolds number flows on the air intake system.
The second phase of simulations was to study the effect of tangential velocity
at the grill side. The simulation was conducted with different air speeds at the grill
side as depicted in Table 4.1. The outlet pressure was fixed at -62.58 Pa for all the
simulations and representative of the pressure drop across the intake system at high
engine speeds (>4000rpm). The assumptions have been made based on specifications
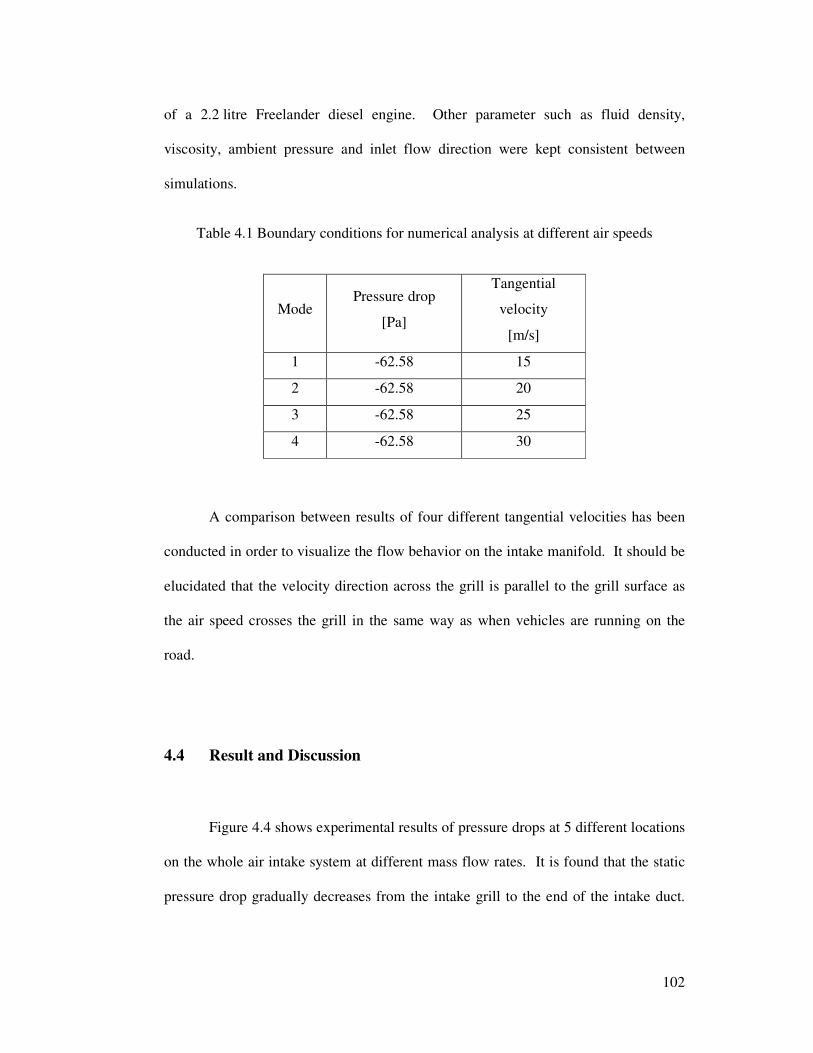
102
of a 2.2 litre Freelander diesel engine. Other parameter such as fluid density,
viscosity, ambient pressure and inlet flow direction were kept consistent between
simulations.
Table 4.1 Boundary conditions for numerical analysis at different air speeds
Mode Pressure drop
[Pa]
Tangential
velocity
[m/s]
1 -62.58 15
2 -62.58 20
3 -62.58 25
4 -62.58 30
A comparison between results of four different tangential velocities has been
conducted in order to visualize the flow behavior on the intake manifold. It should be
elucidated that the velocity direction across the grill is parallel to the grill surface as
the air speed crosses the grill in the same way as when vehicles are running on the
road.
4.4 Result and Discussion
Figure 4.4 shows experimental results of pressure drops at 5 different locations
on the whole air intake system at different mass flow rates. It is found that the static
pressure drop gradually decreases from the intake grill to the end of the intake duct.
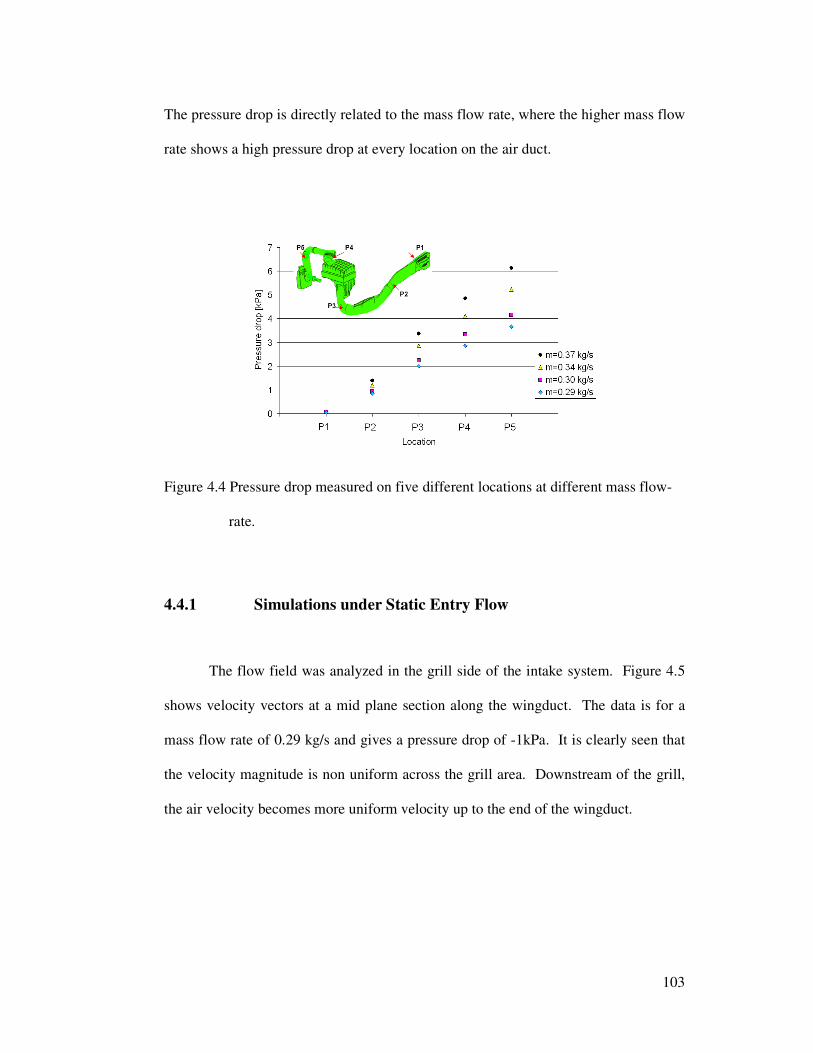
103
The pressure drop is directly related to the mass flow rate, where the higher mass flow
rate shows a high pressure drop at every location on the air duct.
Figure 4.4 Pressure drop measured on five different locations at different mass flow-
rate.
4.4.1 Simulations under Static Entry Flow
The flow field was analyzed in the grill side of the intake system. Figure 4.5
shows velocity vectors at a mid plane section along the wingduct. The data is for a
mass flow rate of 0.29 kg/s and gives a pressure drop of -1kPa. It is clearly seen that
the velocity magnitude is non uniform across the grill area. Downstream of the grill,
the air velocity becomes more uniform velocity up to the end of the wingduct.
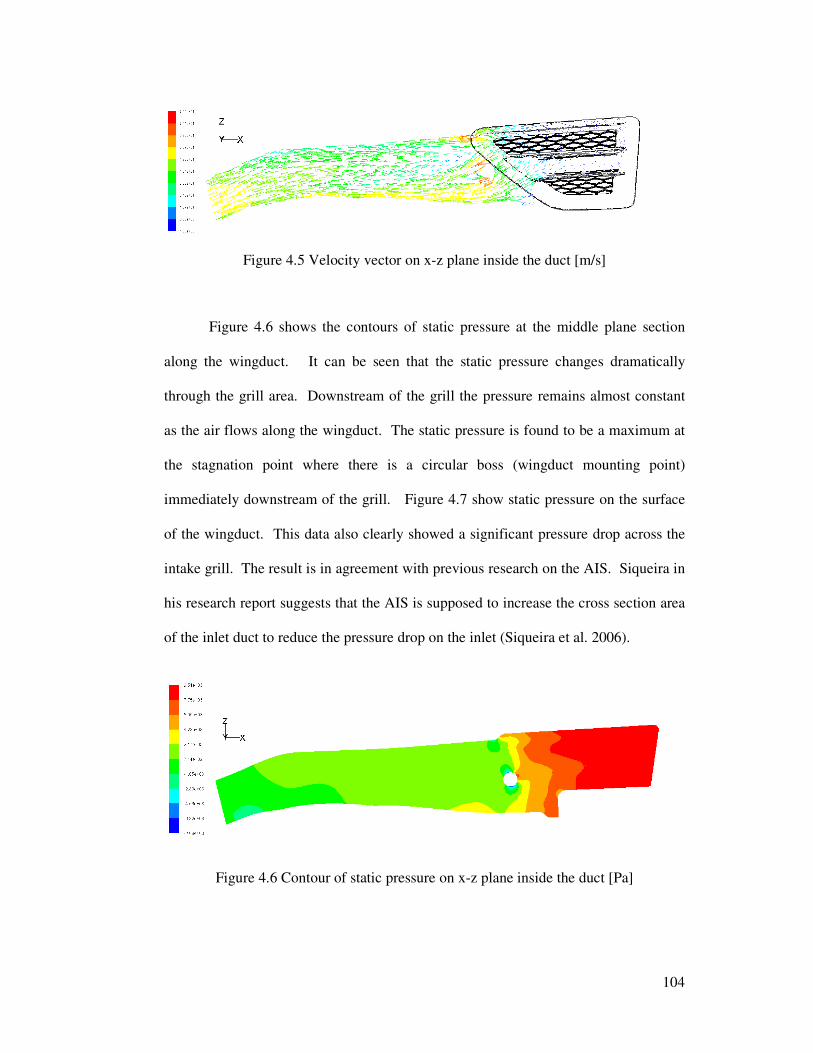
104
Figure 4.5 Velocity vector on x-z plane inside the duct [m/s]
Figure 4.6 shows the contours of static pressure at the middle plane section
along the wingduct. It can be seen that the static pressure changes dramatically
through the grill area. Downstream of the grill the pressure remains almost constant
as the air flows along the wingduct. The static pressure is found to be a maximum at
the stagnation point where there is a circular boss (wingduct mounting point)
immediately downstream of the grill. Figure 4.7 show static pressure on the surface
of the wingduct. This data also clearly showed a significant pressure drop across the
intake grill. The result is in agreement with previous research on the AIS. Siqueira in
his research report suggests that the AIS is supposed to increase the cross section area
of the inlet duct to reduce the pressure drop on the inlet (Siqueira et al. 2006).
Figure 4.6 Contour of static pressure on x-z plane inside the duct [Pa]
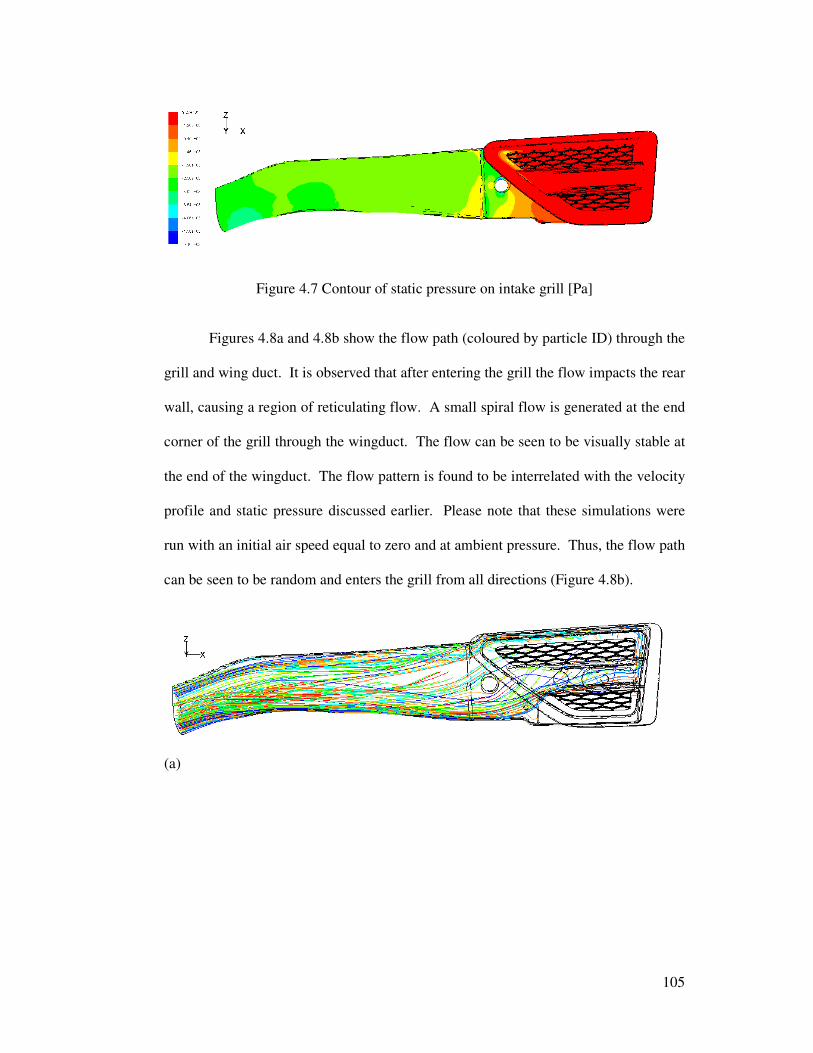
105
Figure 4.7 Contour of static pressure on intake grill [Pa]
Figures 4.8a and 4.8b show the flow path (coloured by particle ID) through the
grill and wing duct. It is observed that after entering the grill the flow impacts the rear
wall, causing a region of reticulating flow. A small spiral flow is generated at the end
corner of the grill through the wingduct. The flow can be seen to be visually stable at
the end of the wingduct. The flow pattern is found to be interrelated with the velocity
profile and static pressure discussed earlier. Please note that these simulations were
run with an initial air speed equal to zero and at ambient pressure. Thus, the flow path
can be seen to be random and enters the grill from all directions (Figure 4.8b).
(a)
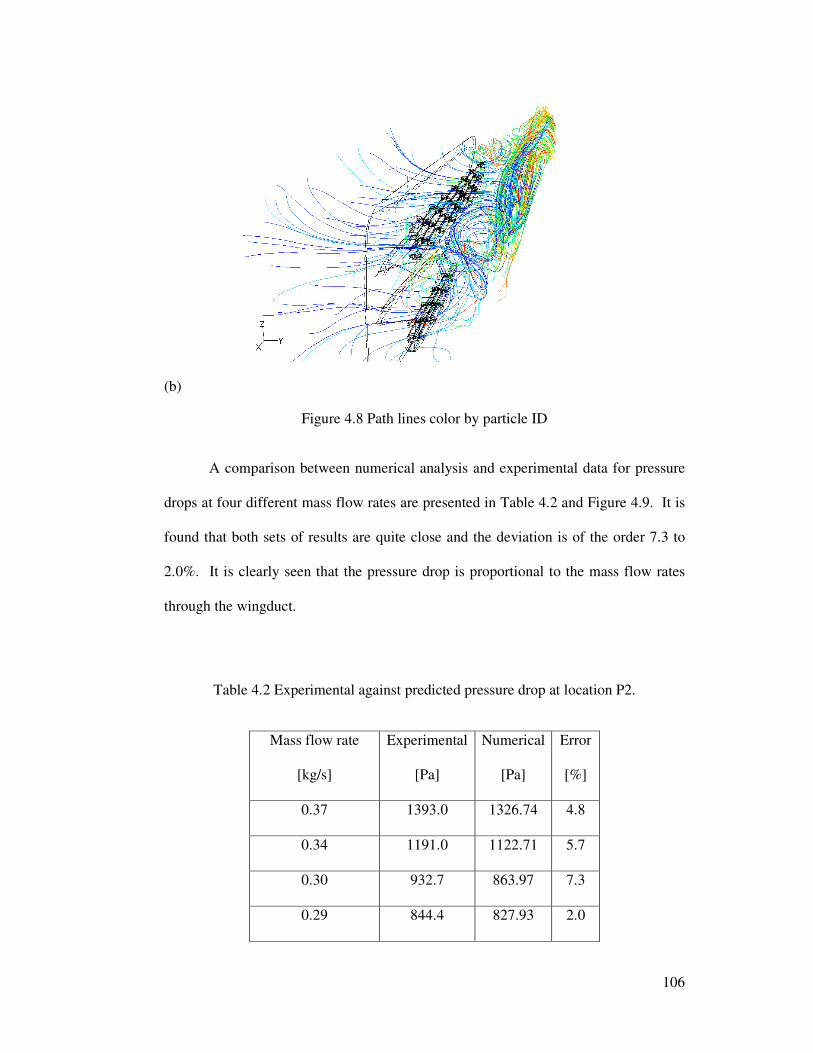
106
(b)
Figure 4.8 Path lines color by particle ID
A comparison between numerical analysis and experimental data for pressure
drops at four different mass flow rates are presented in Table 4.2 and Figure 4.9. It is
found that both sets of results are quite close and the deviation is of the order 7.3 to
2.0%. It is clearly seen that the pressure drop is proportional to the mass flow rates
through the wingduct.
Table 4.2 Experimental against predicted pressure drop at location P2.
Mass flow rate
[kg/s]
Experimental
[Pa]
Numerical
[Pa]
Error
[%]
0.37 1393.0 1326.74 4.8
0.34 1191.0 1122.71 5.7
0.30 932.7 863.97 7.3
0.29 844.4 827.93 2.0
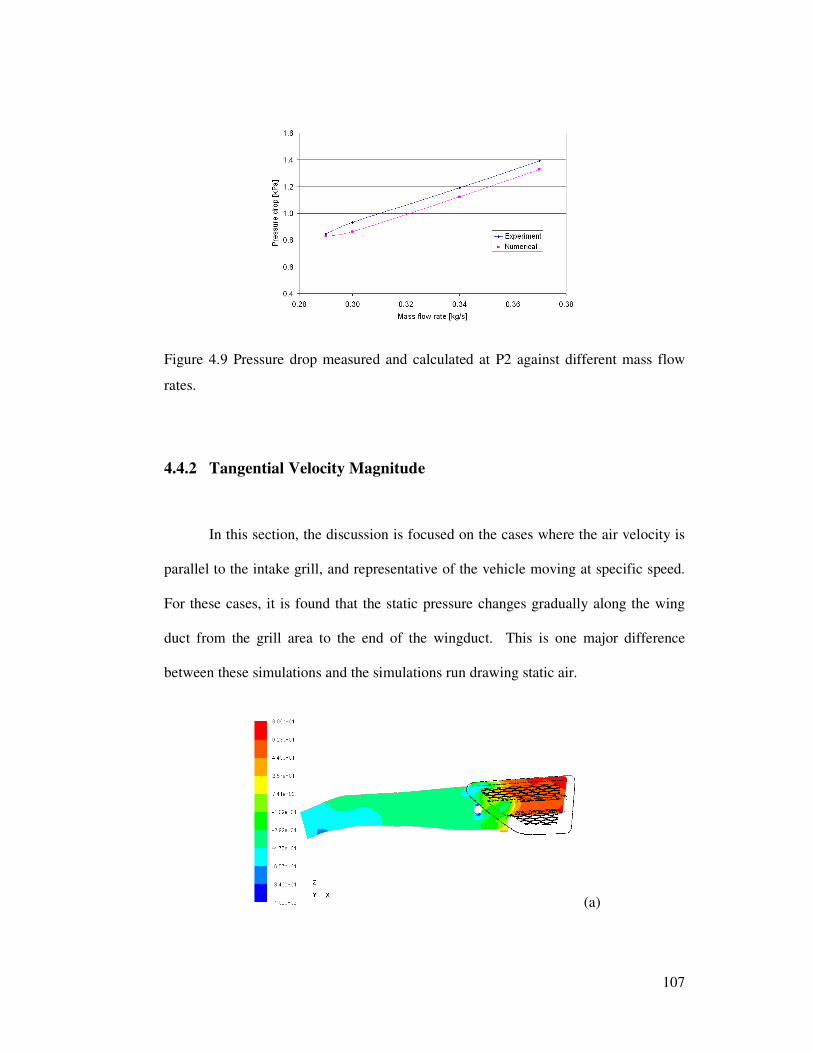
107
Figure 4.9 Pressure drop measured and calculated at P2 against different mass flow
rates.
4.4.2 Tangential Velocity Magnitude
In this section, the discussion is focused on the cases where the air velocity is
parallel to the intake grill, and representative of the vehicle moving at specific speed.
For these cases, it is found that the static pressure changes gradually along the wing
duct from the grill area to the end of the wingduct. This is one major difference
between these simulations and the simulations run drawing static air.
(a)
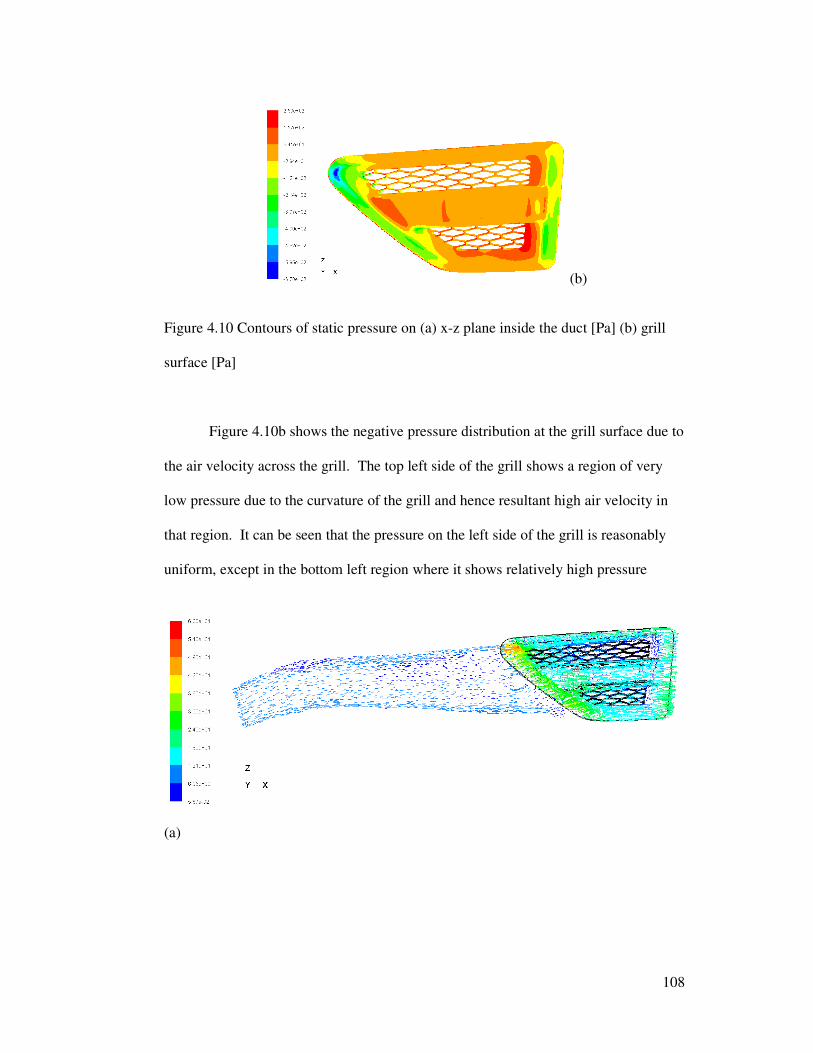
108
(b)
Figure 4.10 Contours of static pressure on (a) x-z plane inside the duct [Pa] (b) grill
surface [Pa]
Figure 4.10b shows the negative pressure distribution at the grill surface due to
the air velocity across the grill. The top left side of the grill shows a region of very
low pressure due to the curvature of the grill and hence resultant high air velocity in
that region. It can be seen that the pressure on the left side of the grill is reasonably
uniform, except in the bottom left region where it shows relatively high pressure
(a)
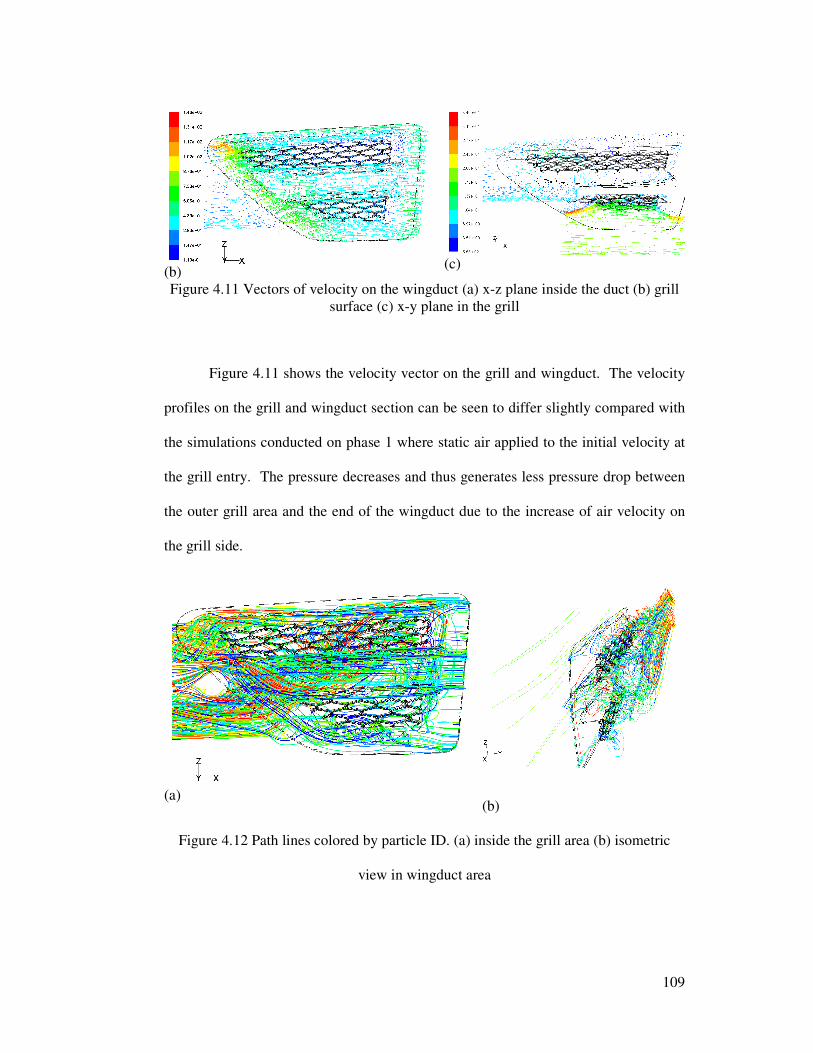
109
(b)
(c)
Figure 4.11 Vectors of velocity on the wingduct (a) x-z plane inside the duct (b) grill surface (c) x-y plane in the grill
Figure 4.11 shows the velocity vector on the grill and wingduct. The velocity
profiles on the grill and wingduct section can be seen to differ slightly compared with
the simulations conducted on phase 1 where static air applied to the initial velocity at
the grill entry. The pressure decreases and thus generates less pressure drop between
the outer grill area and the end of the wingduct due to the increase of air velocity on
the grill side.
(a)
(b)
Figure 4.12 Path lines colored by particle ID. (a) inside the grill area (b) isometric
view in wingduct area
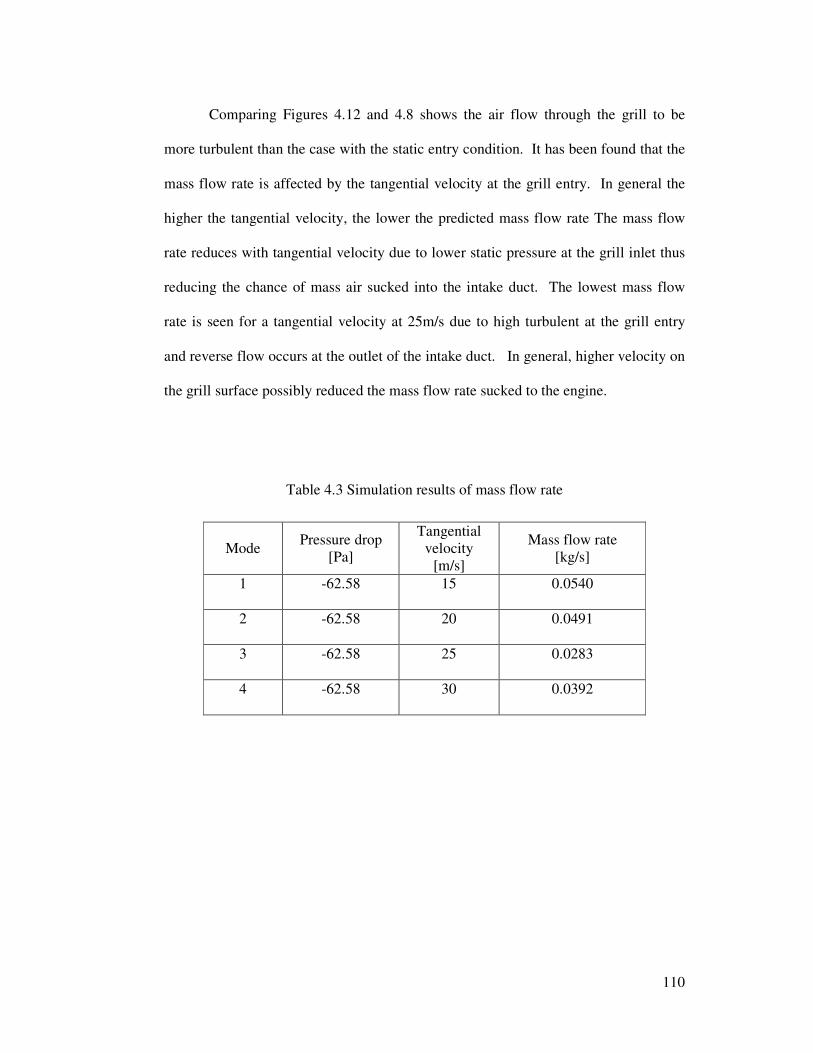
110
Comparing Figures 4.12 and 4.8 shows the air flow through the grill to be
more turbulent than the case with the static entry condition. It has been found that the
mass flow rate is affected by the tangential velocity at the grill entry. In general the
higher the tangential velocity, the lower the predicted mass flow rate The mass flow
rate reduces with tangential velocity due to lower static pressure at the grill inlet thus
reducing the chance of mass air sucked into the intake duct. The lowest mass flow
rate is seen for a tangential velocity at 25m/s due to high turbulent at the grill entry
and reverse flow occurs at the outlet of the intake duct. In general, higher velocity on
the grill surface possibly reduced the mass flow rate sucked to the engine.
Table 4.3 Simulation results of mass flow rate
Mode Pressure drop
[Pa]
Tangential velocity
[m/s]
Mass flow rate [kg/s]
1 -62.58 15 0.0540
2 -62.58 20 0.0491
3 -62.58 25 0.0283
4 -62.58 30 0.0392
111
4.5 Summary
The flow behavior of a vehicle intake system was investigated through
simulation work on an air intake system. The simulation result was validated with
steady flow test. The main conclusions are:
1. The computed pressured drop is in a fair agreement with the experimental results
for the case with static air at the grill entry. Thus, the development of the intake
grill to achieve high volumetric efficiency can be performed using CFD rather
than using trial and error.
2. In the case where the air velocity is tangential to the grill entry, there is a direct
correlation between the magnitude of the tangential velocity and the mass flow
rate sucked into the engine. In general, for a given constant pressure drop, the
higher the tangential speed, the less mass flow into the engine. The lowest mass
flow rate was found at 25m/s of tangential velocity due to high turbulence at the
grill entry.
112
CHAPTER 5
ONE DIMENSIONAL MODELLING OF A V6 DIESEL ENGINE
AND VALIDATION
5.1 Introduction
The Ricardo WAVE v7.2 is used in this research to investigate the effect of
various parameters of the air induction system to the performance of a V6 diesel
engine. The model is created in three distinct steps as recommended from the Ricardo
WAVE manual guide; gathering the data, preparing the data and constructing the
model in WaveBuild (Ricardo 2006). In this model, the engine and all the manifolds
are modelled using one dimensional wave action codes by linking together the
geometrical complex devices such as turbocharger, valves, junction and ducts.
5.2 Engine Model Setup
In general, a one dimensional (1D) simulation of an engine model consists of
intake system, exhaust system, compressor and variable geometry turbocharger
system (VGT), common rail fuel injection systems, exhaust gas recirculation systems,
engine cylinders and valve train. The details of the all engine cylinder, ducts,
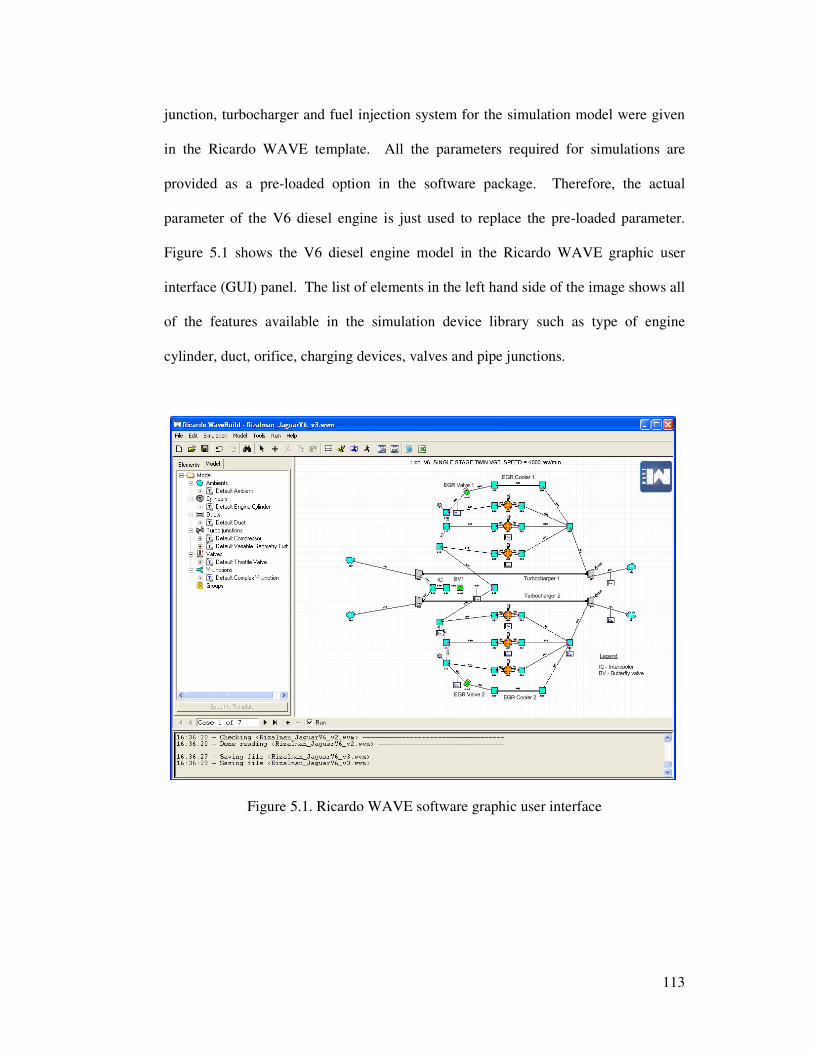
113
junction, turbocharger and fuel injection system for the simulation model were given
in the Ricardo WAVE template. All the parameters required for simulations are
provided as a pre-loaded option in the software package. Therefore, the actual
parameter of the V6 diesel engine is just used to replace the pre-loaded parameter.
Figure 5.1 shows the V6 diesel engine model in the Ricardo WAVE graphic user
interface (GUI) panel. The list of elements in the left hand side of the image shows all
of the features available in the simulation device library such as type of engine
cylinder, duct, orifice, charging devices, valves and pipe junctions.
Figure 5.1. Ricardo WAVE software graphic user interface
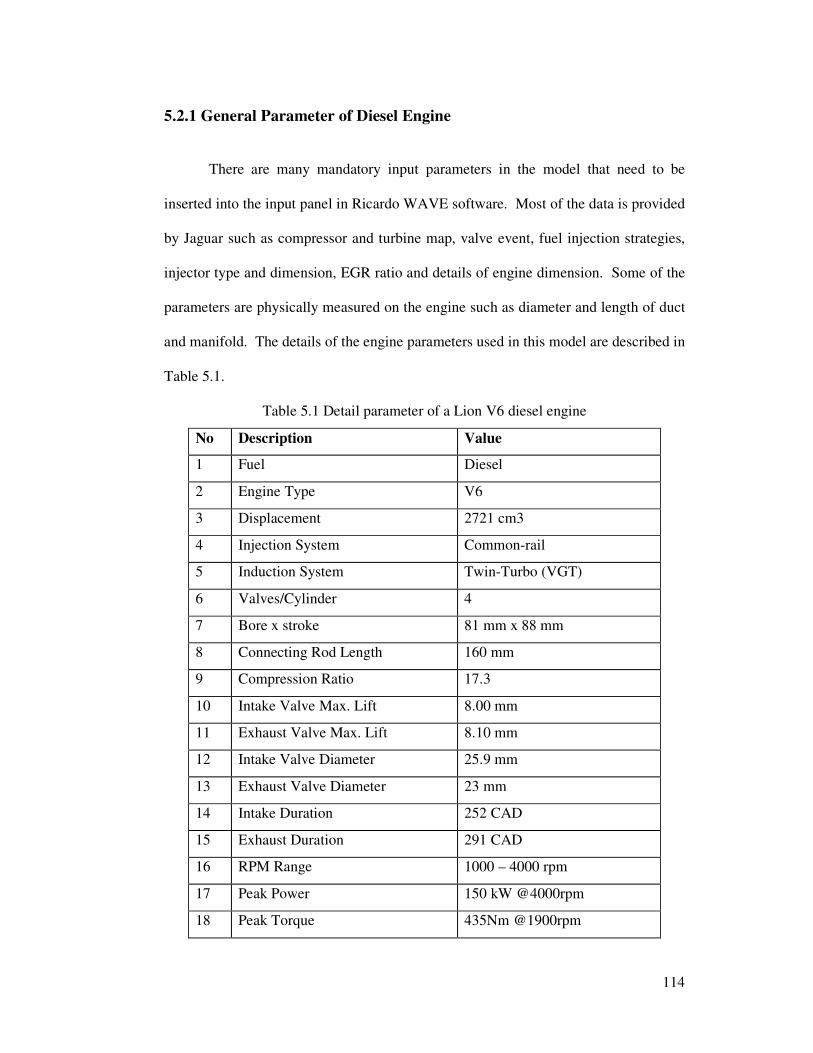
114
5.2.1 General Parameter of Diesel Engine
There are many mandatory input parameters in the model that need to be
inserted into the input panel in Ricardo WAVE software. Most of the data is provided
by Jaguar such as compressor and turbine map, valve event, fuel injection strategies,
injector type and dimension, EGR ratio and details of engine dimension. Some of the
parameters are physically measured on the engine such as diameter and length of duct
and manifold. The details of the engine parameters used in this model are described in
Table 5.1.
Table 5.1 Detail parameter of a Lion V6 diesel engine
No Description Value
1 Fuel Diesel
2 Engine Type V6
3 Displacement 2721 cm3
4 Injection System Common-rail
5 Induction System Twin-Turbo (VGT)
6 Valves/Cylinder 4
7 Bore x stroke 81 mm x 88 mm
8 Connecting Rod Length 160 mm
9 Compression Ratio 17.3
10 Intake Valve Max. Lift 8.00 mm
11 Exhaust Valve Max. Lift 8.10 mm
12 Intake Valve Diameter 25.9 mm
13 Exhaust Valve Diameter 23 mm
14 Intake Duration 252 CAD
15 Exhaust Duration 291 CAD
16 RPM Range 1000 – 4000 rpm
17 Peak Power 150 kW @4000rpm
18 Peak Torque 435Nm @1900rpm
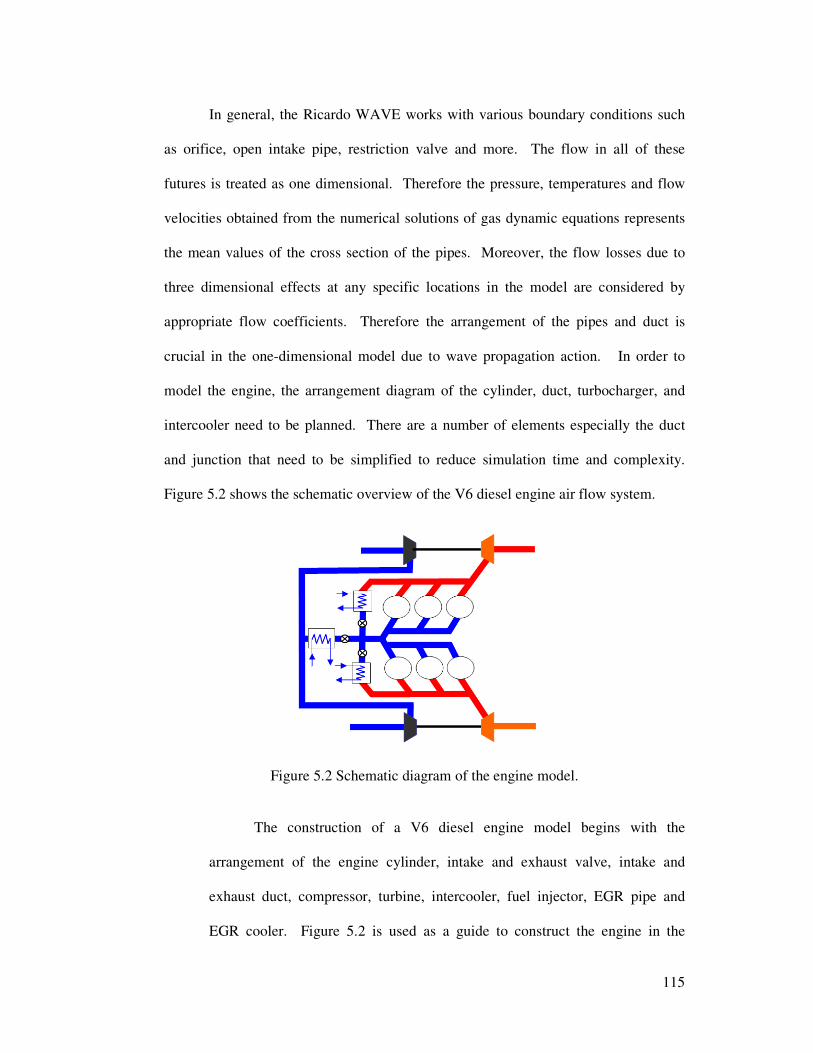
115
In general, the Ricardo WAVE works with various boundary conditions such
as orifice, open intake pipe, restriction valve and more. The flow in all of these
futures is treated as one dimensional. Therefore the pressure, temperatures and flow
velocities obtained from the numerical solutions of gas dynamic equations represents
the mean values of the cross section of the pipes. Moreover, the flow losses due to
three dimensional effects at any specific locations in the model are considered by
appropriate flow coefficients. Therefore the arrangement of the pipes and duct is
crucial in the one-dimensional model due to wave propagation action. In order to
model the engine, the arrangement diagram of the cylinder, duct, turbocharger, and
intercooler need to be planned. There are a number of elements especially the duct
and junction that need to be simplified to reduce simulation time and complexity.
Figure 5.2 shows the schematic overview of the V6 diesel engine air flow system.
Figure 5.2 Schematic diagram of the engine model.
The construction of a V6 diesel engine model begins with the
arrangement of the engine cylinder, intake and exhaust valve, intake and
exhaust duct, compressor, turbine, intercooler, fuel injector, EGR pipe and
EGR cooler. Figure 5.2 is used as a guide to construct the engine in the
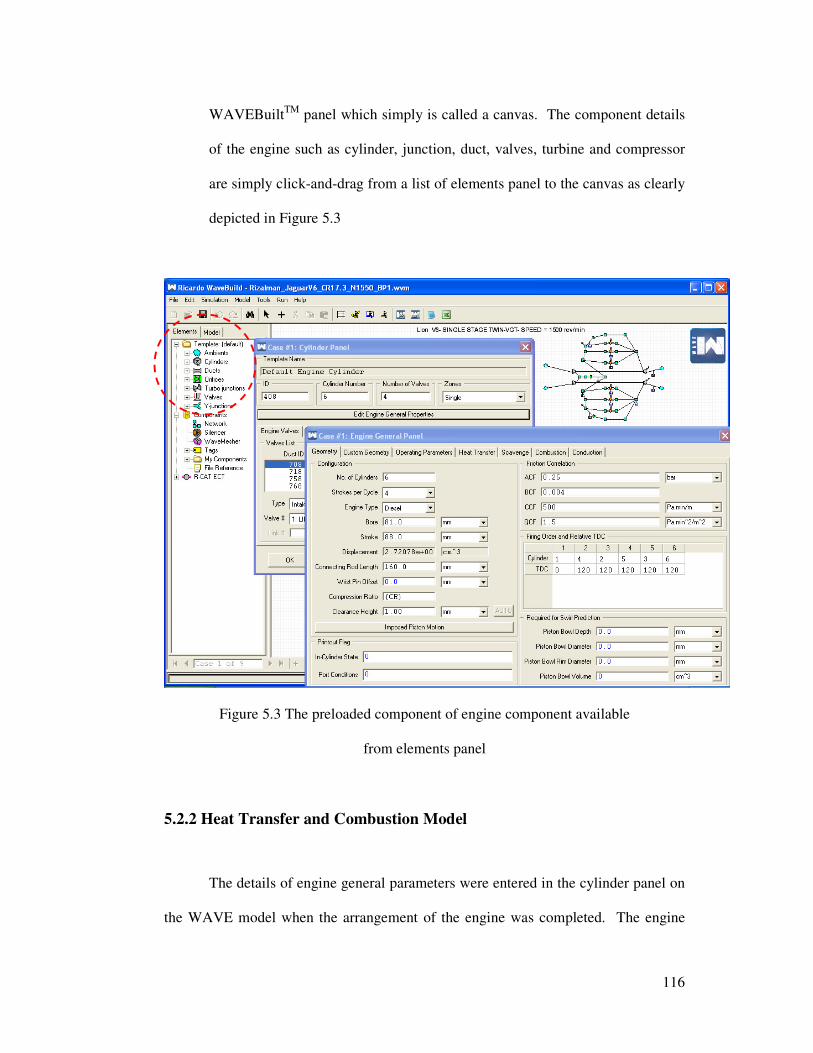
116
WAVEBuiltTM panel which simply is called a canvas. The component details
of the engine such as cylinder, junction, duct, valves, turbine and compressor
are simply click-and-drag from a list of elements panel to the canvas as clearly
depicted in Figure 5.3
Figure 5.3 The preloaded component of engine component available
from elements panel
5.2.2 Heat Transfer and Combustion Model
The details of engine general parameters were entered in the cylinder panel on
the WAVE model when the arrangement of the engine was completed. The engine
117
general properties include engine type, number of engine cylinders, stroke per cycle,
cylinder geometry, compression ratio, clearance height and firing order and relative to
TDC (multiple cylinder). Figure 5.3 clearly shows how the engine parameter was set
into the engine model. The friction correlation number was left as the default number.
The study did not include the swirl analysis on the engine, therefore the details of
swirl parameter on the engine cylinder were set to the default number as zero.
Other parameters such as heat transfer and combustion model also need to be
specified on the engine model. The calculation of heat transfer from the gas to the
cylinder engine was estimated by Woschni equations (Woschni 1967). The model
was successfully used by many researchers to model heat transfer in SI engines
(Quintero et al. 2007; Lejsek et al. 2009) and CI engines (Jajoo et al. 2005; Kubicki et
al. 2007). However, the original Woschni model need to be modified for the HCCI
engines to access higher accuracy as can be found detail in the literature (Jia et al.
2008; Manente et al. 2008). The Woschni correlation which expresses the convective
heat transfer coefficient (hg) is given as (Ricardo 2009)
0.2 0.8 0.53 0.80.0128g c enhth D P T v C− −= (5.1)
where D is the engine cylinder bore; P is the cylinder pressure and T is the cylinder
wall temperature. The calculations of the heat transfer in Woschni model include an
additional scaling multiplier Cenht for many applications in the diesel engine model.
The velocity terms, vc in equation 5.1 is denoted as a characteristic velocity, which is
the sum of the mean piston speed and an additional combustion-related velocity that
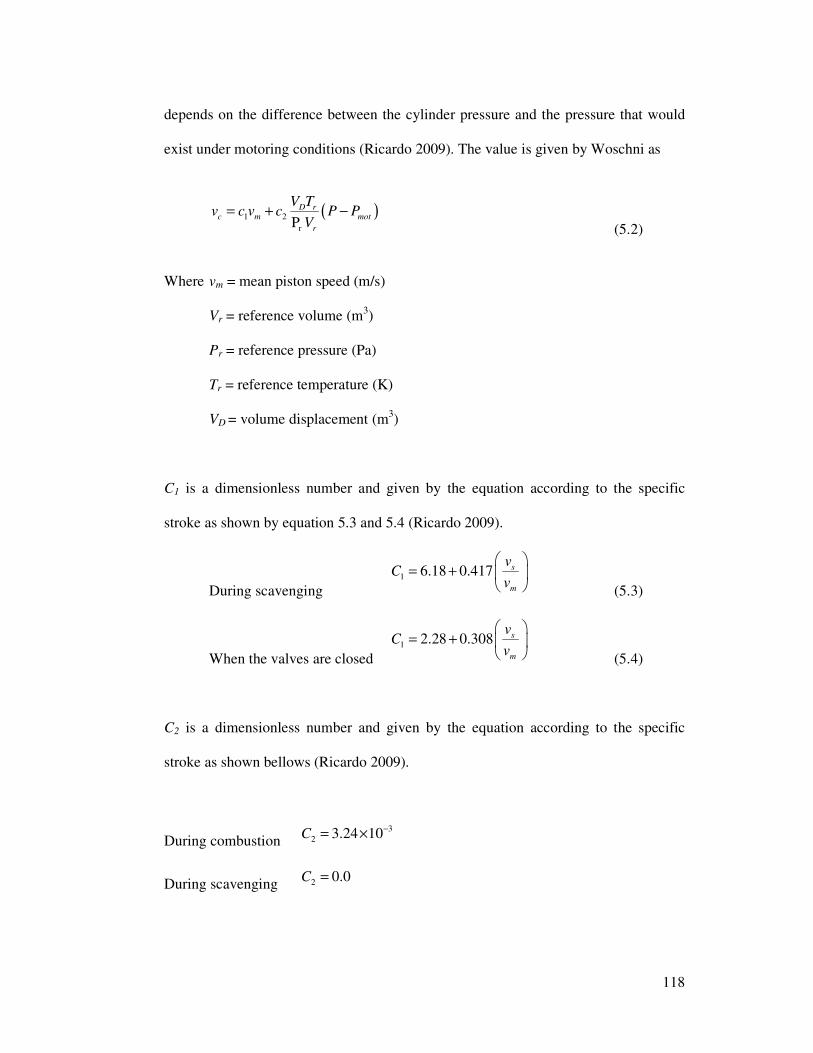
118
depends on the difference between the cylinder pressure and the pressure that would
exist under motoring conditions (Ricardo 2009). The value is given by Woschni as
( )1 2
rPD r
c m mot
r
V Tv c v c P P
V= + −
(5.2)
Where vm = mean piston speed (m/s)
Vr = reference volume (m3)
Pr = reference pressure (Pa)
Tr = reference temperature (K)
VD = volume displacement (m3)
C1 is a dimensionless number and given by the equation according to the specific
stroke as shown by equation 5.3 and 5.4 (Ricardo 2009).
During scavenging 1 6.18 0.417 s
m
vC
v
= +
(5.3)
When the valves are closed 1 2.28 0.308 s
m
vC
v
= +
(5.4)
C2 is a dimensionless number and given by the equation according to the specific
stroke as shown bellows (Ricardo 2009).
During combustion 3
2 3.24 10C−= ×
During scavenging 2 0.0C =
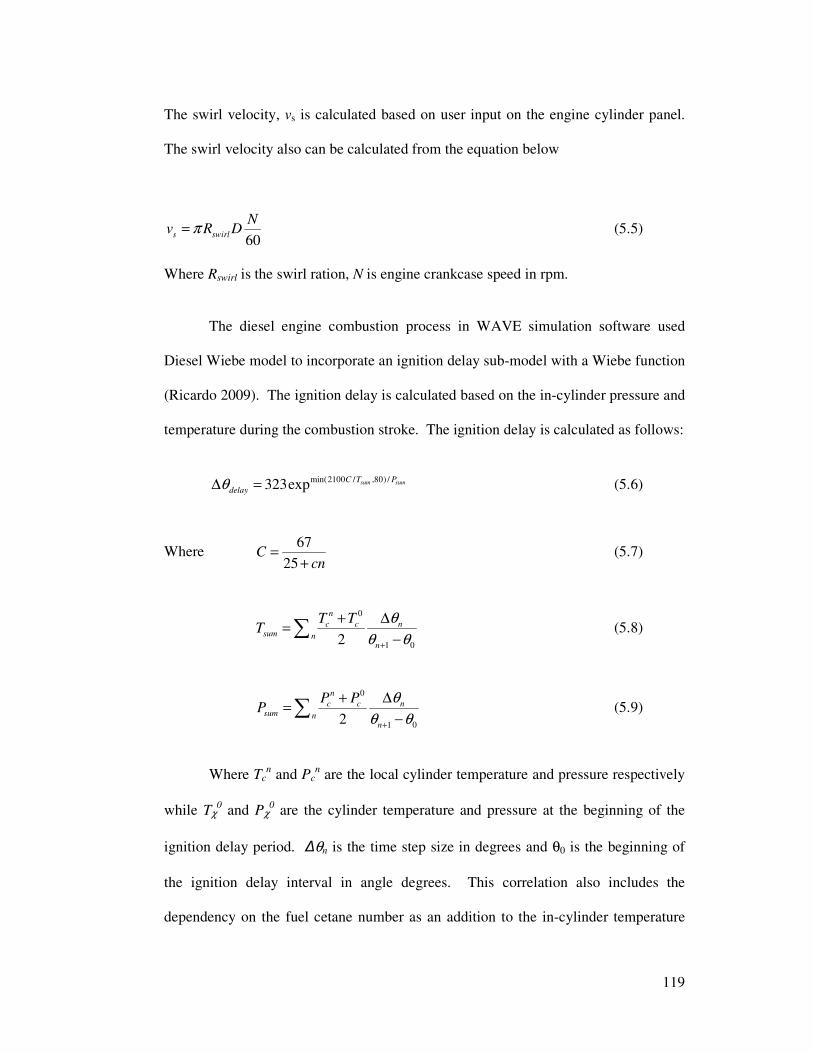
119
The swirl velocity, vs is calculated based on user input on the engine cylinder panel.
The swirl velocity also can be calculated from the equation below
60s swirl
Nv R Dπ= (5.5)
Where Rswirl is the swirl ration, N is engine crankcase speed in rpm.
The diesel engine combustion process in WAVE simulation software used
Diesel Wiebe model to incorporate an ignition delay sub-model with a Wiebe function
(Ricardo 2009). The ignition delay is calculated based on the in-cylinder pressure and
temperature during the combustion stroke. The ignition delay is calculated as follows:
min(2100 / ,80) /323exp sum sumC T P
delayθ∆ = (5.6)
Where 67
25C
cn=
+ (5.7)
0
1 02
n
c c nsum n
n
T TT
θ
θ θ+
+ ∆=
−∑ (5.8)
0
1 02
n
c c nsum n
n
P PP
θ
θ θ+
+ ∆=
−∑ (5.9)
Where Tcn and Pc
n are the local cylinder temperature and pressure respectively
while Tχ0 and Pχ
0 are the cylinder temperature and pressure at the beginning of the
ignition delay period. ∆θn is the time step size in degrees and θ0 is the beginning of
the ignition delay interval in angle degrees. This correlation also includes the
dependency on the fuel cetane number as an addition to the in-cylinder temperature
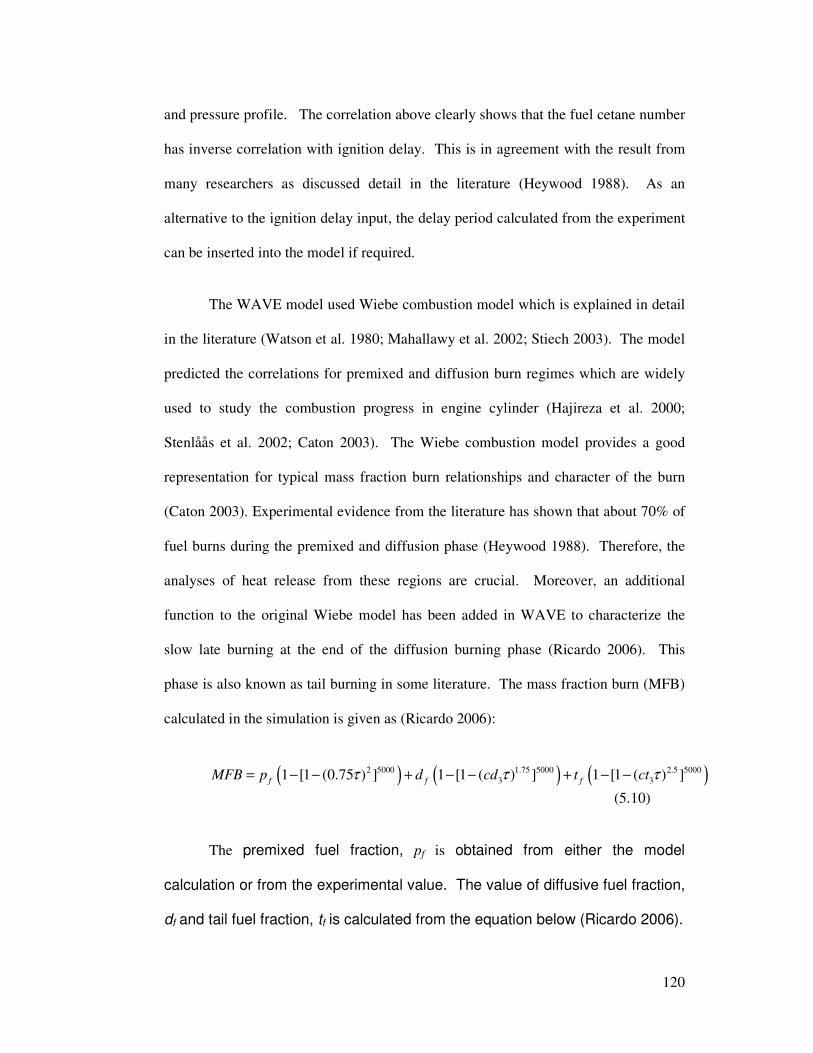
120
and pressure profile. The correlation above clearly shows that the fuel cetane number
has inverse correlation with ignition delay. This is in agreement with the result from
many researchers as discussed detail in the literature (Heywood 1988). As an
alternative to the ignition delay input, the delay period calculated from the experiment
can be inserted into the model if required.
The WAVE model used Wiebe combustion model which is explained in detail
in the literature (Watson et al. 1980; Mahallawy et al. 2002; Stiech 2003). The model
predicted the correlations for premixed and diffusion burn regimes which are widely
used to study the combustion progress in engine cylinder (Hajireza et al. 2000;
Stenlåås et al. 2002; Caton 2003). The Wiebe combustion model provides a good
representation for typical mass fraction burn relationships and character of the burn
(Caton 2003). Experimental evidence from the literature has shown that about 70% of
fuel burns during the premixed and diffusion phase (Heywood 1988). Therefore, the
analyses of heat release from these regions are crucial. Moreover, an additional
function to the original Wiebe model has been added in WAVE to characterize the
slow late burning at the end of the diffusion burning phase (Ricardo 2006). This
phase is also known as tail burning in some literature. The mass fraction burn (MFB)
calculated in the simulation is given as (Ricardo 2006):
( ) ( ) ( )2 5000 1.75 5000 2.5 50003 31 [1 (0.75 ) ] 1 [1 ( ) ] 1 [1 ( ) ]
f f fMFB p d cd t ctτ τ τ= − − + − − + − −
(5.10)
The premixed fuel fraction, pf is obtained from either the model
calculation or from the experimental value. The value of diffusive fuel fraction,
df and tail fuel fraction, tf is calculated from the equation below (Ricardo 2006).
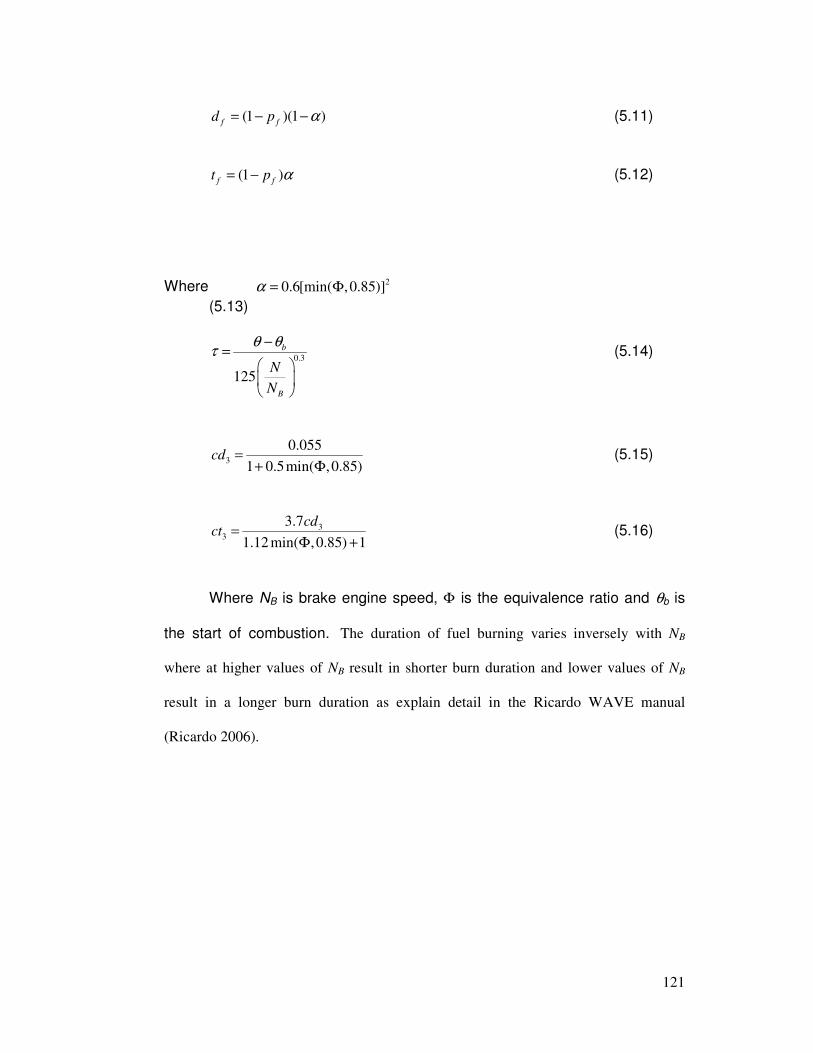
121
(1 )(1 )f fd p α= − − (5.11)
(1 )f ft p α= − (5.12)
Where 20.6[min( ,0.85)]α = Φ
(5.13)
0.3
125
b
B
N
N
θ θτ
−=
(5.14)
3
0.055
1 0.5min( ,0.85)cd =
+ Φ (5.15)
33
3.7
1.12 min( ,0.85) 1
cdct =
Φ + (5.16)
Where NB is brake engine speed, Φ is the equivalence ratio and θb is
the start of combustion. The duration of fuel burning varies inversely with NB
where at higher values of NB result in shorter burn duration and lower values of NB
result in a longer burn duration as explain detail in the Ricardo WAVE manual
(Ricardo 2006).
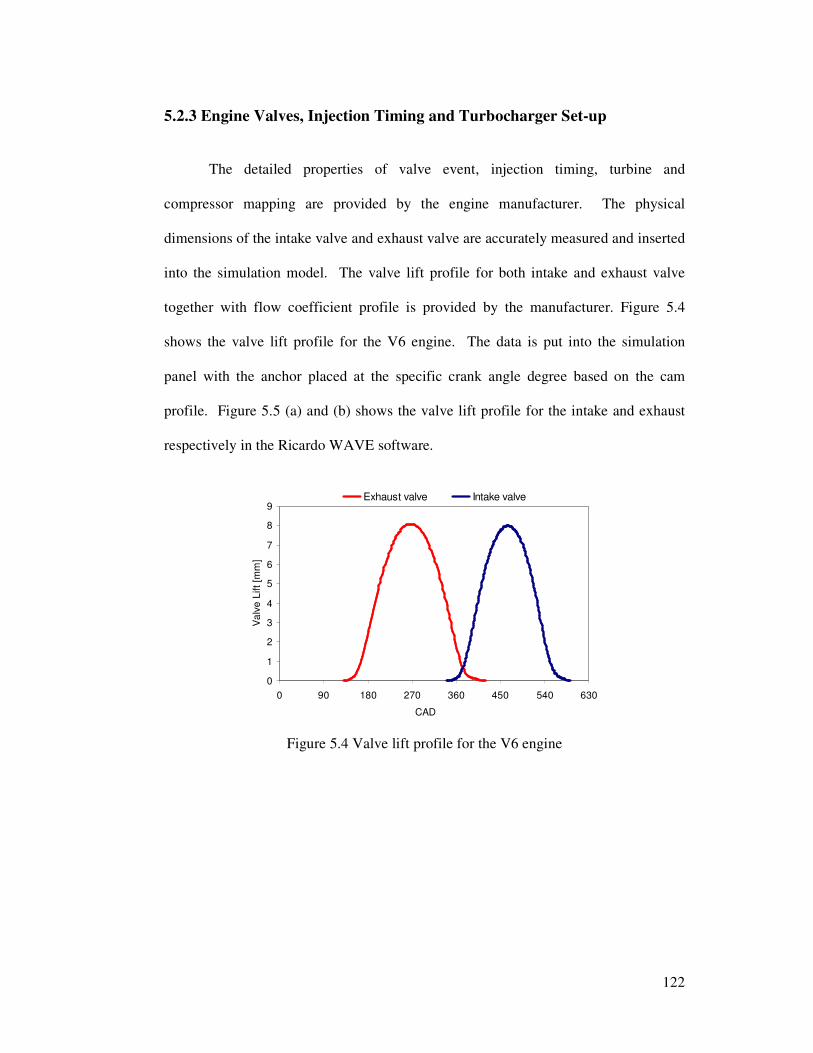
122
5.2.3 Engine Valves, Injection Timing and Turbocharger Set-up
The detailed properties of valve event, injection timing, turbine and
compressor mapping are provided by the engine manufacturer. The physical
dimensions of the intake valve and exhaust valve are accurately measured and inserted
into the simulation model. The valve lift profile for both intake and exhaust valve
together with flow coefficient profile is provided by the manufacturer. Figure 5.4
shows the valve lift profile for the V6 engine. The data is put into the simulation
panel with the anchor placed at the specific crank angle degree based on the cam
profile. Figure 5.5 (a) and (b) shows the valve lift profile for the intake and exhaust
respectively in the Ricardo WAVE software.
0
1
2
3
4
5
6
7
8
9
0 90 180 270 360 450 540 630
CAD
Va
lve
Lift
[mm
]
Exhaust valve Intake valve
Figure 5.4 Valve lift profile for the V6 engine
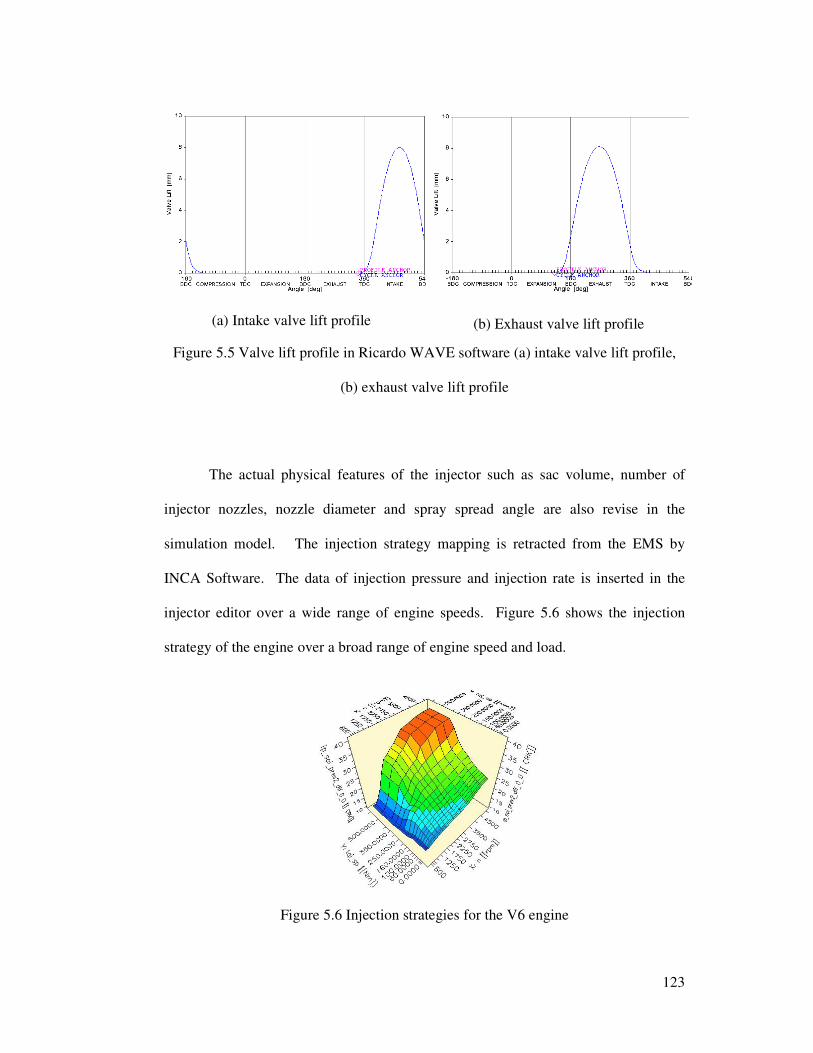
123
(a) Intake valve lift profile (b) Exhaust valve lift profile
Figure 5.5 Valve lift profile in Ricardo WAVE software (a) intake valve lift profile,
(b) exhaust valve lift profile
The actual physical features of the injector such as sac volume, number of
injector nozzles, nozzle diameter and spray spread angle are also revise in the
simulation model. The injection strategy mapping is retracted from the EMS by
INCA Software. The data of injection pressure and injection rate is inserted in the
injector editor over a wide range of engine speeds. Figure 5.6 shows the injection
strategy of the engine over a broad range of engine speed and load.
Figure 5.6 Injection strategies for the V6 engine
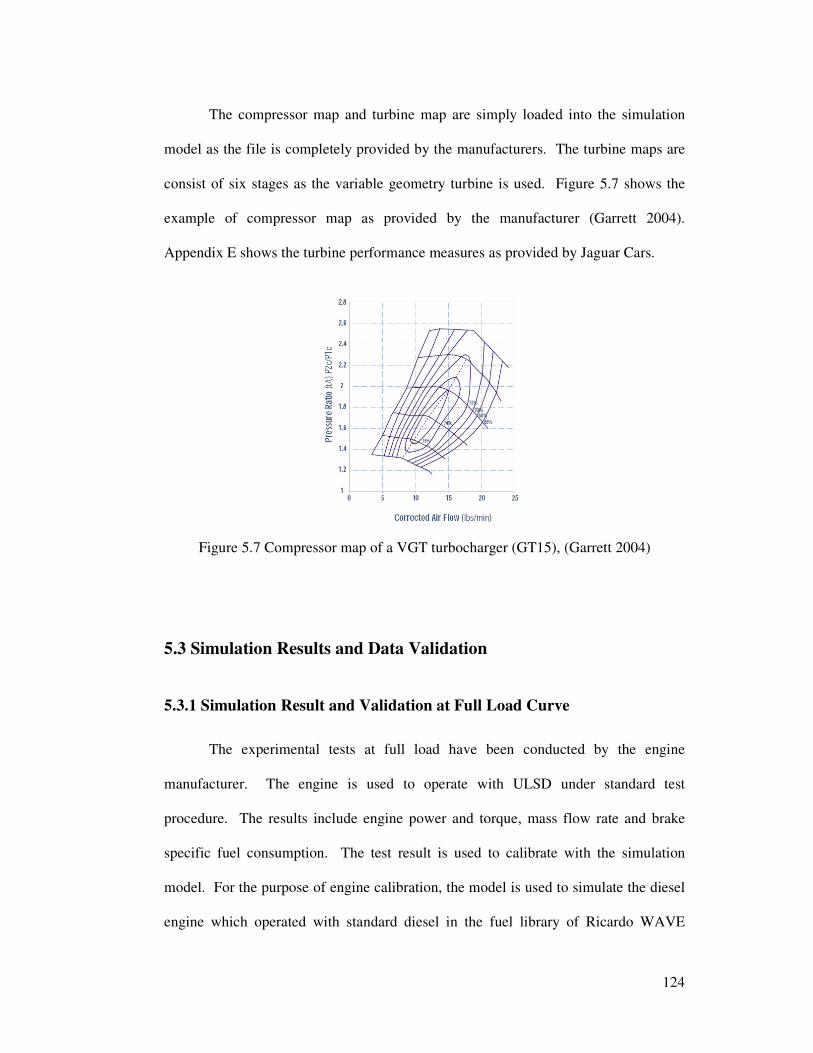
124
The compressor map and turbine map are simply loaded into the simulation
model as the file is completely provided by the manufacturers. The turbine maps are
consist of six stages as the variable geometry turbine is used. Figure 5.7 shows the
example of compressor map as provided by the manufacturer (Garrett 2004).
Appendix E shows the turbine performance measures as provided by Jaguar Cars.
Figure 5.7 Compressor map of a VGT turbocharger (GT15), (Garrett 2004)
5.3 Simulation Results and Data Validation
5.3.1 Simulation Result and Validation at Full Load Curve
The experimental tests at full load have been conducted by the engine
manufacturer. The engine is used to operate with ULSD under standard test
procedure. The results include engine power and torque, mass flow rate and brake
specific fuel consumption. The test result is used to calibrate with the simulation
model. For the purpose of engine calibration, the model is used to simulate the diesel
engine which operated with standard diesel in the fuel library of Ricardo WAVE
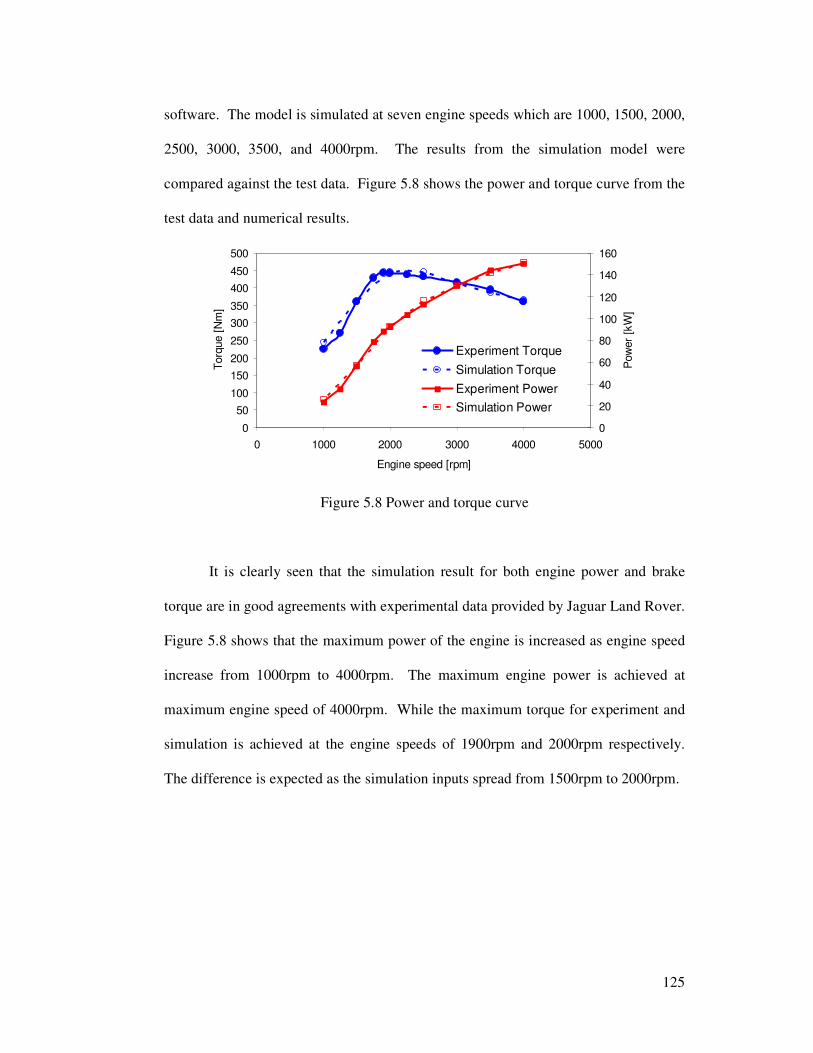
125
software. The model is simulated at seven engine speeds which are 1000, 1500, 2000,
2500, 3000, 3500, and 4000rpm. The results from the simulation model were
compared against the test data. Figure 5.8 shows the power and torque curve from the
test data and numerical results.
0
50
100
150
200
250
300
350
400
450
500
0 1000 2000 3000 4000 5000
Engine speed [rpm]
Torq
ue [
Nm
]
0
20
40
60
80
100
120
140
160
Pow
er
[kW
]
Experiment Torque
Simulation Torque
Experiment Power
Simulation Power
Figure 5.8 Power and torque curve
It is clearly seen that the simulation result for both engine power and brake
torque are in good agreements with experimental data provided by Jaguar Land Rover.
Figure 5.8 shows that the maximum power of the engine is increased as engine speed
increase from 1000rpm to 4000rpm. The maximum engine power is achieved at
maximum engine speed of 4000rpm. While the maximum torque for experiment and
simulation is achieved at the engine speeds of 1900rpm and 2000rpm respectively.
The difference is expected as the simulation inputs spread from 1500rpm to 2000rpm.
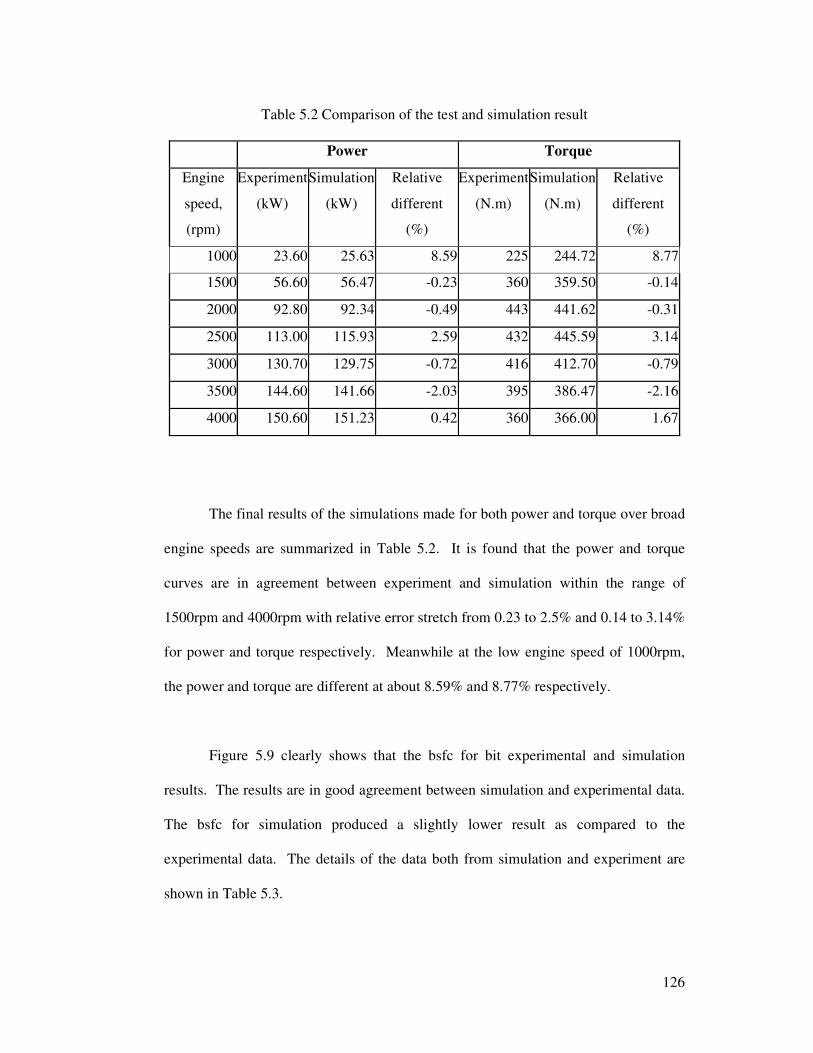
126
Table 5.2 Comparison of the test and simulation result
Power Torque
Engine
speed,
(rpm)
Experiment
(kW)
Simulation
(kW)
Relative
different
(%)
Experiment
(N.m)
Simulation
(N.m)
Relative
different
(%)
1000 23.60 25.63 8.59 225 244.72 8.77
1500 56.60 56.47 -0.23 360 359.50 -0.14
2000 92.80 92.34 -0.49 443 441.62 -0.31
2500 113.00 115.93 2.59 432 445.59 3.14
3000 130.70 129.75 -0.72 416 412.70 -0.79
3500 144.60 141.66 -2.03 395 386.47 -2.16
4000 150.60 151.23 0.42 360 366.00 1.67
The final results of the simulations made for both power and torque over broad
engine speeds are summarized in Table 5.2. It is found that the power and torque
curves are in agreement between experiment and simulation within the range of
1500rpm and 4000rpm with relative error stretch from 0.23 to 2.5% and 0.14 to 3.14%
for power and torque respectively. Meanwhile at the low engine speed of 1000rpm,
the power and torque are different at about 8.59% and 8.77% respectively.
Figure 5.9 clearly shows that the bsfc for bit experimental and simulation
results. The results are in good agreement between simulation and experimental data.
The bsfc for simulation produced a slightly lower result as compared to the
experimental data. The details of the data both from simulation and experiment are
shown in Table 5.3.
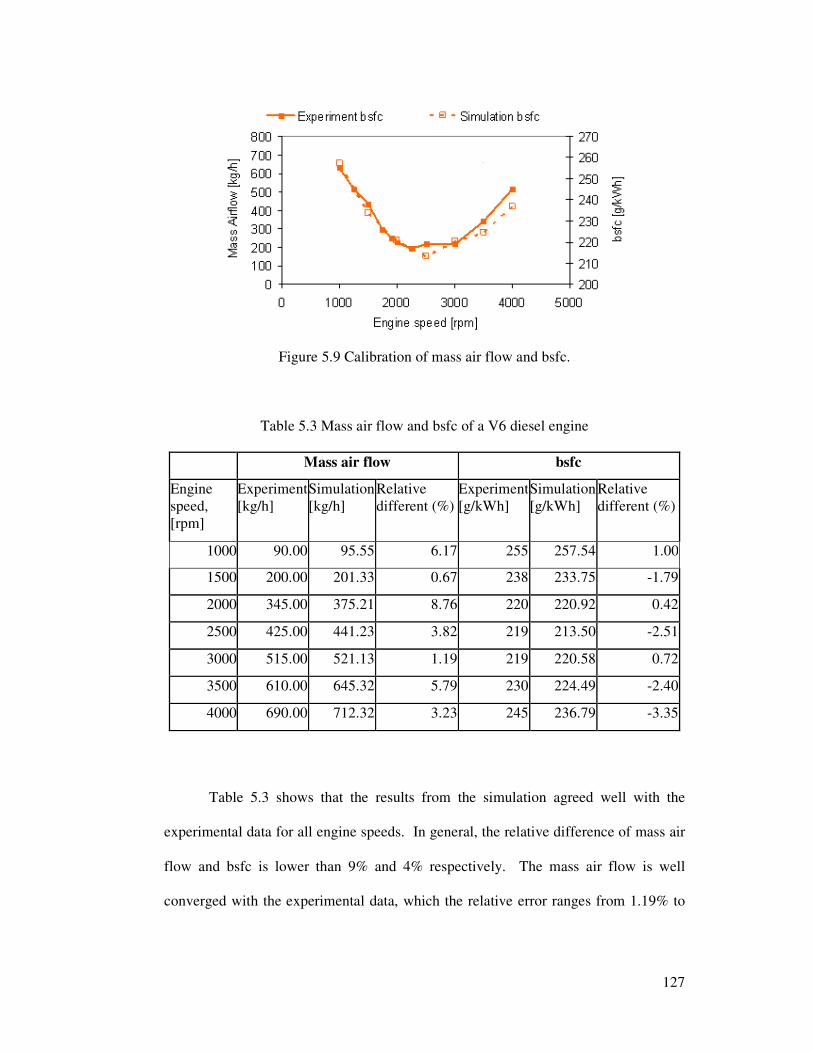
127
Figure 5.9 Calibration of mass air flow and bsfc.
Table 5.3 Mass air flow and bsfc of a V6 diesel engine
Mass air flow bsfc
Engine speed, [rpm]
Experiment[kg/h]
Simulation[kg/h]
Relative different (%)
Experiment[g/kWh]
Simulation[g/kWh]
Relative different (%)
1000 90.00 95.55 6.17 255 257.54 1.00
1500 200.00 201.33 0.67 238 233.75 -1.79
2000 345.00 375.21 8.76 220 220.92 0.42
2500 425.00 441.23 3.82 219 213.50 -2.51
3000 515.00 521.13 1.19 219 220.58 0.72
3500 610.00 645.32 5.79 230 224.49 -2.40
4000 690.00 712.32 3.23 245 236.79 -3.35
Table 5.3 shows that the results from the simulation agreed well with the
experimental data for all engine speeds. In general, the relative difference of mass air
flow and bsfc is lower than 9% and 4% respectively. The mass air flow is well
converged with the experimental data, which the relative error ranges from 1.19% to
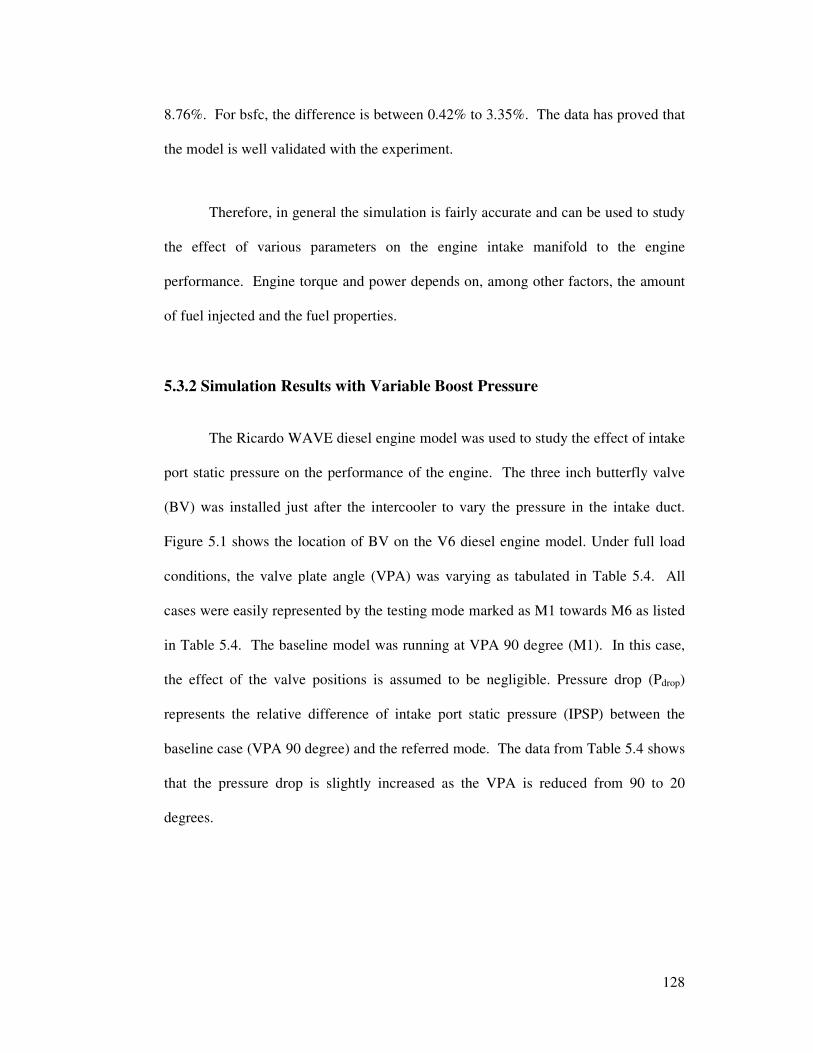
128
8.76%. For bsfc, the difference is between 0.42% to 3.35%. The data has proved that
the model is well validated with the experiment.
Therefore, in general the simulation is fairly accurate and can be used to study
the effect of various parameters on the engine intake manifold to the engine
performance. Engine torque and power depends on, among other factors, the amount
of fuel injected and the fuel properties.
5.3.2 Simulation Results with Variable Boost Pressure
The Ricardo WAVE diesel engine model was used to study the effect of intake
port static pressure on the performance of the engine. The three inch butterfly valve
(BV) was installed just after the intercooler to vary the pressure in the intake duct.
Figure 5.1 shows the location of BV on the V6 diesel engine model. Under full load
conditions, the valve plate angle (VPA) was varying as tabulated in Table 5.4. All
cases were easily represented by the testing mode marked as M1 towards M6 as listed
in Table 5.4. The baseline model was running at VPA 90 degree (M1). In this case,
the effect of the valve positions is assumed to be negligible. Pressure drop (Pdrop)
represents the relative difference of intake port static pressure (IPSP) between the
baseline case (VPA 90 degree) and the referred mode. The data from Table 5.4 shows
that the pressure drop is slightly increased as the VPA is reduced from 90 to 20
degrees.
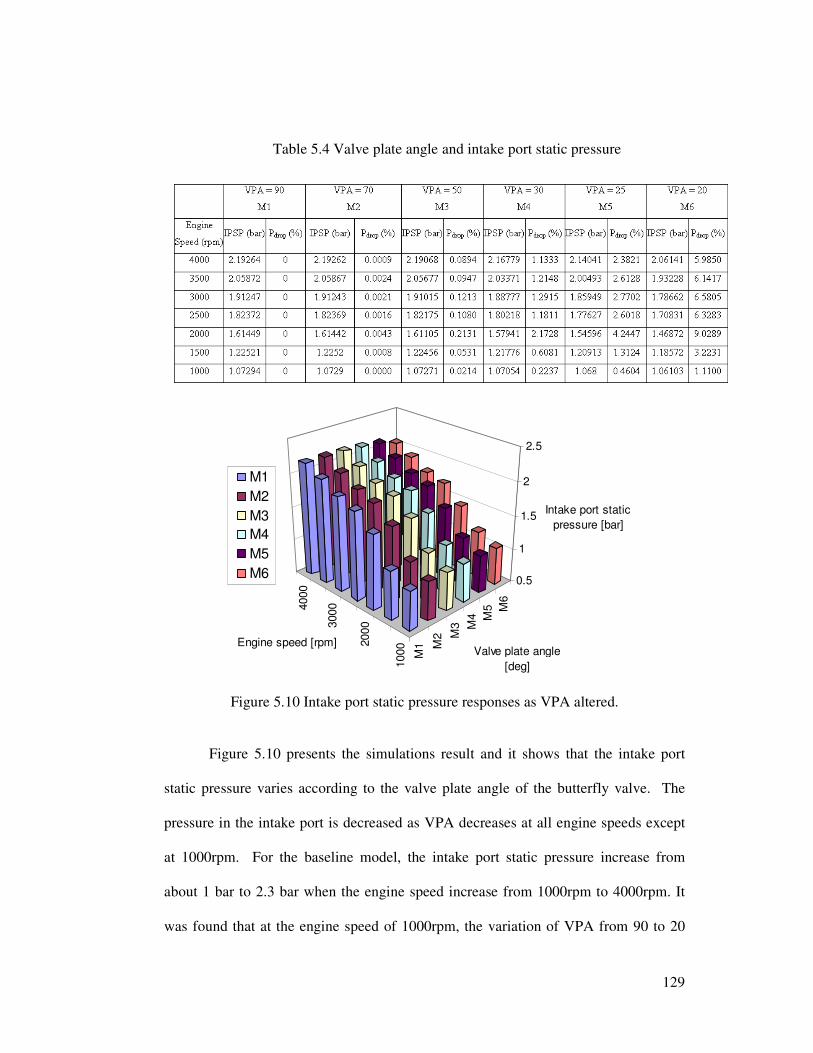
129
Table 5.4 Valve plate angle and intake port static pressure
4000
3000
2000
1000
M1 M
2 M3 M
4 M5 M
6
0.5
1
1.5
2
2.5
Intake port static
pressure [bar]
Engine speed [rpm]Valve plate angle
[deg]
M1
M2
M3
M4
M5
M6
Figure 5.10 Intake port static pressure responses as VPA altered.
Figure 5.10 presents the simulations result and it shows that the intake port
static pressure varies according to the valve plate angle of the butterfly valve. The
pressure in the intake port is decreased as VPA decreases at all engine speeds except
at 1000rpm. For the baseline model, the intake port static pressure increase from
about 1 bar to 2.3 bar when the engine speed increase from 1000rpm to 4000rpm. It
was found that at the engine speed of 1000rpm, the variation of VPA from 90 to 20
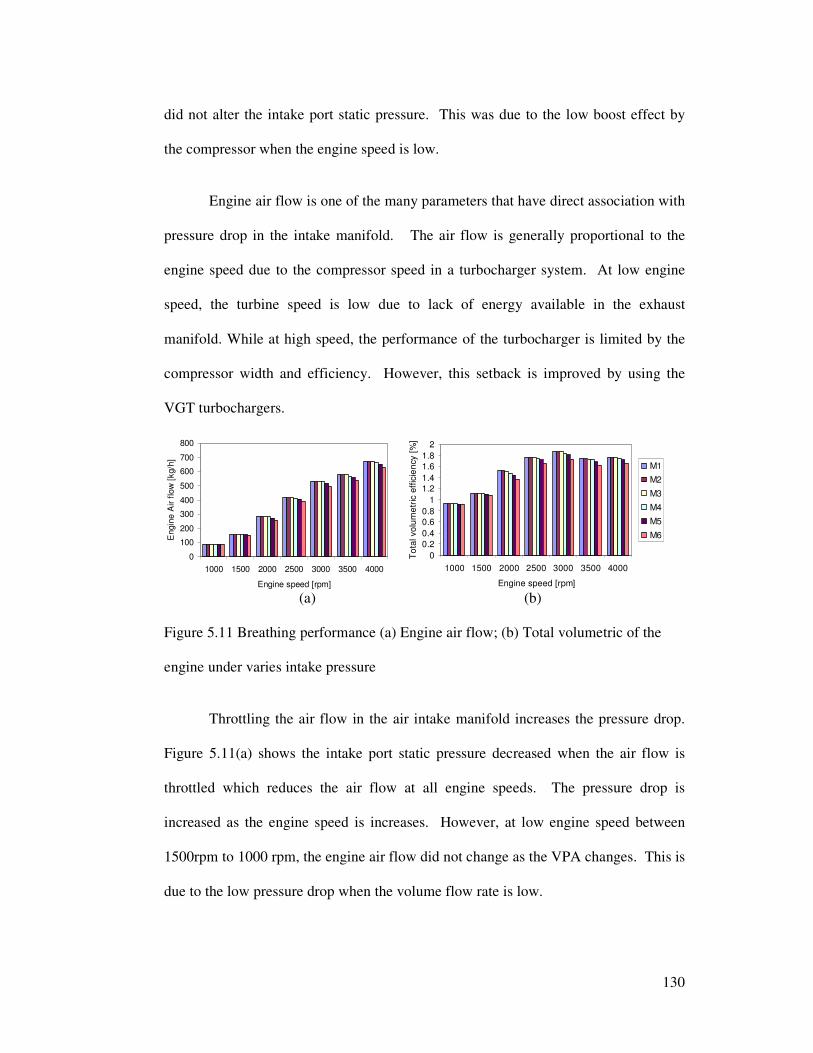
130
did not alter the intake port static pressure. This was due to the low boost effect by
the compressor when the engine speed is low.
Engine air flow is one of the many parameters that have direct association with
pressure drop in the intake manifold. The air flow is generally proportional to the
engine speed due to the compressor speed in a turbocharger system. At low engine
speed, the turbine speed is low due to lack of energy available in the exhaust
manifold. While at high speed, the performance of the turbocharger is limited by the
compressor width and efficiency. However, this setback is improved by using the
VGT turbochargers.
0
100
200
300
400
500
600
700
800
1000 1500 2000 2500 3000 3500 4000
Engine speed [rpm]
Engin
e A
ir f
low
[kg/h
]
0
0.2
0.4
0.6
0.8
1
1.2
1.4
1.6
1.8
2
1000 1500 2000 2500 3000 3500 4000
Engine speed [rpm]
To
tal vo
lum
etr
ic e
ffic
ien
cy [
%]
M1
M2
M3
M4
M5
M6
(a) (b)
Figure 5.11 Breathing performance (a) Engine air flow; (b) Total volumetric of the
engine under varies intake pressure
Throttling the air flow in the air intake manifold increases the pressure drop.
Figure 5.11(a) shows the intake port static pressure decreased when the air flow is
throttled which reduces the air flow at all engine speeds. The pressure drop is
increased as the engine speed is increases. However, at low engine speed between
1500rpm to 1000 rpm, the engine air flow did not change as the VPA changes. This is
due to the low pressure drop when the volume flow rate is low.
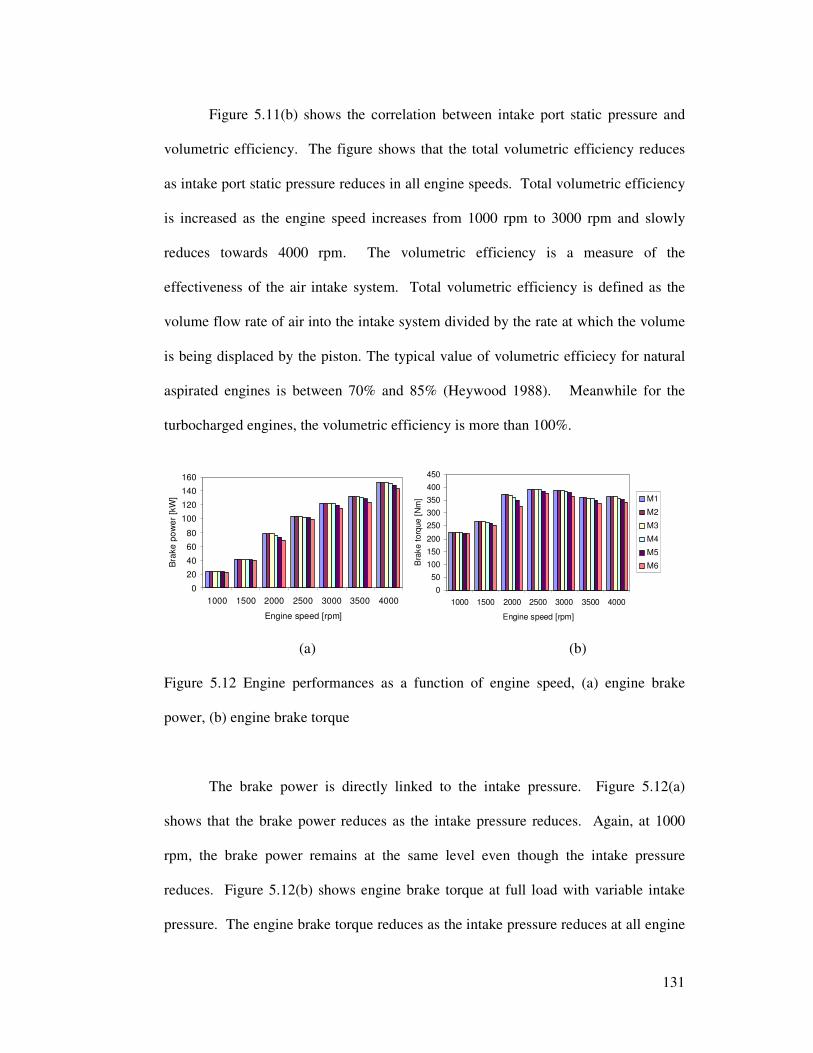
131
Figure 5.11(b) shows the correlation between intake port static pressure and
volumetric efficiency. The figure shows that the total volumetric efficiency reduces
as intake port static pressure reduces in all engine speeds. Total volumetric efficiency
is increased as the engine speed increases from 1000 rpm to 3000 rpm and slowly
reduces towards 4000 rpm. The volumetric efficiency is a measure of the
effectiveness of the air intake system. Total volumetric efficiency is defined as the
volume flow rate of air into the intake system divided by the rate at which the volume
is being displaced by the piston. The typical value of volumetric efficiecy for natural
aspirated engines is between 70% and 85% (Heywood 1988). Meanwhile for the
turbocharged engines, the volumetric efficiency is more than 100%.
0
20
40
60
80
100
120
140
160
1000 1500 2000 2500 3000 3500 4000
Engine speed [rpm]
Bra
ke
po
we
r [k
W]
0
50
100
150
200
250
300
350
400
450
1000 1500 2000 2500 3000 3500 4000
Engine speed [rpm]
Bra
ke t
orq
ue [
Nm
] M1
M2
M3
M4
M5
M6
(a) (b)
Figure 5.12 Engine performances as a function of engine speed, (a) engine brake
power, (b) engine brake torque
The brake power is directly linked to the intake pressure. Figure 5.12(a)
shows that the brake power reduces as the intake pressure reduces. Again, at 1000
rpm, the brake power remains at the same level even though the intake pressure
reduces. Figure 5.12(b) shows engine brake torque at full load with variable intake
pressure. The engine brake torque reduces as the intake pressure reduces at all engine
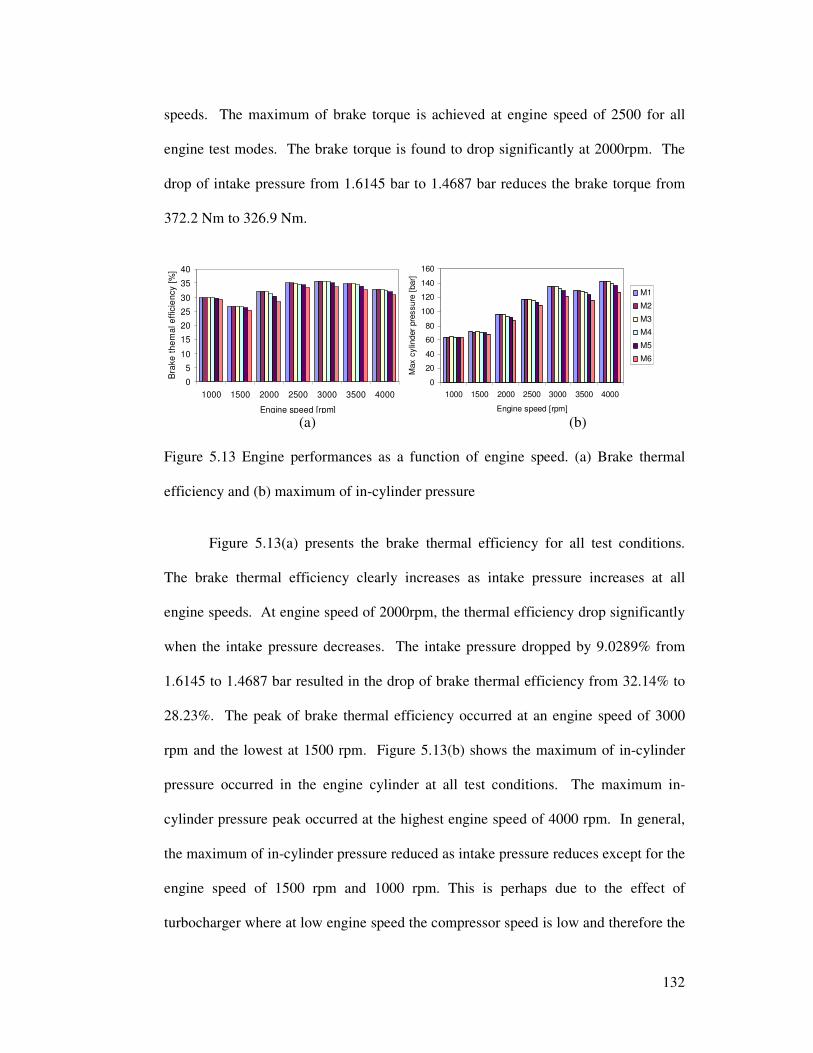
132
speeds. The maximum of brake torque is achieved at engine speed of 2500 for all
engine test modes. The brake torque is found to drop significantly at 2000rpm. The
drop of intake pressure from 1.6145 bar to 1.4687 bar reduces the brake torque from
372.2 Nm to 326.9 Nm.
0
5
10
15
20
25
30
35
40
1000 1500 2000 2500 3000 3500 4000
Engine speed [rpm]
Bra
ke
th
em
al e
ffic
ien
cy [
%]
0
20
40
60
80
100
120
140
160
1000 1500 2000 2500 3000 3500 4000
Engine speed [rpm]M
ax c
ylin
der
pre
ssure
[bar]
M1
M2
M3
M4
M5
M6
(a) (b)
Figure 5.13 Engine performances as a function of engine speed. (a) Brake thermal
efficiency and (b) maximum of in-cylinder pressure
Figure 5.13(a) presents the brake thermal efficiency for all test conditions.
The brake thermal efficiency clearly increases as intake pressure increases at all
engine speeds. At engine speed of 2000rpm, the thermal efficiency drop significantly
when the intake pressure decreases. The intake pressure dropped by 9.0289% from
1.6145 to 1.4687 bar resulted in the drop of brake thermal efficiency from 32.14% to
28.23%. The peak of brake thermal efficiency occurred at an engine speed of 3000
rpm and the lowest at 1500 rpm. Figure 5.13(b) shows the maximum of in-cylinder
pressure occurred in the engine cylinder at all test conditions. The maximum in-
cylinder pressure peak occurred at the highest engine speed of 4000 rpm. In general,
the maximum of in-cylinder pressure reduced as intake pressure reduces except for the
engine speed of 1500 rpm and 1000 rpm. This is perhaps due to the effect of
turbocharger where at low engine speed the compressor speed is low and therefore the
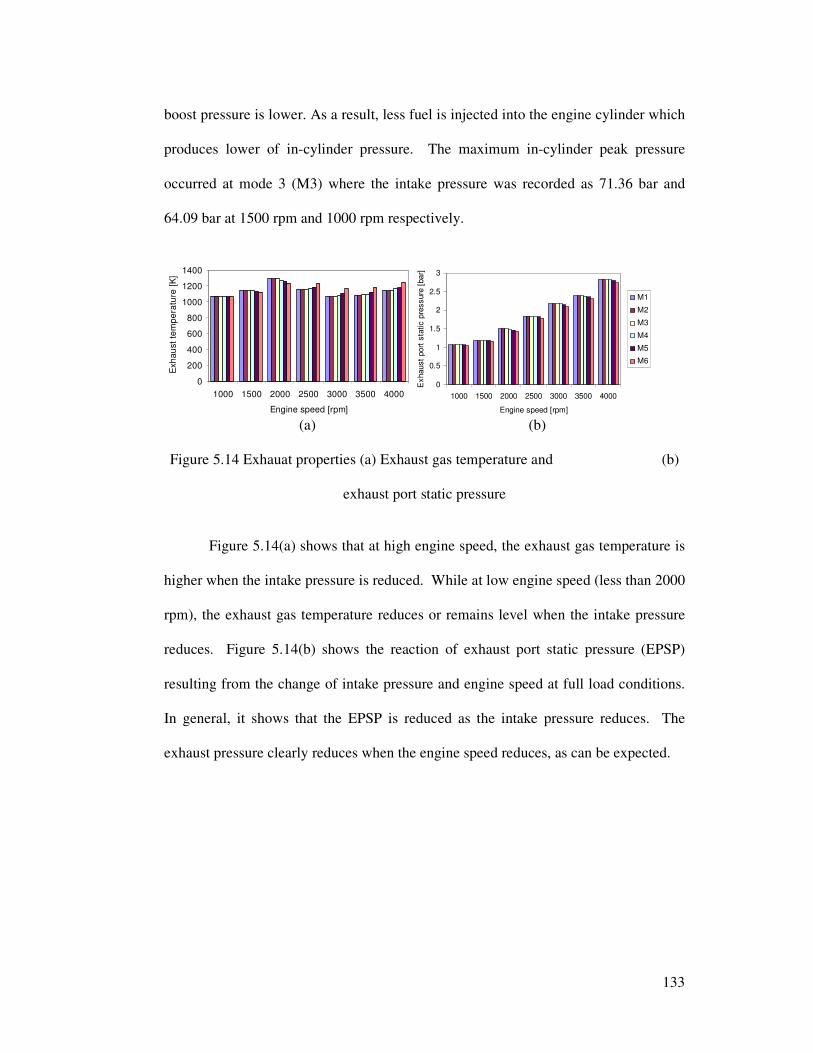
133
boost pressure is lower. As a result, less fuel is injected into the engine cylinder which
produces lower of in-cylinder pressure. The maximum in-cylinder peak pressure
occurred at mode 3 (M3) where the intake pressure was recorded as 71.36 bar and
64.09 bar at 1500 rpm and 1000 rpm respectively.
0
200
400
600
800
1000
1200
1400
1000 1500 2000 2500 3000 3500 4000
Engine speed [rpm]
Exh
au
st
tem
pe
ratu
re [
K]
0
0.5
1
1.5
2
2.5
3
1000 1500 2000 2500 3000 3500 4000
Engine speed [rpm]
Exhaust
port
sta
tic p
ressure
[bar]
M1
M2
M3
M4
M5
M6
(a) (b)
Figure 5.14 Exhauat properties (a) Exhaust gas temperature and (b)
exhaust port static pressure
Figure 5.14(a) shows that at high engine speed, the exhaust gas temperature is
higher when the intake pressure is reduced. While at low engine speed (less than 2000
rpm), the exhaust gas temperature reduces or remains level when the intake pressure
reduces. Figure 5.14(b) shows the reaction of exhaust port static pressure (EPSP)
resulting from the change of intake pressure and engine speed at full load conditions.
In general, it shows that the EPSP is reduced as the intake pressure reduces. The
exhaust pressure clearly reduces when the engine speed reduces, as can be expected.
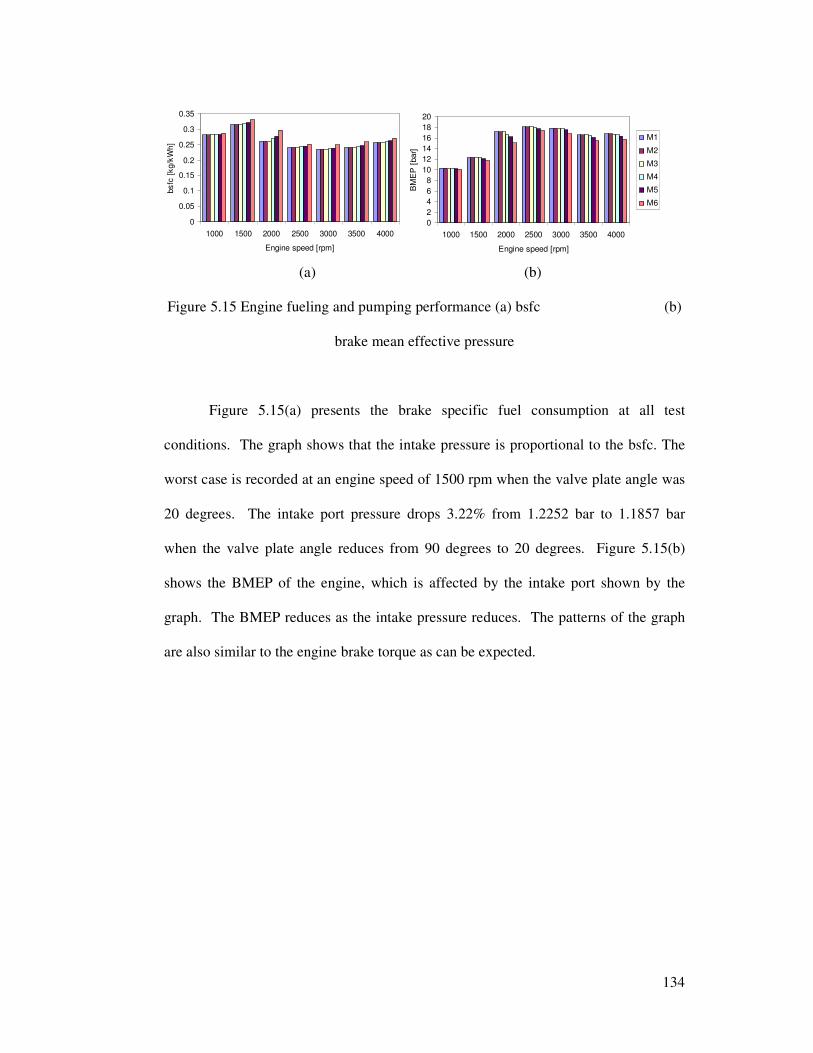
134
0
0.05
0.1
0.15
0.2
0.25
0.3
0.35
1000 1500 2000 2500 3000 3500 4000
Engine speed [rpm]
bs
fc [
kg/k
Wh
]
0
2
4
6
8
10
12
14
16
18
20
1000 1500 2000 2500 3000 3500 4000
Engine speed [rpm]
BM
EP
[bar]
M1
M2
M3
M4
M5
M6
(a) (b)
Figure 5.15 Engine fueling and pumping performance (a) bsfc (b)
brake mean effective pressure
Figure 5.15(a) presents the brake specific fuel consumption at all test
conditions. The graph shows that the intake pressure is proportional to the bsfc. The
worst case is recorded at an engine speed of 1500 rpm when the valve plate angle was
20 degrees. The intake port pressure drops 3.22% from 1.2252 bar to 1.1857 bar
when the valve plate angle reduces from 90 degrees to 20 degrees. Figure 5.15(b)
shows the BMEP of the engine, which is affected by the intake port shown by the
graph. The BMEP reduces as the intake pressure reduces. The patterns of the graph
are also similar to the engine brake torque as can be expected.
135
5.4 Summary
The one dimensional simulation is used to investigate the wave action on the
intake manifold of a V6 diesel engine. It is proved that the one dimensional
simulation is one a good example to understand the dynamic action on the intake
manifold. The simulation results agreed well with all experimental data at full load
conditions. The simulation also provides excellent results on the effect of the intake
manifold variable such as intake boost pressure. The simulation results were validated
with experimental data. It is found that the pressure drop caused by the throttle
resulted in lower engine performance and engine efficiency. The simulation results
showed that at full load conditions, the brake power and brake torque reduces 7.3%
and 12.2% respectively. The relative error of engine power and torque between
experiment and simulation results are varies from 0.23 to 2.5% and 0.14 to 3.14%
respectively. The air mass flow rate and bsfc also gives good agreement between
experimental data and simulation results.
136
CHAPTER 6
PERFORMANCE AND EMISSIONS OF A V6 DIESEL
ENGINE OPERATING WITH BIODIESEL
6.1 Introduction
This chapter presents the engine performance and emissions of a diesel engine
operating with RME and ULSD. The experimental studies were used the 2.7L V6
engine. Section 6.2 and 6.3 discussed the details of the effect of fuel, brake torque and
fuel temperature on the engines performance and emissions level. In both sections 6.2
and 6.3, the results are with respect to the engine operated without EGR and fuelled
by 100% RME and ULSD for comparison. The experiments have been conducted on
two different brake torques conditions. The effect of the EGR mode on all of the
above conditions has been discussed in detail in section 6.4
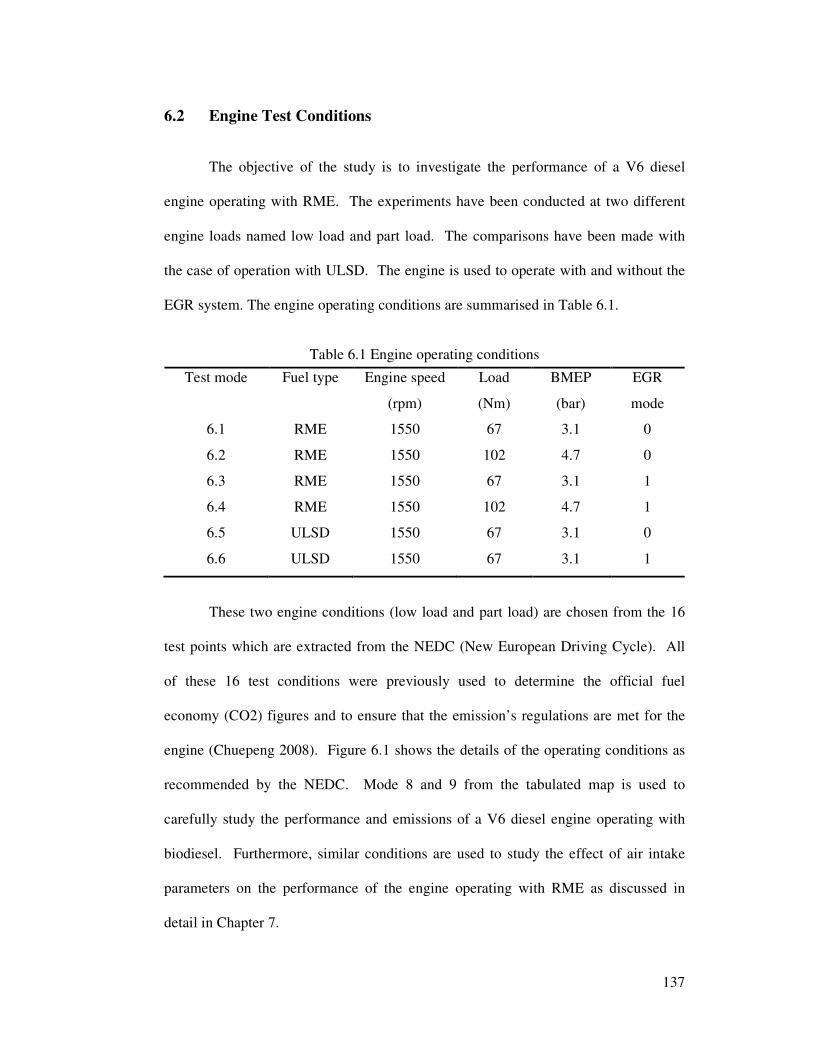
137
6.2 Engine Test Conditions
The objective of the study is to investigate the performance of a V6 diesel
engine operating with RME. The experiments have been conducted at two different
engine loads named low load and part load. The comparisons have been made with
the case of operation with ULSD. The engine is used to operate with and without the
EGR system. The engine operating conditions are summarised in Table 6.1.
Table 6.1 Engine operating conditions
Test mode Fuel type Engine speed
(rpm)
Load
(Nm)
BMEP
(bar)
EGR
mode
6.1 RME 1550 67 3.1 0
6.2 RME 1550 102 4.7 0
6.3 RME 1550 67 3.1 1
6.4 RME 1550 102 4.7 1
6.5 ULSD 1550 67 3.1 0
6.6 ULSD 1550 67 3.1 1
These two engine conditions (low load and part load) are chosen from the 16
test points which are extracted from the NEDC (New European Driving Cycle). All
of these 16 test conditions were previously used to determine the official fuel
economy (CO2) figures and to ensure that the emission’s regulations are met for the
engine (Chuepeng 2008). Figure 6.1 shows the details of the operating conditions as
recommended by the NEDC. Mode 8 and 9 from the tabulated map is used to
carefully study the performance and emissions of a V6 diesel engine operating with
biodiesel. Furthermore, similar conditions are used to study the effect of air intake
parameters on the performance of the engine operating with RME as discussed in
detail in Chapter 7.
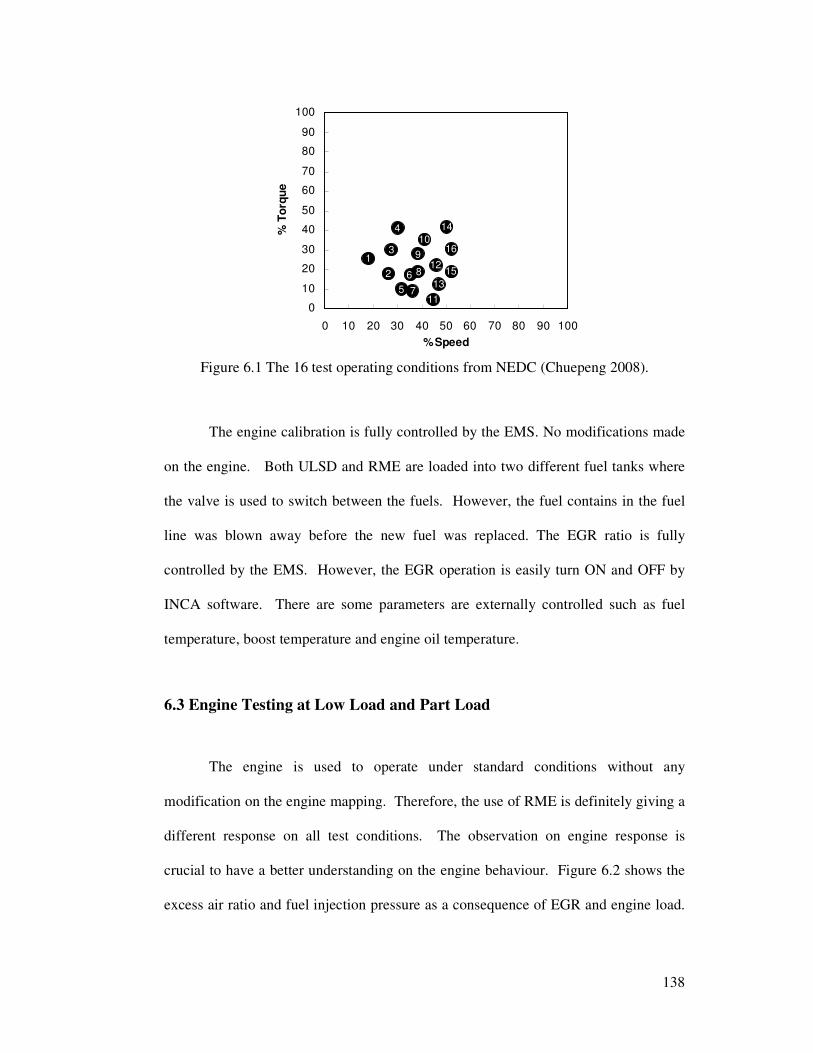
138
0
10
20
30
40
50
60
70
80
90
100
0 10 20 30 40 50 60 70 80 90 100
% Speed
% T
orq
ue
1
2
3
4
5
6
7
8
9
10
11
12
13
14
15
16
Figure 6.1 The 16 test operating conditions from NEDC (Chuepeng 2008).
The engine calibration is fully controlled by the EMS. No modifications made
on the engine. Both ULSD and RME are loaded into two different fuel tanks where
the valve is used to switch between the fuels. However, the fuel contains in the fuel
line was blown away before the new fuel was replaced. The EGR ratio is fully
controlled by the EMS. However, the EGR operation is easily turn ON and OFF by
INCA software. There are some parameters are externally controlled such as fuel
temperature, boost temperature and engine oil temperature.
6.3 Engine Testing at Low Load and Part Load
The engine is used to operate under standard conditions without any
modification on the engine mapping. Therefore, the use of RME is definitely giving a
different response on all test conditions. The observation on engine response is
crucial to have a better understanding on the engine behaviour. Figure 6.2 shows the
excess air ratio and fuel injection pressure as a consequence of EGR and engine load.
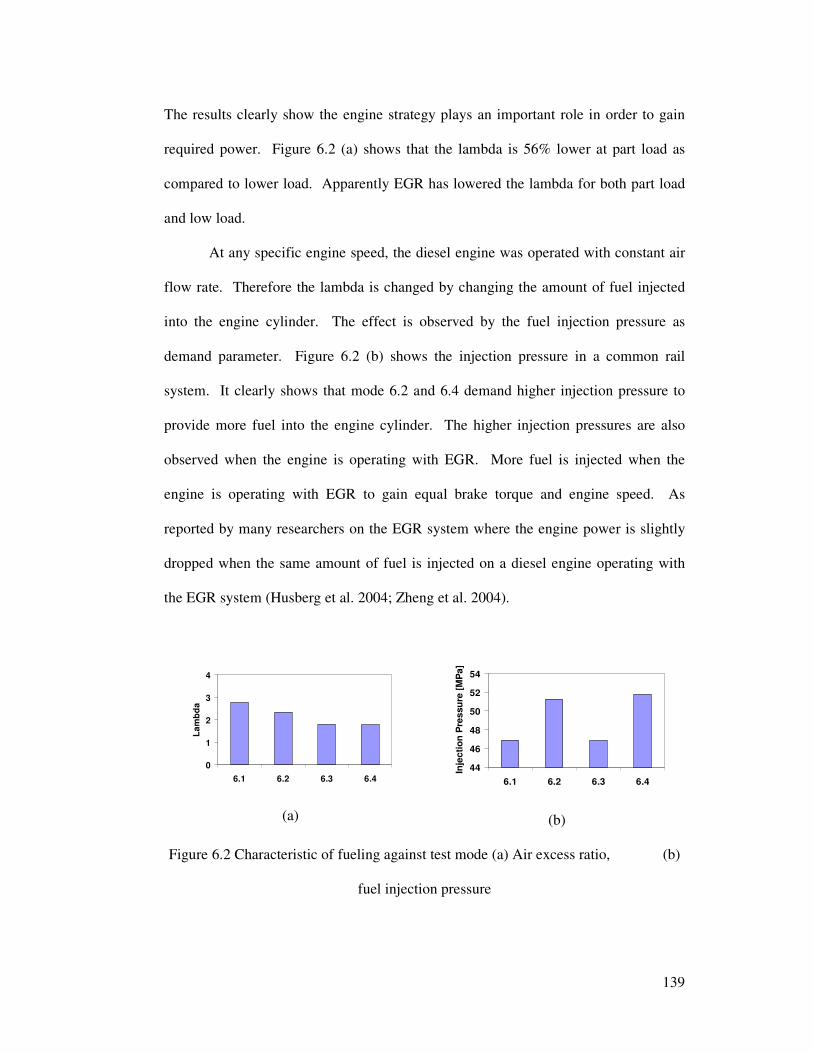
139
The results clearly show the engine strategy plays an important role in order to gain
required power. Figure 6.2 (a) shows that the lambda is 56% lower at part load as
compared to lower load. Apparently EGR has lowered the lambda for both part load
and low load.
At any specific engine speed, the diesel engine was operated with constant air
flow rate. Therefore the lambda is changed by changing the amount of fuel injected
into the engine cylinder. The effect is observed by the fuel injection pressure as
demand parameter. Figure 6.2 (b) shows the injection pressure in a common rail
system. It clearly shows that mode 6.2 and 6.4 demand higher injection pressure to
provide more fuel into the engine cylinder. The higher injection pressures are also
observed when the engine is operating with EGR. More fuel is injected when the
engine is operating with EGR to gain equal brake torque and engine speed. As
reported by many researchers on the EGR system where the engine power is slightly
dropped when the same amount of fuel is injected on a diesel engine operating with
the EGR system (Husberg et al. 2004; Zheng et al. 2004).
Lambda (RME, 1550 rpm, BMEP 3Bar)
0
1
2
3
4
6.1 6.2 6.3 6.4
La
mb
da
(a)
44
46
48
50
52
54
6.1 6.2 6.3 6.4
Inje
cti
on
Pre
ssu
re [
MP
a]
(b)
Figure 6.2 Characteristic of fueling against test mode (a) Air excess ratio, (b)
fuel injection pressure
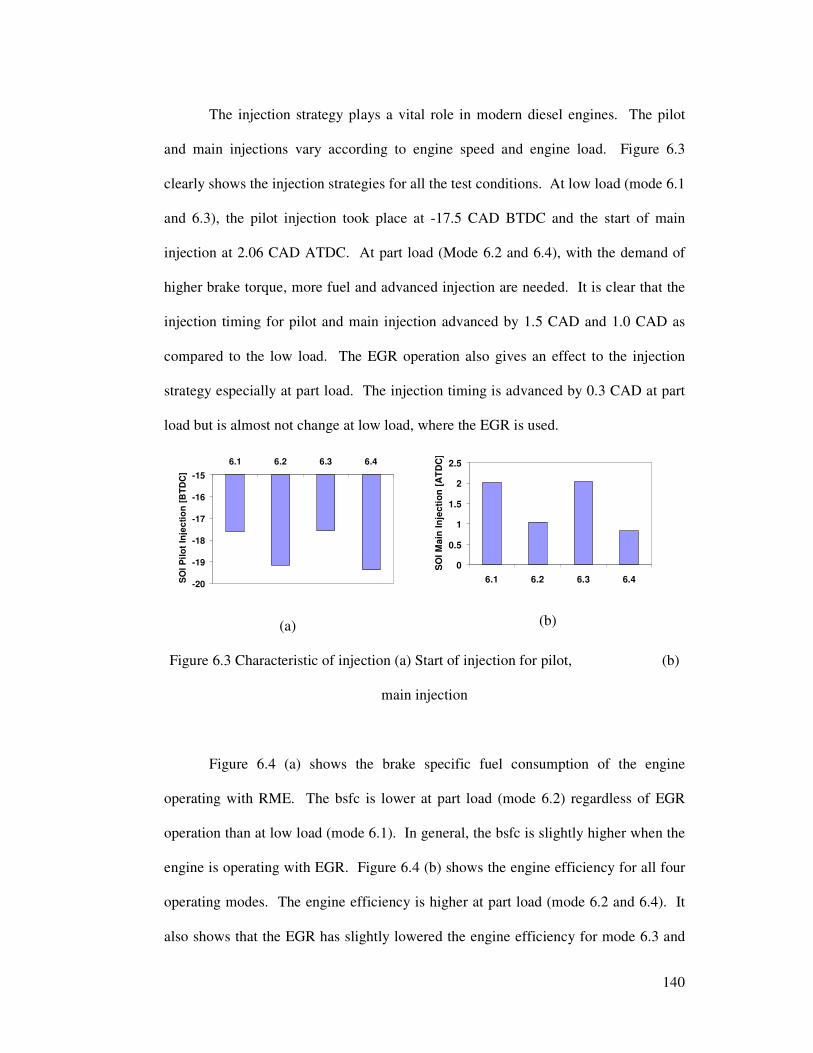
140
The injection strategy plays a vital role in modern diesel engines. The pilot
and main injections vary according to engine speed and engine load. Figure 6.3
clearly shows the injection strategies for all the test conditions. At low load (mode 6.1
and 6.3), the pilot injection took place at -17.5 CAD BTDC and the start of main
injection at 2.06 CAD ATDC. At part load (Mode 6.2 and 6.4), with the demand of
higher brake torque, more fuel and advanced injection are needed. It is clear that the
injection timing for pilot and main injection advanced by 1.5 CAD and 1.0 CAD as
compared to the low load. The EGR operation also gives an effect to the injection
strategy especially at part load. The injection timing is advanced by 0.3 CAD at part
load but is almost not change at low load, where the EGR is used.
-20
-19
-18
-17
-16
-15
6.1 6.2 6.3 6.4
SO
I P
ilo
t In
jec
tio
n [
BT
DC
]
(a)
0
0.5
1
1.5
2
2.5
6.1 6.2 6.3 6.4
SO
I M
ain
In
jec
tio
n [
AT
DC
]
(b)
Figure 6.3 Characteristic of injection (a) Start of injection for pilot, (b)
main injection
Figure 6.4 (a) shows the brake specific fuel consumption of the engine
operating with RME. The bsfc is lower at part load (mode 6.2) regardless of EGR
operation than at low load (mode 6.1). In general, the bsfc is slightly higher when the
engine is operating with EGR. Figure 6.4 (b) shows the engine efficiency for all four
operating modes. The engine efficiency is higher at part load (mode 6.2 and 6.4). It
also shows that the EGR has slightly lowered the engine efficiency for mode 6.3 and
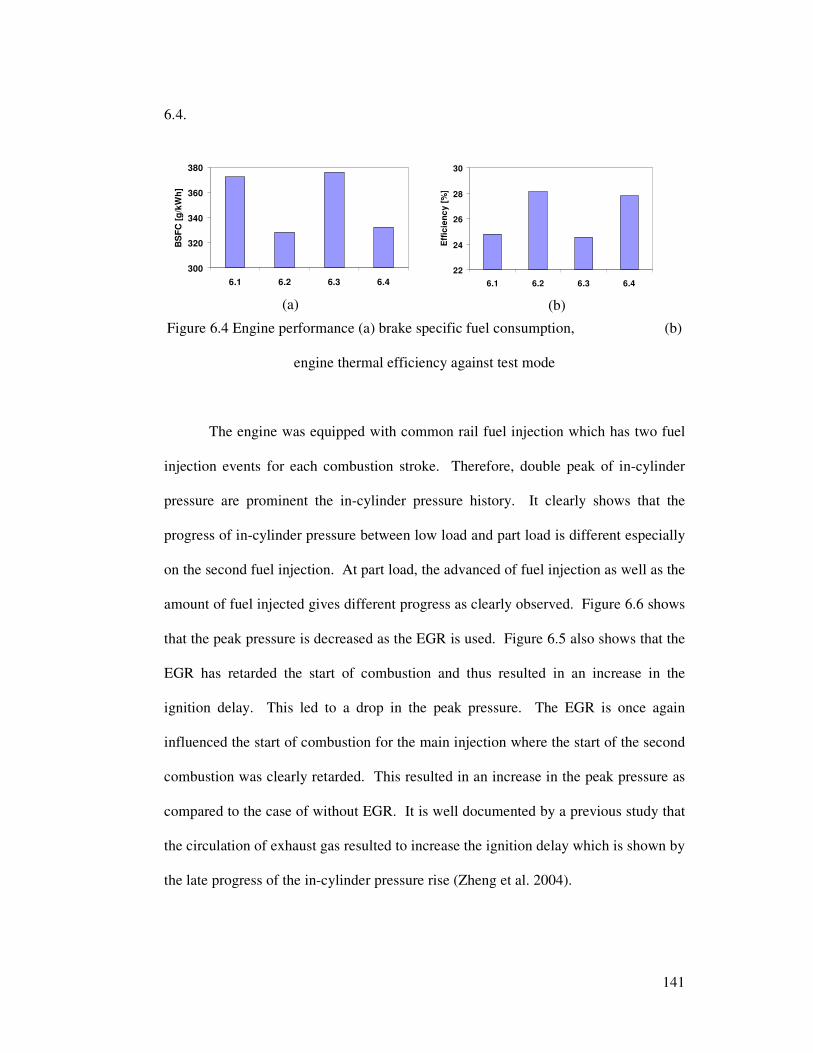
141
6.4.
300
320
340
360
380
6.1 6.2 6.3 6.4
BS
FC
[g
/kW
h]
(a)
22
24
26
28
30
6.1 6.2 6.3 6.4
Eff
icie
nc
y [
%]
(b)
Figure 6.4 Engine performance (a) brake specific fuel consumption, (b)
engine thermal efficiency against test mode
The engine was equipped with common rail fuel injection which has two fuel
injection events for each combustion stroke. Therefore, double peak of in-cylinder
pressure are prominent the in-cylinder pressure history. It clearly shows that the
progress of in-cylinder pressure between low load and part load is different especially
on the second fuel injection. At part load, the advanced of fuel injection as well as the
amount of fuel injected gives different progress as clearly observed. Figure 6.6 shows
that the peak pressure is decreased as the EGR is used. Figure 6.5 also shows that the
EGR has retarded the start of combustion and thus resulted in an increase in the
ignition delay. This led to a drop in the peak pressure. The EGR is once again
influenced the start of combustion for the main injection where the start of the second
combustion was clearly retarded. This resulted in an increase in the peak pressure as
compared to the case of without EGR. It is well documented by a previous study that
the circulation of exhaust gas resulted to increase the ignition delay which is shown by
the late progress of the in-cylinder pressure rise (Zheng et al. 2004).
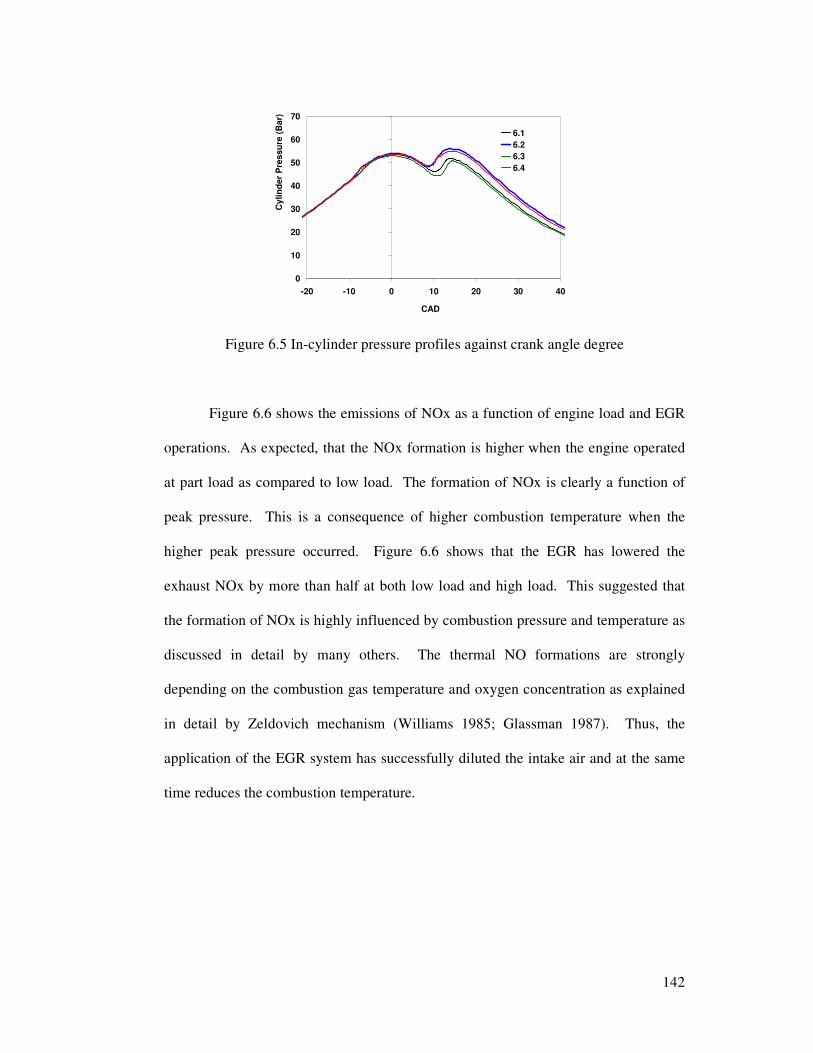
142
0
10
20
30
40
50
60
70
-20 -10 0 10 20 30 40
CAD
Cylin
der
Pre
ssu
re (
Bar)
6.1BM3E0
6.2BM4E1
6.3BM3E1
6.4BM4E0
Figure 6.5 In-cylinder pressure profiles against crank angle degree
Figure 6.6 shows the emissions of NOx as a function of engine load and EGR
operations. As expected, that the NOx formation is higher when the engine operated
at part load as compared to low load. The formation of NOx is clearly a function of
peak pressure. This is a consequence of higher combustion temperature when the
higher peak pressure occurred. Figure 6.6 shows that the EGR has lowered the
exhaust NOx by more than half at both low load and high load. This suggested that
the formation of NOx is highly influenced by combustion pressure and temperature as
discussed in detail by many others. The thermal NO formations are strongly
depending on the combustion gas temperature and oxygen concentration as explained
in detail by Zeldovich mechanism (Williams 1985; Glassman 1987). Thus, the
application of the EGR system has successfully diluted the intake air and at the same
time reduces the combustion temperature.
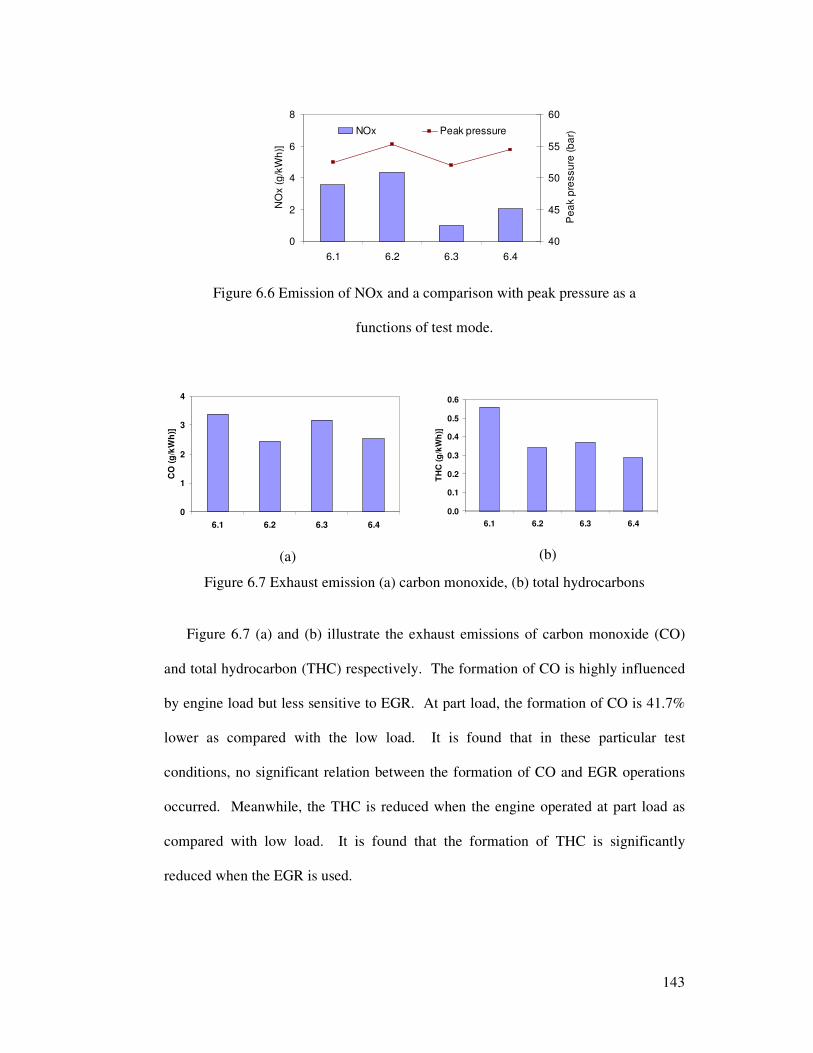
143
0
2
4
6
8
6.1 6.2 6.3 6.4
NO
x (
g/k
Wh
)]
40
45
50
55
60
Pe
ak p
ressu
re (
ba
r)NOx Peak pressure
Figure 6.6 Emission of NOx and a comparison with peak pressure as a
functions of test mode.
0
1
2
3
4
6.1 6.2 6.3 6.4
CO
(g
/kW
h)]
(a)
0.0
0.1
0.2
0.3
0.4
0.5
0.6
6.1 6.2 6.3 6.4
TH
C (
g/k
Wh
)]
(b)
Figure 6.7 Exhaust emission (a) carbon monoxide, (b) total hydrocarbons
Figure 6.7 (a) and (b) illustrate the exhaust emissions of carbon monoxide (CO)
and total hydrocarbon (THC) respectively. The formation of CO is highly influenced
by engine load but less sensitive to EGR. At part load, the formation of CO is 41.7%
lower as compared with the low load. It is found that in these particular test
conditions, no significant relation between the formation of CO and EGR operations
occurred. Meanwhile, the THC is reduced when the engine operated at part load as
compared with low load. It is found that the formation of THC is significantly
reduced when the EGR is used.
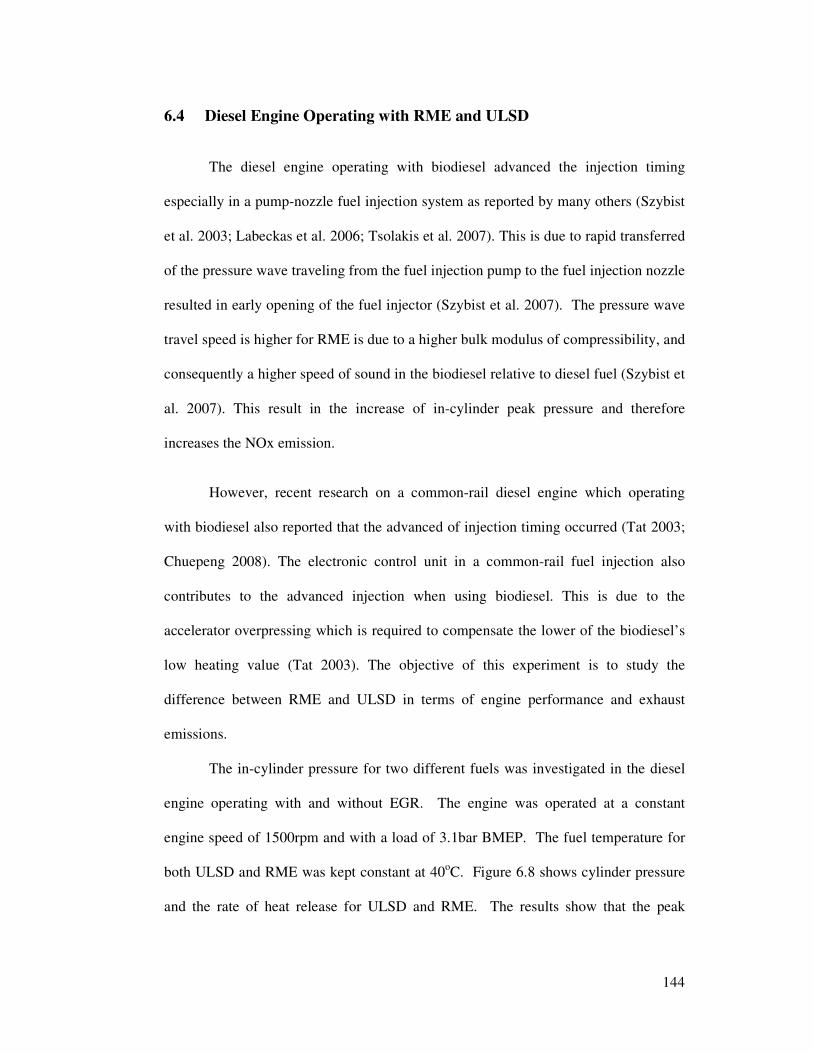
144
6.4 Diesel Engine Operating with RME and ULSD
The diesel engine operating with biodiesel advanced the injection timing
especially in a pump-nozzle fuel injection system as reported by many others (Szybist
et al. 2003; Labeckas et al. 2006; Tsolakis et al. 2007). This is due to rapid transferred
of the pressure wave traveling from the fuel injection pump to the fuel injection nozzle
resulted in early opening of the fuel injector (Szybist et al. 2007). The pressure wave
travel speed is higher for RME is due to a higher bulk modulus of compressibility, and
consequently a higher speed of sound in the biodiesel relative to diesel fuel (Szybist et
al. 2007). This result in the increase of in-cylinder peak pressure and therefore
increases the NOx emission.
However, recent research on a common-rail diesel engine which operating
with biodiesel also reported that the advanced of injection timing occurred (Tat 2003;
Chuepeng 2008). The electronic control unit in a common-rail fuel injection also
contributes to the advanced injection when using biodiesel. This is due to the
accelerator overpressing which is required to compensate the lower of the biodiesel’s
low heating value (Tat 2003). The objective of this experiment is to study the
difference between RME and ULSD in terms of engine performance and exhaust
emissions.
The in-cylinder pressure for two different fuels was investigated in the diesel
engine operating with and without EGR. The engine was operated at a constant
engine speed of 1500rpm and with a load of 3.1bar BMEP. The fuel temperature for
both ULSD and RME was kept constant at 40oC. Figure 6.8 shows cylinder pressure
and the rate of heat release for ULSD and RME. The results show that the peak
145
pressure for RME is higher than that obtained with ULSD. The data recovered from
the engine ECU showed that the pilot injection of RME was advanced by 0.4 crank
angle degrees compared with injection of ULSD. Early injection for RME resulted in
an early start of combustion which produced higher cylinder pressure as clearly
depicted in Figure 6.8.
Figure 6.8 Cylinder pressure and rate of heat release for ULSD and RME at engine
speed of 1550rpm, 67 Nm brake torque.
The combustion pattern is strongly influenced by the EGR operation. The
cylinder pressure decreases as the EGR system is engaged for both ULSD and RME.
In addition, the start of combustion is retarded by 3.5 and 3.6 crank angle degrees for
ULSD and RME respectively when the engine is operating with EGR. Both of these
effects contribute to lower peak pressures and temperatures in the combustion
chamber. As a consequence, the rate of heat release starts to increase faster and tends
to decrease earlier compared with the case without EGR. This trend is similar for both
the pilot as well as main injections.
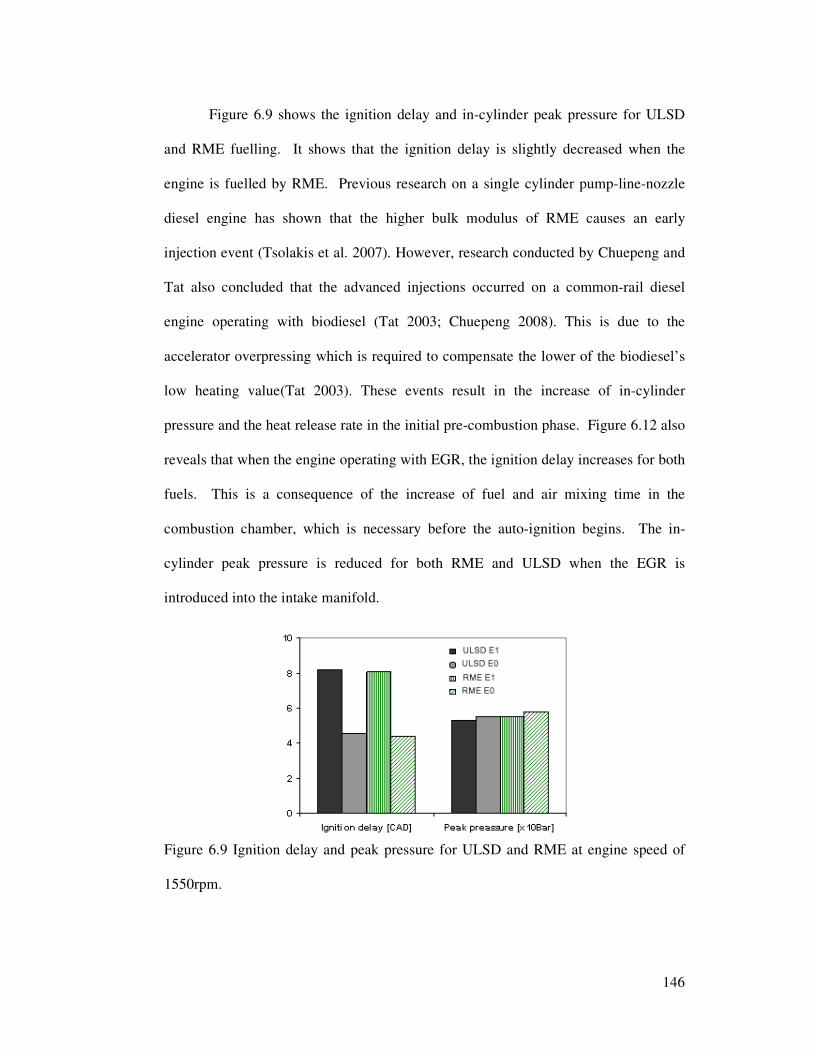
146
Figure 6.9 shows the ignition delay and in-cylinder peak pressure for ULSD
and RME fuelling. It shows that the ignition delay is slightly decreased when the
engine is fuelled by RME. Previous research on a single cylinder pump-line-nozzle
diesel engine has shown that the higher bulk modulus of RME causes an early
injection event (Tsolakis et al. 2007). However, research conducted by Chuepeng and
Tat also concluded that the advanced injections occurred on a common-rail diesel
engine operating with biodiesel (Tat 2003; Chuepeng 2008). This is due to the
accelerator overpressing which is required to compensate the lower of the biodiesel’s
low heating value(Tat 2003). These events result in the increase of in-cylinder
pressure and the heat release rate in the initial pre-combustion phase. Figure 6.12 also
reveals that when the engine operating with EGR, the ignition delay increases for both
fuels. This is a consequence of the increase of fuel and air mixing time in the
combustion chamber, which is necessary before the auto-ignition begins. The in-
cylinder peak pressure is reduced for both RME and ULSD when the EGR is
introduced into the intake manifold.
Figure 6.9 Ignition delay and peak pressure for ULSD and RME at engine speed of
1550rpm.
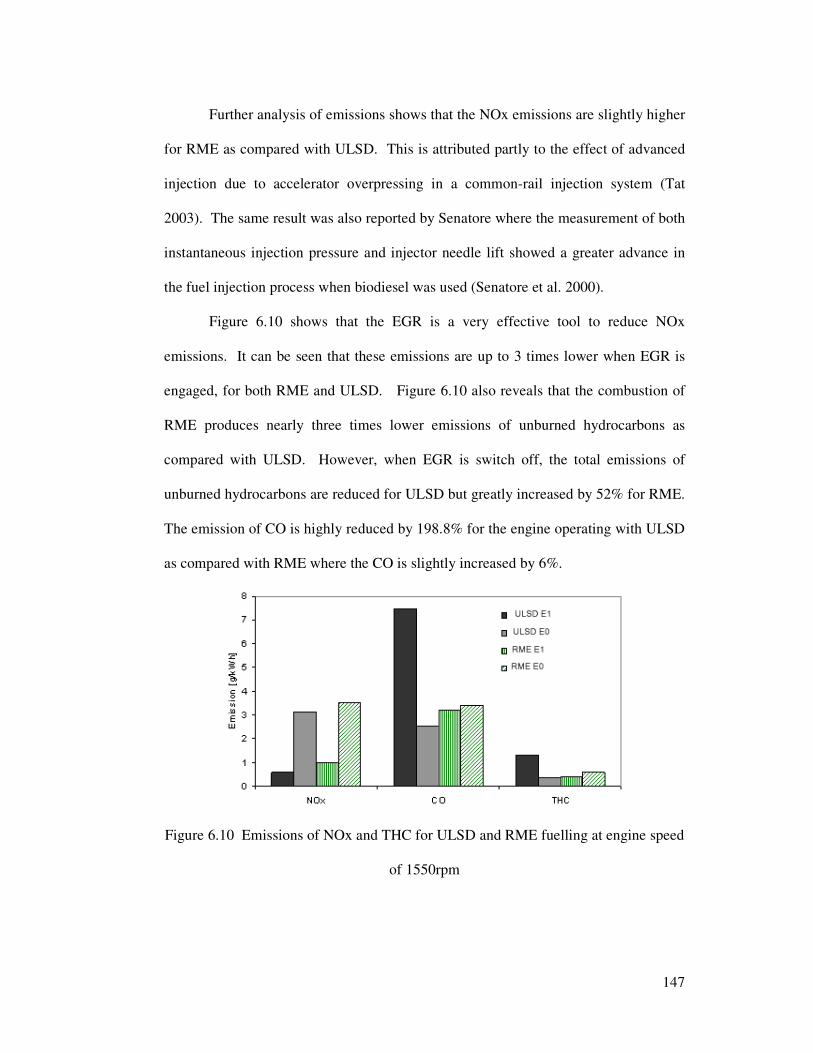
147
Further analysis of emissions shows that the NOx emissions are slightly higher
for RME as compared with ULSD. This is attributed partly to the effect of advanced
injection due to accelerator overpressing in a common-rail injection system (Tat
2003). The same result was also reported by Senatore where the measurement of both
instantaneous injection pressure and injector needle lift showed a greater advance in
the fuel injection process when biodiesel was used (Senatore et al. 2000).
Figure 6.10 shows that the EGR is a very effective tool to reduce NOx
emissions. It can be seen that these emissions are up to 3 times lower when EGR is
engaged, for both RME and ULSD. Figure 6.10 also reveals that the combustion of
RME produces nearly three times lower emissions of unburned hydrocarbons as
compared with ULSD. However, when EGR is switch off, the total emissions of
unburned hydrocarbons are reduced for ULSD but greatly increased by 52% for RME.
The emission of CO is highly reduced by 198.8% for the engine operating with ULSD
as compared with RME where the CO is slightly increased by 6%.
Figure 6.10 Emissions of NOx and THC for ULSD and RME fuelling at engine speed
of 1550rpm
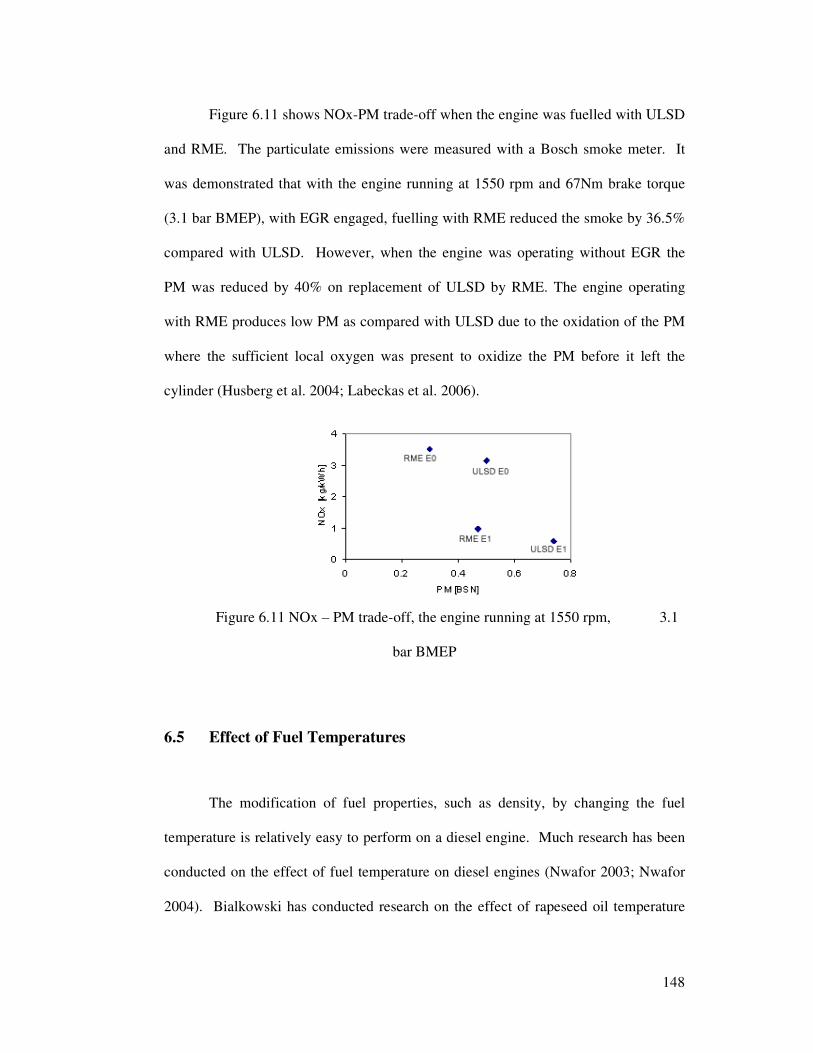
148
Figure 6.11 shows NOx-PM trade-off when the engine was fuelled with ULSD
and RME. The particulate emissions were measured with a Bosch smoke meter. It
was demonstrated that with the engine running at 1550 rpm and 67Nm brake torque
(3.1 bar BMEP), with EGR engaged, fuelling with RME reduced the smoke by 36.5%
compared with ULSD. However, when the engine was operating without EGR the
PM was reduced by 40% on replacement of ULSD by RME. The engine operating
with RME produces low PM as compared with ULSD due to the oxidation of the PM
where the sufficient local oxygen was present to oxidize the PM before it left the
cylinder (Husberg et al. 2004; Labeckas et al. 2006).
Figure 6.11 NOx – PM trade-off, the engine running at 1550 rpm, 3.1
bar BMEP
6.5 Effect of Fuel Temperatures
The modification of fuel properties, such as density, by changing the fuel
temperature is relatively easy to perform on a diesel engine. Much research has been
conducted on the effect of fuel temperature on diesel engines (Nwafor 2003; Nwafor
2004). Bialkowski has conducted research on the effect of rapeseed oil temperature
149
on common rail fuel injector spray behaviour. He concluded that the higher the fuel
temperature, the faster spray penetration and smaller Sauter and arithmetic mean
diameter (Bialkowski et al. 2004). Therefore by changing the fuel physical
conditions, it could possibly reduce the gap between the performance of biodiesel and
mineral diesel fuels.
The objective of the present work is to study the effect of biodiesel fuel
temperature on the combustion and emissions of a diesel engine. The standard engine
calibration and operation is not altered during the experiment. However, the operation
of EGR is switched ON and OFF to study the effect of EGR on engine performance
and emissions level. The temperature of RME is varied and tested at 30, 35 and 40oC.
The fuel temperature is changed by the heat exchanger which is installed 500mm from
the fuel pump. The fuel line between the heat exchanger and fuel pump is insulated to
prevent heat losses. The fuel temperature is carefully controlled by a solenoid valve
which controls the volume flow rate of cooling water.
The engine operations parameter and responses triggered from the ECU were
recorded and analysed in order to obtain a better understanding of the engine reaction
on the effect of fuel temperature and EGR operations. Figure 6.12 shows the
responses of injection pressure in the engine as a consequence of changes in EGR
mode and fuel temperature. It is found that the higher fuel temperatures tend to
produce higher injection pressure. When the fuel temperature is increased, the fuel
density decreases. Therefore, a higher injection pressure is required to gain an equal
fuel mass in order to produce the same required brake torque.
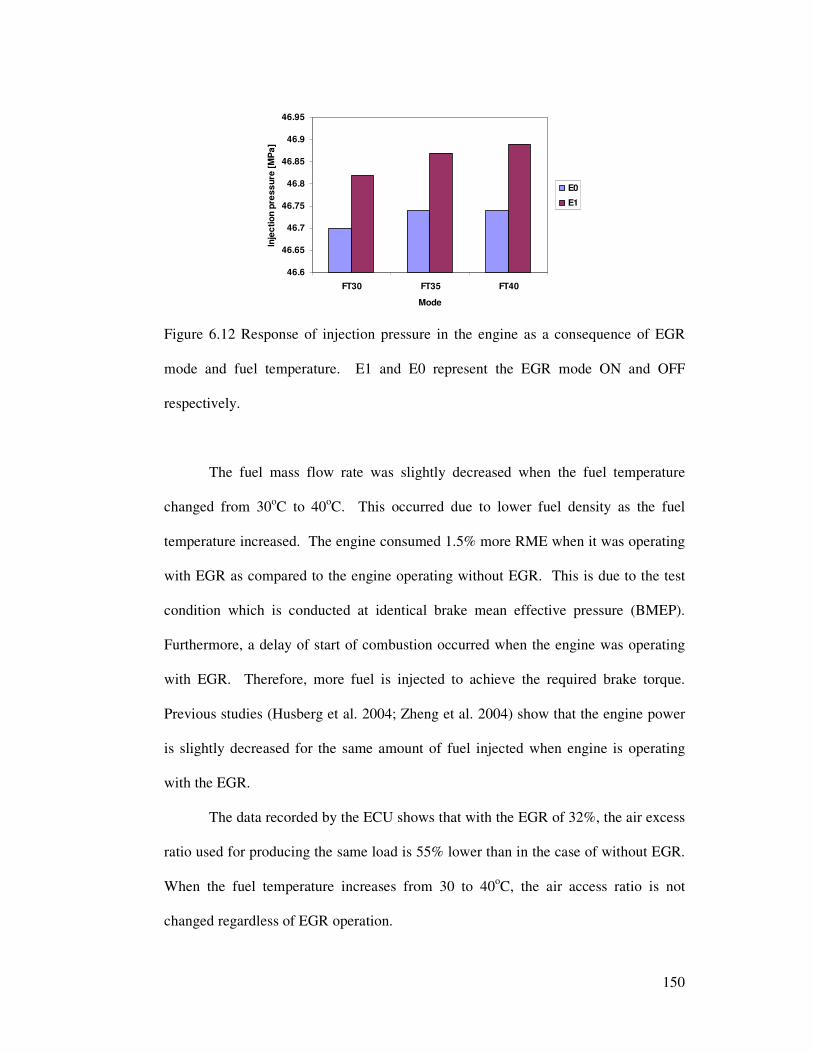
150
46.6
46.65
46.7
46.75
46.8
46.85
46.9
46.95
FT30 FT35 FT40
Mode
Inje
cti
on
pre
ss
ure
[M
Pa
]
E0
E1
Figure 6.12 Response of injection pressure in the engine as a consequence of EGR
mode and fuel temperature. E1 and E0 represent the EGR mode ON and OFF
respectively.
The fuel mass flow rate was slightly decreased when the fuel temperature
changed from 30oC to 40oC. This occurred due to lower fuel density as the fuel
temperature increased. The engine consumed 1.5% more RME when it was operating
with EGR as compared to the engine operating without EGR. This is due to the test
condition which is conducted at identical brake mean effective pressure (BMEP).
Furthermore, a delay of start of combustion occurred when the engine was operating
with EGR. Therefore, more fuel is injected to achieve the required brake torque.
Previous studies (Husberg et al. 2004; Zheng et al. 2004) show that the engine power
is slightly decreased for the same amount of fuel injected when engine is operating
with the EGR.
The data recorded by the ECU shows that with the EGR of 32%, the air excess
ratio used for producing the same load is 55% lower than in the case of without EGR.
When the fuel temperature increases from 30 to 40oC, the air access ratio is not
changed regardless of EGR operation.
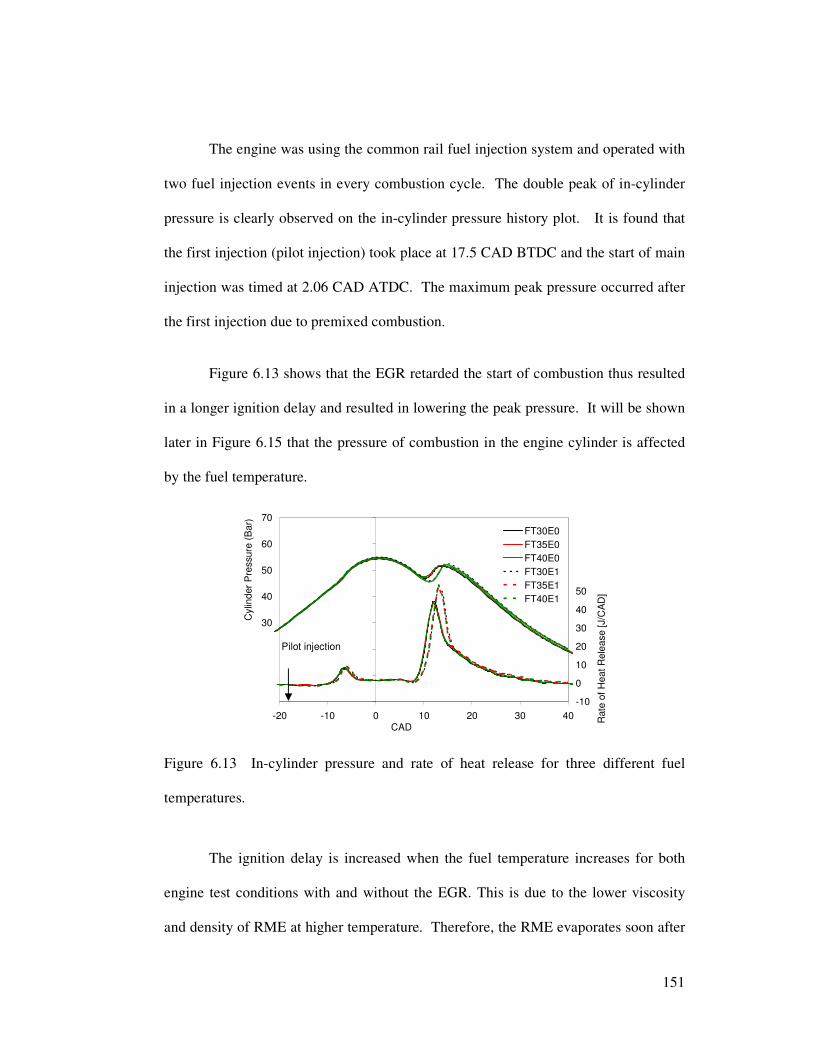
151
The engine was using the common rail fuel injection system and operated with
two fuel injection events in every combustion cycle. The double peak of in-cylinder
pressure is clearly observed on the in-cylinder pressure history plot. It is found that
the first injection (pilot injection) took place at 17.5 CAD BTDC and the start of main
injection was timed at 2.06 CAD ATDC. The maximum peak pressure occurred after
the first injection due to premixed combustion.
Figure 6.13 shows that the EGR retarded the start of combustion thus resulted
in a longer ignition delay and resulted in lowering the peak pressure. It will be shown
later in Figure 6.15 that the pressure of combustion in the engine cylinder is affected
by the fuel temperature.
0
10
20
30
40
50
60
70
-20 -10 0 10 20 30 40CAD
Cylin
der
Pre
ssure
(B
ar)
-10
0
10
20
30
40
50
60
70
80
90
Rate
of
Heat R
ele
ase [
J/C
AD
]
FT30E0
FT35E0
FT40E0
FT30E1
FT35E1
FT40E1
Figure 6.13 In-cylinder pressure and rate of heat release for three different fuel
temperatures.
The ignition delay is increased when the fuel temperature increases for both
engine test conditions with and without the EGR. This is due to the lower viscosity
and density of RME at higher temperature. Therefore, the RME evaporates soon after
Pilot injection
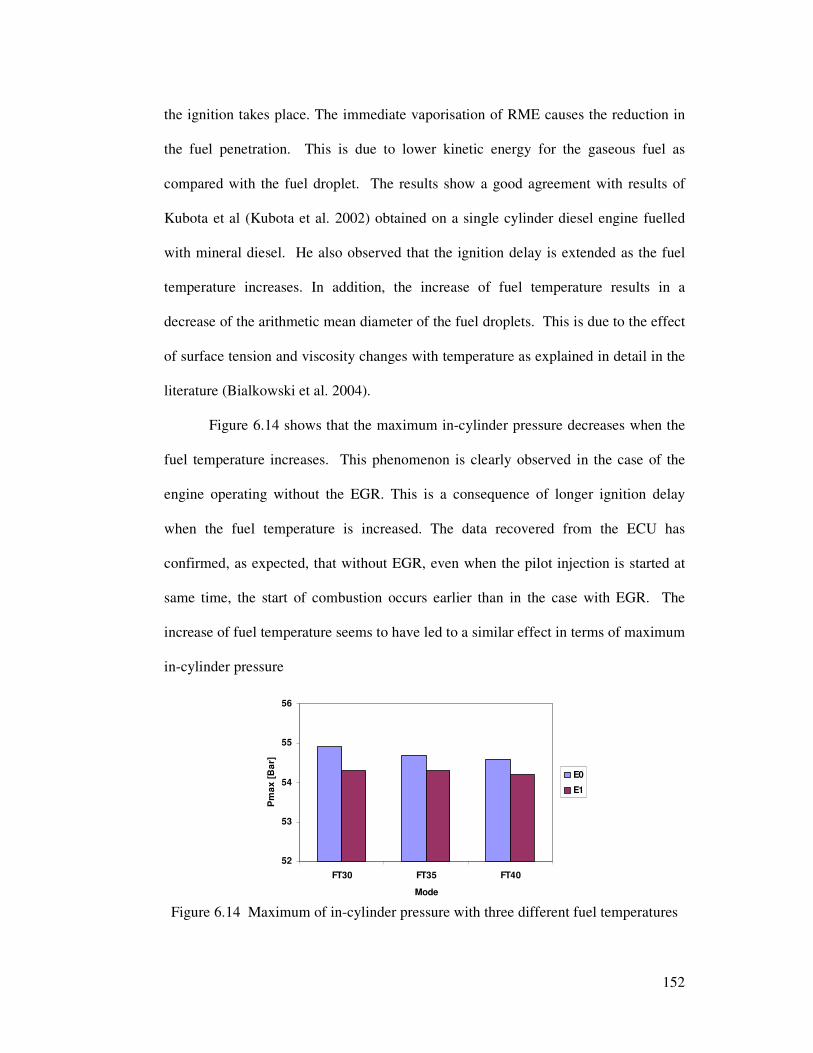
152
the ignition takes place. The immediate vaporisation of RME causes the reduction in
the fuel penetration. This is due to lower kinetic energy for the gaseous fuel as
compared with the fuel droplet. The results show a good agreement with results of
Kubota et al (Kubota et al. 2002) obtained on a single cylinder diesel engine fuelled
with mineral diesel. He also observed that the ignition delay is extended as the fuel
temperature increases. In addition, the increase of fuel temperature results in a
decrease of the arithmetic mean diameter of the fuel droplets. This is due to the effect
of surface tension and viscosity changes with temperature as explained in detail in the
literature (Bialkowski et al. 2004).
Figure 6.14 shows that the maximum in-cylinder pressure decreases when the
fuel temperature increases. This phenomenon is clearly observed in the case of the
engine operating without the EGR. This is a consequence of longer ignition delay
when the fuel temperature is increased. The data recovered from the ECU has
confirmed, as expected, that without EGR, even when the pilot injection is started at
same time, the start of combustion occurs earlier than in the case with EGR. The
increase of fuel temperature seems to have led to a similar effect in terms of maximum
in-cylinder pressure
52
53
54
55
56
FT30 FT35 FT40
Mode
Pm
ax
[B
ar]
E0
E1
Figure 6.14 Maximum of in-cylinder pressure with three different fuel temperatures
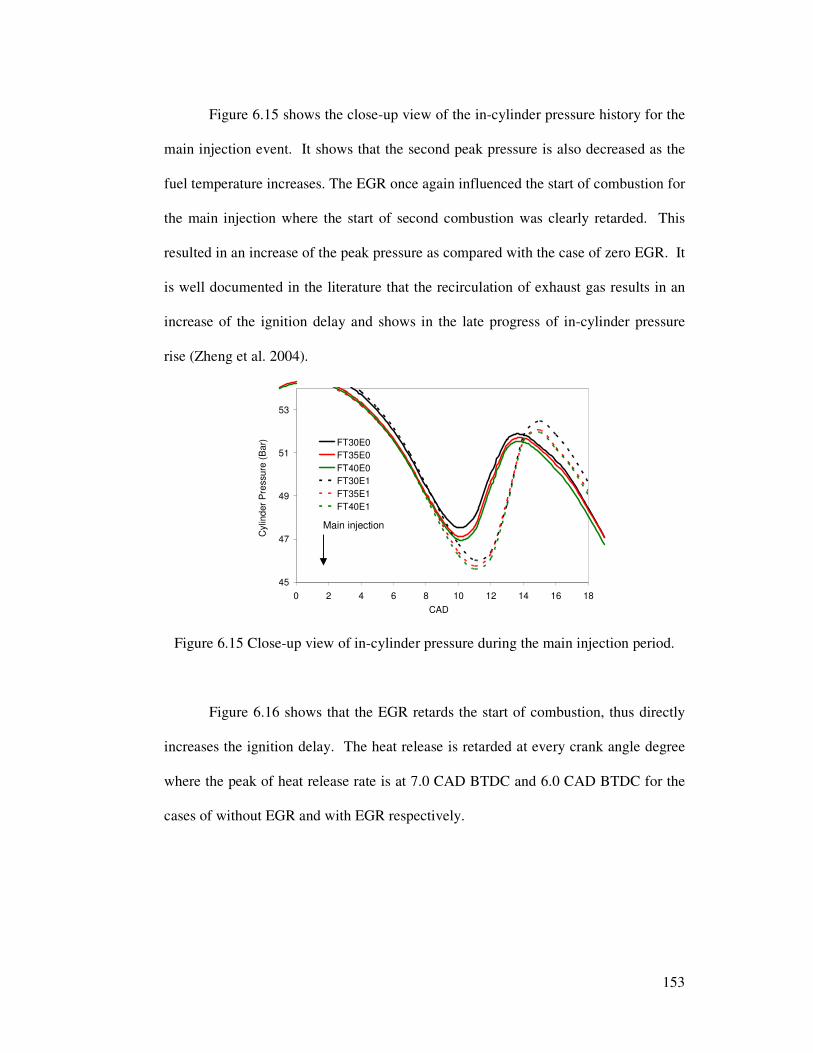
153
Figure 6.15 shows the close-up view of the in-cylinder pressure history for the
main injection event. It shows that the second peak pressure is also decreased as the
fuel temperature increases. The EGR once again influenced the start of combustion for
the main injection where the start of second combustion was clearly retarded. This
resulted in an increase of the peak pressure as compared with the case of zero EGR. It
is well documented in the literature that the recirculation of exhaust gas results in an
increase of the ignition delay and shows in the late progress of in-cylinder pressure
rise (Zheng et al. 2004).
45
47
49
51
53
0 2 4 6 8 10 12 14 16 18
CAD
Cylin
der
Pre
ssu
re (
Ba
r) FT30E0
FT35E0
FT40E0
FT30E1
FT35E1
FT40E1
Figure 6.15 Close-up view of in-cylinder pressure during the main injection period.
Figure 6.16 shows that the EGR retards the start of combustion, thus directly
increases the ignition delay. The heat release is retarded at every crank angle degree
where the peak of heat release rate is at 7.0 CAD BTDC and 6.0 CAD BTDC for the
cases of without EGR and with EGR respectively.
Main injection
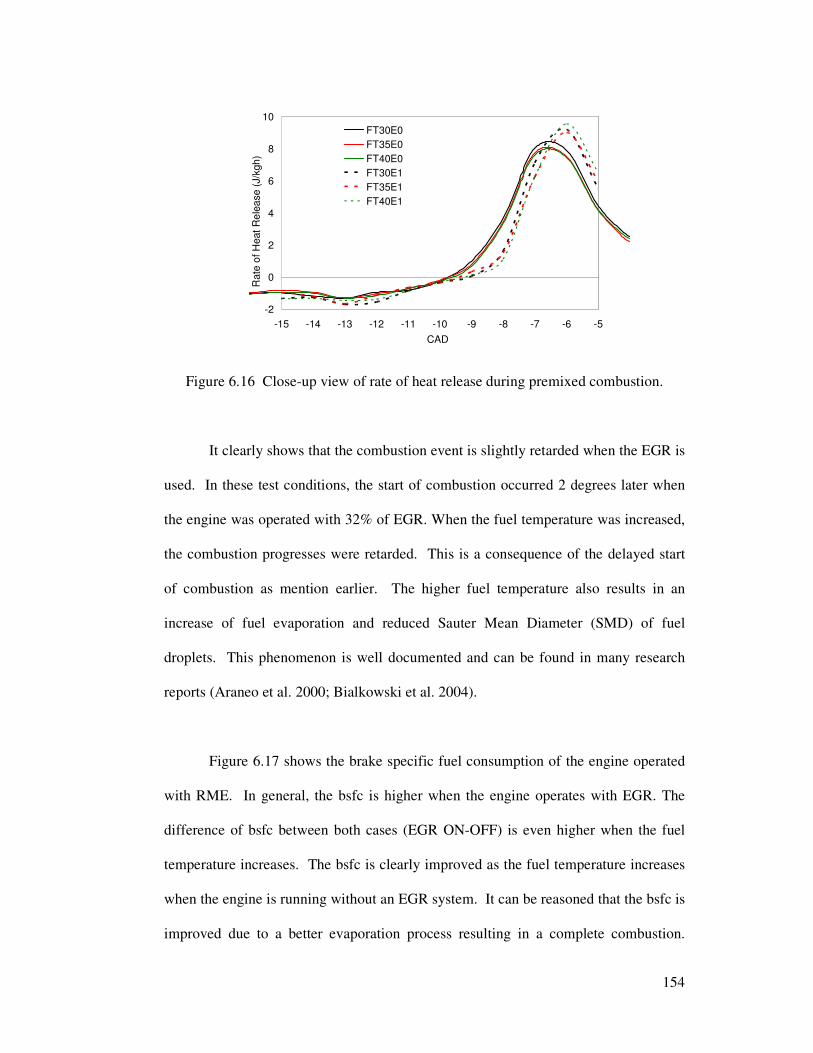
154
-2
0
2
4
6
8
10
-15 -14 -13 -12 -11 -10 -9 -8 -7 -6 -5
CAD
Rate
of H
eat
Re
lea
se (
J/k
gh
)
FT30E0
FT35E0
FT40E0
FT30E1
FT35E1
FT40E1
Figure 6.16 Close-up view of rate of heat release during premixed combustion.
It clearly shows that the combustion event is slightly retarded when the EGR is
used. In these test conditions, the start of combustion occurred 2 degrees later when
the engine was operated with 32% of EGR. When the fuel temperature was increased,
the combustion progresses were retarded. This is a consequence of the delayed start
of combustion as mention earlier. The higher fuel temperature also results in an
increase of fuel evaporation and reduced Sauter Mean Diameter (SMD) of fuel
droplets. This phenomenon is well documented and can be found in many research
reports (Araneo et al. 2000; Bialkowski et al. 2004).
Figure 6.17 shows the brake specific fuel consumption of the engine operated
with RME. In general, the bsfc is higher when the engine operates with EGR. The
difference of bsfc between both cases (EGR ON-OFF) is even higher when the fuel
temperature increases. The bsfc is clearly improved as the fuel temperature increases
when the engine is running without an EGR system. It can be reasoned that the bsfc is
improved due to a better evaporation process resulting in a complete combustion.
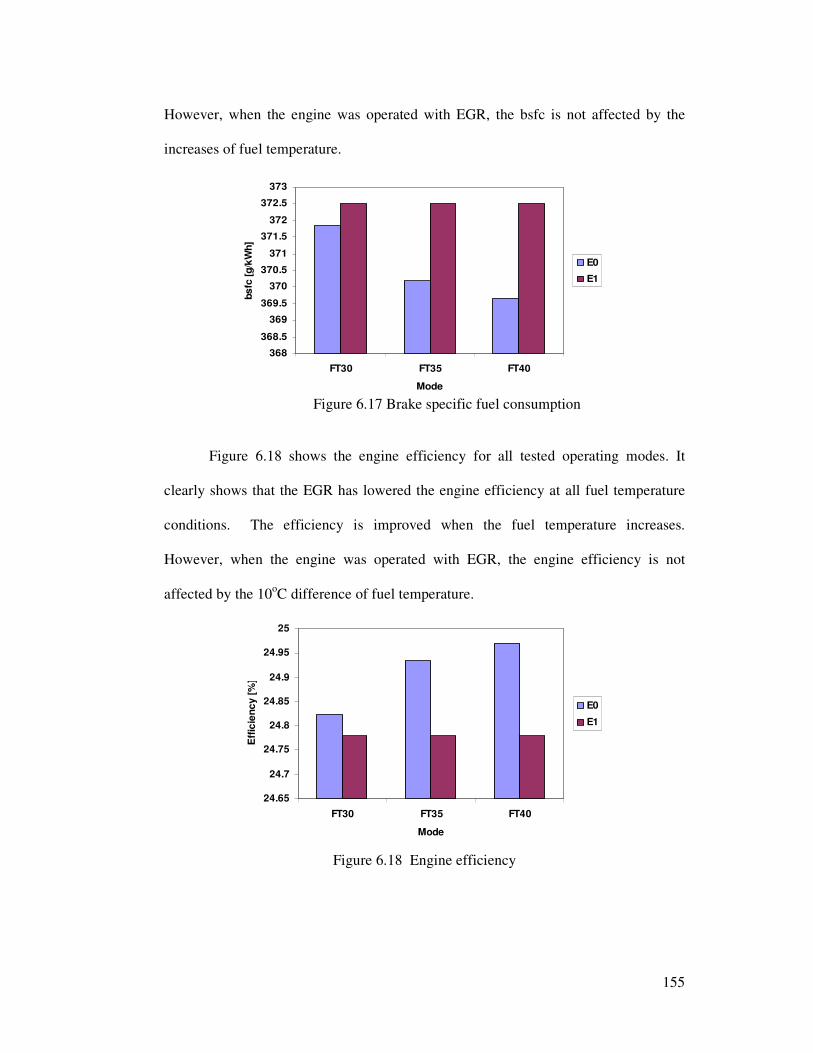
155
However, when the engine was operated with EGR, the bsfc is not affected by the
increases of fuel temperature.
368
368.5
369
369.5
370
370.5
371
371.5
372
372.5
373
FT30 FT35 FT40
Mode
bs
fc [
g/k
Wh
]
E0
E1
Figure 6.17 Brake specific fuel consumption
Figure 6.18 shows the engine efficiency for all tested operating modes. It
clearly shows that the EGR has lowered the engine efficiency at all fuel temperature
conditions. The efficiency is improved when the fuel temperature increases.
However, when the engine was operated with EGR, the engine efficiency is not
affected by the 10oC difference of fuel temperature.
24.65
24.7
24.75
24.8
24.85
24.9
24.95
25
FT30 FT35 FT40
Mode
Eff
icie
nc
y [
%]
E0
E1
Figure 6.18 Engine efficiency
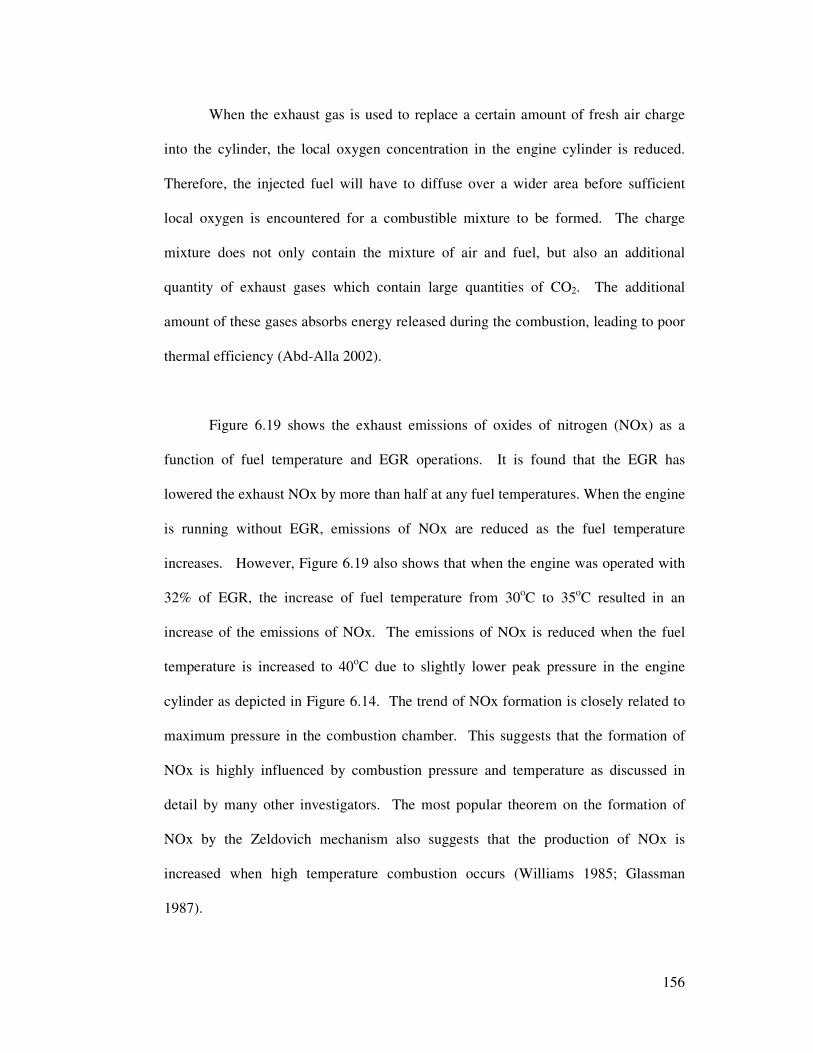
156
When the exhaust gas is used to replace a certain amount of fresh air charge
into the cylinder, the local oxygen concentration in the engine cylinder is reduced.
Therefore, the injected fuel will have to diffuse over a wider area before sufficient
local oxygen is encountered for a combustible mixture to be formed. The charge
mixture does not only contain the mixture of air and fuel, but also an additional
quantity of exhaust gases which contain large quantities of CO2. The additional
amount of these gases absorbs energy released during the combustion, leading to poor
thermal efficiency (Abd-Alla 2002).
Figure 6.19 shows the exhaust emissions of oxides of nitrogen (NOx) as a
function of fuel temperature and EGR operations. It is found that the EGR has
lowered the exhaust NOx by more than half at any fuel temperatures. When the engine
is running without EGR, emissions of NOx are reduced as the fuel temperature
increases. However, Figure 6.19 also shows that when the engine was operated with
32% of EGR, the increase of fuel temperature from 30oC to 35oC resulted in an
increase of the emissions of NOx. The emissions of NOx is reduced when the fuel
temperature is increased to 40oC due to slightly lower peak pressure in the engine
cylinder as depicted in Figure 6.14. The trend of NOx formation is closely related to
maximum pressure in the combustion chamber. This suggests that the formation of
NOx is highly influenced by combustion pressure and temperature as discussed in
detail by many other investigators. The most popular theorem on the formation of
NOx by the Zeldovich mechanism also suggests that the production of NOx is
increased when high temperature combustion occurs (Williams 1985; Glassman
1987).
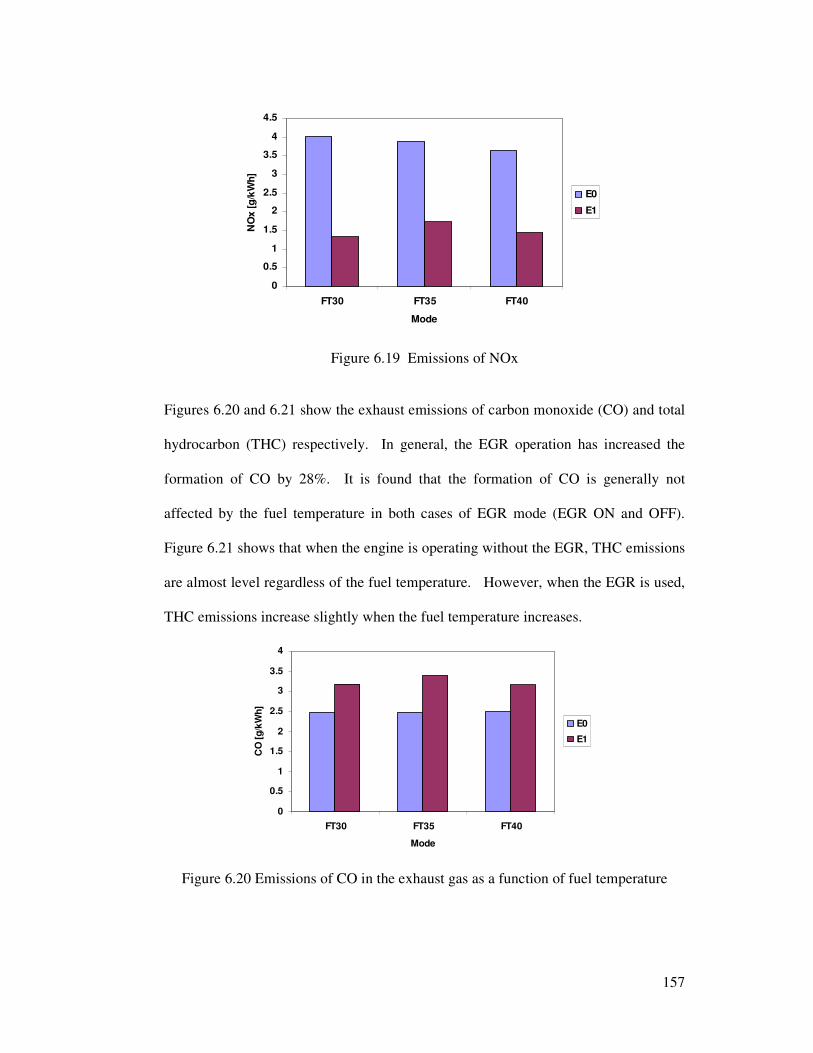
157
0
0.5
1
1.5
2
2.5
3
3.5
4
4.5
FT30 FT35 FT40
Mode
NO
x [
g/k
Wh
]
E0
E1
Figure 6.19 Emissions of NOx
Figures 6.20 and 6.21 show the exhaust emissions of carbon monoxide (CO) and total
hydrocarbon (THC) respectively. In general, the EGR operation has increased the
formation of CO by 28%. It is found that the formation of CO is generally not
affected by the fuel temperature in both cases of EGR mode (EGR ON and OFF).
Figure 6.21 shows that when the engine is operating without the EGR, THC emissions
are almost level regardless of the fuel temperature. However, when the EGR is used,
THC emissions increase slightly when the fuel temperature increases.
0
0.5
1
1.5
2
2.5
3
3.5
4
FT30 FT35 FT40
Mode
CO
[g
/kW
h]
E0
E1
Figure 6.20 Emissions of CO in the exhaust gas as a function of fuel temperature
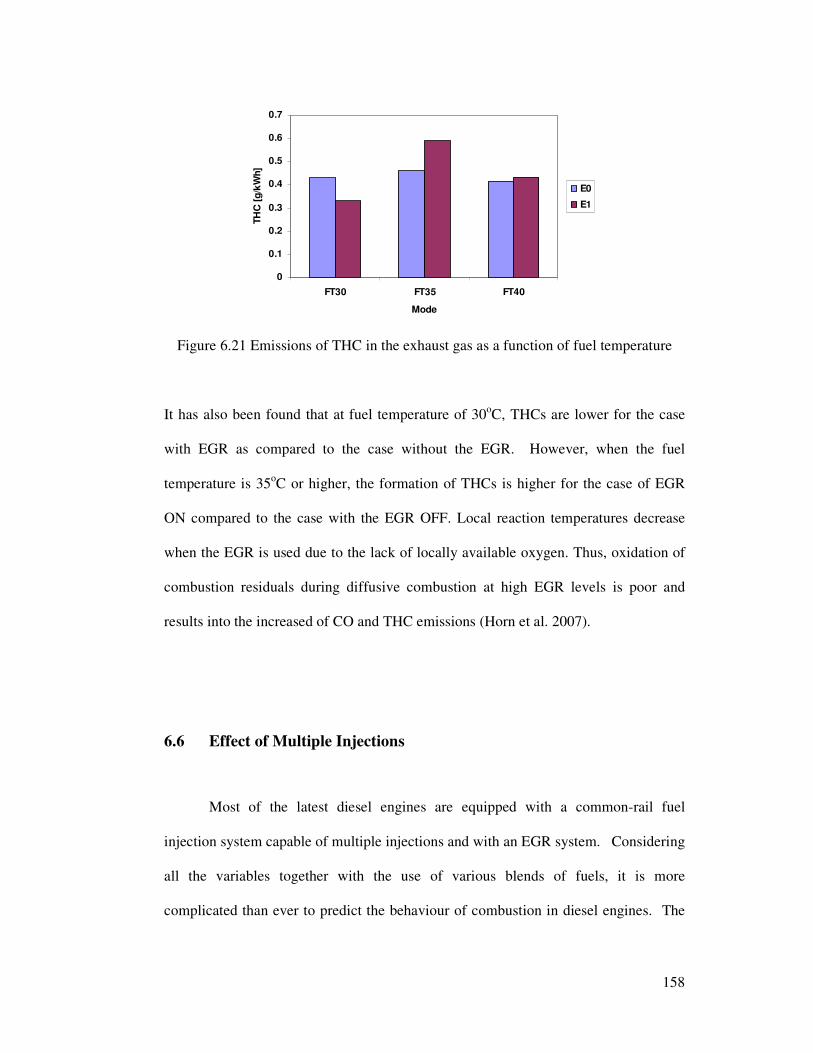
158
0
0.1
0.2
0.3
0.4
0.5
0.6
0.7
FT30 FT35 FT40
Mode
TH
C [
g/k
Wh]
E0
E1
Figure 6.21 Emissions of THC in the exhaust gas as a function of fuel temperature
It has also been found that at fuel temperature of 30oC, THCs are lower for the case
with EGR as compared to the case without the EGR. However, when the fuel
temperature is 35oC or higher, the formation of THCs is higher for the case of EGR
ON compared to the case with the EGR OFF. Local reaction temperatures decrease
when the EGR is used due to the lack of locally available oxygen. Thus, oxidation of
combustion residuals during diffusive combustion at high EGR levels is poor and
results into the increased of CO and THC emissions (Horn et al. 2007).
6.6 Effect of Multiple Injections
Most of the latest diesel engines are equipped with a common-rail fuel
injection system capable of multiple injections and with an EGR system. Considering
all the variables together with the use of various blends of fuels, it is more
complicated than ever to predict the behaviour of combustion in diesel engines. The
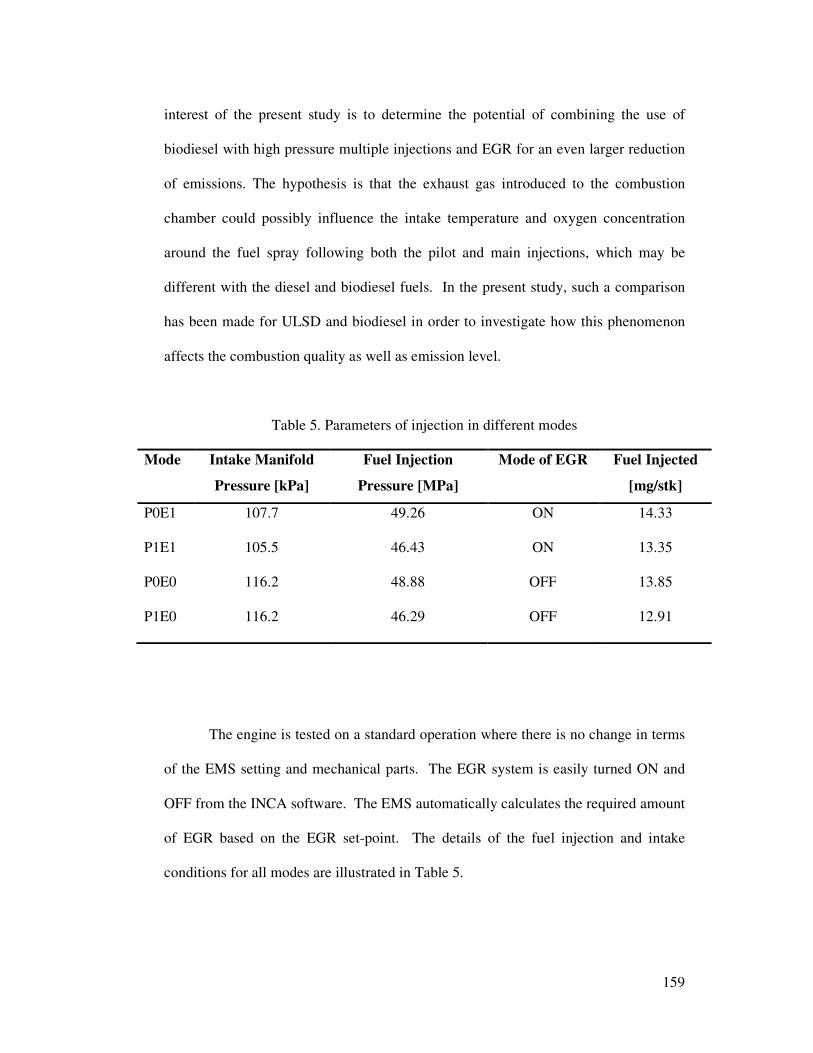
159
interest of the present study is to determine the potential of combining the use of
biodiesel with high pressure multiple injections and EGR for an even larger reduction
of emissions. The hypothesis is that the exhaust gas introduced to the combustion
chamber could possibly influence the intake temperature and oxygen concentration
around the fuel spray following both the pilot and main injections, which may be
different with the diesel and biodiesel fuels. In the present study, such a comparison
has been made for ULSD and biodiesel in order to investigate how this phenomenon
affects the combustion quality as well as emission level.
Table 5. Parameters of injection in different modes
Mode Intake Manifold
Pressure [kPa]
Fuel Injection
Pressure [MPa]
Mode of EGR Fuel Injected
[mg/stk]
P0E1 107.7 49.26 ON 14.33
P1E1 105.5 46.43 ON 13.35
P0E0 116.2 48.88 OFF 13.85
P1E0 116.2 46.29 OFF 12.91
The engine is tested on a standard operation where there is no change in terms
of the EMS setting and mechanical parts. The EGR system is easily turned ON and
OFF from the INCA software. The EMS automatically calculates the required amount
of EGR based on the EGR set-point. The details of the fuel injection and intake
conditions for all modes are illustrated in Table 5.
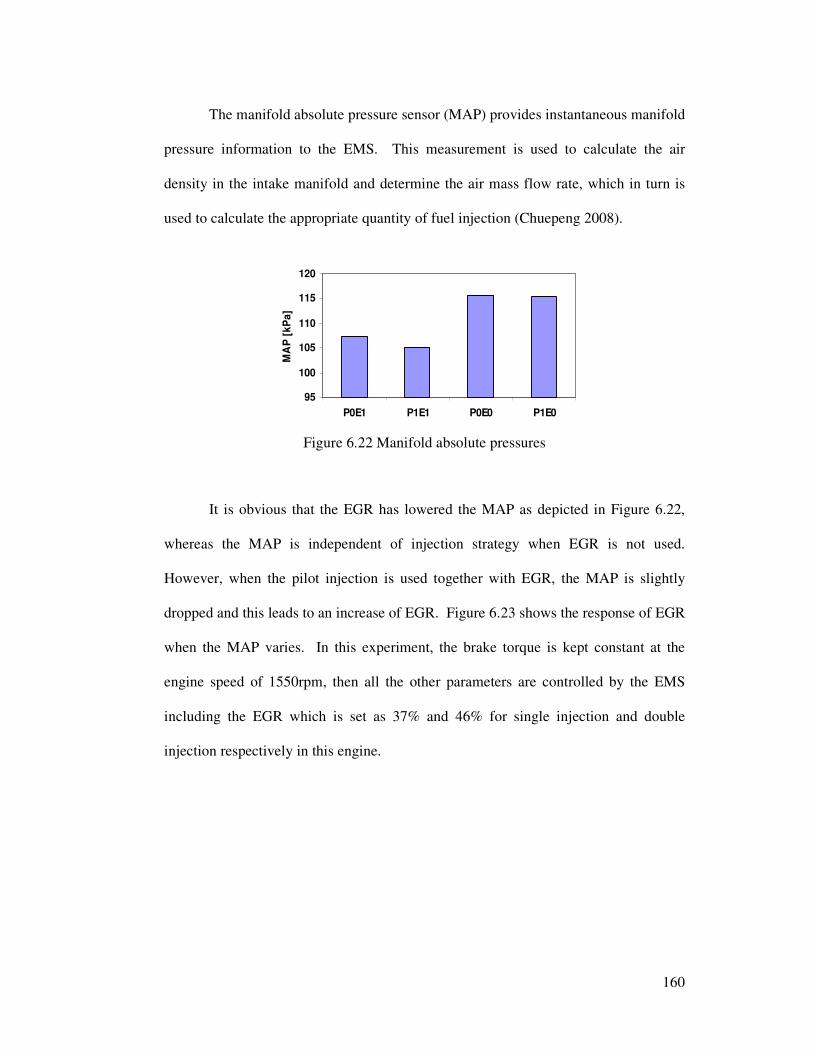
160
The manifold absolute pressure sensor (MAP) provides instantaneous manifold
pressure information to the EMS. This measurement is used to calculate the air
density in the intake manifold and determine the air mass flow rate, which in turn is
used to calculate the appropriate quantity of fuel injection (Chuepeng 2008).
95
100
105
110
115
120
P0E1 P1E1 P0E0 P1E0
MA
P [
kP
a]
Figure 6.22 Manifold absolute pressures
It is obvious that the EGR has lowered the MAP as depicted in Figure 6.22,
whereas the MAP is independent of injection strategy when EGR is not used.
However, when the pilot injection is used together with EGR, the MAP is slightly
dropped and this leads to an increase of EGR. Figure 6.23 shows the response of EGR
when the MAP varies. In this experiment, the brake torque is kept constant at the
engine speed of 1550rpm, then all the other parameters are controlled by the EMS
including the EGR which is set as 37% and 46% for single injection and double
injection respectively in this engine.
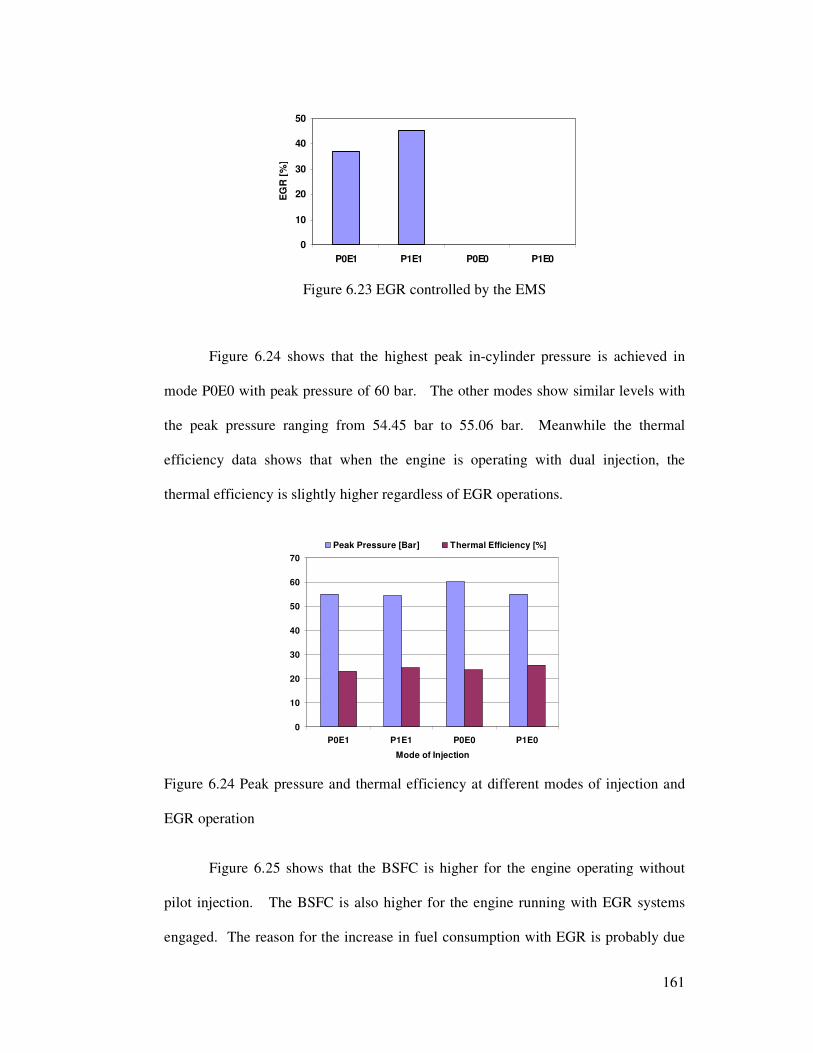
161
0
10
20
30
40
50
P0E1 P1E1 P0E0 P1E0
EG
R [
%]
Figure 6.23 EGR controlled by the EMS
Figure 6.24 shows that the highest peak in-cylinder pressure is achieved in
mode P0E0 with peak pressure of 60 bar. The other modes show similar levels with
the peak pressure ranging from 54.45 bar to 55.06 bar. Meanwhile the thermal
efficiency data shows that when the engine is operating with dual injection, the
thermal efficiency is slightly higher regardless of EGR operations.
0
10
20
30
40
50
60
70
P0E1 P1E1 P0E0 P1E0
Mode of Injection
Peak Pressure [Bar] Thermal Efficiency [%]
Figure 6.24 Peak pressure and thermal efficiency at different modes of injection and
EGR operation
Figure 6.25 shows that the BSFC is higher for the engine operating without
pilot injection. The BSFC is also higher for the engine running with EGR systems
engaged. The reason for the increase in fuel consumption with EGR is probably due
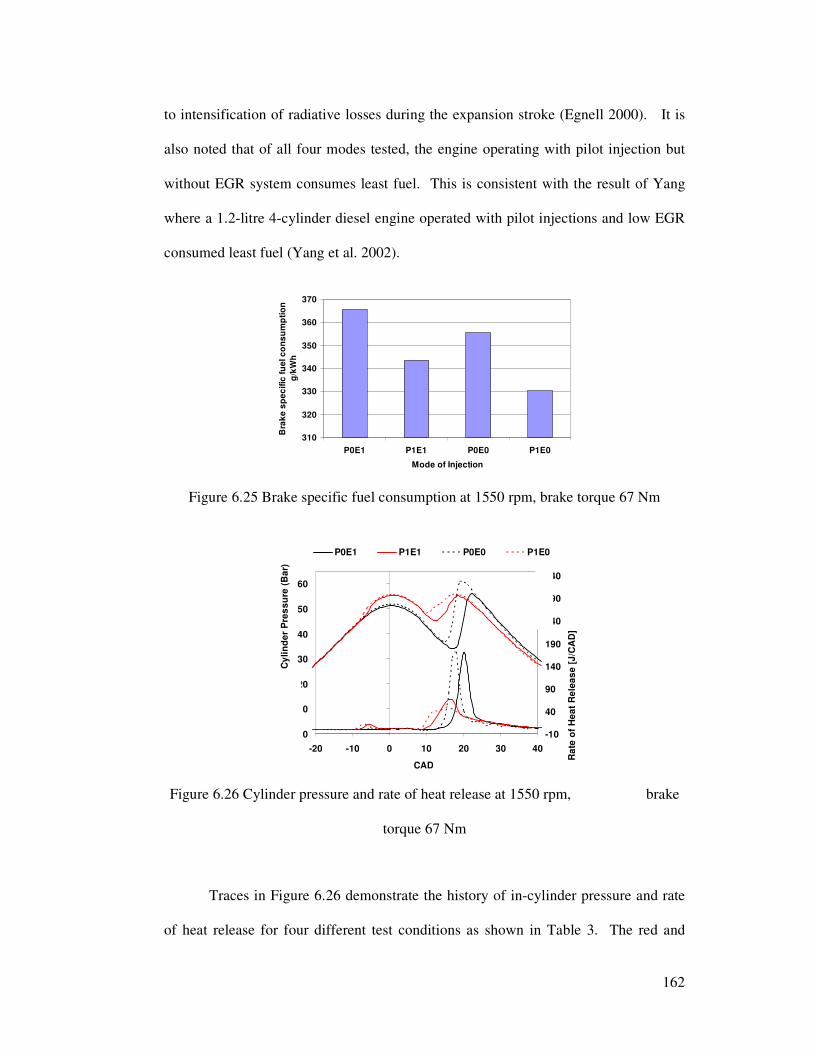
162
to intensification of radiative losses during the expansion stroke (Egnell 2000). It is
also noted that of all four modes tested, the engine operating with pilot injection but
without EGR system consumes least fuel. This is consistent with the result of Yang
where a 1.2-litre 4-cylinder diesel engine operated with pilot injections and low EGR
consumed least fuel (Yang et al. 2002).
310
320
330
340
350
360
370
P0E1 P1E1 P0E0 P1E0
Mode of Injection
Bra
ke
sp
ec
ific
fu
el c
on
su
mp
tio
n
g/k
Wh
Figure 6.25 Brake specific fuel consumption at 1550 rpm, brake torque 67 Nm
0
10
20
30
40
50
60
-20 -10 0 10 20 30 40
CAD
Cy
lin
de
r P
res
su
re (
Ba
r)
-10
40
90
140
190
240
290
340R
ate
of
He
at
Re
lea
se
[J
/CA
D]
P0E1 P1E1 P0E0 P1E0
Figure 6.26 Cylinder pressure and rate of heat release at 1550 rpm, brake
torque 67 Nm
Traces in Figure 6.26 demonstrate the history of in-cylinder pressure and rate
of heat release for four different test conditions as shown in Table 3. The red and
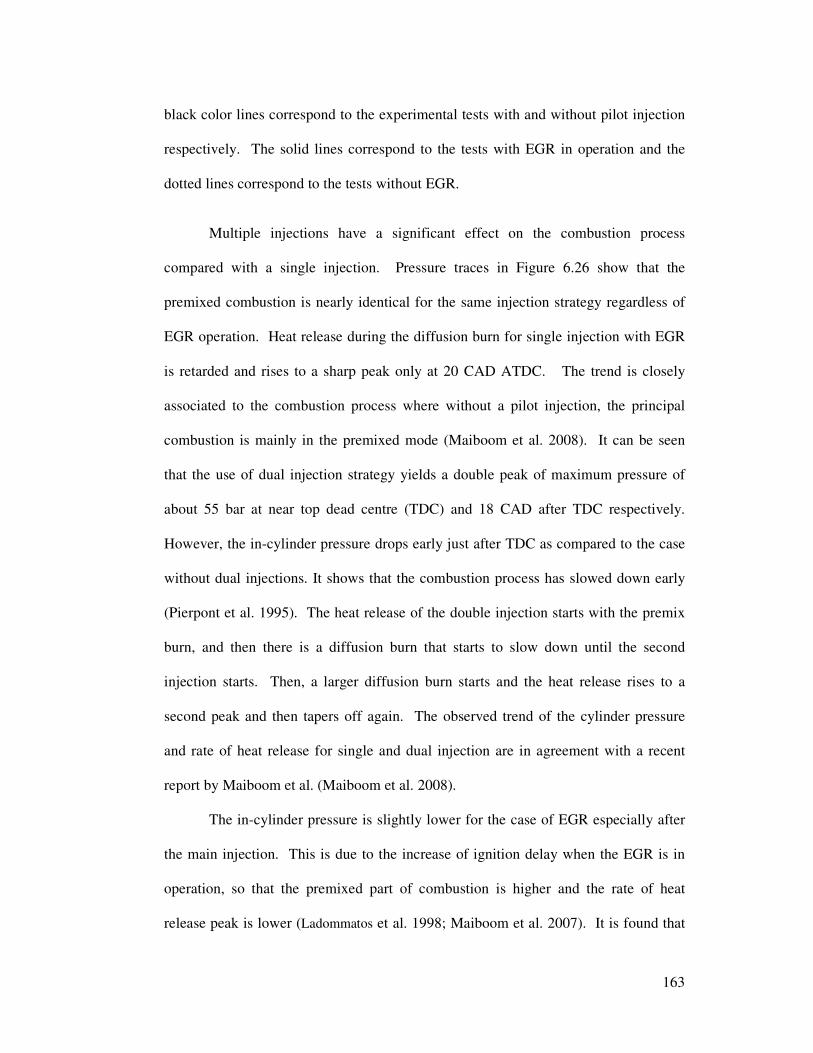
163
black color lines correspond to the experimental tests with and without pilot injection
respectively. The solid lines correspond to the tests with EGR in operation and the
dotted lines correspond to the tests without EGR.
Multiple injections have a significant effect on the combustion process
compared with a single injection. Pressure traces in Figure 6.26 show that the
premixed combustion is nearly identical for the same injection strategy regardless of
EGR operation. Heat release during the diffusion burn for single injection with EGR
is retarded and rises to a sharp peak only at 20 CAD ATDC. The trend is closely
associated to the combustion process where without a pilot injection, the principal
combustion is mainly in the premixed mode (Maiboom et al. 2008). It can be seen
that the use of dual injection strategy yields a double peak of maximum pressure of
about 55 bar at near top dead centre (TDC) and 18 CAD after TDC respectively.
However, the in-cylinder pressure drops early just after TDC as compared to the case
without dual injections. It shows that the combustion process has slowed down early
(Pierpont et al. 1995). The heat release of the double injection starts with the premix
burn, and then there is a diffusion burn that starts to slow down until the second
injection starts. Then, a larger diffusion burn starts and the heat release rises to a
second peak and then tapers off again. The observed trend of the cylinder pressure
and rate of heat release for single and dual injection are in agreement with a recent
report by Maiboom et al. (Maiboom et al. 2008).
The in-cylinder pressure is slightly lower for the case of EGR especially after
the main injection. This is due to the increase of ignition delay when the EGR is in
operation, so that the premixed part of combustion is higher and the rate of heat
release peak is lower (Ladommatos et al. 1998; Maiboom et al. 2007). It is found that
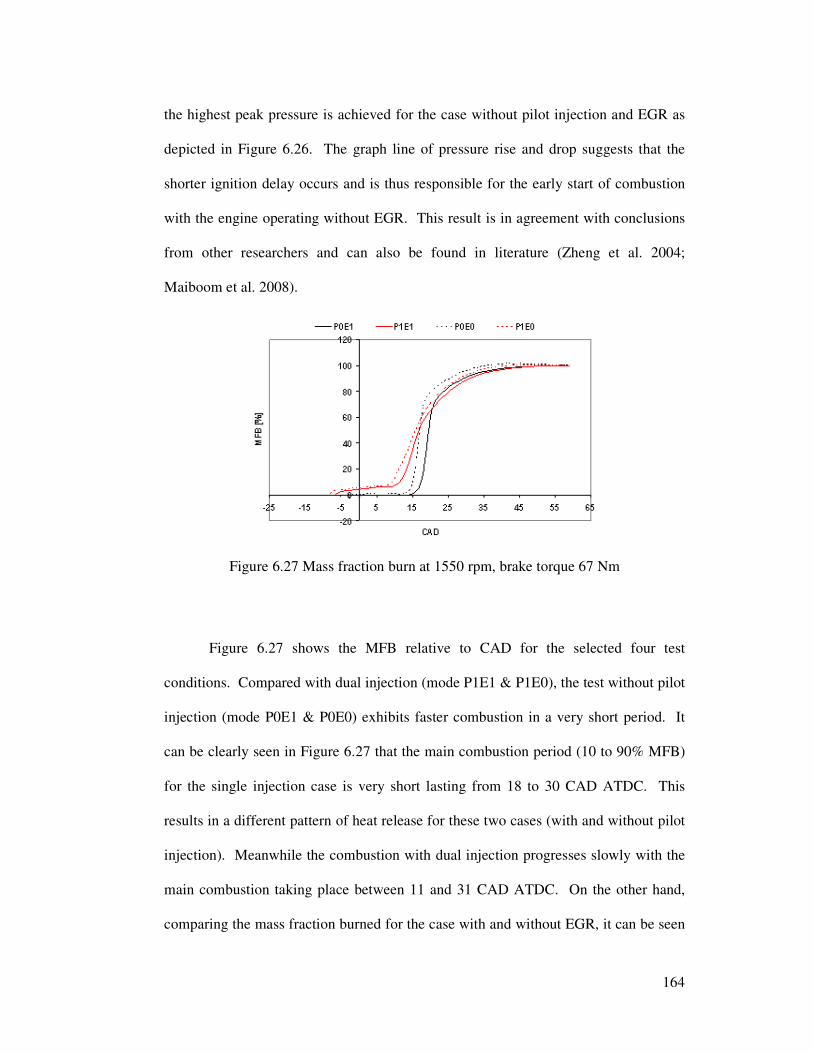
164
the highest peak pressure is achieved for the case without pilot injection and EGR as
depicted in Figure 6.26. The graph line of pressure rise and drop suggests that the
shorter ignition delay occurs and is thus responsible for the early start of combustion
with the engine operating without EGR. This result is in agreement with conclusions
from other researchers and can also be found in literature (Zheng et al. 2004;
Maiboom et al. 2008).
Figure 6.27 Mass fraction burn at 1550 rpm, brake torque 67 Nm
Figure 6.27 shows the MFB relative to CAD for the selected four test
conditions. Compared with dual injection (mode P1E1 & P1E0), the test without pilot
injection (mode P0E1 & P0E0) exhibits faster combustion in a very short period. It
can be clearly seen in Figure 6.27 that the main combustion period (10 to 90% MFB)
for the single injection case is very short lasting from 18 to 30 CAD ATDC. This
results in a different pattern of heat release for these two cases (with and without pilot
injection). Meanwhile the combustion with dual injection progresses slowly with the
main combustion taking place between 11 and 31 CAD ATDC. On the other hand,
comparing the mass fraction burned for the case with and without EGR, it can be seen
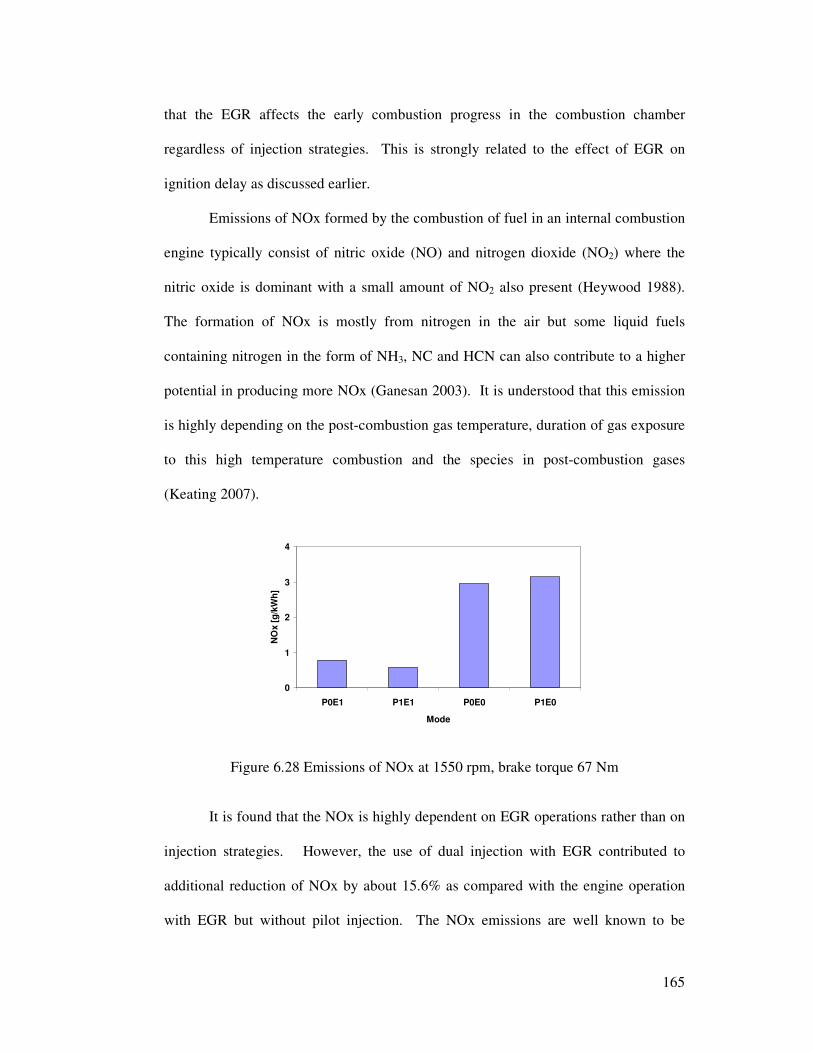
165
that the EGR affects the early combustion progress in the combustion chamber
regardless of injection strategies. This is strongly related to the effect of EGR on
ignition delay as discussed earlier.
Emissions of NOx formed by the combustion of fuel in an internal combustion
engine typically consist of nitric oxide (NO) and nitrogen dioxide (NO2) where the
nitric oxide is dominant with a small amount of NO2 also present (Heywood 1988).
The formation of NOx is mostly from nitrogen in the air but some liquid fuels
containing nitrogen in the form of NH3, NC and HCN can also contribute to a higher
potential in producing more NOx (Ganesan 2003). It is understood that this emission
is highly depending on the post-combustion gas temperature, duration of gas exposure
to this high temperature combustion and the species in post-combustion gases
(Keating 2007).
0
1
2
3
4
P0E1 P1E1 P0E0 P1E0
Mode
NO
x [
g/k
Wh
]
Figure 6.28 Emissions of NOx at 1550 rpm, brake torque 67 Nm
It is found that the NOx is highly dependent on EGR operations rather than on
injection strategies. However, the use of dual injection with EGR contributed to
additional reduction of NOx by about 15.6% as compared with the engine operation
with EGR but without pilot injection. The NOx emissions are well known to be
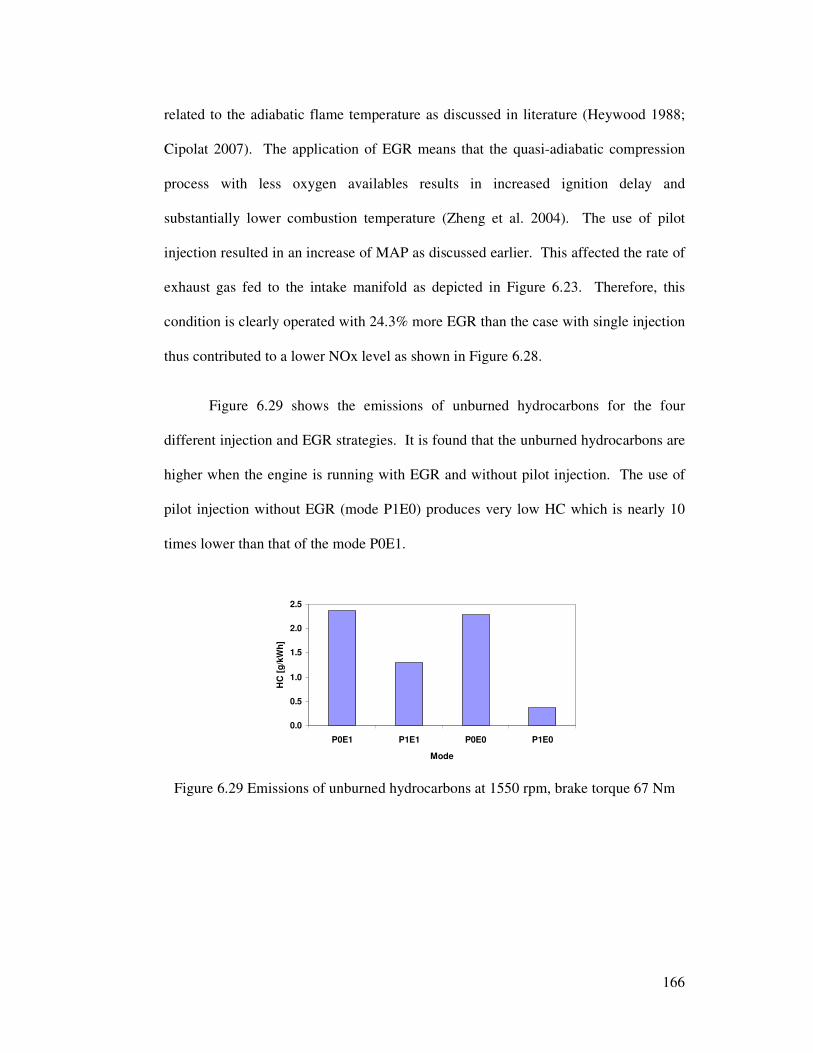
166
related to the adiabatic flame temperature as discussed in literature (Heywood 1988;
Cipolat 2007). The application of EGR means that the quasi-adiabatic compression
process with less oxygen availables results in increased ignition delay and
substantially lower combustion temperature (Zheng et al. 2004). The use of pilot
injection resulted in an increase of MAP as discussed earlier. This affected the rate of
exhaust gas fed to the intake manifold as depicted in Figure 6.23. Therefore, this
condition is clearly operated with 24.3% more EGR than the case with single injection
thus contributed to a lower NOx level as shown in Figure 6.28.
Figure 6.29 shows the emissions of unburned hydrocarbons for the four
different injection and EGR strategies. It is found that the unburned hydrocarbons are
higher when the engine is running with EGR and without pilot injection. The use of
pilot injection without EGR (mode P1E0) produces very low HC which is nearly 10
times lower than that of the mode P0E1.
0.0
0.5
1.0
1.5
2.0
2.5
P0E1 P1E1 P0E0 P1E0
Mode
HC
[g
/kW
h]
Figure 6.29 Emissions of unburned hydrocarbons at 1550 rpm, brake torque 67 Nm
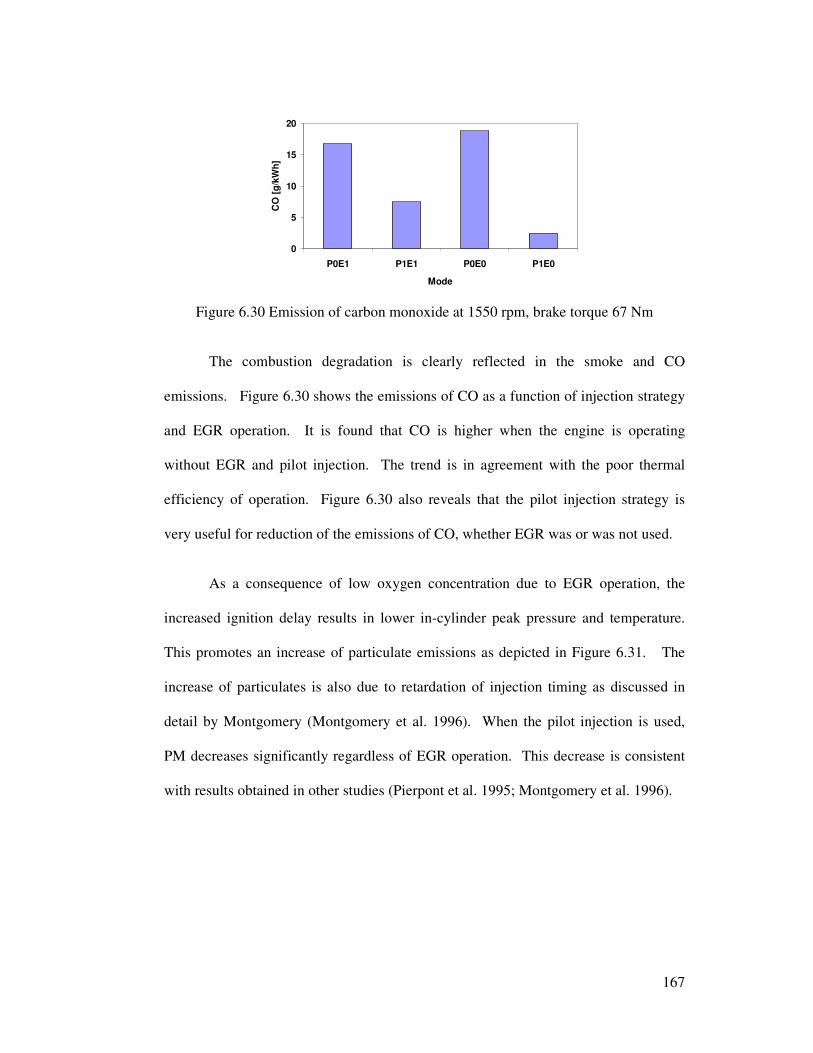
167
0
5
10
15
20
P0E1 P1E1 P0E0 P1E0
ModeC
O [
g/k
Wh
]
Figure 6.30 Emission of carbon monoxide at 1550 rpm, brake torque 67 Nm
The combustion degradation is clearly reflected in the smoke and CO
emissions. Figure 6.30 shows the emissions of CO as a function of injection strategy
and EGR operation. It is found that CO is higher when the engine is operating
without EGR and pilot injection. The trend is in agreement with the poor thermal
efficiency of operation. Figure 6.30 also reveals that the pilot injection strategy is
very useful for reduction of the emissions of CO, whether EGR was or was not used.
As a consequence of low oxygen concentration due to EGR operation, the
increased ignition delay results in lower in-cylinder peak pressure and temperature.
This promotes an increase of particulate emissions as depicted in Figure 6.31. The
increase of particulates is also due to retardation of injection timing as discussed in
detail by Montgomery (Montgomery et al. 1996). When the pilot injection is used,
PM decreases significantly regardless of EGR operation. This decrease is consistent
with results obtained in other studies (Pierpont et al. 1995; Montgomery et al. 1996).
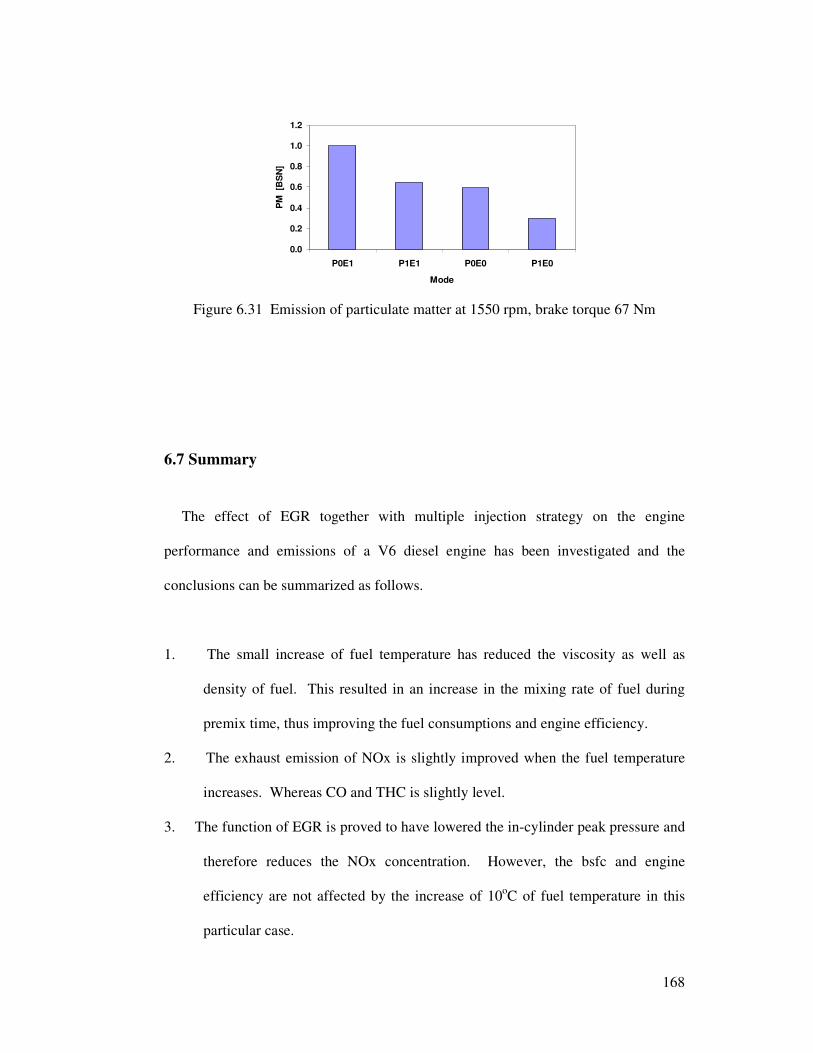
168
0.0
0.2
0.4
0.6
0.8
1.0
1.2
P0E1 P1E1 P0E0 P1E0
ModeP
M [B
SN
]
Figure 6.31 Emission of particulate matter at 1550 rpm, brake torque 67 Nm
6.7 Summary
The effect of EGR together with multiple injection strategy on the engine
performance and emissions of a V6 diesel engine has been investigated and the
conclusions can be summarized as follows.
1. The small increase of fuel temperature has reduced the viscosity as well as
density of fuel. This resulted in an increase in the mixing rate of fuel during
premix time, thus improving the fuel consumptions and engine efficiency.
2. The exhaust emission of NOx is slightly improved when the fuel temperature
increases. Whereas CO and THC is slightly level.
3. The function of EGR is proved to have lowered the in-cylinder peak pressure and
therefore reduces the NOx concentration. However, the bsfc and engine
efficiency are not affected by the increase of 10oC of fuel temperature in this
particular case.
169
4. The application of dual injection strategy without the EGR shows a significant
reduction of hydrocarbon emissions but it has major drawbacks of producing
higher NOx.
5. The experimental results also reveal that the pilot injection lowered the peak
pressure and brake specific fuel consumption regardless of EGR operations.
6. The effect of EGR on reducing NOx emissions is more significant compared
with the effect of multiple injection strategies.
7. The combination of EGR and dual injection strategies produces even better
reductions in emissions, especially of NOx and particulate matter.
8. Engine operation on biodiesel produced higher in-cylinder pressures thus
promoted production of higher NOx emissions but lower emissions of unburned
hydrocarbons, carbon monoxide and particulate matter.
170
CHAPTER 7
EFFECT OF AIR INTAKE SYSTEMS TO THE ENGINE
PERFORMANCE AND EMISSIONS
This chapter presents the study of effect of air intake characteristics such as
temperature and pressure drop on the engine performance and emissions of a diesel
engine. The experimental studies conducted on the 2.7L V6 engine provided by JLR.
The engine was operated without EGR and fuelled by 100% RME and ULSD for a
comparison, under two different brake torque conditions respectively.
7.1 Effect of Boost Pressure
The pressure drop across the air intake system is known to have a significant influence
on the indicated power of the IC engine. The pressure drop is created due to the
suction generated by the descending piston in the case of a naturally aspirated engine.
The pressure drop along the intake system is very dependant on engine speed and
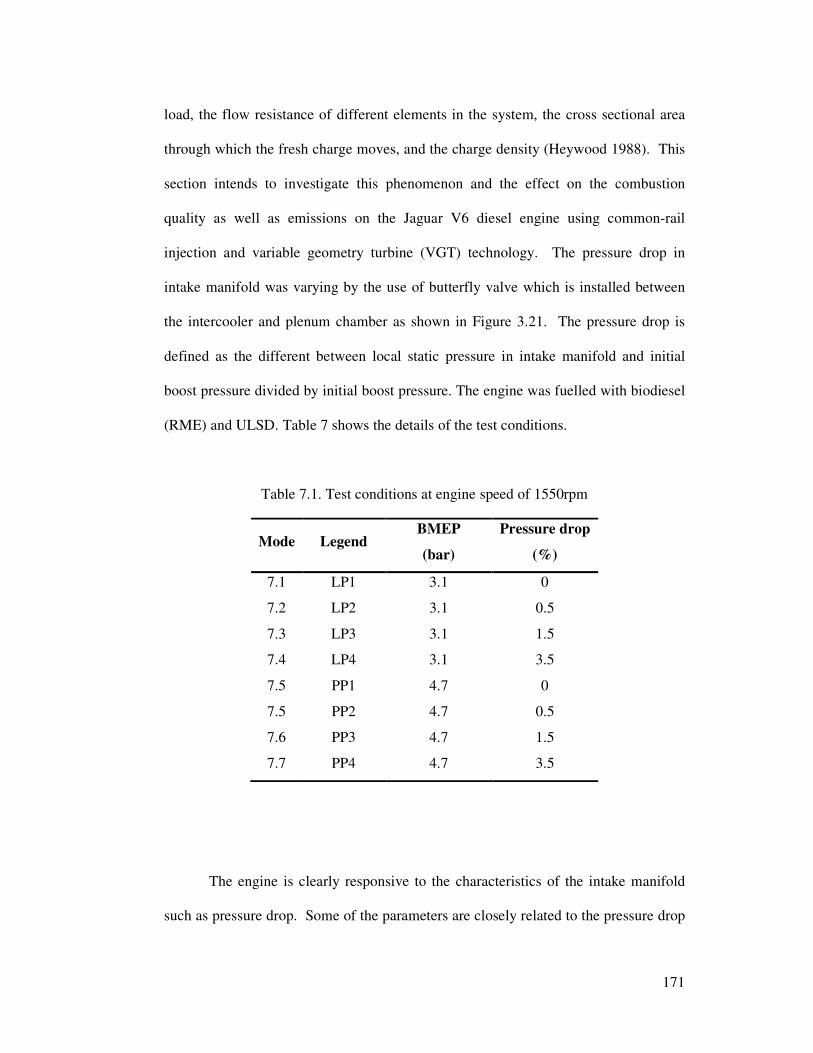
171
load, the flow resistance of different elements in the system, the cross sectional area
through which the fresh charge moves, and the charge density (Heywood 1988). This
section intends to investigate this phenomenon and the effect on the combustion
quality as well as emissions on the Jaguar V6 diesel engine using common-rail
injection and variable geometry turbine (VGT) technology. The pressure drop in
intake manifold was varying by the use of butterfly valve which is installed between
the intercooler and plenum chamber as shown in Figure 3.21. The pressure drop is
defined as the different between local static pressure in intake manifold and initial
boost pressure divided by initial boost pressure. The engine was fuelled with biodiesel
(RME) and ULSD. Table 7 shows the details of the test conditions.
Table 7.1. Test conditions at engine speed of 1550rpm
Mode Legend BMEP
(bar)
Pressure drop
(%)
7.1 LP1 3.1 0
7.2 LP2 3.1 0.5
7.3 LP3 3.1 1.5
7.4 LP4 3.1 3.5
7.5 PP1 4.7 0
7.5 PP2 4.7 0.5
7.6 PP3 4.7 1.5
7.7 PP4 4.7 3.5
The engine is clearly responsive to the characteristics of the intake manifold
such as pressure drop. Some of the parameters are closely related to the pressure drop
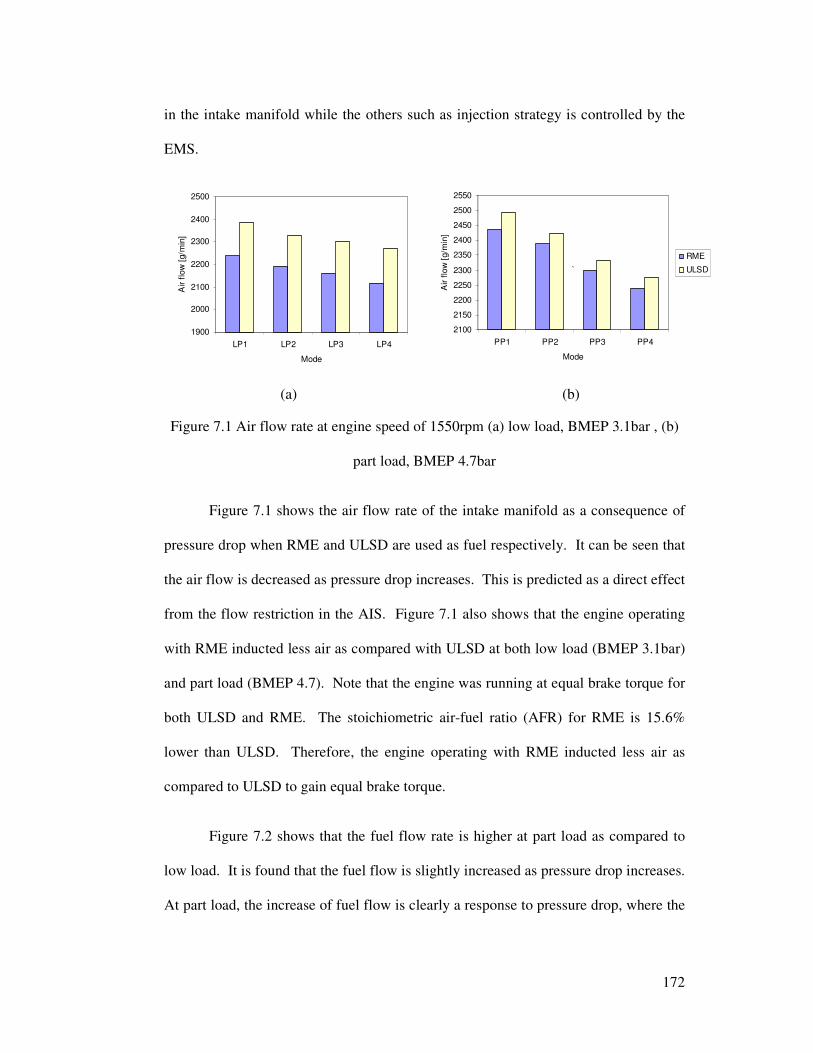
172
in the intake manifold while the others such as injection strategy is controlled by the
EMS.
1900
2000
2100
2200
2300
2400
2500
LP1 LP2 LP3 LP4
Mode
Air f
low
[g/m
in]
2100
2150
2200
2250
2300
2350
2400
2450
2500
2550
PP1 PP2 PP3 PP4
Mode
Air f
low
[g/m
in]
RME
ULSD`
(a) (b)
Figure 7.1 Air flow rate at engine speed of 1550rpm (a) low load, BMEP 3.1bar , (b)
part load, BMEP 4.7bar
Figure 7.1 shows the air flow rate of the intake manifold as a consequence of
pressure drop when RME and ULSD are used as fuel respectively. It can be seen that
the air flow is decreased as pressure drop increases. This is predicted as a direct effect
from the flow restriction in the AIS. Figure 7.1 also shows that the engine operating
with RME inducted less air as compared with ULSD at both low load (BMEP 3.1bar)
and part load (BMEP 4.7). Note that the engine was running at equal brake torque for
both ULSD and RME. The stoichiometric air-fuel ratio (AFR) for RME is 15.6%
lower than ULSD. Therefore, the engine operating with RME inducted less air as
compared to ULSD to gain equal brake torque.
Figure 7.2 shows that the fuel flow rate is higher at part load as compared to
low load. It is found that the fuel flow is slightly increased as pressure drop increases.
At part load, the increase of fuel flow is clearly a response to pressure drop, where the
173
fuel flow rate is rapidly increased as pressure drop increases. At low load, the
injection of RME is more than ULSD by 11.5% (mass). Figure 7.2 also revealed that
at part load, the injection of RME is more than ULSD by 12.5%. This is the
consequence of low calorific value of RME which is slightly lower so more fuel is
required to gain similar brake torque as for ULSD.
56
58
60
62
64
66
68
70
LP1 LP2 LP3 LP4
Mode
Fuel flow
[g/m
in]
74
76
78
80
82
84
86
88
90
92
94
PP1 PP2 PP3 PP4
Mode
Fuel flow
[g/m
in]
RME
ULSD
(a) (b)
Figure 7.2 Fuel flow rate at engine speed of 1550rpm, (a) low load, BMEP 3.1bar (b)
part load, BMEP 4.7bar
7.1.1 Engine Performance
Figure 7.3 presents the in-cylinder pressure for the combustion of ULSD and
RME with the increase of the pressure drop. The dotted lines represent the in-cylinder
pressure for RME while the straight lines represent ULSD. The in-cylinder pressure
data was retracted from cylinder number 5 of the engine operating at 4.7 Bar BMEP
and 1550 rpm. It is found that the in-cylinder pressure for the case of RME is higher
at all pressure drops. The pressure difference is clearly seen on RME and ULSD at
main fuel injections.
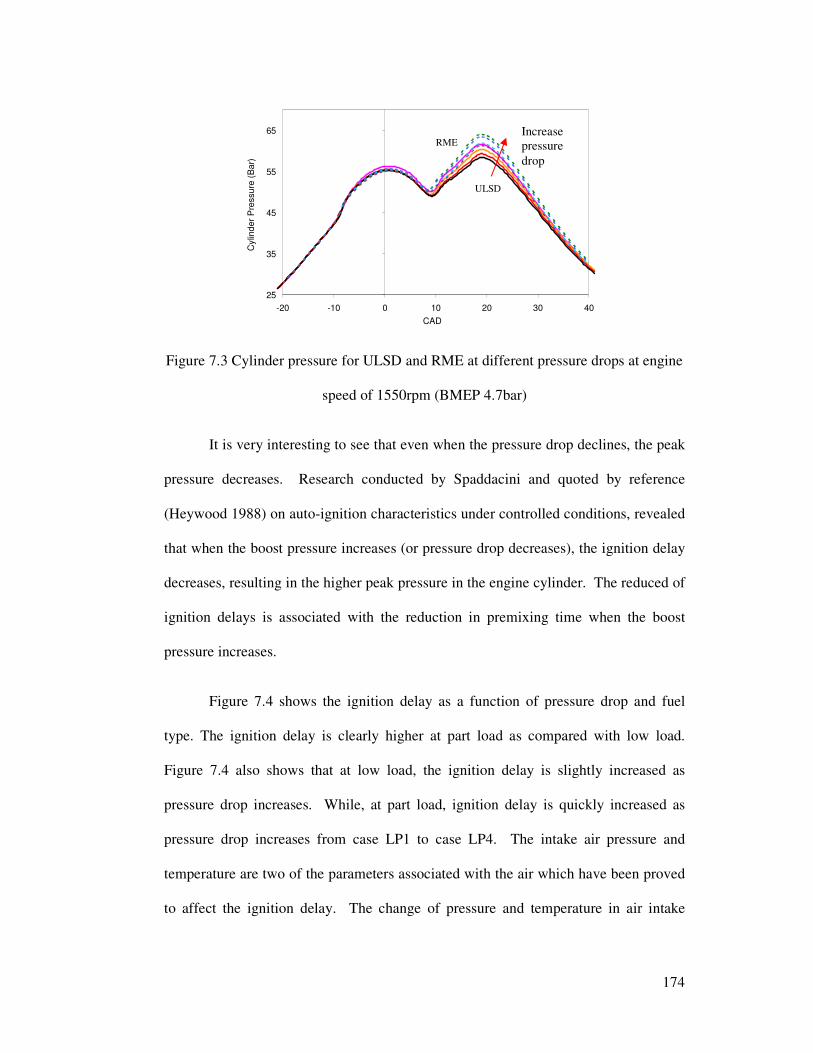
174
25
35
45
55
65
-20 -10 0 10 20 30 40
CAD
Cylin
de
r P
ressu
re (
Ba
r)
Figure 7.3 Cylinder pressure for ULSD and RME at different pressure drops at engine
speed of 1550rpm (BMEP 4.7bar)
It is very interesting to see that even when the pressure drop declines, the peak
pressure decreases. Research conducted by Spaddacini and quoted by reference
(Heywood 1988) on auto-ignition characteristics under controlled conditions, revealed
that when the boost pressure increases (or pressure drop decreases), the ignition delay
decreases, resulting in the higher peak pressure in the engine cylinder. The reduced of
ignition delays is associated with the reduction in premixing time when the boost
pressure increases.
Figure 7.4 shows the ignition delay as a function of pressure drop and fuel
type. The ignition delay is clearly higher at part load as compared with low load.
Figure 7.4 also shows that at low load, the ignition delay is slightly increased as
pressure drop increases. While, at part load, ignition delay is quickly increased as
pressure drop increases from case LP1 to case LP4. The intake air pressure and
temperature are two of the parameters associated with the air which have been proved
to affect the ignition delay. The change of pressure and temperature in air intake
Increase pressure drop
RME
ULSD
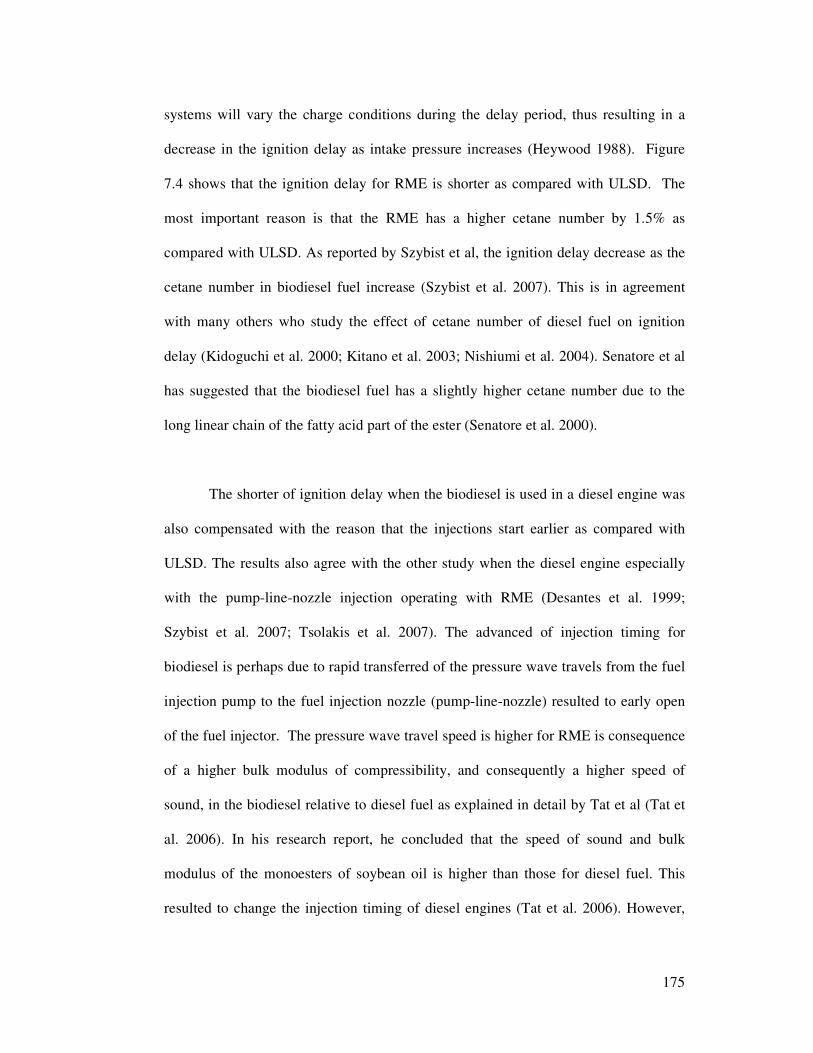
175
systems will vary the charge conditions during the delay period, thus resulting in a
decrease in the ignition delay as intake pressure increases (Heywood 1988). Figure
7.4 shows that the ignition delay for RME is shorter as compared with ULSD. The
most important reason is that the RME has a higher cetane number by 1.5% as
compared with ULSD. As reported by Szybist et al, the ignition delay decrease as the
cetane number in biodiesel fuel increase (Szybist et al. 2007). This is in agreement
with many others who study the effect of cetane number of diesel fuel on ignition
delay (Kidoguchi et al. 2000; Kitano et al. 2003; Nishiumi et al. 2004). Senatore et al
has suggested that the biodiesel fuel has a slightly higher cetane number due to the
long linear chain of the fatty acid part of the ester (Senatore et al. 2000).
The shorter of ignition delay when the biodiesel is used in a diesel engine was
also compensated with the reason that the injections start earlier as compared with
ULSD. The results also agree with the other study when the diesel engine especially
with the pump-line-nozzle injection operating with RME (Desantes et al. 1999;
Szybist et al. 2007; Tsolakis et al. 2007). The advanced of injection timing for
biodiesel is perhaps due to rapid transferred of the pressure wave travels from the fuel
injection pump to the fuel injection nozzle (pump-line-nozzle) resulted to early open
of the fuel injector. The pressure wave travel speed is higher for RME is consequence
of a higher bulk modulus of compressibility, and consequently a higher speed of
sound, in the biodiesel relative to diesel fuel as explained in detail by Tat et al (Tat et
al. 2006). In his research report, he concluded that the speed of sound and bulk
modulus of the monoesters of soybean oil is higher than those for diesel fuel. This
resulted to change the injection timing of diesel engines (Tat et al. 2006). However,
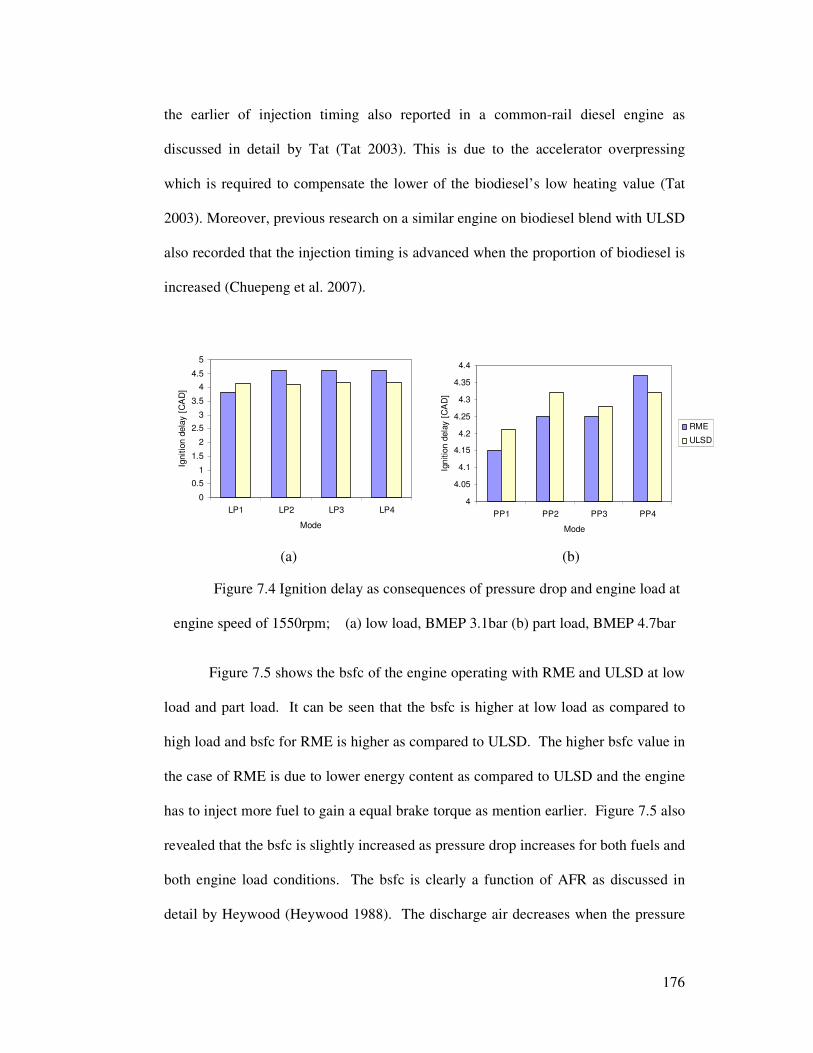
176
the earlier of injection timing also reported in a common-rail diesel engine as
discussed in detail by Tat (Tat 2003). This is due to the accelerator overpressing
which is required to compensate the lower of the biodiesel’s low heating value (Tat
2003). Moreover, previous research on a similar engine on biodiesel blend with ULSD
also recorded that the injection timing is advanced when the proportion of biodiesel is
increased (Chuepeng et al. 2007).
0
0.5
1
1.5
2
2.5
3
3.5
4
4.5
5
LP1 LP2 LP3 LP4
Mode
Ignitio
n d
ela
y [
CA
D]
4
4.05
4.1
4.15
4.2
4.25
4.3
4.35
4.4
PP1 PP2 PP3 PP4
Mode
Ignitio
n d
ela
y [
CA
D]
RME
ULSD
(a) (b)
Figure 7.4 Ignition delay as consequences of pressure drop and engine load at
engine speed of 1550rpm; (a) low load, BMEP 3.1bar (b) part load, BMEP 4.7bar
Figure 7.5 shows the bsfc of the engine operating with RME and ULSD at low
load and part load. It can be seen that the bsfc is higher at low load as compared to
high load and bsfc for RME is higher as compared to ULSD. The higher bsfc value in
the case of RME is due to lower energy content as compared to ULSD and the engine
has to inject more fuel to gain a equal brake torque as mention earlier. Figure 7.5 also
revealed that the bsfc is slightly increased as pressure drop increases for both fuels and
both engine load conditions. The bsfc is clearly a function of AFR as discussed in
detail by Heywood (Heywood 1988). The discharge air decreases when the pressure
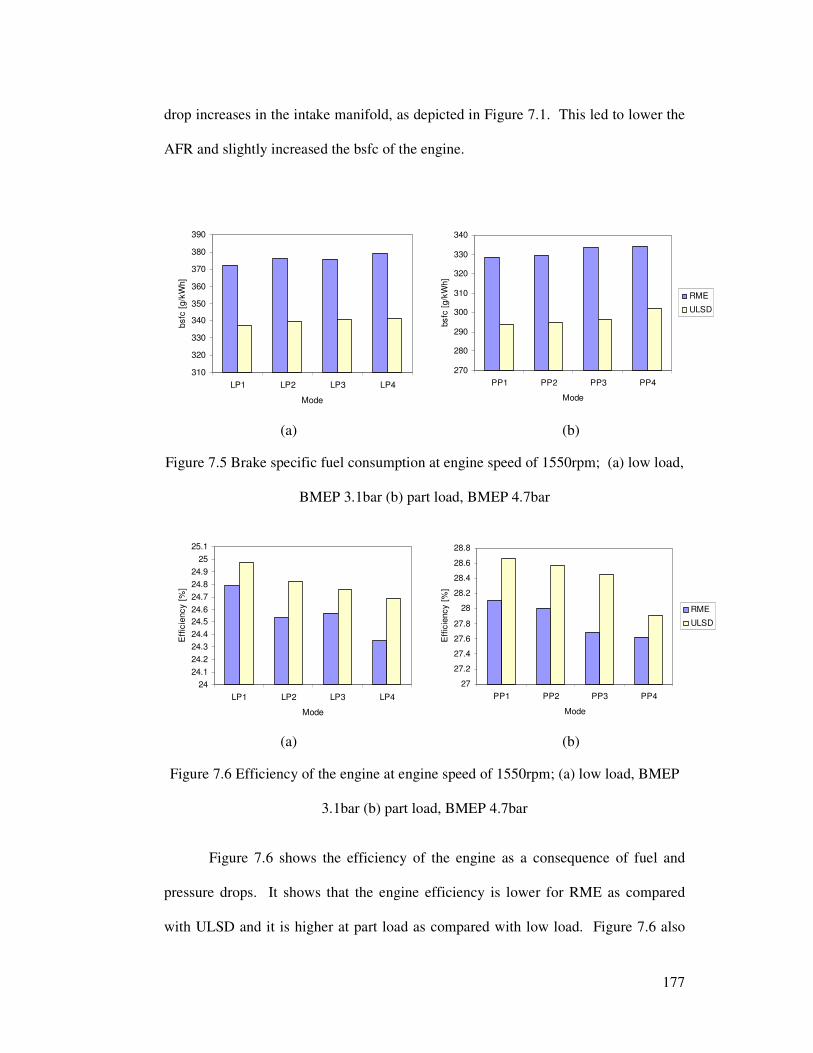
177
drop increases in the intake manifold, as depicted in Figure 7.1. This led to lower the
AFR and slightly increased the bsfc of the engine.
310
320
330
340
350
360
370
380
390
LP1 LP2 LP3 LP4
Mode
bsfc
[g/k
Wh]
270
280
290
300
310
320
330
340
PP1 PP2 PP3 PP4
Mode
bsfc
[g/k
Wh]
RME
ULSD
(a) (b)
Figure 7.5 Brake specific fuel consumption at engine speed of 1550rpm; (a) low load,
BMEP 3.1bar (b) part load, BMEP 4.7bar
24
24.1
24.2
24.3
24.4
24.5
24.6
24.7
24.8
24.9
25
25.1
LP1 LP2 LP3 LP4
Mode
Eff
icie
ncy [
%]
27
27.2
27.4
27.6
27.8
28
28.2
28.4
28.6
28.8
PP1 PP2 PP3 PP4
Mode
Eff
icie
ncy [
%]
RME
ULSD
(a) (b)
Figure 7.6 Efficiency of the engine at engine speed of 1550rpm; (a) low load, BMEP
3.1bar (b) part load, BMEP 4.7bar
Figure 7.6 shows the efficiency of the engine as a consequence of fuel and
pressure drops. It shows that the engine efficiency is lower for RME as compared
with ULSD and it is higher at part load as compared with low load. Figure 7.6 also
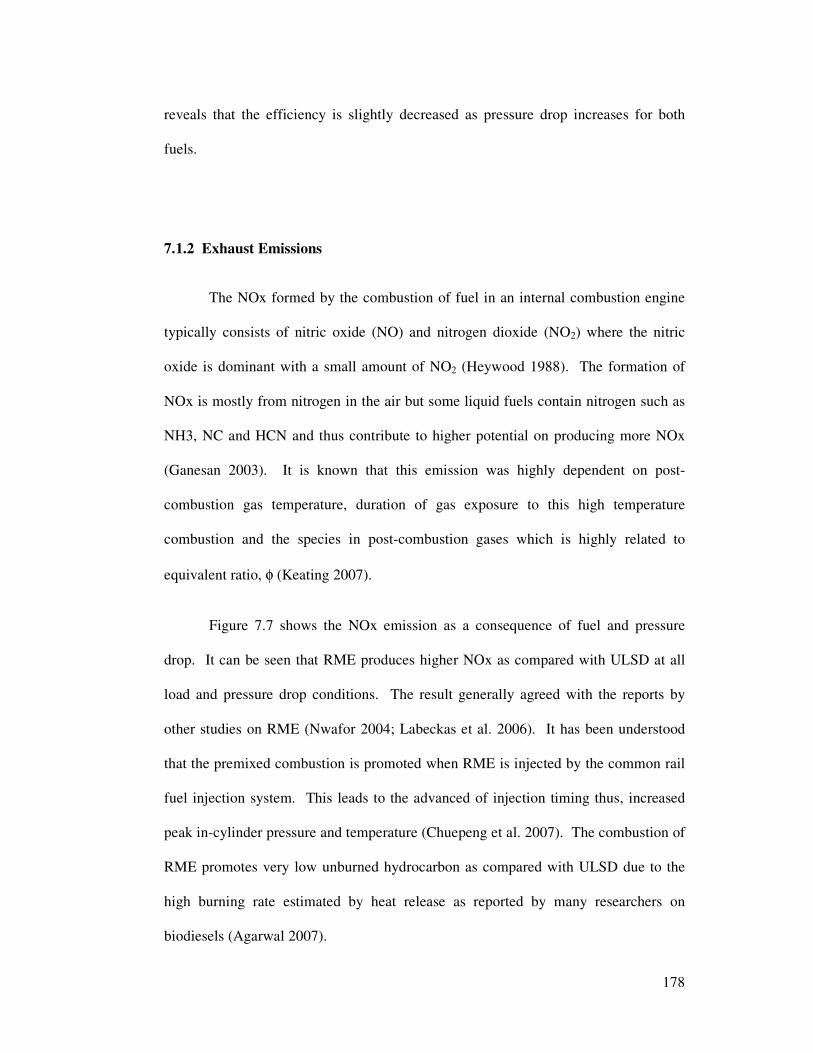
178
reveals that the efficiency is slightly decreased as pressure drop increases for both
fuels.
7.1.2 Exhaust Emissions
The NOx formed by the combustion of fuel in an internal combustion engine
typically consists of nitric oxide (NO) and nitrogen dioxide (NO2) where the nitric
oxide is dominant with a small amount of NO2 (Heywood 1988). The formation of
NOx is mostly from nitrogen in the air but some liquid fuels contain nitrogen such as
NH3, NC and HCN and thus contribute to higher potential on producing more NOx
(Ganesan 2003). It is known that this emission was highly dependent on post-
combustion gas temperature, duration of gas exposure to this high temperature
combustion and the species in post-combustion gases which is highly related to
equivalent ratio, φ (Keating 2007).
Figure 7.7 shows the NOx emission as a consequence of fuel and pressure
drop. It can be seen that RME produces higher NOx as compared with ULSD at all
load and pressure drop conditions. The result generally agreed with the reports by
other studies on RME (Nwafor 2004; Labeckas et al. 2006). It has been understood
that the premixed combustion is promoted when RME is injected by the common rail
fuel injection system. This leads to the advanced of injection timing thus, increased
peak in-cylinder pressure and temperature (Chuepeng et al. 2007). The combustion of
RME promotes very low unburned hydrocarbon as compared with ULSD due to the
high burning rate estimated by heat release as reported by many researchers on
biodiesels (Agarwal 2007).
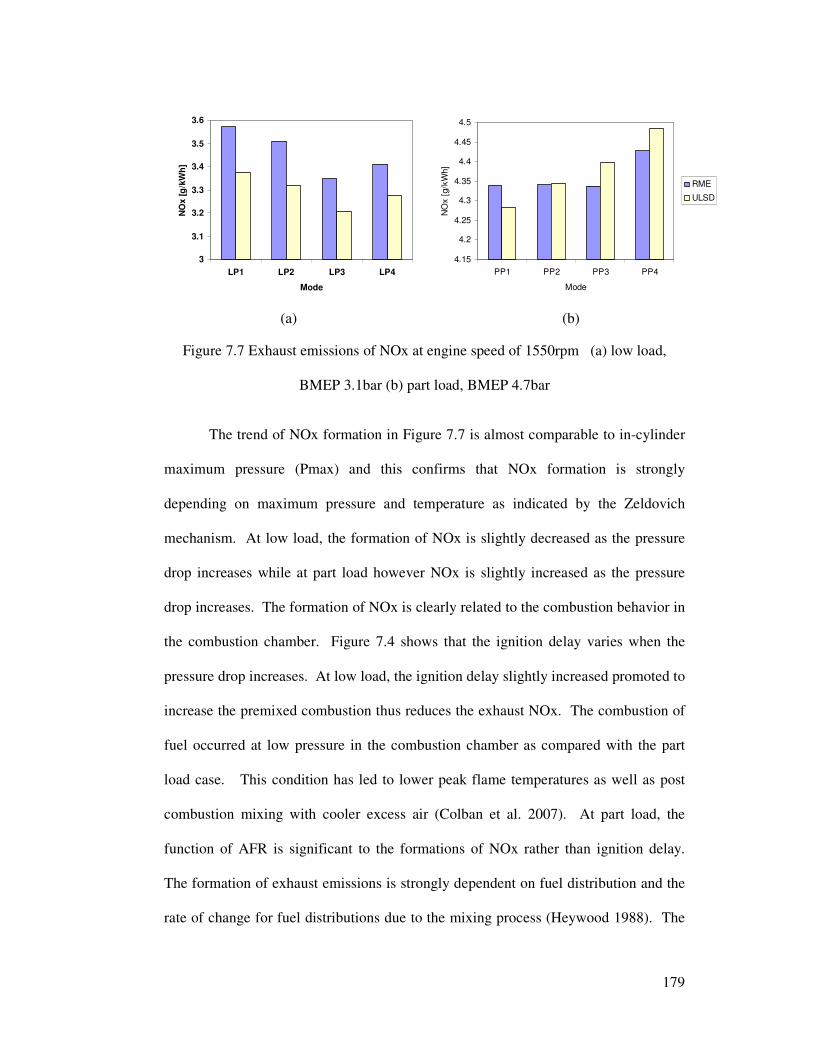
179
3
3.1
3.2
3.3
3.4
3.5
3.6
LP1 LP2 LP3 LP4
Mode
NO
x [
g/k
Wh
]
4.15
4.2
4.25
4.3
4.35
4.4
4.45
4.5
PP1 PP2 PP3 PP4
Mode
NO
x [
g/k
Wh]
RME
ULSD
(a) (b)
Figure 7.7 Exhaust emissions of NOx at engine speed of 1550rpm (a) low load,
BMEP 3.1bar (b) part load, BMEP 4.7bar
The trend of NOx formation in Figure 7.7 is almost comparable to in-cylinder
maximum pressure (Pmax) and this confirms that NOx formation is strongly
depending on maximum pressure and temperature as indicated by the Zeldovich
mechanism. At low load, the formation of NOx is slightly decreased as the pressure
drop increases while at part load however NOx is slightly increased as the pressure
drop increases. The formation of NOx is clearly related to the combustion behavior in
the combustion chamber. Figure 7.4 shows that the ignition delay varies when the
pressure drop increases. At low load, the ignition delay slightly increased promoted to
increase the premixed combustion thus reduces the exhaust NOx. The combustion of
fuel occurred at low pressure in the combustion chamber as compared with the part
load case. This condition has led to lower peak flame temperatures as well as post
combustion mixing with cooler excess air (Colban et al. 2007). At part load, the
function of AFR is significant to the formations of NOx rather than ignition delay.
The formation of exhaust emissions is strongly dependent on fuel distribution and the
rate of change for fuel distributions due to the mixing process (Heywood 1988). The
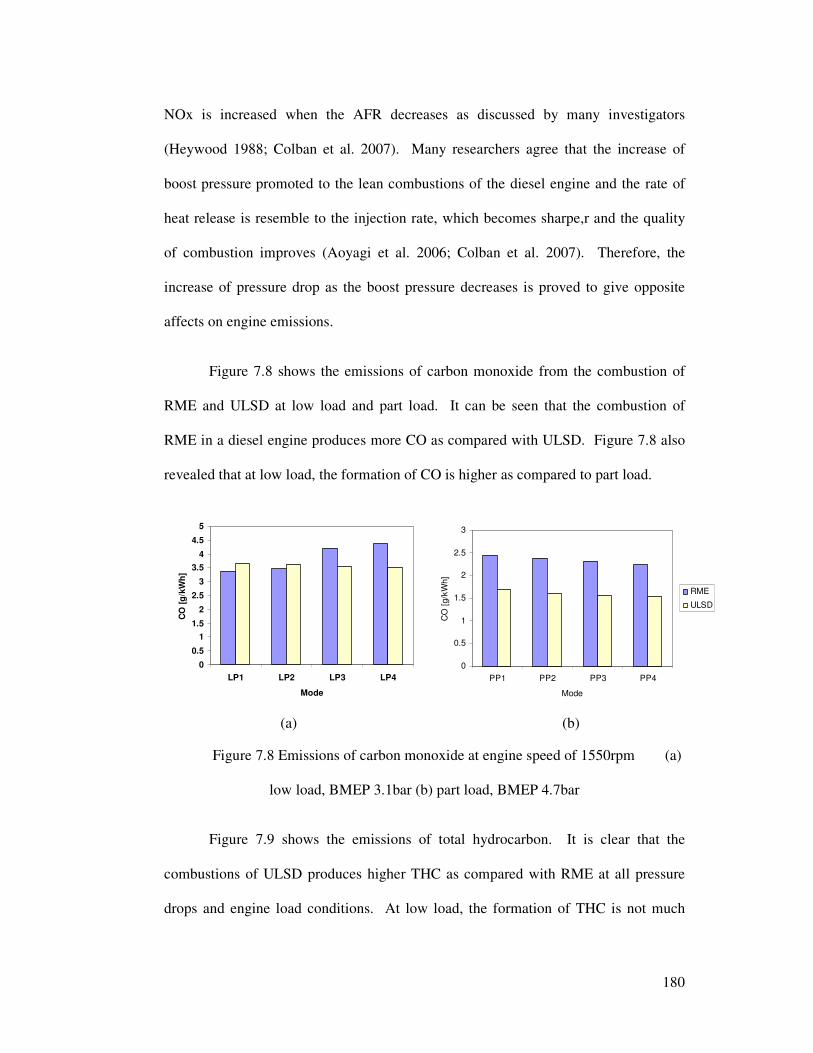
180
NOx is increased when the AFR decreases as discussed by many investigators
(Heywood 1988; Colban et al. 2007). Many researchers agree that the increase of
boost pressure promoted to the lean combustions of the diesel engine and the rate of
heat release is resemble to the injection rate, which becomes sharpe,r and the quality
of combustion improves (Aoyagi et al. 2006; Colban et al. 2007). Therefore, the
increase of pressure drop as the boost pressure decreases is proved to give opposite
affects on engine emissions.
Figure 7.8 shows the emissions of carbon monoxide from the combustion of
RME and ULSD at low load and part load. It can be seen that the combustion of
RME in a diesel engine produces more CO as compared with ULSD. Figure 7.8 also
revealed that at low load, the formation of CO is higher as compared to part load.
0
0.5
1
1.5
2
2.5
3
3.5
4
4.5
5
LP1 LP2 LP3 LP4
Mode
CO
[g
/kW
h]
0
0.5
1
1.5
2
2.5
3
PP1 PP2 PP3 PP4
Mode
CO
[g/k
Wh]
RME
ULSD
(a) (b)
Figure 7.8 Emissions of carbon monoxide at engine speed of 1550rpm (a)
low load, BMEP 3.1bar (b) part load, BMEP 4.7bar
Figure 7.9 shows the emissions of total hydrocarbon. It is clear that the
combustions of ULSD produces higher THC as compared with RME at all pressure
drops and engine load conditions. At low load, the formation of THC is not much
181
affected by the pressure drop. It is found that at high load, the formation of THC for
RME is leveled as the pressure drop increases. Meanwhile at part load, the HC is
reduced as the pressure drop increases.
0
0.2
0.4
0.6
0.8
1
1.2
1.4
1.6
1.8
LP1 LP2 LP3 LP4
Mode
TH
C [
g/k
Wh
]
0
0.2
0.4
0.6
0.8
1
1.2
1.4
PP1 PP2 PP3 PP4
Mode
TH
C [
g/k
Wh
]
RME
ULSD
`
(a) (b)
Figure 7.9 Emissions of total hydrocarbon at engine speed of 1550rpm; (a) low load,
BMEP 3.1bar (b) part load, BMEP 4.7bar
7.2 Effect of Charge Air Temperature
It is apparent that the engine’s power decreases as the air intake mass flow rate
diminishes. In a diesel engines, a supercharger or turbocharger is widely used to
increase the air flow rate, and hence the volumetric efficiency of the engine. Much
research has been conducted on the effect of charge temperature to a diesel engine
(Torregrosa et al. 2006; Beatrice et al. 2007; Maiboom et al. 2007). Moreover, the
effect of charge air intake is extremely important to the recent development of HCCI
engines world wide (Iida et al. 2001; Sjöberg et al. 2003; Iverson et al. 2005; Dubreuil
et al. 2006; Shibata et al. 2006; Andreae et al. 2007). The properties of air which
affect the mass flow rate, among others are the density which is linked to the air
182
temperature. The volumetric efficiency is increased as the charge air temperature
reduces. However, the increase of charge air temperature could also possibly improve
the fuel vaporisation in engine cylinders. This is extremely important for the diesel
engine operating with biodiesel. Much research has been conducted to explain the
effect of fuel vaporisation for biodiesel. Biodiesel is consists of the mono alkyl esters
of vegetable oils and animal fats. The difference in chemical structure of biodiesel
demonstrates distinctive impact on the chemical reaction pathways during ignition and
combustion (Szybist et al. 2007).
The increase of inlet temperature promoted in the reduction of in-cylinder trap
mass (thermal trottling effect). Therefore, the capacity of oxygen and heat capacity of
the air charge significantly reduced when air temperature increases. The effect of
charge air inlet temperature on diesel engines Maiboom et al. He has conducted a
series of experiments on an inline-4 diesel engine. The engine was equipped with a
cooled EGR system, common-rail injection system and VGT. The engine was
operated with mineral diesel fuel at constant engine speed, EGR ratio and inlet boost
pressure. The charge inlet temperature was varied from 20oC to 38oC. He concluded
that the increase of inlet temperature at constant boost pressure results in a slight
decrease of the ROHR. He suggests that at constant boost pressure, the fuel jet
entrains less air with reduced in-cylinder gas density, resulting in a lower oxygen-fuel
mixing therefore lower ROHR. Torregrosa et al. constructed a fully controlled diesel
engine to study the influence of inlet air charge temperature on the performance and
emissions of a diesel engine (Torregrosa et al. 2006). The intake temperature was
varied but the coolant temperature was controlled to isolate the cylinder wall’s
183
temperature. The report concluded that the increase of intake temperature leads to
increased NOx emissions.
RME has a higher tendency to form fuel rich zones at low load conditions than
the other fuels, due to higher viscosity and fuel distillation curves (Horn et al. 2007).
In addition, RME has a possibility of poor fuel atomization and vaporization, due to
its higher density, kinematic viscosity and distillation temperature than diesel fuel
(Kawano et al. 2006). Research conducted by Stovell on a spark ignited natural gas
engine also suggested that the small change in air intake temperature changed the
engine response and performance as well as exhaust gas emissions (Stovell et al.
2001). He tested the engine with three different intake air temperatures (50oF, 80oF
and 130oF) to evaluate their impact upon engine performance and emissions.
In the present study, it is decided to investigate this phenomenon and its effect
on the progress of combustion quality as well as on emissions on the V6 diesel engine.
The experiment was focused on the details of engine performance and emissions at
two different brake torque at 1550rpm of engine speed. The air intake temperature was
measured by thermocouple attached to the intake manifold just after the intercooler
and the data was compared with the reading from the ECU. The temperature was
automatically controlled by the controller to secure the accuracy of the temperature
reading. Comparisons between ULSD and RME have been made at one fuel
temperature of 35oC.
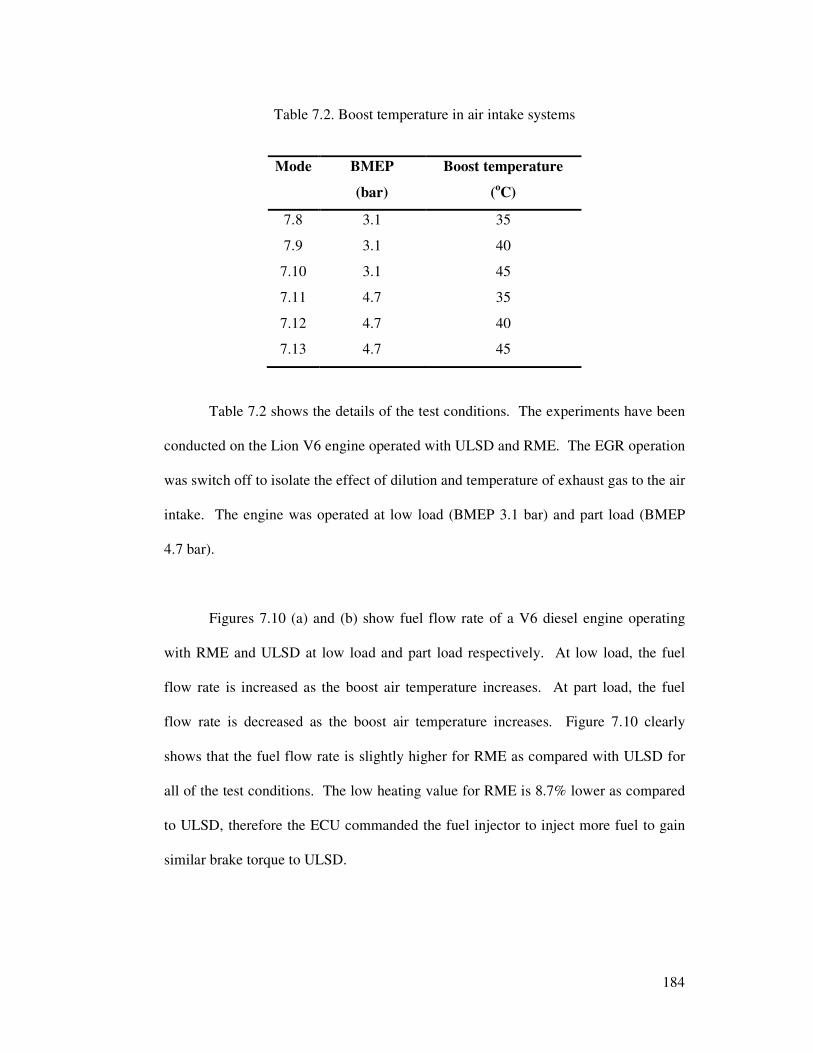
184
Table 7.2. Boost temperature in air intake systems
Mode BMEP
(bar)
Boost temperature
(oC)
7.8 3.1 35
7.9 3.1 40
7.10 3.1 45
7.11 4.7 35
7.12 4.7 40
7.13 4.7 45
Table 7.2 shows the details of the test conditions. The experiments have been
conducted on the Lion V6 engine operated with ULSD and RME. The EGR operation
was switch off to isolate the effect of dilution and temperature of exhaust gas to the air
intake. The engine was operated at low load (BMEP 3.1 bar) and part load (BMEP
4.7 bar).
Figures 7.10 (a) and (b) show fuel flow rate of a V6 diesel engine operating
with RME and ULSD at low load and part load respectively. At low load, the fuel
flow rate is increased as the boost air temperature increases. At part load, the fuel
flow rate is decreased as the boost air temperature increases. Figure 7.10 clearly
shows that the fuel flow rate is slightly higher for RME as compared with ULSD for
all of the test conditions. The low heating value for RME is 8.7% lower as compared
to ULSD, therefore the ECU commanded the fuel injector to inject more fuel to gain
similar brake torque to ULSD.
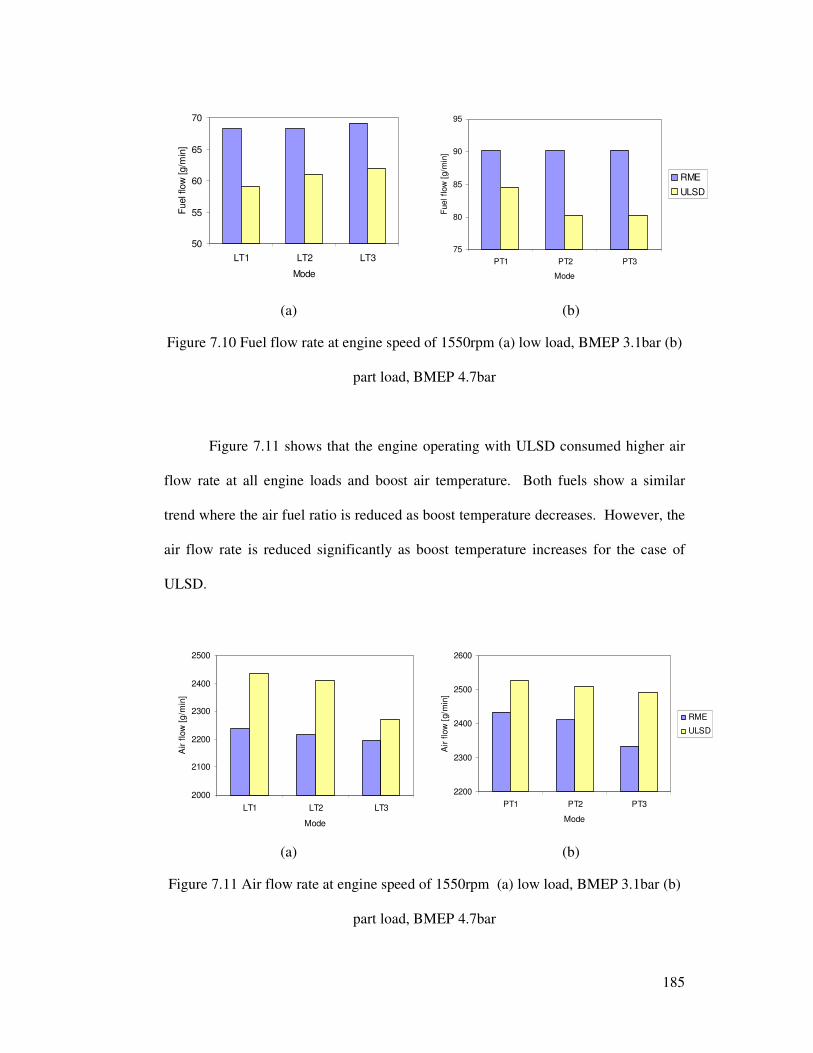
185
50
55
60
65
70
LT1 LT2 LT3
Mode
Fuel f
low
[g/m
in]
75
80
85
90
95
PT1 PT2 PT3
Mode
Fuel flow
[g/m
in]
RME
ULSD
(a) (b)
Figure 7.10 Fuel flow rate at engine speed of 1550rpm (a) low load, BMEP 3.1bar (b)
part load, BMEP 4.7bar
Figure 7.11 shows that the engine operating with ULSD consumed higher air
flow rate at all engine loads and boost air temperature. Both fuels show a similar
trend where the air fuel ratio is reduced as boost temperature decreases. However, the
air flow rate is reduced significantly as boost temperature increases for the case of
ULSD.
2000
2100
2200
2300
2400
2500
LT1 LT2 LT3
Mode
Air f
low
[g/m
in]
2200
2300
2400
2500
2600
PT1 PT2 PT3
Mode
Air f
low
[g/m
in]
RME
ULSD
(a) (b)
Figure 7.11 Air flow rate at engine speed of 1550rpm (a) low load, BMEP 3.1bar (b)
part load, BMEP 4.7bar
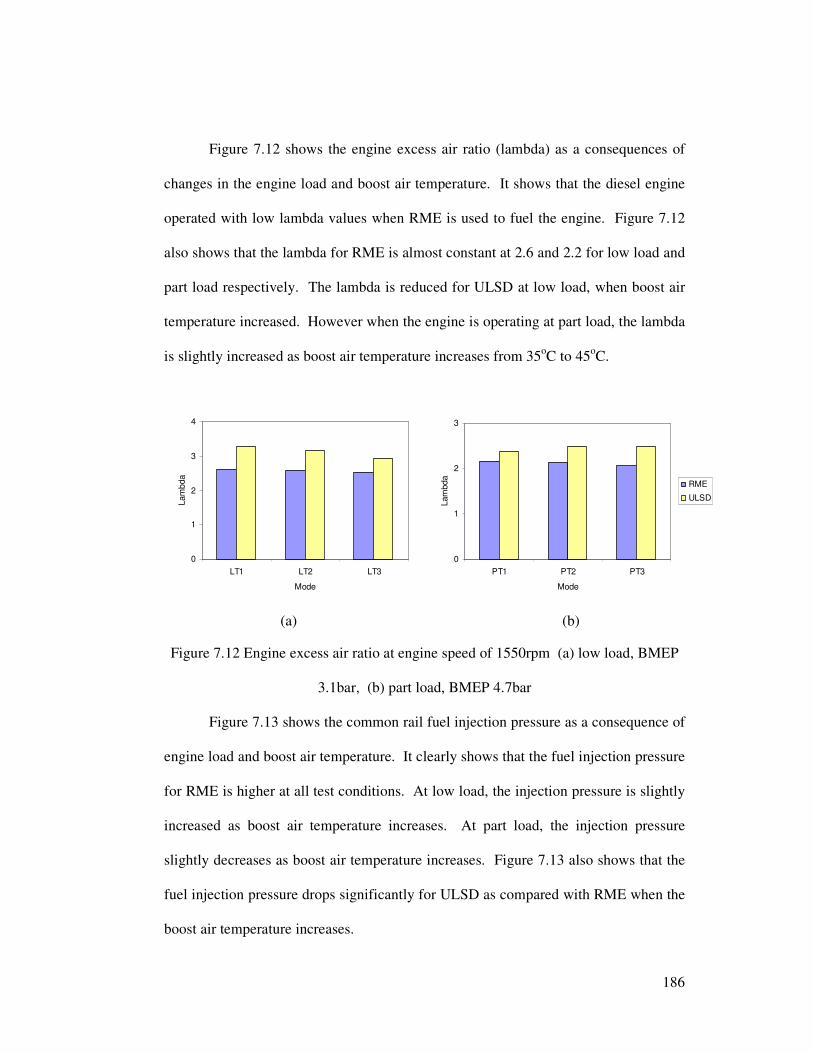
186
Figure 7.12 shows the engine excess air ratio (lambda) as a consequences of
changes in the engine load and boost air temperature. It shows that the diesel engine
operated with low lambda values when RME is used to fuel the engine. Figure 7.12
also shows that the lambda for RME is almost constant at 2.6 and 2.2 for low load and
part load respectively. The lambda is reduced for ULSD at low load, when boost air
temperature increased. However when the engine is operating at part load, the lambda
is slightly increased as boost air temperature increases from 35oC to 45oC.
0
1
2
3
4
LT1 LT2 LT3
Mode
Lam
bda
0
1
2
3
PT1 PT2 PT3
Mode
Lam
bda
RME
ULSD
(a) (b)
Figure 7.12 Engine excess air ratio at engine speed of 1550rpm (a) low load, BMEP
3.1bar, (b) part load, BMEP 4.7bar
Figure 7.13 shows the common rail fuel injection pressure as a consequence of
engine load and boost air temperature. It clearly shows that the fuel injection pressure
for RME is higher at all test conditions. At low load, the injection pressure is slightly
increased as boost air temperature increases. At part load, the injection pressure
slightly decreases as boost air temperature increases. Figure 7.13 also shows that the
fuel injection pressure drops significantly for ULSD as compared with RME when the
boost air temperature increases.
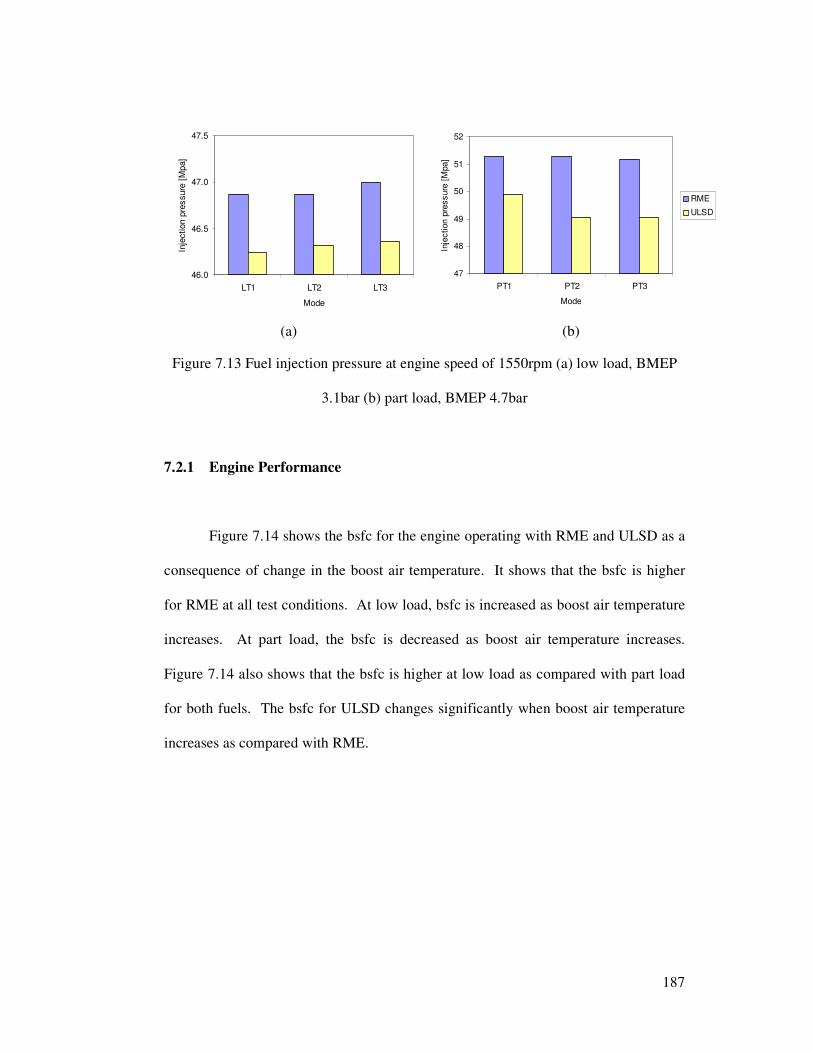
187
46.0
46.5
47.0
47.5
LT1 LT2 LT3
Mode
Inje
ction p
ressure
[M
pa]
47
48
49
50
51
52
PT1 PT2 PT3
Mode
Inje
ction p
ressure
[M
pa]
RME
ULSD
(a) (b)
Figure 7.13 Fuel injection pressure at engine speed of 1550rpm (a) low load, BMEP
3.1bar (b) part load, BMEP 4.7bar
7.2.1 Engine Performance
Figure 7.14 shows the bsfc for the engine operating with RME and ULSD as a
consequence of change in the boost air temperature. It shows that the bsfc is higher
for RME at all test conditions. At low load, bsfc is increased as boost air temperature
increases. At part load, the bsfc is decreased as boost air temperature increases.
Figure 7.14 also shows that the bsfc is higher at low load as compared with part load
for both fuels. The bsfc for ULSD changes significantly when boost air temperature
increases as compared with RME.
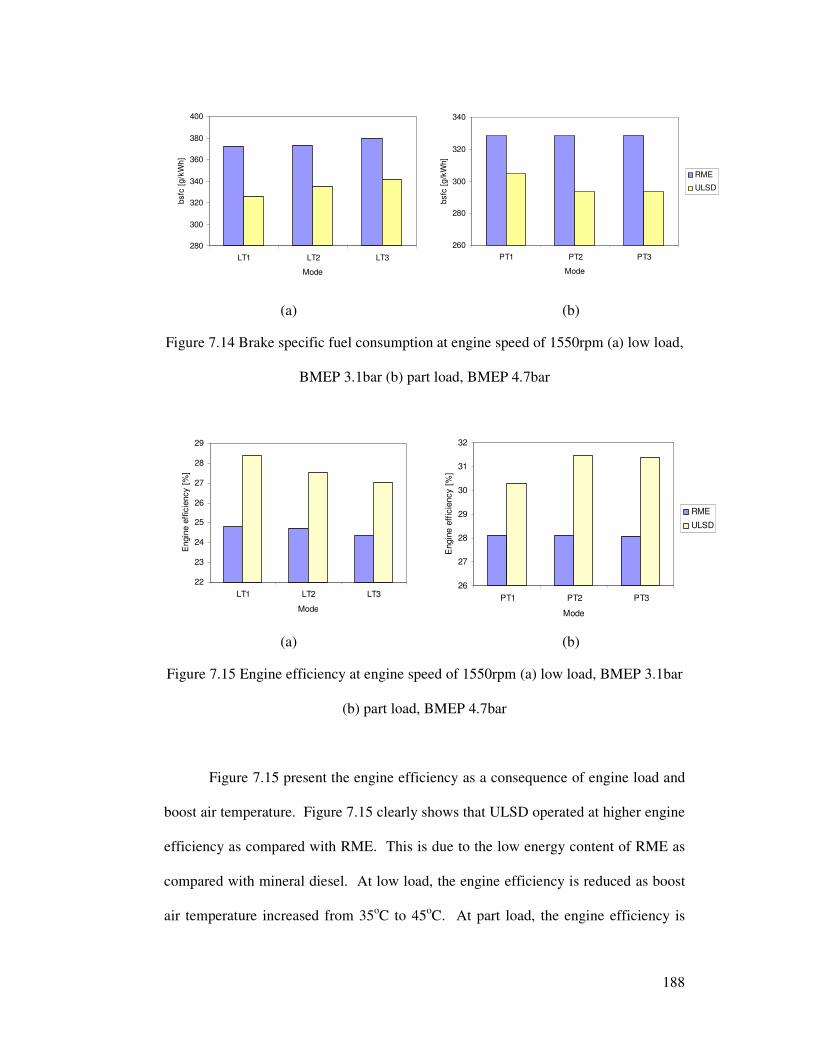
188
280
300
320
340
360
380
400
LT1 LT2 LT3
Mode
bsfc
[g/k
Wh]
260
280
300
320
340
PT1 PT2 PT3
Mode
bsfc
[g/k
Wh]
RME
ULSD
(a) (b)
Figure 7.14 Brake specific fuel consumption at engine speed of 1550rpm (a) low load,
BMEP 3.1bar (b) part load, BMEP 4.7bar
22
23
24
25
26
27
28
29
LT1 LT2 LT3
Mode
Engin
e e
ffic
iency [
%]
26
27
28
29
30
31
32
PT1 PT2 PT3
Mode
Engin
e e
ffic
iency [
%]
RME
ULSD
(a) (b)
Figure 7.15 Engine efficiency at engine speed of 1550rpm (a) low load, BMEP 3.1bar
(b) part load, BMEP 4.7bar
Figure 7.15 present the engine efficiency as a consequence of engine load and
boost air temperature. Figure 7.15 clearly shows that ULSD operated at higher engine
efficiency as compared with RME. This is due to the low energy content of RME as
compared with mineral diesel. At low load, the engine efficiency is reduced as boost
air temperature increased from 35oC to 45oC. At part load, the engine efficiency is
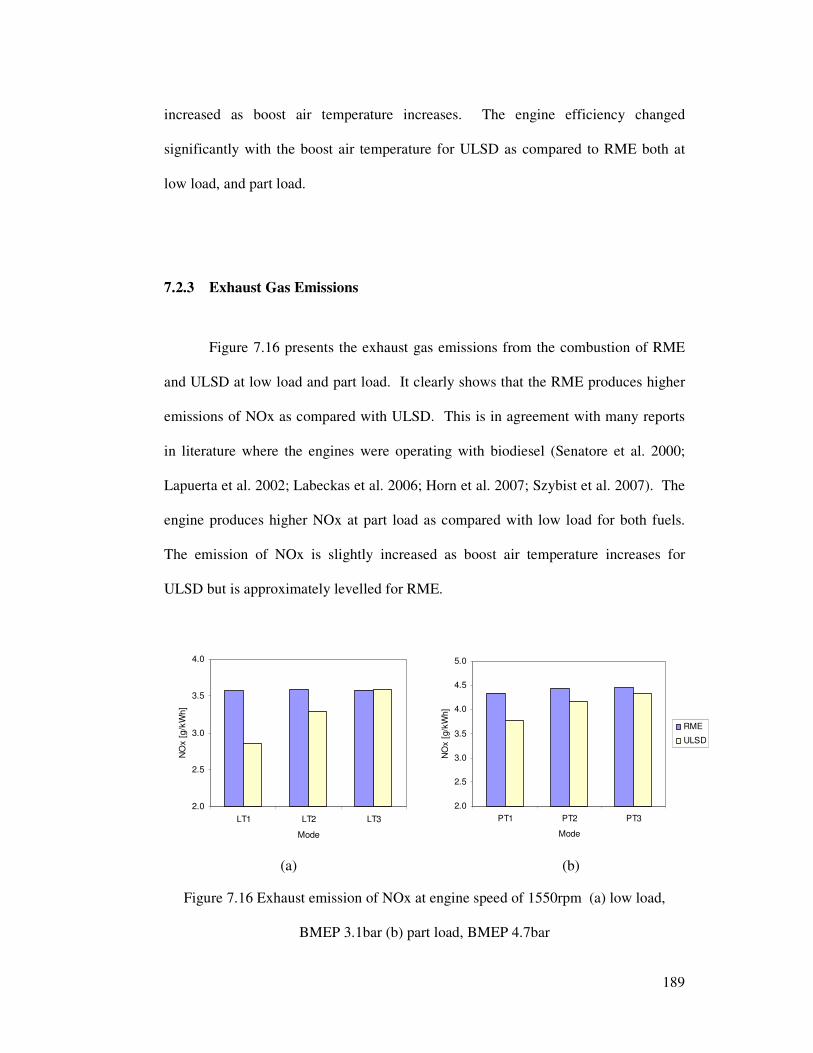
189
increased as boost air temperature increases. The engine efficiency changed
significantly with the boost air temperature for ULSD as compared to RME both at
low load, and part load.
7.2.3 Exhaust Gas Emissions
Figure 7.16 presents the exhaust gas emissions from the combustion of RME
and ULSD at low load and part load. It clearly shows that the RME produces higher
emissions of NOx as compared with ULSD. This is in agreement with many reports
in literature where the engines were operating with biodiesel (Senatore et al. 2000;
Lapuerta et al. 2002; Labeckas et al. 2006; Horn et al. 2007; Szybist et al. 2007). The
engine produces higher NOx at part load as compared with low load for both fuels.
The emission of NOx is slightly increased as boost air temperature increases for
ULSD but is approximately levelled for RME.
2.0
2.5
3.0
3.5
4.0
LT1 LT2 LT3
Mode
NO
x [
g/k
Wh]
2.0
2.5
3.0
3.5
4.0
4.5
5.0
PT1 PT2 PT3
Mode
NO
x [
g/k
Wh]
RME
ULSD
(a) (b)
Figure 7.16 Exhaust emission of NOx at engine speed of 1550rpm (a) low load,
BMEP 3.1bar (b) part load, BMEP 4.7bar
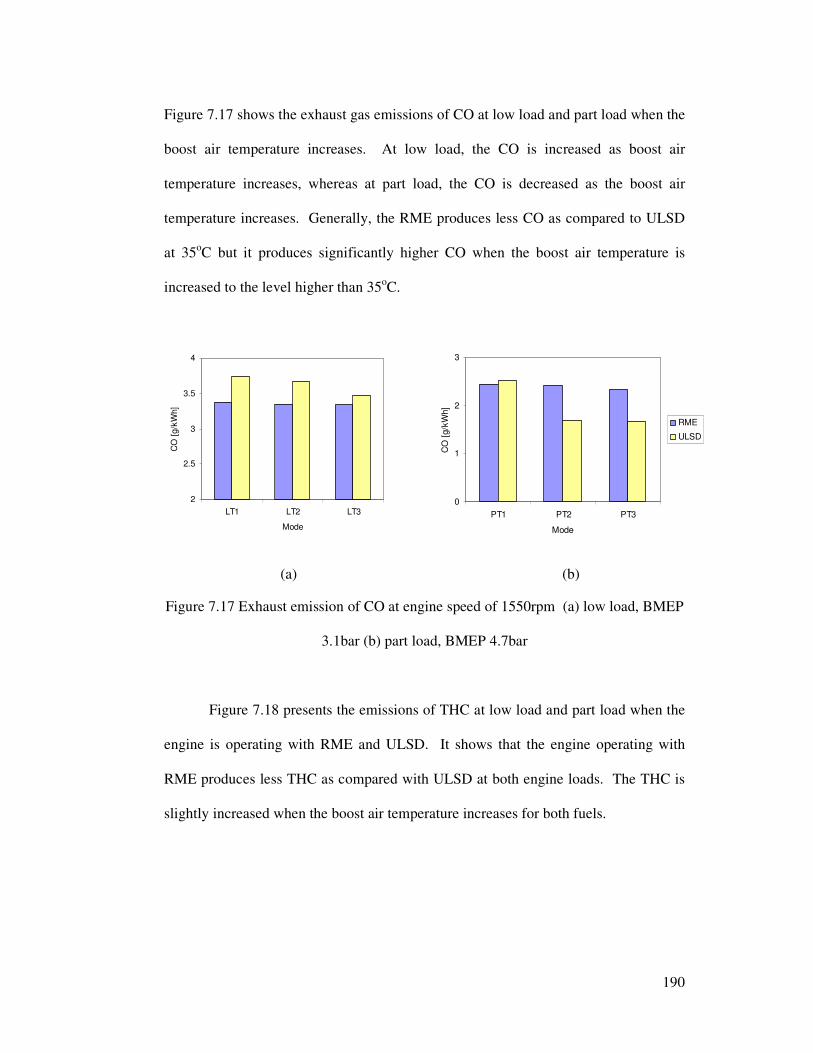
190
Figure 7.17 shows the exhaust gas emissions of CO at low load and part load when the
boost air temperature increases. At low load, the CO is increased as boost air
temperature increases, whereas at part load, the CO is decreased as the boost air
temperature increases. Generally, the RME produces less CO as compared to ULSD
at 35oC but it produces significantly higher CO when the boost air temperature is
increased to the level higher than 35oC.
2
2.5
3
3.5
4
LT1 LT2 LT3
Mode
CO
[g/k
Wh]
0
1
2
3
PT1 PT2 PT3
Mode
CO
[g/k
Wh]
RME
ULSD
(a) (b)
Figure 7.17 Exhaust emission of CO at engine speed of 1550rpm (a) low load, BMEP
3.1bar (b) part load, BMEP 4.7bar
Figure 7.18 presents the emissions of THC at low load and part load when the
engine is operating with RME and ULSD. It shows that the engine operating with
RME produces less THC as compared with ULSD at both engine loads. The THC is
slightly increased when the boost air temperature increases for both fuels.
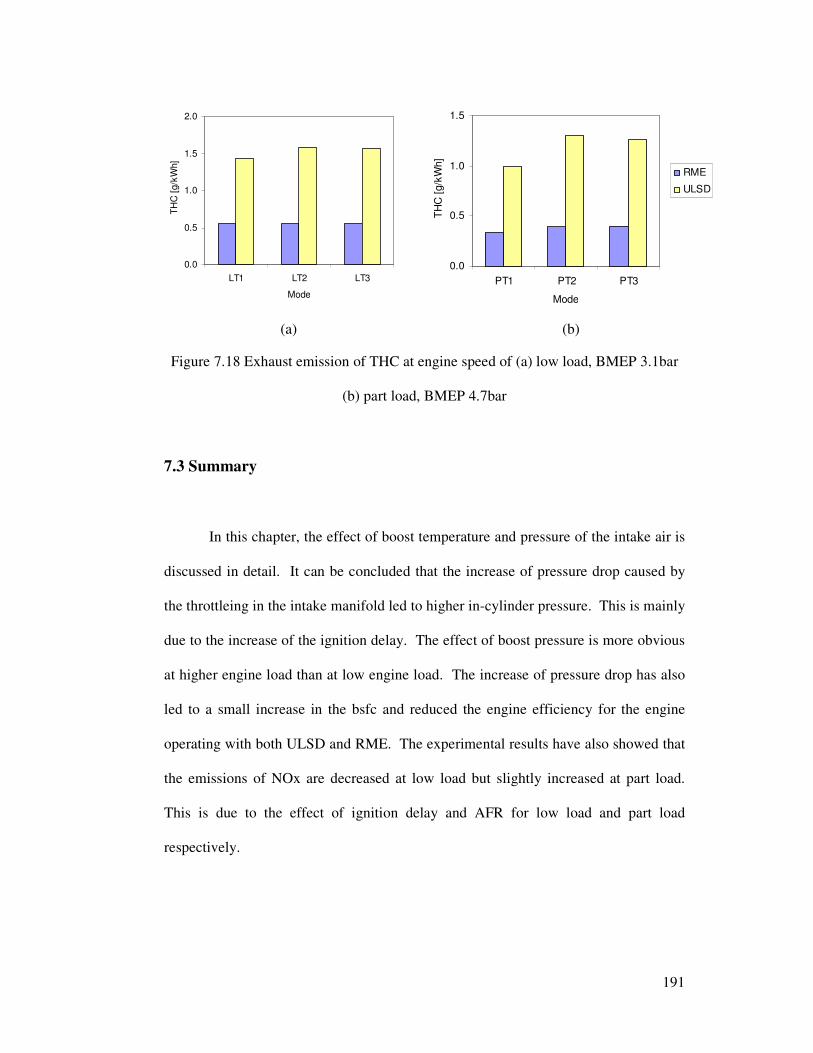
191
0.0
0.5
1.0
1.5
2.0
LT1 LT2 LT3
Mode
TH
C [
g/k
Wh]
0.0
0.5
1.0
1.5
PT1 PT2 PT3
Mode
TH
C [
g/k
Wh]
RME
ULSD
(a) (b)
Figure 7.18 Exhaust emission of THC at engine speed of (a) low load, BMEP 3.1bar
(b) part load, BMEP 4.7bar
7.3 Summary
In this chapter, the effect of boost temperature and pressure of the intake air is
discussed in detail. It can be concluded that the increase of pressure drop caused by
the throttleing in the intake manifold led to higher in-cylinder pressure. This is mainly
due to the increase of the ignition delay. The effect of boost pressure is more obvious
at higher engine load than at low engine load. The increase of pressure drop has also
led to a small increase in the bsfc and reduced the engine efficiency for the engine
operating with both ULSD and RME. The experimental results have also showed that
the emissions of NOx are decreased at low load but slightly increased at part load.
This is due to the effect of ignition delay and AFR for low load and part load
respectively.
192
The increase of inlet temperature led to the reductions of in-cylinder trap mass
and therefore reduced the oxygen and heat capacity of the charged air. This has
resulted in an increase of bsfc at low load but slightly lowered the bsfc at part load
when the charge air temperature is increased. The exhaust gas emissions are slightly
increased for ULSD but remain levelled for RME. The emission of CO is decreased
and the emission of THC is increased when the charge air temperature increases.
193
CHAPTER 8
CONCLUSIONS AND RECOMMENDATION
The research work reported in this thesis consists of two major parts. The first
part is the performance of the air induction system of a V6 diesel engine was
investigated through 3D simulation and the engine dynamic flow was simulated by 1D
simulation whereas the models were validated by experimental data. The 3D
simulation was conducted using Fluent version 6.2 while the Ricardo WAVE
commercial gas dynamic engine cycle was used for 1D analysis. The experimental
data from the V6 diesel engine have been used to validate the simulation results. The
diesel engine was operated with ULSD and RME in order to study the performance
and emissions of the engine fuelled by biodiesel with the effect of air intake charge
conditions. Generally the results have revealed that the effect of a number of
important parameters in the diesel engine operations and these include EGR, injection
strategy, air intake pressure and temperature. The conclusions are summarised in
section 8.1 and some suggestions for future work are given in the end.
194
8.1. Conclusion Remarks
8.1.1 Influence of Negative Pressure on the Induction Grill
In order to quantify the effect of negative pressure on the induction grill, 3D
analysis of real geometry of a Freelander AIS has been investigated with respect to the
fluid flow behaviour on the intake system. The results show that the magnitude of
fluid flow velocity on the intake grill has a significant impact on the pressure drop in
the intake manifold. The flow behaviour in the intake manifold changes significantly
as the velocity magnitude is increased. Moreover, the mass flow rate is influenced by
the tangential velocity at the grill entry. The results from the steady flow test give a
good agreement with simulation results. In general, for a given constant pressure
drop, the higher the tangential speed, the lower the mass flow into the engine, which
subsequently reduces the volumetric efficiency. Therefore, the grill design of the air
induction system is very important to enhance the volumetric efficiency of air
induction systems. This is extremely important especially when the induction grill is
located at the rear side of vehicle.
8.1.2 One-Dimensional Analysis of the Air Induction System of a V6
Diesel Engine.
The induction system of a V6 diesel engine has been simulated to study the
effect its consignment on the performance of a diesel engine. The main objective is to
use the wave action strategy to optimise the air induction system of a V6 diesel
engine. The study starts with the engine models operating at full load for 7 different
195
engine speeds from 1000rpm to 4000rpm. The simulation results were compared with
the experimental data provided by Jaguar Land Rover, and a good agreement is
obtained with a relative error between 1% and 9%. The analysis of the pressure wave
on the intake manifold suggests that the pressure drop in the intake manifold gives a
considerable effect on the performance of the air induction system.
8.1.3 Performance and Emissions of a Diesel Engine Operating with
ULSD and RME.
The experimental work was conducted on a V6 diesel engine operating with
ULSD and RME. The engine was tested at low load and part load. The result has
showed that the engine was operating with RME produces higher NOx as compared
with the engine operating with ULSD, but produces significantly lower CO and THC.
The effect of EGR on the emissions, especially the reductions of NOx is evident for
ULSD and RME. However, with standard engine calibration, the EGR level is
different between ULSD and RME when the engine is operated at equal brake torque
and engine speed. Therefore, in order to have a better engine performance and lower
emissions, the engine needs new calibration when biodiesel is used as a fuel. It also
found the engine operated with RME produced a 5% higher in-cylinder pressure and
therefore higher charge air pressure at an engine speed of 1550rpm with 102Nm brake
torque. The experiment result has also concluded that the small change in fuel
temperature (10oC) gives an impact to the engine performance and exhaust emissions.
It is believe that the small change of pressure drop and temperature in the intake
manifold would change the ‘environment’ temperature for the fuel spray and thus

196
affect the fuel spray droplet size and distribution promoted to amend the engine
performance and emissions. The small increase of fuel temperature from 30oC to
40oC has reduced the viscosity and density of the fuel. This led to an increase in the
mixing rate of fuel and air in the cylinder, and is useful for improving the fuel
consumption and engine performance. When EGR was not introduced, such an effect
was evident.
With standard engine calibration, the engine is operated with double injections
where each of the injection timing varies according to engine speed and load. It was
found that the engine performance and engine emission is highly dependant on
injection strategy as was expected. The application of dual injection strategy without
the EGR system shows a significant lower of hydrocarbon emissions but it has major
drawbacks of producing higher NOx. The experimental results also reveal that pilot
injection lowered peak pressure and brake specific fuel consumption regardless of
EGR operations. The effect of EGR on reducing NOx emissions is more significant
compared with the effect of multiple injection strategies. The combination of EGR
and dual injection strategies produce even further reductions in emissions especially
of NOx and particulate matter.
8.1.4 The Effect of Intake Charge Pressure Drop and Temperature on
Engine Performance
The experimental results showed that the intake charge pressure and
temperature have significant effect on the performance as well as emission levels of a
diesel engine. The diesel engine operated at higher pressure drop increases the bsfc,
197
thus reduces the engine efficiency on both low load and part load. The emission of
NOx was influenced by the combustion process in the engine cylinder and therefore
has a different association with the intake charge pressure. At low load test
conditions, the emissions of NOx decreased as pressure drop increased while at part
load, the exhaust NOx increased as the pressure drop increases for both ULSD and
RME. It is found that the rates of the decrease and increase of NOx emissions are
different between ULSD and RME. It is clear that at low load, the emissions of NOx
decreased significantly for ULSD when the pressure drop increased as compared with
RME. At part load, the emissions of NOx increased significantly for ULSD when the
pressure drop increased as compared to RME.
The charge temperature has a significant effect the performance and emissions
of a diesel engine. However the trends dependent on engine load and fuel type. At
low load, as the charge air temperature increased, the bsfc increases and engine
efficiency decreases for both ULSD and RME. The emissions of NOx, CO and THC
are generally increased as charge air temperature increases for both ULSD and RME.
While at part load, the bsfc and engine efficiency improve significantly as charge
temperature increased from 35oC to 45oC. However, the emission of NOx is increased
when the charge temperature increases, while CO and THC are decreased. The engine
performance is altered when the ignition delay changed according to charge air
temperature at a given engine load conditions. The formation of NOx generally is
governed by the combustion process in the cylinder of the engine.
198
8.2. Future Work
After a series of simulations and experimental work for the diesel engine, the
author would like to address several issues concerning the future work as follows.
8.2.1 The modifications of Current Design of Freelander Air Intake
System
The 3D analysis of air intake system of a Freelander vehicle is simulated with
standard air intake system. There is no modification made to improve the geometry
and design of the intake manifold and grill. The simulation results show that the
negative pressure in intake grill reduces the volumetric efficiency of the air intake
system. Therefore, it is valuable to modify the geometry and design of the grill and
manifold to optimise the performance of air intake system. One-dimensional
simulation such as Ricardo WAVE also can be used together with 3D geometry to
optimised the required length and overall geometry of air intake system.
8.2.2 The Effect of EGR Rate and Exhaust Gas Temperature on the Intake
Charge.
The experiment so far has been conducted with the standard operation of EGR.
Therefore, the EGR rate is fully controlled by the ECU based on the current engine
calibrations. Thus the results are compared between ULSD and RME at a standard
operation basis. The engine was operated without any modification on the engine
hardware and calibrations. For experimental purposes, it is very useful to compare the
result between ULSD and RME for fixed EGR. This is will be heelpfull to improving
199
understanding the effect of EGR and their impact on the engine performance and
emissions when the engine is operating with ULSD and RME respectively.
8.2.3 Transient Operation on Diesel Engine Operating with ULSD and
RME.
The V6 diesel engine with the instrumentation used for the present study is
capable of running at a steady-state operation. The current dynamometer controller
and the fuel pedal control are unable to operate at transient mode. The transient mode
test is crucial to simulate the ‘real’ travel conditions on the road. The transient test
can be performed according to European driving test conditions and it will provide
paramount data of the engine performance and emissions rate at real time scale, thus
provide the real performance and emissions of the engine operating with ULSD and
neat RME.
200
REFERENCES
Abd-Alla, G. H. (2002). "Using Exhaust Gas Recirculation in Internal Combustion
Engines: a Review." Energy Conversion and Management 43 (2002) 1027-
1042.
Agarwal, A. K. (2007). "Biofuels (Alcohol and Biodiesel) Applications as Fuels for
Internal Combustion Engines." Progress in Energy and Combustion Science 33
(2007) 233-271.
Agnew, D. D. and G. J. Rohrback (2004). "Engineering a Composite Intake Manifold
for the Performance Aftermarket." SAE Technical Paper 2004-01-3512.
Alcini, W. V. and I. West (2006). "GT Model for Passive Flapper Exhaust Valve."
SAE Technical Paper 2006-01-1373.
Altõn, R., S. Cetinkaya and H. S. Yucesu (2001). "The potential of using vegetable oil
fuels as fuel for diesel engines." Vol. 42: 529±538.
Araneo, L., A. Coghe, G. Brunello and R. Dondé (2000). "Effects of Fuel
Temperature and Ambient Pressure on a GDI Swirled Injector Spray." SAE
Technical Paper 2000-01-1901.
Athavale, S. M. and P. R. Sajanpawar (1999). "Analysis and Development of Inline
Helmholtz Resonator through Computer Simulation for Elimination of Low
Frequency Intake Noise Character." SAE Technical Paper 1999-01-1662.
Bai, M., J. Lv and Z. Shao (2008). "A Study of Performance Development and
Optimization of 6106 Diesel Engine." SAE Technical Paper 2008-01-1725.
Balat, M. and H. Balat (2008). "A Critical Review of Bio-diesel as a Vehicular Fuel."
Energy Conversion and Management Vol 49: 2727-2741.
201
Balusamy, T. and R. Marappan (2007). "Performance evaluation of direct injection
diesel engine with blends of Thevetia peruviana seed oil and diesel." Journal of
Scientific & Industrial Research Vol. 66: 1035-1040.
Baukal, C. E. (2001). The John Zink Combustion Handbook. London, CRC Press.
Bayraktar, I. and T. Bayraktar (2006). "Guidelines for CFD Simulations of Ground
Vehicle Aerodynamics." SAE Technical Paper 2006-01-3544.
Bevan, K. E. and J. B. Ghandhi (2004). "PIV Measurements of In-Cylinder Flow in a
Four-Stroke Utility Engine and Correlation with Steady Flow Results." SAE
Technical Paper 2004-32-0005.
Bialkowski, M. T., T. Pekdemir, D. P. Towers, R. Reuben, M. Brautsch and G. Elsbett
(2004). "Effect of Fuel Temperature and Ambient Pressure on a Common Rail
Rapeseed Oil Spray." Journal of KONES Internal Combustion Engines Vol.
11(1-2).
Board, E. B. (2006). EBB Publishes Annual Biodiesel Production Statistics.
535/COM/07. Bruxelles, European Biodiesel Board.
Bohac, S. V. and D. N. Assanis (2001). "Quantification of Local Ozone Production
Attributable to Automobile Hydrocarbon Emissions." SAE Technical Paper
2001-01-3760.
Bozbas, K. (2008). "Biodiesel as an Alternative Motor Fuel: Production and Policies
in the European Union." Renewable and Sustainable Energy Reviews 12
(2008) 542-552.
Bozza, F., A. Gimelli, V. Pianese, S. D. Martino and R. Curion (2004). "An Acoustic
Design Procedure for Intake Systems: 1DAnalysis and Experimental
Validation." SAE Technical Paper 2004-01-0412.
202
BP (1998). BP Gas Oil Safety Data Sheet. Sheet No: SUK2102, BP Oil UK Ltd: 1.
Caton, J. A. (2003). "Effects of Burn Rate Parameters on Nitric Oxide Emissions for a
Spark Ignition Engine: Results from a Three-Zone, Thermodynamic
Simulation." SAE Technical Paper 2003-01-0720.
Chao, P.-K., Y. Goktas, W. Weber and K. Nelson (1999). "A Statistical Investigation
of High Frequency Radiated Noise from a Composite Nylon Intake Manifold."
1999-01-1228.
Chen, C., D. R. Amlee, R. J. R. Johns and Y. Zeng (2004). "Detailed Modeling of
Liquid Fuel Sprays in One-Dimensional Gas Flow Simulation." SAE
Technical Paper 2004-01-3000.
Chuepeng, S. (2008). Quantitative Impact on Engine Performance and Emissions of
High Proportion Biodiesel Blends and the Required Engine Control Strategies,
University of Birmingham. PhD Thesis.
Chuepeng, S. (2008). Quantitative Impact on Engine Performance and Emissions of
High Proportion Biodiesel Blends and the Required Engine Control Strategies.
PhD Thesis, The University of Birmingham.
Chuepeng, S., A. Tsolakis, K. Theinnoi, H. M. Xu, M. L. Wyszynski and J. Qiao
(2007). "A Study of Quantitative Impact on Emissions of High Proportion
RME-Based Biodiesel Blends." SAE Technical Journal 2007-01-0072.
Cipolat, D. (2007). "Analysis of energy release and NOx emissions of a CI engine
fuelled on diesel and DME." Applied Thermal Engineering 27(11-12): 2095.
Colin, G., P. Giansetti, Y. Chamaillard and P. Higelin (2007). "In-Cylinder Mass
Estimation Using Cylinder Pressure." SAE Technical Paper 2007-24-0049.
203
Cussons (2008). P7305/SP Impulse Swirl Meter with Port Flow Rig and Display.
http://www.cussons.co.uk/pdf/english/enauto/P7305SP.pdf. Retriev on
18/11/08.
Demirbas, A. (2007). "Importance of biodiesel as transportation fuel." Energy Policy
35(9): 4661.
Dennis, A. J., C. P. Garner and D. H. C. Taylor (1999). "The Effect of EGR on Diesel
Engine Wear." SAE Technical Paper 1999-01-0839.
Devi, R., P. Saxena, B. Walter, B. Record and V. Rajendran (2004). "Pressure
Reduction in Intake System of a Turbocharged-Inter
Cooled DI Diesel Engine Using CFD Methodology." SAE Technical Paper 2004-01-
1874.
Douglas, J. F. (1995). Fluid Mechanics. London, Longman Scientific & Technical.
EBB (2008). European Biodiesel Board Position Paper on the Commission Proposal
for a New Directive on Renewable Energies Revising Directive 2003/30 on the
Promotion of Biofuels. 25/COM/08. Bruxelles, European Biodiesel Board.
EEC (2000). "The approximation of the laws of the Member States relating to
measures to be taken against the emission of gaseous and particulate pollutants
from compression ignition engines for use in vehicles, and the emission of
gaseous pollutants from positive ignition engines fuelled with natural gas or
liquefied petroleum gas for use in vehicles and amending Council Directive
88/77/EEC." Official Journal of the European Union Directive 1999/96/EC
(2000)(L44: 1 - 155).
Egnell, R. (2000). "The Influence of EGR on Heat Release Rate and NO Formation in
a DI Diesel Engine." SAE Technical Paper 2000-01-1807.
204
EPA (2002). A Comprehensive Analysis of Biodiesel Impacts on Exhaust Emissions.
Draft Technical Report, EPA420-P-02-001, United States Environmental
Protection Agency.
Ferguson, C. F. (2001). Internal Combustion Engine. New Jersey, John Wiley & Sons.
Fluent (2005). FLUENT 6.2 User's Guide. Lebanon, FLUENT Inc.
Gaikwad, S., K. Arora, V. Korivi and S. K. Cho (2008). "Steady and Transient CFD
Approach for Port Optimization." SAE Technical Paper 2008-01-1430.
Ganesan, V. (2003). Internal Combustion Engines. New Delhi, McGraw Hill.
Ganesan, V., J. S. Kumar and V. Balasubramanian (2004). "Flow field Analysis of a
Multi Cylinder S.I Engine Air Intake System Using Computational Fluid
Dynamics." SAE Technical Paper 2004-28-0010.
Garrett (2004). Garrett Performance Product Catalogue. Los Angeles.
Gilkes, O. S., R. Mishra, J. Fieldhouse and V. Rao (2008). "Simulation of the
Transient Performance of a Turbocharged Diesel Engine Featuring a Two
Point Air Injection Transient Assist System." SAE Technical Paper 2008-01-
1192.
Glassman, I. (1987). Combustion. Orlando, Academic Press Inc.
Goswani, D. Y. and F. Kreith (2007). Energy Conversion. London, CRC Press.
Hajireza, S., B. Sundén and F. Mauss (2000). "Effect of Inhomogeneities in the End
Gas Temperature Field on the Autoignition in SI Engines." 2000-01-0954.
Hasimoglu, C., M. Ciniviz, I. Ozsert, Y. Icingur, A. Parlak and M. S. Salman (2008).
"Performance Characteristics of a Low Heat Rejection Diesel Engine
Operating with Biodiesel." Renewable Energy Vol. 33: 1709-1715.
205
Hester, R. E. and R. M. Harrison (2004). Transport and the Environment. Cambridge,
The Royal Society of Chemistry.
Heywood, J. B. (1988). Internal Combustion Engine Fundamentals. New York,
McGraw Hill.
Hirose, Y., H. Kino, T. Sawatari, K. Kaminaga and K. Yokohashi (2002). "Acoustic
Analysis of Unreflective (Non-Resonant) Duct." SAE Technical Paper 2002-
01-0857.
Horn, U., R. Egnell, B. Johansson and Ö. Andersson (2007). "Detailed Heat Release
Analyses with Regard to Combustion of RME and Oxygenated Fuels in an
HSDI Diesel Engine." SAE Technical Paper 2007-01-0627.
Husberg, T., S. Gjirja, I. Denbratt and J. Engstrom (2004). "Visualization of EGR on
Diesel Combustion with Long Ignition Delay in a Heavy-duty Engine." SAE
Technical Paper 2004-01-2947.
Inagaki, K., M. Ueda, J. Mizuta, K. Nakakita and S. Nakayama (2008). "Universal
Diesel Engine Simulator (UniDES): 1st Report: Phenomenological Multi-Zone
PDF Model for Predicting the Transient Behavior of Diesel Engine
Combustion." 2008-01-0843.
Jajoo, B. N., A. N. Pawar and M. R. Nandgaonkar (2005). "Coating for Improving
Diesel Engine Performance Using Turbocharger." 15th Asia-Pacific
Conference on Combustion, Australia.
Jia, M., M. Xie and Z. Peng (2008). "A Comparative Study of Multi-zone Combustion
Models for HCCI Engines." SAE Technical Paper 2008-01-0064.
Joshi, S. S., V. Mathews, M. Nandgaonkar, S. Kajale, M. Niranjan, S. Krishnan and S.
K. Mahajan (2008). "Application of CFD Methodology to Reduce the Pressure
206
Drop and Water Entry in the Air Intake System of Turbocharged Engine."
SAE Technical Paper 2008-01-1172.
Kandasamy, K., S. Jeganathan and R. Ganesan (2008). "Operation and Combustion
Characteristics of a Direct Injection Diesel Engine Fulled with Esterified
Cotton Seed Oil." Modern Applied Science Vol 2: 71-80.
Kawano, D., H. Ishii, Y. Goto, A. Noda and Y. Aoyagi (2006). "Application of
Biodiesel Fuel to Modern Diesel Engine." SAE Technical Paper 2006-01-
0233.
Kawano, D., H. Ishii, Y. Goto, A. Noda and Y. Aoyagi (2007). "Effect of Exhaust Gas
Recirculation on Exhaust Emissions from Diesel Engines Fuelled with
Biodiesel." SAE Technical Paper 2007-24-0128.
Kawashima, J.-i., H. Ogawa and Y. Tsuru (1998). "Research on a variable swirl intake
port for 4-valve, high-speed DI diesel engines." SAE Technical Paper 982680.
Keating, E. L. (2007). Applied Combustion. London, CRC Press.
Kimberley, W. (2004). Diesel-Engine Management, Robert Bosch GmbH.
Kitahara, S., H. Takao, T. Hashimoto and S. Hatano (2005). "Improvement of Car
Interior Noise by Utilizing a Porous Intake Duct: Treatment Effect on an
Intake System." SAE Technical Paper 2005-01-2363.
Kobayashi, T. and K. Arase (1999). "Intake System Optimization by Intake Loss
Coefficient Method." SAE Technical Paper 1999-01-3337.
Kreith, F. and D. Y. Goswami (2007). Handbook of Energy Efficiency and Renewable
Energy. London, CRC Press.
207
Kubicki, M., H. C. Watson, J. Williams and P. C. Stryker (2007). "Spatial and
Temporal Temperature Distributions in a Spark Ignition Engine Piston at
WOT." SAE Technical Paper 2007-01-1436.
Kubota, M., K. Yoshida, H. Shoji and H. Tanaka (2002). "A Study of the Influence of
Fuel Temperature on Emission Characteristics and Engine Performance of
Compression Ignition Engine." SAE Technical Paper 2002-32-1777.
Kutz, M. (2006). Mechanical Engineers Handbook - Energy and Power (3rd Edition).
New Jersey, John Wiley & Sons.
Labeckas, G. and S. Slavinskas (2006). "The Effect of Rapeseed Oil Methyl Ester on
Direct Injection Diesel Engine Performance and Exhaust Emissions." Energy
Conversion and Management 47 (2006) 1954-1967.
Ladommatos, N., S. M. Abdelhalim, H. Zhao and Z. Hu (1998). "Effects of EGR on
Heat Release in Diesel Combustion." SAE Technical Paper 980184.
Lapuerta, M., O. Armas and R. Ballesteros (2002). "Diesel Particulate Emissions from
Biofuels Derived from Spanish Vegetable Oils." SAE Technical Paper 2002-
01-1657.
Lee, K.-H. (1998). "A Study on the Influence of Plastic Intake Manifold on the
Performance and NVH of In-line 4 Cylinder Gasoline Engine." SAE Technical
Paper 980728.
Lejsek, D. and A. Kulzer (2009). "Investigations on the Transient Wall Heat Transfer
at Start-Up for SI Engines with Gasoline Direct Injection." SAE Technical
Paper 2009-01-0613.
208
Li, Y., L. Li, J. Xu, X. Gong, S. Liu and S. Xu (2000). "Effects of Combination and
Orientation of Intake Ports on Swirl Motion in Four-Valve DI Diesel Engines."
SAE Technical Paper 2000-01-1823.
Lilly, L. C. R. (1984). Diesel Engine Reference Book. London, Butterworths.
Ling, J. and L. T. Y. Tun (2006). "CFD Analysis of Non-Symmetrical Intake
Manifold for Formula SAE Car." SAE Technical Paper 2006-01-1976.
Liu, I. (1999). Environmental Engineers Handbook. London, CRC Press.
Mahallawy, F. E. and S. E. Habik (2002). Fundamental and Technology of
Combustion. Oxford, Elsevier.
Mahrous, A.-F. M. (2008). A CFD Study of Fluid Flow Characteristics in an Engine
Cylinder with Negative Valve Overlapping. PhD Thesis, The University of
Birmingham.
Maiboom, A., X. Tauzia and J.-F. Hetet (2008). "Experimental study of various
effects of exhaust gas recirculation (EGR) on combustion and emissions of an
automotive direct injection diesel engine." Energy 33(1): 22.
Maiboom, A., X. Tauzia, J.-F. Hétet, M. Cormerais, M. Tounsi, T. Jaine and S.
Blanchin (2007). "Various Effects of EGR on Combustion and Emissions on
an Automotive DI Diesel Engine: Numerical and Experimental Study." 2007-
01-1834.
Manente, V., A. Vressner, P. Tunestal and B. Johansson (2008). "Validation of a Self
Tuning Gross Heat Release Algorithm." SAE Technical Paper 2008-01-1672.
Martyr, A. J. and M. A. Plint (2007). Engine Testing. New York, Butterworth-
Heinemann.
209
Mathew, B. A. and H. Wiebeck (1999). "Automotive Air Intake Manifold Application
using Nylon 6,6 Composite Material." SAE Technical Paper 1999-01-3011.
Meng, X., J. Yang, X. Xu, L. Zhang, Q. Nie and M. Xian (2008). "Biodiesel
production from oleaginous microorganisms." Renewable Energy.
Montgomery, D. T. and R. D. Reitz (1996). "Six-mode Cycle Evaluation of the Effect
of EGR and Multiple Injections ob Particulaye and NOx Emissions from a D.I.
Diesel Engine." SAE Technical Paper 960316.
Montgomery, D. T. and R. D. Reitz (1996). "Six-Mode Cycle Evaluation of the Effect
of EGR and Multiple Injections on Particulate and NOx Emissions from a D.I.
Diesel Engine." SAE Technical Paper 960316.
Motortorque (2008). Land Rover Freelander 2 Automatic Review.
http://motortorque.askaprice.com/images/news/inhouse/4539%5B1%5D-
03.jpg. Retrieved on 29/09/08.
Musculus, M. P. B. (2004). "On the Correlation between NOx Emissions and the
Diesel Premixed Burn." SAE Technical Paper 2004-01-1401.
Nwafor, O. M. I. (2003). "The Effect of Elevated Fuel Inlet Temperature on
Performance of Diesel Engine Running on Neat Vegetable Oil at Constant
Speed Conditions." Renewable Energy 28 (2003) 171-181.
Nwafor, O. M. I. (2004). "Emission Characteristics of Diesel Engine Operating on
Rapeseed Methyl Ester." Renewable Energy 29 (2004) 119-129.
Nwafor, O. M. I. (2004). "Emission Characteristics of Diesel Engine Running on
Vegetable Oil with Elevated Fuel Inlet Temperature." Biomass and Bioenergy
27 (2004) 507 - 511.
210
O'Connor, J. F. and N. R. McKinley (1998). "CFD Simulations of Intake Port Flow
Using Automatic Mesh Generation: Comparison With Laser Sheet, Swirl and
LDA Measurements for Steady Flow Conditions." SAE Technical Paper
980129.
Paffrath, H., M. Alex and K.-E. Hummel (1999). "Technology for Future Air Intake
Systems." SAE Technical Paper 1999-01-0266.
Patterson, M. S., S. C. Kong, G. J. Hampson and R. D. Reitz (1994). "Modelling the
Effect of Fuel Injection Characteristics on Diesel Engine Soot and NOx
Emissions." SAE Technical Paper 940523.
Pierburg, A. (2008). Intake Manifolds- Smart System with Low Weight and Multiple
Functions, Kolbenschmidt Pierburg Group.
Pierpont, D. A., D. T. Montgomery and R. D. Reitz (1995). "Reducing Particulate and
NOx Using Multiple Injections and EGR in a D.I. Diesel." SAE Technical
Paper 950217.
Quintero, H. F., C. A. Romero and L. V. V. Useche (2007). "Thermodynamic and
dynamic analysis of an internal combustion engine with a noncircular-gear
based modified crank-slider mechanism." 12th IFToMM World Congress,
Besançon (France).
Radavich, P. M., A. Selamet and J. M. Novak (2001). "Flow-Acoustic Coupling in
Quarter-Wave Resonators Using Computational Fluid Dynamics." SAE
Technical Paper 2001-01-1430.
Rakopoulos, C. D., K. A. Antonopoulos, D. C. Rakopoulos, D. T. Hountalas and E. G.
Giakoumis (2006). "Comparative Performance and Emissions Study of a
Direct Injection Diesel Engine Using Blends of Diesel Fuel with Vegetable
211
Oils or Bio-diesels of Various Origins." Energy Conversion and Management
47 (2006) 3272-3287.
Ricardo (2006). "Ricardo WAVE Knowledge Center 7.2."
Ricardo (2009). Ricardo WAVE Knowledge Center 7.2.
Safari, M., M. Ghamari and A. Nasiritosi (2003). "Intake Manifold Optimization by
Using 3-D CFD Analysis." SAE Technical Paper 2003-32-0073.
Senatore, A., M. Cardone, V. Rocco and M. V. Prati (2000). "A Comparative Analysis
of Combustion Process in D.I. Diesel Engine Fueled with Biodiesel and Diesel
Fuel." SAE Technical Journal 2000-01-0691.
Siavoshani, S., M. Stickler, H. Nehme and B. Krajewski (2001). "Analytical and
Experimental Techniques in Solving the Plastic Intake Manifold NVH." SAE
Technical Paper 2001-01-1544.
Siqueira, C. d. L. R., M. P. Kessler, L. A. R. d. Araújo and E. C. Rodrigues (2006).
"Three-dimensional Transient Simulation of an Intake Manifold using CFD
Techniques." SAE Technical Paper 2006-01-2633.
Smith, L. A., T. Fickenscher and R. P. Osborne (1999). "Engine Breathing - Steady
Speed Volumetric Efficiency and Its Validity Under Transient Engine
Operation." SAE Technical Paper 1999-01-0212.
Smith, P. H. (1971). The Scientific Design of Exhaust and Intake Systems. Oxford, G
T Foulis & Co Ltd.
Song, J.-E., S.-H. Yoon and S. M. Baek (2005). "A Study on the NVH Characteristic
for the Improvement of Plastic Intake Manifold." SAE Technical Paper 2005-
03-0166.
212
Stenlåås, O., A. Gogan, R. Egnell, B. Sundén and F. Mauss (2002). "The Influence of
Nitric Oxide on the Occurrence of Autoignition in the End Gas of Spark
Ignition Engines." 2002-01-2699.
Stiech, G. (2003). Modeling Engine Spray and Combustion Processes, Springer.
Superflow (2008). SF1020-SB Super Bench- Automated and Control External
Devices. http://www.superflow.com/flowbenches/index_1157.cfm. Retrieved
on 21/11/08.
Szybist, J. P. and A. L. Boehman (2003). "Behavior of a Diesel Injection System with
Biodiesel Fuel." SAE Technical Paper 2003-01-1039.
Szybist, J. P., J. Song, M. Alam and A. L. Boehman (2007). "Biodiesel Combustion,
Emissions and Emission Control." Fuel Processing Technology 88 (2007)
679–691.
Tanaka, H. and S. Kitagawa (2007). "Development of a Plastic Intake Manifold with
CAE." SAE Technical Paper 2007-01-3549.
Tat, M. E. (2003). Investigation of oxides of nitrogen emissions from biodiesel-fueled
engines, Iowa State University. PhD thesis.
Tompkins, B. T., J. Esquivel and T. J. Jacobs (2009). "Performance Parameter
Analysis of a Biodiesel-Fuelled Medium Duty Diesel Engine." SAE Technical
Paper 2009-01-0481.
Transport, D.-G. f. E. a. (2004). "European Commission. Promoting Biofuels in
Europe -Securing a Cleaner Future for Transport." Directorate-General for
Energy and Transport.
Tsolakis, A., A. Megaritis, M. L. Wyszynski and K. Theinnoi (2007). "Engine
Performance and Emissions of a Diesel Engine Operating on Diesel-RME
213
(Rapeseed Methyl Ester) Blends with EGR (Exhaust Gas Recirculation)."
Energy 32 (2007) 2072-2080.
Tsubokura, M., T. Kobayashi, T. Nakashima, T. Nouzawa and T. Nakamura (2008).
"Computational visualization of unsteady flow around vehicles using high
performance computing." Journal Computers and Fluids.
Venugopalan, S., M.-C. Lai, F. Wu, W. S. University and F. M. Washko (2005).
"Experimental and Simulation Analysis of PFI-SI Engine for Fuel Economy
Improvement." SAE Technical Paper 2005-01-3691.
Versteeg, H. K. and W. Malalasekera (1995). An Introduction to Computational Fluid
Dynamics. London, Longman.
Watson, N., A. D. Pilley and M. Marzouk (1980). "A Combustion Correlation for
Diesel Engine Simulation." SAE Technical Paper 800029.
Wendt, J. F. (1992). Computational Fluid Dynamics. Berlin, Springer Verlag.
Wilcox, D. C. (1994). Turbulence Modeling for CFD. California, DCW Industries,
Inc.
Williams, F. A. (1985). Combustion Theory. California, The Benjamin/Cummings
Publishing Company, Inc.
Winterbone, D. E. and R. J. Pearson (1999). Design Techniques for Engine
Manifolds”. London, Prefessional Engineering Publishing.
Woschni, G. (1967). "Universally Applicable Equation for the Instantaneous Heat
Transfer Coefficient in the Internal Combustion Engine." SAE Technical
Paper 670931.
Xu, H. (2001). "Some Critical Issues on the Steady Flow Testing of Cylinder Heads."
SAE Technical Papers 2001-01-1308.
214
Yang, B., A. M. Mellor and S. K. Chen (2002). "Multiple Injections with EGR Effects
on NOx Emissions for DI Diesel Engines Analyzed Using an Engineering
Model." SAE Technical Paper 2002-01-2774.
Yoon, S. H., H. K. Suh and C. S. Lee (2009). "Effect of Spray and EGR Rate on the
Combustion and Emission Characteristics of Biodiesel Fuel in a Compression
Ignition Engine." Energy & Fuels
Vol 23(3): 1486-1493.
Zheng, M., M. C. Mulenga, G. T. Reader, M. Wang, D. S. K. Ting and J. Tjong
(2008). "Biodiesel Engine Performance and Emissions in Low Temperature
Combustion." Fuel 87(6): 714.
Zheng, M., G. T. Reader and J. G. Hawley (2004). "Diesel Engine Exhaust Gas
Recirculation--a Review on Advanced and Novel Concepts." Energy
Conversion and Management 45 (2004) 883-900.
Zhu, H. and Z. Yang (2008). "Simulation of Flow around a Generic Pickup Truck
with RSM Model." SAE Technical Paper 2008-01-0324.
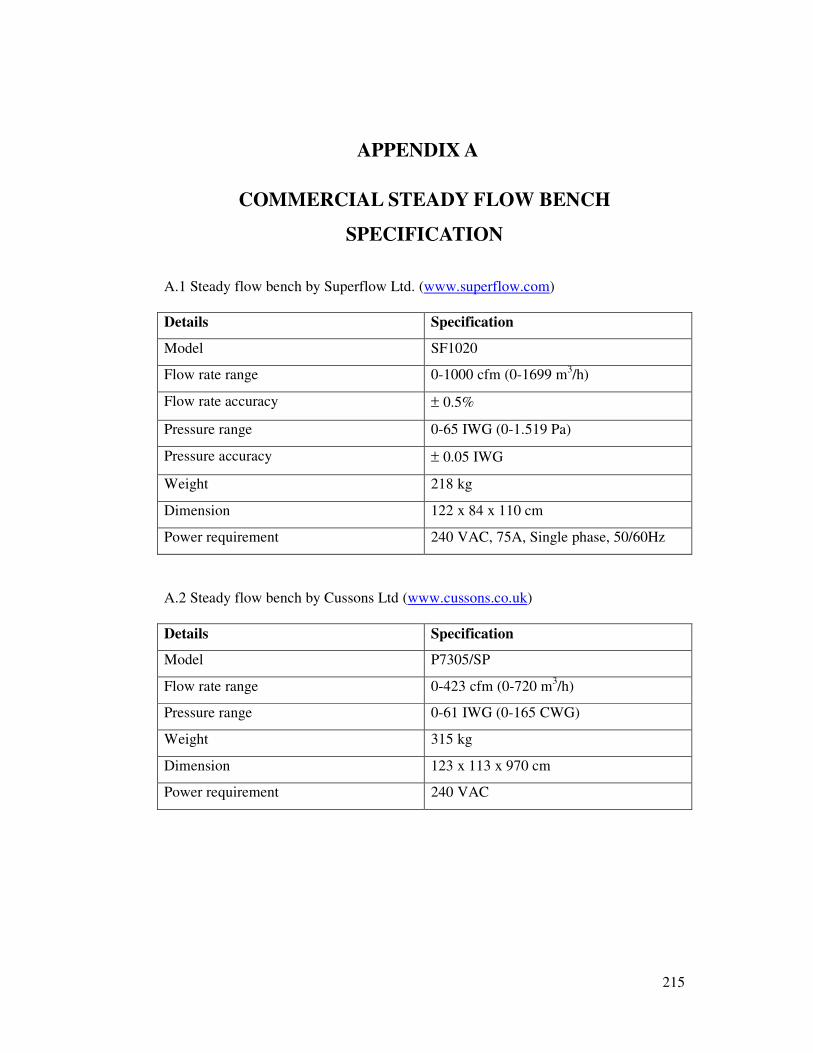
215
APPENDIX A
COMMERCIAL STEADY FLOW BENCH
SPECIFICATION
A.1 Steady flow bench by Superflow Ltd. (www.superflow.com) Details Specification
Model SF1020
Flow rate range 0-1000 cfm (0-1699 m3/h)
Flow rate accuracy ± 0.5%
Pressure range 0-65 IWG (0-1.519 Pa)
Pressure accuracy ± 0.05 IWG
Weight 218 kg
Dimension 122 x 84 x 110 cm
Power requirement 240 VAC, 75A, Single phase, 50/60Hz
A.2 Steady flow bench by Cussons Ltd (www.cussons.co.uk) Details Specification
Model P7305/SP
Flow rate range 0-423 cfm (0-720 m3/h)
Pressure range 0-61 IWG (0-165 CWG)
Weight 315 kg
Dimension 123 x 113 x 970 cm
Power requirement 240 VAC
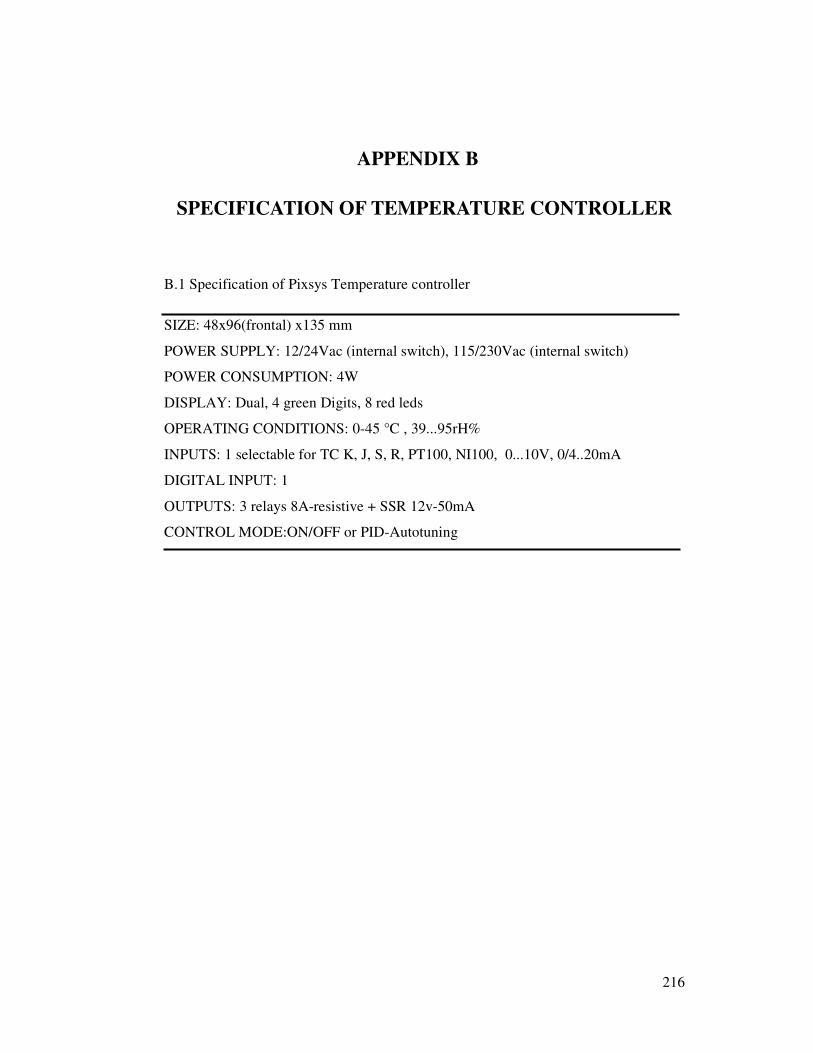
216
APPENDIX B
SPECIFICATION OF TEMPERATURE CONTROLLER
B.1 Specification of Pixsys Temperature controller
SIZE: 48x96(frontal) x135 mm
POWER SUPPLY: 12/24Vac (internal switch), 115/230Vac (internal switch)
POWER CONSUMPTION: 4W
DISPLAY: Dual, 4 green Digits, 8 red leds
OPERATING CONDITIONS: 0-45 °C , 39...95rH%
INPUTS: 1 selectable for TC K, J, S, R, PT100, NI100, 0...10V, 0/4..20mA
DIGITAL INPUT: 1
OUTPUTS: 3 relays 8A-resistive + SSR 12v-50mA
CONTROL MODE:ON/OFF or PID-Autotuning
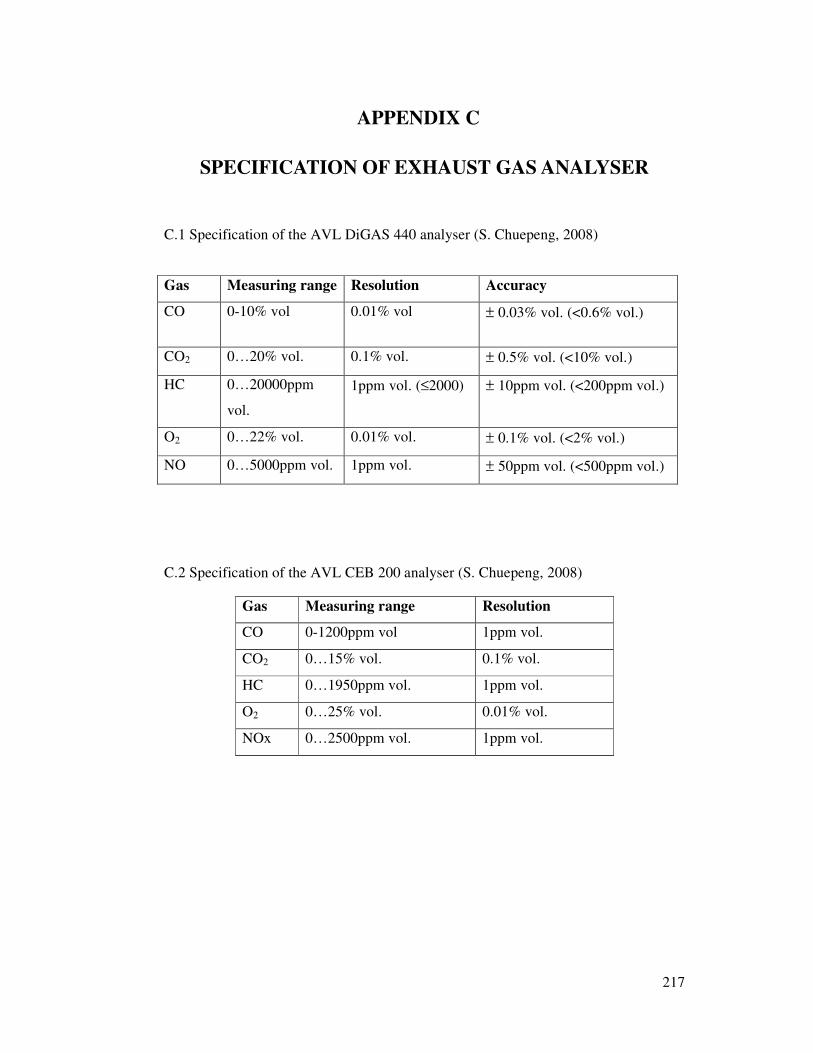
217
APPENDIX C
SPECIFICATION OF EXHAUST GAS ANALYSER
C.1 Specification of the AVL DiGAS 440 analyser (S. Chuepeng, 2008)
Gas Measuring range Resolution Accuracy
CO 0-10% vol 0.01% vol ± 0.03% vol. (<0.6% vol.)
CO2 0…20% vol. 0.1% vol. ± 0.5% vol. (<10% vol.)
HC 0…20000ppm
vol.
1ppm vol. (≤2000) ± 10ppm vol. (<200ppm vol.)
O2 0…22% vol. 0.01% vol. ± 0.1% vol. (<2% vol.)
NO 0…5000ppm vol. 1ppm vol. ± 50ppm vol. (<500ppm vol.)
C.2 Specification of the AVL CEB 200 analyser (S. Chuepeng, 2008)
Gas Measuring range Resolution
CO 0-1200ppm vol 1ppm vol.
CO2 0…15% vol. 0.1% vol.
HC 0…1950ppm vol. 1ppm vol.
O2 0…25% vol. 0.01% vol.
NOx 0…2500ppm vol. 1ppm vol.
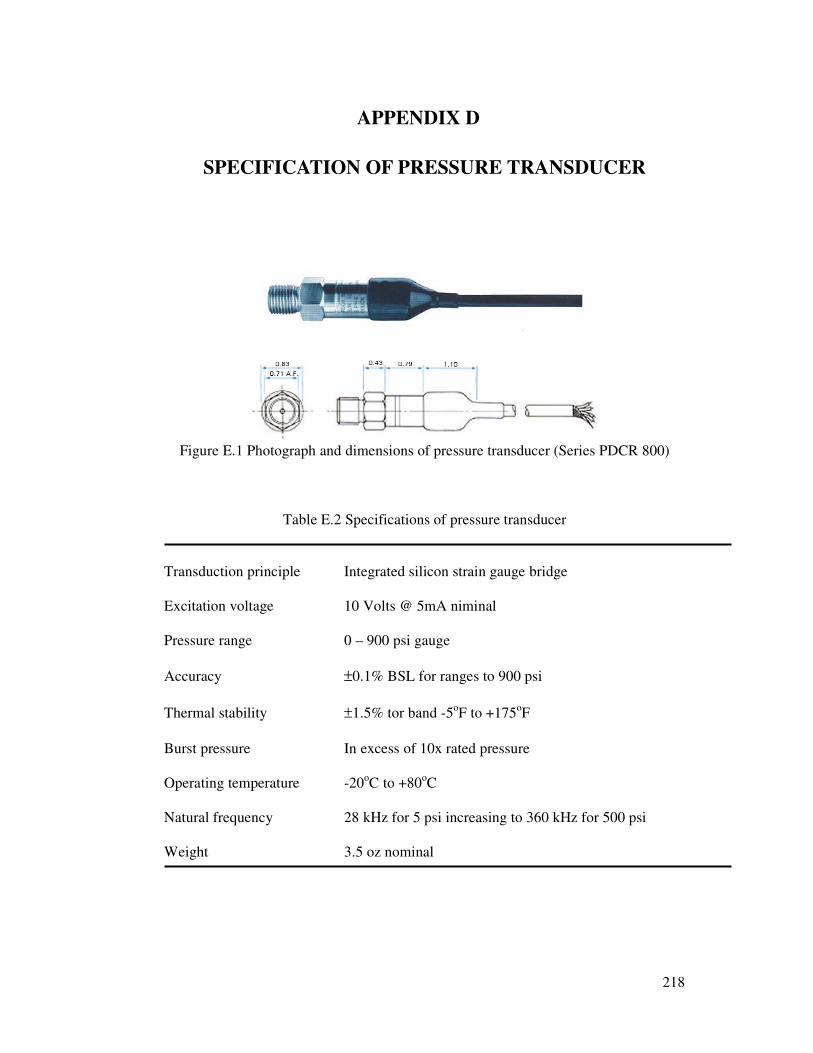
218
APPENDIX D
SPECIFICATION OF PRESSURE TRANSDUCER
Figure E.1 Photograph and dimensions of pressure transducer (Series PDCR 800)
Table E.2 Specifications of pressure transducer
Transduction principle Integrated silicon strain gauge bridge
Excitation voltage 10 Volts @ 5mA niminal
Pressure range 0 – 900 psi gauge
Accuracy ±0.1% BSL for ranges to 900 psi
Thermal stability ±1.5% tor band -5oF to +175oF
Burst pressure In excess of 10x rated pressure
Operating temperature -20oC to +80oC
Natural frequency 28 kHz for 5 psi increasing to 360 kHz for 500 psi
Weight 3.5 oz nominal
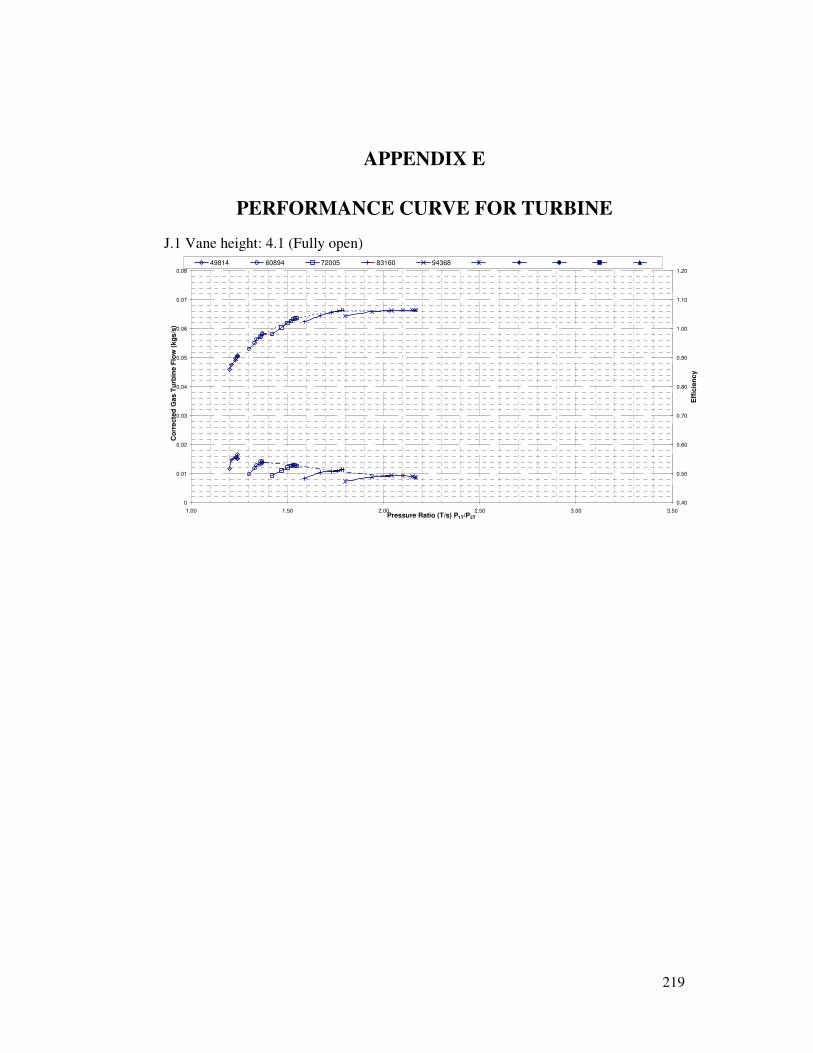
219
APPENDIX E
PERFORMANCE CURVE FOR TURBINE
J.1 Vane height: 4.1 (Fully open)
0
0.01
0.02
0.03
0.04
0.05
0.06
0.07
0.08
1.00 1.50 2.00 2.50 3.00 3.50Pressure Ratio (T/s) P1T/P2T
Co
rre
cte
d G
as T
urb
ine F
low
(k
gs
/s)
0.40
0.50
0.60
0.70
0.80
0.90
1.00
1.10
1.20
Eff
icie
nc
y
49814 60894 72005 83160 94368
A U T O M O T I V E