Embed Size (px)
Citation preview

July 2002
ECN-C--02-080
PERFORMANCE AND ACCEPTANCE OF
ELECTRIC AND HYBRID VEHICLES
Determination of attitude shifts and energy consumption of electric and
hybrid vehicles used in the ELCIDIS project
H. Jeeninga
W.G. van Arkel
C.H. Volkers

2 ECN-C--02-080
Acknowledgement This study has been carried out as part of the ‘Electric Vehicle City Distribution’-project
(ELCIDIS) (TR 0048/97). This project is co-ordinated by the Municipality of Rotterdam. The
ECN project number was 7.7179.
Summary The goal of the ELCIDIS project (Electric Vehicle City Distribution Systems) is to demonstrate
the suitability of clean and silent hybrid and electric vehicles in urban distribution activities.
This is done by means of practical demonstrations in six European cities. These demonstration
projects include setting up an electric vehicle based goods distribution system and assessment of
the efficiency and environmental impact of the electric and hybrid vehicles. The contribution of
the Energy Research Centre of the Netherlands (ECN) existed of two tasks:
1) Measurement and analyses of (shifts in) opinion about the use of and opportunities for elec-
tric and hybrid vehicles.
2) Analyses of energy consumption of the electric and hybrid vehicles used in the ELCIDIS
project.
Two questionnaires have been developed. The first questionnaire had to be filled in before the
vehicles were put into operation. The second questionnaire was repeated every couple of months
during the period of operation of the vehicle, in order to be able to observe shifts in attitude and
preferences. When comparing the expected performance (first questionnaire) with the actual
performance (second questionnaire), it was found that for most aspects the actual performance is
lower than the expected performance (so the vehicles are performing less well than expected).
Largest differences (decrease) between expected performances and actual performance were
found for ‘energy use’, ‘suitable for our organisation’, ‘safety’. The most important drawbacks
of electric and hybrid vehicles mentioned were ‘radius of action’ and ‘power of the engine’.
During the project, some of the vehicles have covered large distances. The three electric vehi-
cles in Stockholm drove over 13.000 km during the project. The maximum distance driven on
one single day ranged from 39 to 84 km for these vehicles. The vehicles in Stockholm use more
energy per km (0.55 ± 0.06) in comparison to comparable vehicles in Lombardia (0.35 ± 0.02)
and Stavanger (0.31 ± 0.02). The differences in specific energy consumption cannot be ex-
plained by means of differences in average trip length of driving style.

ECN-C--02-080 3
CONTENTS
LIST OF TABLES 4
LIST OF FIGURES 4
1. INTRODUCTION 7
2. VALUATION OF THE USE OF THE ELECTRIC AND HYBRID VEHICLES 8 2.1 Introduction 8 2.2 The questionnaires 8
2.3 Results of Questionnaire 1 9
2.3.1 Respondents 9 2.3.2 Objectives 10
2.3.3 Objectives of the project and expected performance 11
2.3.4 Importance and expectations of several aspects related to the use of the
vehicles 13
2.3.5 Statements 16
2.4 Results of Questionnaire 2 17
2.4.1 Respondents 17
2.4.2 Information provided 18
2.4.3 Experiences 19
2.4.4 Overall opinion 22
2.4.5 General statements 23
2.4.6 Shifts in valuation of the vehicles 25
2.5 General conclusions derived from the questionnaires 26
3. ENERGY CONSUMPTION 36 3.1 Introduction 36
3.2 Total distance driven 37
3.3 Specific energy consumption 40
3.4 Temperature and energy consumption 44
4. CONCLUSIONS AND RECOMMENDATIONS 45 4.1 Attitude and opinion 45
4.2 Specific energy consumption 46
APPENDIX A 47
APPENDIX B 67
REFERENCES 80

4 ECN-C--02-080
LIST OF TABLES
Table 2.1 Number of questionnaires received per city 9 Table 3.1 Overview of types of vehicles per city for the ELCIDIS project 36 Table 3.2 Location and type of vehicles equipped with the mobi-box system 37 Table 3.3 Overview of the performance of the vehicles equipped with the mobi-box
system in the ELCIDIS project 42
LIST OF FIGURES
Figure 2.1 Position at the job of the respondents of questionnaire 1 (n = 72) 10 Figure 2.2 Average value per city for three objectives of the ELCIDIS project for electric
vehicles 10 Figure 2.3 Average value per city for three objectives of the ELCIDIS project for hybrid
vehicles (er = Erlangen (hybrid vehicle), rm = Rotterdam (hybrid trucks), zw =
Stockholm (hybrid trucks)) 11 Figure 2.4 Relevancy of the objectives of the ELCIDIS project vs. expected performance
of electric vehicles 12 Figure 2.5 Relevancy of the objectives of the ELCIDIS study vs. expected performance of
hybrid cars 12 Figure 2.6 Relevancy of the objectives of the ELCIDIS study vs. expected performance of
hybrid trucks 13 Figure 2.7 Importance and expectations for several issues related to the use of electric
vehicles 14 Figure 2.8 Importance and expectations for several issues related to the use of hybrid cars
and trucks 15 Figure 2.9 Importance vs. expectations of several relevant aspects related to the use of
electric and hybrid vehicles 16 Figure 2.10 Score on different general statements regarding the prospects of electric and
hybrid vehicles for respondents using electric vehicles and respondents using
hybrid vehicles 17 Figure 2.11 Position at the job of the respondents of questionnaire 2 (n = 103) 18 Figure 2.12 Way of receiving information about the ELCIDIS project 18 Figure 2.13 Frequency of aspects on which more information is requested 19 Figure 2.14 Average score of different aspects of the actual performance of the electric
vehicles 20 Figure 2.15 Difference between expected performance and actual performance of several
properties of the electric and hybrid vehicles 21 Figure 2.16 Difference between importance and actual performance of several properties of
the electric and hybrid vehicles 22 Figure 2.17 Overall opinion about the actual performance of electric vehicles and hybrid
cars and trucks 23 Figure 2.18 Average score on several statements for electric and hybrid vehicles (1 = I
totally disagree, 10 = I totally agree) 23 Figure 2.19 Differences between the score on several general statements given at
the start of the project (based on expectations) and during the project
(based on experiences) 24 Figure 2.20 Average score on several statements for hybrid cars 25 Figure 2.21 Average score on several statements for hybrid trucks 25

ECN-C--02-080 5
Figure 2.22 Opinion about the vehicle normally used vs. expected performance of electric
vehicles 27 Figure 2.23 Opinion about the vehicle normally used vs. expected energy use of electric
vehicles 28 Figure 2.24 Familiarity with the use of electric vehicles vs. the expected performance of
electric vehicles 28 Figure 2.25 Familiarity with the use of electric vehicles vs. the expected performance of
hybrid cars 29 Figure 2.26 Familiarity with the use of electric vehicles vs. the expected performance of
hybrid trucks 29 Figure 2.27 Expected performance vs. the overall opinion of electric vehicles 30 Figure 2.28 Expected performance vs. the overall opinion of hybrid vehicles 30 Figure 2.29 Quality of the information received vs. overall opinion about the vehicle (1= no
information, 2 = written information, 3 = face to face information, 4 = written as
well as face to face information, 5 = other) 31 Figure 2.30 Relationship between the number of drivers per vehicle and the overall opinion
about the vehicle. 32 Figure 2.31 Satisfaction with respect to the capacity of the batteries vs. radius of action 33 Figure 2.32 Satisfaction with respect to the capacity of the batteries vs. top speed 33 Figure 2.33 Satisfaction with respect to the capacity of the batteries vs. acceleration 33 Figure 2.34 Graphical presentation of the ‘occurrence of malfunctions’ vs. ‘availability’ 34 Figure 2.35 Graphical presentation of the ‘occurrence of malfunctions’ vs. ‘ease of
operation’ 34 Figure 2.36 Graphical presentation of the ‘occurrence of malfunctions’ vs. ‘reliability’ 34 Figure 2.37 Graphical presentation of the ‘occurrence of malfunctions’ vs. ‘suitable for our
organisation’ 34 Figure 2.38 Graphical presentation of the ‘occurrence of malfunctions’ vs. ‘overall opinion
about the vehicle’ 35 Figure 2.39 Existence of ‘adjustments in the organisation’ vs. ‘suitable for the organisation’ 35 Figure 2.40 Existence of ‘adjustments in the organisation’ vs. ‘overall opinion about the
vehicle’ 35 Figure 3.1 Total distance driven (km/month) during the ELCIDIS project for the electric
vehicles in La Rochelle 38 Figure 3.2 Total distance driven (km/month) during the ELCIDIS project for the electric
vehicles in Stavanger used at the Posten company 39 Figure 3.3 Total distance driven (km/month) during the ELCIDIS project for the electric
vehicles in Stavanger 39 Figure 3.4 Total distance driven (km/month) during the ELCIDIS project for the electric
vehicles in Stockholm 40 Figure 3.5 Specific energy consumption of the electric vehicles 41 Figure 3.6 Average daily distance [km/day] vs. specific energy consumption of the electric
vehicles [kWh/km] (deviant values, market as ×, are excluded) 41 Figure 3.7 Average monthly outdoor temperature [°C] vs. average monthly energy use
[kWh/km] for electric vehicles in Stavanger 44

6 ECN-C--02-080
ECN-C--02-080 7
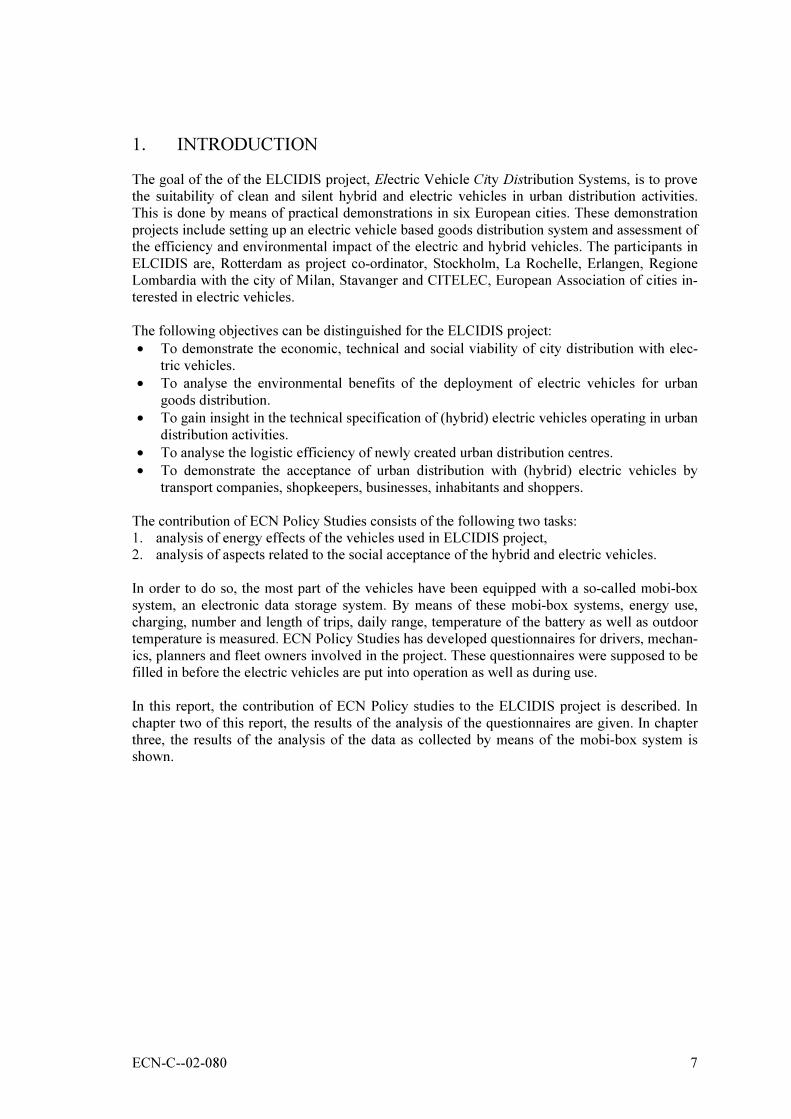
1. INTRODUCTION
The goal of the of the ELCIDIS project, Electric Vehicle City Distribution Systems, is to prove
the suitability of clean and silent hybrid and electric vehicles in urban distribution activities.
This is done by means of practical demonstrations in six European cities. These demonstration
projects include setting up an electric vehicle based goods distribution system and assessment of
the efficiency and environmental impact of the electric and hybrid vehicles. The participants in
ELCIDIS are, Rotterdam as project co-ordinator, Stockholm, La Rochelle, Erlangen, Regione
Lombardia with the city of Milan, Stavanger and CITELEC, European Association of cities in-
terested in electric vehicles.
The following objectives can be distinguished for the ELCIDIS project:
• To demonstrate the economic, technical and social viability of city distribution with elec-
tric vehicles.
• To analyse the environmental benefits of the deployment of electric vehicles for urban
goods distribution.
• To gain insight in the technical specification of (hybrid) electric vehicles operating in urban
distribution activities.
• To analyse the logistic efficiency of newly created urban distribution centres.
• To demonstrate the acceptance of urban distribution with (hybrid) electric vehicles by
transport companies, shopkeepers, businesses, inhabitants and shoppers.
The contribution of ECN Policy Studies consists of the following two tasks:
1. analysis of energy effects of the vehicles used in ELCIDIS project,
2. analysis of aspects related to the social acceptance of the hybrid and electric vehicles.
In order to do so, the most part of the vehicles have been equipped with a so-called mobi-box
system, an electronic data storage system. By means of these mobi-box systems, energy use,
charging, number and length of trips, daily range, temperature of the battery as well as outdoor
temperature is measured. ECN Policy Studies has developed questionnaires for drivers, mechan-
ics, planners and fleet owners involved in the project. These questionnaires were supposed to be
filled in before the electric vehicles are put into operation as well as during use.
In this report, the contribution of ECN Policy studies to the ELCIDIS project is described. In
chapter two of this report, the results of the analysis of the questionnaires are given. In chapter
three, the results of the analysis of the data as collected by means of the mobi-box system is
shown.

8 ECN-C--02-080
2. VALUATION OF THE USE OF THE ELECTRIC AND HYBRID
VEHICLES
2.1 Introduction
The succeeding of a transition from a conventional gasoline based urban transportation system
towards a sustainable way of transportation, might depend on a quite number of critical factors.
The substitution of conventional vehicles through electric and/or hybrid vehicles involves not
only economical and environmental aspects, but aspects of social acceptance might be as rele-
vant as i.e. the cost-effectiveness.
In order to determine possible barriers with respect to the valuation of electric and hybrid vehi-
cles, two questionnaires have been developed. The questionnaires are supposed to be filled in by
the critical actors, such as drivers, fleet owners and planners. The first questionnaire has to be
filled in before the electric and hybrid vehicles are put into operation. The second questionnaire
is supposed to be filled in every couple of months as soon as the vehicles are taken into service.
By comparing the results of the first and the second questionnaire, a possible shift in the valua-
tion of the vehicles as a result of the (first) experiences using the vehicles can be determined.
The first questionnaire measures primary the expected judgement, which is in generally based
on limited or even no relevant experience with electric or hybrid vehicles. The second question-
naire measures the appreciation at the time that the critical actors have had (at least) some actual
experiences using the vehicles. This comparison might for instance indicate whether or not
some of the critical actors are prejudiced (in either a positive of negative sense).
By comparing several samples of the second questionnaire filled in by the same respondent,
shifts in time of the appreciation of the respondent during the actual use of the vehicles can be
observed. I.e. in the first phase of the project, some initial technical problems could occur,
which might influence the judgement negatively. However, when the system has overcome pos-
sible initial problems, one might expect a rise again in appreciation.
First, a short description of the contents is given (Section 2.2). Next, the score of questionnaire
one (Section 2.3) and two are given (Section 2.4). Chapter 2 concludes with the general results
that can be drawn from the comparison between the questionnaires.
2.2 The questionnaires
The first questionnaire, Q1, makes an inventory of expectations and experiences before the elec-
tric or hybrid vehicle is put in use. By means of questionnaire one, the following topics are ad-
dressed, see also Appendix A:
• The type of vehicle that is being used by the driver during working hours are asked (fuel
type, opinion).
• The objectives of the ELCIDIS project (familiarity, importance).
• Past experiences with hybrid and electric vehicles.
• Expectation as well as the importance with respect to the performance of the electric or hy-
brid vehicle (i.e. reliability, energy consumption, noise, acceleration, etc.)
• General statements with respect to benefits and use of electric and hybrid vehicles. The re-
spondent is asked to indicate whether or not they agree.

ECN-C--02-080 9
Part of the questions of questionnaire 1 are repeated in questionnaire 2 (Q2). In questionnaire 2,
the following issues are addressed, see also Appendix A:
• Use of the electric and/or hybrid vehicle (duration, distance etc.).
• Valuation of the information received at the start of the ELCIDIS project.
• Valuation of the performance of the electric or hybrid vehicle (i.e. reliability, energy
consumption, noise, acceleration, etc.) This question is almost identical to the question
asked in Q1.
• General opinion about the ELCIDIS project.
• Technical issues (i.e. charging of batteries, reliability, comparison between vehicles, mal-
functions).
• Comparison (benefit/drawback) of the electric or hybrid vehicle with a conventional vehi-
cle.
• Possible improvements (technical, organisation).
• General statements with respect to benefits and use of electric and hybrid vehicles. This
question is identical to the question asked in Q1.
As stated before, Q1 has to be filled in (only one time) before the electric or hybrid vehicle is
put in use. Q2 has to be filled for the first time a couple of weeks after the electric or hybrid ve-
hicle is put into use. From that time, Q2 is supposed to be filled in (about) every couple of
months. Q2 is repeated a couple of times a year. Therefore, some of the drivers who make use
of the electric or hybrid vehicle for a longer period (i.e. a year or more) have to fill in Q2 several
times. In Table 2.1, the number of questionnaires received per city is given.
Table 2.1 Number of questionnaires received per city
City Questionnaire 1 Questionnaire 2
Stavanger 17 25
Stockholm 20 28
La Rochelle 6 4
Region de Lombardia/Milan 8 20
Erlangen 18 22
Rotterdam 3 4
Total 72 103
2.3 Results of Questionnaire 1
When looking at the results of questionnaire 1, one should bear in mind that this questionnaire
was filled before the electric and/or hybrid vehicle was put into use. Therefore, it deals with ex-
pectations rather than experiences.
2.3.1 Respondents
In Figure 2.1, the position at the job of the respondents of the first questionnaire is given. About
50% of the respondents were driver of the vehicle. About 20% of the questionnaires were filled
in by fleet managers, 13% by ‘others’ and 11% by planners.

10 ECN-C--02-080
3%
49%
11%
6%
18%
13%
administrator driver planner
technical staff, mechanic fleet manager other
Figure 2.1 Position at the job of the respondents of questionnaire 1 (n = 72)
2.3.2 Objectives
In Figure 2.2, the average score for the relevance of the different objectives of the ELCIDIS
project is given for the cities using electric vehicles. The objective ‘more efficient distribution’
has the lowest score for each city besides La Rochelle. This can be explained by the fact that in
La Rochelle, as a result of the ELCIDIS project, a new distribution system was put into use. In
the city of Milan, the objective ‘environmental benefits’ did score relatively high.
Figure 2.2 Average value per city for three objectives of the ELCIDIS project for electric
vehicles (mi = Region de Lombardia, Milan, ro = La Rochelle, st = Stavanger,
zw = Stockholm)
The average value for the objectives of the ELCIDIS project per participating company using
electric vehicles is given in Figure B.1 of Appendix B.
The average score for the objectives of the ELCIDIS project for hybrid cars and trucks is shown
in Figure 2.3. The objective ‘more efficient distribution’ was regarded to be the least important

ECN-C--02-080 11
objective. This can be explained by the fact that the basically the transportation system was un-
altered for these cities. In comparison to the other objectives, ‘environmental benefits’ was con-
sidered more important for hybrid trucks than for hybrid cars.
Figure 2.3 Average value per city for three objectives of the ELCIDIS project for hybrid
vehicles (er = Erlangen (hybrid vehicle), rm = Rotterdam (hybrid trucks),
zw = Stockholm (hybrid trucks))
2.3.3 Objectives of the project and expected performance
Next, it is investigated whether or not there exists a relationship between the average score for
the objectives (relevancy) of the ELCIDIS report and the expected performance of the electric
and hybrid vehicles, see Figure 2.4. The basic assumption is that a high score for the relevancy
of the objectives goes together with high expectations with respect to the performance of the
vehicles.

12 ECN-C--02-080
109 87 6 5 4 3
10
8
6
4
2
0
Expectations (average)
Relevancy of objectives
Figure 2.4 Relevancy of the objectives of the ELCIDIS project vs. expected performance of
electric vehicles
When looking at Figure 2.4 - Figure 2.6, there is no statistical evidence for the existence of a
relationship between the average score on the relevancy of the objectives of the ELCIDIS pro-
ject and the expected performance of the electric and hybrid vehicles (R2 < 0.012).
10 9 8 76 5 4 3
9
8
7
6
5
4
3
2
1
Expectations (average)
Relevancy of objectives
Figure 2.5 Relevancy of the objectives of the ELCIDIS study vs. expected performance of hybrid
cars

ECN-C--02-080 13
10 98 7 65 4
8.5
8.0
7.5
7.0
6.5
6.0
5.5
5.0
4.5
Expectations (average)
Relevancy of objectives
Figure 2.6 Relevancy of the objectives of the ELCIDIS study vs. expected performance of hybrid
trucks
2.3.4 Importance and expectations of several aspects related to the use of the vehicles
In the first questionnaire, the respondents are asked to score several aspects related to the use of
electric and hybrid vehicles on relevance and expectations. In Figure 2.7, the score for the im-
portance as well as expectation for the different aspects is given for electric vehicles.

14 ECN-C--02-080
0
1
2
3
4
5
6
7
8
9
10
relia
bility
ener
gy u
se
full tim
e av
ailabi
lity
(24
hour
s)
mas
s of
load
ing
capa
city
(kg)
volum
e load
ing
capa
city (m
3)
low m
aint
enan
ce c
osts
design
, stylin
g
low e
ngin
e no
ise
enviro
nmen
tal frie
ndly
top
spee
d
acce
lera
tion
com
forta
ble
for d
river
optio
ns (a
irco,
ABS)
radius
of a
ctio
n
man
ouvr
ability
safe
ty
ease
of o
pera
tion
suita
ble
for o
ur o
rgan
isat
ion
importance expectation
Figure 2.7 Importance and expectations for several issues related to the use of electric vehicles
There seems to be a striking resemblance for the score on relevance and expectations for the dif-
ferent aspects related to the use of the electric vehicle. This means that those aspects that are
scored low on expectations are also considered being of less importance. Issues that are consid-
ered to be very important have also a high score on expected performance. This would suggest
that, it is expected that the electric vehicles have no real weaknesses (high importance and low
expectations). Highest score with respect to the importance of the different aspects are found for
safety (8.7), suitable for our organisation (8.4), environmental friendly, reliability, ease of op-
eration and comfortable for driver (8.3). These aspects have also the highest score on expecta-
tions. Aspects such as design and style (5.5) as well as full time availability (6.2) and options
like airco and ABS (6.2) are considered to be the least important. These options also score low-
est on expectations. The average score for both importance and expectations amounts to 7.4.
In Figure 2.8, the same graph is given for hybrid cars and trucks. Again, there seems to be a cor-
relation between those aspects that are considered to be important and those aspects that are ex-
pected to perform well. Reliability (8.9), environmental friendly and safety (8.4) and ease of op-
eration are considered to be the most important aspects with respect to the use of hybrid cars
and trucks. The aspects reliability (8.0), environmental friendly (8.3) and safety (8.0) are also
expected to perform well in practice. For ease of operation (7.3), the difference between the
score relevance and expected performance is relative large (0.9). However, the largest gap be-
tween relevance and expected performance is found for radius of action (8.0 vs. 6.5), so on
forehand, this aspect is identified as a possible weakness with respect to the use of hybrid cars
and trucks.

ECN-C--02-080 15
0
1
2
3
4
5
6
7
8
9
10
relia
bility
ener
gy u
se
full tim
e av
aila
bility
(24
hour
s)
mas
s of l
oadi
ng c
apac
ity (k
g)
volum
e load
ing
capa
city
(m3)
low m
aint
enan
ce cos
ts
design
, sty
ling
low e
ngin
e no
ise
enviro
nmen
tal frie
ndly
top
spee
d
acce
lera
tion
com
forta
ble fo
r driv
er
optio
ns (a
irco,
ABS)
radius
of a
ctio
n
man
ouvra
bility
safe
ty
ease
of o
pera
tion
suita
ble
for o
ur o
rgan
isat
ion
importance expectation
Figure 2.8 Importance and expectations for several issues related to the use of hybrid cars and
trucks
Remarkably, ‘suitable for our organisation’ is considered to be less relevant for hybrid cars and
trucks (7.4) in comparison to electric vehicles (8.4). This also yields for the expected suitability
(7.0 vs. 8.5). On forehand, one would expect that this issue would be considered to be of the
same relevance for electric vehicles and hybrid cars and trucks. The aspect ‘options like airco
and ABS is considered to be more relevant for hybrid cars and trucks (7.2) than for electric ve-
hicles (6.2). This also yields for full time availability ((7.2) vs. (6.2)). The mass of loading ca-
pacity and low engine noise are considered to be of less importance for hybrid vehicles (6.2)
than for electric vehicles (6.2 vs. 6.9 and 6.9 vs. 7.4).
With respect to the expected performance, largest differences between electric and hybrid vehi-
cles are found for suitable for our organisation (EV: 8.5 hybrid: 7.0), low maintenance costs
(EV: 8.1, hybrid: 6.7) and mass of loading capacity (EV: 7.3, hybrid: 6.0).
In order to investigate the existence of a correlation between expected performance and rele-
vancy, the score for the different aspects are plotted in a graph, see Figure 2.9. Especially for the
electric vehicles, there is evidence for the existence of such a relationship (R2 = 0.76). This is
less obvious for hybrid vehicles (R2 = 0.59). The existence of this possible correlation could be
just coincidental, but might also imply that people might have had problems answering the
question.1 Another possible explanation could be that ‘wishful thinking’ might have influenced
the scores.2
1 Perhaps the difference between relevance and expectancy was not understood well enough. 2 If a certain aspect is considered to be very relevant, and the respondent wants the project to be a success (highly
motivated), this issue has also have to have a good score on expected performance.

16 ECN-C--02-080
R2 = 0.76
R2 = 0.59
5
6
7
8
9
5 6 7 8 9
EV Hybrid Lineair (EV) Lineair (Hybrid)
Figure 2.9 Importance vs. expectations of several relevant aspects related to the use of electric
and hybrid vehicles
2.3.5 Statements
In the first questionnaire, some statements are included in order to make an inventory of the
opinion about some general issues related to the prospects of electric and hybrid vehicles. The
respondents are asked to give their opinion about the following statements (ranked A to N):
(A)
(B)
(C)
(D)
(E)
(F)
(G)
(H)
(I)
(J)
(K)
(L)
(M)
Electric vehicles certainly have a future in urban goods distribution.
Electric vehicles have no prospect without governmental support.
Electric vehicles fit in easily in our organisation.
Our town is very well suited for distribution of goods by means of electric vehicles.
Hybrid vehicles certainly have a future in urban goods distribution.
Hybrid vehicles have no prospect without governmental support.
Hybrid vehicles fit in easily in our organisation.
Our town is very well suited for distribution of goods by means of hybrid vehicles.
It is very important that in our town more ‘clean’ vehicles are deployed.
It is very important that in our town more ‘silent’ vehicles are deployed.
I have high expectations for the ELCIDIS project in our town.
Even if electric/hybrid transport turns out to be somewhat more expensive than conven-
tional transport, it should still be preferred to conventional transport.
I have high expectations of technological innovation in general.
The individual scores3 on these statements are shown in Figure 2.10. High scores are given for
(I) and (J), which dealt with the importance to use clean and silent vehicles. The respondents are
also quite optimistic about technological innovation (M).
3 Score from 1 – 10; 1 = I totally disagree, 10 = I totally agree.

ECN-C--02-080 17
0
1
2
3
4
5
6
7
8
9
10
A B C D E F G H I J K L M
EV hybrid
Figure 2.10 Score3 on different general statements regarding the prospects of electric and
hybrid vehicles for respondents using electric vehicles and respondents using
hybrid vehicles
The respondents involved in using hybrid vehicles are more optimistic about the prospects of
electric and hybrid vehicles without governmental support (issue (B) and (F)). For respondents
involved in the use of hybrid vehicles, a relative low score is found for (L), ‘preference of hy-
brid/electric vehicles even if they are a bit more expensive’.
2.4 Results of Questionnaire 2
The second questionnaire had to be answered every couple of months as soon as the vehicle was
put into use. Part of the questions as given in the first questionnaire is repeated in questionnaire
2.
2.4.1 Respondents
In Figure 2.11, the position at the job of the respondents of the second questionnaire is given.
Over 65% of the respondents were driver of the vehicle. About 13% of the questionnaires were
filled in by ‘others’ and 8% by planners.

18 ECN-C--02-080
3%
67%
8%
4%
5%
13%
driver/planner driver planner
technical staff, mechanic fleet manager other
Figure 2.11 Position at the job of the respondents of questionnaire 2 (n = 103)
2.4.2 Information provided
In Figure 2.12 the way information was received of the ELCIDIS project is given. About one
fifth of the respondents did not receive any information about the project. About 60% of the
people who did receive information were informed about the project by means of face-to-face
instructions (48% of the total). About 23% of the people who received information did obtain
this by written information as well as face-to-face instructions.
21%
12%
48%
18%
1%
I did not receive any information
I received written information
I received face to face instructions
I received written information and face to face instructions
Other
Figure 2.12 Way of receiving information about the ELCIDIS project
Next, the respondents are asked to indicate on what aspects more information is wanted, see
Figure 2.13. This yields for a number of aspects, such as economic and environmental aspects,
possibilities and limitations of the vehicle, energy consumption of the vehicle and the ELCIDIS
project.

ECN-C--02-080 19
0
5
10
15
20
25
hand
ling
the
vehi
cle
driving
char
acte
ristic
s of
the
vehi
cle
char
ging
the
batte
ries
capa
city of
the
batte
ries
ener
gy con
sum
ption
poss
ibilit
ies an
d lim
itatio
ns o
f the
veh
icle
tech
nica
l spe
cific
atio
ns
min
or re
pair
elec
tric
mot
or
maj
or re
pair
elec
tric
mot
or
(if h
ybrid
) min
or re
pair
com
bustion
mot
or
(if h
ybrid
) maj
or re
pair
com
bustion
mot
or
econ
omic a
spec
ts o
f the
veh
icle (c
osts
and
ben
efits
)
enviro
nmen
tal a
spec
ts o
f the
veh
icle
the
ELCID
IS p
roje
ct
othe
r, na
mel
y
Frequency
Figure 2.13 Frequency of aspects on which more information is requested
2.4.3 Experiences
In the first questionnaire, it is asked to score different aspects regarding the electric and hybrid
vehicles on expected performance, see Section 2.3.4. This question is repeated in the second
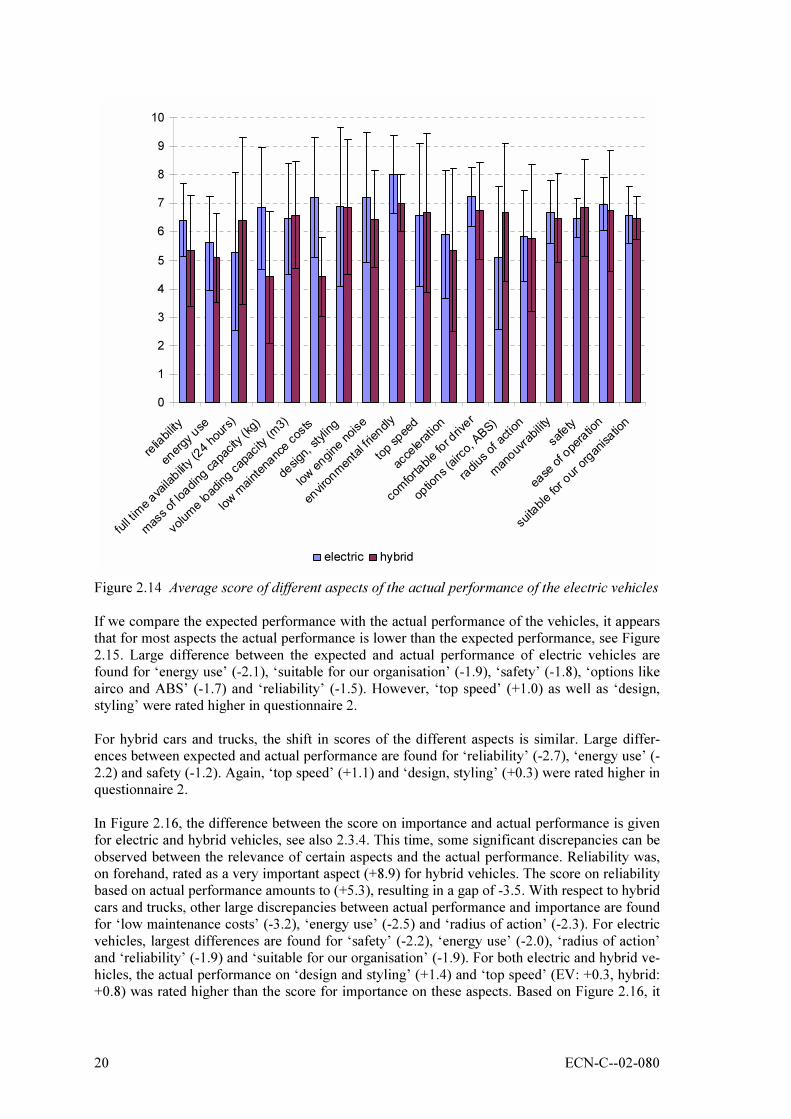
questionnaire. The results are shown in Figure 2.14. With respect to electric vehicles, highest
scores are found for ‘environmental friendly’ (8.0), ‘comfortable for driver’ and ‘low mainte-
nance costs’ (7.2). Remarkably, for hybrid vehicles the lowest score is given for ‘low mainte-
nance costs’ (4.4), as well as for ‘mass of loading capacity’ (4.4). For electric vehicles, the as-
pects ‘options like airco and ABS’ (5.1), ‘full time availability’ (5.3) and ‘energy use’ (5.6) are
rated relatively low. Highest score for hybrid vehicles is found for ‘environmental friendly’
(7.0).
20 ECN-C--02-080
0
1
2
3
4
5
6
7
8
9
10
relia
bility
ener
gy u
se
full tim
e ava
ilabilit
y (2
4 ho
urs)
mas
s of
loadi
ng c
apacity
(kg)
volum
e lo
ading c
apac
ity (m
3)
low
mai
nten
ance c
osts
design
, stylin
g
low
engi
ne n
oise
enviro
nmen
tal f
riendl
y
top
spee
d
acce
lera
tion
com
forta
ble
for d
river
optio
ns (a
irco,
ABS)
radi
us o
f act
ion
man
ouvra
bility
safe
ty
ease
of o
pera
tion
suita
ble
for o
ur o
rgan
isatio
n
electric hybrid
Figure 2.14 Average score of different aspects of the actual performance of the electric vehicles
If we compare the expected performance with the actual performance of the vehicles, it appears
that for most aspects the actual performance is lower than the expected performance, see Figure
2.15. Large difference between the expected and actual performance of electric vehicles are
found for ‘energy use’ (-2.1), ‘suitable for our organisation’ (-1.9), ‘safety’ (-1.8), ‘options like
airco and ABS’ (-1.7) and ‘reliability’ (-1.5). However, ‘top speed’ (+1.0) as well as ‘design,
styling’ were rated higher in questionnaire 2.
For hybrid cars and trucks, the shift in scores of the different aspects is similar. Large differ-
ences between expected and actual performance are found for ‘reliability’ (-2.7), ‘energy use’ (-
2.2) and safety (-1.2). Again, ‘top speed’ (+1.1) and ‘design, styling’ (+0.3) were rated higher in
questionnaire 2.
In Figure 2.16, the difference between the score on importance and actual performance is given
for electric and hybrid vehicles, see also 2.3.4. This time, some significant discrepancies can be
observed between the relevance of certain aspects and the actual performance. Reliability was,
on forehand, rated as a very important aspect (+8.9) for hybrid vehicles. The score on reliability
based on actual performance amounts to (+5.3), resulting in a gap of -3.5. With respect to hybrid
cars and trucks, other large discrepancies between actual performance and importance are found
for ‘low maintenance costs’ (-3.2), ‘energy use’ (-2.5) and ‘radius of action’ (-2.3). For electric
vehicles, largest differences are found for ‘safety’ (-2.2), ‘energy use’ (-2.0), ‘radius of action’
and ‘reliability’ (-1.9) and ‘suitable for our organisation’ (-1.9). For both electric and hybrid ve-
hicles, the actual performance on ‘design and styling’ (+1.4) and ‘top speed’ (EV: +0.3, hybrid:
+0.8) was rated higher than the score for importance on these aspects. Based on Figure 2.16, it

ECN-C--02-080 21
can be concluded that especially aspects such as reliability, energy use, radius of action and low
maintenance costs are identified as key elements that need improvement.
design, styling
comfortable for
driver
options (airco, ABS)
radius of action
manouvrability
safety
suitable for our
organisation
low maintenance
costs
volume loading
capacity (m3)mass of loading
capacity (kg)full time availability
(24 hours)
reliability
energy use
acceleration
top speed
environmental
friendly
low engine noise
ease of operation
-3 -2 -1 0 1 2
hybrid EV
Figure 2.15 Difference between expected performance and actual performance of several
properties of the electric and hybrid vehicles

22 ECN-C--02-080
manouvrability
safety
options (airco,
ABS)
design, styling
comfortable for
driver
radius of action
suitable for our
organisationease of operation
low engine noise
environmental
friendly
top speed
acceleration
energy use
reliability
full time availability
(24 hours)
mass of loading
capacity (kg)
volume loading
capacity (m3)
low maintenance
costs
-4 -3 -2 -1 0 1 2
hybrid EV
Figure 2.16 Difference between importance and actual performance of several properties of the
electric and hybrid vehicles
In questionnaire two, it was asked to give the two most important benefits and drawbacks of
electric and hybrid vehicles in comparison to a conventional combustion vehicle. Most impor-
tant benefits were ‘environment’ and ‘noise’. Most important drawbacks mentioned were ‘ra-
dius of action’ and ‘power of the engine’.
2.4.4 Overall opinion
In Figure 2.17 the score on ‘overall opinion’ of the electric and hybrid vehicles are given. High-
est score on overall opinion is found for the electric vehicle (+6.4 ± 1.8) and lowest score for
hybrid trucks (5.6 ± 1.5). Average score for hybrid cars amounted to (5.9 ± 1.2). Although the
number of respondent is quite high (n = 58), there still is a pretty large variance in the score on
‘overall opinion’ (standard deviation = 1.8). There seems to be relative little consistency with
respect to the opinion whether or not the vehicles are performing well or not.

ECN-C--02-080 23
0%
5%
10%
15%
20%
25%
30%
35%
40%
45%
1 2 3 4 5 6 7 8 9 10
overall opinion
share
EV (n = 58) Hybrid cars (n = 21) Hybrid trucks (n = 19)
Figure 2.17 Overall opinion about the actual performance of electric vehicles and hybrid cars
and trucks
2.4.5 General statements
Besides overall opinion, the users of the vehicles were also asked to give their opinion about
some general statements referring to the prospects of electric and hybrid vehicles, see also Sec-
tion 2.3.5. In Figure 2.18, the average score on these statements is given for electric and hybrid
vehicles.
0
1
2
3
4
5
6
7
8
9
10
A B C D E F G H I J L
EV hybrid
Figure 2.18 Average score on several statements for electric and hybrid vehicles (1 = I totally
disagree, 10 = I totally agree)

24 ECN-C--02-080
(A)
(B)
(C)
(D)
(E)
(F)
(G)
(H)
(I)
(J)
(K)
(L)
Electric vehicles certainly have a future in urban goods distribution.
Electric vehicles have no prospect without governmental support.
Electric vehicles fit in easily in our organisation.
Our town is very well suited for distribution of goods by means of electric vehicles.
Hybrid vehicles certainly have a future in urban goods distribution.
Hybrid vehicles have no prospect without governmental support.
Hybrid vehicles fit in easily in our organisation.
Our town is very well suited for distribution of goods by means of hybrid vehicles.
It is very important that in our town more ‘clean’ vehicles are deployed.
It is very important that in our town more ‘silent’ vehicles are deployed.
I have high expectations for the ELCIDIS project in our town.
Even if electric/hybrid transport turns out to be somewhat more expensive than
conventional transport, it should still be preferred to conventional transport.
For electric as well as hybrid vehicles, highest score is given for (I) ‘It’s important that more
clean vehicles are deployed in our town’. Again, see Section 2.3.5, a relative low score (imply-
ing disagreement) is given on (L) ‘even if the costs of electric/hybrid transport are somewhat
higher, it should be preferred to conventional transport’ by the respondents using hybrid vehi-
cles. If we compare the scores on the general statements as given at the start of the project and
during the project, a remarkable drop in the score on (A) ‘electric vehicles certainly have a fu-
ture in urban goods distribution’ can be observed. A increase in score is found for (B) ‘electric
vehicles have no prospect without governmental support’. So, the respondents involved in the
use of the electric vehicles have adjusted their opinion during the project in a way that they
think there is less future and more need for governmental support.
B
F
G
C
KJIHEDA
-1.5
-1.0
-0.5
0.0
0.5
1.0
EV Hybrid
Figure 2.19 Differences between the score on several general statements given at the start of
the project (based on expectations) and during the project (based on experiences)
For respondents involved in the use of EV’s as well as hybrid vehicles, a decrease in score
(agreement) van be observed for the statements (I), (J) and (K), being the need for deployment
of clean and silent vehicles and the expectations for the ELCIDIS project. Judging on the differ-
ences in score for (E) - (H) for ‘hybrid’, in comparison to the differences for (A) - (D) for ‘EV’,

ECN-C--02-080 25
one might conclude that the experiences gained during the project were less disappointing for
hybrid vehicles. However, further analysis shows that conclusion might not be valid for the hy-
brid cars (the Erlangen project), since very low scores were found on various relevant state-
ments concerning the prospects and future of hybrid cars, see Figure 2.20 and Figure 2.21.
preferred to conventional
high expectations
silent vehicles
clean vehicles
our town is suited
fit in easily
have no prospect
have future in
9
8
7
6
5
4
3
2
average
Figure 2.20 Average score on several statements for hybrid cars
preferred to conventional
high expectations
silent vehicles
clean vehicles
our town is suited
fit in easily
have no prospect
have future in
9.0
8.5
8.0
7.5
7.0
6.5
6.0
5.5
average
Figure 2.21 Average score on several statements for hybrid trucks
2.4.6 Shifts in valuation of the vehicles
Several drivers have filled in the second questionnaire a number of times during the project
(every couple of months). By comparing the score on different aspects of the valuation of the
vehicle, one might get an indication of possible shifts in opinion about these aspects during the
project. For electric vehicles as well as hybrid trucks, the occurrence of shifts in score has been
determined for ‘overall opinion of the vehicle’, ‘reliability’, ‘energy use’, ‘acceleration’, ‘radius
of action’, ‘safety’, ‘ease of operation’ and ‘suitable for our organisation’, see Figure B.11 -
Figure B.26 of Appendix B. It should be noted that only a limited number of drivers have filled

26 ECN-C--02-080
in the second questionnaire a number of times. Therefore, there might exist differences in out-
come for this (limited) group of drivers in comparison to the results for all drivers.
The most important conclusion that can be derived from the graphs is the observation that dur-
ing the project there is a tendency to adjust the pretty extreme valuation (in a positive as well as
a negative sense) towards a less extreme level. So, very high scores on certain aspects at the be-
ginning of the project have a tendency to go down and low scores have a tendency to go up.
Another observation that can be made is that for some aspects, such as acceleration, safety and
radius of action of the electric vehicles, shifts in score per driver are quite large.
2.5 General conclusions derived from the questionnaires
By means of the questionnaires, the following relationships (hypothesis) can be tested:
1. The relationship between the opinion of the vehicle normally used (at the job) and the ex-
pectations and overall opinion for the electric or hybrid vehicle. Hypothesis: a positive opin-
ion of the conventional vehicle leads to less positive expectations and overall opinion for
the electric or hybrid vehicle.
2. The relationship between familiarity with the use of electric and hybrid vehicles and the ex-
pected performance of electric and hybrid vehicles. Hypothesis: a high familiarity with (the
use of) electric and hybrid vehicles before the vehicle is put into use leads to high expecta-
tions with respect to the performance of electric and hybrid vehicles.
3. The relationship between the expectations with respect to the performance of the electric
and hybrid vehicles and the final valuation of the vehicle at the end of the project. Hypothe-
sis: high expectations lead to a high overall opinion of the electric and hybrid vehicles.
4. The relationship between the quality of the information provided about the goal of the EL-
CIDIS project and the final opinion about the vehicle. Hypothesis: providing sufficient in-
formation at the start of the project leads to a higher valuation of the electric or hybrid vehi-
cle.
5. The relationship between the overall opinion about the vehicle and the individual issues re-
lated to the performance of the electric or hybrid vehicle. Hypothesis: the overall opinion
about the vehicle will be determined by a limited amount of issues, such as reliability, ra-
dius of action, engine noise and environmental aspects.
Other issues that can be tested and consistency checks that can be performed are:
6. Does it make any difference with respect to the valuation of the electric or hybrid vehicle if
the driver has to share the vehicle with other drivers or if the driver ‘owns’ the vehicle. Hy-
pothesis: not sharing the vehicle with other drivers leads to an increase in valuation of the
vehicle.
7. It is expected that satisfaction with respect tot the capacity of the batteries (question 5.6 of
Q2) correlates with the score on the radius of action (question 4.1 N of Q2) (consistency
check). Moreover, it can be tested whether a correlation exists with top speed and accelera-
tion (question 4.1 J and K).
8. It is expected that the occurrence of malfunctions (question 6.1 of Q2) correlates with the
score given on reliability (question 4.1 A of Q2). There might also exist a correlation with
‘full time availability’, ‘ease of operation’ as well as ‘suitable for our organisation’ (ques-
tion 4.1 C, Q and R of Q2).
9. There might exist a correlation between ‘adjustments in the organisation, which could add
to the success of the vehicle within the organisation’ (question 8.2, Q2) and ‘suitable for our
organisation’ (question 4.1 R, Q20) and the overall opinion about the ELCIDIS project
(question 4.2, Q2).

ECN-C--02-080 27
Hypothesis 1: Opinion of the vehicle normally used vs. expectations and overall opinion
of the electric or hybrid vehicle In Figure 2.22, the overall opinion about the vehicle normally used is plotted vs. the (average)
expected performance of the electric vehicle. Comparable graphs can be made with respect to
expected performance of hybrid cars and trucks, see Figure B.7 and Figure B.8 of Appendix B.
Analyses of the data given in Figure 2.22 shows that here is no statistical evidence that supports
the existence of the relationship as described in the hypothesis. Based on the empirical data, hy-
pothesis 1 has to be rejected.
Opinion about vehicle norm. used
10 9 8 7 654 3
Expectations (average)
10
8
6
4
2
0
Figure 2.22 Opinion about the vehicle normally used vs. expected performance of electric
vehicles
Figure 2.23 shows the opinion about the vehicle normally used vs. the expected energy use of
electric vehicles. Comparable graphs are made for expected energy use of hybrid cars and hy-
brid vehicles, see Figure B.9, Figure B.10 of Appendix B. Again, there is no statistical evidence
that supports the existence of a relationship between the opinion of the vehicle normally used
and expected energy use of electric and hybrid vehicles.

28 ECN-C--02-080
Opinion about vehicle norm. used
109 8 76 5 4 3
10
8
6
4
2
0
-2
Energy use
Figure 2.23 Opinion about the vehicle normally used vs. expected energy use of electric
vehicles
Hypothesis 2: familiarity and expectations By means of hypothesis 2, it is investigated whether or not familiarity with the use of electric
and/or hybrid vehicles before the start of the project (experiences in the past) have an effect on
the expected performance. In Figure 2.24 - Figure 2.26, the familiarity with electric or hybrid
vehicles and trucks is plotted vs. the expected performance of these vehicles. Taking the vari-
ance in the score on expected performance into account, there seems to be hardly any difference
in expectation between people who are not familiar, somewhat familiar and very familiar with
electric and hybrid vehicles. Therefore, the hypothesis that high familiarity leads to higher aver-
age expectations for the performance of electric and hybrid vehicles has to be rejected.
4 15 14 N =
Familiar with electric vehicle
very familiar somewhat familiar not familiar
10
8
6
4
2
0
Expectations (average)
Figure 2.24 Familiarity with the use of electric vehicles vs. the expected performance of electric
vehicles

ECN-C--02-080 29
4 9 4N
very familiar somewhat familiar not familiar
10
8
6
4
2
0
Familiar with hybrid cars
Expectations (average)
Figure 2.25 Familiarity with the use of electric vehicles vs. the expected performance of hybrid
cars
4 3 11 N
very familiar somewhat familiar not familiar
8.5
8.0
7.5
7.0
6.5
6.0
5.5
5.0
4.5
10
Familiar with hybrid cars (trucks)
Expectations (average)
Figure 2.26 Familiarity with the use of electric vehicles vs. the expected performance of hybrid
trucks
Hypothesis 3: expectations and overall opinion By means of hypothesis 3, it is investigated whether or not there exists a correlation between the
expected performance of the electric or hybrid vehicles as measured at the start of the ELCIDIS
project and the overall opinion about the vehicle normally used at the end of the ELCIDIS pro-
ject, see Figure 2.27 and Figure 2.28. The existence of such a correlation might imply that pre-
judgement might have played a role in the determination of the overall opinion about the vehi-
cle. There is no statistical evidence that supports the existence of a relationship between ex-
pected performance (start of the project) and the score on the overall opinion (end of the pro-
ject). Therefore hypothesis 3 has to be rejected.

30 ECN-C--02-080
Mean expectation
10 864 2 0
Overa
ll opin
ion a
bout th
e v
ehic
le
10
8
6
4
2
0
Figure 2.27 Expected performance vs. the overall opinion of electric vehicles4
Mean expectation
8,0 7,57,0 6,5 6,0 5,5 5,0 4,5 4,0
Overa
ll opin
ion a
bou
t th
e v
ehic
le
9
8
7
6
5
4
3
2
1
Figure 2.28 Expected performance vs. the overall opinion of hybrid vehicles
4
Hypothesis 4: quality of information and overall opinion In Figure 2.29, the quality of the information received about the ELCIDIS project is plotted vs.
the overall opinion about the vehicle. No statistical correlation could be found between the type
of information received and the overall opinion. Therefore, the hypothesis that proper informa-
tion of the people involved in the ELCIDIS project would lead to a higher average opinion
about the vehicle has to be rejected.
4 Each dot plotted in the graph corresponds to the score of one or more respondents.

ECN-C--02-080 31
Received information
6 543 2 10
Overa
ll opin
ion a
bout th
e v
ehic
le
10
8
6
4
2
0
Figure 2.29 Quality of the information received vs. overall opinion about the vehicle
4 (1= no
information, 2 = written information, 3 = face to face information, 4 = written as
well as face to face information, 5 = other)
Hypothesis 5: overall opinion and specific characteristics of the vehicle It appears that there is a significant relationship between the overall opinion about the ELCIDIS
vehicle (question 4.2 of Q2) with only a limited number of characteristics of the vehicle (ques-
tion 4.1 of Q2). Significant variables with a positive correlation are ‘comfortable for driver’,
‘manoeuvrability’, ‘safety’ and ‘suitable for our organisation’. A positive correlation implies
that the overall opinion increases when the score of the variable increases.5 A negative correla-
tion is found for ‘loading capacity (in m3)’, meaning that the overall opinion about the vehicle is
low when the ‘loading capacity’ is rated low.
However, when a correction is made for correlation between the significant variables,6. it ap-
pears that only three variables are significant: ‘suitable for the organisation’, ‘manoeuvrability’
and ‘engine noise’. Together, these three variables explain 95% of the variance in the ‘overall
opinion’. On forehand, it was expected that the variables ‘reliability’ and ‘radius of action’
would be significant, in stead of ‘suitable for the organisation’. This could be explained by a
possible correlation of ‘suitable for the organisation’ with the variables ‘reliability’ and ‘radius
of action’.7 In order to investigate the effects of this possible dependency between these vari-
ables, the analysis was repeated with exclusion of the variable ‘suitable for the organisation’. In
this case, the variables are ‘environmental friendly’, ‘energy use’, ‘comfortable for driver’ and
‘loading capacity’ explain 96% of the variance in the overall opinion about the vehicle.8
In conclusion: the overall opinion about the vehicle is determined by a limited number of spe-
cific characteristics: ‘suitable for the organisation’, ‘manoeuvrability’ and ‘engine noise’. How-
ever, when the variable ‘suitable for the organisation’ is excluded, 96% of the variance in the
overall opinion can be explained by ‘environmental friendly’, ‘energy use’, ‘comfortable for
5 The variables ‘acceleration’ and ‘reliability’ appear to be the next important variables, but are not statistical
significant. 6 ‘stepwise’. 7 So, if the vehicle is not reliable or has a low radius of operation, it is not suitable for the organisation. 8 If ‘comfortable for driver’ is also excluded, the only significant variables found are ‘environmental friendly’,
‘loading capacity’ and ‘options (airco and ABS)’.

32 ECN-C--02-080
driver’ and ‘loading capacity’. Aspects like ‘reliability’, ‘acceleration’ and ‘radius of action’
are, surprisingly, not significant.
Hypothesis 6: number of drivers per vehicle and the overall opinion On forehand, it was expected that in case that the driver does not have to share the vehicle with
other drivers, the overall opinion of the vehicle would be higher. In Figure 2.30, the overall
opinion about the vehicle is given in case there is only one driver per vehicle and in case there
are two or more drivers for the same vehicle. The first box in Figure 2.30 refers to the respon-
dents who have not answered the question about the number of drivers per vehicle. The figure
shows that there are indications that the overall opinion is somewhat higher when the vehicle is
driven by only one driver. However, this cannot be stated for sure, as a result of the large vari-
ance in the overall opinion.
462424 N =
Are you the only driver
2 1
Overa
ll opin
ion a
bout th
e v
ehic
le
10
8
6
4
2
0
97
69
Figure 2.30 Relationship between the number of drivers per vehicle and the overall opinion
about the vehicle
Hypothesis 7: capacity of the batteries and radius of action, top speed and acceleration The radius of action is determined by the capacity of the batteries. There might also exist a more
indirect relationship between the capacity of the batteries and other aspects such as top speed
and acceleration. First, it is tested whether or not the relationship between capacity of the batter-
ies and radius of action can be derived from the answers given on questionnaire 2, see Figure
2.31. There appears to be a correlation between ‘satisfied with the capacity of the batteries’ and
‘radius of action’.9 Next, the existence of a correlation between ‘satisfied with the capacity of
the batteries’ and ‘top speed’ and ‘acceleration’ is examined, see Figure 2.32 and Figure 2.33. In
both cases, there is no empirical evidence that supports the existence of such a correlation.
9 r = 0.6, R2 = 0.36

ECN-C--02-080 33
Satisfied with the capacity of batteries
6 543 2 1 0
Radiu
s o
f action
10
8
6
4
2
0
Satisfied with the capacity of batteries
6 54 3 2 10
Top s
peed
10
8
6
4
2
0
Figure 2.31 Satisfaction with respect to the
capacity of the batteries vs. radius
of action4
Figure 2.32 Satisfaction with respect to the
capacity of the batteries vs. top
speed4
1 = very satisfied
2 = satisfied
3 = not satisfied/not unsatisfied
4 = unsatisfied
5 = very unsatisfied
Satisfied with the capacity of batteries
6 543 21 0
Accele
ration
10
8
6
4
2
0
Figure 2.33 Satisfaction with respect to the capacity of the batteries vs. acceleration
4
Hypothesis 8: Consistency between occurrence of malfunctions and reliability. It is expected that there might be a positive correlation between the occurrence of malfunctions
(question 6 of Q2) and i.e. ‘reliability’, ‘full time availability’, ‘ease of operation’ and ‘suitable
for our organisation’ (question 4.1 A, C, Q, R of Q2) as well as the overall opinion about the
vehicle (question 4.2 of Q2). The analysis shows that there are indications for a dependency be-
tween ‘occurrence of malfunctions’ and ‘reliability’, see Figure 2.34. As expected, the occur-
rence of malfunctions has a negative effect on reliability. The occurrence of malfunctions how-
ever seems to have little effect on ‘ease of operation’, see Figure 2.35, as well as ‘suitable for
our organisation’, see Figure 2.36. Surprisingly, ‘occurrence of malfunctions’ seems tot have a
positive effect on the ‘availability 24 hours a day’, see Figure 2.37. This cannot be explained

34 ECN-C--02-080
and has to be attributed to the large variance in the results and other not identified factors. As
expected, the occurrence of malfunctions leads to a decrease in overall opinion about the vehi-
cle, see Figure 2.38. This dependency is however not very strong, which is consistent with hy-
pothesis 6.
In conclusion: there are indications that the occurrence of malfunctions has a negative effect on
reliability as well as the overall opinion about the vehicle. There is no proof of a dependency of
‘easy of operation’ and ‘suitable for our organisation’ on the occurrence of malfunctions. The
possible existence of a positive correlation of occurrence of malfunctions with ‘availability’,
cannot be explained.
48391N =
Occurrence malfunctions
malfunctionsno malfunctions
Availa
bili
ty 2
4 h
ours
a d
ay
10
8
6
4
2
0
51411N =
Occurrence malfunctions
malfunctionsno malfunctions
Ease o
f opera
tion
10
8
6
4
2
0
3263
66936499
58
61
69
Figure 2.34 Graphical presentation of the
‘occurrence of malfunctions’ vs.
‘availability’
Figure 2.35 Graphical presentation of the
‘occurrence of malfunctions’
vs. ‘ease of operation’
50411N =
Occurrence malfunctions
malfunctionsno malfunctions
Rela
bilt
y
10
8
6
4
2
0
960996961
44421N =
Occurrence malfunctions
malfunctionsno malfunctions
Su
ita
ble
fo
r o
ur
org
an
isa
tio
n
10
8
6
4
2
0
59263103163
665861
99
68
Figure 2.36 Graphical presentation of the
‘occurrence of malfunctions’ vs.
‘reliability’
Figure 2.37 Graphical presentation of the
‘occurrence of malfunctions’ vs.
‘suitable for our organisation’

ECN-C--02-080 35
53441N =
Occurrence malfunctions
malfunctionsno malfunctions
Overa
ll opin
ion a
bout
the v
ehic
le
10
8
6
4
2
0
2320
10363
Figure 2.38 Graphical presentation of the ‘occurrence of malfunctions’ vs. ‘overall opinion
about the vehicle’
Hypothesis 9: adjustments and suitability for the organisation The existence of adjustments (opportunities for improvement) that can be made within the or-
ganisation might be of influence on the suitability for the organisation as well as the overall
opinion. In Figure 2.39 and Figure 2.40, the existence of possible adjustments within the organi-
sation is plotted vs. the score on ‘suitable for our organisation’ and ‘overall opinion’. Taking
into account the variance in score, it must be concluded that the existence of adjustments in the
organisation is little to no influence on the score on ‘suitable for our organisation’ as well as
‘overall opinion about the vehicle’.
877N =
Adjustment in the organisation
yn
Suitable
for
our
org
anis
ation
10
8
6
4
2
0
6166
1799
1659683263
885N =
Adjustment in the organisation
yn
Ove
rall
op
inio
n a
bo
ut
the
ve
hic
le
10
8
6
4
2
0
2023
63
Figure 2.39 Existence of ‘adjustments in the
organisation’ vs. ‘suitable for the
organisation’
Figure 2.40 Existence of ‘adjustments in
the organisation’ vs. ‘overall
opinion about the vehicle’

36 ECN-C--02-080
3. ENERGY CONSUMPTION
3.1 Introduction
In Table 3.1, an overview is given of the types of vehicles in the ELICIDS project. Basically,
four different types of vehicles are used:
• electric cars (Stockholm, La Rochelle, Stavanger, Regione Lombardia)
• hybrid cars (Erlangen)
• electric vans (Rotterdam, Stavanger, La Rochelle)
• hybrid trucks (Stockholm).
Table 3.1 Overview of types of vehicles per city for the ELCIDIS project
Site Logistics Vehicles
Distribution service Operating area Number & type Battery type Payload
[kg]
Rotterdam parcels & packages city centre 3 electric vans Mercedes
Sprint
6 x sodium nickel
chloride ZEBRA Z5C
1250
4 electric vans Mercedes
Sprint
12 x sodium nickel
chloride ZEBRA Z5C
1000-
1500*
Stockholm parcels & packages city centre
& region
6 hybrid electric trucks
Mercedes ATEGO 1217
6 x lead 2300
3 electric vans Citroën
Berlingo
3 x nickel cadmium 500
6 electric vans Citroën
Berlingo
6 x nickel cadmium 500
La
Rochelle
parcels, packages &
messages
city centre 1 FAAM Jolly 1200 electric
van
1 x lead 900
1 electric car Citroën Saxo 1 x nickelcadmium 300
Erlangen courier and delivery service
of goods and documents
city centre
& region
10 hybrid electric Audi Duo 10 x lead 400
Regione
Lombardia
mail delivery & services city & city
centre
13 electric vans Citroën
Berlingo
13 x nickel cadmium 500
3 electric vans Peugeot
Partner
3 x nickel cadmium 500
mail, packages, city centre 2 electric vans Citroën
Berlingo
2 x nickel cadmium 500
Stavanger documents & equipment etc. & region 2 electric cars Citroën Saxo 2 x nickel cadmium 300
1 electric van Mercedes
Sprint
1 x lead 500**
* If more than 1000 kg, Gross Vehicle Weight exceeds 3500 kg, meaning the van becomes a truck. ** With a Gross Vehicle Weight of 3500 kg.
In order to determine the performance of the electric and hybrid vehicles, part of the vehicles
are equipped with so called mobi-boxes, see Table 3.2. With respect to the data recording in or-
der to determine the performance of the vehicles, a number of problems have occurred. In a
number of cases, it appeared not to be possible to fix the technical malfunctions. Due to these
malfunctions, no data has been recorded by the mobi-box systems in ‘Lombardia’. In La Ro-
chelle, the charging data is not recorded. In Rotterdam, the reading of the kilometres driven ap-
peared to be incorrect. This problem also seems to have occurred at the hybrid trucks in Stock-
holm, since daily distances over 700 kilometres were recorded. Therefore, it was not possible to
assess the specific energy consumption for the vehicles in Lombardia, La Rochelle, Rotterdam
and the hybrid trucks in Stockholm. Moreover, some of the vehicles have been put into use with
serious delay. In these cases, the data is recorded over a relative short period.

ECN-C--02-080 37
Table 3.2 Location and type of vehicles equipped with the mobi-box system
Location Car-ID Company Vehicle type Start data-recording End data-recording
Stavanger EL 10066 Posten Peugeot Partner Sep 1999 May 2002
Stavanger EL 10067 Posten Peugeot Partner Sep 1999 May 2002
Stavanger EL 10068 Posten Peugeot Partner Sep 1999 May 2002
Stavanger EL 10142 Posten Mercedes Sprinter Aug 2000 May 2002
Stavanger EL 10075 Stavanger Kommune Citroën Berlingo Nov 1999 May 2002
Stavanger EL 10074 Lyse Energi AS Citroën Berlingo Sep 1999 May 2002
Stavanger EL 10079 Lyse Energi AS Citroën Saxo Oct 1999 May 2002
Stavanger EL 10080 Vegvesenet Citroën Saxo Sep 1999 May 2002
Stockholm PBT 335 Riksbyggen Citroën Berlingo Aug 2000 May 2002
Stockholm ROR 337 Riksbyggen Citroën Berlingo Dec 2000 Apr 2002
Stockholm RPC 222 Riksbyggen Citroën Berlingo Sep 2000 May 2002
Stockholm SFX 780 GreenCargo Mercedes ATEGO May 2001 Apr 2002
Stockholm SKR 246 GreenCargo Mercedes ATEGO May 2001 May 2002
Stockholm SJH 468 Danzas Mercedes ATEGO March 2001 May 2002
Stockholm SRP 258 Danzas Mercedes ATEGO Apr 2002 May 2002
Stockholm SPJ 030 Trabé Mercedes ATEGO Oct 2001 May 2002
Stockholm SSK 609 Grönsakshallen Mercedes ATEGO - -
La Rochelle Vehicle A Citroën Berlingo Sep 2001 Apr 2002
La Rochelle Vehicle B Citroën Berlingo Apr 2001 Apr 2002
La Rochelle Vehicle C Citroën Berlingo May 2001 Apr 2002
Rotterdam BL-LT-89 Van Gend en Loos Mercedes Sprinter Feb 2002 Apr 2002
Rotterdam BL-PT-05 Van Gend en Loos Mercedes Sprinter Feb 2002 Apr 2002
Rotterdam Vehicle 1 TNT Mercedes Sprinter March 2002 March 2002
Rotterdam Vehicle 2 TNT Mercedes Sprinter March 2002 March 2002
Lombardia Vehicle 1 Milan Municipality Citroën Berlingo May 2001 Dec 2001
Lombardia Vehicle 2 Milan Municipality Citroën Berlingo May 2001 Feb 2002
Lombardia Vehicle 3 Milan Municipality Citroën Berlingo Apr 2001 March 2002
Lombardia Vehicle 4 Milan Municipality Citroën Berlingo Apr 2001 March 2002
Lombardia Vehicle 5 Milan Municipality Citroën Berlingo Apr 2001 Feb 2002
Lombardia Vehicle 6 Milan Municipality Citroën Berlingo Apr 2001 Feb 2002
Lombardia Vehicle 7 Milan Municipality Citroën Berlingo Apr 2001 Feb 2002
Lombardia Vehicle 8 Milan Municipality Citroën Berlingo Apr 2001 Feb 2002
Lombardia Vehicle 9 Milan Municipality Citroën Berlingo Apr 2001 Feb 2002
By means of the date recorded by these mobi-boxes, the following characteristics can be deter-
mined:
nr of days
tot km
km/day
hours/day
tot kWh
kWh/charge
hours/charge
kWh/km
= Number of days driven in the car.
= Total km driven.
= Average km driven per day (tot km/nr of days).
= Average number of hours driven per day.
= Total electricity charged in kWh.
= Average kWh charged during 1 charging event.
= Average number of hours that 1 charging event takes.
= The average Energy use in kWh/km.
3.2 Total distance driven
La Rochelle In Figure 3.1, the total distance driven per month is given for three electric vehicles equipped
with the mobi-box system. Data acquisition for vehicle B started at April 2001. Data recording
was ended for all vehicles in April 2002.

38 ECN-C--02-080
0
100
200
300
400
500
600
700
Vehicle A Vehicle B Vehicle C
[km]
Figure 3.1 Total distance driven (km/month) during the ELCIDIS project for the electric
vehicles in La Rochelle
In total, the three vehicles have covered about 6400 km in total in one-year time. A highest av-
erage daily distance of 19.2 km per day driven was achieved by vehicle A. Average daily dis-
tance per day driven for vehicle C amounted to a modest 4.4 km/day. The maximum distance
driven on one day amounted to 41.6 km - 43.1 km per day.
Stavanger In Stavanger, seven electric vehicles were equipped with the mobi-box system. Four of these
vehicles were in use at the Posten company, see Figure 3.2, and three at other companies (see
Figure 3.3). Data recording from the majority of the electric cars started at about September
1999. Date recording by the electric van (EL 10142) however started in August 2000. For all
cars, data recording was ended in May 2002. Total distance driven by the seven electric vehicles
over the period September 1999 to May 2002 amounts to over 155.000 km. Four of the electric
vehicles drove over 20.000 km during the ELCIDIS project (31 months). This corresponds to an
average yearly distance over 10.000 kilometres per car per year. The average daily distance of
three of the vehicles was over 45 kilometres per day. All, cars besides EL1067, have at least
once driven a distance of over 90 kilometres a day. Maximum distance driven on one day
amounted to 115.6 km.

ECN-C--02-080 39
0
200
400
600
800
1000
1200
1400
1600
1800
EL 10066 EL 10067 EL 10068 EL 10142
[km]
Figure 3.2 Total distance driven (km/month) during the ELCIDIS project for the electric
vehicles in Stavanger used at the Posten company
0
200
400
600
800
1000
1200
1400
EL 10074 EL 10075 EL 10079 EL 10080
[km]
Figure 3.3 Total distance driven (km/month) during the ELCIDIS project for the electric
vehicles in Stavanger
Stockholm In Figure 3.4, the total distance driven per month is given for the three electric cars equipped
with the mobi-box system.10
The total distance covered by the three electric cars during the EL-
CIDIS project amounts to about 13.000 kilometres. The average yearly distance varied between
2.500 and 32.00 kilometres per year. The maximum distance driven on a single day varied be-
tween 39 and 84 kilometres a day. The low readings for several months can be ascribed to tech-
nical malfunctions of the vehicles.
10 Distance driven by the hybrid trucks is not given, due to improper readings from the mobi-box system, see also
Section 3.1.

40 ECN-C--02-080
0
100
200
300
400
500
600
700
800
PBT 335 ROR 337 RPC 222
[km]
Figure 3.4 Total distance driven (km/month) during the ELCIDIS project for the electric
vehicles in Stockholm
3.3 Specific energy consumption
The average specific energy consumption can be derived from the total distance driven and the
charging data, see Table 3.3. The average electricity consumption of the electric cars varies be-
tween 0.25 kwh/km for a Citroen Saxo in Stavanger and 0.75 kWh/km for a Peugeot Partner in
Stavanger. The average energy consumption of the electric van amounts to 0.88 kWh/km. In
other projects, specific energy consumption of the same type of vehicle was found to be be-
tween 0.39 kWh/km in Paris to 0.50 kWh/km in Strasbourg (EVD, 2001) and 0.36 kWh/km in
Ostend to 47.4 kWh/km in Brussels (EVWG, 2000).
It is remarkable that the three electric vehicles used in Stockholm use on average considerably
more electricity per kilometre (0.55 ± 0.06 kWh/km) in comparison to identical vehicles in
Lombardia (0.35 ± 0.02 kWh/km) and Stavanger (0.31 ± 0.02 kWh/km). This difference might
be (partly) due to differences in trajectory.11
Average daily distance for the vehicles amounted to
about 43 km/day in Stavanger and 16 km/day in Stockholm and 36 km/day for Lombardia. In
order to analyse this effect, the average specific energy consumption is plotted vs. the average
daily distance driven, see Figure 3.6. After excluding the deviant values,12
a trend line is calcu-
lated. Although the trend line suggests a decrease in specific energy consumption at increasing
average outdoor temperatures, statistical analysis shows that the correlation between average
daily distance and average specific energy consumption is not statistically significant.
Part of the variance in specific energy consumption might also be due to difference in the way
of driving by the driver. However, based on the data for Lombardia, it is estimated13
that due
this factor the specific consumption might vary between identical cars by about 0.05 kWh/km.
Last but not least, it cannot be excluded that the differences in energy consumption are (partly)
11 The average energy consumption as calculated by TFK – Transport Research Institute, Stockholm, amounts to 0.4
kWh/km. The difference with the value calculated by ECN can, according to TFK, be explained by the selected
evaluation period. Some of the vans have not been used for a long period of time. However, during this period,
electricity was charged in regular use for the whole period. 12 Marked as a ×. 13 By taking three times the standard deviation.

ECN-C--02-080 41
due to improper readings by the mobi-box system.14
The specific consumption of one of the
electric vehicles in Stavanger (0.75 kWh/km) deviates considerably from the specific consump-
tion of the other vehicles in Stavanger and comparable vehicles in other cities, see also Section
3.4.
0,00
0,10
0,20
0,30
0,40
0,50
0,60
0,70
0,80
0,90
1,00
1
[kWh/km]
Citroën Saxo (Stavanger) Citroën Berlingo (Stavanger) Peugeot Partner (Stavanger)
Citroën Berlingo (Lombardia) Citroën Berlingo (Stockholm) Mercedes Sprinter (Stavanger)
Figure 3.5 Specific energy consumption of the electric vehicles
0,0
0,1
0,2
0,3
0,4
0,5
0,6
0,7
0,8
0 10 20 30 40 50 60
Figure 3.6 Average daily distance [km/day] vs. specific energy consumption of the electric
vehicles [kWh/km] (deviant values, market as ×, are excluded)
14 Although in Lombardia, the specific energy consumption was not calculated using the mobi-box system.

42
E
CN
-C--
02
-080
Table
3.3
O
verv
iew
of
the
per
form
ance
of
the
vehic
les
equip
ped
wit
h t
he
mobi-
box
syst
em i
n t
he
EL
CID
IS p
roje
ct.
Lo
cati
on
Car
-ID
C
om
pan
y
Veh
icle
typ
e S
tart
dat
a-
reco
rdin
g
End
dat
a-
reco
rdin
g
Nr
of
day
s
dri
ven
Tota
l
dri
ven
[km
]
Aver
age
km
/day
dri
ven
Aver
age
tim
e/day
dri
ven
Tota
l
char
ged
[kW
h]
Aver
age
ener
gy u
se
[kW
h/k
m]
Sta
van
ger
E
L 1
00
66
P
ost
en
Peu
geo
t P
artn
er
Sep
19
99
M
ay 2
00
2
57
8
28
318
4
9.0
0
2:2
6
93
55
0
.33
Sta
van
ger
E
L 1
00
67
P
ost
en
Peu
geo
t P
artn
er
Sep
19
99
M
ay 2
00
2
67
9
15
119
2
2.3
0
2:0
8
11
296
0
.75
Sta
van
ger
E
L 1
00
68
P
ost
en
Peu
geo
t P
artn
er
Sep
19
99
M
ay 2
00
2
54
8
23
287
4
2.5
0
4:4
7
70
69
0
.30
Sta
van
ger
E
L 1
01
42
P
ost
en
Mer
ced
es S
pri
nte
r A
ug 2
00
0
May
20
02
2
78
5
89
5
21
.2
01
:40
5
21
5
0.8
8
Sta
van
ger
E
L 1
00
75
S
tavan
ger
Ko
mm
une
Cit
roën
Ber
lingo
N
ov 1
99
9
May
20
02
5
16
2
79
22
5
4.1
0
2:3
7
86
24
0
.31
Sta
van
ger
E
L 1
00
74
L
yse
Ener
gi
AS
C
itro
ën B
erli
ngo
S
ep 1
99
9
May
20
02
6
49
2
92
31
4
5.0
0
1:3
1
83
81
0
.29
Sta
van
ger
E
L 1
00
79
L
yse
Ener
gi
AS
C
itro
ën S
axo
O
ct 1
99
9
May
20
02
4
88
1
44
42
2
9.6
0
1:0
4
42
11
0
.29
Sta
van
ger
E
L 1
00
80
V
egves
enet
C
itro
ën S
axo
S
ep 1
99
9
May
20
02
7
14
1
17
79
1
6.5
0
0:4
6
29
53
0
.25
Sto
ckho
lm
PB
T 3
35
R
iksb
yggen
C
itro
ën B
erli
ngo
A
ug 2
00
0
May
20
02
3
17
5
61
8
17
.7
07
:1415
34
70
0
.62
Sto
ckho
lm
RO
R 3
37
R
iksb
yggen
C
itro
ën B
erli
ngo
D
ec 2
00
0
Ap
r 2
00
2
24
1
32
52
1
3.5
0
2:0
9
15
98
0
.49
Sto
ckho
lm
RP
C 2
22
R
iksb
yggen
C
itro
ën B
erli
ngo
S
ep 2
00
0
May
20
02
2
50
4
29
2
17
.2
01
:17
2
38
1
0.5
5
Sto
ckho
lm
SF
X 7
80
G
reen
Car
go
M
erce
des
AT
EG
O
May
20
01
A
pr
20
02
2
82
N
ot
avai
lab
le16
03
:07
N
ot
avai
lab
le
Sto
ckho
lm
SK
R 2
46
G
reen
Car
go
M
erce
des
AT
EG
O
May
20
01
M
ay 2
00
2
27
5
No
t av
aila
ble
16
03
:35
N
ot
avai
lab
le
Sto
ckho
lm
SJH
46
8
Dan
zas
Mer
ced
es A
TE
GO
M
arch
20
01
M
ay 2
00
2
19
5
No
t av
aila
ble
16
06
:31
N
ot
avai
lab
le
Sto
ckho
lm
SR
P 2
58
D
anza
s M
erce
des
AT
EG
O
Ap
r 2
00
2
May
20
02
2
5
No
t av
aila
ble
16
Sto
ckho
lm
SP
J 03
0
Tra
bé
Mer
ced
es A
TE
GO
O
ct 2
00
1
May
20
02
8
4
No
t av
aila
ble
16
Sto
ckho
lm
SS
K 6
09
G
rönsa
ksh
alle
n
Mer
ced
es A
TE
GO
-
- -
-
La
Ro
chel
le V
ehic
le 1
Cit
roën
Ber
lingo
S
ep 2
00
1
Ap
r 2
00
2
16
4
31
45
1
9.2
0
2:4
9
No
t av
aila
ble
La
Ro
chel
le V
ehic
le 2
Cit
roën
Ber
lingo
A
pr
20
01
A
pr
20
02
2
45
2
26
7
9.3
0
1:0
7
No
t av
aila
ble
La
Ro
chel
le V
ehic
le 3
Cit
roën
Ber
lingo
M
ay 2
00
1
Ap
r 2
00
2
23
1
10
19
4
.4
00
:35
N
ot
avai
lab
le
Ro
tter
dam
B
L-L
T-8
9
Van
Gen
d e
n L
oo
s M
erce
des
Sp
rinte
r F
eb 2
00
2
Ap
r 2
00
2
32
N
ot
avai
lab
le16
02
:54
N
ot
avai
lab
le
Ro
tter
dam
B
L-P
T-0
5
Van
Gen
d e
n L
oo
s M
erce
des
Sp
rinte
r F
eb 2
00
2
Ap
r 2
00
2
20
N
ot
avai
lab
le16
02
:05
N
ot
avai
lab
le
Ro
tter
dam
V
ehic
le 1
T
NT
M
erce
des
Sp
rinte
r M
arch
20
02
M
arch
20
02
1
6
No
t av
aila
ble
16
03
:30
N
ot
avai
lab
le
Ro
tter
dam
V
ehic
le 2
T
NT
M
erce
des
Sp
rinte
r M
arch
20
02
M
arch
20
02
1
1
No
t av
aila
ble
16
01
:48
N
ot
avai
lab
le
15 T
he
ver
y h
igh
val
ue
for
‘aver
age
tim
e d
riven
’ is
exp
lain
ed b
y a
tec
hn
ical
mal
fun
ctio
n o
f th
e M
obi
bo
x.
16 T
he
Mo
bi
bo
xes
giv
es i
mp
rop
er r
ead
ings
wit
h r
esp
ect
to t
he
dis
tance
dri
ven
. T
her
efo
re, to
tal
dis
tan
ce a
s w
ell
as s
pec
ific
en
erg
y c
on
sum
pti
on
can
no
t b
e d
eter
min
ed.

43
E
CN
-C--
02
-080
Table
3.3
C
onti
nued
Lo
cati
on
Car
-ID
C
om
pan
y
Veh
icle
typ
e S
tart
dat
a-
reco
rdin
g
End
dat
a-
reco
rdin
g
Nr
of
day
s
dri
ven
Tota
l
dri
ven
[km
]
Aver
age
km
/day
dri
ven
Aver
age
tim
e/day
dri
ven
Tota
l
char
ged
[kW
h]
Aver
age
ener
gy u
se
[kW
h/k
m]
Lo
mb
ard
ia
Veh
icle
1
Mil
an M
unic
ipal
ity
Cit
roën
Ber
lingo
M
ay 2
00
1
Dec
20
01
6
6
16
73
2
5.3
53
9
0.3
2
Lo
mb
ard
ia
Veh
icle
2
Mil
an M
unic
ipal
ity
Cit
roën
Ber
lingo
M
ay 2
00
1
Feb
20
02
1
42
5
96
9
42
.0
1
90
4
0.3
2
Lo
mb
ard
ia
Veh
icle
3
Mil
an M
unic
ipal
ity
Cit
roën
Ber
lingo
A
pr
20
01
M
arch
20
02
1
94
6
61
3
34
.1
2
20
2
0.3
3
Lo
mb
ard
ia
Veh
icle
4
Mil
an M
unic
ipal
ity
Cit
roën
Ber
lingo
A
pr
20
01
M
arch
20
02
8
9
40
52
4
5.5
14
79
0
.37
Lo
mb
ard
ia
Veh
icle
5
Mil
an M
unic
ipal
ity
Cit
roën
Ber
lingo
A
pr
20
01
F
eb 2
00
2
11
4
48
66
4
2.7
17
61
0
.36
Lo
mb
ard
ia
Veh
icle
6
Mil
an M
unic
ipal
ity
Cit
roën
Ber
lingo
A
pr
20
01
F
eb 2
00
2
13
2
58
40
4
4.2
21
90
0
.38
Lo
mb
ard
ia
Veh
icle
7
Mil
an M
unic
ipal
ity
Cit
roën
Ber
lingo
A
pr
20
01
F
eb 2
00
2
16
8
73
31
4
3.6
24
71
0
.34
Lo
mb
ard
ia
Veh
icle
8
Mil
an M
unic
ipal
ity
Cit
roën
Ber
lingo
A
pr
20
01
F
eb 2
00
2
88
2
13
1
24
.2
7
93
0
.37
Lo
mb
ard
ia
Veh
icle
9
Mil
an M
unic
ipal
ity
Cit
roën
Ber
lingo
A
pr
20
01
F
eb 2
00
2
60
1
14
4
19
.1
4
20
0
.37

44 ECN-C--02-080
3.4 Temperature and energy consumption
In Figure 3.7, the average monthly energy use is plotted vs. the average monthly outdoor
temperature for the electric vehicles in Stavanger, see also Table 3.3. Data analysis shows there
is little to no effect of the outdoor temperature on the specific energy consumption of the
electric vehicles. However, some remarkable observations can be made.
0.0
0.2
0.4
0.6
0.8
1.0
1.2
1.4
1.6
-20 -15 -10 -5 0 5 10 15 20 25
Temperatuur [°C]
[kWh/km]
EL 10066 EL 10067 EL 10068 EL 10074 EL 10075 EL 10079 EL 10080 EL 10142
Figure 3.7 Average monthly outdoor temperature [°C] vs. average monthly energy use
[kWh/km] for electric vehicles in Stavanger
For vehicle EL1068, some very low readings for the average outdoor temperature are found, al-
though the vehicle has been in use over the same period as the other vehicles. The specific
monthly energy consumption of vehicle EL1067 is divided into two intervals. The energy con-
sumption in the low interval corresponds with the average monthly energy consumption of the
other comparable vehicles (around 0.4 kWh/km). However, the specific monthly energy con-
sumption in the second interval is much higher (about 1.0 - 1.2 kWh/km). This observation is in
line with the observation made in Section 3.3, in which was found that the total specific energy
consumption of vehicle EL1067 deviates significantly from the values found for comparable
vehicles.

ECN-C--02-080 45
4. CONCLUSIONS AND RECOMMENDATIONS
The goal of the project carried out by ECN was twofold:
1. Measurement and analyses of (shifts in) opinion about the use of and opportunities for elec-
tric and hybrid vehicles.
2. Analyses of energy consumption of the electric and hybrid vehicles used in the ELCIDIS
project.
4.1 Attitude and opinion
On forehand, a number of hypotheses have been developed which needed to be tested. In order
to be able to do this, two questionnaires were developed. The first questionnaire had to be filled
in before the vehicles were put into operation. The second questionnaire was repeated every
couple of months during the period of operation of the vehicle, in order to be able to observe
shifts in attitude and preferences.
It appeared that there was no statistical evidence for the existence of a relationship between the
opinion about the vehicle normally used at the job and the opinion about the electric or hybrid
vehicle. The familiarity with electric vehicles and the type and quality of information received
before the start of the project also appeared to be insignificant with respect to the expected as
well as actual performance of the electric and hybrid vehicles. Also the number of drivers per
vehicle has no significant effect on the overall opinion. As expected, a correlation was found for
‘satisfied with the capacity of the batteries’ with ‘radius of action’.
The overall opinion about the vehicle is determined by a limited number of characteristics. The
variables ‘manoeuvrability’, ‘engine noise’ and ‘suitable for our organisation’ determine over
95% of the variation in the overall opinion. When the variable ‘suitable for our organisation’ is
excluded, the variables ‘environmental friendly’, ‘energy use’, ‘comfortable for driver’ and
‘loading capacity’ are found to be statistically significant. On forehand, it was expected that as-
pects such as ‘reliability’, ‘acceleration’ and ‘radius of action’ would determine the overall
opinion to a large extent. These variables, however, appear to be statistically insignificant.
As expected, the ‘occurrence of malfunctions’ has a negative effect on ‘reliability’ but hardly
any effect on ‘ease of operation’ as well as ‘suitable for our organisation’. The existence of op-
portunities for adjustments within the organisation has little to no influence on ‘suitable for our
organisation’ as well as ‘overall opinion about the vehicle’.
A remarkable resemblance was found for the score on ‘relevance’ and ‘expected performance’
of several issues related to the use of the electric and hybrid vehicles. This means that those as-
pects, which are expected to perform low, are also considered to be off less importance. So, on
forehand, no real ‘weaknesses’ of the electric and hybrid vehicles could be identified. High
scores were found for expected performance and relevance on aspects such as ‘safety’, ‘suitable
for our organisation’, ‘environmental friendly’, ‘reliability’, ‘ease of operation’ and reliability’.
‘Design and style’ was considered to be of little importance.
When comparing the scores on these aspects between the first questionnaire (based on expecta-
tions) and the second questionnaire (based on experiences), it was found that for most aspects
the actual performance is lower than the expected performance (so the vehicles are performing
less well than expected). Largest differences (decrease) between expected performances and ac-
tual performance were found for ‘energy use’, ‘suitable for our organisation’, ‘safety’, ‘options
like airco and ABS’ and ‘reliability’. However, the electric vehicles appear to perform better
than expected with respect to ‘top speed’ as well as ‘design and styling’. The most important

46 ECN-C--02-080
drawbacks of electric and hybrid vehicles mentioned were ‘radius of action’ and ‘power of the
engine’.
The respondents involved in the use of the electric vehicles have adjusted their opinion during
the project in a way that they think there is less future and more need for governmental support.
During the project there, a tendency can be observed to adjust extreme scores on several aspects
(in a positive as well as a negative sense) towards a less extreme level. So, very high scores on
certain aspects at the beginning of the project have a tendency to go down and low scores have a
tendency to go up. Another observation that can be made is that for some aspects, such as accel-
eration, safety and radius of action of the electric vehicles, shifts in score per driver are quite
large.
4.2 Specific energy consumption
Part of the vehicles used in the ELCIDIS project is equipped with so-called Mobi box systems.
By means of these systems, a number of characteristics have been recorded, such as ‘total km
driven’, ‘total kWh charged’, ‘trip length’ and ‘time driven’. Unfortunately, the reliability of the
data recording of by means of the Mobi box systems was beyond expectation. In some cases,
characteristics such as ‘total kWh charged’ were not recorded. In other cases, the readings were
incorrect (i.e. improper ‘trip length’ or ‘time driven’).
During the project, some of the vehicles have covered large distances. The three electric vehi-
cles in Stockholm drove over 13.000 km during the project. The maximum distance driven on
one single day ranged from 39 to 84 km for these vehicles. Remarkably, the vehicles in Stock-
holm use more energy per km (0.55 ± 0.06)17
in comparison to comparable vehicles in
Lombardia (0.35 ± 0.02) and Stavanger (0.31 ± 0.02). Values for specific energy consumption
for comparable electric vehicles used in other projects range from on average 0.36 kWh/km to
0.50 kWh/km (EVWG, 2000; EVD, 2001). The differences in specific energy consumption
might be partly due to differences in trajectory (such as average trip length) and way of driving.
Further analysis shows that the relationship between the specific energy plotted and the average
daily distance driven is not statistically significant. Also, based on the data for Lombardia, the
effects of differences in driving style are (roughly) estimated to have an effect on the specific
energy consumption of about 0.05 kWh/km. Finally, it cannot be excluded that the differences
in specific energy consumption are (partly) due to improper readings by the mobi-box system.18
The average monthly outdoor temperature appeared to have little to no effects on the average
specific energy consumption.
It is recommended to pay more attention to validation as well as reliability of the readings of the
data recording devices. During this project, in some cases it appeared not to be possible to fix
major technical malfunctions. As a result, in some cases crucial information needed in order to
be able to evaluate the performance of the electric vehicles has not been collected. In case all
relevant parameters were recorded, some inexplicable values were found. Unfortunately, it can-
not be excluded that these deviating values are due to improper readings by the data collection
system.
17
The average specific energy consumption of the electric vehicles in Stockholm has also been calculated by TFK
(Transport Reasearch Institute, Stockholm). According to TFK, the average specific energy consumption amouted
to 0.4 kWh/km. The difference with the value calculated by ECN can, according to TFK, be explained by the
selected evaluation period. Some of the vans have not been used for a long period of time. However, during this
period, electricity was charged in regular use for the whole period. 18 Although in Lombardia, the specific energy consumption was not calculated using the mobi-box system.

ECN-C--02-080 47
APPENDIX A
- Questionnaire 1
- Questionnaire 2

48 ECN-C--02-080

ECN-C--02-080 49
THE ELCIDIS PROJECT
Questionnaire 1 Dear participant, You are involved in the Electric Vehicle CIty DIStribution Systems project. In the ELCIDIS project, six European cities are exploring the possibilities of new forms of city distribution systems operating with electric and hybrid vehicles. In order to collect the experiences of the participating companies and authorities, surveys of persons involved in the project will be performed on a regular basis. This is the first survey, meant to determine your expectations prior to the introduction of the vehicles. Your answers will be processed anonymously.
1. What is (the best description of) your position?
� driver ��GO TO QUESTION 2.1
� planner (responsible for the day to day operation) ��GO TO QUESTION 4 � technical staff, mechanic ��GO TO QUESTION 4 � fleet manager (responsible for the acquisition of the fleet) ��GO TO QUESTION 4 � other …………………………………………………………. ��GO TO QUESTION 4
2.1. What kind of vehicle will you use in the ELCIDIS project? � don’t know (not yet clear) � electric �� make:……………………………….
model:………………………………
loading capacity……………kg
loading capacity……………m³
� hybrid �� make:……………………………….
model:…………………………….…
loading capacity……………kg
loading capacity……………m³
2.2. Do you take part in the project on a voluntary basis? � Yes, I voluntarily take part in the project � No, my superiors decided on my taking part
3.1 What kind of vehicle do you normally use at the job (= prior to the electric or hybrid
vehicle)? � not applicable �� question 4 � make……………………… model/type ………………….. loading
capacity…………kg loading capacity ………..m³
3.2 What kind of fuel does this vehicle use?

50 ECN-C--02-080
3.3 On a scale of 1-9, where 1 is “very poor” and 9 is “excellent”, please indicate (by circling the right
figure) your opinion about the vehicle you described in question 3.1
Table 1
very poor 1 2 3 4 5 6 7 8 9 excellent
My opinion about the vehicle I normally use at the job
1
2
3
4
5
6
7
8
9
4. To what extent are you familiar with the objectives of the ELCIDIS project?
� Very familiar � Somewhat familiar � Not familiar
5 There are several objectives of the ELCIDIS project. Please indicate on a scale of 1-9,
where 1 is “not important at all” and 9 is “very important”, how important you would say
the objectives of the ELCIDIS project are?
Table 2
not important at all 1 2 3 4 5 6 7 8 9 very important
A Explore more efficient urban distribution systems
1
2
3
4
5
6
7
8
9
B Demonstrate the environmental benefits of electric/hybrid vehicles for goods distribution
1
2
3
4
5
6
7
8
9
C Realise technical improvement of electric/hybrid vehicles
1
2
3
4
5
6
7
8
9
6.1 To what extent are you familiar with electric vehicles?
� Very familiar � Somewhat familiar � Not familiar
6.2 In the current situation, does your organisation already use electric vehicles for
distribution purposes? � Yes � No � Don’t know
6.3 Have you ever driven an electric vehicle (either a car, a van or a lorry)?
� Yes � No
7.1 To what extent are you familiar with hybrid vehicles? � Very familiar � Somewhat familiar � Not familiar
7.2 In the current situation, does your organisation already use hybrid vehicles for
distribution purposes? � Yes � No � Don’t know
7.3 Have you ever driven a hybrid vehicle (either a car, a van or a lorry)?
� Yes � No

ECN-C--02-080 51
QUESTION 8.1/8.2 FOR TECHNICAL STAFF (MECHANICS) ONLY. ALL OTHERS GO TO
QUESTION 9
8.1 To what extent do you have experience in the technical maintenance of ELECTRIC
vehicles? � Much experience � Some experience � Little experience � No experience at all
8.2 To what extent do you have experience in the technical maintenance of HYBRID
vehicles? � Much experience � Some experience � Little experience � No experience at all
8.2 To what extent do you have experience in the technical maintenance of HYBRID
vehicles? � Much experience � Some experience � Little experience � No experience at all

52 ECN-C--02-080
9. On a scale of 1-9, where 1 is “not important at all” and 9 is “very important”, please indicate the
importance of the following aspects for successful operation of the electric/hybrid vehicle within
your organisation.
PLEASE FILL IN YOUR FIGURES (BETWEEN 1 TO 9) IN COLUMN A OF TABLE 3.
IF YOU DON’T KNOW AN ANSWER, PUT A QUESTIONMARK (?)
10. On a scale of 1-9, where 1 is “very poor” and 9 is “excellent “, please indicate your expectations
of the performance of electric and hybrid vehicles in your organisation.
PLEASE FILL IN YOUR FIGURES (BETWEEN 1 TO 9) IN COLUMN B OF TABLE 3.
IF YOU DON’T KNOW AN ANSWER, PUT A QUESTIONMARK (?)
Table 3
COLUMN A
How important
are these aspects for success?
1= not important at
all
9=very important
?=don’t know
COLUMN B
What do you expect
of electric and hybrid vehicles?
1= very poor
9=excellent
?= don’t know
electric
vehicles
hybrid
vehicles
a RELIABILITY OF THE VEHICLE
b ENERGY USE OF THE VEHICLE
c FULL TIME AVAILABILITY (24 hours a day)
D MASS OF LOADING CAPACITY (kg)
e VOLUME OF LOADING CAPACITY (m³)
f LOW MAINTENANCE COSTS
g DESIGN,STYLING
h LOW ENGINE NOISE
i ENVIRONMENTALLY FRIENDLY
j TOP SPEED
k ACCELERATION
l COMFORTABLE FOR DRIVER
m OPTIONS (AIRCO, ABS)
m RADIUS OF ACTION
o MONOEUVRABILITY
p SAFETY
q EASE OF OPERATION
r SUITABLE FOR OUR ORGANISATION

ECN-C--02-080 53
11. On a scale of 1-9, where 1 is “I totally disagree” and 9 is “I totally agree”, please indicate your
personal opinion about the following statements.
PLEASE FILL IN YOUR FIGURES (BETWEEN 1 TO 9) IN TABLE 4. IF YOU DON’T KNOW AN ANSWER, PUT A QUESTIONMARK (?).
Table 4
I totally disagree 1 2 3 4 5 6 7 8 9 I totally agree, ?=don’t know
Your figure
A Electric vehicles certainly have a future in urban goods distribution
B Electric vehicles have no prospect without governmental support
C Electric vehicles fit in easily in our organisation
D Our town is very well suited for distribution of goods by means of electric vehicles
E Hybrid vehicles certainly have a future in urban goods distribution
F Hybrid vehicles have no prospect without governmental support
G Hybrid vehicles fit in easily in our organisation
H Our town is very well suited for distribution of goods by means of hybrid vehicles
I It is very important that in our town more ‘clean’ vehicles are deployed
J It is very important that in our town more ‘silent’ vehicles are deployed
K I have high expectations for the ElCIDIS project in our town
L Even if electric/hybrid transport turns out to be somewhat more expensive than conventional transport, it should still be preferred to conventional transport
M I have high expectations of technological innovation in general
Your organisation………………………………………………………… Your name………………………………………..Initials……………… Postal address…………………………………………………………….. Phone number…………………………………………………………….

54 ECN-C--02-080
country>. < Name organisation> < Name project manager> < Postal address > Thank you for your co-operation! Your remarks on this questionnaire or on the ELCIDIS project:

ECN-C--02-080 55
THE ELCIDIS PROJECT
Questionnaire 2 Dear participant, You are involved in the Electric Vehicle CIty DIStribution Systems project. In the ELCIDIS project, six European cities are exploring the possibilities of new forms of city distribution systems operating with electric and hybrid vehicles. In order to collect the experiences of the participating companies and authorities, surveys of persons involved in the project will be performed on a regular basis. This is Questionnaire 2, meant to determine your experiences in the ELCIDIS project so far. Your answers will be processed anonymously.
1. What is (the best description of) your position? � driver ��GO TO QUESTION 2.1 � planner (responsible for the day to day operation) ��GO TO QUESTION 3.1 � technical staff, mechanic ��GO TO QUESTION 3.1 � fleet manager (responsible for the acquisition of the fleet) ��GO TO QUESTION 3.1 � other:………………………………………………………. ��GO TO QUESTION 3.1
2.1 Do you drive an electric or a hybrid vehicle in the ELCIDIS project?
� electric �� please fill in table 2.1.1 � hybrid �� please fill in table 2.1.2
Table 2.1.1 Please fill in
A
What kind of electric vehicle
do you drive in the ELCIDIS
project?
B
How many vehicles of this
particular model do you
drive regularly?
C
Please indicate the number
plate(s) of this/these electric
vehicle(s)
D
In case of more
vehicles, please
put a tick against
the vehicle you
drive mostly
Make:………………………..
Model:……………………….
Loading capacity…………kg
Loading capacity…………m³
� only 1 vehicle
� 2 vehicles
� 3 vehicles
� more, namely …………
…………………………………
…………………………………
…………………………………
…………………………………
�
�
�
�

56 ECN-C--02-080
Table 2.1.2 Please fill in
A
What kind of hybrid vehicle
do you drive in the ELCIDIS
project?
B
How many vehicles of this
particular model do you
drive regularly?
C
Please indicate the number
plate(s) of this/these hybrid
vehicle(s)
D
In case of more
vehicles, please
put a tick against
the vehicle you
drive mostly
Make:………………………..
Model:……………………….
Loading capacity…………kg
Loading capacity…………m³
� only 1 vehicle
� 2 vehicles
� 3 vehicles
� more, namely …………
…………………………………
…………………………………
…………………………………
…………………………………
�
�
�
�
THE FOLLOWING QUESTIONS REFER TO THE ELECTRIC OR HYBRID VEHICLE YOU DRIVE MOSTLY.
2.2 Are you the only driver of this particular vehicle? � Yes � No, there are (about) ….. drivers altogether who drive this vehicle.
2.3 How many weeks’ experience do you have with the vehicle?
…………….weeks
2.4 As a rule, how many days a week is the vehicle used, whether by
you or any other driver?
……………days a week
2.5 How many kilometres does the vehicle cover on an average day?
……………kilometres daily
2.6 How many stops does the vehicle make on an average day?
( A STOP INVOLVES PARKING THE VEHICLE IN ORDER THAT
GOODS ARE LOADED OR UNLOADED)
…………….stops a day
2.7 IF YOU ARE TALKING ABOUT A HYBRID VEHICLE:
How many kilometres are covered on an average day using the electric motor and
how many using the conventional motor?
Daily …………………kilometres electric Daily …………………kilometres with the conventional motor
Information about the vehicle
3.1 When you were first involved with the ELCIDIS project, you may have
received information on the project and the vehicle/vehicles concerned. In
what form did you receive this information?
� I did not receive any information � I received written information � I received face-to-face instructions � Other:…………………………………………………………………………….

ECN-C--02-080 57
3.2 Would you say you were sufficiently informed in order to do your job properly?
� Yes � GO TO QUESTION 3.5
� No � GO TO QUESTION 3.3
3.3 About which aspects was the information provided insufficient?
3.4 In which form would you prefer to be informed on these aspects (for example
written information or face-to-face instructions)
3.5 Would you indicate in the table below about which aspects you currently want
MORE information?(several answers possible)
� Handling the vehicle � Driving characteristics of the vehicle � Charging the batteries � Capacity of the batteries � Energy consumption � Possibilities and limitations of the vehicle � Technical specifications � Minor repair electric motor � Major repair electric motor
� (if hybrid) minor repair combustion motor � (if hybrid) major repair combustion motor � economic aspects of the vehicle (costs and
benefits) � environmental aspects of the vehicle � the ELCIDIS project � other, namely ……………………………………………………… ………………………………………………………

58 ECN-C--02-080
Impressions of the vehicle
NEXT QUESTIONS REFER TO THE VEHICLE (MAKE & MODEL) YOUR ORGANISATION IS USING IN THE ELCIDIS PROJECT. SO PLEASE COMMENT ON THE MAKE & MODEL RATHER THAN A PARTICULAR VEHICLE. IN CASE YOUR ORGANISATION IS USING MORE
THAN ONE MAKE & MODEL IN THE ELCIDIS PROJECT, PLEASE COMMENT ON THE
MAKE & MODEL YOU KNOW BEST.
4.1 On a scale of 1-9, where 1 is “very poor” and 9 is “excellent “, please indicate your
impressions of the performance of the vehicle (MODEL) your organisation is using
in the ELCIDIS-project.
PLEASE FILL IN YOUR FIGURES (BETWEEN 1 TO 9) IN COLUMN A. IF YOU DON’T KNOW AN ANSWER, PUT A QUESTIONMARK (?)
The vehicle you comment on:
Make:…………………………………………………………..
Model:…………………………………………………………..
COLUMN A
What are your
impressions of the vehicle?
1= very poor,
9=excellent
?= don’t know
A RELIABILITY
B ENERGY USE
C FULL TIME AVAILABILITY (24 hours a day)
De LOADING CAPACITY (kg)
E LOADING CAPACITY (m³)
F LOW MAINTENANCE COSTS
G DESIGN,STYLING
H ENGINE NOISE
I ENVIRONMENTALLY FRIENDLY
J TOP SPEED
K ACCELERATION
L COMFORTABLE FOR DRIVER
M OPTIONS (AIRCO, ABS)
N RADIUS OF ACTION
O MONOEUVRABILITY
P SAFETY
Q EASE OF OPERATION
R SUITABLE FOR OUR ORGANISATION

ECN-C--02-080 59
4.2 On a scale of 1-9, where 1 is “very poor” and 9 is “excellent”, please indicate (by
circling the right figure) your overall opinion about the vehicle.
Very poor 1 2 3 4 5 6 7 8 9 excellent
My overall opinion about the vehicle in the ELCIDIS project
1
2
3
4
5
6
7
8
9
4.3 Have you noticed significant differences in performance between two or more
vehicles of the same make and model? � No ��GO TO QUESTION 5.1 � Yes ��GO TO QUESTION 4.4
4.4 Could you describe these differences in
performance?
4.5 Could you explain these differences?
� No
� Yes, as follows:
4.6 Please indicate the number plates of vehicles that perform strikingly poor as
compared to other vehicles of the same make and model.
………………………………… …………………………………
Charging the batteries
5.1 Are you personally involved with the charging of the batteries? � No ��GO TO QUESTION 6.1 � Yes ��GO TO QUESTION 5.2
5.2 Where does the charging of the batteries take place? (several answers possible)
� At the work site/distribution centre � At the driver’s home � At customers � other, namely …………………………………………………………….

60 ECN-C--02-080
5.3 How often are the batteries charged?
� several times a day � exactly once a day � several times a week � no fixed procedures
5.4 To what extent are you satisfied with charging the batteries?
� very satisfied � satisfied � not satisfied/not unsatisfied � unsatisfied � very unsatisfied
5.5 Please explain your answer
5.6 To what extent are you satisfied with the capacity of the batteries?
� very satisfied � satisfied � not satisfied/not unsatisfied � unsatisfied � very unsatisfied
Technical malfunctions
6.1 Did any malfunctions occur at one or more vehicles in the ELCIDIS project?
� No �� GO TO QUESTION 7.1 � Yes �� GO TO QUESTION 6.2

ECN-C--02-080 61
6.2 Could you give a precise description of the malfunction; please, indicate if and by
whom the malfunction was repaired.
Description malfunction Functionary who repaired the
malfunction?
Vehicle numberplate: …………………………. Malfunction ………………………………………………………………. ………………………………………………………………………………
� Driver himself � Mechanic of the own organisation � Mechanic of a repair firm � Other, namely…………………
Vehicle numberplate: ………………………….. Malfunction …………………………… …………………………………. ………………………………………………………………………………
� Driver himself � Mechanic of the own organisation � Mechanic of a repair firm � Other, namely…………………
Vehicle numberplate: …………………………. Malfunction ………………..……………………………………………… ………………………………………………………………………………
� Driver himself � Mechanic of the own organisation � Mechanic of a repair firm � Other, namely…………………
Evaluation
7.1 If you compare the electric/hybrid vehicle with a conventional vehicle (combustion
engine), what would you say are THE TWO MOST IMPORTANT BENEFITS of the
electric/hybrid vehicle? Could you also indicate WHY THESE BENEFITS ARE
IMPORTANT TO YOU?
1. Benefits of the electric/hybrid vehicle:
Important because:
2. Benefits of the electric/hybrid vehicle:
Important because:

62 ECN-C--02-080
7.2 If you compare the electric/hybrid vehicle with a conventional vehicle, what are
TWO MOST IMPORTANT DRAWBACKS of the electric/hybrid vehicle? Could you
also describe WHY these aspects are important to you?
1. Drawback of the electric/hybrid vehicle:
Important because:
2. Drawback of the electric/hybrid vehicle:
Important because:
Improvements
8.1 Could you think of any TECHNICAL ADJUSTMENTS to the vehicle, which could add
to the success of the vehicle within your organisation?
� Yes
� No �� GO TO QUESTION 8.2
If yes, please describe your suggestions:

ECN-C--02-080 63
8.2 Could you think of any ADJUSTMENTS IN YOUR ORGANISATION, which could add
to the success of the vehicle within your organisation?
� yes � No �� GO TO QUESTION 8.3
If yes, please describe your suggestions:

64 ECN-C--02-080
8.3 Could you think of any ADJUSTMENTS IN YOUR WORK AREA who could add to
the success of the vehicle within your organisation? (FOR EXAMPLE OF TRAFFIC
RULES, ADAPTATIONS OF STREETS AND SO ON)
� Yes
� No �� GO TO QUESTION 9.1
If yes, please describe your suggestions:

ECN-C--02-080 65
9.1 On a scale of 1-9, where 1 is “I totally disagree” and 9 is “I totally agree”, please
indicate your personal opinion about the following statements.
PLEASE FILL IN YOUR FIGURES (BETWEEN 1 TO 9) IN TABLE 4. IF YOU DON’T KNOW AN ANSWER, PUT A QUESTIONMARK (?)
I totally disagree 1 2 3 4 5 6 7 8 9 I totally agree, ?=don’t know
Your figure
A Electric vehicles certainly have a future in urban goods distribution
B Electric vehicles have no prospect without governmental support
C Electric vehicles fit in easily in our organisation
D Our town is very well suited for distribution of goods by means of electric vehicles
E Hybrid vehicles certainly have a future in urban goods distribution
F Hybrid vehicles have no prospect without governmental support
G Hybrid vehicles fit in easily in our organisation
H Our town is very well suited for distribution of goods by means of hybrid vehicles
I It is very important that in our town more `clean’ vehicles are deployed
J It is very important that in our town more ‘silent’ vehicles are deployed
K I have high expectations for the ElCIDIS project in our town
L Even if electric/hybrid transport turns out to be somewhat more expensive than conventional transport, it should still be preferred to conventional transport

66 ECN-C--02-080
Your organisation………………………………………………………… Your name………………………………………..Initials……………… Postal address…………………………………………………………….. Phone number…………………………………………………………….
Please return this questionnaire to <the organisation in charge of the ELCIDIS project in your
country>. < Name organisation> < Name project manager> < Postal address > Thank you for your co-operation! Your remarks on this questionnaire or on the ELCIDIS project:

ECN-C--02-080 67
APPENDIX B
company Rik
srd
pos
lys
kom
bita
gent
fabr
AEM
com4
com3
com2
com1
10
9
8
7
6
5
4
3
More eff. distribution
Environm. benefits
Techn. improvement
Average
Figure B.1 Average value per company for three objectives of the ELCIDIS project for electric
vehicles
company TU
Siem
Herz
Grun
GEWO
FI
Comp
Betr
10
8
6
4
2
0
More eff. distribution
Environm. benefits
Techn. improvements
Average
Figure B.2 Average value per company for three objectives of the ELCIDIS project for hybrid
vehicles (Erlangen)

68 ECN-C--02-080
company TNT
NPD
G&L
TRA
SAB
GSAB
GC
ASG
ABS
ABF
10
8
6
4
2
0
More eff. distribution
Environm. benefits
Techn. improvements
Average
Figure B.3 Average value per company for three objectives of the ELCIDIS project for hybrid
trucks vehicles
9
8
7
6
5
4
Average
Relia
bility
Energ
y u
se
Loadin
g c
ap. [k
g]
Availa
bility
24 h
ours
Loadin
g c
ap.[m
3]
Manoeuvra
bility
Desig
n, s
tylin
g
Low
main
tenance c
ost
Engin
e n
ois
e
Enviro
nm
. friendly
Top S
peed
Optio
n lik
e a
irco
Com
fort fo
r driv
er
Accele
ratio
n
Suita
ble
for o
rganis
atio
n
Radiu
s o
f actio
n
Ease o
f opera
tion
Safe
ty
Figure B.4 Average score of different aspects of the actual performance of the electric vehicles

ECN-C--02-080 69
7.0
6.5
6.0
5.5
5.0
4.5
4.0
Average
Re
liab
ility
En
erg
y u
se
Lo
ad
ing
ca
p. [k
g]
Ava
ilab
ility 2
4 h
ou
rs
Lo
ad
ing
ca
p.[m
3]
Ma
no
eu
vra
bility
De
sig
n, s
tylin
g
Lo
w m
ain
ten
an
ce
co
st
En
gin
e n
ois
e
En
viro
nm
. frien
dly
To
p S
pe
ed
Op
tion
like
airc
o
Co
mfo
rt for d
rive
r
Acce
lera
tion
Su
itab
le fo
r org
an
isa
tion
Ra
diu
s o
f actio
n
Ea
se
of o
pe
ratio
n
Sa
fety
Figure B.5 Average score of different aspects of the actual performance of the hybrid cars
9
8
7
6
5
4
3
Average
Reliability
Energy use
Loading cap. [kg]
Availability 24 hours
Loading cap.[m3]
Manoeuvrability
Design, styling
Low m
aintenance cost
Engine noise
Environm
. friendly
Top S
peed
Option like airco
Com
fort for driver
Acceleration
Suitable for organisation
Radius of action
Ease of operation
Safety
Figure B.6 Average score of different aspects of the actual performance of the hybrid trucks

70 ECN-C--02-080
109 876 5 4 3 2
9
8
7
6
5
4
3
2
1
Expectations [average]
Opinion about vehicle norm used Figure B.7 Opinion about the vehicle normally used vs. expected performance of hybrid
vehicles
10 8 6 420 -2
8.5
8.0
7.5
7.0
6.5
6.0
5.5
5.0
4.5
Opinion about vehicle norm used
Expectations [average]
Figure B.8 Opinion about the vehicle normally used vs. expected performance of hybrid trucks
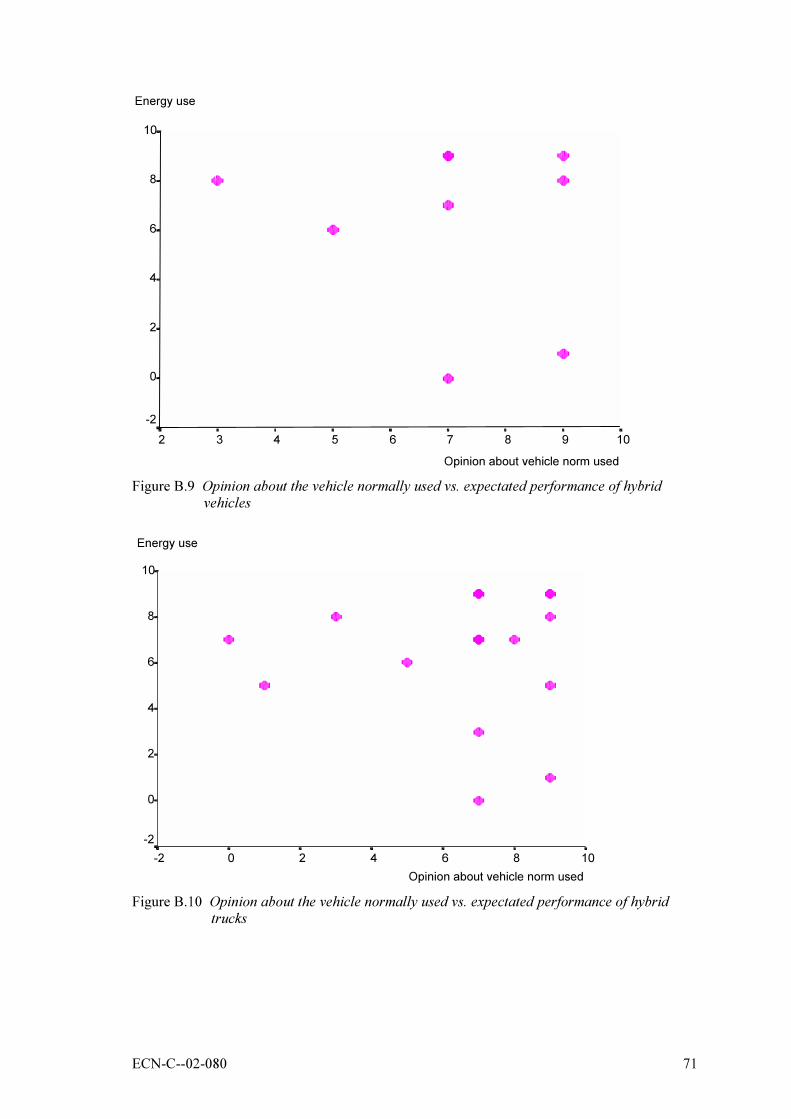
ECN-C--02-080 71
10 9 876 5 4 3 2
10
8
6
4
2
0
-2
Opinion about vehicle norm used
Energy use
Figure B.9 Opinion about the vehicle normally used vs. expectated performance of hybrid
vehicles
10 8 6 4 2 0 -2
10
8
6
4
2
0
-2
Opinion about vehicle norm used
Energy use
Figure B.10 Opinion about the vehicle normally used vs. expectated performance of hybrid
trucks

72 ECN-C--02-080
0
1
2
3
4
5
6
7
8
9
10
M1 N1 N2 N3 N4 N5 N6 N7 S5 S6 S7 S8
Figure B.11 Observed shift in the score on overall opinion during the project for electric
vehicles (M = Milan, N = Stavanger, S = Stockholm)
0
1
2
3
4
5
6
7
8
9
10
M1 N1 N2 N3 N4 N5 N6 N7 S5 S6 S7 S8
Figure B.12 Observed shift in the score on reliability of electric vehicles during the project
(M = Milan, N = Stavanger, S = Stockholm)

ECN-C--02-080 73
0
1
2
3
4
5
6
7
8
9
10
M1 N1 N2 N3 N4 N5 N6 N7 S5 S6 S7 S8 Figure B.13 Observed shift in the score on energy use of electric vehicles during the project
(M = Milan, N = Stavanger, S = Stockholm)
0
1
2
3
4
5
6
7
8
9
10
M1 N1 N2 N3 N4 N5 N6 N7 S5 S6 S7 S8 Figure B.14 Observed shift in the score on acceleration of electric vehicles during the project
(M = Milan, N = Stavanger, S = Stockholm)

74 ECN-C--02-080
0
1
2
3
4
5
6
7
8
9
10
M1 N1 N2 N3 N4 N5 N6 N7 S5 S6 S7 S8 Figure B.15 Observed shift in the score on radius of action of electric vehicles during the
project (M = Milan, N = Stavanger, S = Stockholm)
0
1
2
3
4
5
6
7
8
9
10
M1 N1 N2 N3 N4 N5 N6 N7 S5 S6 S7 S8 Figure B.16 Observed shift in the score on safety of electric vehicles during the project
(M = Milan, N = Stavanger, S = Stockholm)

ECN-C--02-080 75
0
1
2
3
4
5
6
7
8
9
10
M1 N1 N2 N3 N4 N5 N6 N7 S5 S6 S7 S8
Figure B.17 Observed shift in the score on ease of operation of electric vehicles during the
project (M = Milan, N = Stavanger, S = Stockholm)
0
1
2
3
4
5
6
7
8
9
10
M1 N1 N2 N3 N4 N5 N6 N7 S5 S6 S7 S8
Figure B.18 Observed shift in the score on suitable for our organisation during the project for
electric vehicles (M = Milan, N = Stavanger, S = Stockholm)

76 ECN-C--02-080
0
1
2
3
4
5
6
7
8
9
10
S1 S2 S3 S4
Figure B.19 Observed shift in the score on overall opinion during the project for hybrid trucks
in Stockholm
0
1
2
3
4
5
6
7
8
9
10
S1 S2 S3 S4
Figure B.20 Observed shift in the score on reliability of hybrid trucks during the project in
Stockholm

ECN-C--02-080 77
0
1
2
3
4
5
6
7
8
9
10
S1 S2 S3 S4
Figure B.21 Observed shift in the score on energy use of hybrid trucks during the project in
Stockholm
0
1
2
3
4
5
6
7
8
9
10
S1 S2 S3 S4
Figure B.22 Observed shift in the score on acceleration of hybrid trucks during the project in
Stockholm
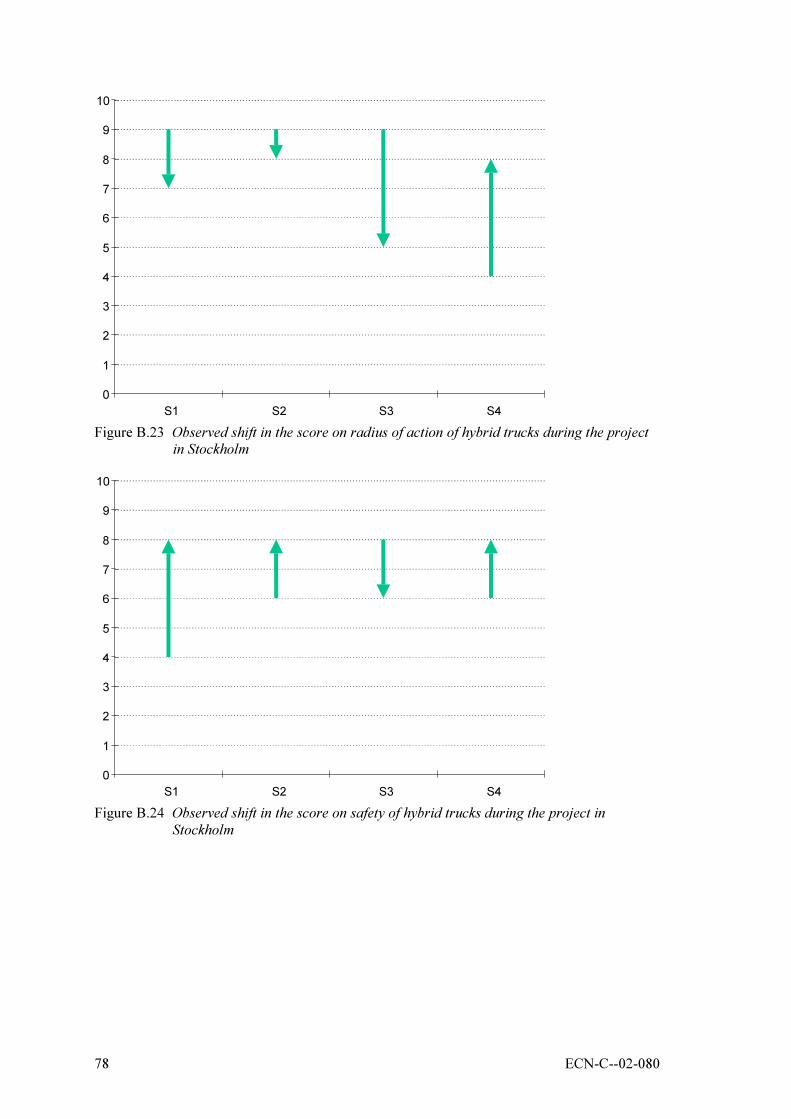
78 ECN-C--02-080
0
1
2
3
4
5
6
7
8
9
10
S1 S2 S3 S4
Figure B.23 Observed shift in the score on radius of action of hybrid trucks during the project
in Stockholm
0
1
2
3
4
5
6
7
8
9
10
S1 S2 S3 S4
Figure B.24 Observed shift in the score on safety of hybrid trucks during the project in
Stockholm

ECN-C--02-080 79
0
1
2
3
4
5
6
7
8
9
10
S1 S2 S3 S4
Figure B.25 Observed shift in the score on ease of operation of hybrid trucks during the project
in Stockholm
0
1
2
3
4
5
6
7
8
9
10
S1 S2 S3 S4
Figure B.26 Observed shift in the score on suitable for our organisation during the project for
hybrid trucks in Stockholm

80 ECN-C--02-080
REFERENCES
EVD (2001): Electric Vehicle Deliveries in Postal Services.
EVWG (2000): Electric Vehicle Working Group. Evaluation of Targeted Transport Projects.