Embed Size (px)
Citation preview
Perceptual Evaluation of Liquid Simulation Methods
KIWON UM, Technical University of MunichXIANGYU HU, Technical University of MunichNILS THUEREY, Technical University of Munich
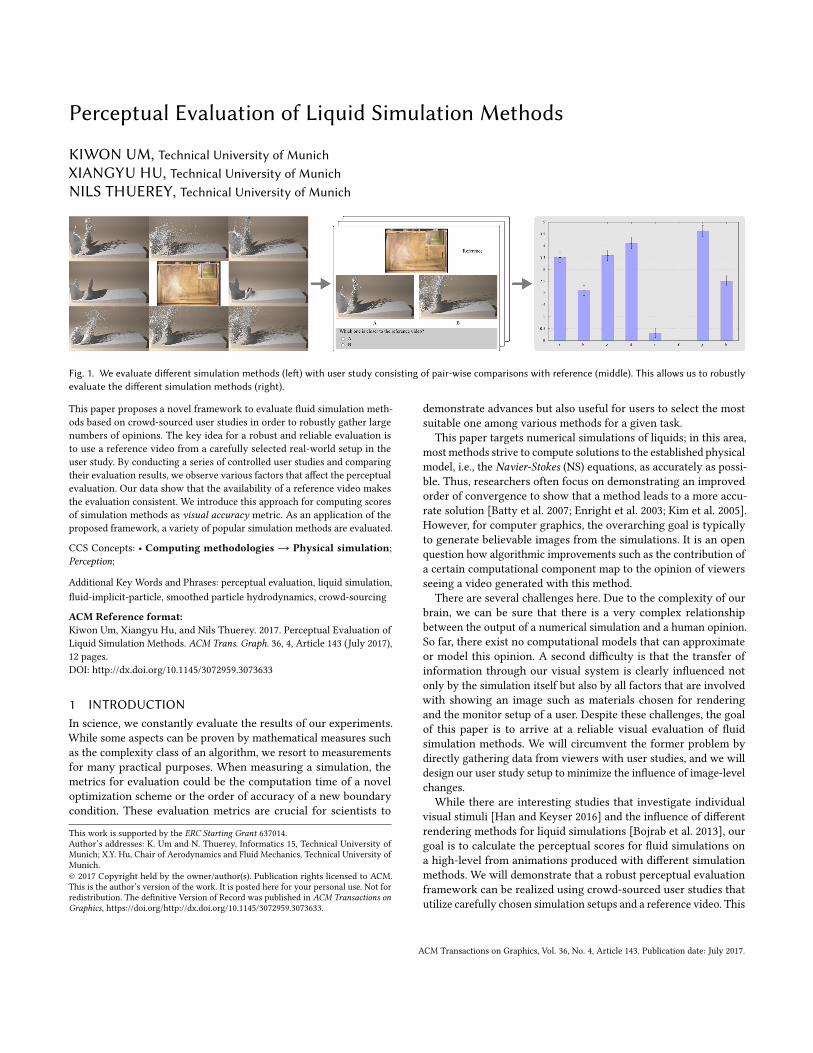
Fig. 1. We evaluate di�erent simulation methods (le�) with user study consisting of pair-wise comparisons with reference (middle). This allows us to robustlyevaluate the di�erent simulation methods (right).
This paper proposes a novel framework to evaluate �uid simulation meth-ods based on crowd-sourced user studies in order to robustly gather largenumbers of opinions. The key idea for a robust and reliable evaluation isto use a reference video from a carefully selected real-world setup in theuser study. By conducting a series of controlled user studies and comparingtheir evaluation results, we observe various factors that a�ect the perceptualevaluation. Our data show that the availability of a reference video makesthe evaluation consistent. We introduce this approach for computing scoresof simulation methods as visual accuracy metric. As an application of theproposed framework, a variety of popular simulation methods are evaluated.
CCS Concepts: • Computing methodologies → Physical simulation;Perception;
Additional Key Words and Phrases: perceptual evaluation, liquid simulation,�uid-implicit-particle, smoothed particle hydrodynamics, crowd-sourcing
ACM Reference format:Kiwon Um, Xiangyu Hu, and Nils Thuerey. 2017. Perceptual Evaluation ofLiquid Simulation Methods. ACM Trans. Graph. 36, 4, Article 143 (July 2017),12 pages.DOI: http://dx.doi.org/10.1145/3072959.3073633
1 INTRODUCTIONIn science, we constantly evaluate the results of our experiments.While some aspects can be proven by mathematical measures suchas the complexity class of an algorithm, we resort to measurementsfor many practical purposes. When measuring a simulation, themetrics for evaluation could be the computation time of a noveloptimization scheme or the order of accuracy of a new boundarycondition. These evaluation metrics are crucial for scientists to
This work is supported by the ERC Starting Grant 637014.Author’s addresses: K. Um and N. Thuerey, Informatics 15, Technical University ofMunich; X.Y. Hu, Chair of Aerodynamics and Fluid Mechanics, Technical University ofMunich.© 2017 Copyright held by the owner/author(s). Publication rights licensed to ACM.This is the author’s version of the work. It is posted here for your personal use. Not forredistribution. The de�nitive Version of Record was published in ACM Transactions onGraphics, https://doi.org/http://dx.doi.org/10.1145/3072959.3073633.
demonstrate advances but also useful for users to select the mostsuitable one among various methods for a given task.
This paper targets numerical simulations of liquids; in this area,most methods strive to compute solutions to the established physicalmodel, i.e., the Navier-Stokes (NS) equations, as accurately as possi-ble. Thus, researchers often focus on demonstrating an improvedorder of convergence to show that a method leads to a more accu-rate solution [Batty et al. 2007; Enright et al. 2003; Kim et al. 2005].However, for computer graphics, the overarching goal is typicallyto generate believable images from the simulations. It is an openquestion how algorithmic improvements such as the contribution ofa certain computational component map to the opinion of viewersseeing a video generated with this method.
There are several challenges here. Due to the complexity of ourbrain, we can be sure that there is a very complex relationshipbetween the output of a numerical simulation and a human opinion.So far, there exist no computational models that can approximateor model this opinion. A second di�culty is that the transfer ofinformation through our visual system is clearly in�uenced notonly by the simulation itself but also by all factors that are involvedwith showing an image such as materials chosen for renderingand the monitor setup of a user. Despite these challenges, the goalof this paper is to arrive at a reliable visual evaluation of �uidsimulation methods. We will circumvent the former problem bydirectly gathering data from viewers with user studies, and we willdesign our user study setup to minimize the in�uence of image-levelchanges.
While there are interesting studies that investigate individualvisual stimuli [Han and Keyser 2016] and the in�uence of di�erentrendering methods for liquid simulations [Bojrab et al. 2013], ourgoal is to calculate the perceptual scores for �uid simulations ona high-level from animations produced with di�erent simulationmethods. We will demonstrate that a robust perceptual evaluationframework can be realized using crowd-sourced user studies thatutilize carefully chosen simulation setups and a reference video. This
ACM Transactions on Graphics, Vol. 36, No. 4, Article 143. Publication date: July 2017.
143:2 • K. Um et al.
will allow us to retrieve reliable visual accuracy scores of di�erentsimulation methods evaluated in each study. In order to establishthis framework, we ran an extensive series of user studies gatheringmore than 53,000 votes in total. The overview of our framework isillustrated in Figure 1.
In summary, we propose a novel perceptual evaluation frameworkfor liquid simulations. To the best of our knowledge, the perceptualevaluation of physically-based liquid animations has previously notbeen studied, and we will use our framework to evaluate di�erentsimulation methods and parameterizations. From our evaluationresults, we will draw useful observations for di�erent simulationmethods.
2 RELATED WORKFluid simulation methods typically compute solutions to the NSequations, which can be written as ∂u/∂t+u ·∇u = g−∇P/ρ+ν∇2uwith the additional constraint to conserve volume: ∇ · u = 0, whereu is the velocity, g is the gravity, P is the pressure, ρ is the den-sity, and ν is the viscosity coe�cient. Numerical solvers for theseequations can be roughly categorized as Eulerian and Lagrangianmethods. Fluid animations using Eulerian discretizations have beenpioneered by Foster and Metaxas [1996], and the stable �uids solver[Stam 1999] has been widely used after its introduction. For liquids,the particle level set method has been demonstrated to yield accu-rate and smooth surface motions [Enright et al. 2002]. Currently, the�uid-implicit-particle (FLIP) approach, which combines Eulerian in-compressibility with a particle-based advection scheme to representsmall-scale details and splashes, is widely used for visual e�ects[Zhu and Bridson 2005]. The FLIP algorithm has been extended tomany interesting applications such as the artistic control [Pan et al.2013] and adaptivity [Ando et al. 2013]. In the following, we willfocus on liquid simulations in simple domains without any adap-tivity. We believe that this is a good starting point for our studies,but these extensions would of course be interesting for perceptualevaluations in the future.
The FLIP method was extended to incorporate position correctionof the participating particles [Ando et al. 2012; Um et al. 2014] andto improve its e�ciency by restricting particles to a narrow bandaround the surface [Ferstl et al. 2016]. Secondary e�ects generationhas been a highly popular topic within the �uid simulation area inorder to increase the apparent detail of the simulation [Ihmsen et al.2012]. Many movies and interactive applications have incorporatedhand-tuned parameters and heuristics to approximate where andhow splashes, foam, and bubbles develop from an under-resolvedsimulation. Moreover, a unilateral pressure solver was proposed toenable large-scale splashes in FLIP [Gerszewski and Bargteil 2013].Recently, several more FLIP variants were proposed to incorporatecomplex material e�ects that go beyond regular Newtonian �uids[Ram et al. 2015; Stomakhin et al. 2013]. We will later use the closelyrelated a�ne particle-in-cell (APIC) variant [Jiang et al. 2015] asone of our candidates for simulation methods.
Lagrangian �uid simulation techniques in graphics are typicallybased on variants of the smoothed particle hydrodynamics (SPH)approach. After its �rst use for deformable objects [Debunne et al.1999], an SPH algorithm for liquids was introduced by Müller et
al. [2003], and then weakly-compressible SPH (WCSPH) was in-troduced by Becker and Teschner [2007]. The SPH algorithm wasadopted and extended in a multitude of ways such as an adaptivediscretization [Adams et al. 2007] and a predictor-corrector step thatimproves e�ciency and stability [Solenthaler and Pajarola 2009].Techniques for two-way coupling between rigid bodies and liquidshave likewise been proposed [Akinci et al. 2012].
A di�erent formulation using the position-based dynamics view-point was proposed for real-time simulations [Macklin and Müller2013] while other researchers suggested an implicit method for bet-ter convergence rate [Ihmsen et al. 2014a]; this is known as implicitincompressible SPH (IISPH). From the Lagrangian �eld, we will re-strict our visual accuracy study to a few selected methods: WCSPHand IISPH, which are typical and popular in graphics. Additionally,we also include an engineering SPH variant [Adami et al. 2012],from which we expect particularly accurate simulations; we denotethis variant as SPH in our studies.
Naturally, researchers have been interested in combining aspectsof the Lagrangian and Eulerian representations by bringing SPHand grid-based solving components together [Losasso et al. 2008;Raveendran et al. 2011]. We have not yet included these hybridapproaches in our studies, although FLIP arguably represents ahybrid particle-grid method. For a thorough overview of popular�uid simulations methods, refer to the book by Bridson [2015] andstate-of-the-art report by Ihmsen et al. [2014b].
The human visual system and perception of image and videocontents have received signi�cant attention in computer graphicsin order to study how algorithmic choices in�uence the �nal judg-ment of the created images. For example, in the area of renderingtechniques, Cater et al. [2002] proposed to use selective and per-ceptually driven rendering approaches, and Dumont et al. [2003]introduced a theoretical framework to compute perceptual metrics.In photography, Masia et al. [2009] perceptually evaluated di�erenttechniques for tone-mapping HDR images with user studies. Forvideos, an approach for perceptually-driven up-scaling of 3D con-tent was proposed [Didyk et al. 2010] while others investigated acomputational model for the perceptual evaluation of videos [Aydinet al. 2010].
Beyond rendering and video, perceptual studies have also beenused in the �eld of character animation. Especially, human charac-ters have received attention. For instance, McDonnell et al. [2008]studied how to populate natural crowds for virtual environments.More recently, researchers also gathered data on the attractivenessof virtual characters [Hoyet et al. 2013]. In the area of deformable ob-jects, Han and Keyser [2016] studied how visual details can in�uencethe perceived sti�ness of materials. Bojrab et al. [2013] studied howrendering styles of liquids in�uence user opinion. While this workalso considers liquids, our goal is in a way orthogonal to theirs. Wefocus on simulation methods without being in�uenced by renderingstyles.
3 VISUAL EVALUATION OF LIQUID SIMULATIONSDespite the fact that most liquid simulation methods are physically-based and thus capable of approximating the NS equations in thelimit, noticeable visual di�erences exist among animations createdfrom the di�erent methods. Being aware of these di�erences, we
ACM Transactions on Graphics, Vol. 36, No. 4, Article 143. Publication date: July 2017.
Perceptual Evaluation of Liquid Simulation Methods • 143:3
1.00
0.295
0.295
0.403
0.744 1.248 1.228
0.550.161
0.161
top
front
(a) breaking-dam (in meter)
6.2
45 45
9.3
front
top
50.8
(b) sloshing-wave (in centimeter)
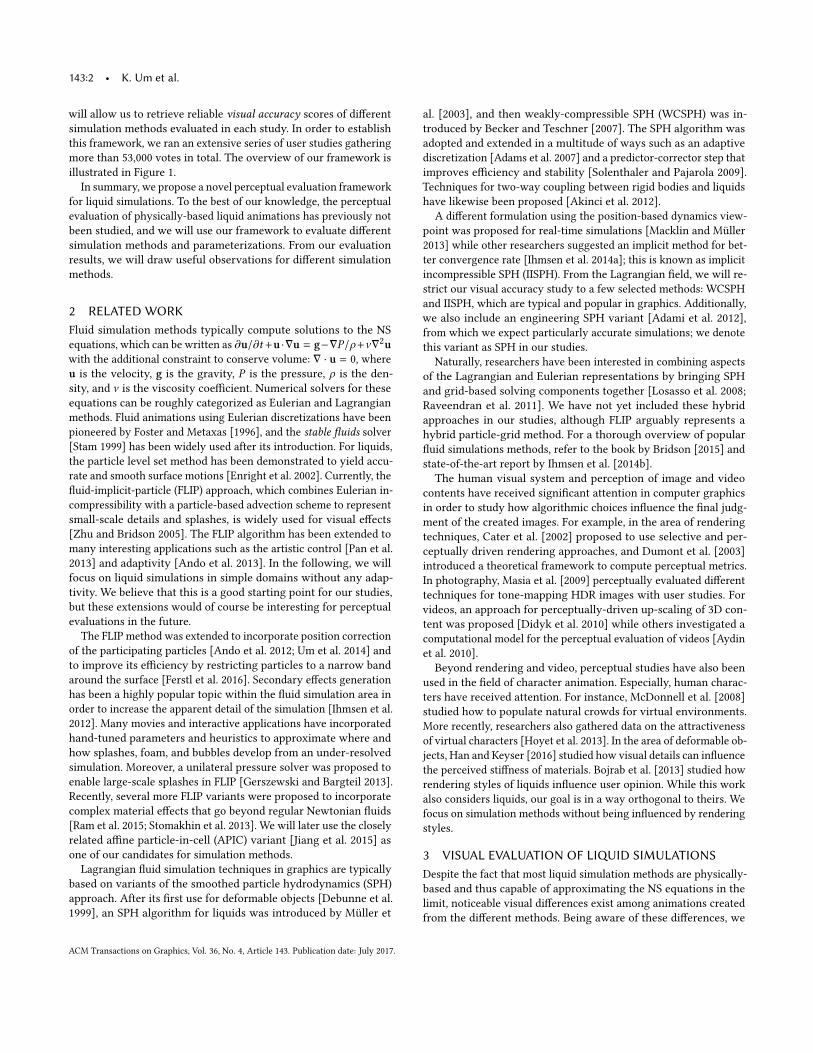
Fig. 2. Two simulation setups [Botia-Vera et al. 2010; Kleefsman et al. 2005]for evaluation of liquid simulation and example frames of real experiments.
propose a novel approach that employs user studies to evaluate thedi�erent methods in terms of how closely they match real phenom-ena. The goal of our approach is to robustly and reliably comparedi�erent liquid simulations such that the evaluation re�ects a gen-eral opinion. Therefore, we employ a crowd-sourcing platform inorder to recruit many participants to retrieve a reliable evaluation.
We focus on the perceptual evaluation of simulations in terms ofwhat we call visual accuracy. We de�ne this visual accuracy to be ascore computed from user study data to compare di�erent methods,and we will make sure that it can be computed in a robust andunbiased way. To collect data, we let users select a preferred videofrom pair-wise comparisons, and we found it crucial for robustnessto provide participants with a visual reference. As we will outlinebelow, this also makes the results very stable with respect to stronglydi�ering rendering styles. These comparisons with a reference videoare also our motivation to see the scores we compute as a form ofaccuracy.
Liquid simulations are commonly used tools in visual e�ectsand applied for a vast range of phenomena from drops of blood tolarge scale ocean scenes. While it would be highly interesting toevaluate all of them, we focus on one particular regime of water-likeliquids on human scales. This regime is highly challenging due tothe low viscosity of water. The resulting �ows typically feature highReynolds numbers, complex waves, and large amounts of dropletsand splashes. Although this naturally limits the regime of our study,we believe that it is particularly a representative for many e�ectsand thus worth studying. Next, we will present two carefully chosensimulation setups that will also form the basis of our user studies inSection 3.2.
3.1 Simulation SetupWhen selecting simulation setups, our requirements are that thesetups are easy to realize in numerical simulations; thus, they do not
involve any specialized domain boundary conditions or any mov-ing obstacles. Therefore, the setups should be easily reproducible.Nonetheless, the setups need to result in su�ciently complex dynam-ics such as overturning waves and splashes in order to be relevantfor visual e�ects applications. Note that our setups stem from theengineering community. This has the additional bene�t that detailed�ow measurements are available as well as video data from realexperiments. The latter is especially important for our user studylater.
Our �rst setup is close to the popular breaking dam case oftenseen in graphics. Such a benchmark setup is also often used forvalidation in the engineering studies, which adds an obstacle infront of the breaking dam for additional complexity [Kleefsmanet al. 2005]. This setup uses a tank of size 3.22m×1m×1m with anopen roof, a static obstacle of 0.16m×0.16m×0.4m, and an initialwater volume of 1.23m×0.55m×1.0m. As the tank is more than threemeters in length and the initial column is considerably high, thisbreaking dam setup results in violent and turbulent splashes, whichmakes it tough but relevant for our purposes. We will denote thissetup as dam in the following, and the details of its initial conditionsare illustrated in Figure 2-(a).
Our second setup is a sloshing wave tank [Botia-Vera et al. 2010];this is illustrated in Figure 2-(b). A rectangular tank partially �lledwith water experiences a periodic motion that continually injectsenergy into the system leading to waves and splash e�ects form-ing over time. The size of the tank is 0.9m×0.51m×0.062m, and therotation axis is located at the lower center of the tank. The initialwater height is 0.093m. This setup has a signi�cantly smaller overallwater volume; it leads to interesting waves forming over time. Thesewaves are more prominent here than in the dam setup. We will de-note this setup as wave in the following. Additional documentationfor both setups is available online [Issa et al. 2017].
For all simulations, we parameterize them according to the real-world dimensions given above using earth gravity as the only exter-nal force. Unless otherwise noted, we will not include any additionalviscosity. In the following, we explain the user studies, which arebased on one of these two setups.
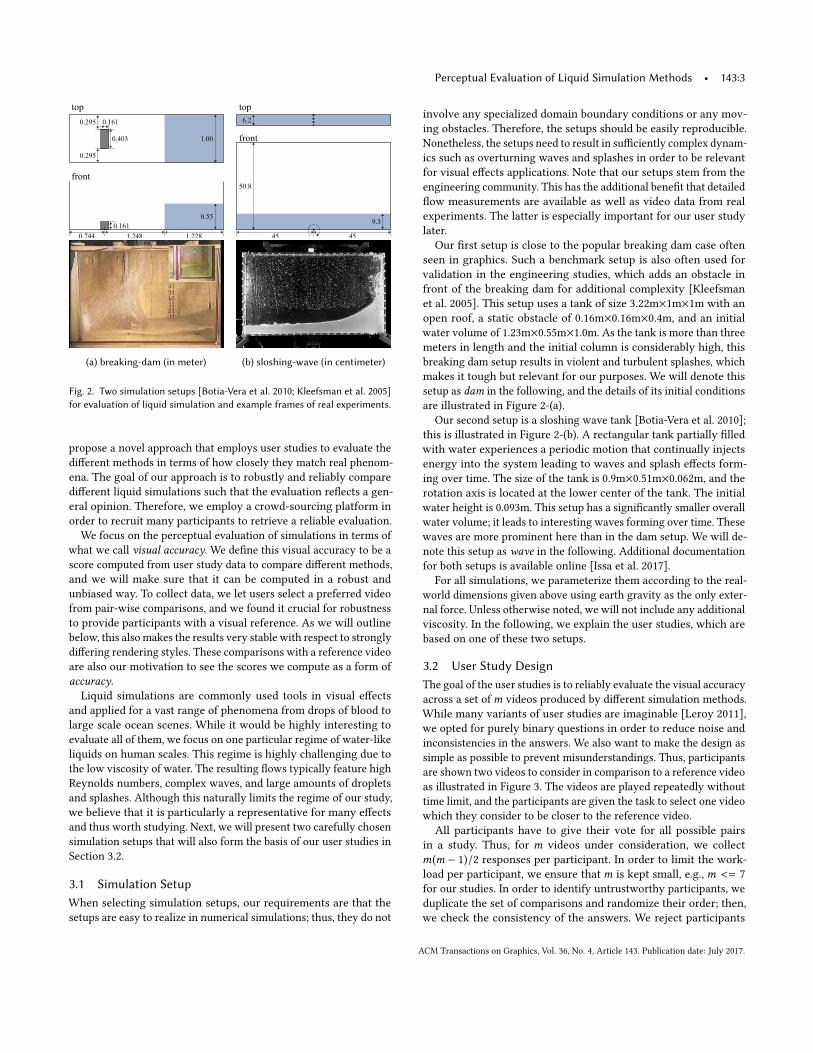
3.2 User Study DesignThe goal of the user studies is to reliably evaluate the visual accuracyacross a set of m videos produced by di�erent simulation methods.While many variants of user studies are imaginable [Leroy 2011],we opted for purely binary questions in order to reduce noise andinconsistencies in the answers. We also want to make the design assimple as possible to prevent misunderstandings. Thus, participantsare shown two videos to consider in comparison to a reference videoas illustrated in Figure 3. The videos are played repeatedly withouttime limit, and the participants are given the task to select one videowhich they consider to be closer to the reference video.
All participants have to give their vote for all possible pairsin a study. Thus, for m videos under consideration, we collectm(m − 1)/2 responses per participant. In order to limit the work-load per participant, we ensure that m is kept small, e.g., m <= 7for our studies. In order to identify untrustworthy participants, weduplicate the set of comparisons and randomize their order; then,we check the consistency of the answers. We reject participants
ACM Transactions on Graphics, Vol. 36, No. 4, Article 143. Publication date: July 2017.
143:4 • K. Um et al.
A B
AB
01/30: Which one is closer to the reference video?
Reference
Fig. 3. Our user study design.
with a consistency of less than 70% [Cole et al. 2009]. Note that wealso randomize the positioning of both videos for each question (i.e.,left and right side).
Based on the pair-wise votes per study, we can now compute aset of scores for all m videos. For this purpose, we adopt the widelyused Bradley-Terry model [Bradley and Terry 1952]. We review themodel brie�y here. Its goal is to compute scores si such that we cande�ne the probability pi j that a participant chooses video i overvideo j as:
pi j = esi−sj /(1 + esi−sj
). (1)
Letwi j denote the number of times where video i was preferred overvideo j in a user study. Assuming the observations are independent,wi j follows a binomial distribution. Therefore, the log likelihood forall pairs among all videos can be calculated as follows:
L(s) =m∑i=1
m∑j=1
(wi jsi −wi j ln(esi + esj )
)(2)
where s = [s1, s2, ..., sm]. The �nal scores of all videos are computedby solving for the s that maximizes the likelihood function L inEquation (2) [Hunter 2004].
The vector of scores s is what we use to evaluate the visual ac-curacy in the following. Note that these scores do not yield any“absolute” distances to the reference, and they cannot be used tomake comparisons across di�erent studies. However, we found thatthey yield a reliable scoring and probability (see Equation (1)) forall videos participating in a single study.
In order to prevent bias with respect to the participants, we rana series of studies in three di�erent crowd-sourcing platforms andfound that di�erences were negligible. Details for these studies canbe found in Appendix A. Across our studies, we also noticed thatthe consistency checks did not substantially in�uence the results,thus the large majority of participants was trustworthy. We gath-ered 50 answers per pair-wise comparison question from di�erentparticipants in each user study. In total, we collected user study datafor 53,300 questions from 612 participants in 65 countries.
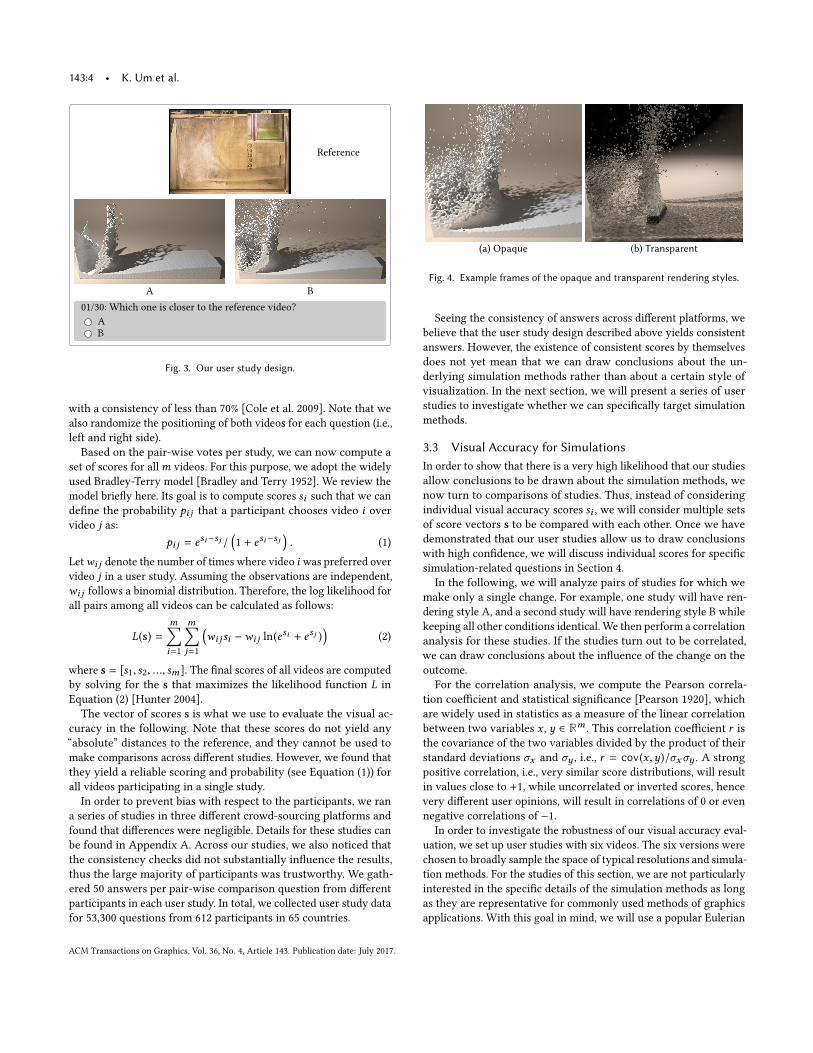
(a) Opaque (b) Transparent
Fig. 4. Example frames of the opaque and transparent rendering styles.
Seeing the consistency of answers across di�erent platforms, webelieve that the user study design described above yields consistentanswers. However, the existence of consistent scores by themselvesdoes not yet mean that we can draw conclusions about the un-derlying simulation methods rather than about a certain style ofvisualization. In the next section, we will present a series of userstudies to investigate whether we can speci�cally target simulationmethods.
3.3 Visual Accuracy for SimulationsIn order to show that there is a very high likelihood that our studiesallow conclusions to be drawn about the simulation methods, wenow turn to comparisons of studies. Thus, instead of consideringindividual visual accuracy scores si , we will consider multiple setsof score vectors s to be compared with each other. Once we havedemonstrated that our user studies allow us to draw conclusionswith high con�dence, we will discuss individual scores for speci�csimulation-related questions in Section 4.
In the following, we will analyze pairs of studies for which wemake only a single change. For example, one study will have ren-dering style A, and a second study will have rendering style B whilekeeping all other conditions identical. We then perform a correlationanalysis for these studies. If the studies turn out to be correlated,we can draw conclusions about the in�uence of the change on theoutcome.
For the correlation analysis, we compute the Pearson correla-tion coe�cient and statistical signi�cance [Pearson 1920], whichare widely used in statistics as a measure of the linear correlationbetween two variables x , y ∈ Rm . This correlation coe�cient r isthe covariance of the two variables divided by the product of theirstandard deviations σx and σy , i.e., r = cov(x ,y)/σxσy . A strongpositive correlation, i.e., very similar score distributions, will resultin values close to +1, while uncorrelated or inverted scores, hencevery di�erent user opinions, will result in correlations of 0 or evennegative correlations of −1.
In order to investigate the robustness of our visual accuracy eval-uation, we set up user studies with six videos. The six versions werechosen to broadly sample the space of typical resolutions and simula-tion methods. For the studies of this section, we are not particularlyinterested in the speci�c details of the simulation methods as longas they are representative for commonly used methods of graphicsapplications. With this goal in mind, we will use a popular Eulerian
ACM Transactions on Graphics, Vol. 36, No. 4, Article 143. Publication date: July 2017.
Perceptual Evaluation of Liquid Simulation Methods • 143:5
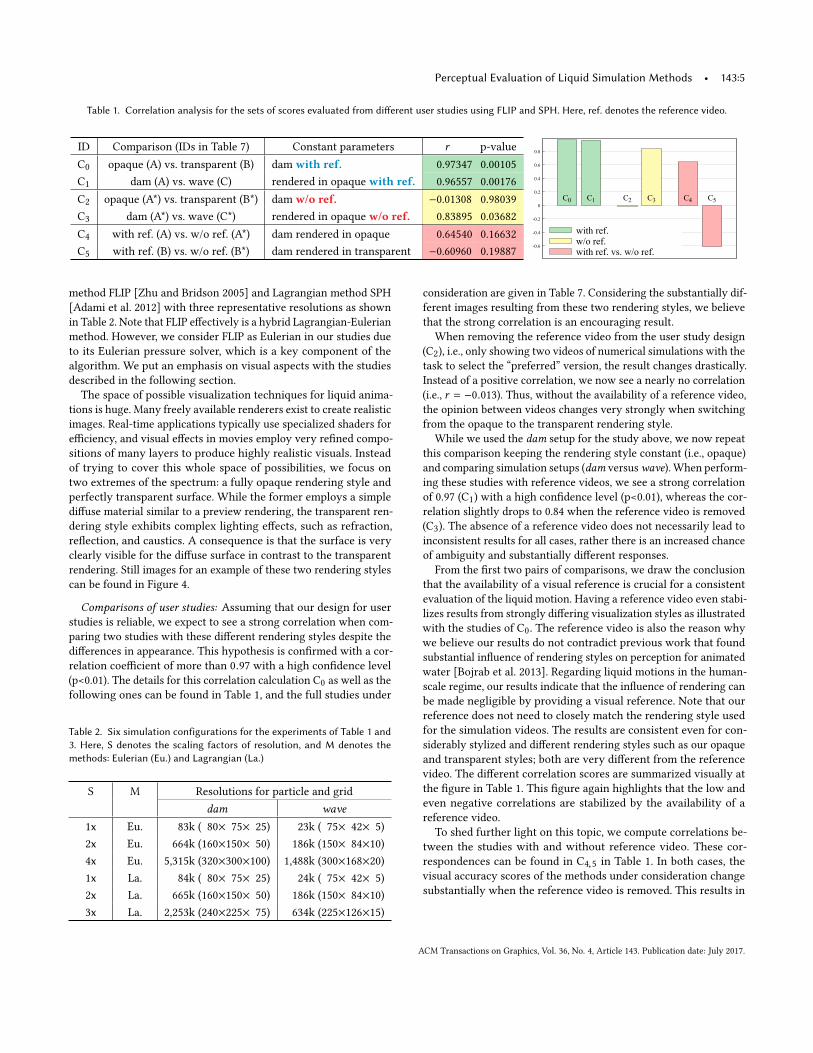
Table 1. Correlation analysis for the sets of scores evaluated from di�erent user studies using FLIP and SPH. Here, ref. denotes the reference video.
ID Comparison (IDs in Table 7) Constant parameters r p-valueC0 opaque (A) vs. transparent (B) dam with ref. 0.97347 0.00105C1 dam (A) vs. wave (C) rendered in opaque with ref. 0.96557 0.00176C2 opaque (A*) vs. transparent (B*) dam w/o ref. −0.01308 0.98039C3 dam (A*) vs. wave (C*) rendered in opaque w/o ref. 0.83895 0.03682C4 with ref. (A) vs. w/o ref. (A*) dam rendered in opaque 0.64540 0.16632C5 with ref. (B) vs. w/o ref. (B*) dam rendered in transparent −0.60960 0.19887 -0.6
-0.4
-0.2
0
0.2
0.4
0.6
0.8
with ref.
C0 C1
w/o ref.
C2 C3
with ref. vs. w/o ref.
C4 C5
method FLIP [Zhu and Bridson 2005] and Lagrangian method SPH[Adami et al. 2012] with three representative resolutions as shownin Table 2. Note that FLIP e�ectively is a hybrid Lagrangian-Eulerianmethod. However, we consider FLIP as Eulerian in our studies dueto its Eulerian pressure solver, which is a key component of thealgorithm. We put an emphasis on visual aspects with the studiesdescribed in the following section.
The space of possible visualization techniques for liquid anima-tions is huge. Many freely available renderers exist to create realisticimages. Real-time applications typically use specialized shaders fore�ciency, and visual e�ects in movies employ very re�ned compo-sitions of many layers to produce highly realistic visuals. Insteadof trying to cover this whole space of possibilities, we focus ontwo extremes of the spectrum: a fully opaque rendering style andperfectly transparent surface. While the former employs a simpledi�use material similar to a preview rendering, the transparent ren-dering style exhibits complex lighting e�ects, such as refraction,re�ection, and caustics. A consequence is that the surface is veryclearly visible for the di�use surface in contrast to the transparentrendering. Still images for an example of these two rendering stylescan be found in Figure 4.
Comparisons of user studies: Assuming that our design for userstudies is reliable, we expect to see a strong correlation when com-paring two studies with these di�erent rendering styles despite thedi�erences in appearance. This hypothesis is con�rmed with a cor-relation coe�cient of more than 0.97 with a high con�dence level(p<0.01). The details for this correlation calculation C0 as well as thefollowing ones can be found in Table 1, and the full studies under
Table 2. Six simulation configurations for the experiments of Table 1 and3. Here, S denotes the scaling factors of resolution, and M denotes themethods: Eulerian (Eu.) and Lagrangian (La.)
S M Resolutions for particle and griddam wave
1x Eu. 83k ( 80× 75× 25) 23k ( 75× 42× 5)2x Eu. 664k (160×150× 50) 186k (150× 84×10)4x Eu. 5,315k (320×300×100) 1,488k (300×168×20)1x La. 84k ( 80× 75× 25) 24k ( 75× 42× 5)2x La. 665k (160×150× 50) 186k (150× 84×10)3x La. 2,253k (240×225× 75) 634k (225×126×15)
consideration are given in Table 7. Considering the substantially dif-ferent images resulting from these two rendering styles, we believethat the strong correlation is an encouraging result.
When removing the reference video from the user study design(C2), i.e., only showing two videos of numerical simulations with thetask to select the “preferred” version, the result changes drastically.Instead of a positive correlation, we now see a nearly no correlation(i.e., r = −0.013). Thus, without the availability of a reference video,the opinion between videos changes very strongly when switchingfrom the opaque to the transparent rendering style.
While we used the dam setup for the study above, we now repeatthis comparison keeping the rendering style constant (i.e., opaque)and comparing simulation setups (dam versus wave). When perform-ing these studies with reference videos, we see a strong correlationof 0.97 (C1) with a high con�dence level (p<0.01), whereas the cor-relation slightly drops to 0.84 when the reference video is removed(C3). The absence of a reference video does not necessarily lead toinconsistent results for all cases, rather there is an increased chanceof ambiguity and substantially di�erent responses.
From the �rst two pairs of comparisons, we draw the conclusionthat the availability of a visual reference is crucial for a consistentevaluation of the liquid motion. Having a reference video even stabi-lizes results from strongly di�ering visualization styles as illustratedwith the studies of C0. The reference video is also the reason whywe believe our results do not contradict previous work that foundsubstantial in�uence of rendering styles on perception for animatedwater [Bojrab et al. 2013]. Regarding liquid motions in the human-scale regime, our results indicate that the in�uence of rendering canbe made negligible by providing a visual reference. Note that ourreference does not need to closely match the rendering style usedfor the simulation videos. The results are consistent even for con-siderably stylized and di�erent rendering styles such as our opaqueand transparent styles; both are very di�erent from the referencevideo. The di�erent correlation scores are summarized visually atthe �gure in Table 1. This �gure again highlights that the low andeven negative correlations are stabilized by the availability of areference video.
To shed further light on this topic, we compute correlations be-tween the studies with and without reference video. These cor-respondences can be found in C4,5 in Table 1. In both cases, thevisual accuracy scores of the methods under consideration changesubstantially when the reference video is removed. This results in
ACM Transactions on Graphics, Vol. 36, No. 4, Article 143. Publication date: July 2017.
143:6 • K. Um et al.
Fig. 5. Example frames of our alternate reference video for dam.
the correlations that are not statistically signi�cant (p>0.05). Be-sides, the results with the transparent rendering style show a drasticchange of user opinions. Thus, without a reference video, visualappearance can strongly in�uence the scores.
Reference videos: The video we used as reference for the damexample has a visual appearance that is clearly di�erent from ourrenderings. We note that visual accuracy can be evaluated evenwhen the simulated phenomena bear only rough resemblance tothe reference video. Figure 5 shows the example frames of a videorecorded in nature at a seashore. In an additional user study withthe dam simulations, we use this seashore video as reference insteadof the one shown in Figure 2. The resulting scores (A+ in Table 7)are highly correlated with the results of the original study with thevideo of the dam experiment (A in Table 7). Here, the correlation is0.93 with a high con�dence level (p<0.01).
On the other hand, when we use a video that di�ers more stronglyin another additional user study, the results start to change. Thecorrelation between a study using the wave video with the damsimulations (A− in Table 7) and the original study (A in Table 7) isnot statistically signi�cant (p>0.05). To summarize, our results showthat a reliable visual accuracy can be established even if no referenceto the exact simulation setup is available. The human visual systemis powerful enough to correlate the visual inputs despite di�erentappearance. However, the stability of the results drops when thephysics di�er substantially.
Representative methods: At this point, we also want to con�rmour assumption that the two initially chosen simulation methodsare representative for commonly used Eulerian and Lagrangianmethods. We choose two di�erent methods from the Eulerian andLagrangian classes: APIC [Jiang et al. 2015] and IISPH [Ihmsen et al.2014a]. With these two methods, we performed new user studieskeeping the remainder of the user study and simulation setupsconstant; i.e., the simulations use the same resolutions of particleand grid as before (Table 2). The strong positive correlation forthis pair of studies con�rms our initial assumption (C6 in Table 3).Note that our two sets of simulation methods are also correlated instudies without a reference video (C7). Presumably, this indicatesthat the participants’ tendency in preference among the two classesof methods is fairly consistent. In this case, the individual scoresof each method change substantially between the FLIP&SPH andAPIC&IISPH sets. Thus, this makes it di�cult to draw a conclusionamong the di�erent methods of each class. However, the correlationbetween the two sets of methods con�rms our assumption thatthese methods cover the space of Eulerian and Lagrangian classeswell. In addition, we �nd that the availability of a reference video
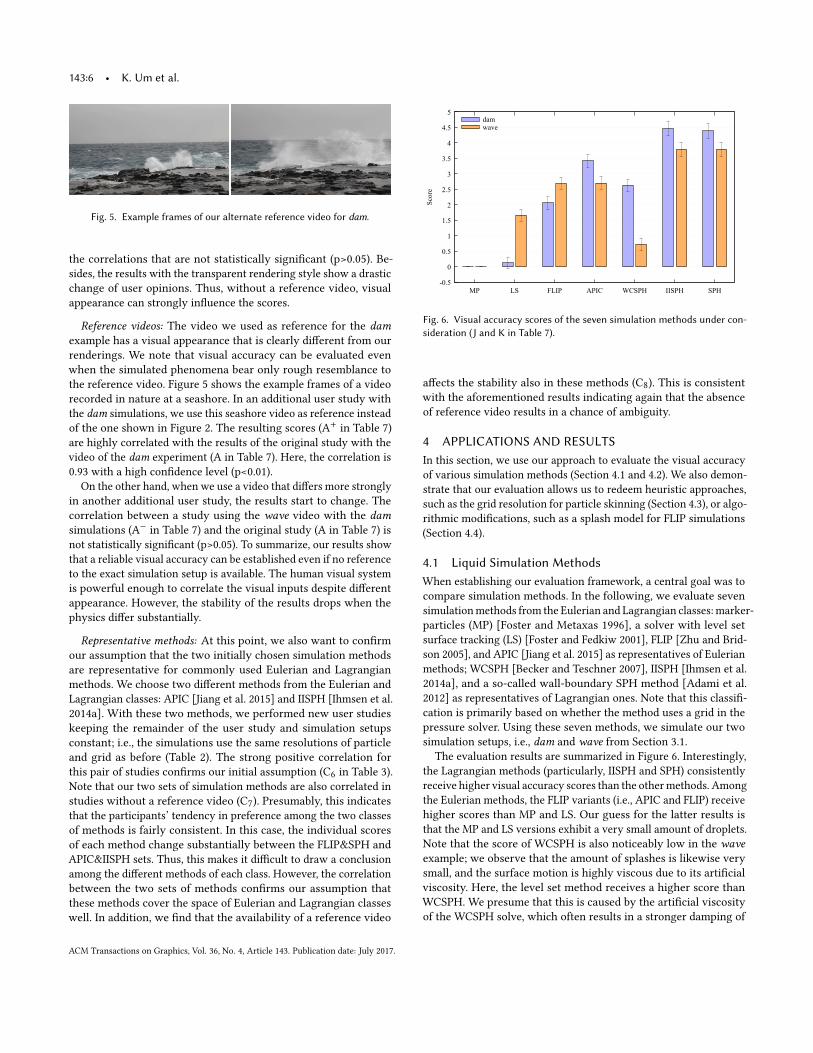
-0.5
0
0.5
1
1.5
2
2.5
3
3.5
4
4.5
5
MP LS FLIP APIC WCSPH IISPH SPH
Sco
re
damwave
Fig. 6. Visual accuracy scores of the seven simulation methods under con-sideration (J and K in Table 7).
a�ects the stability also in these methods (C8). This is consistentwith the aforementioned results indicating again that the absenceof reference video results in a chance of ambiguity.
4 APPLICATIONS AND RESULTSIn this section, we use our approach to evaluate the visual accuracyof various simulation methods (Section 4.1 and 4.2). We also demon-strate that our evaluation allows us to redeem heuristic approaches,such as the grid resolution for particle skinning (Section 4.3), or algo-rithmic modi�cations, such as a splash model for FLIP simulations(Section 4.4).
4.1 Liquid Simulation MethodsWhen establishing our evaluation framework, a central goal was tocompare simulation methods. In the following, we evaluate sevensimulation methods from the Eulerian and Lagrangian classes: marker-particles (MP) [Foster and Metaxas 1996], a solver with level setsurface tracking (LS) [Foster and Fedkiw 2001], FLIP [Zhu and Brid-son 2005], and APIC [Jiang et al. 2015] as representatives of Eulerianmethods; WCSPH [Becker and Teschner 2007], IISPH [Ihmsen et al.2014a], and a so-called wall-boundary SPH method [Adami et al.2012] as representatives of Lagrangian ones. Note that this classi�-cation is primarily based on whether the method uses a grid in thepressure solver. Using these seven methods, we simulate our twosimulation setups, i.e., dam and wave from Section 3.1.
The evaluation results are summarized in Figure 6. Interestingly,the Lagrangian methods (particularly, IISPH and SPH) consistentlyreceive higher visual accuracy scores than the other methods. Amongthe Eulerian methods, the FLIP variants (i.e., APIC and FLIP) receivehigher scores than MP and LS. Our guess for the latter results isthat the MP and LS versions exhibit a very small amount of droplets.Note that the score of WCSPH is also noticeably low in the waveexample; we observe that the amount of splashes is likewise verysmall, and the surface motion is highly viscous due to its arti�cialviscosity. Here, the level set method receives a higher score thanWCSPH. We presume that this is caused by the arti�cial viscosityof the WCSPH solve, which often results in a stronger damping of
ACM Transactions on Graphics, Vol. 36, No. 4, Article 143. Publication date: July 2017.
Perceptual Evaluation of Liquid Simulation Methods • 143:7
Table 3. Additional correlation analysis for two sets of simulation methods. Here, the dam example is used with opaque style.
ID Comparison (IDs in Table 7) Constant parameters r p-valueC6 FLIP&SPH (A) vs. APIC&IISPH (D) with ref. 0.96057 0.00230C7 FLIP&SPH (A*) vs. APIC&IISPH (D*) w/o ref. 0.96932 0.00140C8 with ref. (D) vs. w/o ref. (D*) APIC&IISPH 0.72139 0.10562
its surface motion in comparison to the LS solve. Figure 7 showsseveral still frames of all the methods.
For the implementation of each method, we followed the originalwork without any considerable modi�cations. The Eulerian methods(i.e., MP, LS, FLIP, and PIC) used grid resolutions of 160×150×50 fordam and 150×84×10 for wave. All methods except LS used 665K par-ticles for dam and 186K particles for wave. Although the Lagrangianmethods did not use any grid in their solve, we used the same un-derlying grid for initializing the particles and sampled each cellwith eight particles. While the Lagrangian methods used a uniformsampling, the Eulerian methods randomly jittered the particles toavoid aliasing. Note that this resulted in slightly di�erent numbersof particles (∼1k) between the two classes of methods; the particleswere not reseeded during the simulation. In order to ensure a com-parable resolution for surface tracking in all methods, we used adoubled resolution for tracking the level set in LS. For the pressuresolver of the Eulerian methods, we used a standard conjugate gra-dient method with modi�ed incomplete Cholesky preconditioning[Bridson 2015]. All implementations and setups can be found online.
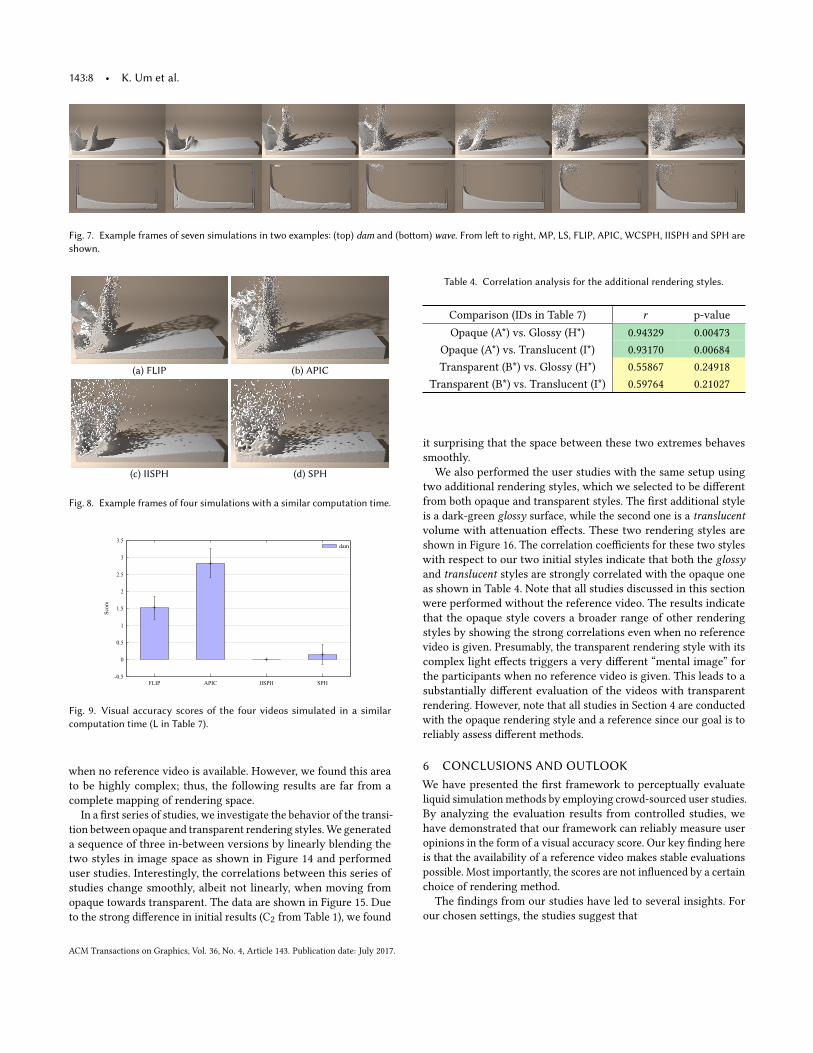
4.2 Limited Computational BudgetThis experiment focuses on the four methods that ranked high-est from the previous evaluation and re-evaluates them with theconstraint of a limited computational budget per frame. While theprevious study kept resolution and particle count constant, we haveadjusted them to yield comparable runtimes for this study. We sim-ulated the dam example using APIC, FLIP, IISPH and SPH such thatthey all required approximately 55 seconds per frame of animation.Here, we do not include the computational costs for non-simulationsteps such as surface generation and rendering. We are aware thatabsolute comparisons of performance are di�cult in general, but wehave made our best e�orts to treat all methods fairly and to bringall implementations up to a similar level of optimization (e.g., allimplementations employ shared-memory parallelism with OpenMPfor most of their steps).
The time restriction leads to signi�cant reduction in resolutionfor the SPH-based methods. Both FLIP and APIC use a 320×300×100grid and 5,315k particles; IISPH uses 143k particles sampled froma 96×90×30 grid, while SPH uses 84k particles sampled from a80×75×25 grid. Example frames for these simulation con�gurationsare shown in Figure 8.
In contrast to the previous evaluation in Section 4.1, our partici-pants gave the Eulerian methods higher visual accuracy scores. Theresults are shown in Figure 9. Thus, while the previous study sug-gests that Lagrangian methods capture large-scale splashes betterat a given resolution, this study suggests that FLIP and APIC leadto improved results under a restriction in computation time.
4.3 Particle SkinningOur evaluation approach is also useful to redeem heuristic ap-proaches, where parameters are typically chosen by intuition. Oneexample is the grid resolution for generating a surface mesh fromparticle data, i.e., particle skinning. The commonly used heuristic forthis is to use a two times higher resolution of the simulation grid,but there has been little motivation for this particular setting.
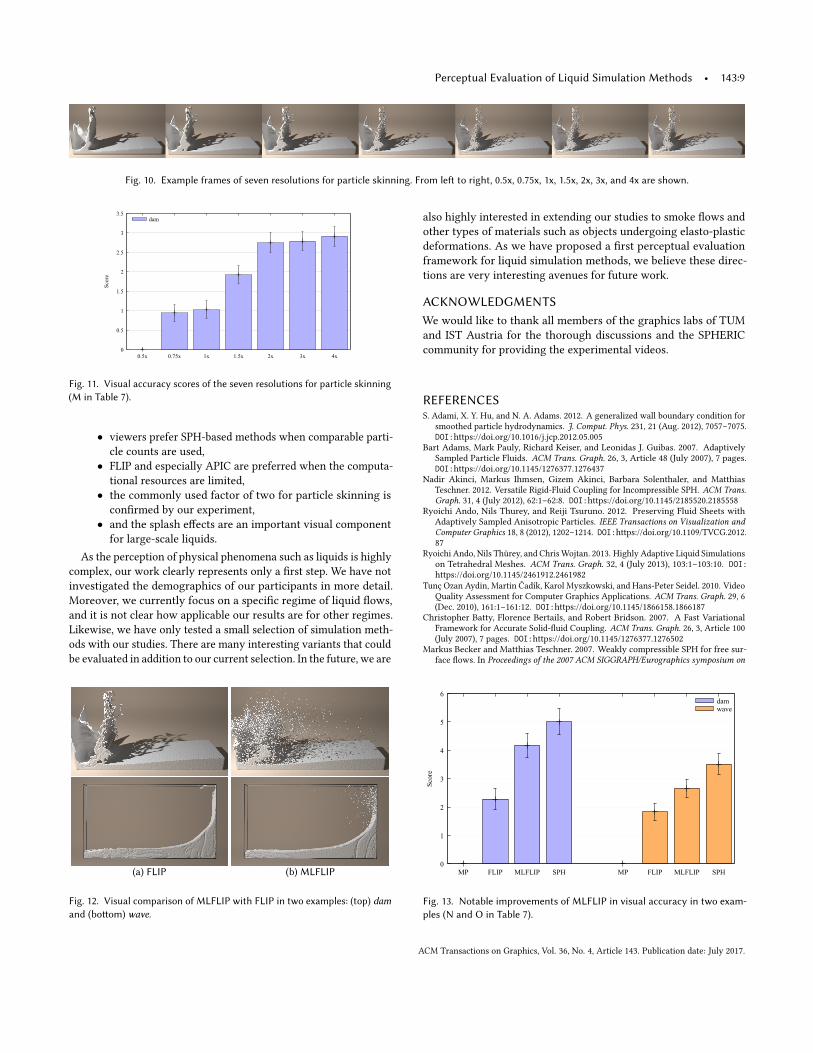
As the base simulation for this experiment, we use FLIP with a160×150×50 grid and 664k particles. After simulation, a signed dis-tance �eld is computed from the particles [Zhu and Bridson 2005],which we triangulate with marching cubes. Since the particles aresampled at a 23 sub-grid, the cell size of the base resolution (1x)is 2h, where h denotes the particle spacing. We perform the parti-cle skinning using di�erent resolutions with seven scaling factorsrelative to h: 0.5x, 0.75x, 1x, 1.5x, 2x, 3x, and 4x. In order to avoidmissing particles in the grids that are more than h apart, the particlediameter is adjusted to the larger of either the grid spacing or theparticle spacing. The example frames are shown in Figure 10.
As Figure 11 shows, the evaluation result indicates that the heuris-tic of 2x [Zhu and Bridson 2005] is a good one. The higher resolutionsdo not yield results that can reliably be considered better than the2x factor, which thus represents the best performance.
4.4 Visual Impact of Splash ModelingThis section inspects a speci�c FLIP extension that claims to yield anincreased amount of visual detail with secondary e�ects. It employsa neural-networks approach to model the sub-grid scale dynamicsthat lead to splashes [Um et al. 2017], and we will denote it asMLFLIPin the following. A visual comparison of example frames from bothFLIP and MLFLIP can be seen in Figure 12.
In order to see whether this splash model indeed results in bettervisual accuracy scores, we evaluate both FLIP and MLFLIP with twoadditional methods for reference (i.e., MP and SPH). Figure 13 showsthe resulting visual accuracy scores. For the dam setup, we observethat the MLFLIP approach yields a notable improvement in scorefrom 2.28 for regular FLIP to 4.18 for MLFLIP. The gain for the wavesetup is lower, from 1.83 to 2.66, but we can still �nd a statisticallyrelevant improvement. These results indicate that splashes are animportant visual cue for large-scale liquid phenomena.
5 DISCUSSION OF RENDERING STYLESAs our core method of evaluation, we propose to use measurementsof visual accuracy scores from user studies with a reference video.However, seeing the strong variability in the previous results, es-pecially for the transparent rendering style, we believe that it isimportant to discuss additional studies that we conducted to investi-gate the in�uence of rendering on the scores of simulation methods
ACM Transactions on Graphics, Vol. 36, No. 4, Article 143. Publication date: July 2017.
143:8 • K. Um et al.
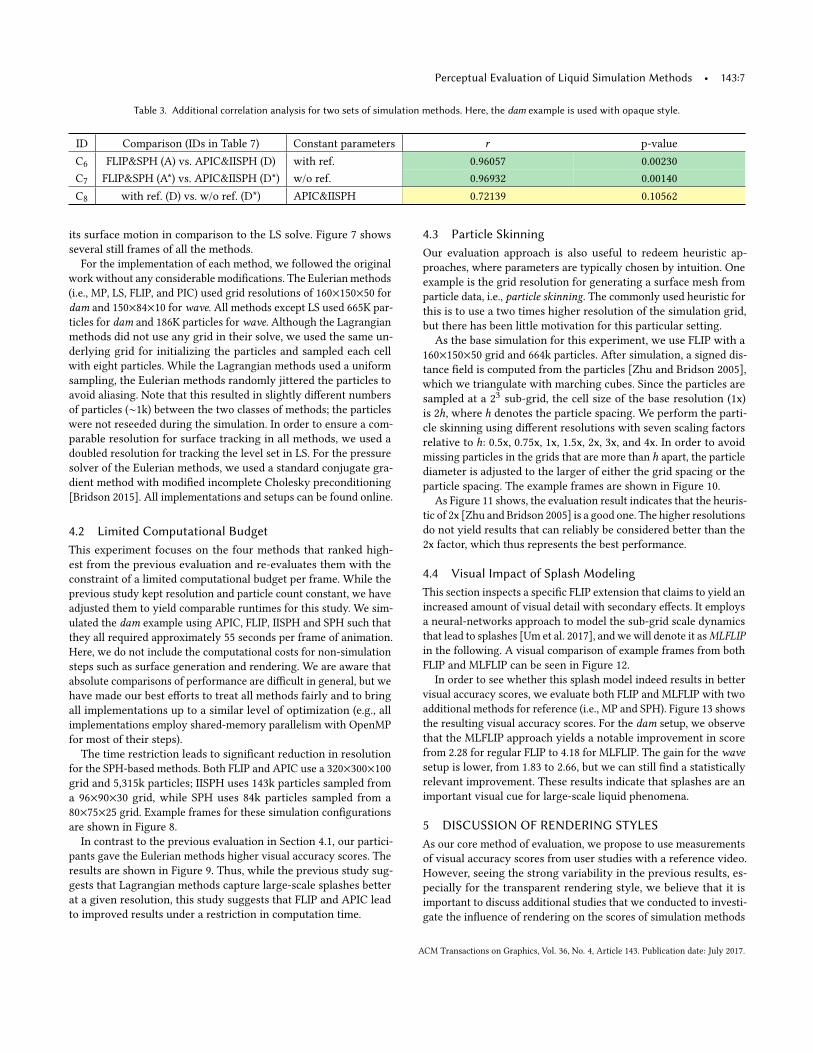
Fig. 7. Example frames of seven simulations in two examples: (top) dam and (bo�om) wave. From le� to right, MP, LS, FLIP, APIC, WCSPH, IISPH and SPH areshown.
(a) FLIP (b) APIC
(c) IISPH (d) SPH
Fig. 8. Example frames of four simulations with a similar computation time.
-0.5
0
0.5
1
1.5
2
2.5
3
3.5
FLIP APIC IISPH SPH
Sco
re
dam
Fig. 9. Visual accuracy scores of the four videos simulated in a similarcomputation time (L in Table 7).
when no reference video is available. However, we found this areato be highly complex; thus, the following results are far from acomplete mapping of rendering space.
In a �rst series of studies, we investigate the behavior of the transi-tion between opaque and transparent rendering styles. We generateda sequence of three in-between versions by linearly blending thetwo styles in image space as shown in Figure 14 and performeduser studies. Interestingly, the correlations between this series ofstudies change smoothly, albeit not linearly, when moving fromopaque towards transparent. The data are shown in Figure 15. Dueto the strong di�erence in initial results (C2 from Table 1), we found
Table 4. Correlation analysis for the additional rendering styles.
Comparison (IDs in Table 7) r p-valueOpaque (A*) vs. Glossy (H*) 0.94329 0.00473
Opaque (A*) vs. Translucent (I*) 0.93170 0.00684Transparent (B*) vs. Glossy (H*) 0.55867 0.24918
Transparent (B*) vs. Translucent (I*) 0.59764 0.21027
it surprising that the space between these two extremes behavessmoothly.
We also performed the user studies with the same setup usingtwo additional rendering styles, which we selected to be di�erentfrom both opaque and transparent styles. The �rst additional styleis a dark-green glossy surface, while the second one is a translucentvolume with attenuation e�ects. These two rendering styles areshown in Figure 16. The correlation coe�cients for these two styleswith respect to our two initial styles indicate that both the glossyand translucent styles are strongly correlated with the opaque oneas shown in Table 4. Note that all studies discussed in this sectionwere performed without the reference video. The results indicatethat the opaque style covers a broader range of other renderingstyles by showing the strong correlations even when no referencevideo is given. Presumably, the transparent rendering style with itscomplex light e�ects triggers a very di�erent “mental image” forthe participants when no reference video is given. This leads to asubstantially di�erent evaluation of the videos with transparentrendering. However, note that all studies in Section 4 are conductedwith the opaque rendering style and a reference since our goal is toreliably assess di�erent methods.
6 CONCLUSIONS AND OUTLOOKWe have presented the �rst framework to perceptually evaluateliquid simulation methods by employing crowd-sourced user studies.By analyzing the evaluation results from controlled studies, wehave demonstrated that our framework can reliably measure useropinions in the form of a visual accuracy score. Our key �nding hereis that the availability of a reference video makes stable evaluationspossible. Most importantly, the scores are not in�uenced by a certainchoice of rendering method.
The �ndings from our studies have led to several insights. Forour chosen settings, the studies suggest that
ACM Transactions on Graphics, Vol. 36, No. 4, Article 143. Publication date: July 2017.
Perceptual Evaluation of Liquid Simulation Methods • 143:9
Fig. 10. Example frames of seven resolutions for particle skinning. From le� to right, 0.5x, 0.75x, 1x, 1.5x, 2x, 3x, and 4x are shown.
0
0.5
1
1.5
2
2.5
3
3.5
0.5x 0.75x 1x 1.5x 2x 3x 4x
Sco
re
dam
Fig. 11. Visual accuracy scores of the seven resolutions for particle skinning(M in Table 7).
• viewers prefer SPH-based methods when comparable parti-cle counts are used,
• FLIP and especially APIC are preferred when the computa-tional resources are limited,
• the commonly used factor of two for particle skinning iscon�rmed by our experiment,
• and the splash e�ects are an important visual componentfor large-scale liquids.
As the perception of physical phenomena such as liquids is highlycomplex, our work clearly represents only a �rst step. We have notinvestigated the demographics of our participants in more detail.Moreover, we currently focus on a speci�c regime of liquid �ows,and it is not clear how applicable our results are for other regimes.Likewise, we have only tested a small selection of simulation meth-ods with our studies. There are many interesting variants that couldbe evaluated in addition to our current selection. In the future, we are
(a) FLIP (b) MLFLIP
Fig. 12. Visual comparison of MLFLIP with FLIP in two examples: (top) damand (bo�om) wave.
also highly interested in extending our studies to smoke �ows andother types of materials such as objects undergoing elasto-plasticdeformations. As we have proposed a �rst perceptual evaluationframework for liquid simulation methods, we believe these direc-tions are very interesting avenues for future work.
ACKNOWLEDGMENTSWe would like to thank all members of the graphics labs of TUMand IST Austria for the thorough discussions and the SPHERICcommunity for providing the experimental videos.
REFERENCESS. Adami, X. Y. Hu, and N. A. Adams. 2012. A generalized wall boundary condition for
smoothed particle hydrodynamics. J. Comput. Phys. 231, 21 (Aug. 2012), 7057–7075.DOI:https://doi.org/10.1016/j.jcp.2012.05.005
Bart Adams, Mark Pauly, Richard Keiser, and Leonidas J. Guibas. 2007. AdaptivelySampled Particle Fluids. ACM Trans. Graph. 26, 3, Article 48 (July 2007), 7 pages.DOI:https://doi.org/10.1145/1276377.1276437
Nadir Akinci, Markus Ihmsen, Gizem Akinci, Barbara Solenthaler, and MatthiasTeschner. 2012. Versatile Rigid-Fluid Coupling for Incompressible SPH. ACM Trans.Graph. 31, 4 (July 2012), 62:1–62:8. DOI:https://doi.org/10.1145/2185520.2185558
Ryoichi Ando, Nils Thurey, and Reiji Tsuruno. 2012. Preserving Fluid Sheets withAdaptively Sampled Anisotropic Particles. IEEE Transactions on Visualization andComputer Graphics 18, 8 (2012), 1202–1214. DOI:https://doi.org/10.1109/TVCG.2012.87
Ryoichi Ando, Nils Thürey, and Chris Wojtan. 2013. Highly Adaptive Liquid Simulationson Tetrahedral Meshes. ACM Trans. Graph. 32, 4 (July 2013), 103:1–103:10. DOI:https://doi.org/10.1145/2461912.2461982
Tunç Ozan Aydin, Martin Čadík, Karol Myszkowski, and Hans-Peter Seidel. 2010. VideoQuality Assessment for Computer Graphics Applications. ACM Trans. Graph. 29, 6(Dec. 2010), 161:1–161:12. DOI:https://doi.org/10.1145/1866158.1866187
Christopher Batty, Florence Bertails, and Robert Bridson. 2007. A Fast VariationalFramework for Accurate Solid-�uid Coupling. ACM Trans. Graph. 26, 3, Article 100(July 2007), 7 pages. DOI:https://doi.org/10.1145/1276377.1276502
Markus Becker and Matthias Teschner. 2007. Weakly compressible SPH for free sur-face �ows. In Proceedings of the 2007 ACM SIGGRAPH/Eurographics symposium on
0
1
2
3
4
5
6
MP FLIP MLFLIP SPH MP FLIP MLFLIP SPH
Sco
re
damwave
Fig. 13. Notable improvements of MLFLIP in visual accuracy in two exam-ples (N and O in Table 7).
ACM Transactions on Graphics, Vol. 36, No. 4, Article 143. Publication date: July 2017.

143:10 • K. Um et al.
(a) Transparent (b) Blended (opaque: 0.25) (c) Blended (opaque: 0.5) (d) Blended (opaque: 0.75) (e) Opaque
Fig. 14. Examples from our series of rendering styles transitioning from opaque to transparent.
Opaque
Blended(opaque: 0.75)
Blended(opaque: 0.5)
Blended(opaque: 0.25)
Transparent
Transparent Blended(opaque: 0.25)
Blended(opaque: 0.5)
Blended(opaque: 0.75)
Opaque
0.27919 0.46189 0.74095 1.00000
0.61722 0.84580 0.92656 1.00000 0.74095
0.77268 0.97564 1.00000 0.92656 0.46189
0.87906 1.00000 0.97564 0.84580 0.27919
1.00000 0.87906 0.77268 0.61722
-0.01308
-0.01308
-0.2
0
0.2
0.4
0.6
0.8
1
1.2
Fig. 15. Correlation among the five sets of overall scores evaluated fromthe user studies with di�erent rendering styles.
Computer animation (SCA ’07). Eurographics Association, Aire-la-Ville, Switzerland,Switzerland, 209–217. http://dl.acm.org/citation.cfm?id=1272690.1272719
Micah Bojrab, Michel Abdul-Massih, and Bedrich Benes. 2013. Perceptual Importanceof Lighting Phenomena in Rendering of Animated Water. ACM Trans. Appl. Percept.10, 1 (March 2013), 2:1–2:18. DOI:https://doi.org/10.1145/2422105.2422107
Elkin Botia-Vera, Antonio Souto-Iglesias, Gabriele Bulian, and L. Lobovský. 2010. ThreeSPH Novel Benchmark Test Cases for free surface �ows. In Proceedings of the 5thERCOFTAC SPHERIC workshop on SPH applications. Manchester, UK.
Ralph Allan Bradley and Milton E. Terry. 1952. Rank Analysis of Incomplete BlockDesigns: I. The Method of Paired Comparisons. Biometrika 39, 3/4 (1952), 324–345.DOI:https://doi.org/10.2307/2334029
Robert Bridson. 2015. Fluid Simulation for Computer Graphics. CRC Press.Kirsten Cater, Alan Chalmers, and Patrick Ledda. 2002. Selective Quality Rendering by
Exploiting Human Inattentional Blindness: Looking but Not Seeing. In Proceedingsof the ACM Symposium on Virtual Reality Software and Technology (VRST ’02). ACM,New York, NY, USA, 17–24. DOI:https://doi.org/10.1145/585740.585744
Forrester Cole, Kevin Sanik, Doug DeCarlo, Adam Finkelstein, Thomas Funkhouser,Szymon Rusinkiewicz, and Manish Singh. 2009. How Well Do Line DrawingsDepict Shape? ACM Trans. Graph. 28, 3, Article 28 (July 2009), 9 pages. DOI:https://doi.org/10.1145/1531326.1531334
(a) Glossy (b) Translucent
Fig. 16. Example frames of the rendering styles.
Gilles Debunne, Mathieu Desbrun, Alan Barr, and Marie-Paule Cani. 1999. Interactivemultiresolution animation of deformable models. In Computer Animation andSimulation ’99. Springer, 133–144.
Piotr Didyk, Elmar Eisemann, Tobias Ritschel, Karol Myszkowski, and Hans-PeterSeidel. 2010. Perceptually-motivated Real-time Temporal Upsampling of 3D Contentfor High-refresh-rate Displays. Computer Graphics Forum 29, 2 (2010), 713–722.DOI:https://doi.org/10.1111/j.1467-8659.2009.01641.x
Reynald Dumont, Fabio Pellacini, and James A. Ferwerda. 2003. Perceptually-DrivenDecision Theory for Interactive Realistic Rendering. ACM Trans. Graph. 22, 2 (April2003), 152–181. DOI:https://doi.org/10.1145/636886.636888
Douglas Enright, Ronald Fedkiw, Joel Ferziger, and Ian Mitchell. 2002. A Hybrid ParticleLevel Set Method for Improved Interface Capturing. J. Comput. Phys. 183, 1 (Nov.2002), 83–116. DOI:https://doi.org/10.1006/jcph.2002.7166
Doug Enright, Duc Nguyen, Frederic Gibou, and Ron Fedkiw. 2003. Using the ParticleLevel Set Method and a Second Order Accurate Pressure Boundary Condition for FreeSurface Flows. In Proceedings of 4th ASME-JSME Joint Fluids Summer EngeneeringConference, Vol. 2. 337–342. DOI:https://doi.org/10.1115/FEDSM2003-45144
Florian Ferstl, Ryoichi Ando, Chris Wojtan, Rüdiger Westermann, and Nils Thuerey.2016. Narrow band FLIP for liquid simulations. Computer Graphics Forum 35, 2(2016), 225–232.
Nick Foster and Ronald Fedkiw. 2001. Practical Animation of Liquids. In Proceedingsof the 28th Annual Conference on Computer Graphics and Interactive Techniques(SIGGRAPH ’01). ACM, New York, NY, USA, 23–30. DOI:https://doi.org/10.1145/383259.383261
Nick Foster and Dimitri Metaxas. 1996. Realistic Animation of Liquids. GraphicalModels and Image Processing 58, 5 (Sept. 1996), 471–483. DOI:https://doi.org/10.1006/gmip.1996.0039
Dan Gerszewski and Adam W. Bargteil. 2013. Physics-Based Animation of Large-Scale Splashing Liquids. ACM Trans. Graph. 32, 6 (Nov. 2013), 185:1–185:6. DOI:https://doi.org/10.1145/2508363.2508430
D. Han and J. Keyser. 2016. E�ect of Low-Level Visual Details in Perception ofDeformation. Computer Graphics Forum 35, 2 (May 2016), 375–383. DOI:https://doi.org/10.1111/cgf.12839
Ludovic Hoyet, Kenneth Ryall, Katja Zibrek, Hwangpil Park, Jehee Lee, Jessica Hodgins,and Carol O’Sullivan. 2013. Evaluating the Distinctiveness and Attractiveness ofHuman Motions on Realistic Virtual Bodies. ACM Trans. Graph. 32, 6 (Nov. 2013),204:1–204:11. DOI:https://doi.org/10.1145/2508363.2508367
David R. Hunter. 2004. MM algorithms for generalized Bradley-Terry models. The Annalsof Statistics 32, 1 (Feb. 2004), 384–406. DOI:https://doi.org/10.1214/aos/1079120141
Markus Ihmsen, Nadir Akinci, Gizem Akinci, and Matthias Teschner. 2012. Uni�edspray, foam and air bubbles for particle-based �uids. The Visual Computer 28, 6-8(2012), 669–677.
Markus Ihmsen, Jens Cornelis, Barbara Solenthaler, Christopher Horvath, and MatthiasTeschner. 2014a. Implicit Incompressible SPH. IEEE Transactions on Visualizationand Computer Graphics 20, 3 (March 2014), 426–435. DOI:https://doi.org/10.1109/TVCG.2013.105
Markus Ihmsen, Jens Orthmann, Barbara Solenthaler, Andreas Kolb, and MatthiasTeschner. 2014b. SPH Fluids in Computer Graphics. In Eurographics 2014 - State ofthe Art Reports. Eurographics Association, Strasbourg, France, 21–42. DOI:https://doi.org/10.2312/egst.20141034
R. Issa, D. Violeau, Antonio Souto-Iglesias, and Elkin Botia-Vera. 2017. SPHERICValidation Tests. http://spheric-sph.org/validation-tests. (2017).
Chenfanfu Jiang, Craig Schroeder, Andrew Selle, Joseph Teran, and Alexey Stomakhin.2015. The A�ne Particle-in-cell Method. ACM Trans. Graph. 34, 4 (July 2015),51:1–51:10. DOI:https://doi.org/10.1145/2766996
ByungMoon Kim, Yingjie Liu, Ignacio Llamas, and Jarek Rossignac. 2005. FlowFixer:Using BFECC for Fluid Simulation. In Eurographics Conference on Natural Phenomena.Eurographics Association, Dublin, Ireland, 51–56. DOI:https://doi.org/10.2312/NPH/NPH05/051-056
K. M. T. Kleefsman, G. Fekken, A. E. P. Veldman, B. Iwanowski, and B. Buchner. 2005.A Volume-of-Fluid Based Simulation Method for Wave Impact Problems. J. Comput.Phys. 206, 1 (June 2005), 363–393. DOI:https://doi.org/10.1016/j.jcp.2004.12.007
ACM Transactions on Graphics, Vol. 36, No. 4, Article 143. Publication date: July 2017.
Perceptual Evaluation of Liquid Simulation Methods • 143:11
Gondy Leroy. 2011. Designing User Studies in Informatics. Springer London. DOI:https://doi.org/10.1007/978-0-85729-622-1
F. Losasso, J.O. Talton, N. Kwatra, and R. Fedkiw. 2008. Two-Way Coupled SPH andParticle Level Set Fluid Simulation. IEEE Transactions on Visualization and ComputerGraphics 14, 4 (2008), 797–804. DOI:https://doi.org/10.1109/TVCG.2008.37
Miles Macklin and Matthias Müller. 2013. Position Based Fluids. ACM Trans. Graph. 32,4 (July 2013), 104:1–104:12. DOI:https://doi.org/10.1145/2461912.2461984
Belen Masia, Sandra Agustin, Roland W. Fleming, Olga Sorkine, and Diego Gutierrez.2009. Evaluation of Reverse Tone Mapping Through Varying Exposure Conditions.ACM Trans. Graph. 28, 5, Article 160 (Dec. 2009), 8 pages. DOI:https://doi.org/10.1145/1618452.1618506
Rachel McDonnell, Michéal Larkin, Simon Dobbyn, Steven Collins, and Carol O’Sullivan.2008. Clone Attack! Perception of Crowd Variety. ACM Trans. Graph. 27, 3, Article26 (Aug. 2008), 8 pages. DOI:https://doi.org/10.1145/1360612.1360625
Matthias Müller, David Charypar, and Markus Gross. 2003. Particle-Based FluidSimulation for Interactive Applications. In Proceedings of the 2003 ACM SIG-GRAPH/Eurographics Symposium on Computer Animation (SCA ’03). EurographicsAssociation, Aire-la-Ville, Switzerland, Switzerland, 154–159.
Zherong Pan, Jin Huang, Yiying Tong, Changxi Zheng, and Hujun Bao. 2013. InteractiveLocalized Liquid Motion Editing. ACM Trans. Graph. 32, 6 (Nov. 2013), 184:1–184:10.DOI:https://doi.org/10.1145/2508363.2508429
Karl Pearson. 1920. Notes on the History of Correlation. Biometrika 13, 1 (Jan. 1920),25–45. DOI:https://doi.org/10.1093/biomet/13.1.25
Daniel Ram, Theodore Gast, Chenfanfu Jiang, Craig Schroeder, Alexey Stomakhin,Joseph Teran, and Pirouz Kavehpour. 2015. A Material Point Method for ViscoelasticFluids, Foams and Sponges. In Proceedings of the 2015 ACM SIGGRAPH/EurographicsSymposium on Computer Animation (SCA ’15). ACM, New York, NY, USA, 157–163.DOI:https://doi.org/10.1145/2786784.2786798
Karthik Raveendran, Chris Wojtan, and Greg Turk. 2011. Hybrid Smoothed ParticleHydrodynamics. In Proceedings of the 2011 ACM SIGGRAPH/Eurographics Symposiumon Computer Animation (SCA ’11). ACM, New York, NY, USA, 33–42. DOI:https://doi.org/10.1145/2019406.2019411
B. Solenthaler and R. Pajarola. 2009. Predictive-corrective Incompressible SPH. ACMTrans. Graph. 28, 3, Article 40 (July 2009), 6 pages. DOI:https://doi.org/10.1145/1531326.1531346
Jos Stam. 1999. Stable Fluids. In Proceedings of the 26th Annual Conference on ComputerGraphics and Interactive Techniques (SIGGRAPH ’99). ACM Press/Addison-WesleyPublishing Co., New York, NY, USA, 121–128. DOI:https://doi.org/10.1145/311535.311548
Alexey Stomakhin, Craig Schroeder, Lawrence Chai, Joseph Teran, and Andrew Selle.2013. A Material Point Method for Snow Simulation. ACM Trans. Graph. 32, 4 (July2013), 102:1–102:10. DOI:https://doi.org/10.1145/2461912.2461948
Kiwon Um, Seungho Baek, and JungHyun Han. 2014. Advanced Hybrid Particle-GridMethod with Sub-Grid Particle Correction. Computer Graphics Forum 33, 7 (Oct.2014), 209–218. DOI:https://doi.org/10.1111/cgf.12489
Kiwon Um, Xiangyu Hu, and Nils Thuerey. 2017. Liquid Splash Modeling with NeuralNetworks. (2017). arXiv:1704.04456
Yongning Zhu and Robert Bridson. 2005. Animating Sand As a Fluid. ACM Trans.Graph. 24, 3 (July 2005), 965–972. DOI:https://doi.org/10.1145/1073204.1073298
A CROWD-SOURCING PLATFORMSThere exist several crowd sourcing services that provide a web-basedplatform where the requester can launch user studies with a web-interface. This section compares three popular platforms: AmazonMechanical Turk (MT), CrowdFlower (CF), and Microworkers (MW).
In order to investigate consistency of all three platforms, we useour study setup for dam from Section 3.3 with six di�erent versions.In addition, we included an additional seventh dummy video, whichwas synthesized by interleaving the six videos for each one second;we did not include reverse questions in these three studies.
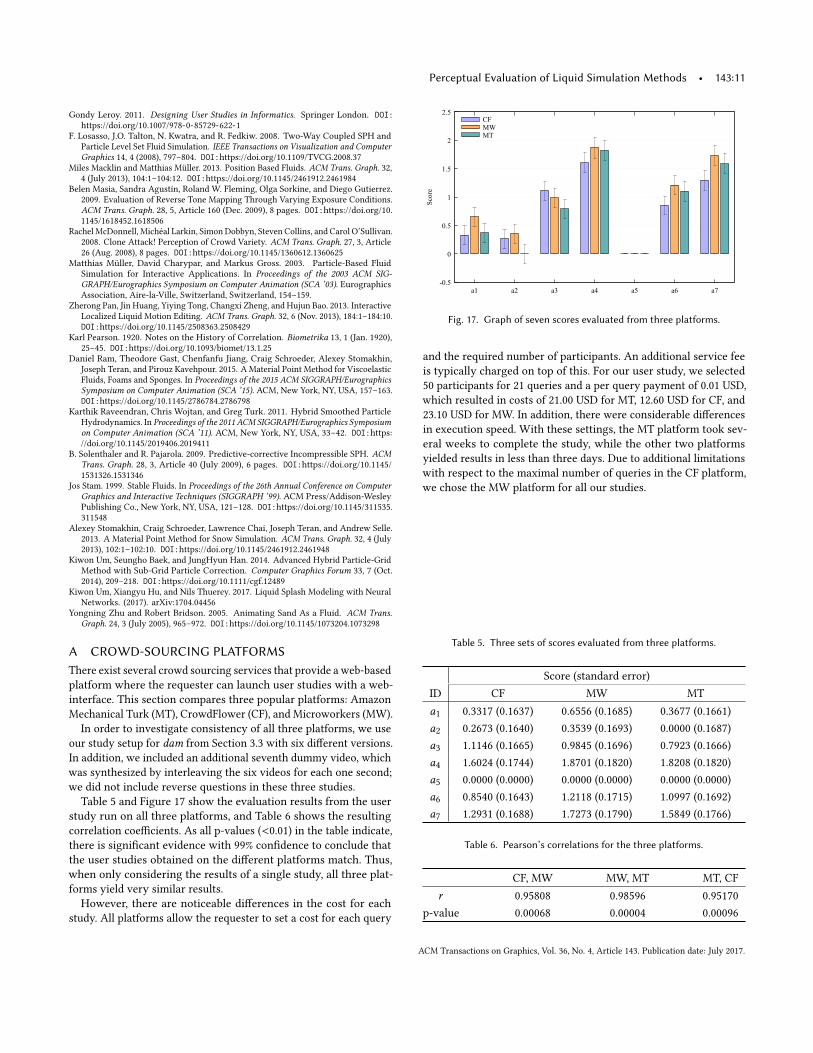
Table 5 and Figure 17 show the evaluation results from the userstudy run on all three platforms, and Table 6 shows the resultingcorrelation coe�cients. As all p-values (<0.01) in the table indicate,there is signi�cant evidence with 99% con�dence to conclude thatthe user studies obtained on the di�erent platforms match. Thus,when only considering the results of a single study, all three plat-forms yield very similar results.
However, there are noticeable di�erences in the cost for eachstudy. All platforms allow the requester to set a cost for each query
-0.5
0
0.5
1
1.5
2
2.5
a1 a2 a3 a4 a5 a6 a7
Sco
re
CFMWMT
Fig. 17. Graph of seven scores evaluated from three platforms.
and the required number of participants. An additional service feeis typically charged on top of this. For our user study, we selected50 participants for 21 queries and a per query payment of 0.01 USD,which resulted in costs of 21.00 USD for MT, 12.60 USD for CF, and23.10 USD for MW. In addition, there were considerable di�erencesin execution speed. With these settings, the MT platform took sev-eral weeks to complete the study, while the other two platformsyielded results in less than three days. Due to additional limitationswith respect to the maximal number of queries in the CF platform,we chose the MW platform for all our studies.
Table 5. Three sets of scores evaluated from three platforms.
Score (standard error)ID CF MW MTa1 0.3317 (0.1637) 0.6556 (0.1685) 0.3677 (0.1661)a2 0.2673 (0.1640) 0.3539 (0.1693) 0.0000 (0.1687)a3 1.1146 (0.1665) 0.9845 (0.1696) 0.7923 (0.1666)a4 1.6024 (0.1744) 1.8701 (0.1820) 1.8208 (0.1820)a5 0.0000 (0.0000) 0.0000 (0.0000) 0.0000 (0.0000)a6 0.8540 (0.1643) 1.2118 (0.1715) 1.0997 (0.1692)a7 1.2931 (0.1688) 1.7273 (0.1790) 1.5849 (0.1766)
Table 6. Pearson’s correlations for the three platforms.
CF, MW MW, MT MT, CFr 0.95808 0.98596 0.95170
p-value 0.00068 0.00004 0.00096
ACM Transactions on Graphics, Vol. 36, No. 4, Article 143. Publication date: July 2017.
143:12 • K. Um et al.
Table 7. The visual accuracy scores (and standard errors).
Di�erent examples and renderings (Section 3.3 and 5), where A*, B*, D*, and E*-I* denote the studies without the reference video.ID Ex. Rendering FLIP, 1x FLIP, 2x FLIP, 4x SPH, 1x SPH, 2x SPH, 3x
A dam opaque 0.0000 (0.0000) 3.1368 (0.4584) 4.6271 (0.4786) 4.9480 (0.4813) 6.5291 (0.4961) 6.7529 (0.4989)A* dam opaque 0.0000 (0.0000) 1.0822 (0.1975) 1.6328 (0.2083) 0.0579 (0.1964) 0.9089 (0.1955) 1.0300 (0.1968)B dam transparent 0.0000 (0.0000) 2.0498 (0.3272) 3.8288 (0.3572) 2.8715 (0.3428) 4.6016 (0.3700) 5.3260 (0.3864)B* dam transparent 1.6860 (0.1785) 1.7125 (0.1789) 1.5685 (0.1765) 0.8198 (0.1694) 0.4223 (0.1695) 0.0000 (0.0000)C wave opaque 0.0000 (0.0000) 3.2189 (0.4720) 3.6823 (0.4771) 3.0738 (0.4701) 5.2235 (0.4996) 5.0324 (0.4958)
APIC, 1x APIC, 2x APIC, 4x IISPH, 1x IISPH, 2x IISPH, 3x
D dam opaque 0.0000 (0.0000) 2.6095 (0.3411) 3.7208 (0.3541) 2.6466 (0.3416) 4.2966 (0.3618) 4.9892 (0.3751)D* dam opaque 0.1480 (0.1816) 1.5857 (0.1857) 2.0321 (0.1933) 0.0000 (0.0000) 1.4117 (0.1835) 1.8044 (0.1890)
FLIP, 1x FLIP, 2x FLIP, 4x SPH, 1x SPH, 2x SPH, 3x
E* dam blend 25% 0.0000 (0.0000) -0.0776 (0.1762) 0.0000 (0.1769) -1.9924 (0.1972) -1.4552 (0.1849) -1.6837 (0.1895)F* dam blend 50% 0.0000 (0.0000) 0.1456 (0.1629) 0.2132 (0.1636) -1.2302 (0.1726) -0.6418 (0.1629) -0.7460 (0.1641)G* dam blend 75% 0.0000 (0.0000) 0.8031 (0.1843) 1.1089 (0.1919) -1.0177 (0.1914) -0.2983 (0.1779) -0.2034 (0.1772)H* dam glossy 0.0000 (0.0000) 0.5613 (0.1489) 0.8232 (0.1524) -0.7548 (0.1553) 0.1286 (0.1465) 0.0537 (0.1465)I* dam translucent 0.0000 (0.0000) 0.8324 (0.1484) 0.8324 (0.1484) -0.2321 (0.1456) 0.1135 (0.1437) 0.0723 (0.1438)
Di�erent reference videos with dam simulations (Section 3.3).ID Reference FLIP, 1x FLIP, 2x FLIP, 4x SPH, 1x SPH, 2x SPH, 3x
A+ seashore 0.0000 (0.0000) 1.2957 (0.1997) 2.1712 (0.2095) 1.1659 (0.1987) 2.6929 (0.2186) 2.9781 (0.2250)A− wave 0.0000 (0.0000) 1.3566 (0.1975) 2.0606 (0.2078) 0.3904 (0.1947) 1.7945 (0.2031) 2.2241 (0.2112)
Seven simulation methods (Section 4.1).ID Ex. MP LS FLIP APIC WCSPH IISPH SPHJ dam 0.0000 (0.0000) 0.1248 (0.1769) 2.0613 (0.1962) 3.4211 (0.2136) 2.6271 (0.2039) 4.4595 (0.2294) 4.3855 (0.2280)K wave 0.0000 (0.0000) 1.6646 (0.1943) 2.6871 (0.2058) 2.6987 (0.2060) 0.7209 (0.1876) 3.7943 (0.2229) 3.7943 (0.2229)
Four simulation methods for dam in similar computation time (Section 4.2).ID FLIP APIC IISPH SPHL 1.5215 (0.3387) 2.8256 (0.4205) 0.0000 (0.0000) 0.1410 (0.3070)
Seven grid resolutions for particle skinning (Section 4.3).ID 0.5x 0.75x 1x 1.5x 2x 3x 4x
M 0.0000 (0.0000) 0.9397 (0.2308) 1.0235 (0.2310) 1.9248 (0.2393) 2.7473 (0.2533) 2.7891 (0.2542) 2.9170 (0.2572)
Four methods including MLFLIP (Section 4.4).ID MP FLIP MLFLIP SPHN 0.0000 (0.0000) 2.2833 (0.3723) 4.1758 (0.4353) 5.0077 (0.4569)O 0.0000 (0.0000) 1.8312 (0.3069) 2.6612 (0.3282) 3.5203 (0.3538)
ACM Transactions on Graphics, Vol. 36, No. 4, Article 143. Publication date: July 2017.


![1 Examples 3D Electromagnetic Simulation Magnetic quasi-static simulation [coreless liquid-cooled motor]](https://img.pdfslide.us/doc/110x75/56649ed55503460f94be601c/1-examples-3d-electromagnetic-simulation-magnetic-quasi-static-simulation-coreless.jpg)