Embed Size (px)
Citation preview
NUMERICAL SIMULATION OF LIQUID ATOMISATION
WAN MUHAMMAD MUKHLIS BIN WAN AB LATIF
Report submitted as partial fulfillment of the requirements
for the award of the degree of
Bachelor of Mechanical Engineering with Automotive Engineering
Faculty of Mechanical Engineering
UNIVERSITI MALAYSIA PAHANG
DECEMBER 2010
UNIVERSITI MALAYSIA PAHANG
FACULTY OF MECHANICAL ENGINEERING
I certify that the thesis entitled “Numerical Simulation Of Liquid Atomisation” is written by Wan
Muhammad Mukhlis Bin Wan Ab Latif. I have examined the final copy of this thesis and in my
opinion; it is fully adequate in terms of scope and quality for the award of the degree of Bachelor
of Engineering. I herewith recommend that it be accepted in fulfillment of the requirements for
the degree of Bachelor of Mechanical Engineering with Automotive Engineering.
DR. KORADA VISWANATHA SHARMA
Examiner Signature
ii
SUPERVISOR’S DECLARATION
I hereby declare that I have checked this project report and in my opinion, this
project is adequate in terms of scope and quality for the award of the degree of
Bachelor of Mechanical Engineering
Signature :………………………
Name of Supervisor : TN HAJI AMIRRUDDIN ABDUL KADIR
Position : DEPUTY DEAN (ACADEMIC & STUDENT
DEVELOPMENT AFFAIRS)
Date : 6 DECEMBER 2010
iii
STUDENT’S DECLARATION
I hereby declare that the work in this thesis is my own except for quotations and
summaries which have been duly acknowledged. The thesis has not been accepted for
any degree and is not concurrently submitted for award of other degree.
Signature : …………………………..
Name : WAN MUHAMMAD MUKHLIS WAN AB LATIF
Id Number : MH08004
Date: : 6 DECEMBER 2010
v
ACKNOWLEDGEMENT
First and foremost, I want to thank Allah S.W.T, for giving me the source of
power, knowledge and strength to finish the project and dissertation for completing my
Bachelor of Mechanical Engineering final year project.
I would like to express my gratitude to my supervisor Hj. Amiruddin Abdul
Kadir for his wisdom, endurance and encouragement during his supervision period. He
guided me through the dissertation process, never accepting less than my best efforts
His suggestions have helped me improve my technical writing and presentation skills.
Special thank to my lecturers, Mr. Mohd Fadzil Bin Rahim and Mr. Mohd
Zuhairi for their kindness in sharing their knowledge about ANSYS Fluent software and
doing me a favor in getting additional information for the project. Also thanks to my
fellow friends for their co-operation and help.
Lastly, thanks to my family for giving me supports and advice to me to keep
looking forward when I’m facing a lot of problems and boundaries in completing my
PSM
vi
ABSTRACT
The focus of this study was to investigate the spray characteristics and
atomization performance of gasoline fuel (G100) and ethanol fuel (E100) in a high
pressure chamber. The overall spray and atomization characteristics such as an axial
spray tip penetration, spray width, and overall SMD were measured experimentally and
predicted by using ANSYS Fluent. The development process and the appearance timing
of the vortices in the test fuels were very similar. Moreover, the increased injection
pressure induced the occurrence of a clear circular shape in the downstream spray and a
uniform mixture between the injected spray droplets and ambient air. The axial spray tip
penetrations of the test fuels were similar, while the spray width and spray cone angle of
G100 were slightly larger than the other fuels. In terms of atomization performance, the
E100 fuel among the tested fuels had the largest droplet size because E100 has a high
kinematic viscosity and surface tension.
vii
ABSTRAK
Fokus kajian ini adalah untuk mengetahui ciri-ciri semburan dan prestasi
pengatoman bahan bakar petrol (G100), dan bahan bakar etanol (E100), dalam ruangan
tekanan tinggi. Keseluruhan semburan dan ciri-ciri pengatoman seperti penetrasi hujung
paksi semburan, lebar semburan, dan SMD keseluruhan diukur secara eksperimen dan
diramal dengan menggunakan ANSYS Fluent. Proses pembangunan dan masa
penampilan vortisitas dalam ujian bahan bakar sangat mirip. Penetrasi hujung paksi
semburan ujian bahan bakar adalah serupa, sedangkan lebar sembur dan sudut kon
G100 sedikit lebih besar dari bahan bakar yang lain. Berkenaan prestasi pengatoman,
bahan bakar E100 antara bahan bakar yang diuji mempunyai saiz titisan terbesar kerana
E100 memiliki kinematik viskositi dan tegangan permukaan yang tinggi.
viii
TABLE OF CONTENTS
TITLE PAGE
TITLE PAGE i
DECLARATION ii
DEDICATION iv
ACKNOWLEDGEMENT v
ABSTRACT vi
ABSTRAK vii
TABLE OF CONTENTS viii
LIST OF FIGURES x
CHAPTER 1:
INTRODUCTION 1
1.1 Project background 1
1.2 Problem statement 2
1.3 Objectives 2
1.4 Scopes of work 2
1.5 Outline of the project 2
CHAPTER 2:
LITERATURE REVIEW 3
2.1 Atomization 3
2.2 Spray parameters 4
2.3 Fuel injection system 5
2.4 Spray simulation 5
2.5 Software simulation 6
2.6 Example simulation 7
2.6.1 Using KIVA-3V 7
ix
2.6.2 Using star-CD 8
2.6.3 Using AVL 9
CHAPTER 3:
METHODOLOGY 11
3.1 Introduction 11
3.2 Flow chart of methodology 11
3.3 Geometry 13
3.4 Meshing 13
3.5 Setup 14
3.5.1 General 14
3.5.2 Model 16
3.5.3 Material 20
3.5.4 Boundary conditions 21
3.5.5 Solution 23
CHAPTER 4:
RESULTS AND DISCUSSION 24
4.1 Simulation 24
4.2 Experimental 25
4.3 Comparisons of simulation with experiment result 26
CHAPTER 5:
CONCLUSION 27
5.1 Conclusion 27
5.2 Recommendation and future work 27
REFERENCES 28
APPENDIX 29
x
LIST OF FIGURES
FIGURE NO. TITLE PAGE
2.1 Spray regimes 3
2.2 Definitions of spray tip penetration and spray angle 4
2.3 Computational domain 8
2.4 Numerical result 8
2.5 Computational domain 9
2.6 Numerical result 9
2.7 Computational domain 10
2.8 Numerical result 10
3.1 Flow chart 12
3.2 Geometry of domain 13
3.3 Meshing 13
3.4 Mesh display dialog box 14
3.5 Mesh color dialog box 15
3.6 Plane 3 face 15
3.7 Reorder report 16
3.8 Energy dialog box 16
3.9 Viscous model dialog box 17
3.10 Species model dialog box 17
3.11 Discrete phase model dialog box 18
3.12 Tracking tab dialog box 19
3.13 Set injection properties dialog box 19
3.14 Species dialog box 20
3.15 Create/edit materials dialog box 21
3.16 Pressure Outlet dialog box 22
3.17 Wall dialog box 22
3.18 Patch dialog box 23
4.1 G100 (simulation) 24
4.2 E100 (simulation) 25
4.3 G100 (experiment) 25
4.4 comparisons of simulation result with experiment result 26
CHAPTER 1
INTRODUCTION
1.1 PROJECT BACKGROUND
High pressure spray injection plays a significant role in modern direct injection
engines. The detailed understanding of this process becomes even more important in the
development of gasoline direct injection engines with a stratified charge concept.
Gasoline direct injection engines have attracted considerable attention due to their low
fuel consumption and being free of mixture control and meet the strengthening emission
regulations. The advantages of the Gasoline direct injection engine were their higher
thermal efficiency, better potential for reducing specific fuel consumption, as well as
freedom for controlling injection timing and in cylinder fuel quantity. Meanwhile, the
Gasoline direct injection engine also has potential for significant improvement of
pollutant emissions and start-acceleration performance compared with those of the
traditional gasoline engine.
The aim of this project was to illustrate the liquid atomization of the spray
influential parameters on the spray characteristics using different ratio gasoline-ethanol
blend. The physical properties of gasoline, ethanol and their blend, such as density,
viscosity, surface tension, and speed of sound, were measured and used in the numerical
simulations. Injection process parameters such as injection pressure, nozzle needle lift,
injection rate, and volume of injected fuel were controlled on the fuel injection systems
test bench. The simulation results were compared with the experimental result for
verification.
2
1.2 PROBLEM STATEMENT
Sprays have been studied for more than a century but were still under research.
Through studies by different researchers, it was found that the spray was influenced by
a large number of parameters for example different fuel blend, internal nozzle flow
including cavitations, spray velocity profile, turbulence at nozzle exit plus physical and
thermodynamic states of liquid and surrounding gas.
1.3 OBJECTIVE
a) To simulate the spray of gasoline and ethanol fuel.
b) To compare the simulation result with the experimental result.
1.4 SCOPES OF WORK
This project focused only on high pressure spray. CFD simulation had been
conducted in this project using ANSYS Fluent software. Two different type of fuel was
used, gasoline (G100) and ethanol (E100). The ‘‘E’’ designates ethanol and the number
next to E designates the volume percentage of ethanol. The G100 mean that 100%
gasoline and E100 means pure ethanol.
1.5 OUTLINE OF THE PROJECT
In this present chapter the background for investigating high- pressure sprays in
gasoline direct injection engines was given. In chapter 2 the theory of spray were
presented together with a review of the simulation finding for high pressure sprays. In
chapter 3 the CFD code of ANSYS fluent was presented, together with the spray model
used, which relates to high pressure sprays. The numerical simulation had been in
chapter 3. In chapter 4 was review of experimental and simulation result for high-
pressure spray. Chapter 4 also includes a discussion of experimental and simulation
result. The final chapter 5 would summarize the main result and conclusion and outline
the suggested path for future work. Gantt chart was given in Appendix A.
CHAPTER 2
LITERATURE REVIEW
2.1 ATOMIZATION
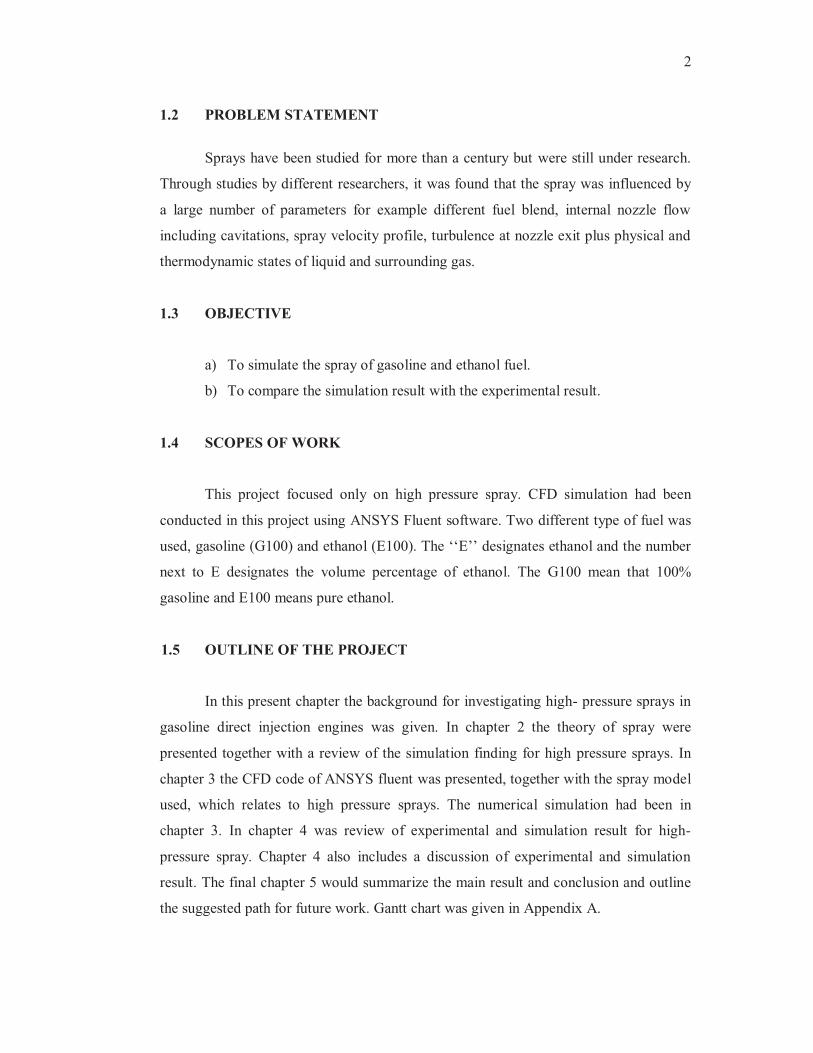
Sprays are usually classified into four spray regimes:
Rayleigh regime: Droplet diameter is larger than jet or spray diameter and liquid
break up occurs at the downstream of the nozzle.
First wind induced regime: Droplet diameter in the order of the spray diameter.
Break up occurs at the downstream of the nozzle
Second wind induced regime: Droplet diameter smaller is than the spray
diameter and break up starts some distance downstream of nozzle.
Atomization regime: Droplet diameter much smaller than the spray diameter and
break up starts close to the nozzle exit.
Figure 2.1: Spray regimes.
Source: Bjarke Skovgard Dam, 2007
4
Atomization is the process leading to the formation of sprays, which refers to the
conversion of bulk liquid into a collection of droplets, often by passing the liquid through a
nozzle or an atomizer. Atomization can be considered as a disruption of the consolidating
influence of surface tension by the action of internal and external forces. The atomization
model supplies the initial conditions for spray computations, in example the drop sizes,
velocities, temperatures, and other at the injector nozzle exit.
2.2 SPRAY PARAMETERS
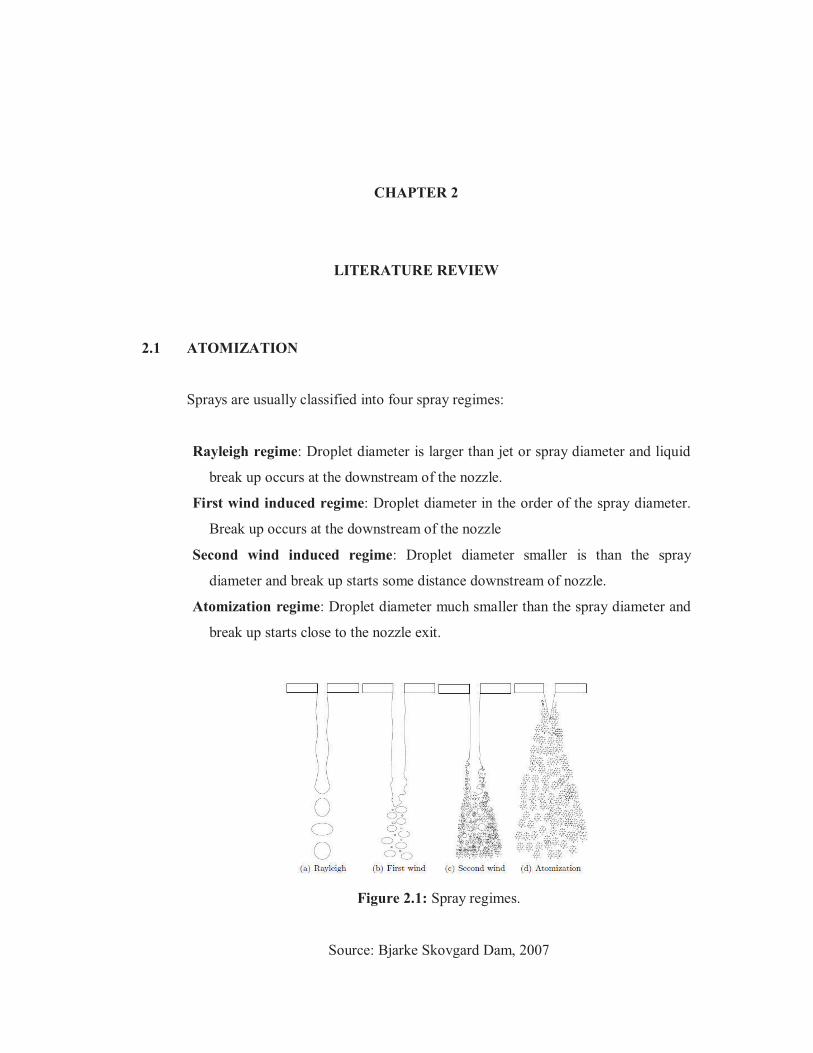
A number of parameters are defined in order to characterize a spray under certain
conditions. Some commonly used parameters are:
Penetration: The penetration length is the distance from the nozzle to the end of
spray.
Spray angle: The spray angle is used to define the size of the spray. It is defined as
the quasi steady angle, which is reached after the passing of the spray head.
Sauter Mean Diameter (SMD): The droplet size in the spray is usually
characterized with its SMD. SMD is proportional to the surface to volume
ratio and has the advantage that even if the droplets are not spheres their
surface to volume fraction is equivalent to a sphere and therefore they heat up
and evaporate in the same way.
Figure 2.2: Definitions of spray tip penetration and spray angle.
Source: Jian Gao, et.al , 2006
5
2.3 FUEL INJECTION SYSTEM
The fuel injection system needs to provide different operating modes for the
different loads. Fuel injection pressure is very high. This higher pressure values allow a
higher penetration and reduce the mean droplet diameter determining a better atomized
spray and a good penetration. The high injection pressures will enhance atomization but at
the same time produce an over penetrating sprays and wall wetting problems, especially
when a sac volume is present. For the unthrottled part-load case, a late injection is needed
in order to allow stratified charge combustion, with a well atomized compact spray to
control the stratification. A well dispersed spray is desirable, with bigger cone angle and a
conical shape. As mentioned before the higher injection pressure is necessary to reduce the
Sauter mean radius (SMD) of the liquid spray. To better characterize the spray size
distribution the DV90 statistic may also be introduced, which is a quantitative measure of
the largest droplets in the spray. It is the droplet diameter corresponding to the 90%
volume point, so it gives a measure of the droplet size distribution spread. Gasoline direct
injection (GDI) injectors can either be single fluid or air-assisted (two phase) and may be
classified by atomization mechanism (sheet, turbulence, pressure, cavitations), by actuation
type, nozzle configuration (that can be either swirl, slit, multihole or cavity type), or by
spray configuration (hollow cone, solid-cone, fan, multi-plume). [Rossella Rotondi, et.al,
2005]
2.4 SPRAY SIMULATION
Sprays have always been a challenge for fluid modelers. Sprays that occur within
direct injection engines are typically comprised of a very large number of droplets. Each
droplet has unique properties and is subject to complex interactions that are a function of
those properties. Due to limited computational resources, it is nearly impossible to take
into account each individual droplet in a computational simulation. A variety of strategies
has been formulated over the years to address this problem. While details vary from to
model, most of these strategies fall into two basic categories: Eulerian-type and
lagrangian-type formulation. [Sara dailey bauman, 2001]
6
The Eulerian-type formulation represents the spray using continuous fields on the
same computational grid as is used for the ambient fluid. This formulation is often chosen
for its simplicity and ease of implementation. Due to the semi-continuous nature of its
formulation, spray properties are typically required to remain uniform, such as isothermal
droplets and uniform droplet radii, or to follow other simplifying assumptions. Diverse
droplet properties can be taken into account by maintaining multiple fields and transport
equations. This type is almost appropriate when concerned about macroscopic behavior of
the spray on scales much larger than the average droplet spacing or on scales on the order
of the spray penetration length. Averaged information about the spray may be obtained
and general spray behavior can be observed. However, the Eulerian approach suffers from
numerical diffusion, particularly on coarse grids. [Sara dailey bauman, 2001]
The lagrangian-type formulation is based on a fluid-particle model introduced by
Dukowicz. The spray is represented by a collection of computational particles. Each
particle in turn represents a parcel of spray droplets that are assumed to have identical
properties such as position, velocity, density, radius, and temperature. Often referred to as
the discrete droplet model or stochastic particle model, this formulation is more resistant to
the numerical diffusion inherent in a semi-continuous field representation. Though the
droplets of a single particle have identical properties, each particle in the spray can have a
unique set of properties and interact with the fluid accordingly. If appropriately chosen
probability distributions are used to define particle properties, an adequate statistical
representation of realistic sprays may be obtained when a sufficiently large number of
computational particles are used. In the limit of single droplet per particle and assuming
appropriate initial conditions are known, this type of formulation approaches the ideal
conditions for simulating the spray. [Sara dailey bauman, 2001]
2.5 SOFTWARE SIMULATION
Nowadays computational fluid dynamics (CFD) plays a key role for the
optimization of the combustion process in direct injection (DI) diesel engines. Despite their
great uncertainties compared to the experimental studies, numerical simulations permit
carrying out extensive parametric studies, isolating every single variable involved in the
general process at any point in time and at any position in physical space. Modeling also
7
allows one to artificially separate specific subprocess in example spray atomization,
evaporation, diffusive combustion, and emissions from the others that would interact in the
real system or to investigate the effects of unnatural boundary conditions on such
processes, in order to better understand the combustion process in engines. Basically,
engine simulation models can be classified into three categories, depending on their
complexity and increasing requirements with respect to the computational power:
thermodynamics and phenomenological models, and the multidimensional models used in
the so-called CFD codes. [J. M. Desantes, et.al 2009]
The thermodynamic codes assume that the cylinder charge is uniform in both
composition and temperature, at all times during the cycle. These models are
computationally very efficient but cannot provide insight into local processes such as the
spatial variation in mixture composition and temperature, essential to predict exhaust
emissions. Phenomenological spray and combustion models are more complex than the
thermodynamic models since they divide the combustion chamber into numerous different
zones, characterized by different temperature and compositions. In the multidimensional
CFD-codes the full set of differential equations for species, mass, energy, and momentum
conservation are solved on a relatively fine numerical mesh with the inclusion of models to
account for the effects of turbulence. As a result, these models are best suited to analyze
the various subscale processes of mixture formation and combustion with great detail. [J.
M. Desantes, et.al, 2009]
2.6 EXAMPLE SIMULATION
2.6.1 Using KIVA-3 V
In order to apply the spray of gasoline and ethanol fuels to the KIVA-3 V code,
gasoline (C8H17) and ethanol (C2H5OH) fuel properties from the fuel library (Amsden,
1993) were used to calculate the gasoline (G100) and ethanol (E100) sprays. In the case of
the ethanol blended gasoline fuel (E85), the fuel library was created on the basis of
measured fuel properties such as surface tension, density, and kinetic viscosity. Therefore,
the calculations of the spray characteristics injected through the GDI injector were
conducted after the fuel library of the test fuel was added and modified in the KIVA-3V
8
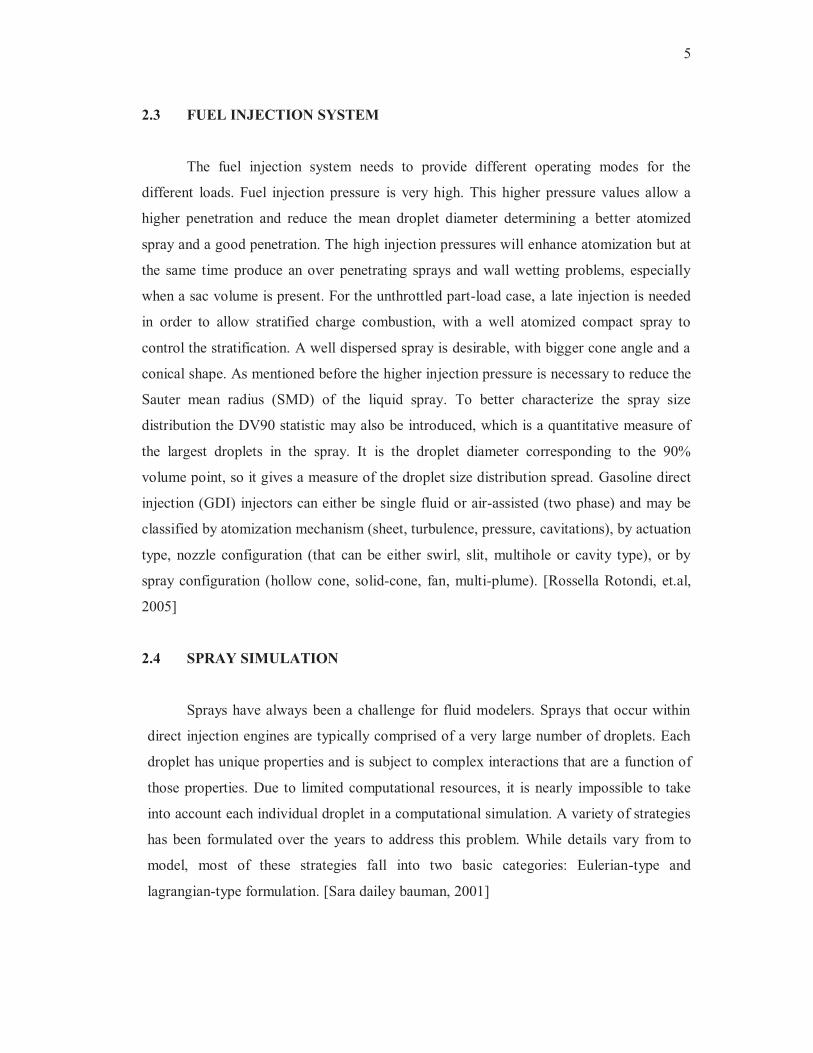
code. The calculation conditions used were the same as the experimental conditions. The
total number of injected droplets was set at 5000. The spray angle and duration of pre-
spray with nozzle hole diameter were determined to be 10 degree of a solid cone form and
0.1 ms before the conversion of the hollow cone, respectively. In order to analyze the spray
characteristics, uniform cubic meshes with a computational cell size of 2 x 2 x 2 mm were
used. [Su Han Park, et.al, 2009]
Figure 2.3: Computational domain.
Source: Su Han Park, Hyung Jun Kim, Hyun Kyu Suh, Chang Sik Lee, 2009
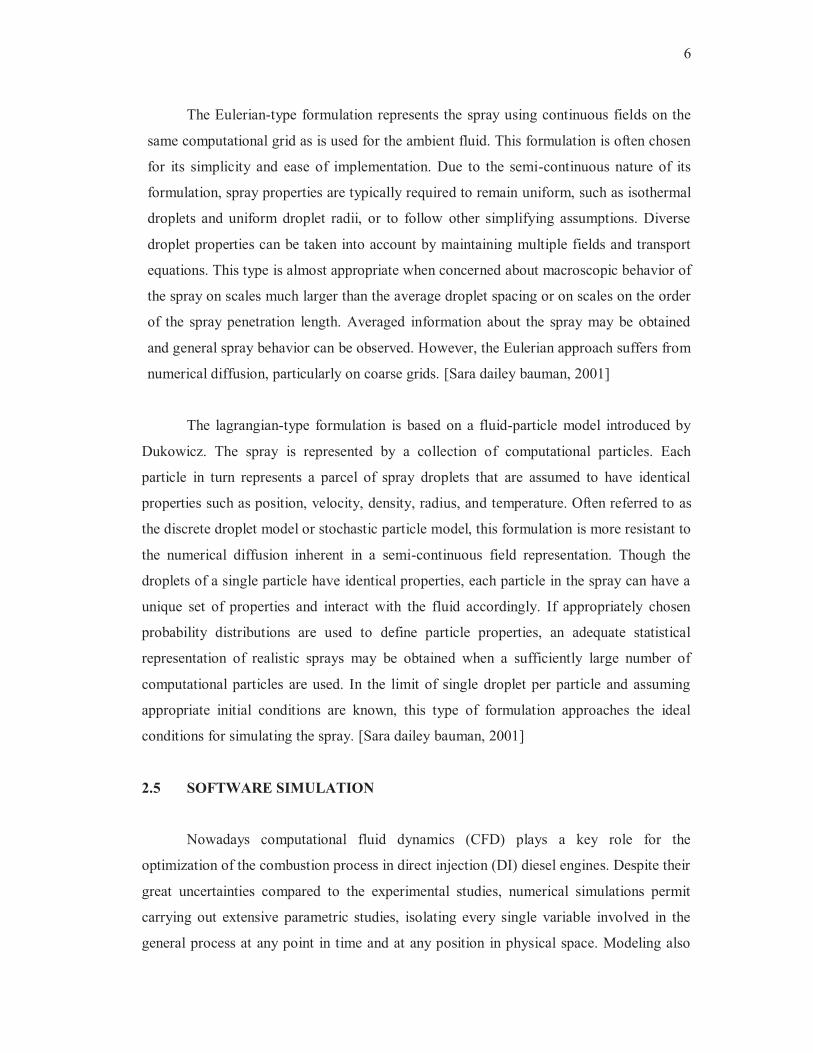
Figure 2.4: Numerical result.
Source: Su Han Park, Hyung Jun Kim, Hyun Kyu Suh, Chang Sik Lee, 2009
9
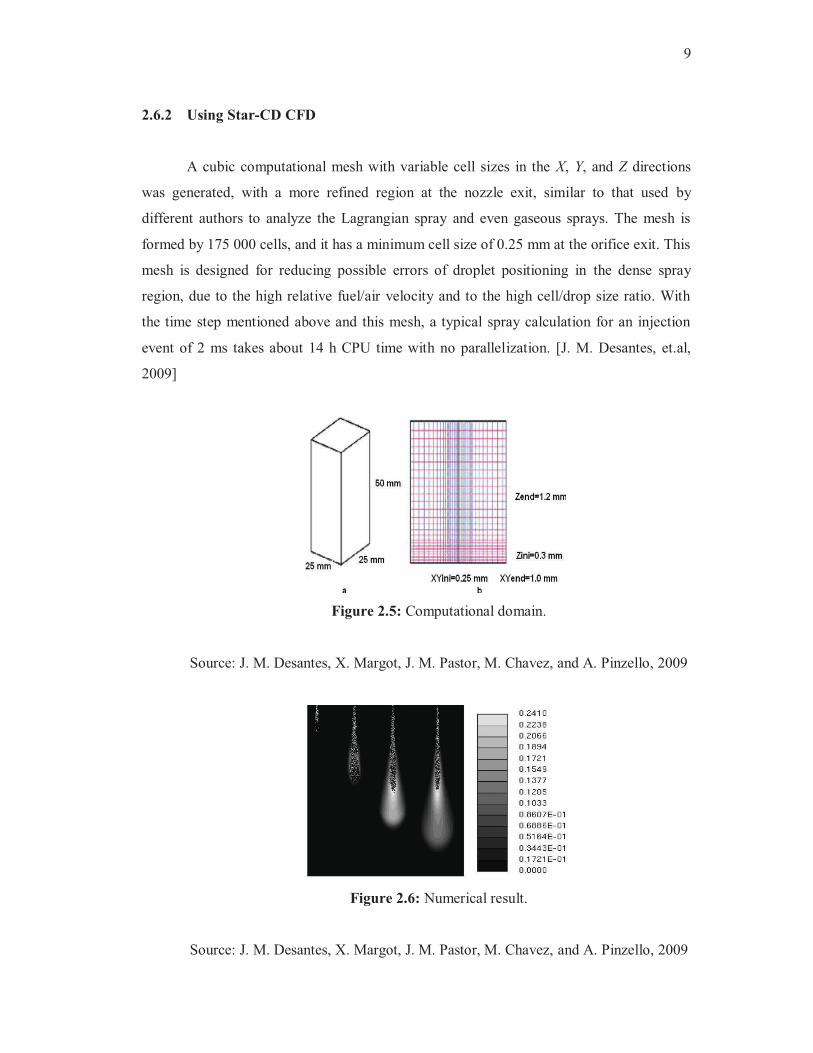
2.6.2 Using Star-CD CFD
A cubic computational mesh with variable cell sizes in the X, Y, and Z directions
was generated, with a more refined region at the nozzle exit, similar to that used by
different authors to analyze the Lagrangian spray and even gaseous sprays. The mesh is
formed by 175 000 cells, and it has a minimum cell size of 0.25 mm at the orifice exit. This
mesh is designed for reducing possible errors of droplet positioning in the dense spray
region, due to the high relative fuel/air velocity and to the high cell/drop size ratio. With
the time step mentioned above and this mesh, a typical spray calculation for an injection
event of 2 ms takes about 14 h CPU time with no parallelization. [J. M. Desantes, et.al,
2009]
Figure 2.5: Computational domain.
Source: J. M. Desantes, X. Margot, J. M. Pastor, M. Chavez, and A. Pinzello, 2009
Figure 2.6: Numerical result.
Source: J. M. Desantes, X. Margot, J. M. Pastor, M. Chavez, and A. Pinzello, 2009
10
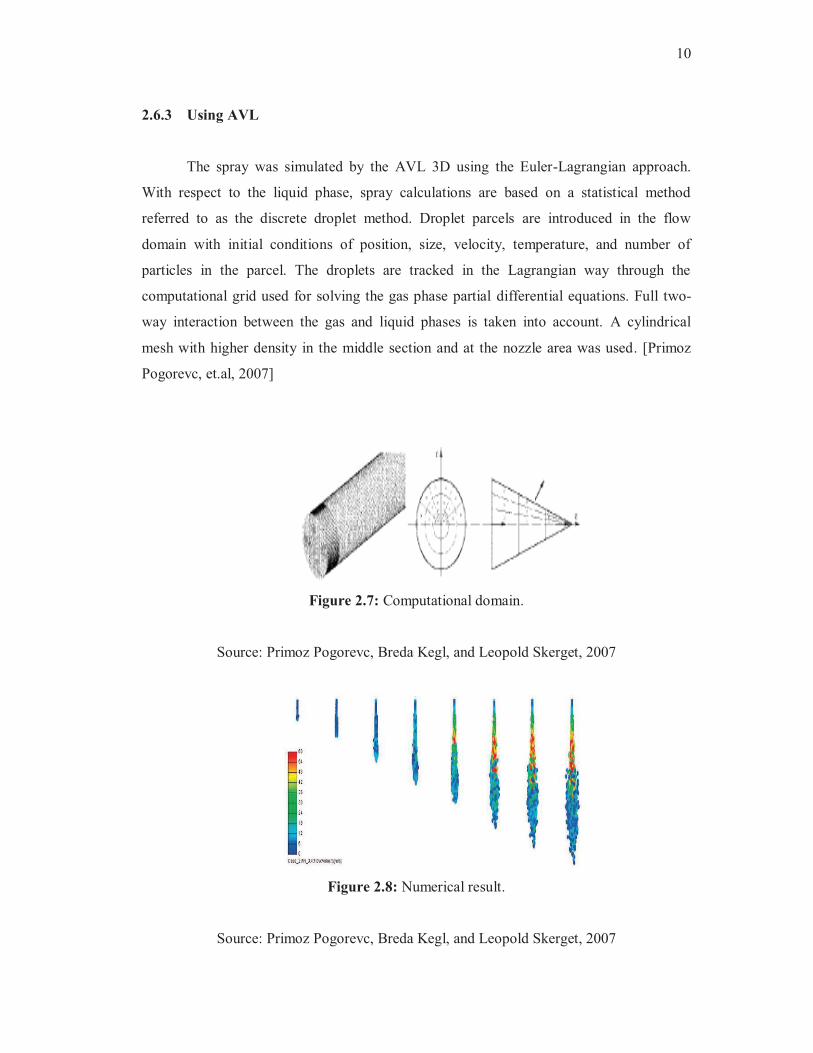
2.6.3 Using AVL
The spray was simulated by the AVL 3D using the Euler-Lagrangian approach.
With respect to the liquid phase, spray calculations are based on a statistical method
referred to as the discrete droplet method. Droplet parcels are introduced in the flow
domain with initial conditions of position, size, velocity, temperature, and number of
particles in the parcel. The droplets are tracked in the Lagrangian way through the
computational grid used for solving the gas phase partial differential equations. Full two-
way interaction between the gas and liquid phases is taken into account. A cylindrical
mesh with higher density in the middle section and at the nozzle area was used. [Primoz
Pogorevc, et.al, 2007]
Figure 2.7: Computational domain.
Source: Primoz Pogorevc, Breda Kegl, and Leopold Skerget, 2007
Figure 2.8: Numerical result.
Source: Primoz Pogorevc, Breda Kegl, and Leopold Skerget, 2007
CHAPTER 3
METHODOLOGY
3.1 INTRODUCTION
In this project, several methods were used to complete the project. The methods
used were literature survey, data collecting, geometry measurement, conceptual design,
computational simulation, and analysis. Each of the methods was explained in details and
clearly with explanation.
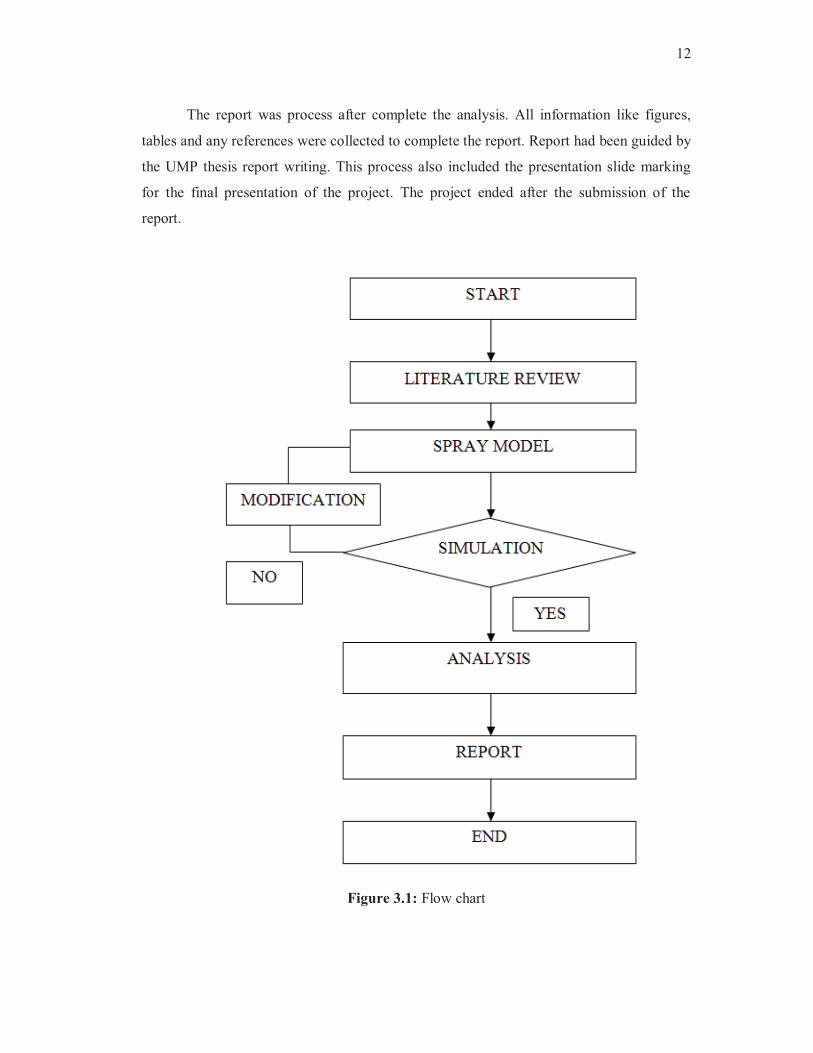
3.2 FLOW CHART OF METHODOLOGY
The project starts with literature review and research about title such as a review of
the concept spray process, fuel properties, injection characteristics, software used, and
spray modeling. These tasks have been done through research on the books, journals,
technical reports and other sources.
After gathering all relevant information, the project undergoes to spray model. In
this step, from the knowledge gathered, the review was used to design the injector,
chamber and other to complete the system spray. After completing the spray model, the
simulation was run. All results were recorded. When something erred or problems arose in
this step, the spray model was modified.
The next step was analysis result. Result from simulation was compared to the
experimental result. The comparison of simulation with experimental include the liquid
atomization and characteristic of different fuel blend like spray angle, spray penetration,
also droplet size.
12
The report was process after complete the analysis. All information like figures,
tables and any references were collected to complete the report. Report had been guided by
the UMP thesis report writing. This process also included the presentation slide marking
for the final presentation of the project. The project ended after the submission of the
report.
Figure 3.1: Flow chart
13
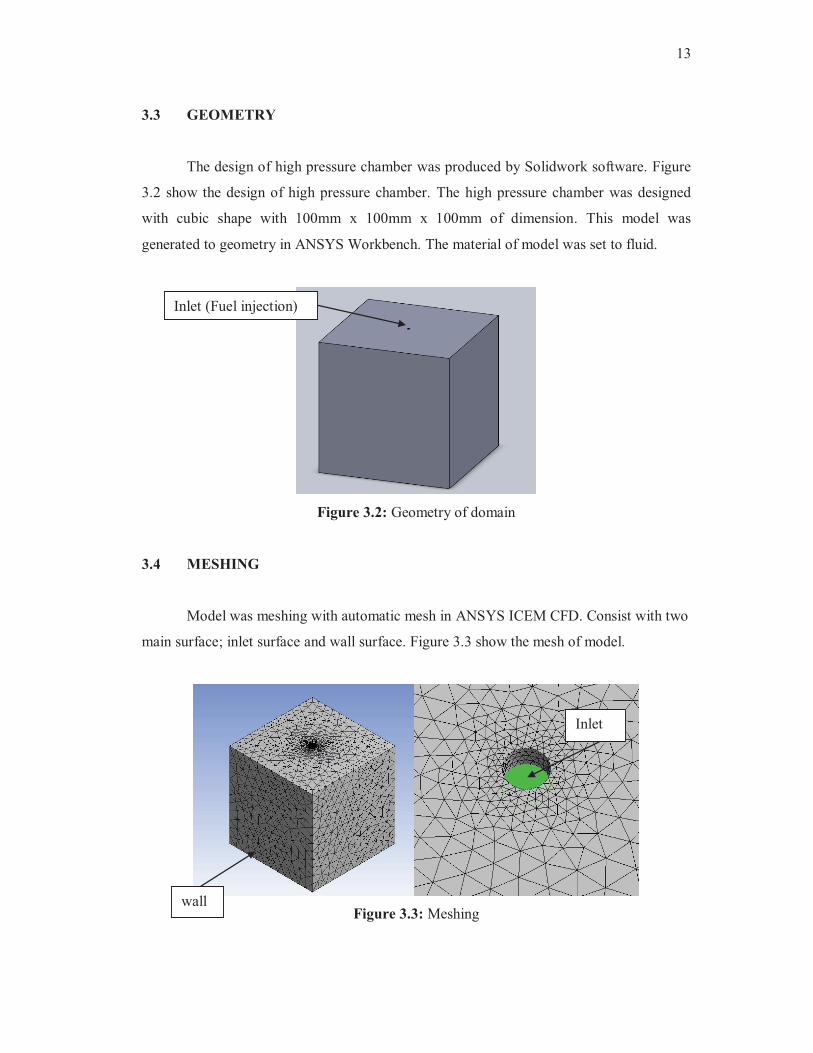
3.3 GEOMETRY
The design of high pressure chamber was produced by Solidwork software. Figure
3.2 show the design of high pressure chamber. The high pressure chamber was designed
with cubic shape with 100mm x 100mm x 100mm of dimension. This model was
generated to geometry in ANSYS Workbench. The material of model was set to fluid.
Figure 3.2: Geometry of domain
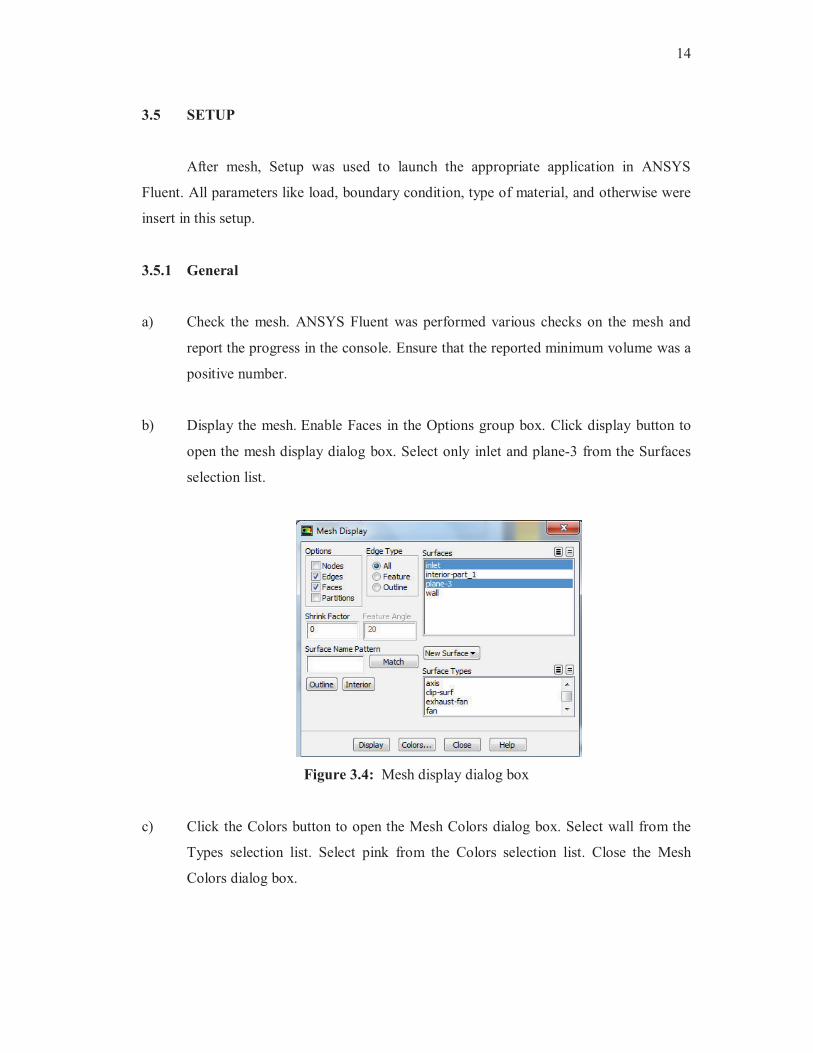
3.4 MESHING
Model was meshing with automatic mesh in ANSYS ICEM CFD. Consist with two
main surface; inlet surface and wall surface. Figure 3.3 show the mesh of model.
Figure 3.3: Meshing
Inlet (Fuel injection)
Inlet
wall
14
3.5 SETUP
After mesh, Setup was used to launch the appropriate application in ANSYS
Fluent. All parameters like load, boundary condition, type of material, and otherwise were
insert in this setup.
3.5.1 General
a) Check the mesh. ANSYS Fluent was performed various checks on the mesh and
report the progress in the console. Ensure that the reported minimum volume was a
positive number.
b) Display the mesh. Enable Faces in the Options group box. Click display button to
open the mesh display dialog box. Select only inlet and plane-3 from the Surfaces
selection list.
Figure 3.4: Mesh display dialog box
c) Click the Colors button to open the Mesh Colors dialog box. Select wall from the
Types selection list. Select pink from the Colors selection list. Close the Mesh
Colors dialog box.


![MEF SD-WAN Reality Check · SD-WAN Controller SD- WAN Gateway Self-service Web Portal CSP [Presto] Branch SD WAN (v)CPE [Adagio] [Legato] SD-WAN Gateway SD-WAN (v)CPE ISP Z ISP Y](https://img.pdfslide.us/doc/110x75/600f825ea8a94866cc40d9d4/mef-sd-wan-reality-check-sd-wan-controller-sd-wan-gateway-self-service-web-portal.jpg)