Embed Size (px)
Citation preview
Perception and insights on fats and fatty Perception and insights on fats and fatty acids: knowledge of fat quality of the dietacids: knowledge of fat quality of the diet

[drive:directory path\filename.ppt 2 ]
Background
• Research indicates that consumers nowadays are very aware of their health and the major role nutrition plays in this.*
• Consumers actively look for information on nutrition. The question is whether this has resulted in a better understanding of the role of nutrition in their health.
• This piece of consumer research was performed to gain insight into the degree of consumer knowledge and confusion about nutrition, with emphasis on the role of fats.
* Source: The American Journal of Clinical Nutrition, 2006;83:1272–5.
[drive:directory path\filename.ppt 3 ]
The objectives of this research were to gain an understanding of:
• Consumers knowledge of fats in general, and specific fats
• Consumers attitudes towards the topic of fat
• What consumers think of the role of fat in the diet
• Which foods consumers believe provide the different fats
Objectives
[drive:directory path\filename.ppt 4 ]
Study population
• The research was carried out in 16 countries
• Interviews were conducted in two periods: • Nov-Dec 07 (wave 1)• Aug-Sept 08 (wave 2)
• How: • Telephone and face-to-face interviewing (wave 1)• Internet and face-to-face interviewing (wave 2)
• Who: •Chief shoppers (those who personally select items for their household half or more than half of the time), aged 18-70
• How many: • 200 per country per wave

[drive:directory path\filename.ppt 5 ]
Study population: 16 countries
USAUSA
MEXICOMEXICO
BRAZILBRAZIL
INDONINDON
S.AFRS.AFR
TKTK
SWESWE
SPSP
PLPLNLNLBEBE
UKUK
GREGRE
GEGE
FRFRCZCZ
Results: Fat as a part of a healthy diet

[drive:directory path\filename.ppt 7 ]
How much fat do consumers think is needed for a healthy balanced diet?
Of my daily calories, from fat I should have…%
How much fat needed for a healthy balanced diet – Wave 2Q - Thinking about how much fat you need for a healthy balanced diet. How much of your daily intake of calories do you think should come from fat?
Global Average
“15-30% of daily calories”
22%
“Less than 14%”:
60%
“Don’t know”
13%
60% think that fat should deliver 14% of the daily energy,
or less.
“More than 31%”: 6%

[drive:directory path\filename.ppt 8 ]
Foods needed in a healthy balanced diet – Fat – Wave 2Q - Thinking about the different things that foods contains, which of these do you think people need for a healthy balanced diet?
Global average Developed average Emerging average
Sweden* United Kingdom* Czech Republic*
Netherlands* United States
Germany Poland Spain
Belgium Greece France
Mexico Indonesia
South Africa Turkey Brazil
4147
35
79595757
4947
434140
3232
5042
3831
19
Do consumers think that fat is part of a healthy balanced diet?
Only in some countries do
consumers agree that fat needs to be part of healthy
diet.
%

[drive:directory path\filename.ppt 9 ]
Statements about fats – Wave 2Q - How strongly do you agree or disagree with these statements about fats? (5 point scale agree strongly to disagree strongly)
A low fat diet is a healthy diet% agree
6558
72
6868656564
6056
4743
3418
918178
6766
Global average Developed average Emerging average
Spain Germany
Poland United Kingdom
Greece United States
Czech Republic Belgium
Netherlands France
Sweden
Turkey South Africa
Mexico Brazil
Indonesia
65% think that a low fat diet is a healthy
diet.
Do consumers agree that a low fat diet is a healthy diet?
[drive:directory path\filename.ppt 10 ]
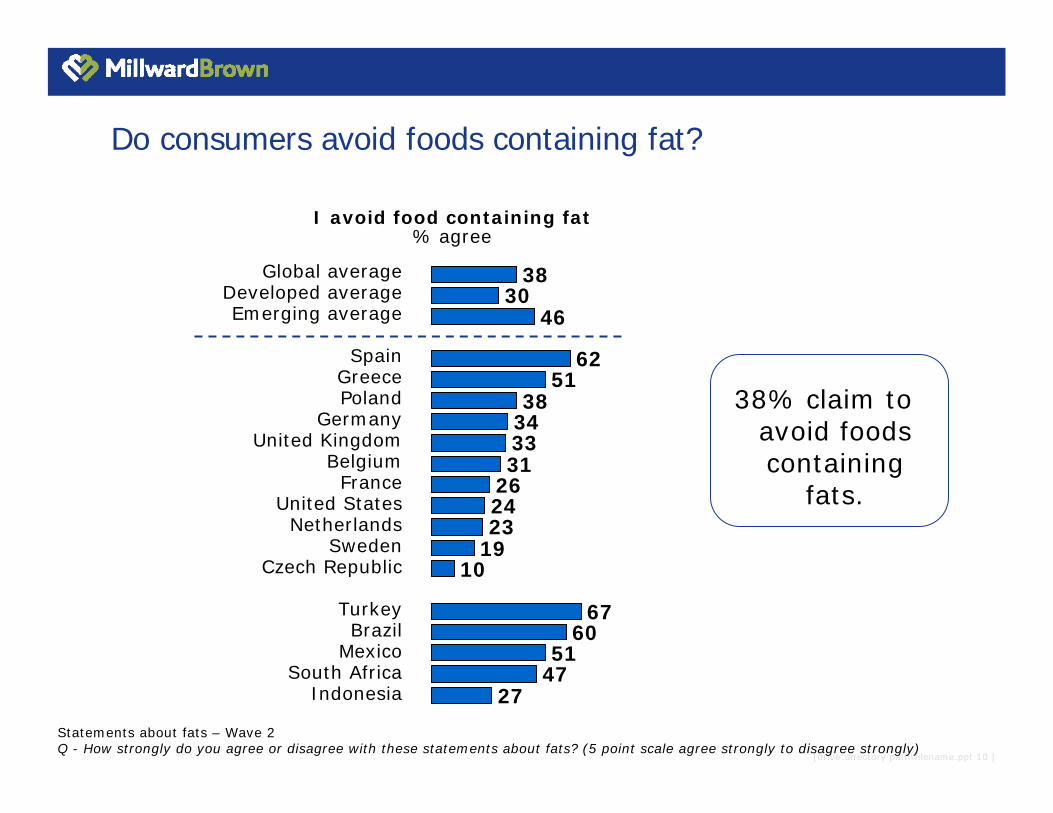
I avoid food containing fat% agree
3830
46
6251
38343331
262423
1910
6760
5147
27
Global average Developed average Emerging average
Spain Greece Poland
Germany United Kingdom
Belgium France
United States Netherlands
Sweden Czech Republic
Turkey Brazil
Mexico South Africa
Indonesia
Statements about fats – Wave 2Q - How strongly do you agree or disagree with these statements about fats? (5 point scale agree strongly to disagree strongly)
38% claim to avoid foods containing
fats.
Do consumers avoid foods containing fat?

[drive:directory path\filename.ppt 11 ]
What foods do consumers think are needed for a balanced diet?
Foods that are needed for a balanced diet – Wave 2Q - Thinking about the different things that foods contains, which of these do you think people need for a healthy balanced diet?
Vitamins
Proteins
Fibre
Minerals
Carbohydrates
Salt
Fat
Sugar
Alcohol
95
93
88
84
78
42
41
38
3
Global average%
Developed average%
95
93
91
89
78
40
47
32
3
Emerging average%
94
93
85
79
79
43
35
44
2
Vitamins, proteins, fibre, minerals and carbohydrates are elements of a balanced diet. Fats are not.

[drive:directory path\filename.ppt 12 ]
Some real life consumer quotes on a healthy diet
‘I am quite ignorant on eating healthy and I
think a lot of people are ignorant as to what you are supposed to eat and how many calories you are supposed to have.’
‘I don’t care as long as it tastes OK’
‘If it says low in fat,
you are drawn to it then really’
‘I try and justify the lack of a
healthy diet by being more active.’
Institute of Grocery Distribution, 2008 Saturated fat communication: enabling consumers to make more informed choices

Results: Different types of fatWhere can you find them & what do they do?
[drive:directory path\filename.ppt 14 ]
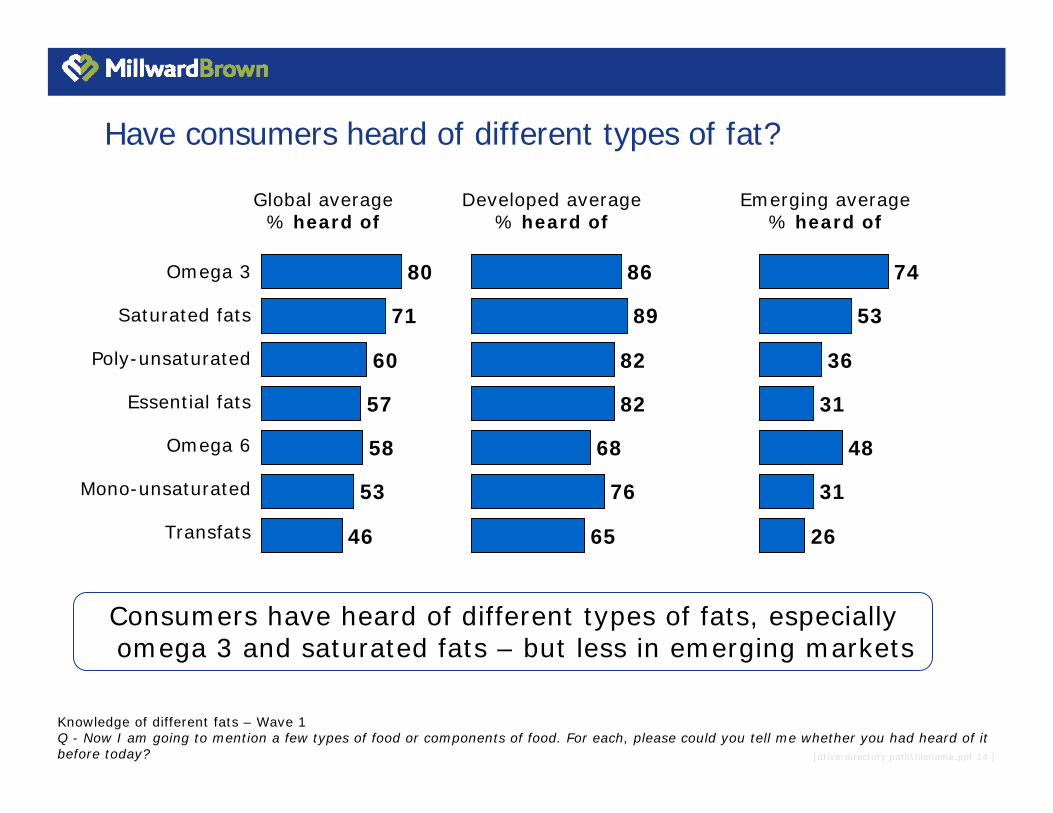
Have consumers heard of different types of fat?
Knowledge of different fats – Wave 1Q - Now I am going to mention a few types of food or components of food. For each, please could you tell me whether you had heard of it before today?
Omega 3
Saturated fats
Poly-unsaturated
Essential fats
Omega 6
Mono-unsaturated
Transfats
80
71
60
57
58
53
46
Global average% heard of
Developed average% heard of
86
89
82
82
68
76
65
Emerging average% heard of
74
53
36
31
48
31
26
Consumers have heard of different types of fats, especially omega 3 and saturated fats – but less in emerging markets
[drive:directory path\filename.ppt 15 ]
Don’t know%
2
2
5
9
12
30
63
38
16
9
10
7
3
7
5
4
2
4
13
10
5
Omega 3
Omega 6
Essential fats
Mono-unsaturated fats
Poly-unsaturated fats
Transfats
Saturated fats
Bad%
Good%
3
6
15
26
28
49
67
77
53
56
33
40
6
4
7
6
5
4
3
9
7
Neither%
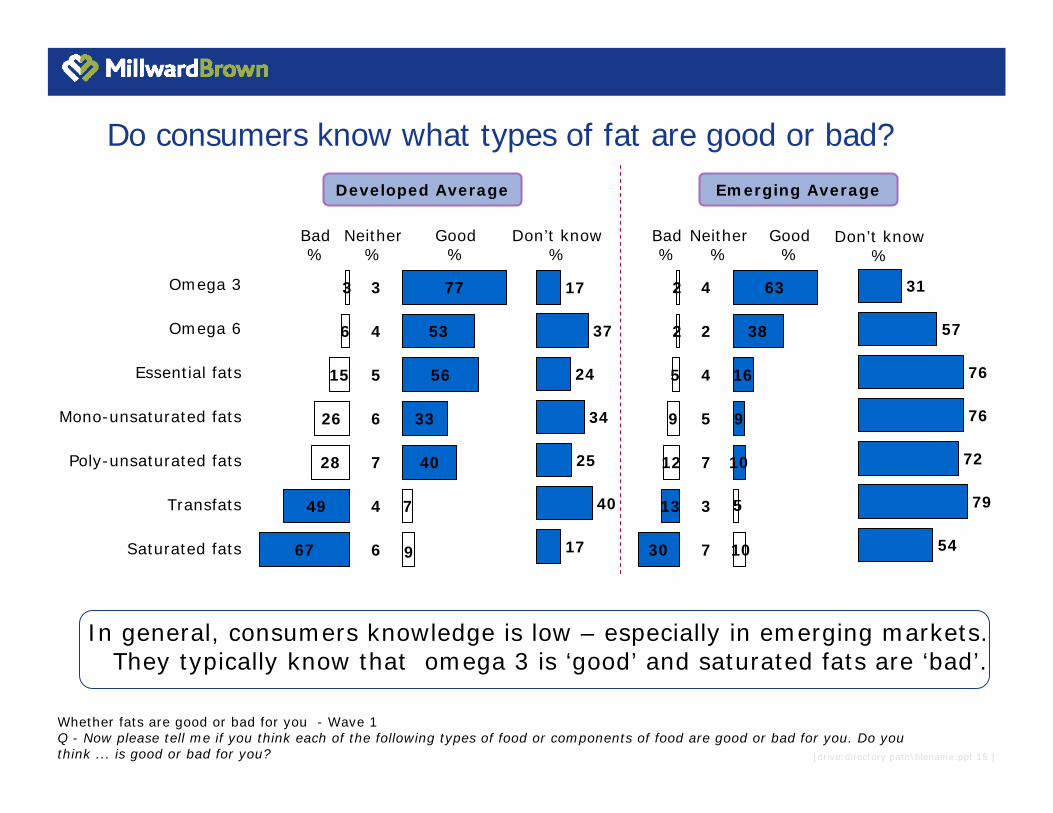
Whether fats are good or bad for you - Wave 1Q - Now please tell me if you think each of the following types of food or components of food are good or bad for you. Do you think ... is good or bad for you?
Bad%
Good%
Neither%
Don’t know%
17
37
24
34
25
40
17
31
57
76
76
72
79
54
Developed Average Emerging Average
In general, consumers knowledge is low – especially in emerging markets. They typically know that omega 3 is ‘good’ and saturated fats are ‘bad’.
Do consumers know what types of fat are good or bad?
[drive:directory path\filename.ppt 16 ]
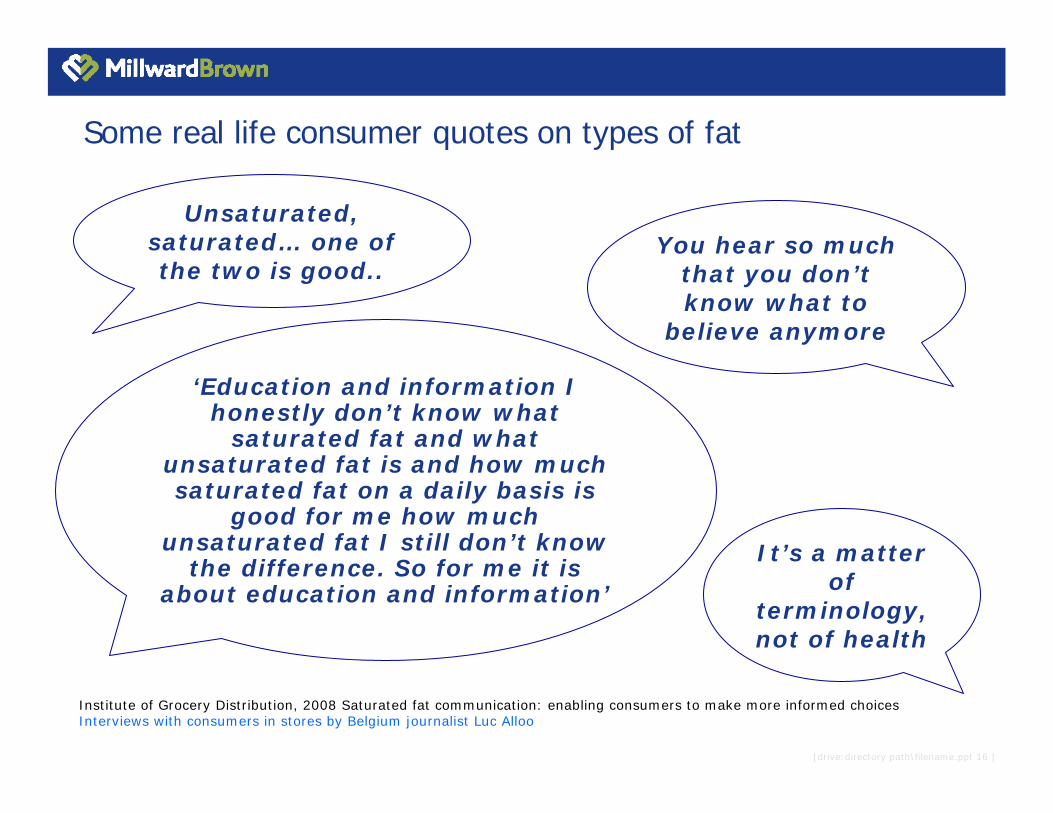
Some real life consumer quotes on types of fat
It’s a matter of
terminology, not of health
‘Education and information I honestly don’t know what
saturated fat and what unsaturated fat is and how much saturated fat on a daily basis is
good for me how much unsaturated fat I still don’t know
the difference. So for me it is about education and information’
Unsaturated, saturated… one of the two is good..
You hear so much that you don’t know what to
believe anymore
Institute of Grocery Distribution, 2008 Saturated fat communication: enabling consumers to make more informed choicesInterviews with consumers in stores by Belgium journalist Luc Alloo
[drive:directory path\filename.ppt 17 ]
Good%
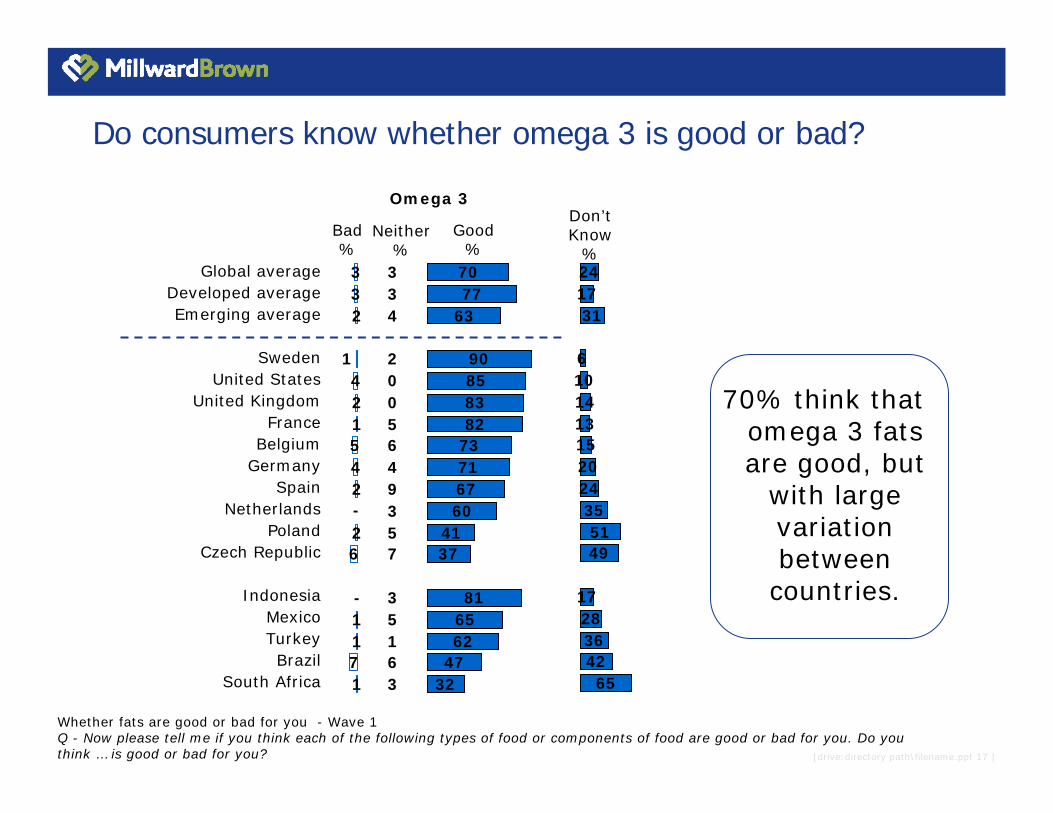
Do consumers know whether omega 3 is good or bad?
Bad%
Omega 3
Global average Developed average Emerging average
Sweden United States
United Kingdom France
Belgium Germany
Spain Netherlands
Poland Czech Republic
Indonesia Mexico Turkey Brazil
South Africa
7077
63
90858382
73716760
4137
816562
4732
332
421542
26
1171 3
6153
7539465002
433
-
1
-
Don’tKnow
%Neither
%241731
6101413152024355149
17283642
65
Whether fats are good or bad for you - Wave 1Q - Now please tell me if you think each of the following types of food or components of food are good or bad for you. Do you think … is good or bad for you?
70% think that omega 3 fats are good, but
with large variation between countries.
[drive:directory path\filename.ppt 18 ]
332524
161615
121110
76
421
Essential fatsProteinsVitaminsMinerals
Poly-unsaturated fatsFats
Mono-unsaturated fatsFibre
CarbohydratesSaturated fats
TransfatsCholesterolDon’t know
Global average%
Fat (any)
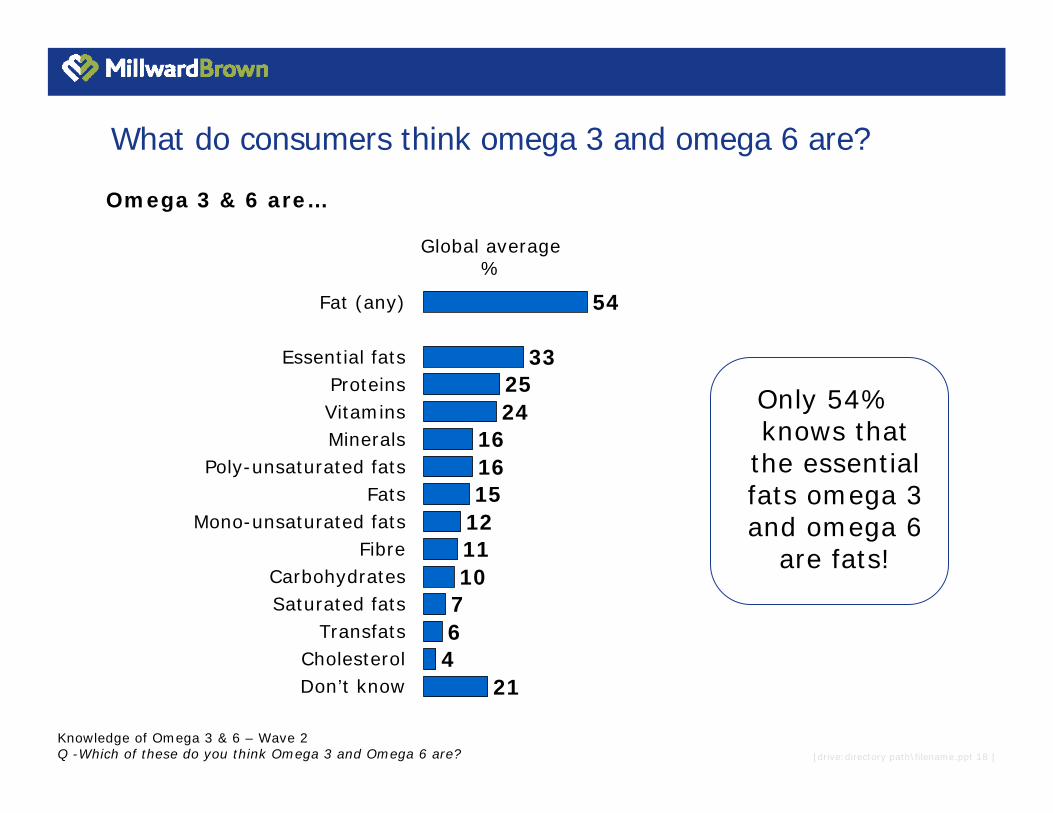
Only 54% knows that
the essential fats omega 3 and omega 6
are fats!
54
What do consumers think omega 3 and omega 6 are?
Knowledge of Omega 3 & 6 – Wave 2Q -Which of these do you think Omega 3 and Omega 6 are?
Omega 3 & 6 are…

[drive:directory path\filename.ppt 19 ]
94
72
15
7
45
17
65
79
To which effects do consumers link fats?
What fat does to the body – Wave 2Q - Which of these things do you think fat/saturated fats/essential fats/omega 3 and 6 can do to the body?
Fat
Saturated fats
Essential fats
Omega 3 and 6
Anynegative
contribution%
Anypositive
contribution%
Positive Provide vitamins,
Help with optimal cell growth and renewal, Help keep your heart healthy,
Keep you feeling full for longer, Help keep your skin and hair healthy,
Help brain and nerve cells function well,
Negative Cause weight gain,
Clog up your arteries, Raise cholesterol,
Cause cancer
Global Average
‘Fat’ is seen to do bad things to the body
[drive:directory path\filename.ppt 20 ]
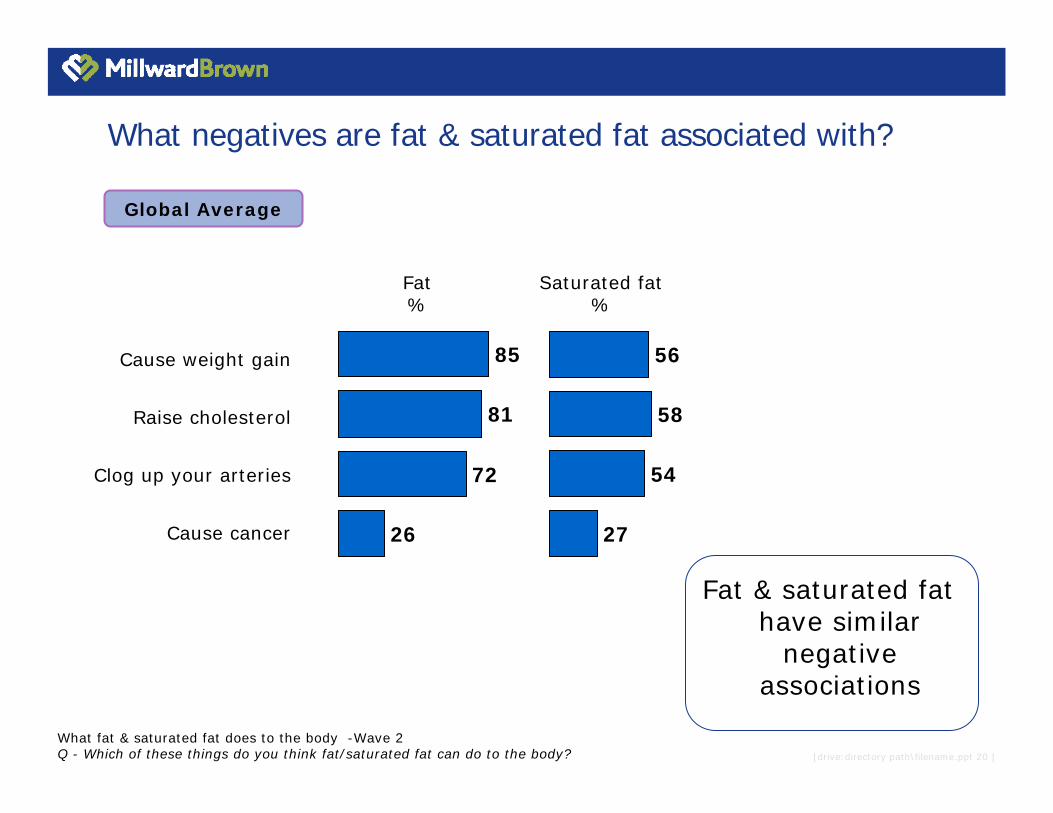
What negatives are fat & saturated fat associated with?
Cause weight gain
Raise cholesterol
Clog up your arteries
Cause cancer
85
81
72
26
Fat%
Saturated fat%
56
58
54
27
What fat & saturated fat does to the body -Wave 2 Q - Which of these things do you think fat/saturated fat can do to the body?
Global Average
Fat & saturated fat have similar
negative associations

[drive:directory path\filename.ppt 21 ]
What positives are essential fats and omega 3/6 associated with?
Help with optimal cell growth and renewal
Help keep your heart healthy
Help brain and nerve cells function well
Provide vitamins
Help keep your skin and hair healthy
Keep you feeling full for longer
37
33
33
31
31
17
42
49
53
36
36
12
Essential fats%
Omega 3 and 6%
What Essential fats & Omega 3 & 6 does to the body – Wave 2Q - Which of these things do you think essential fats & Omega 3 & 6 can do to the body?
Global Average
Essential fats and omegas are seen to have a range of benefits but at low levels
[drive:directory path\filename.ppt 22 ]
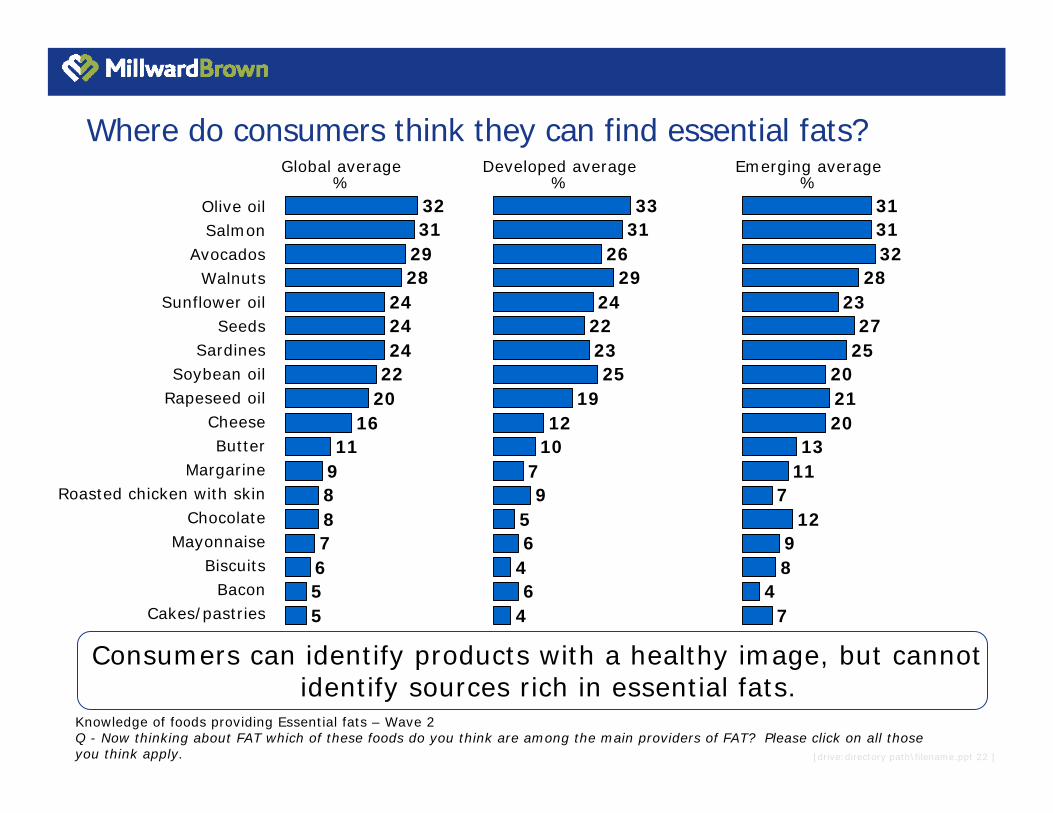
Where do consumers think they can find essential fats?
Knowledge of foods providing Essential fats – Wave 2Q - Now thinking about FAT which of these foods do you think are among the main providers of FAT? Please click on all those you think apply.
Olive oilSalmon
AvocadosWalnuts
Sunflower oilSeeds
SardinesSoybean oil
Rapeseed oilCheeseButter
MargarineRoasted chicken with skin
ChocolateMayonnaise
BiscuitsBacon
Cakes/pastries
Global average%
3331
2629
24222325
1912
1079
56
46
4
Developed average%
313132
2823
2725
202120
1311
712
98
47
Emerging average%
3231
2928
242424
2220
1611
9887655
Consumers can identify products with a healthy image, but cannotidentify sources rich in essential fats.
[drive:directory path\filename.ppt 23 ]
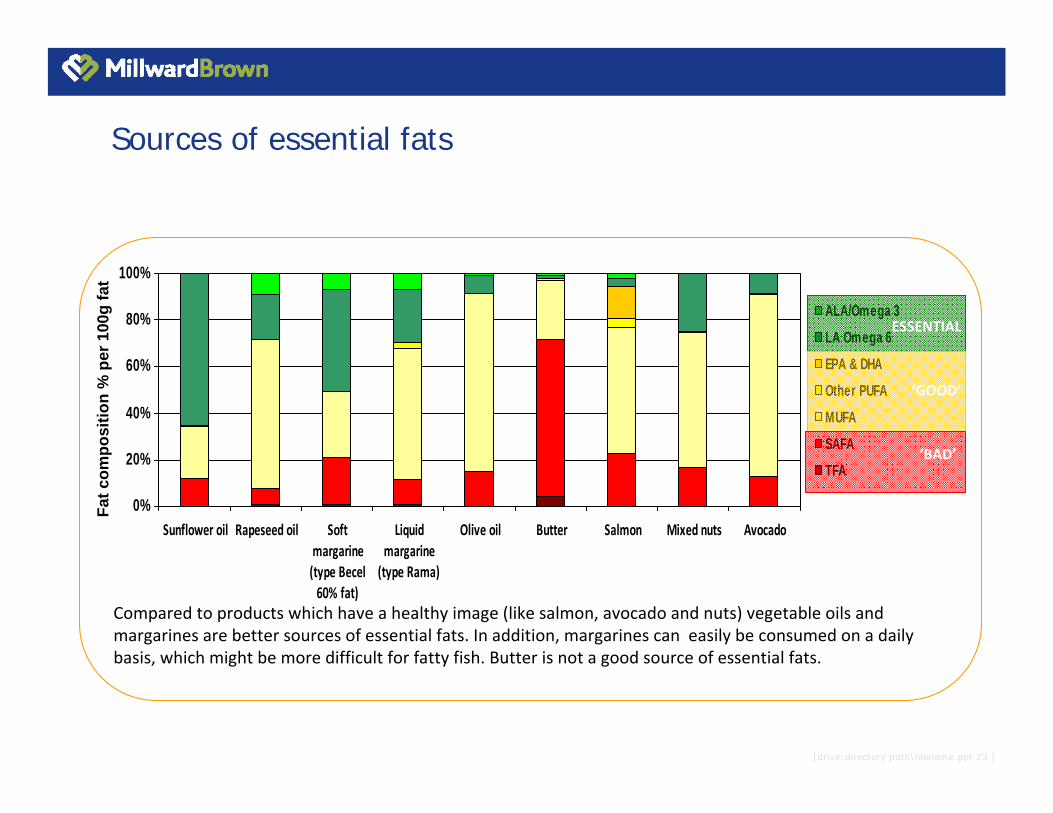
0%
20%
40%
60%
80%
100%
Sunflower oil Rapeseed oil Softmargarine(type Becel60% fat)
Liquidmargarine(type Rama)
Olive oil Butter Salmon Mixed nuts Avocado
ALA/Omega 3LA Omega 6EPA & DHAOther PUFAMUFASAFATFA
Sources of essential fats
Compared to products which have a healthy image (like salmon, avocado and nuts) vegetable oils and margarines are better sources of essential fats. In addition, margarines can easily be consumed on a daily basis, which might be more difficult for fatty fish. Butter is not a good source of essential fats.
Fat c
ompo
sitio
n %
per
100
g fa
t
ESSENTIAL
‘GOOD’
‘BAD’

Discussion and conclusions

[drive:directory path\filename.ppt 25 ]
Discussion points – possible weaknesses of the research
•Complicated subject matter, resulting in challenging questions being asked of consumers
•Different methodologies have been used (phone, internet, face to face) to best match the needs of the country (should cause less concern given the factual nature of the questions)
•For a Global study, Asia is under-represented given its large population
•Wave 1 had no quotas to make the sample representative
[drive:directory path\filename.ppt 26 ]
Discussion points – strengths of the research
• Large - one the largest studies on fat to date - (n= 3200)
• Recent - wave 2 research being conducted within the last 6 months, and wave 1 just over a year ago
• Coverage of large range of geographies; there is a good representation of both developed and emerging markets and all continents represented to some degree
• Carefully constructed questionnaire to ensure fats are considered in the context of other nutrients and in the context of a balanced diet. Questions are carefully phrased to ensure, while complex, they can be understood and responded to by consumers
• The methodology was considered on a country by country basis to ensure it reached a broad population. Where internet research was conducted, the online panels were carefully chosen to ensure people couldn’t self select for the interview

[drive:directory path\filename.ppt 27 ]
• 59% of consumers do NOT think that fat is part of a healthy diet;
• 65% of consumers think that a low fat diet is a healthy diet;
• 38% of consumers claim to avoid foods containing fats
• In the minds of consumers, vitamins, minerals, proteins, fibre and carbohydrates are needed to have a healthy balanced diet, but not fat.
Summary - Fat as a part of a healthy balanced diet
[drive:directory path\filename.ppt 28 ]
• Consumers, have heard of many different types of fats (especially in developed markets) but their knowledge is low. They typically know that omega 3 is ‘good’ and saturated fats are ‘bad’;
• Only 54% know that the essential fats omega 3 and omega 6 are fats!
• The word ‘fat’ is associated with saturated fats not essential fats
• Fat is mainly loaded with negative health attributes
• Consumers can identify products with a healthy image, but cannotidentify sources rich in essential fats.
Summary - Different types of fat; Where can you find them and what do they do?
[drive:directory path\filename.ppt 29 ]
Conclusion
Many people don’t know that fat is a part of a healthy diet.
Even in developed markets there is still a need to educate people that fat is part of a healthy diet.
As it is clear that people are confused, the messaging needs to be simple.

[drive:directory path\filename.ppt 30 ]

AppendixAppendix
[drive:directory path\filename.ppt 32 ]
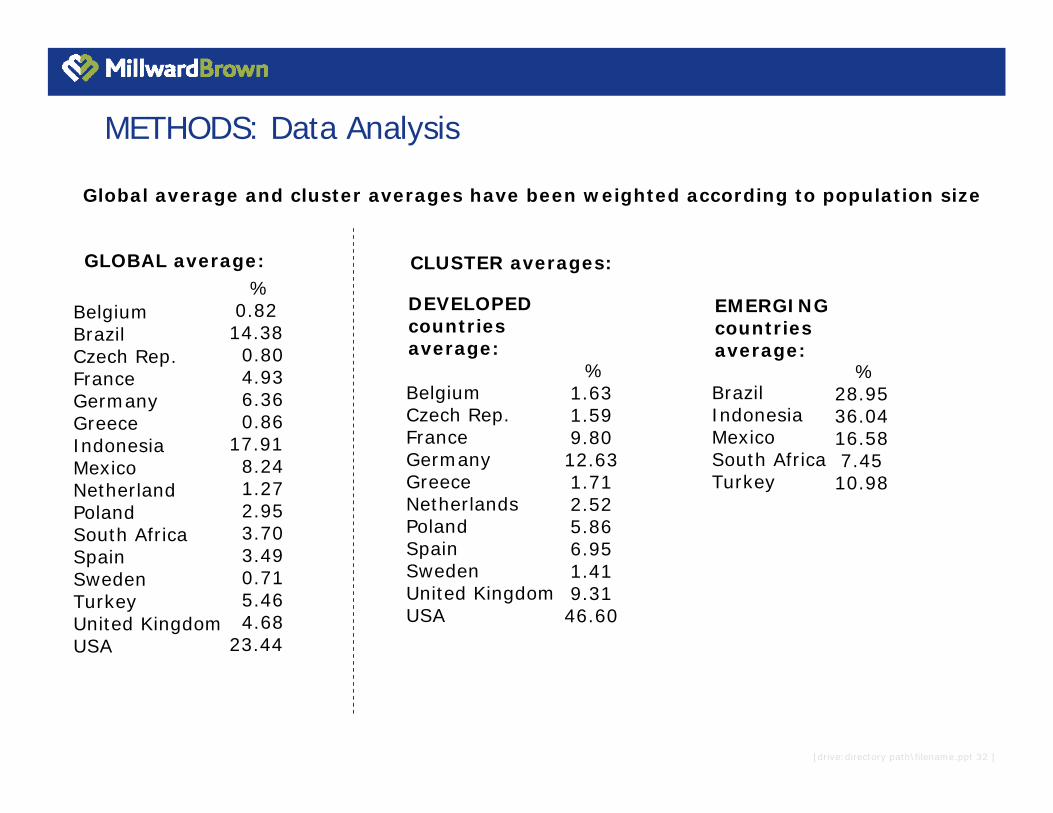
METHODS: Data Analysis
BelgiumBrazilCzech Rep.FranceGermanyGreeceIndonesiaMexicoNetherlandPolandSouth AfricaSpainSwedenTurkeyUnited KingdomUSA
% 0.8214.380.804.936.360.86
17.918.241.272.953.703.490.715.464.68
23.44
Global average and cluster averages have been weighted according to population size
GLOBAL average:
DEVELOPED countries average:
EMERGING countries average:
CLUSTER averages:
BrazilIndonesiaMexicoSouth AfricaTurkey
BelgiumCzech Rep.FranceGermanyGreeceNetherlandsPolandSpainSwedenUnited KingdomUSA
% 1.631.599.8012.631.712.525.866.951.419.3146.60
% 28.9536.0416.587.4510.98
[drive:directory path\filename.ppt 33 ]
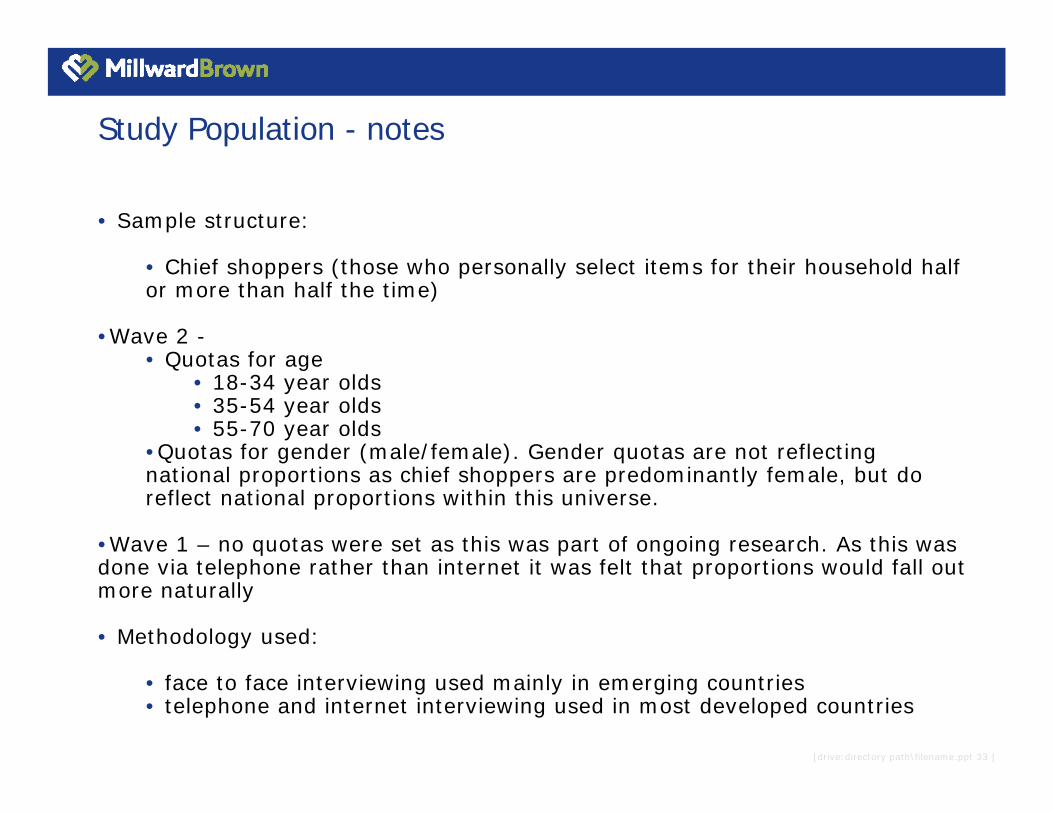
Study Population - notes
• Sample structure:
• Chief shoppers (those who personally select items for their household half or more than half the time)
•Wave 2 -• Quotas for age
• 18-34 year olds• 35-54 year olds • 55-70 year olds
•Quotas for gender (male/female). Gender quotas are not reflecting national proportions as chief shoppers are predominantly female, but do reflect national proportions within this universe.
•Wave 1 – no quotas were set as this was part of ongoing research. As this was done via telephone rather than internet it was felt that proportions would fall out more naturally
• Methodology used:
• face to face interviewing used mainly in emerging countries • telephone and internet interviewing used in most developed countries
[drive:directory path\filename.ppt 34 ]
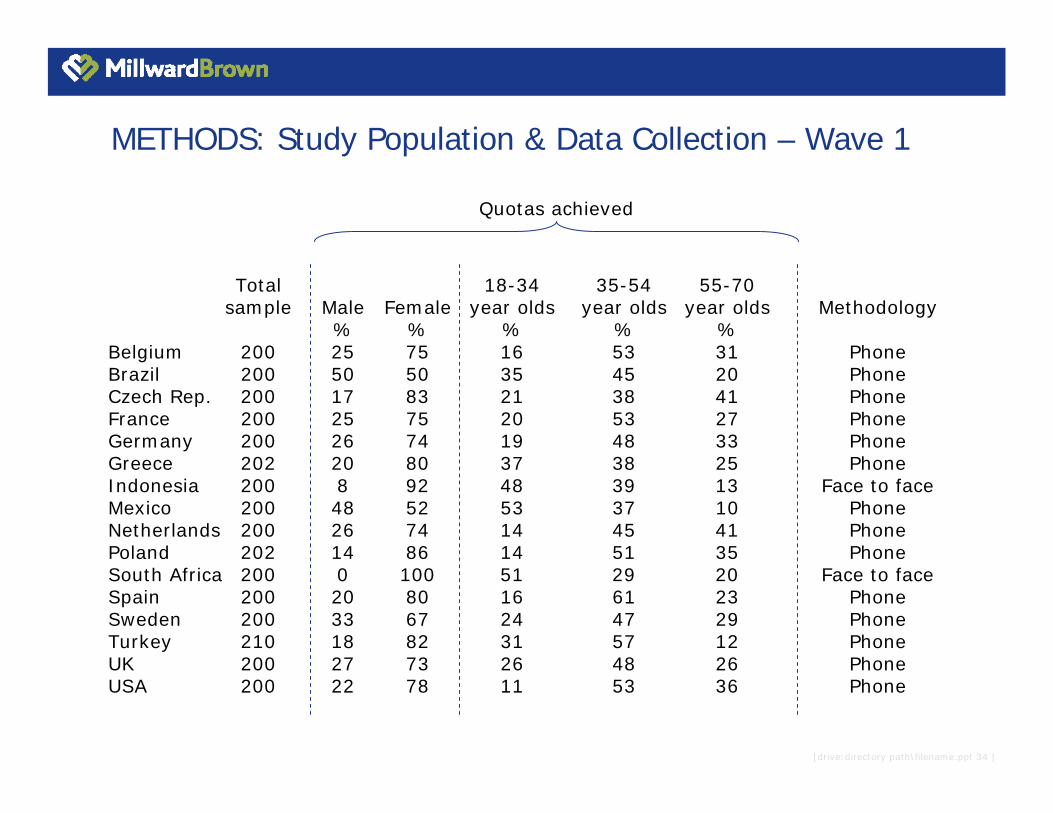
METHODS: Study Population & Data Collection – Wave 1
Total 18-34 35-54 55-70sample Male Female year olds year olds year olds Methodology
% % % % %Belgium 200 25 75 16 53 31 PhoneBrazil 200 50 50 35 45 20 PhoneCzech Rep. 200 17 83 21 38 41 PhoneFrance 200 25 75 20 53 27 PhoneGermany 200 26 74 19 48 33 PhoneGreece 202 20 80 37 38 25 PhoneIndonesia 200 8 92 48 39 13 Face to faceMexico 200 48 52 53 37 10 PhoneNetherlands 200 26 74 14 45 41 PhonePoland 202 14 86 14 51 35 PhoneSouth Africa 200 0 100 51 29 20 Face to faceSpain 200 20 80 16 61 23 PhoneSweden 200 33 67 24 47 29 PhoneTurkey 210 18 82 31 57 12 PhoneUK 200 27 73 26 48 26 PhoneUSA 200 22 78 11 53 36 Phone
Quotas achieved
[drive:directory path\filename.ppt 35 ]
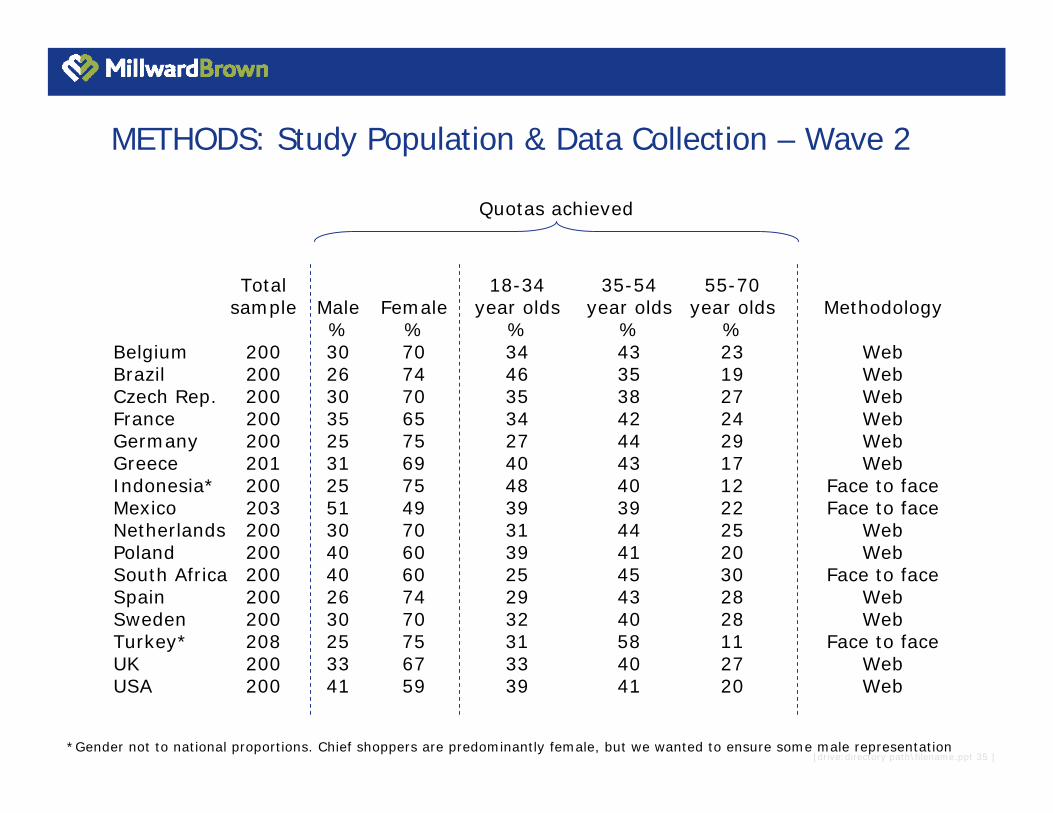
METHODS: Study Population & Data Collection – Wave 2
Total 18-34 35-54 55-70sample Male Female year olds year olds year olds Methodology
% % % % %Belgium 200 30 70 34 43 23 WebBrazil 200 26 74 46 35 19 WebCzech Rep. 200 30 70 35 38 27 WebFrance 200 35 65 34 42 24 WebGermany 200 25 75 27 44 29 WebGreece 201 31 69 40 43 17 WebIndonesia* 200 25 75 48 40 12 Face to faceMexico 203 51 49 39 39 22 Face to faceNetherlands 200 30 70 31 44 25 WebPoland 200 40 60 39 41 20 WebSouth Africa 200 40 60 25 45 30 Face to faceSpain 200 26 74 29 43 28 WebSweden 200 30 70 32 40 28 WebTurkey* 208 25 75 31 58 11 Face to faceUK 200 33 67 33 40 27 WebUSA 200 41 59 39 41 20 Web
Quotas achieved
*Gender not to national proportions. Chief shoppers are predominantly female, but we wanted to ensure some male representation
[drive:directory path\filename.ppt 36 ]
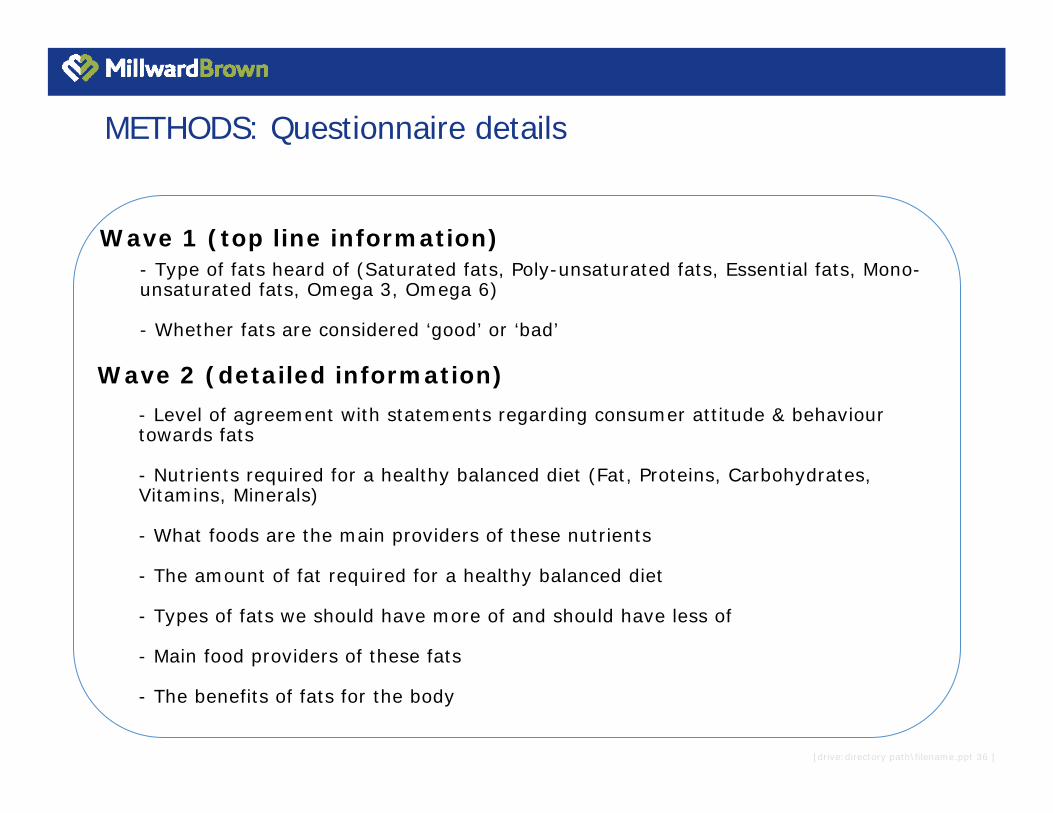
METHODS: Questionnaire details
Wave 1 (top line information)
- Level of agreement with statements regarding consumer attitude & behaviour towards fats
- Nutrients required for a healthy balanced diet (Fat, Proteins, Carbohydrates, Vitamins, Minerals)
- What foods are the main providers of these nutrients
- The amount of fat required for a healthy balanced diet
- Types of fats we should have more of and should have less of
- Main food providers of these fats
- The benefits of fats for the body
- Type of fats heard of (Saturated fats, Poly-unsaturated fats, Essential fats, Mono-unsaturated fats, Omega 3, Omega 6)
- Whether fats are considered ‘good’ or ‘bad’
Wave 2 (detailed information)

[drive:directory path\filename.ppt 37 ]
Significance of data
Single country Global Developed Emergingsample average average average
% -/+ -/+ -/+ -/+0 – 10 3 1 2 211 – 20 5 2 3 321 – 30 6 2 3 331 – 40 7 2 3 341 – 50 7 3 4 451 – 60 7 3 4 461 – 70 7 2 3 371 – 80 6 2 3 381 – 90 5 2 3 391 – 100 3 1 2 2
In using a sample to represent a total population there is an acceptance that there is variability around the actual % seen. This table guides us as to where the result falls around the actual reported % at 95% confidence.
For example, in South Africa 13% are aware of Transfats. This means that the true result could be anywhere between 8% and 18%