Embed Size (px)
Citation preview

Peppermint and Sled: Tools for Evaluating SMP Systems based on IA-64 (IPF) Processors Sujoy Basu, Sumit Roy, Raj Kumar, Tom Fisher1, Bruce E. Blaho1 Client Media and Systems Laboratory HP Laboratories Palo Alto HPL-2002-14 January 25th , 2002* E-mail: [email protected] IA64, architecture, simulation, Itanium, McKinley
In this paper, we describe Peppermint and Sled: tools developed for evaluations of computer systems based on IA-64 processors. Sled generates trace from applications running on IA-64 processors, while Peppermint models the complete system using cycle-accurate, trace-driven simulation Peppermint and Sled allow us to perform a trace-based evaluation of 4 applications running on SMP systems based on Itanium and McKinley processors. We find that the improvement in IPC of McKinley relative to Itanium ranges from 7% to over 100% for our different applications. The improvement can be attributed to a variety of factors. These range from the availability of additional functional units and issue ports in the McKinley processor to our assumption of a better memory system. While the improvement in performance remains valid in SMP systems in some cases, higher contention for system bus and memory reduces the performance gain in other cases. Increasing the system bus bandwidth and size of queues for pending requests in the memory controller are identified as first steps for optimizing SMP performance.
* Internal Accession Date Only Approved for External Publication 1 Technical Computing Division, Hewlett-Packard, Fort Collins, CO, 80528 Copyright IEEE. To be published in and presented at the 16th International Parallel and Distributed Processing Symposium (IPDPS) 15-19 April 2002, Ft. Lauderdale, Florida

Peppermint and Sled: Tools for Evaluating SMP Systems based on IA-64(IPF) Processors
Sujoy Basu�, Sumit Roy and Raj KumarHewlett-Packard Laboratories
Hewlett-Packard Company1501 Page Mill Rd.
Palo Alto, CA 94304
Tom Fisher and Bruce E. BlahoTechnical Computing Division
Hewlett-Packard Company3404 E Harmony Rd.
Fort Collins, CO 80528
1 Introduction
In this paper, we describe Peppermint and Sled: tools developed for cycle-accurate, trace-driven simulation ofapplications running on IA-64 processors, with the possibility of doing execution-driven simulations in future. Withthe introduction of Itanium processor[11], it has become necessary for system architects to understand the performanceof applications developed for the IA-64 family of processors. They would like to spend their time on those aspects ofthe design where the maximum impact on performance could be realized. Some of the different scenarios in which weenvisage the use of Peppermint and Sled are illustrated in Figure 1.
Identify functionsor whole
applications to beanalyzed
Use Sled togenerate trace by
runningapplication
Edit configuration fileof Peppermint tovary the IA-64
system architectureunder study
Run Peppermintwith the generated
trace as input
Identifyarchitectural
improvements
Edit and compilesource code of
Peppermint to refinefurther the system
under study
Optimizeapplication
Figure 1. Possible uses for Peppermint and Sled
The design of our simulator Peppermint is influenced by the complex, real-world technical applications we needto analyze. The tools will be used primarily to study long traces captured from such applications, and simulate thetraces by varying various parameters of system components like the memory controller. However as shown in ourexperiments in this paper, Peppermint can be used to explore other aspects of the design space. The motivationfor this project has been the development of a tool set that can be used for fast exploration of the design spacefor systems built around IA-64 processors. Detailed performance simulations, such as those possible using flexiblesimulation environments like [3], can be very slow. Because of our requirement for fast simulations, we have chosento selectively model system components. We might iteratively refine the model later if higher accuracy is required atthe cost of slower simulation speed.
�contact at sujoy [email protected]
1

Peppermint currently models one or more IA-64 processor with three levels of cache, a system bus, memory con-troller and DRAM chips. All these components are parameterized. Peppermint uses a configuration file in which theseparameters are specified. The focus of this paper is to give the maximum amount of information about the details ofour implementation. Since we are selectively modeling details of the system architecture, we have chosen to highlightthese details. Then we give the reader some idea about the basic experiments that can be conducted using our tools.
Although the target architecture for Peppermint is an IA-64 system, only the generation of IA-64 traces havebeen done on Itanium systems using Sled . Peppermint itself has been developed and tested primarily on PA-RISCcomputers running HP-UX and IA-32 computers running Linux. It takes the trace and a configuration file as input.The actual application or the libraries used by it on the IA-64 system need not be provided to Peppermint since Sledcaptures all the necessary information in the trace.
This paper is organized as follows. Section 2 describes how Peppermint models different components of the systemarchitecture, and our ongoing work on validation. That is followed by Section 3, which describes in detail how Sled, the tool for capturing IA-64 application traces, is implemented and performs. Then the performance of Itanium andMcKinley are compared in Section 4. Finally we present our conclusions in Section 5.
2 Architectural Model
In this section, we describe the details of the system architecture modeled by Peppermint. In case the reader isinterested in extending the model, experience in writing architectural models for Augmint [9] will be required.
2.1 Processor Architecture
2.1.1 Instruction Dispersal
Peppermint parameterizes the issue width of the processor. For both Itanium and McKinley, this number is 2. Thismeans that at most 2 instruction bundles will be available for dispersal every cycle in the dispersal window. Exper-iments can be conducted by varying this parameter in Peppermint. Dispersal is achieved with a decoupling buffer,which decouples the front end of the pipeline from the rest of the pipeline. The front end is responsible for fetchinginstructions from instruction cache into the decoupling buffer, while the back end disperses them. Peppermint has oneprimary event corresponding to the front end, and another primary event corresponding to the back end. Both of theseevents are scheduled on every clock cycle.
The event corresponding to the front end reads entries from the trace file, and schedules corresponding instructionfetches. The number of such instruction fetches in a cycle may be limited, of course, by factors like available portson the I-cache and number of outstanding cache misses. These instruction fetch events will in some subsequent clockcycle feed the corresponding instruction bundle into the decoupling buffer. Here perfect branch prediction is assumed.The model can be extended to introduce delay due to branch mispredictions.
The event corresponding to the back end starts by checking that the dispersal window is filled with bundles. If not,it shifts the next bundles in the instruction stream from the decoupling buffer into the dispersal window. This succeedsunless the bundle is not available due to cache miss. Next it tries to issue all the instructions in the dispersal windowto their issue ports within the same cycle. To do that, the instruction bundle is decoded using functions from a libraryused by linker and other system tools. Next, rules available in [7] are used to determine which issue port can be givenan instruction. As soon as an instruction fails to find a free issue port, dispersal stops for that cycle. All instructionsin sequential order preceding that instruction have been dispersed that cycle. Dispersal is said to split-issue at thatinstruction. Also, an explicit stop-bit might be encoded in the bundle, indicating split-issue at an instruction. Otherspecial cases for Itanium that cause split-issue are implemented. The reader is referred to [7] for these details. Anotherimportant cause for split-issue that we implement is an instruction waiting for a source operand register that is thetarget of a load from memory.
2.1.2 Predication
Predicated instructions, for which the predicate register contains 0, must be squashed in the pipeline without updatingthe architectural state. Specifically, Peppermint cannot mark the target register of such an instruction busy, forcingsome instruction to wait for the register to become available. This is currently modeled when the predicated instruction
2

is a load or store. Peppermint uses the value of the predicate register recorded by Sled in the load or store trace entryto determine whether the load or store needs to be issued to the memory system, and also whether the target registerof a load needs to be marked busy. This is quite good as a first-order approximation since loads can have high latencydue to cache misses. If higher accuracy of simulation is desired, the value of predicate register has to be recorded inthe trace for all instructions; then Peppermint can ensure that other predicated-off instructions do not mark their targetregister busy.
2.1.3 Data Speculation
Data speculation is a technique that allows the compiler to schedule loads ahead of time. In this case, though, thespeculation arises from the fact that the load has been scheduled prior to stores that actually precede it in programorder and can potentially write into the memory location from which the load will be reading. Compile-time analysisfor ruling out such overlapping stores and loads is difficult when dynamic data structures (code with pointers) precludestatic analysis. The IA-64 architecture supports such data speculation by introducing advance load instructions. Anadvance load behaves like a normal load in accessing memory. However, in addition to that, the target register, loadaddress and number of bytes being loaded are entered in the Advance Load Address Table (ALAT). Every storeinstruction checks the ALAT for entries with overlapping addresses. Such entries are invalidated. At the originallocation of the load in the instruction stream, a speculation check (chk.a) instruction is placed. When executed, itchecks the ALAT for the entry inserted by the corresponding advance load. If the entry is present, speculation hassucceeded. Otherwise it has failed, and a branch is taken to fix-up code.
Peppermint currently does not model the ALAT. However it does issue advance loads to memory, which is whatthe architecture specifies. Notice also that during the capture of a trace by Sled , if the application has any failedspeculation, it will branch to fix-up code. The execution of that fix-up code will get recorded in the trace. So modelingthe ALAT is not necessary unless one is experimenting with the design of the ALAT. In that case, however, one mustuse Peppermint in execution-driven mode so that the branch to fix-up code is only taken when the modeled ALATindicates failure of speculation.
2.1.4 Control Speculation
Control speculation allows the compiler to minimize the stall due to load instructions that suffer large latencies result-ing from cache misses. The compiler can speculatively schedule such loads far ahead of their normal position in theinstruction stream, even before intervening branch instructions. This indicates the load should be executed condition-ally depending on the outcome of the branches. For such speculative loads, exceptions such as page faults are deferreduntil the outcome of the speculated branches are known. Peppermint currently does not model exceptions. All loadsare sent to the memory hierarchy. Like data speculation, it can be added to the model. However Peppermint must beused in execution-driven mode, as explained in Section 2.1.3.
2.1.5 Register Remapping
In the IA-64 architecture, instructions dispersed to functional units, must undergo register remapping before beingable to access the register file. There are 2 features of the IA-64 Instruction Set Architecture that require remappingof register names: register stacking and register rotation. Register stacking ensures that each active frame on theprocedure call stack of a program can use its own register frame consisting of potentially all physical registers in thegeneral register file. Hardware transparently manages the register file in two ways. It remaps the register number inthe instruction to the correct physical register. It also spills and restores registers between the general register file andbacking store in memory. Register rotation enhances instruction-level parallelism; it allows overlapped execution ofloop iterations, known as software pipelining. This is done without requiring the compiler to unroll the loop bodywhen generating code. This is possible since the hardware manages counters called rotating register base (RRB) thatcan remap the register number in an instruction to different physical registers in different iterations.
Register remapping is handled in both Peppermint and Sled. Firstly, Sled reads the Current Frame Marker (CFM)register to extract the parameters governing stacking and rotation. Then it does the appropriate modulo arithmeticto identify the physical register to be read. Since the register is spilled to the backing store during trace generation,the correct location in memory is then read. Similarly, Peppermint models the Current Frame Marker and relatedregisters, and simulates the effect of all instructions that affect them. Examples of such instructions are alloc, br.call,
3

brl.call, br.ret, cover and clrrrb . Furthermore, it also implements the remapping function. However it diverges fromthe hardware in assuming a very large physical register set. So memory traffic resulting from spilling or restoringregisters is not simulated.
2.1.6 Cache Hierarchy
Peppermint simulates all three levels of cache present in the Itanium processor family. The simulator is highly param-eterized, and the cache configuration can be easily modified to explore the design space with simulations. Parametersthat could be changed for each cache include the size, line size, associativity, line replacement policy, number of ports,access latency and number of outstanding misses. Also caches can be turned off selectively to alter the depth of thecache hierarchy. Instantiating an additional level of cache and adding it to the configuration file is quite simple. Cur-rently Peppermint makes some simplifying assumptions regarding access latency. Exceptional cases are not treatedseparately. Instead all integer loads have a latency of 2, 6 or 21 cycles depending on whether they hit in the Itanium’sL1D, L2 or L3 cache respectively. Instruction fetches have a latency of 1, 5 or 20 cycles depending on whether theyhit in the Itanium’s L1I, L2 or L3 cache respectively. Floating-point loads bypass the first level of cache, and incur alatency of 9 or 24 cycles, depending on whether there is a hit in L2 or L3 cache. All types of loads that miss in the L3cache access memory by initiating a transaction on the system bus. The details are described in the following sections.Peppermint also supports a limit on the number of outstanding misses for each level of the cache hierarchy.
Changing the values for the different parameters simply requires modification of these values in the configurationfile. However treating special cases separately, that are not already handled in Peppermint, will require addition ofcode to dynamically override the latency when the exception occurs. Since Peppermint decodes each instruction, theframework is present for such code to be added easily.
2.2 System Bus
We simulate a pipelined, split-transaction system bus. The frequency is parameterized. Arbitration is done inround-robin order among the requesting caches. The arbitration algorithm can be called by higher-priority I/O devices.However the current model does not include such devices.
2.3 Memory Controller
We have parameterized the memory controller so that the bits from the physical address to be used for row address,column address and bank can be specified in the configuration file. This allows us to study different memory configu-rations. Other parameters that can be varied include the number of open pages and size of outstanding read and writequeues in the memory controller. Scheduling policies for memory accesses can also be studied. We schedule readswith a higher priority than writes, with some exceptions such as the presence of overlapping writes. However a wholerange of policies can be studied by writing the appropriate function for selecting among the different queues for reads,writes, precharge and activation. Additional queues can also be defined if needed. However since we do not modelthe internal logic of the memory controller, we assume a constant time overhead in addition to the waiting time in thequeues. This overhead is parameterized, and memory benchmarks could possibly be used to approximate the valuefor a computer system. For DRAM, important parameters available for DRAM data sheets are parameterized. Varioussituations such as precharge and hit on an open page are modeled. Accordingly, the latency seen by each memoryaccess varies.
2.4 Performance and Validation
The cache system of Peppermint has been validated against Dinero [8]. Preliminary validation has indicated that themargin of error is within 20%. Further detailed validation is planned using the McKinley processor. The throughputof Peppermint will depend on the details being simulated. Table 1 gives an idea of how the throughput of Peppermintvaries with the benchmark used and with the length of the trace. Unlike [13], we do not use sampling. All instructionsare simulated. Hence our throughput numbers cannot be directly compared to theirs.
4
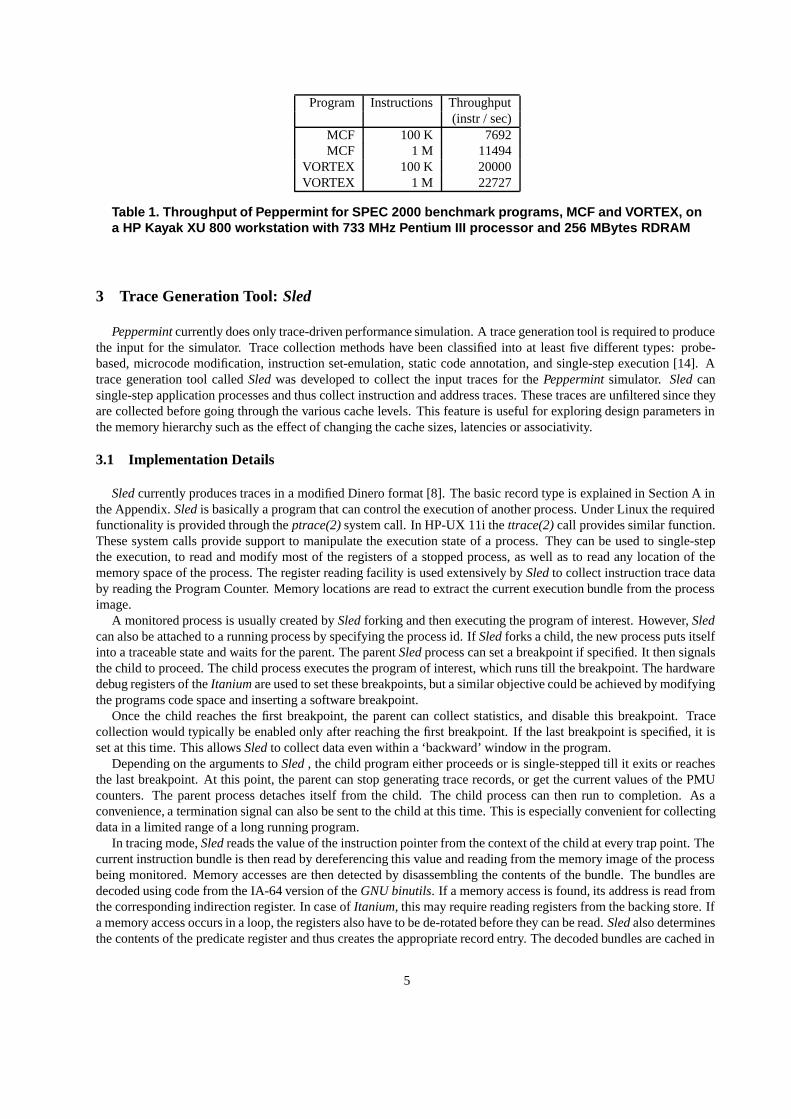
Program Instructions Throughput(instr / sec)
MCF 100 K 7692MCF 1 M 11494
VORTEX 100 K 20000VORTEX 1 M 22727
Table 1. Throughput of Peppermint for SPEC 2000 benchmark programs, MCF and VORTEX, ona HP Kayak XU 800 workstation with 733 MHz Pentium III processor and 256 MBytes RDRAM
3 Trace Generation Tool: Sled
Peppermint currently does only trace-driven performance simulation. A trace generation tool is required to producethe input for the simulator. Trace collection methods have been classified into at least five different types: probe-based, microcode modification, instruction set-emulation, static code annotation, and single-step execution [14]. Atrace generation tool called Sled was developed to collect the input traces for the Peppermint simulator. Sled cansingle-step application processes and thus collect instruction and address traces. These traces are unfiltered since theyare collected before going through the various cache levels. This feature is useful for exploring design parameters inthe memory hierarchy such as the effect of changing the cache sizes, latencies or associativity.
3.1 Implementation Details
Sled currently produces traces in a modified Dinero format [8]. The basic record type is explained in Section A inthe Appendix. Sled is basically a program that can control the execution of another process. Under Linux the requiredfunctionality is provided through the ptrace(2) system call. In HP-UX 11i the ttrace(2) call provides similar function.These system calls provide support to manipulate the execution state of a process. They can be used to single-stepthe execution, to read and modify most of the registers of a stopped process, as well as to read any location of thememory space of the process. The register reading facility is used extensively by Sled to collect instruction trace databy reading the Program Counter. Memory locations are read to extract the current execution bundle from the processimage.
A monitored process is usually created by Sled forking and then executing the program of interest. However, Sledcan also be attached to a running process by specifying the process id. If Sled forks a child, the new process puts itselfinto a traceable state and waits for the parent. The parent Sled process can set a breakpoint if specified. It then signalsthe child to proceed. The child process executes the program of interest, which runs till the breakpoint. The hardwaredebug registers of the Itanium are used to set these breakpoints, but a similar objective could be achieved by modifyingthe programs code space and inserting a software breakpoint.
Once the child reaches the first breakpoint, the parent can collect statistics, and disable this breakpoint. Tracecollection would typically be enabled only after reaching the first breakpoint. If the last breakpoint is specified, it isset at this time. This allows Sled to collect data even within a ‘backward’ window in the program.
Depending on the arguments to Sled , the child program either proceeds or is single-stepped till it exits or reachesthe last breakpoint. At this point, the parent can stop generating trace records, or get the current values of the PMUcounters. The parent process detaches itself from the child. The child process can then run to completion. As aconvenience, a termination signal can also be sent to the child at this time. This is especially convenient for collectingdata in a limited range of a long running program.
In tracing mode, Sled reads the value of the instruction pointer from the context of the child at every trap point. Thecurrent instruction bundle is then read by dereferencing this value and reading from the memory image of the processbeing monitored. Memory accesses are then detected by disassembling the contents of the bundle. The bundles aredecoded using code from the IA-64 version of the GNU binutils. If a memory access is found, its address is read fromthe corresponding indirection register. In case of Itanium, this may require reading registers from the backing store. Ifa memory access occurs in a loop, the registers also have to be de-rotated before they can be read. Sled also determinesthe contents of the predicate register and thus creates the appropriate record entry. The decoded bundles are cached in
5

a direct mapped buffer. This saves the cost of system calls for the next time that these instruction bundles would haveto be read from the memory image of the process.
In addition to collecting address and instruction traces, Sled can also be used as a performance measurement tool.It uses the perfmonctl system call available in the Linux IA-64 kernel to access the performance monitoring registersavailable on the Itanium. Sled provides the capability to collect detailed statistics around any window of execution of aprogram. One extension planned for Sled is the ability to reset breakpoints, so that one can accumulate the performancedata for a region of code that get executed repeatedly. This overcomes one fundamental limitation in the Itaniumimplementation of the Performance Monitoring Unit. Specifically, address range based performance monitoring is notavailable for all possible event types, for example CPU CYCLES [6].
3.2 Sled Performance
One metric proposed for evaluating the quality of a trace collection tool is the slowdown compared to a full speedexecution of the same piece of code [14]. The slowdown reported for single-step based trace collection cover a widerange, from 100 [1], 1000 [4], to 10,000 [5]. As shown in Table 2, the slowdown as seen on a 800 MHz dual Itaniumsystem lies towards the low end of reported figures. p
Program Instr Full Trace SlowdownSpeed Enabled
(Millions) (sec) (sec)MCF 3.17 1.08 59.23 60
VORTEX 1.26 0.21 41.7 200
Table 2. Trace collection slowdown for SPEC 2000 benchmark programs, MCF and VORTEX
Trace collection is more expensive than merely single-stepping the processor, since system calls are required toread the instruction pointer, the bundles, and in case of a memory access, the contents of the indirection register, thepredicate register and the backing store. However, the bundle cache performs fairly well as seen by the data in Table 3.It is can be seen that the single stepping cost and trace collection cost both scale linearly with the length of the tracecollected, and that the overhead for trace collection lies between 20 - 30 % of the execution time.
Instruction Count Single step Trace collect(sec) (sec)
1 Million 23.49 28.4410 Million 211.14 270.38
100 Million 2174.00 2691.59
Table 3. Single stepping and Trace collection time for SPEC 2000 benchmark program, MCF
4 Comparison of Itanium and McKinley
Next we present results from our experimental evaluation of systems based on Itanium and McKinley processors.Systems based on Itanium and McKinley processors differ not only in the processor, but also in the system bus andmemory. Peppermint allows us to explore the design space by doing controlled experiments. We compare 2 systemsbased on these 2 processors, with typical configurations for system bus and memory, to get an estimate of the perfor-mance improvement for different applications between these 2 systems. We also vary design parameters to get a senseof what contributes to the difference in performance. The differences between the systems compared are presentedin Table 4. More detailed comparison can be made by comparing the configuration files for Itanium and McKinleypresented in Section B in the Appendix.
The comparison is done using traces captured from 4 applications. To capture a trace from an application, first thesource code of the application is examined to identify the code fragment which initializes data structures. A function is
6

Parameter Itanium McKinley
Processor Frequency 800 MHz 900 MHzThird-level Cache 4 MB 3 MB
System-bus Frequency 133 MHz 200 MHzSystem-bus Width 64 bits 128 bits
Double Data Rate DRAM No Yes
Table 4. Some Difference in system parameters between the 2 systems
Application Description
Mcf Combinatorial optimization: network simplex algorithmVortex Lookups, insertions and deletions in object-oriented
database; the benchmark does not have any database I/OGap System for computational discrete algebraTranscoder Down-scale transcoding of compressed video
optimized for speed and power
Table 5. Applications Used in Our Experiments
identified which is called only after this initialization code. Next the application is run under the control of Sled , andtracing is started when the identified function is reached. This ensures that initialization code is skipped. To ensurethat cold misses in the caches are a small part of the whole execution, we captured traces containing 100 millioninstructions. Preliminary experiments had indicated that increasing the trace length increased metrics like Instructionsper cycle (IPC). However they leveled off before 100 million instructions. However this should be a function ofcache size. Increasing the cache size far beyond what we used might require further increase in trace length. The 4applications used in this study are described in Table 5. For the applications from the SPEC CPU2000 suite [2], thereference data set was used as input. The remaining application, Transcoder, is described in [10, 12].
4.1 Basic Results
In the first set of experiments shown in Figure 2, we compare the execution of Itanium and McKinley based systemscompared in Table 4. The metrics used are instructions per cycle (IPC) and instructions per second (IPS). Each lineshows the corresponding metric for McKinley normalized to that of Itanium. The results show that for the applicationtraces used, the performance improvement of McKinley over Itanium can range from 7% to over 100%, when compar-ing IPC. With IPS, the results are even better, since the frequency of the McKinley processor used in our experimentsis higher than that of Itanium.
In the second set of experiments shown in Figure 3, we take the total execution cycles of each application, normal-ized to the longest running application, and plot a bar graph. Each bar shows 5 components. The Busy componentcounts cycles in which at least 1 instruction is dispersed by the front end of the processor pipeline. The remainingcomponents measure stalls in instruction dispersal. They are attributed to instruction fetch (Ifetch) when the stallresults from the decoupling buffer being empty. If the stall occurs because an issue port cannot be assigned to theinstruction, it is attributed to functional units (Funit). If a data dependency forces instruction dispersal to be stalled, itis accounted for in the DataDep component. Finally the Cache component account for stalls reached when loads orstores cannot be issued due to the limit on outstanding misses in the caches.
On the X-axis, each bar has a label. The first character indicates the application, which can be Gap (G), Transcoder(T), Mcf (M) or Vortex (V). The second character indicates whether the system simulated is an Uniprocessor (u)or Multiprocessor (m), specifically a 2-processor SMP. The last character indicates Itanium (I) or McKinley (M),indicating the system parameters used, as shown in Table 4.
Both gap and transcoder are quite compute-intensive and most of their execution time can be attributed to Busycycles in which 1 or more instructions are issued. The FUstall component of transcoder, which represents stall due to
7

0
0.5
1
1.5
2
2.5
gap mcf transcoder vortex
Normalized IPC
Normalized IPS
Figure 2. Relative IPC and IPS
unavailability of functional units, decreases from 13% for Itanium to 8% for McKinley. This is due to the increasednumber of functional units in Mckinley. This increases the IPC of transcoder by 7%. For gap, the improvement inexecution time from Itanium to Mckinley can be attributed to both DDstall and IFstall, stalls due to data dependenciesand instruction fetches respectively. The larger size and line size of the second-level cache in Mckinley benefits gap. Italso benefits significantly from the better memory system of Mckinley (double-data rate and higher frequency), whichimplies lower latency for third-level cache misses. Its IPC increases by 11%. For the dual-processor configurations,both applications maintain their performance improvement from Itanium to Mckinley.
The uniprocessor execution of mcf on Itanium and Mckinley show a huge difference in performance. This is becausethe execution of mcf on Itanium is dominated by data dependency stalls (DDstall). It accounts for 86% of the executiontime. Mckinley cuts down this component to 75%. This improves the IPC of mcf by 100%. This is despite the factthat Mckinley has 3 MBytes of third-level cache, compared to 4 MBytes in Itanium. The primary contributor forthis performance improvement is the better memory system of Mckinley as explained in the previous paragraph. Thememory system is critical for mcf, because mcf is pointer-intensive, and has low cache hit rates. The problem ismore acute in IA-64 architectures, where the pointers increase to 64 bits in width, and result in larger working sets.For the dual-processor execution of mcf with vortex, we find that improvement in IPC is only 36% from Itaniumto Mckinley. This is due to the higher contention for system bus and memory in the dual-processor systems. Formcf on the uniprocessor systems, bus utilization was 71% and 76% for Itanium and Mckinley respectively. For thedual-processor systems, we found the bus utilization to be 77% and 79% for Itanium and Mckinley respectively. Thenumber of memory accesses that had to be retried because the memory controller had reached the limit on pendingreads or writes was 5.2 million and 2.7 million on Itanium and Mckinley respectively in the uniprocessor case. For thedual-processor case,the number of retries were 7.3 million and 3.0 million on Itanium and Mckinley respectively. Theaverage latency of a read serviced by memory was 103 processor cycles for Itanium and only 72 cycles for Mckinley;difference between uniprocessor and dual-processor configurations was negligible. This implies that memory bankconflicts did not change significantly with increase from 1 to 2 processors. To summarize, the main problems observedin the SMP case are high bus utilization and increased retries as a result of queues in the memory controller reachingtheir limit. So improving system bus bandwidth and increasing the queue sizes in the memory controller might be thefirst steps in improving SMP performance.
The uniprocessor runs of vortex on Mckinley yields an improvement of 21% in IPC over Itanium. This is a result ofreduction in stalls due to data dependencies (DDstall) and instruction fetches (IFstall). In the dual-processor case, theimprovement in IPC for vortex is only 16%. Again this can be attributed to the higher contention for system bus andmemory. The number of retries induced by the memory controller in the dual-processor case, as mentioned earlier,
8

0
20
40
60
80
100
120
GuI TuIGm
ITm
IGuM TuM
GmM
TmM M
uI VuIM
mI
VmI
MuM VuM
Mm
MVm
M
Applications + Architecture
No
rmal
ized
Cyc
les
Cache
DataDep
Funit
Ifetch
Busy
Figure 3. Breakdown of normalized execution cycles
were 7.3 million and 3.0 million on Itanium and Mckinley respectively. For the uniprocessor case, vortex had 1.8million and 0.8 million retries for Itanium and Mckinley respectively.
4.2 Parameter Sensitivity
We also studied variation of some system parameters. Figure 4 shows the effect of varying the frequency of thesystem bus. The total execution cycles of each application is plotted relative to the longest running application, whichis normalized to 100. Each bar is labeled on the X-axis with 1 or 2 applications (G, M, T or V), followed by the systemarchitecture (I or M) and bus frequency. For the Itanium system configuration, the bus frequencies chosen are 133,266 and 333 MHz, corresponding to labels 1, 2, and 3 respectively. For McKinley, the corresponding bus frequenciesare 200, 333 and 450 MHz respectively. The most significant improvement in performance has been observed in mcf.The DataDep component shows significant reduction for this application on both Itanium and McKinley. On Itanium,for example, its IPC increases by 42% if the bus frequency is increased from 133 to 333 MHz.
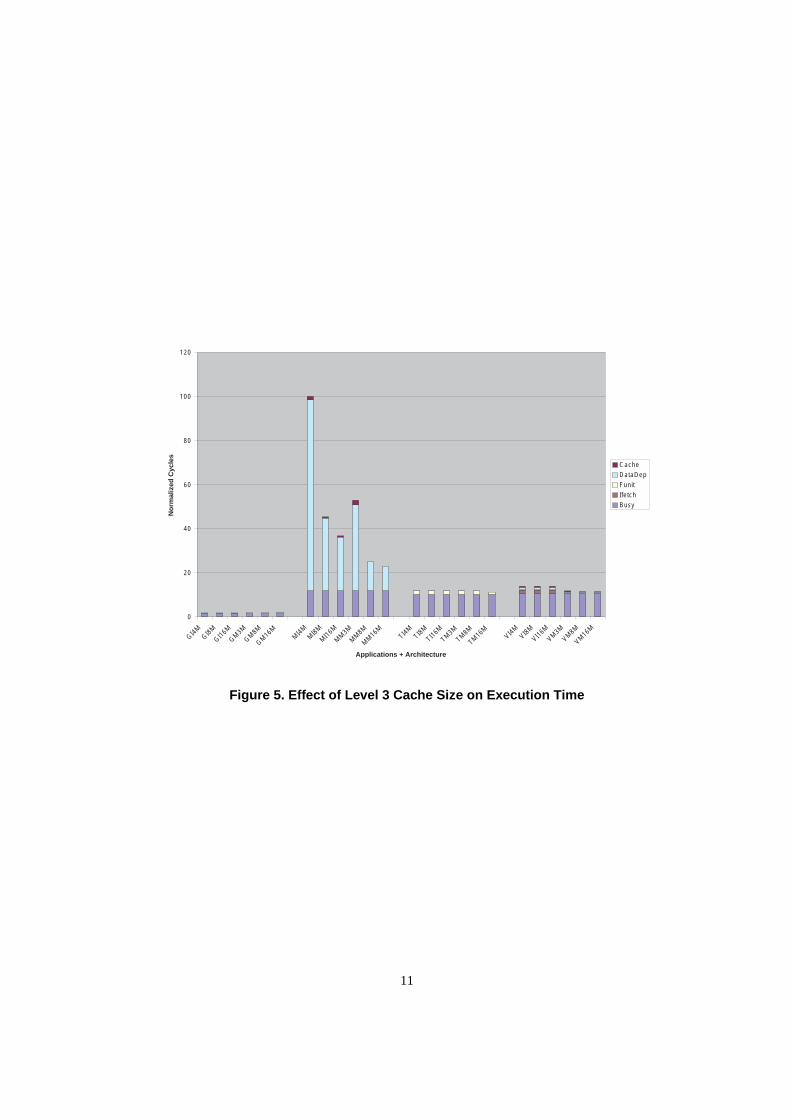
Figure 5 shows the effect of varying the size of the third-level cache. The total execution cycles of each applicationis plotted relative to the longest running application, which is normalized to 100. Each bar is labeled on the X-axiswith 1 or 2 applications (G, M, T or V), followed by the system architecture (I or M) and finally the size of the third-level cache (3, 4, 8 or 16 M ). Increasing cache size yields better performance improvement compared to increasingbus frequency. In fact, the IPC for mcf on Itanium increased by 42% due to increase in system bus frequency, whileit increased by 120% due to increase in cache size. The results turned out to be additive. That is, the 2 enhancementstogether increased IPC by 162%. For McKinley, the improvement in IPC resulting from increasing bus frequency to333 MHZ was 30%, while increasing third-level cache size to 8 MBytes increased IPC by 113%. Together, these 2enhancements increased IPC by 126%.
5 Conclusion
This paper describes the implementation of Peppermint and Sled: tools for cycle-accurate, trace-driven simulationof applications running on IA-64 processors. These tools are used to compare the performance of systems based onItanium and McKinley processors using 4 applications. We find that the improvement in IPC of McKinley relative to
9

0
20
40
60
80
100
120
GI1 GI3GM
2M
I2M
M1
MM
3TI1 TI3
TM2 VI2
VM1
VM3
GTI1GTI3
GTM2
MVI2
MVM
1
MVM
3
Applications + Architecture
No
rmal
ized
Cyc
les
Cache
DataDep
Funit
Ifetch
Busy
Figure 4. Effect of Bus Frequency on Execution Time
Itanium ranges from 7% to over 100% for our different experiments. The improvement can be attributed to a varietyof factors. These range from the availability of additional functional units and issue ports in the McKinley processorto our assumption of a better memory system. While the improvement in performance remains valid in SMP systemsin some cases, higher contention for system bus and memory reduces the performance gain in other cases. Increasingthe system bus bandwidth and size of queues for pending requests in the memory controller are identified as first stepsfor optimizing SMP performance.
10
0
20
40
60
80
100
120
GI4M
GI8M
GI16M
GM3M
GM8M
GM16
MM
I4M
MI8
M
MI1
6M
MM
3M
MM
8M
MM
16M
TI4M
TI8M
TI16M
TM3M
TM8M
TM16
MVI4
MVI8
M
VI16M
VM3M
VM8M
VM16
M
Applications + Architecture
No
rmal
ized
Cyc
les
Cache
DataDep
Funit
Ifetch
Busy
Figure 5. Effect of Level 3 Cache Size on Execution Time
11

A Using Sled
The format of the bundle used by Sled includes fields for identifying the bundle type, predicate value, predicateregister and address of either instruction fetch or memory access (load or store). The details of the bundle format arepresented in Figure 6.
Pred Reg On/Off Type 64 bit AddressPred Reg : 6 bits for the predicate register.
On/Off : 1 bit for predicate, On = 0, Off = 1.Type : 2 bits for the record type.
0 = Memory read.1 = Memory write.2 = Instruction fetch.6 = Instruction fetch with bundle information.
Address : Instruction or Memory address.in hexadecimal (without leading 0x).
Figure 6. Basic record type produced by Sled
The 128 bits of the instruction bundle are available through a record as shown in Figure 7.
6 64 bit Address Bundle High 64 Bits Bundle Low 64 Bits
Figure 7. Bundle record type produced by Sled
A.1 User Interface
Sled has a command line interface with the following options:
-a <file name> (append output to file).
-b Add the bundled opcodes to the instruction fetch record. The opcodes are only printed at 16 byte alignedinstruction addresses.
-d (disassemble, implies -s).
Disassemble the instructions as they are being stepped through. This is useful for verifying the output of thetool.
-e EVENT1,EVENT2,.., (events to monitor, max 4).
Collect performance counter values for the requested events. The Itanium implementation limits the number ofevents that can be monitored to a maximum of four events. The arguments are optional, and some combinationsof events may not be allowed by the architecture. This option is currently available only on Linux-ia64.
-f <first instruction to monitor>.
Specify the starting point for generating traces or collecting statistics. This breakpoint can be specified using asymbolic name or a numeric address.
-k <signal> (kill child with signal after last instruction).
Send this signal to the monitored program when Sled exits. This is especially useful when generating traces orcollecting statistics only between two breakpoints. The default is to let the monitored program run to completion.
12

-l <last instruction to monitor>.
Specify the ending point for collecting traces or statistics. The breakpoint can be specified using a symbolicname or a numeric address.
-n <number of instructions to step through> (implies -s).
This flag is usually specified with -t to collect data for a fixed number of instruction.
-o <file name> (overwrite output in file).
-p <target pid to attach to>.
Attach Sled to a running program with this pid. The program name is not required since Sled obtains all theinformation by querying the running program. This mode can be used combined with the -n flag to periodicallycollect samples from long running programs.
-P (enable performance counters).
Collect performance counter values from the monitored program. If the events to be monitored are not specifiedwith the -e flag, Sled defaults to reporting the values for IA64 INST RETIRED, CPU CYCLES, LOADS RETIRED,and STORES RETIRED [6]. This option is currently available only on Linux-ia64.
-s (single step).
Single step the program and print the number of instructions executed. This flag is useful on OSes that do nothave a Performance counter interface to determine the number of instructions retired in a section of the program.
-t (generate address trace).
Collect traces in the modified Dinero format. The -b flag adds two further fields at aligned instruction fetches.
-v (verbose).
Provide debugging and progress information.
13

B Comparison of Configuration Files
Table 6 presents the difference in configurations parameters provided to Peppermint for our comparison of Itaniumand McKinley. Some of these parameters are based on assumptions made by the authors about processor and DRAMtechnology at the time the project was done, and do not necessarily reflect actual products based on these 2 processors.
System Parameter Itanium McKinley
Processor Frequency 800 MHz 900 MHzL1 I-cache Line Size 32 bytes 64 bytesL1 I-cache Associativity 4 4L1 I-cache Size 16 KB 16 KBL1 I-cache Ports 2 2L1 I-cache Access Latency 2 cycles 1 cycleL1 D-cache Line Size 32 bytes 64 bytesL1 D-cache Associativity 4 4L1 D-cache Size 16 KB 16 KBL1 D-cache Ports 2 4L1 D-cache Access Latency 2 cycles 1 cycleL2 Cache Associativity 6 8L2 Cache Line Size 64 bytes 128 bytesL2 Cache Size 96 KB 256 KBL2 Cache Ports 2 4L2 Cache Access Latency (integer) 6 cycles 5 cyclesL2 Cache Access Latency (floating-point) 9 cycles 6 cyclesL3 Cache Associativity 4 12L3 Cache Line Size 64 bytes 128 bytesL3 Cache Size 4 MB 3 MBL3 Cache Access Latency (integer) 21 cycles 12 cyclesL3 Cache Access Latency (floating-point) 24 cycles 16 cyclesSystem Bus Frequency 133 MHz 200 MHzSystem Bus Width 64 bits 128 bitsDRAM Frequency 100 MHz 150 MHzRAS to CAS Delay, tRCD 20 ns 20 nsCAS Latency (DRAM cycles) 2 2Double Data Rate No Yes
Table 6. Difference in System Parameters
14

C Using Peppermint
Assuming you have acquired the source files for Peppermint , the first step is to enter the top-level directory, andbuild and install the libraries:
cd peppermint./configuremake install
You will not normally need to compile the front-end program that reads the trace files generated by Sled , anddrives the simulation. The above step should be sufficient to build the complete Peppermint simulator as the binaryfile read trace in the directory peppermint=applications=no ctxsw. However if you decide to change any sourcecode or link different libraries and recompile, after the above steps, you might have to execute:
cd applications/no_ctxswmake cleanmake
To run Peppermint using the configuration file for Itanium and McKinley respectively, using a trace file your app.trgenerated by Sled , you will have to execute:
cd applications/no_ctxswread_trace -- -c peppermint.config.itn < your_app.trread_trace -- -c peppermint.config.mck < your_app.tr
Peppermint runs in SMP configurations, when it is given the -m flag for multiple processors, along with the -c flagfor configuration file. It has been tested for 2 and 4 processor systems. When given the -m flag, it assumes that thetraces for the different processors are available in files named peppermint.trace0, peppermint.trace1, . . .
Suppose you have 2 compressed traces from your applications that you want to run in a SMP configuration. Youcould uncompress the trace files in files named peppermint.trace0 and peppermint.trace1 if you have enough diskspace. The alternative could be the following sequence of commands:
cd applications/no_ctxswmkfifo peppermint.trace0 peppermint.trace1gzcat your_app0.tr.gz > peppermint.trace0 &gzcat your_app1.tr.gz > peppermint.trace1 &read_trace -- -c peppermint.config.itn -m 2
15

References
[1] A. Agarwal, J. Hennessy, and M. Horowitz. Cache Performance of Operating System and Multiprogrammed Workloads.ACM Transactions on Computer Science, 6(4):393 – 431, 1988.
[2] S. P. E. Council. Spec cpu2000 benchmark. For further information, check http://www.spec.org/.[3] D. Burger and T. Austin. The SimpleScalar Tool Set. Technical Report 1342, University of Wisconsin, 1997.[4] J. K. Flanagan, B. E. Nelson, J. K. Archibald, and K. Grimsrud. BACH: BYU Address Collection Hardware, The Collection
of Complete Traces. In Proceedings of the 6th International Conference on Modelling Techniques and Tools for ComputerPerformance Evaluation, pages 128 – 137, 1992.
[5] M. Holliday. Techniques for Cache and Memory Simulation using Address Reference Traces. International Journal inComputer Simulation, 1:129 – 151, 1991.
[6] intel. Intel R IA-64 Architecture Software Developer’s Manual, volume 4, chapter Processor Performance Monitoring. IntelCorporation, 1.1 edition, July 2000.
[7] Intel Corporation. Itanium Processor Microarchitecture Reference, August 2000. Document Number 245473-002, Availablefrom http://developer.intel.com/design/itanium/manuals/.
[8] Jan Edler and Mark D. Hill. Dinero IV Trace-Driven Uniprocessor Cache Simulator. Technical report, University of Wiscon-sin, 1999. Available at http://www.cs.wisc.edu/ markhill/DineroIV/.
[9] A.-T. Nguyen, M. Michael, A. Sharma, and J. Torrellas. The augmint multiprocessor simulation toolkit for intel x86 archi-tectures. In International Conference on Computer Design (ICCD), 1996.
[10] S. Roy and B. Shen. Implementation of an Algorithm for Fast Down-Scale Transcoding of Compressed Video on the Itanium.In Proceedings of the 3rd Workshop on Media and Streaming Processors, pages 119 – 126, Austin, TX, December 2001.
[11] H. Sharangpani and K. Arora. Itanium processor microarchitecture. IEEE Micro, pages 24–43, September-October 2000.[12] B. Shen and S. Roy. A very Fast Video Spatial Resolution Reduction Transcoder. In To appear in Proceedings of ICASSP
2002, Orlando, FL, May 2002.[13] R. Uhlig, R. Fishtein, O. Gershon, I. Hirsh, and H. Wang. Softsdv: A presilicon software development environment for the
ia-64 architecture. Intel Technology Journal, 4th Quarter 1999. Available from http://developer.intel.com/technology/itj/.[14] R. A. Uhlig and T. N. Mudge. Trace-driven Memory Simulation: a Survey. ACM Computing Surveys, 29(2):128 – 170, June
1997.
16