Embed Size (px)
Citation preview

People People People People Everywhere!!Everywhere!!
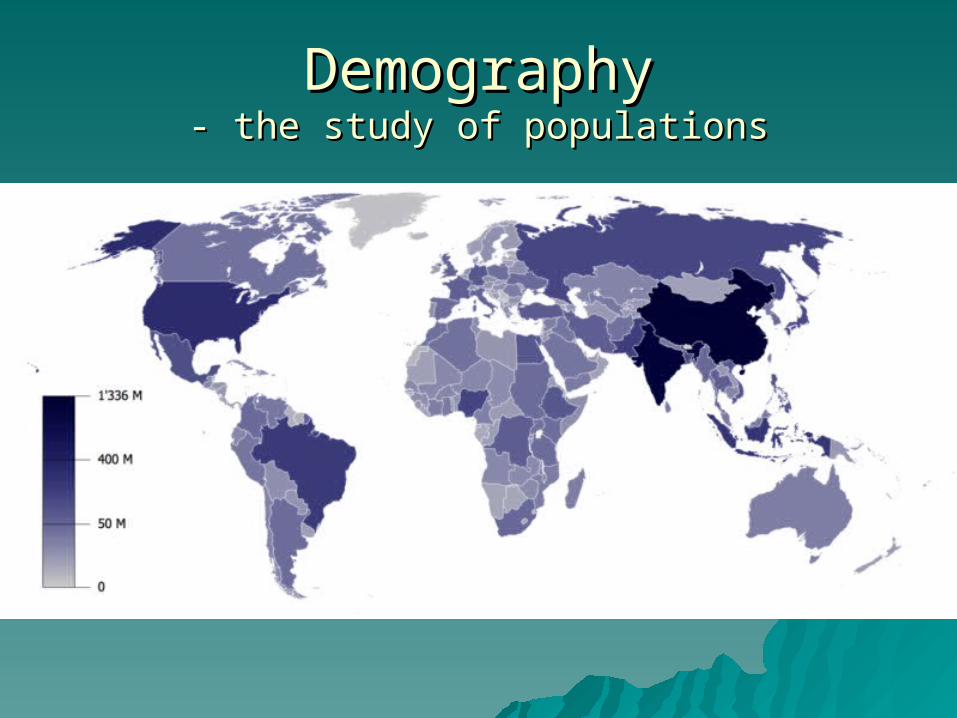
DemographyDemography- the study of populations- the study of populations
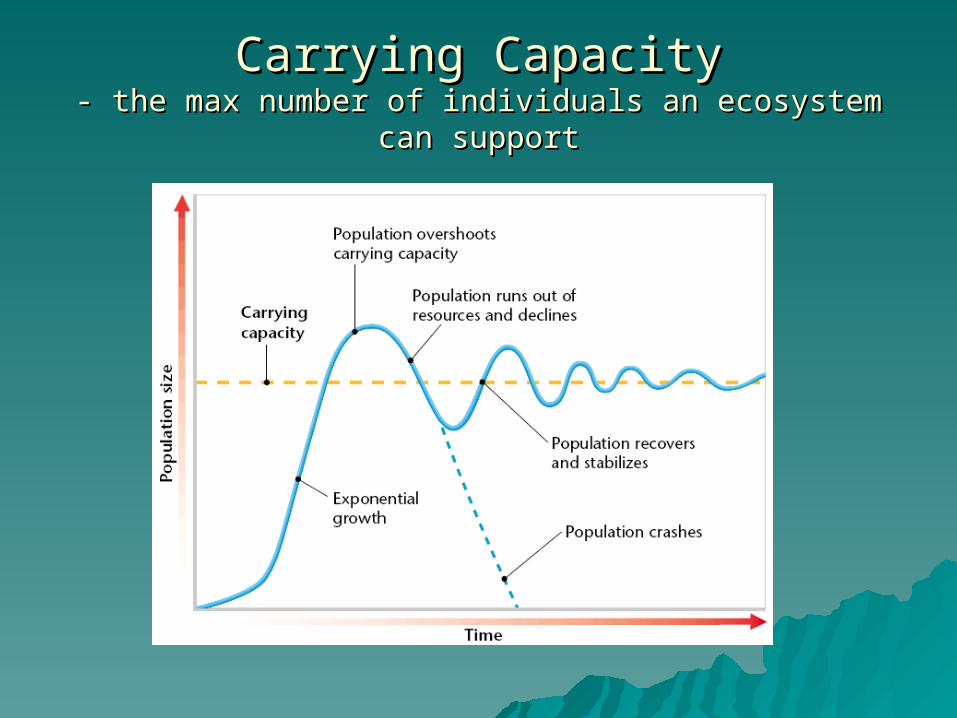
Carrying CapacityCarrying Capacity- the max number of individuals an ecosystem can support- the max number of individuals an ecosystem can support
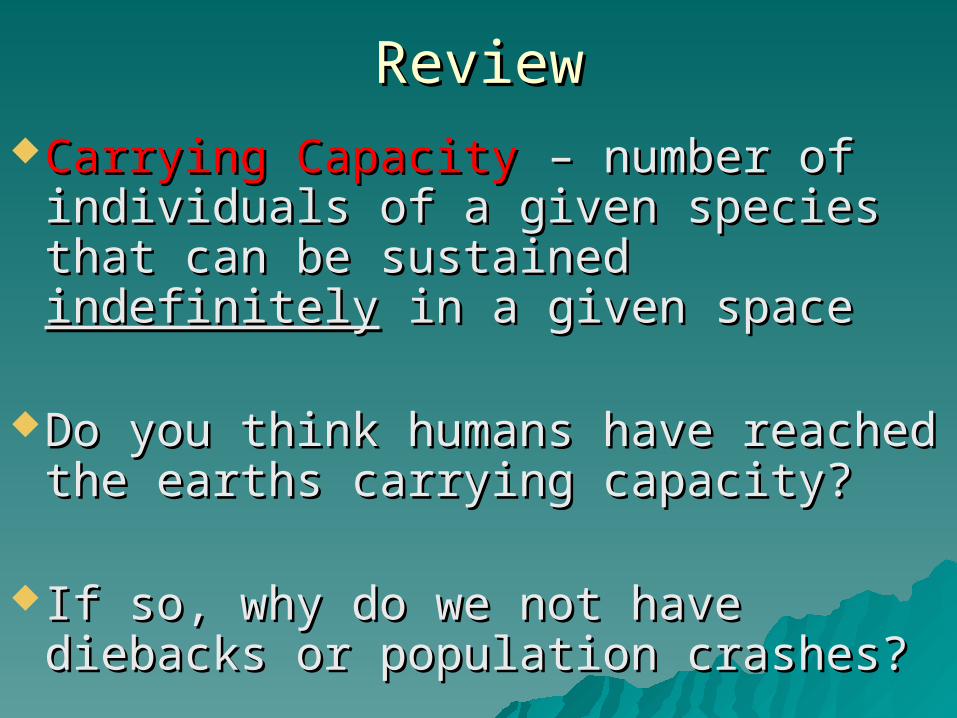
ReviewReviewCarrying CapacityCarrying Capacity – number of – number of
individuals of a given species that individuals of a given species that can be sustained can be sustained indefinitelyindefinitely in a in a given spacegiven space
Do you think humans have reached Do you think humans have reached the earths carrying capacity?the earths carrying capacity?
If so, why do we not have diebacks If so, why do we not have diebacks or population crashes?or population crashes?

We do…occasionallyWe do…occasionally
Easter Island – 2,500 yrs agoEaster Island – 2,500 yrs ago
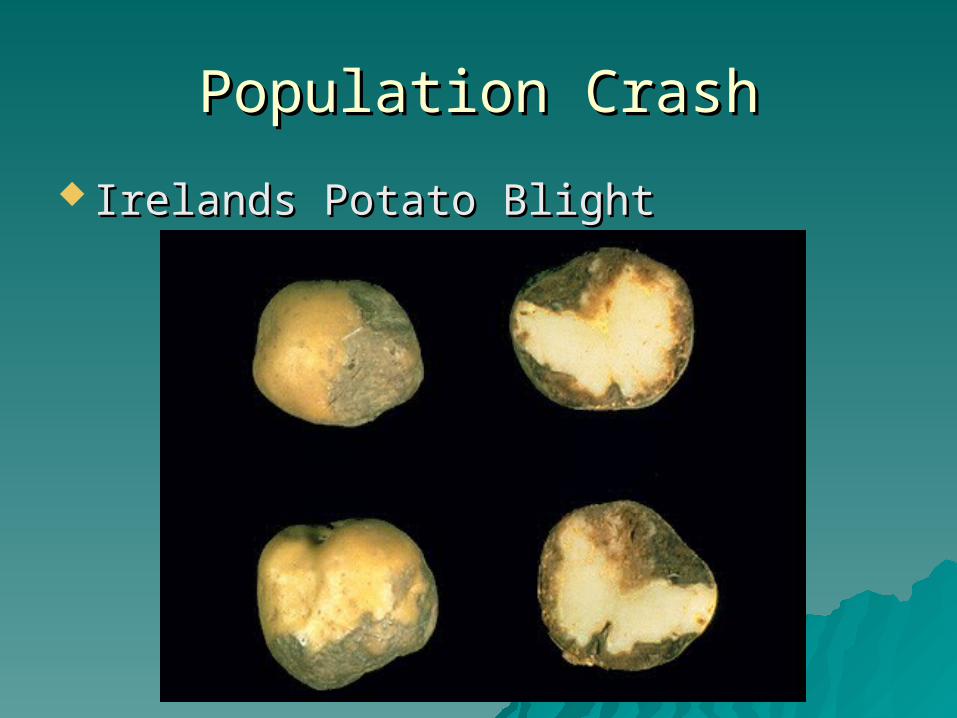
Population CrashPopulation Crash
Irelands Potato BlightIrelands Potato Blight
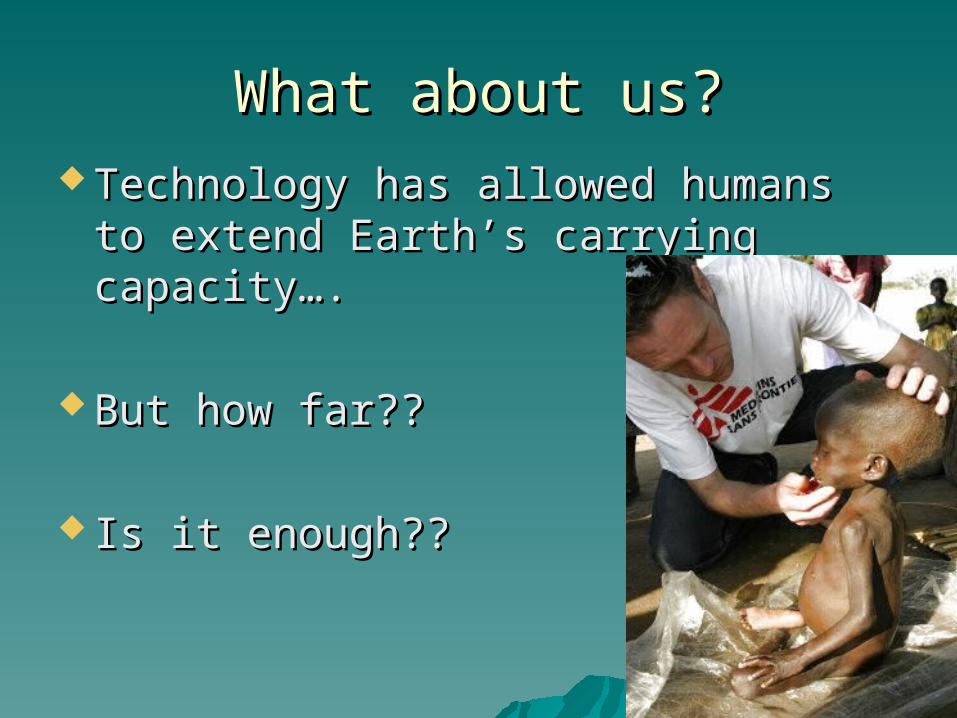
What about us?What about us? Technology has allowed humans to Technology has allowed humans to
extend Earth’s carrying capacity….extend Earth’s carrying capacity….
But how far??But how far??
Is it enough??Is it enough??
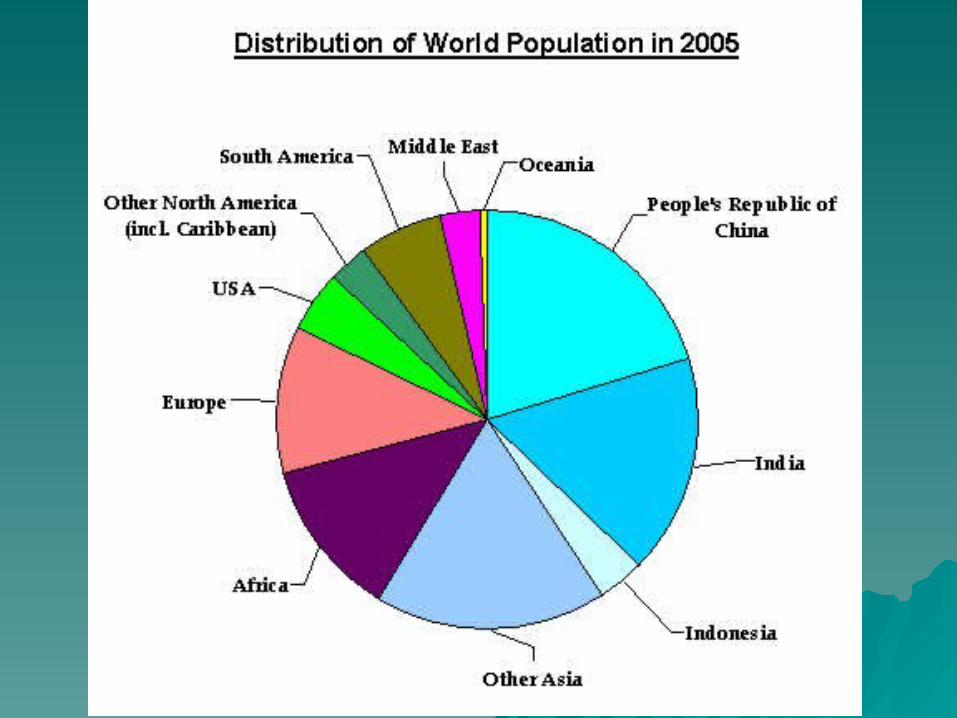
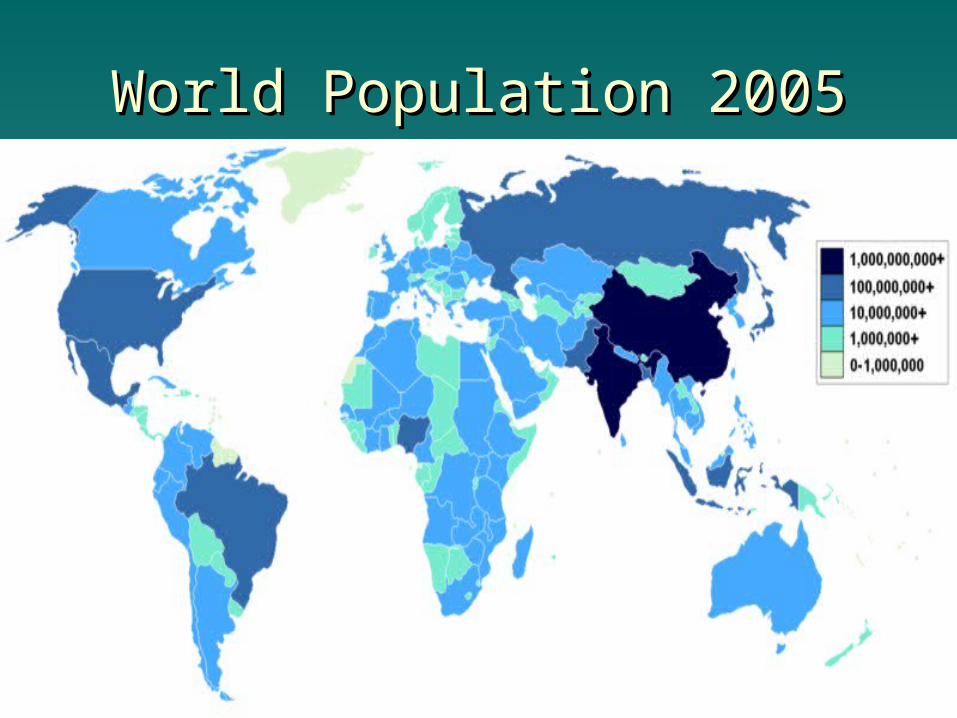
World Population 2005World Population 2005
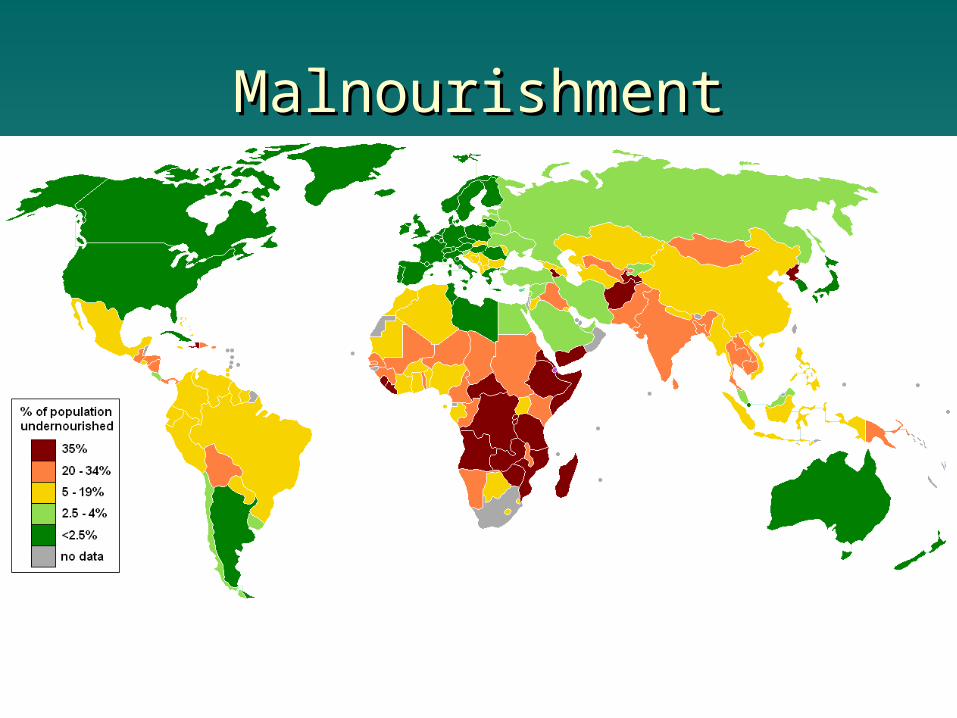
MalnourishmentMalnourishment
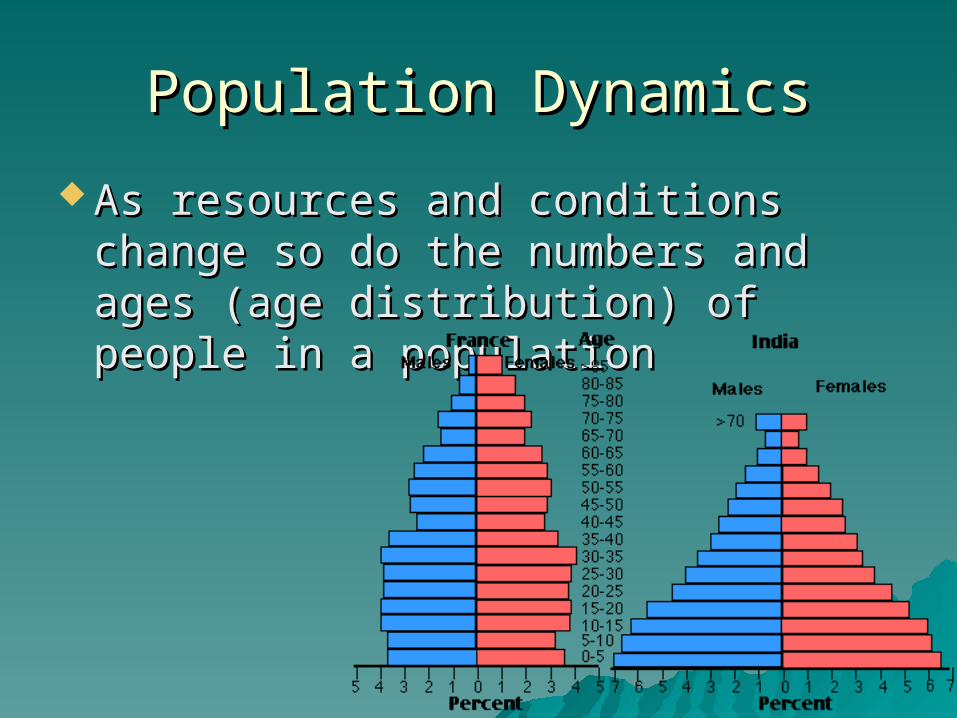
Population DynamicsPopulation Dynamics
As resources and conditions change As resources and conditions change so do the numbers and ages (age so do the numbers and ages (age distribution) of people in a populationdistribution) of people in a population
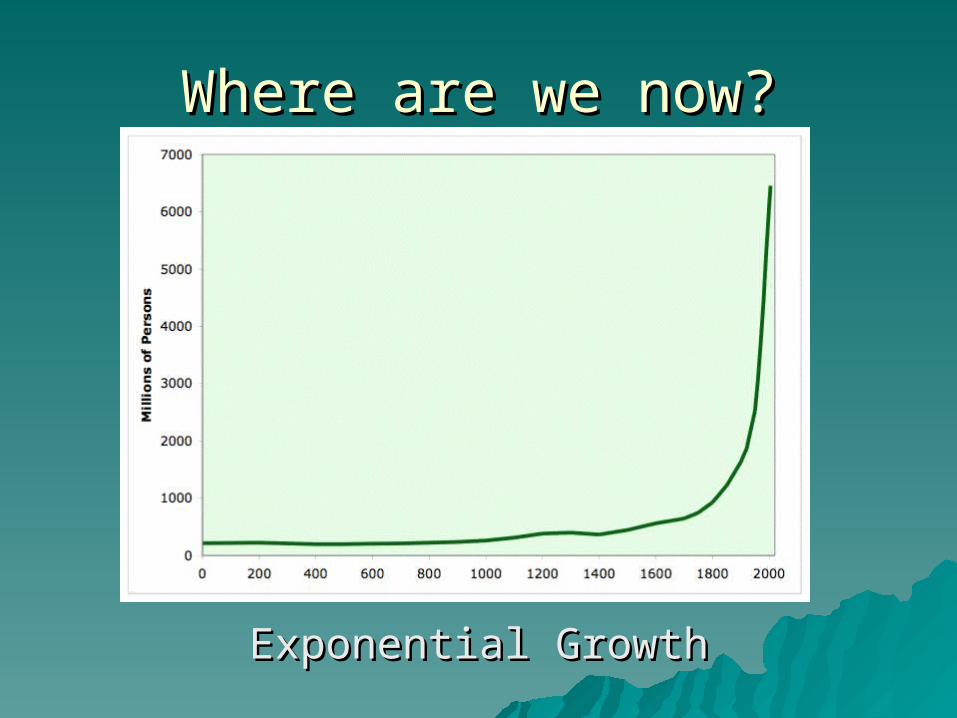
Where are we now?Where are we now?
Exponential GrowthExponential Growth
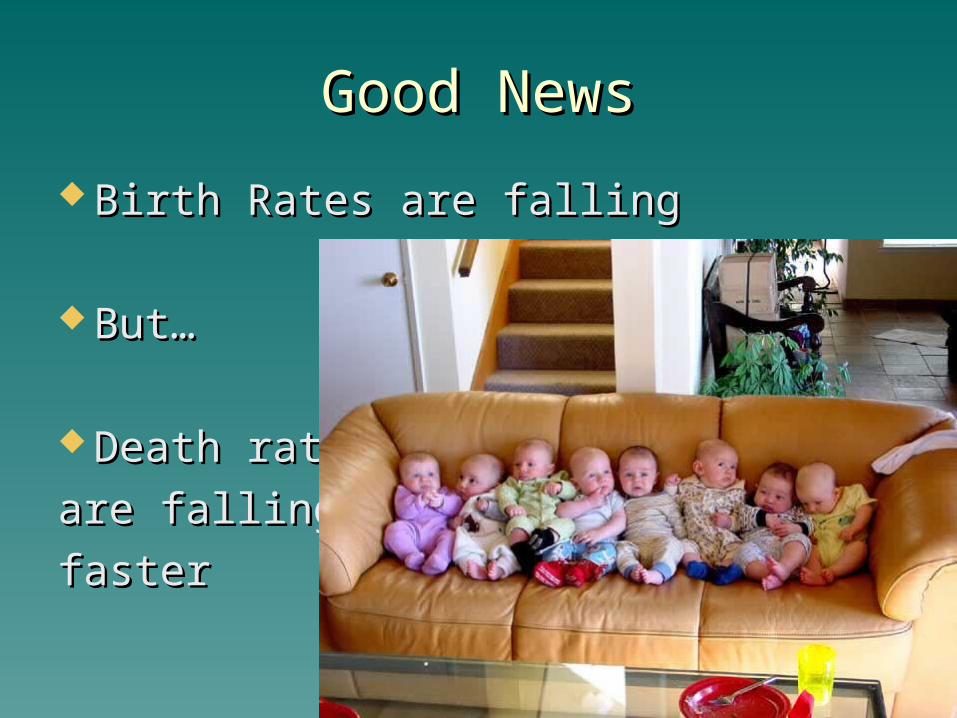
Good NewsGood News
Birth Rates are fallingBirth Rates are falling
But…But…
Death ratesDeath rates
are falling are falling
fasterfaster
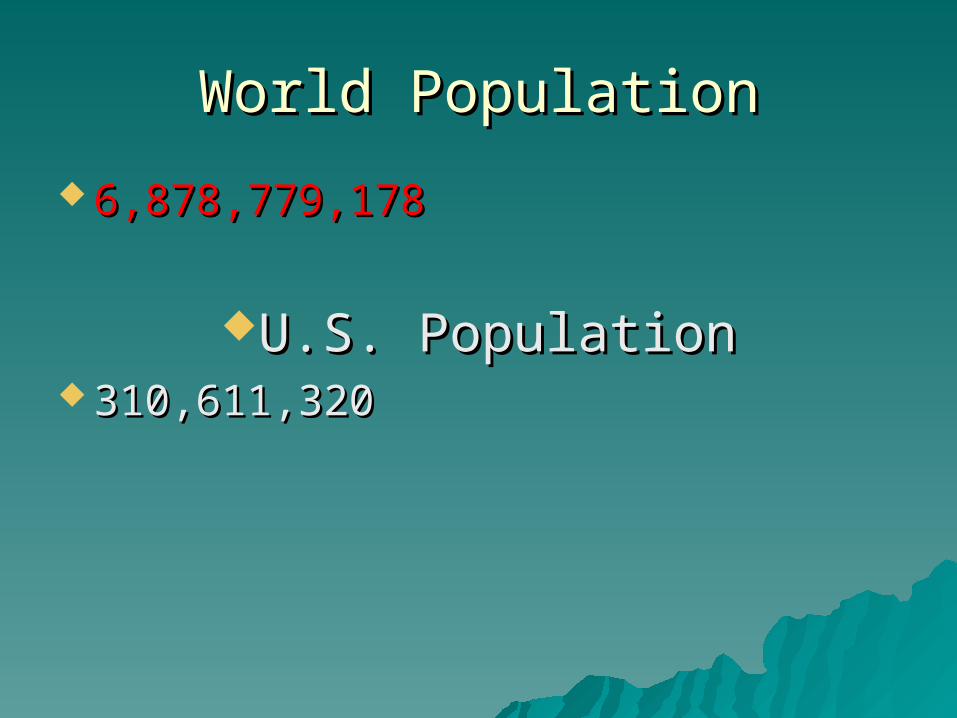
World PopulationWorld Population
6,878,779,1786,878,779,178
U.S. PopulationU.S. Population 310,611,320 310,611,320
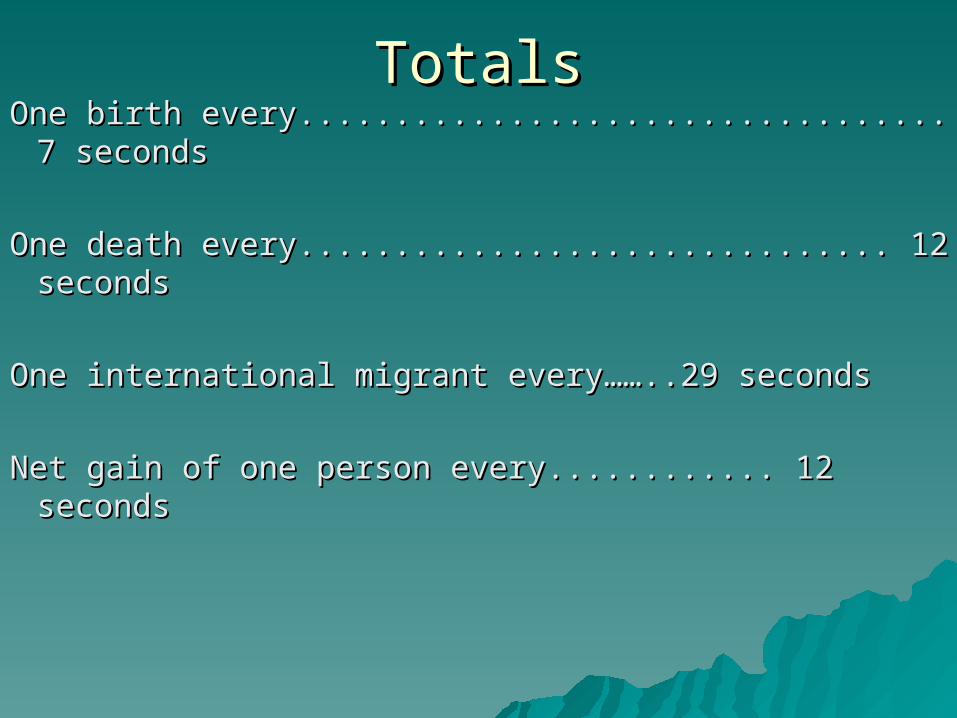
TotalsTotalsOne birth every.................................. 7 secondsOne birth every.................................. 7 seconds
One death every............................... 12 seconds One death every............................... 12 seconds
One international migrant every……..29 seconds One international migrant every……..29 seconds
Net gain of one person every............ 12 seconds Net gain of one person every............ 12 seconds
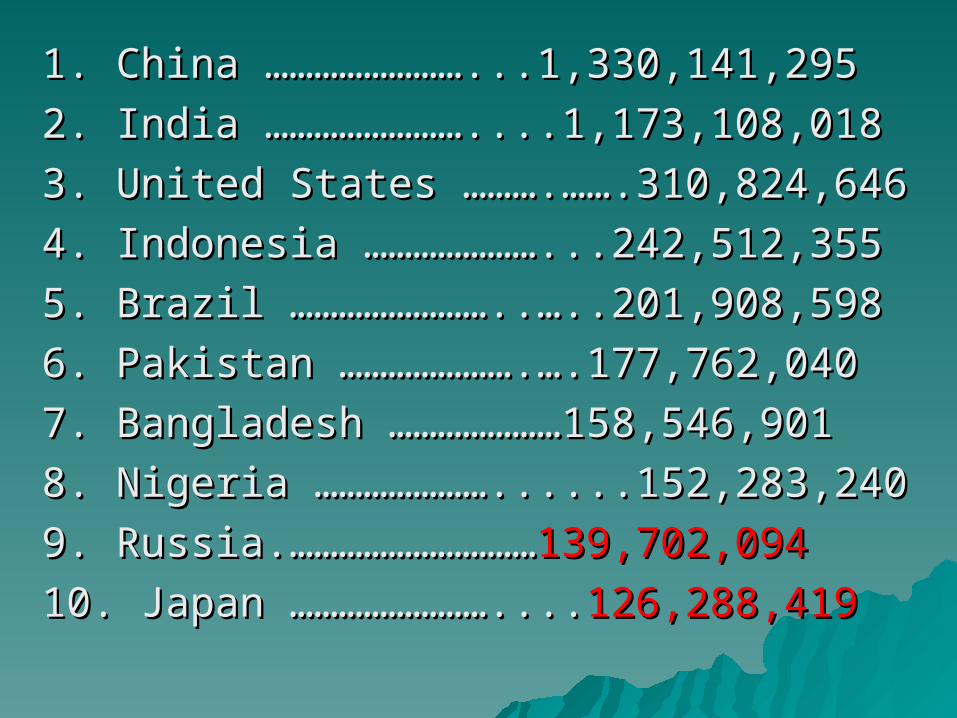
1. China ……………………...1,330,141,295 1. China ……………………...1,330,141,295
2. India ……………………....1,173,108,018 2. India ……………………....1,173,108,018
3. United States ……….…….310,824,646 3. United States ……….…….310,824,646
4. Indonesia …………………...242,512,355 4. Indonesia …………………...242,512,355
5. Brazil ……………………..…..201,908,598 5. Brazil ……………………..…..201,908,598
6. Pakistan ………………….….177,762,040 6. Pakistan ………………….….177,762,040
7. Bangladesh …………………158,546,901 7. Bangladesh …………………158,546,901
8. Nigeria …………………......152,283,240 8. Nigeria …………………......152,283,240
9. Russia.…………………………9. Russia.…………………………139,702,094139,702,094
10. Japan ……………………....10. Japan ……………………....126,288,419126,288,419
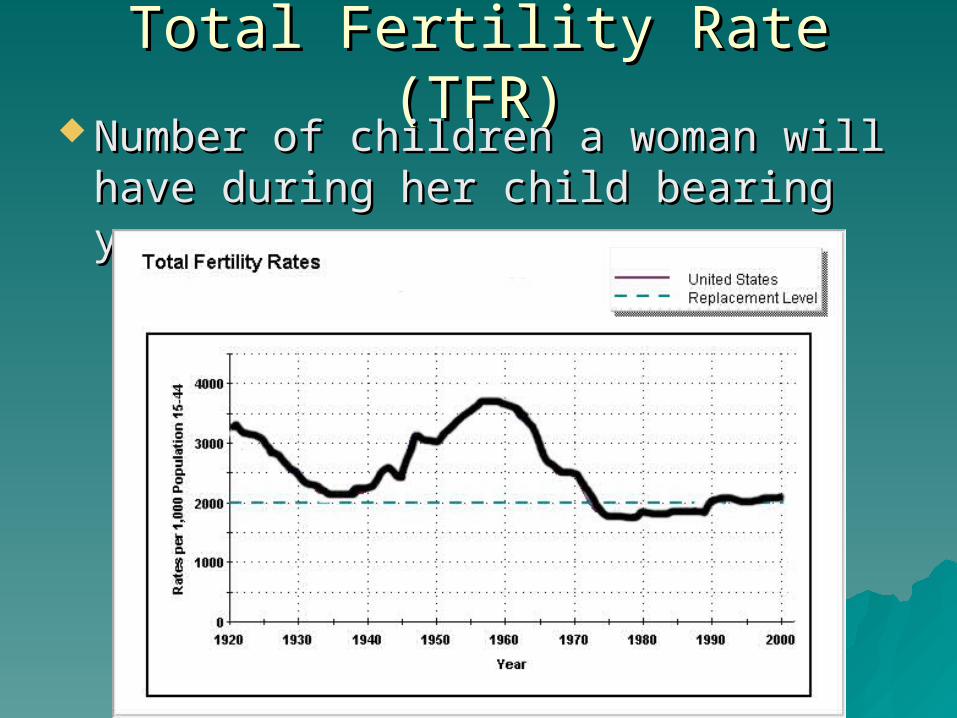
Total Fertility Rate (TFR)Total Fertility Rate (TFR) Number of children a woman will Number of children a woman will
have during her child bearing years.have during her child bearing years.
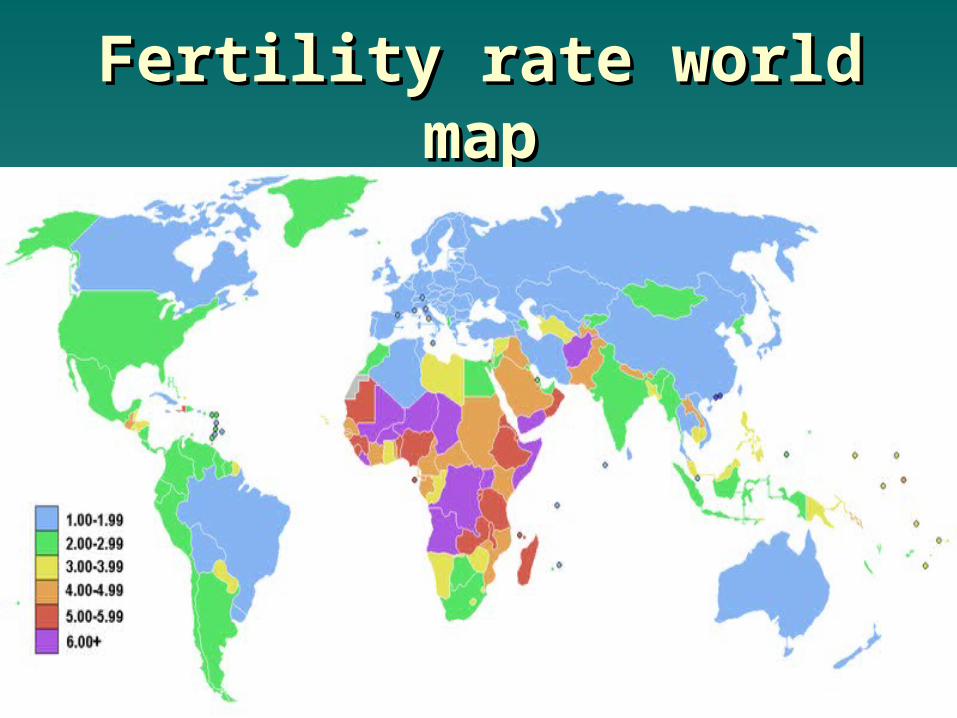
Fertility rate world Fertility rate world mapmap
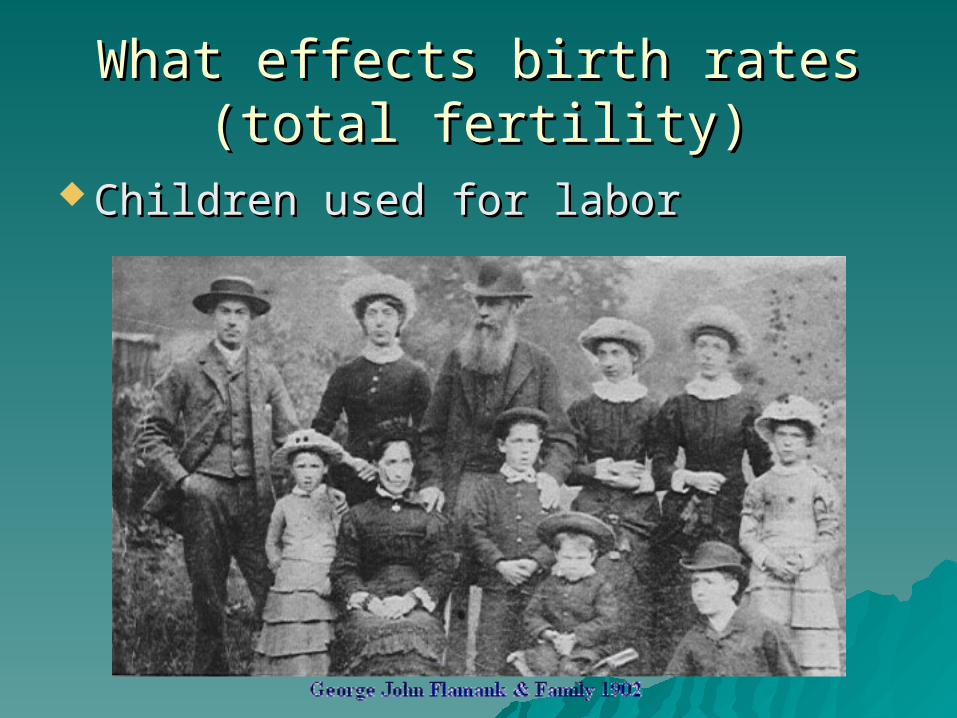
What effects birth rates (total fertility)What effects birth rates (total fertility)
Children used for laborChildren used for labor
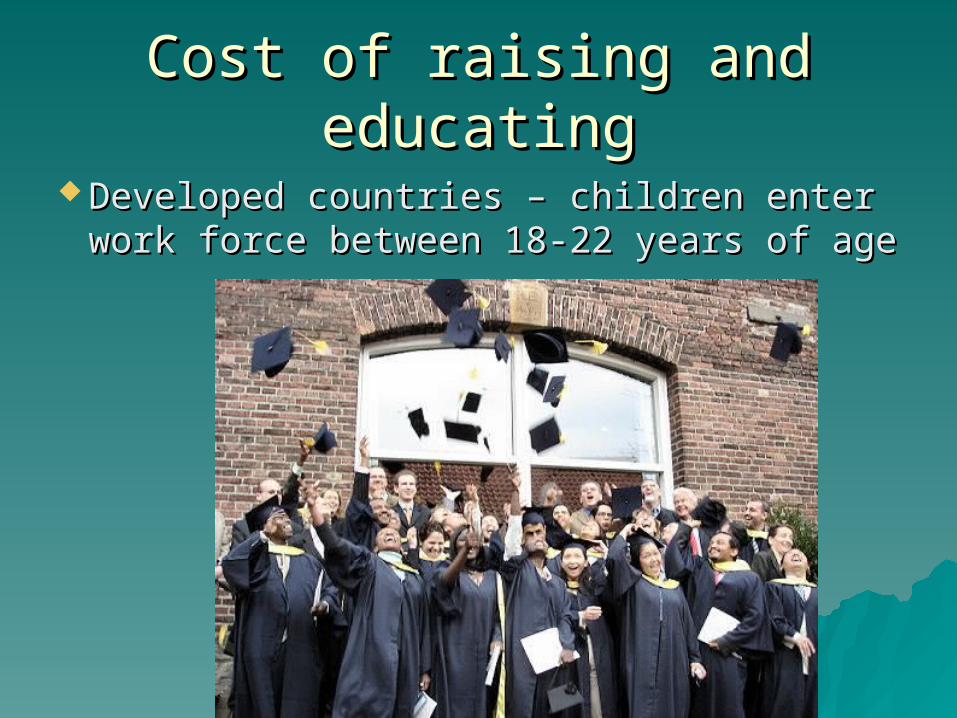
Cost of raising and educatingCost of raising and educating
Developed countries – children enter Developed countries – children enter work force between 18-22 years of agework force between 18-22 years of age
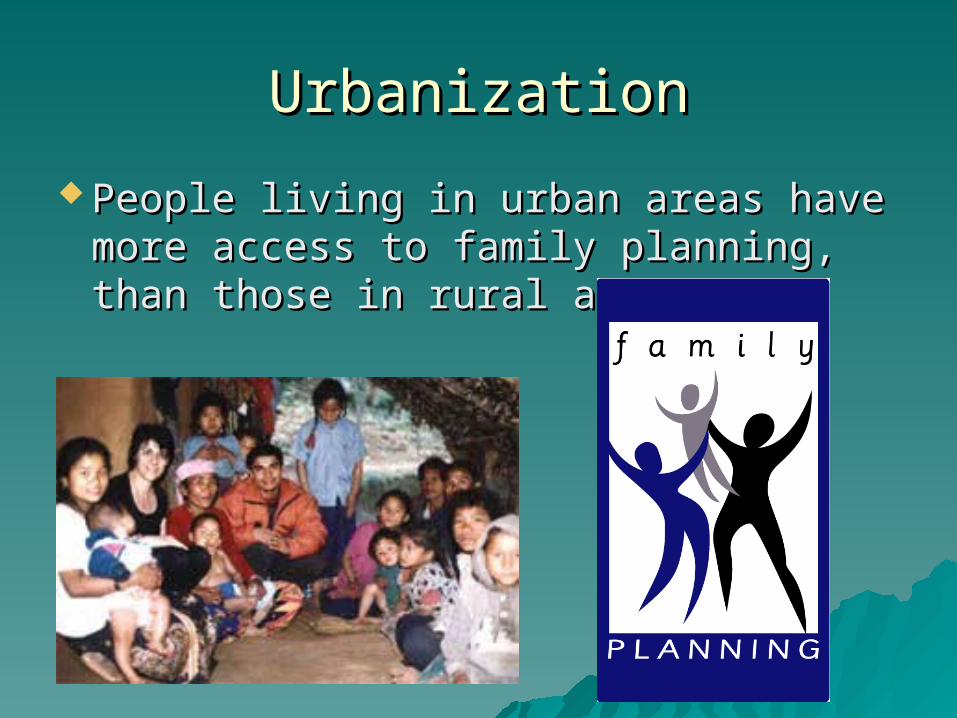
UrbanizationUrbanization
People living in urban areas have People living in urban areas have more access to family planning, than more access to family planning, than those in rural areasthose in rural areas
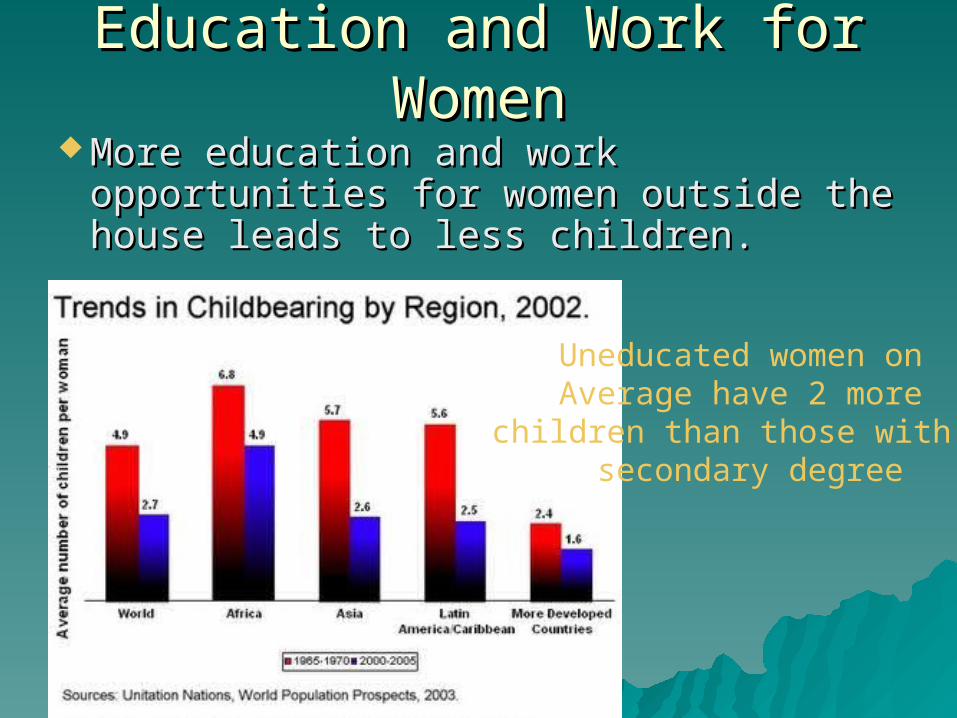
Education and Work for WomenEducation and Work for Women More education and work More education and work
opportunities for women outside the opportunities for women outside the house leads to less children.house leads to less children.
Uneducated women on Average have 2 more
children than those with a secondary degree
More reasonsMore reasons
Infant mortality rateInfant mortality rate Average age of marriageAverage age of marriage Legality of abortionsLegality of abortions Availability of birth controlAvailability of birth control
– Religious beliefsReligious beliefs– TraditionsTraditions– Cultural normsCultural norms
Factors effecting death ratesFactors effecting death rates
More foodMore food Better food distributionBetter food distribution Better nutritionBetter nutrition MedicineMedicine Improved sanitationImproved sanitation Safe water supplySafe water supply
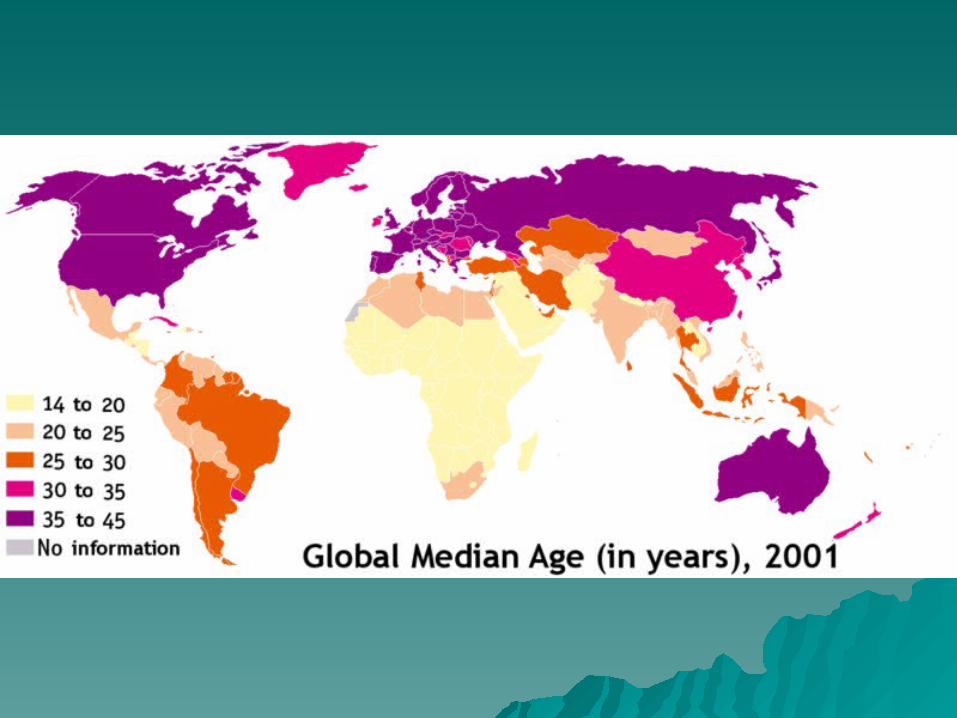
Life ExpectancyLife Expectancy
Developed ~ 67 – 81 yearsDeveloped ~ 67 – 81 years
Developing ~ 55 years or lessDeveloping ~ 55 years or less
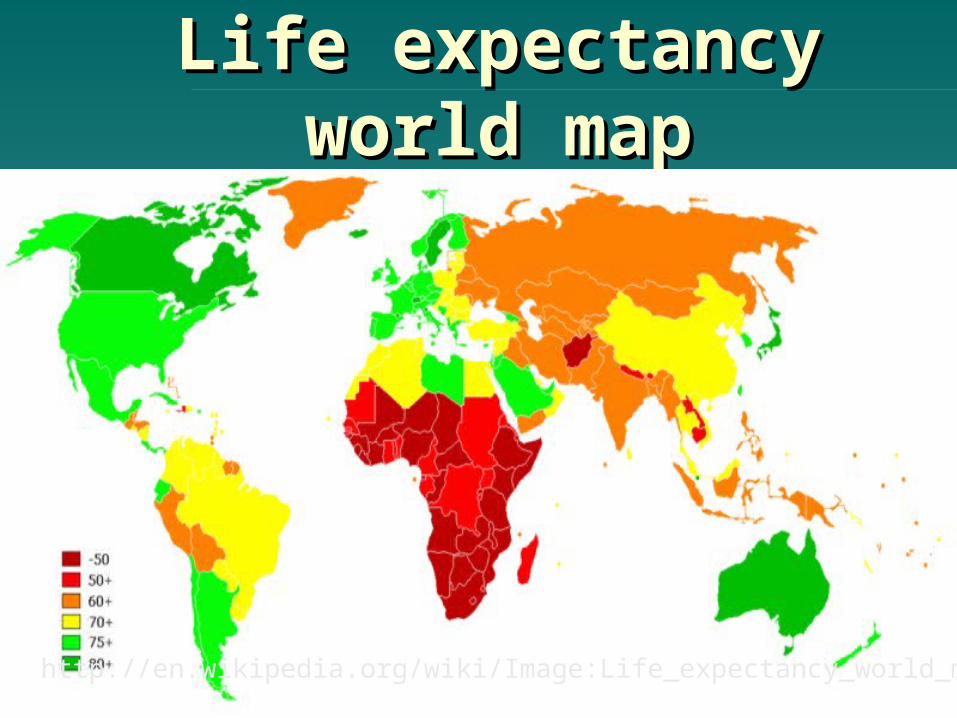
Life expectancy world Life expectancy world mapmap
http://en.wikipedia.org/wiki/Image:Life_expectancy_world_map.PNG

On your Notes PaperOn your Notes PaperMake a chart…Make a chart…
DevelopingDeveloping
Least Least DevelopedDeveloped
DevelopedDeveloped
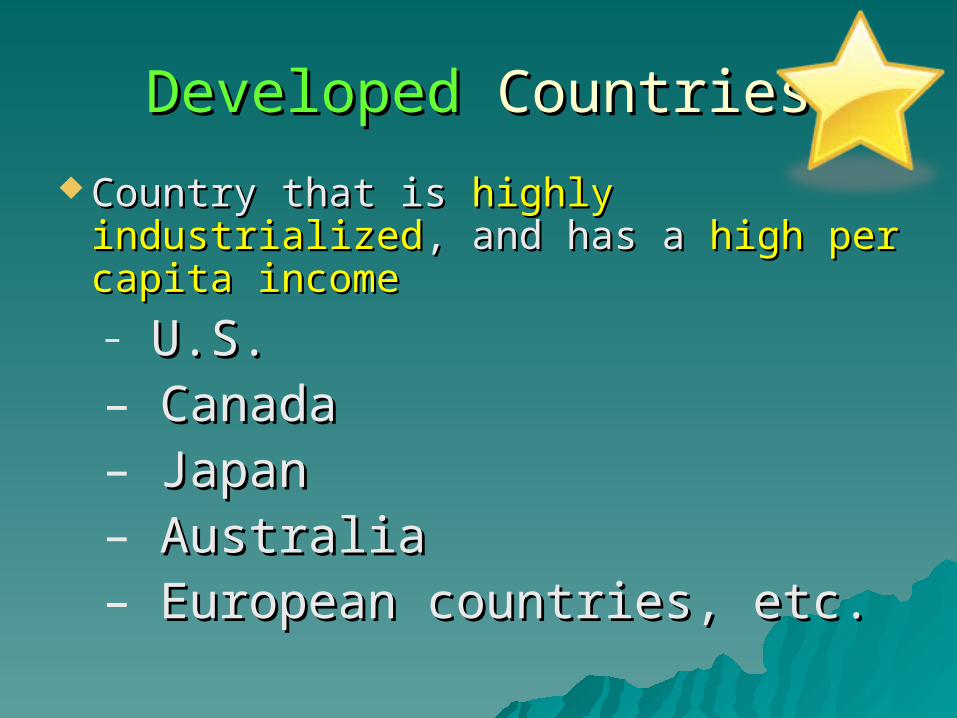
DevelopedDeveloped Countries Countries
Country that is Country that is highly industrializedhighly industrialized, , and has a and has a high per capita incomehigh per capita income– U.S. U.S. – Canada Canada – Japan Japan – AustraliaAustralia– European countries, etc.European countries, etc.
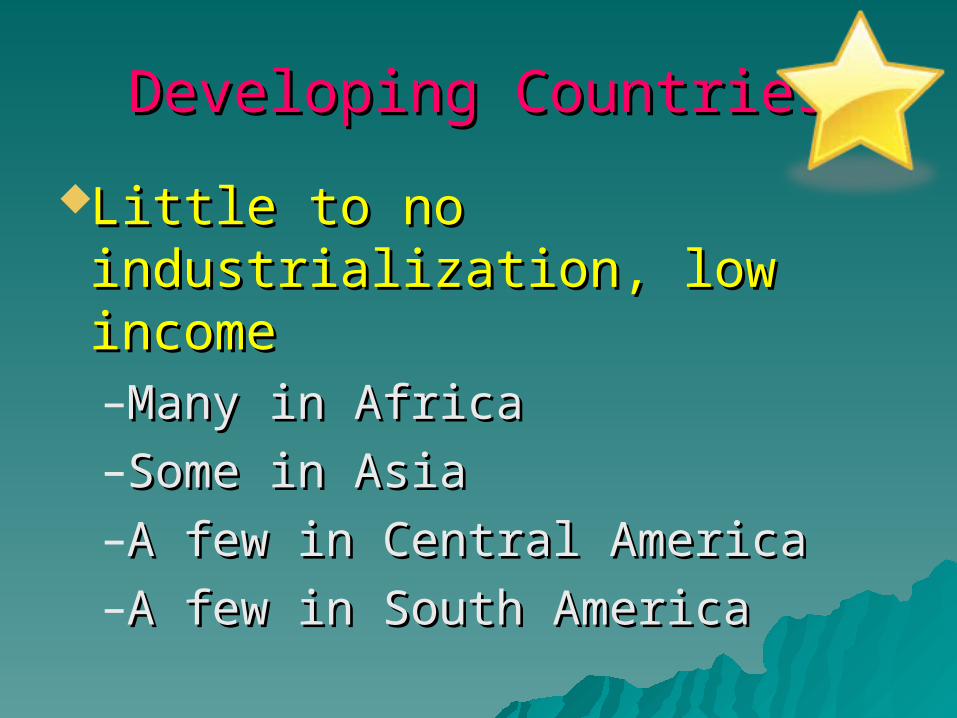
Developing CountriesDeveloping Countries
Little to no industrialization, Little to no industrialization, low incomelow income–Many in Africa Many in Africa –Some in Asia Some in Asia –A few in Central America A few in Central America –A few in South AmericaA few in South America

http://www.miniature-earth.com/http://www.miniature-earth.com/me_english.htm me_english.htm
DevelopedDeveloped countries have:countries have:
more wealthmore wealthbetter educationbetter educationeasier access to easier access to healthcarehealthcare
higher standards of livinghigher standards of livinglower fertility rateslower fertility rates
DevelopingDeveloping countries have:countries have:
more povertymore povertylower standards of living lower standards of living less educationless educationless healthcareless healthcarehigher fertility rateshigher fertility rates
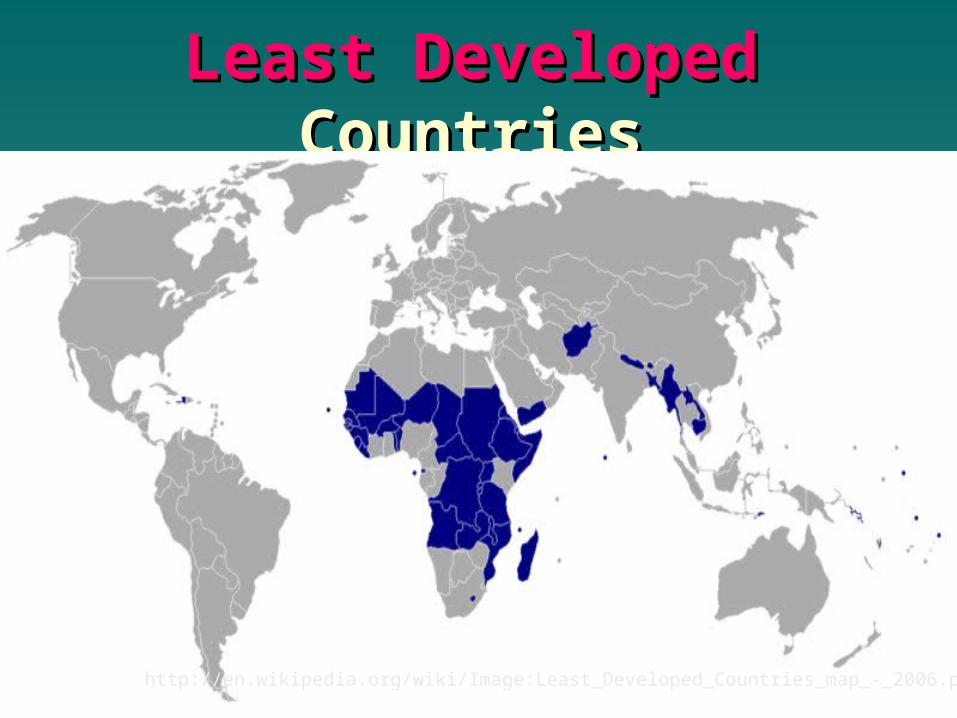
Least DevelopedLeast Developed CountriesCountries
http://en.wikipedia.org/wiki/Image:Least_Developed_Countries_map_-_2006.png
Least DevelopedLeast Developed (LDC)- (LDC)- CharacteristicsCharacteristics
Extreme povertyExtreme povertyOngoing civil war or Ongoing civil war or ethnic conflictsethnic conflicts
Political/Social Political/Social instabilityinstability
Corrupt governmentCorrupt government
Population ControlsPopulation ControlsControlling the birth rate generally implies Controlling the birth rate generally implies
one of the following practices:one of the following practices:
EDUCATIONEDUCATIONsexual abstinence sexual abstinence birth control/contraception birth control/contraception sterilizationsterilizationabortion abortion infanticide infanticide
Earth Carrying CapacityEarth Carrying Capacity
50 Billion People50 Billion People
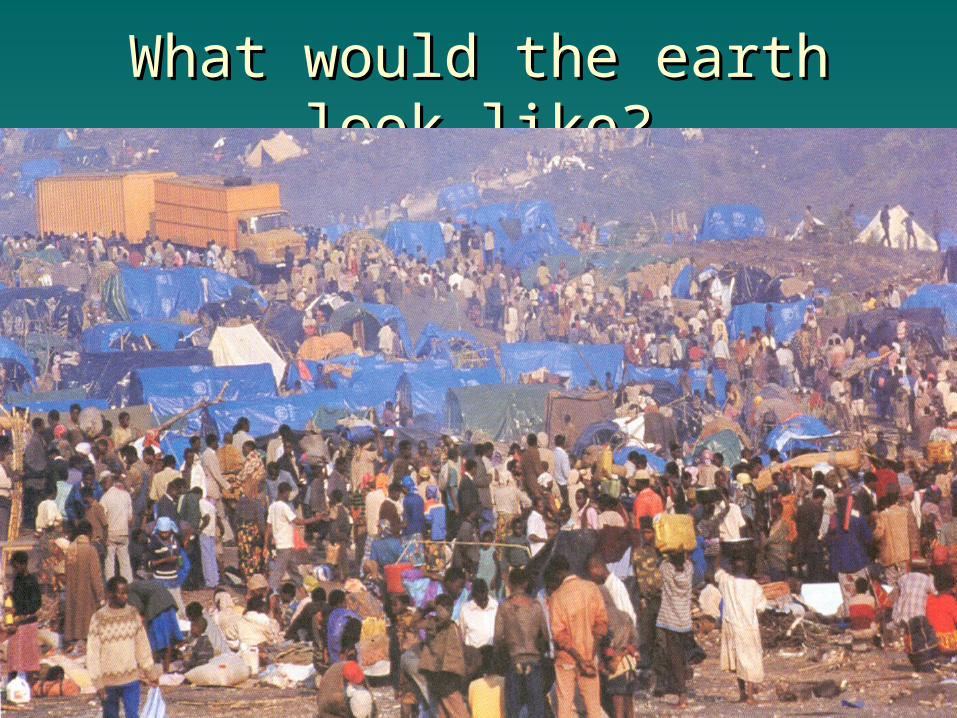
What would the earth look like?What would the earth look like?
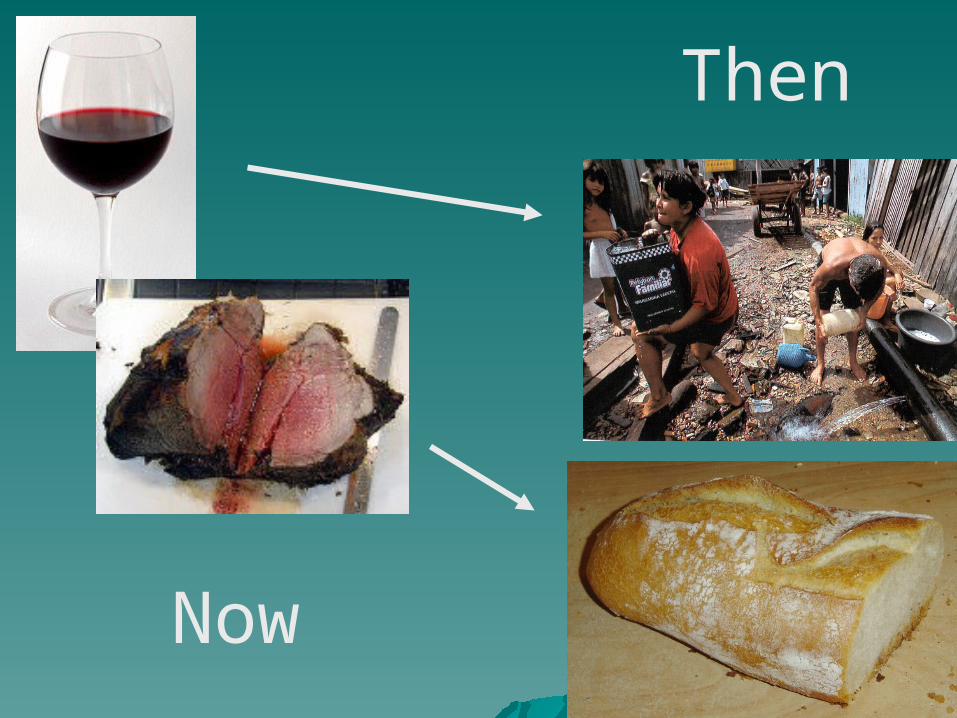
Now
Then

““If you would only cut down your If you would only cut down your redwood forests, you could use redwood forests, you could use the lumber to build houses and the lumber to build houses and then grow potatoes on the land, then grow potatoes on the land, shipping the food to us. Since we shipping the food to us. Since we
are all passengers together on are all passengers together on Spaceship Earth, are you not Spaceship Earth, are you not duty bound to do so? Which is duty bound to do so? Which is more precious, trees or human more precious, trees or human
being?”being?”


Humans or Humans or Trees???Trees???

““utterly dismal theorem”utterly dismal theorem”free food……….free food……….

““give a man a fish….give a man a fish….Feed him for a day….Feed him for a day….
Teach a man to fish feed Teach a man to fish feed him for a lifetime!”him for a lifetime!”
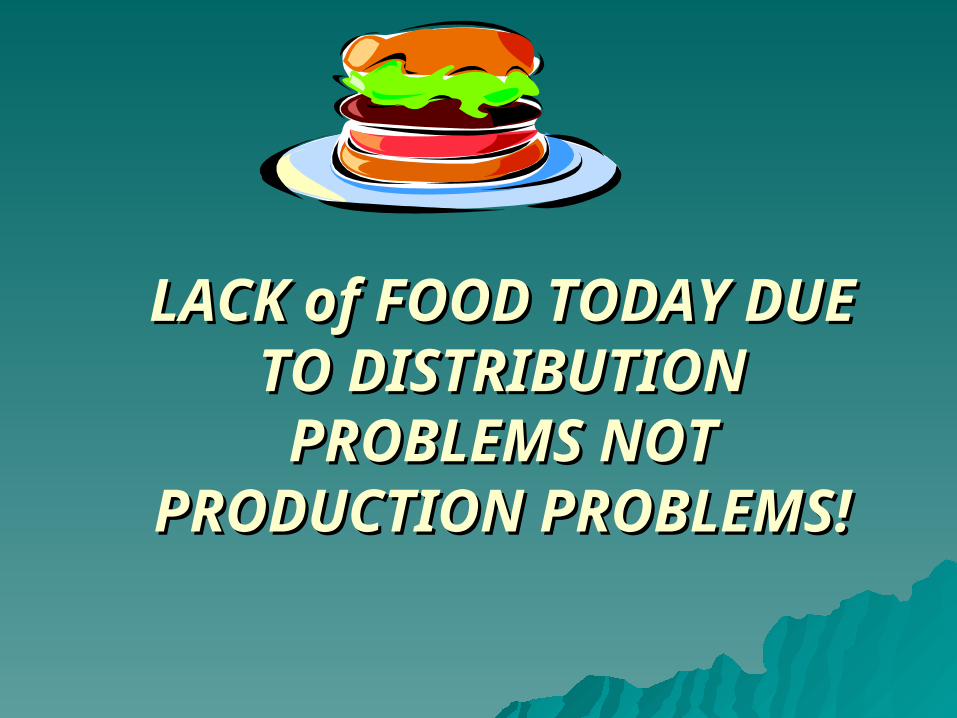
LACK of FOOD TODAY DUE LACK of FOOD TODAY DUE TO DISTRIBUTION TO DISTRIBUTION PROBLEMS NOT PROBLEMS NOT
PRODUCTION PROBLEMS!PRODUCTION PROBLEMS!
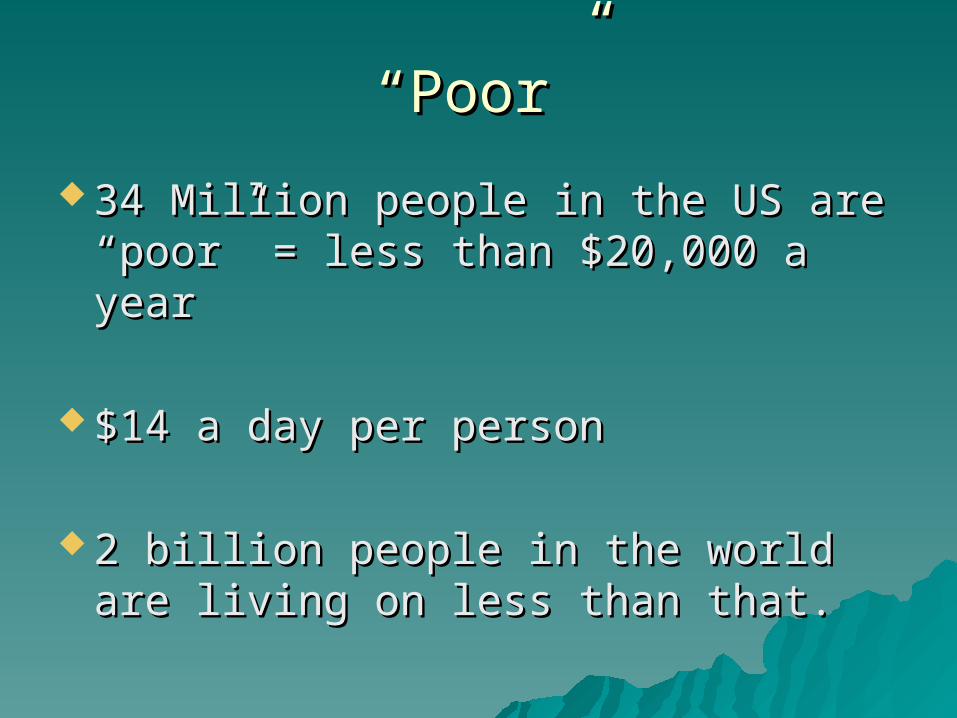
““Poor”Poor”
34 Million people in the US are 34 Million people in the US are “poor” = less than $20,000 a year“poor” = less than $20,000 a year
$14 a day per person$14 a day per person
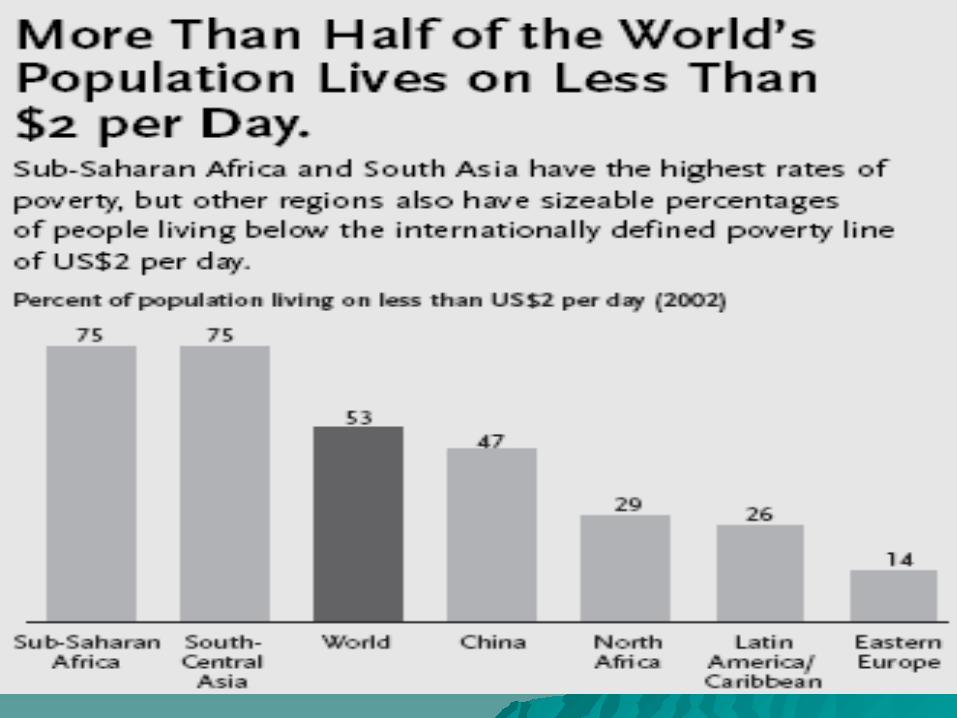
2 billion people in the world are living 2 billion people in the world are living on less than that. on less than that.
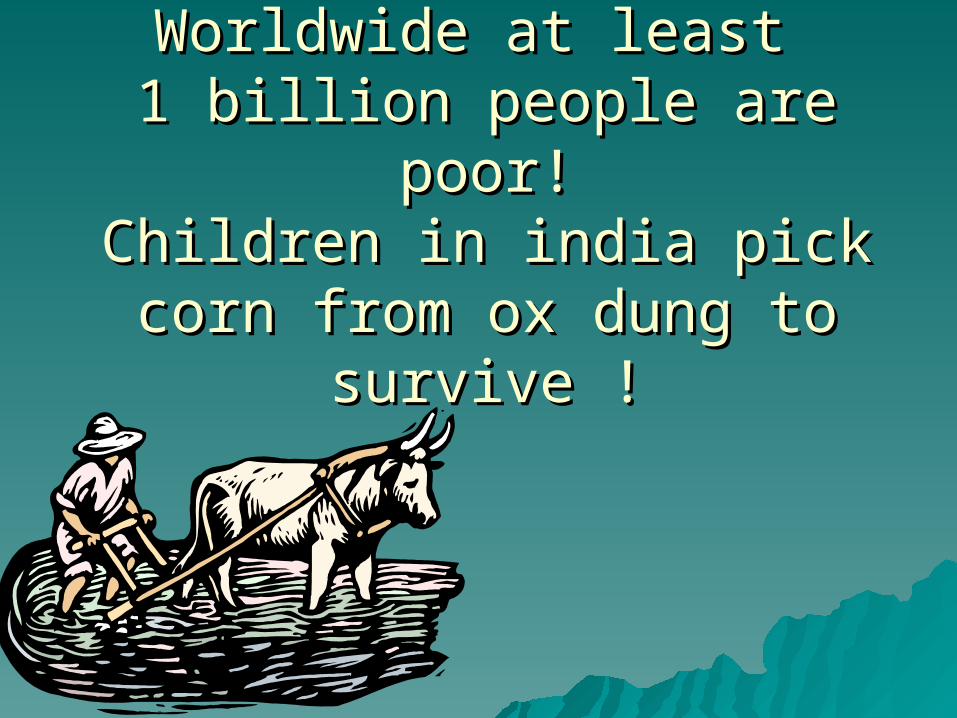
Worldwide at least Worldwide at least 1 billion people are poor!1 billion people are poor!
Children in india pickChildren in india pickcorn from ox dung to corn from ox dung to
survive !survive !
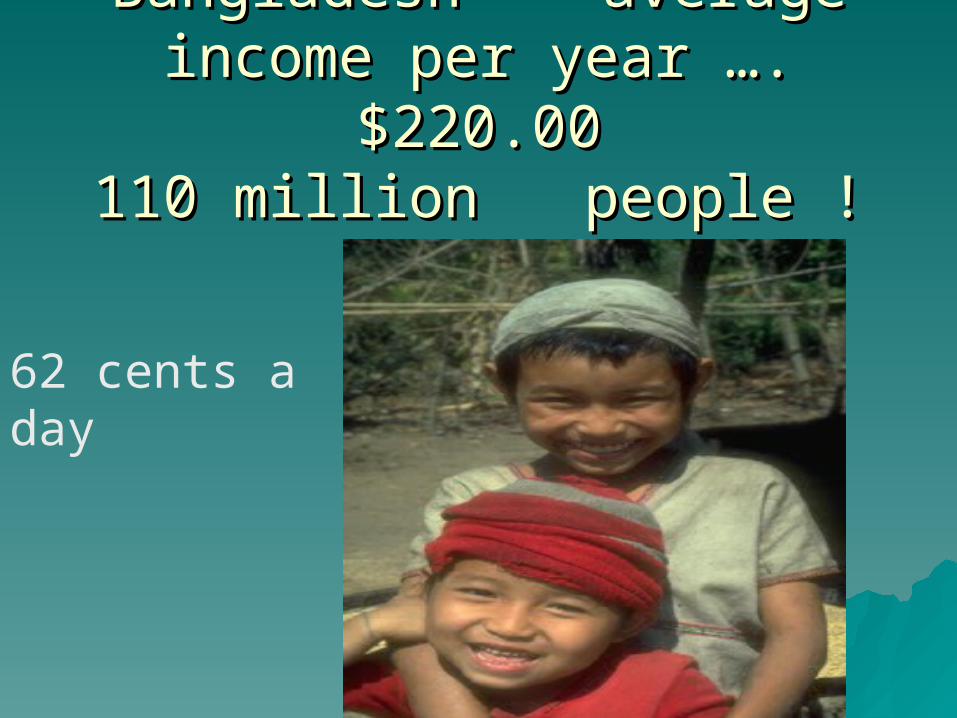
Bangladesh----averageBangladesh----averageincome per year ….$220.00income per year ….$220.00
110 million people !110 million people !
62 cents a day

A meal for 12 people in India’sA meal for 12 people in India’s finest finest restaurant cost in restaurant cost in
American dollars =$20.00American dollars =$20.00

On a separate piece of paper add up On a separate piece of paper add up everything you spend in a month and everything you spend in a month and divide it by 30 to find your daily divide it by 30 to find your daily spending.spending.– Car insuranceCar insurance– Car paymentCar payment– Rent (divide by # of people in you home)Rent (divide by # of people in you home)– FoodFood– Cell phoneCell phone– EntertainmentEntertainment– Etc. Etc.
Question?Question?
What is your suggestion for What is your suggestion for controlling the controlling the overpopulation issues in overpopulation issues in developingdeveloping nations? nations?Please write Please write 1 paragraph1 paragraph discussing your answer.discussing your answer.
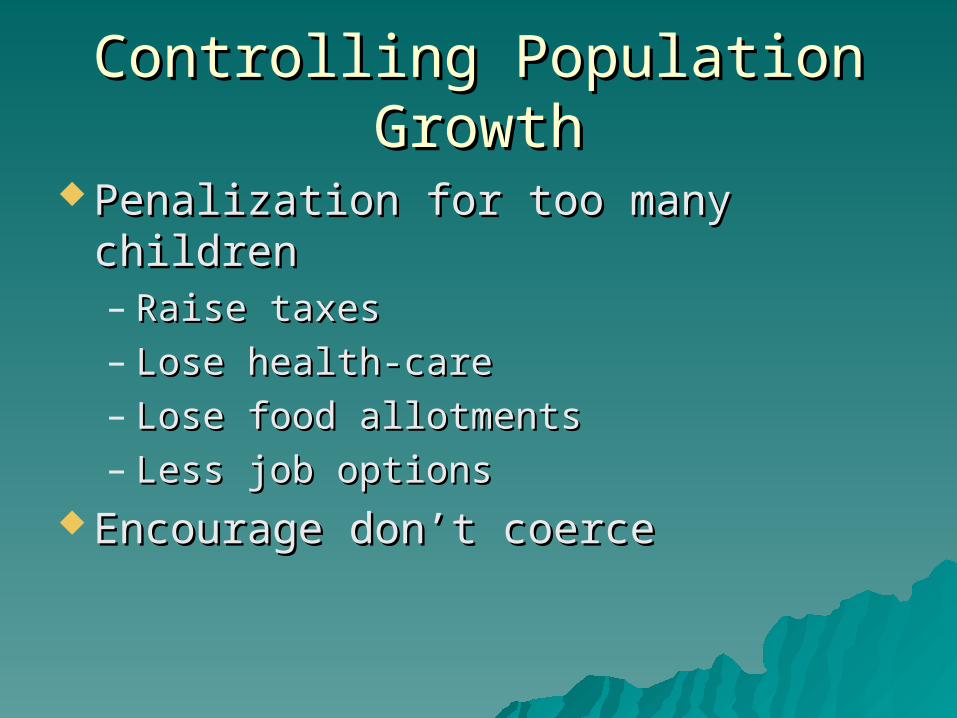
Controlling Population GrowthControlling Population Growth
Penalization for too many childrenPenalization for too many children– Raise taxesRaise taxes– Lose health-careLose health-care– Lose food allotmentsLose food allotments– Less job optionsLess job options
Encourage don’t coerceEncourage don’t coerce
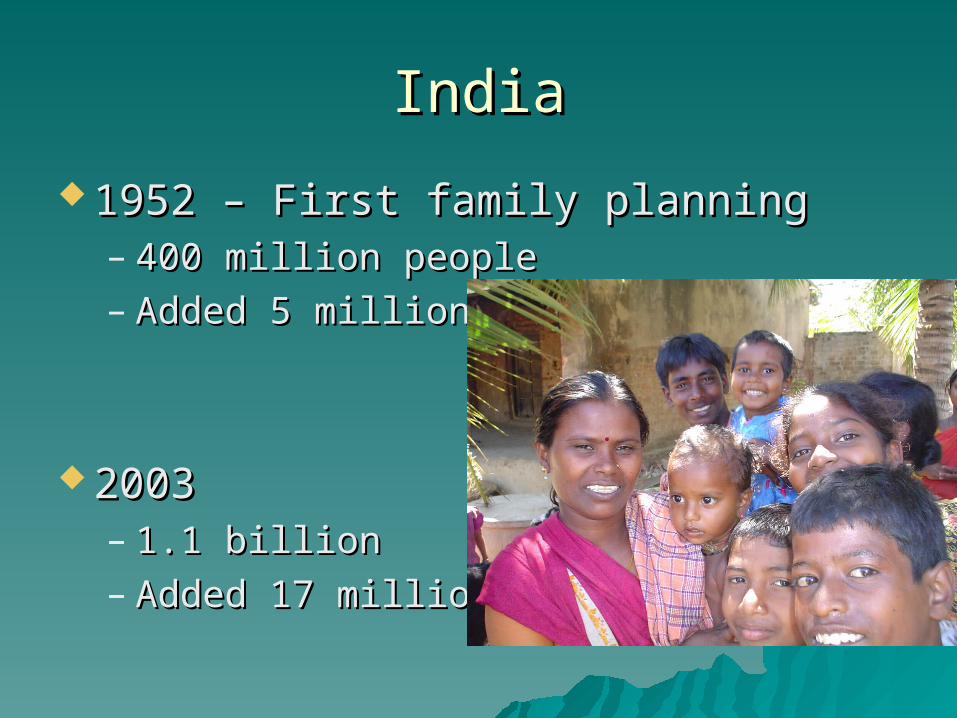
IndiaIndia
1952 – First family planning1952 – First family planning– 400 million people400 million people– Added 5 million Added 5 million
20032003– 1.1 billion1.1 billion– Added 17 millionAdded 17 million
India’s effortsIndia’s efforts
Total Fertility Rate (TFR)Total Fertility Rate (TFR)– 1970 – 5.31970 – 5.3– 2003 – 3.12003 – 3.1
Working somewhat…Working somewhat…
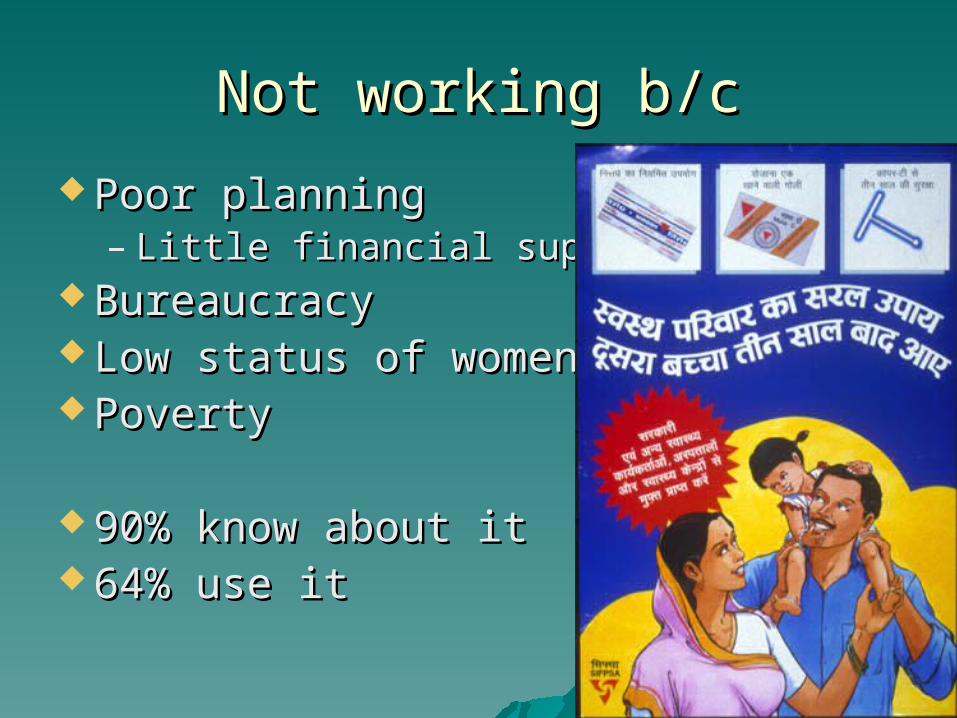
Not working b/cNot working b/c
Poor planningPoor planning– Little financial supportLittle financial support
BureaucracyBureaucracy Low status of womenLow status of women PovertyPoverty
90% know about it90% know about it 64% use it64% use it
ChinaChina
1972 – 20031972 – 2003 TFR 5.7 – 1.7 (WOW!)TFR 5.7 – 1.7 (WOW!)
HOW?!?HOW?!?
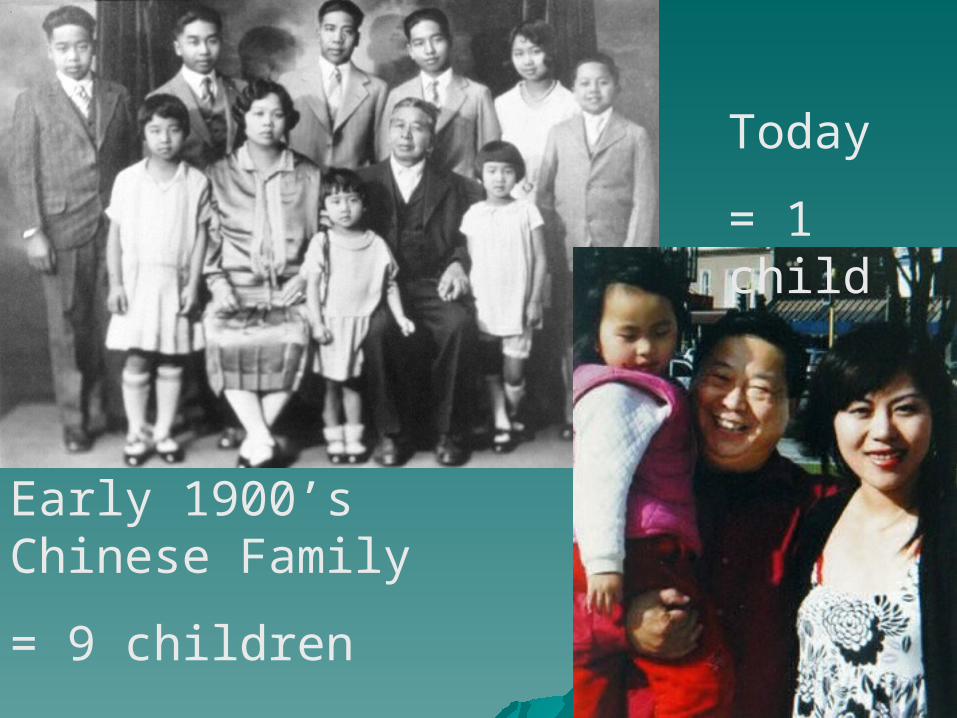
Early 1900’s Chinese Family
= 9 children
Today
= 1 child
HowHow
Most extinsive, Most extinsive, intrusiveintrusive, and strict , and strict population control in the world!!population control in the world!!
They make your life very hard if you They make your life very hard if you have more than one!!have more than one!!
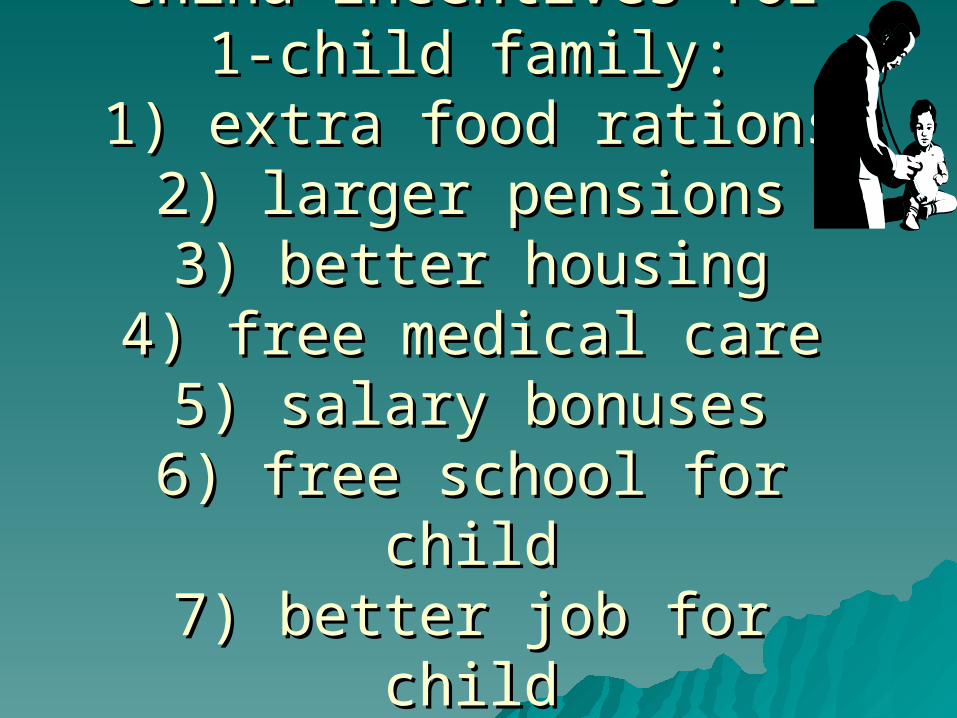
China incentives for 1-China incentives for 1-child family:child family:
1) extra food rations1) extra food rations2) larger pensions2) larger pensions3) better housing3) better housing
4) free medical care4) free medical care5) salary bonuses5) salary bonuses
6) free school for child6) free school for child7) better job for child7) better job for child
The government provides The government provides
Free sterilizationFree sterilization Free contraceptivesFree contraceptives Free/mandatory abortionsFree/mandatory abortions
83% use birth control!!83% use birth control!!
Surprised?Surprised?
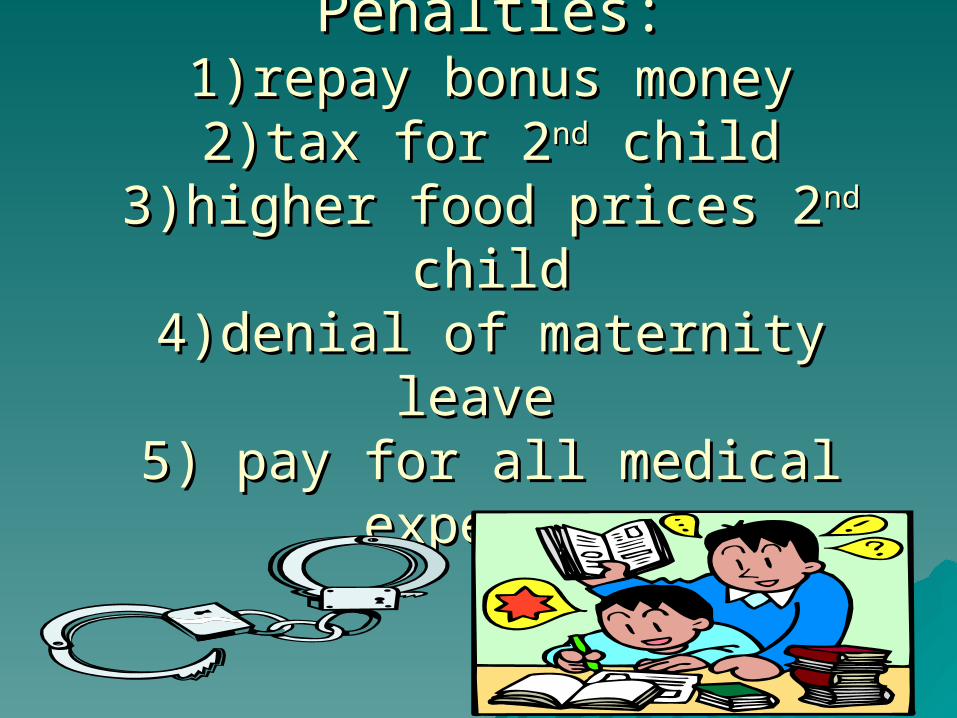
Penalties:Penalties:1)repay bonus money1)repay bonus money
2)tax for 22)tax for 2ndnd child child3)higher food prices 23)higher food prices 2ndnd child child4)denial of maternity leave 4)denial of maternity leave
5) pay for all medical expenses5) pay for all medical expenses
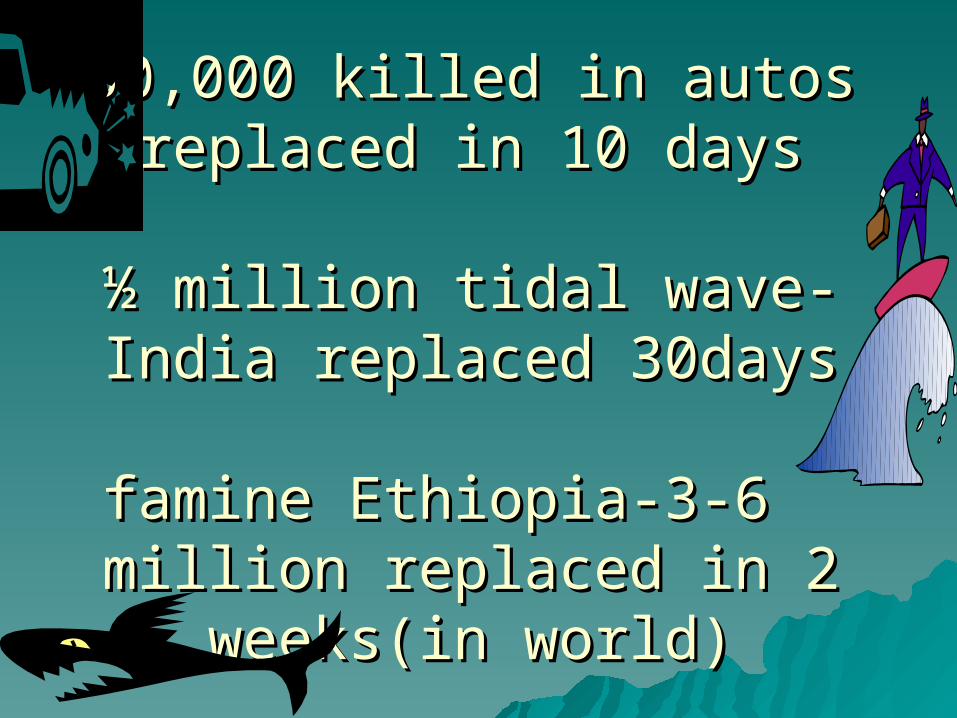
50,000 killed in autos50,000 killed in autosreplaced in 10 daysreplaced in 10 days
½ million tidal wave-India ½ million tidal wave-India replaced 30daysreplaced 30days
famine Ethiopia-3-6 famine Ethiopia-3-6 million replaced in 2 million replaced in 2
weeks(in world)weeks(in world)
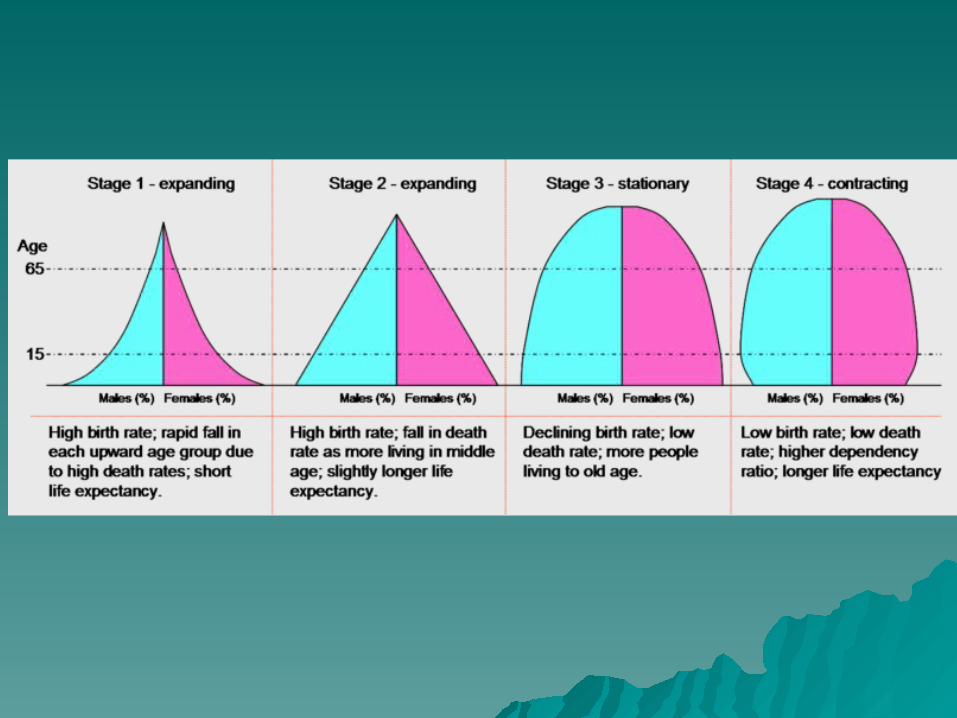
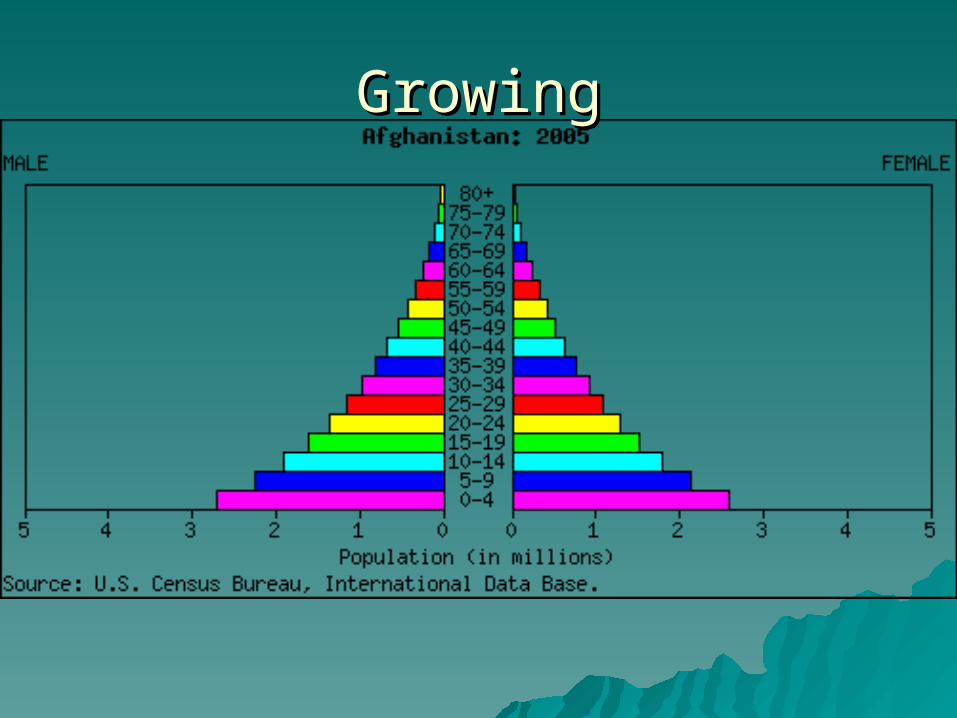
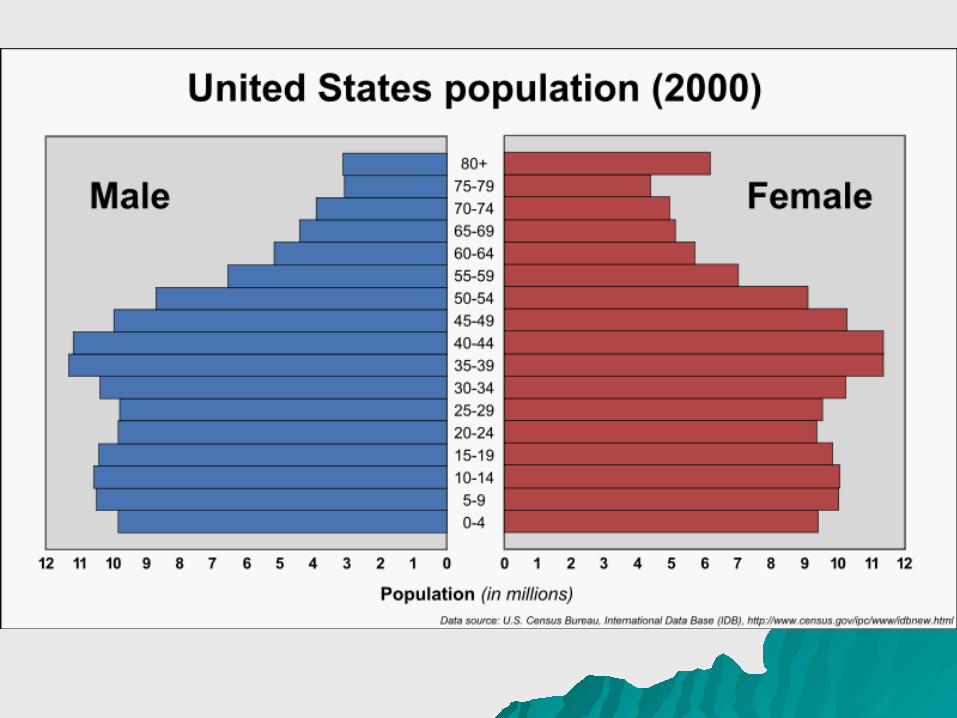
GrowingGrowing
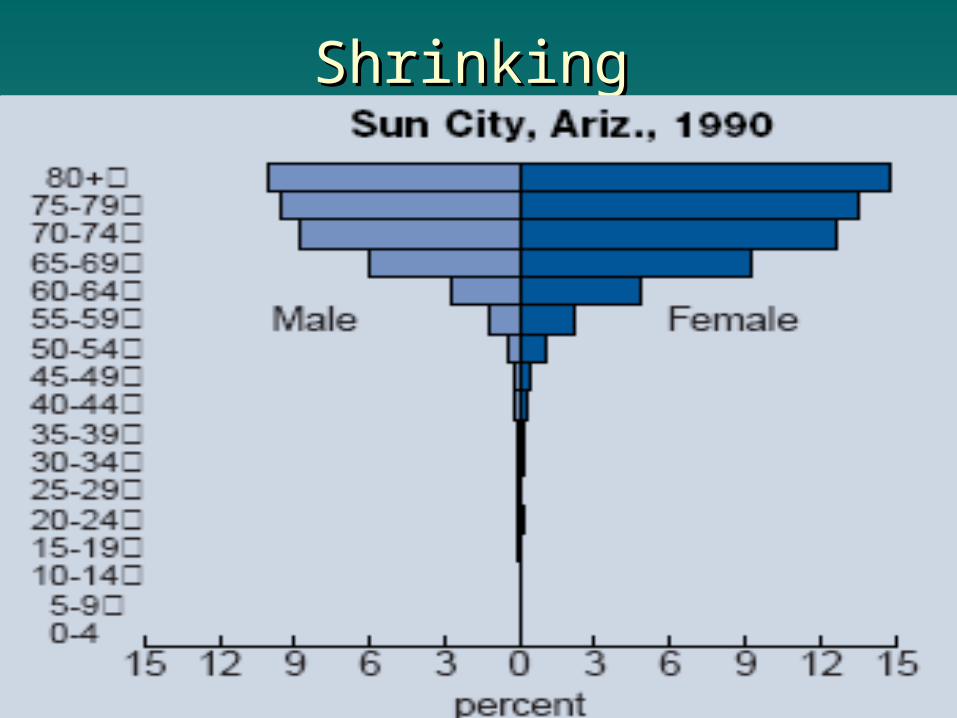
ShrinkingShrinking
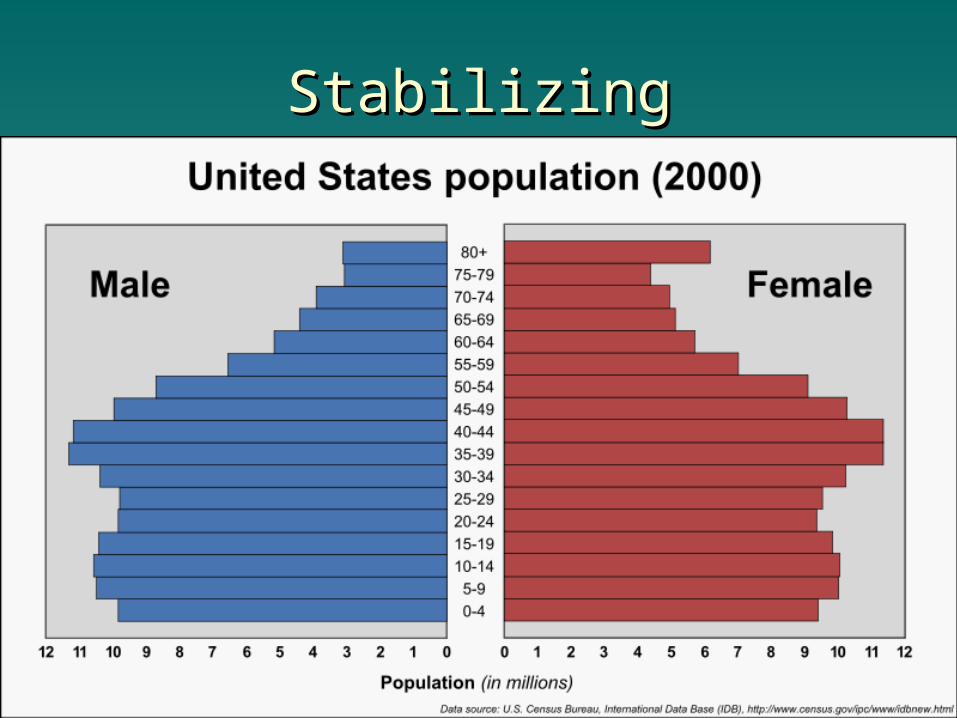
StabilizingStabilizing
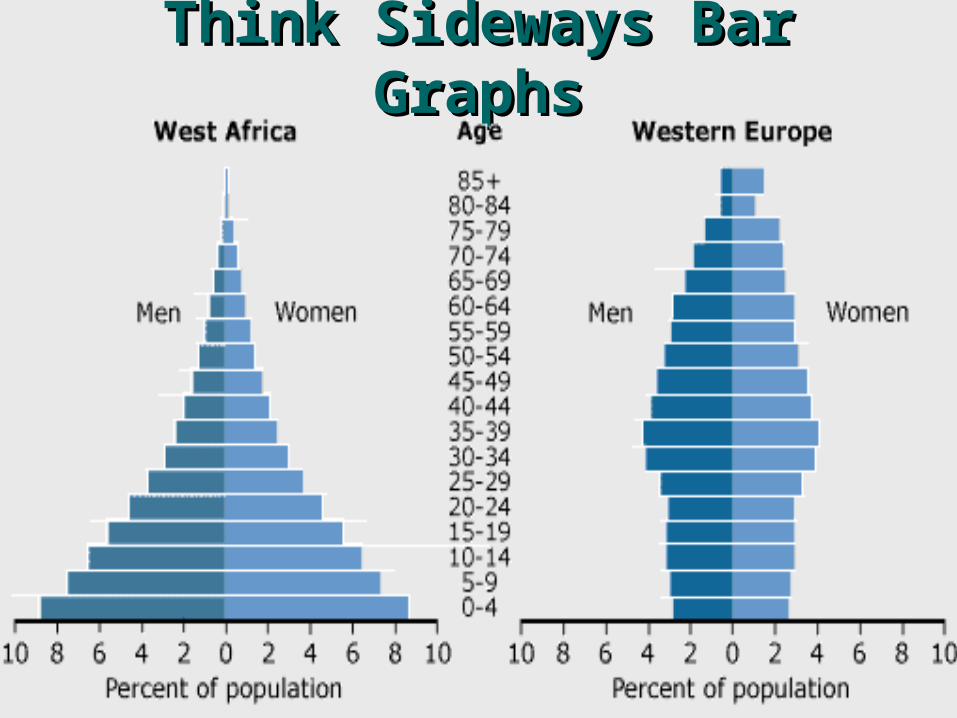
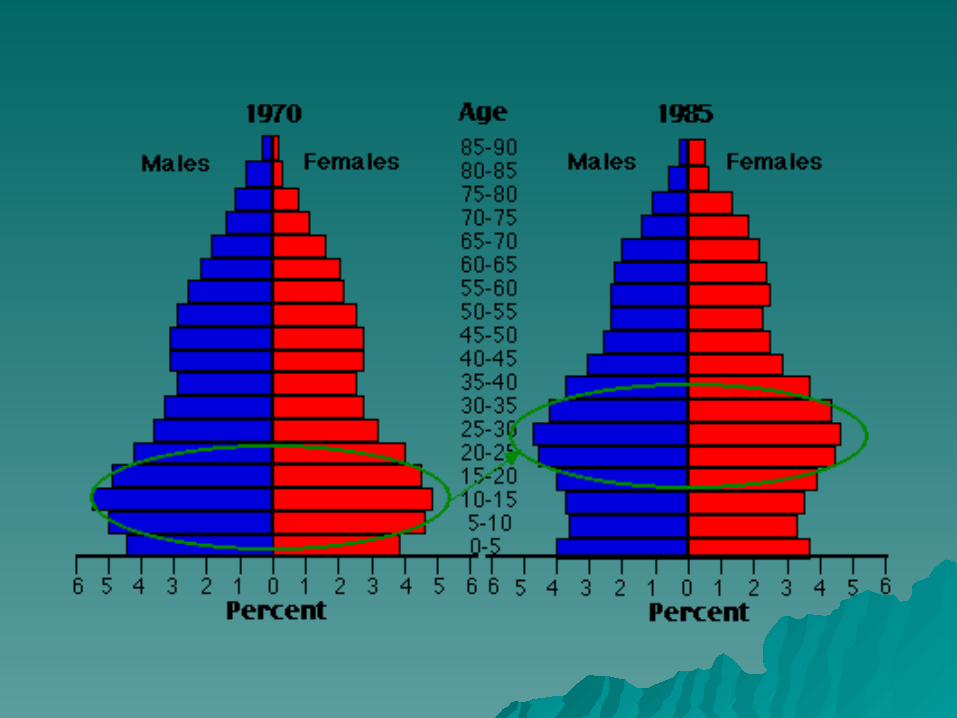
Think Sideways Bar GraphsThink Sideways Bar Graphs
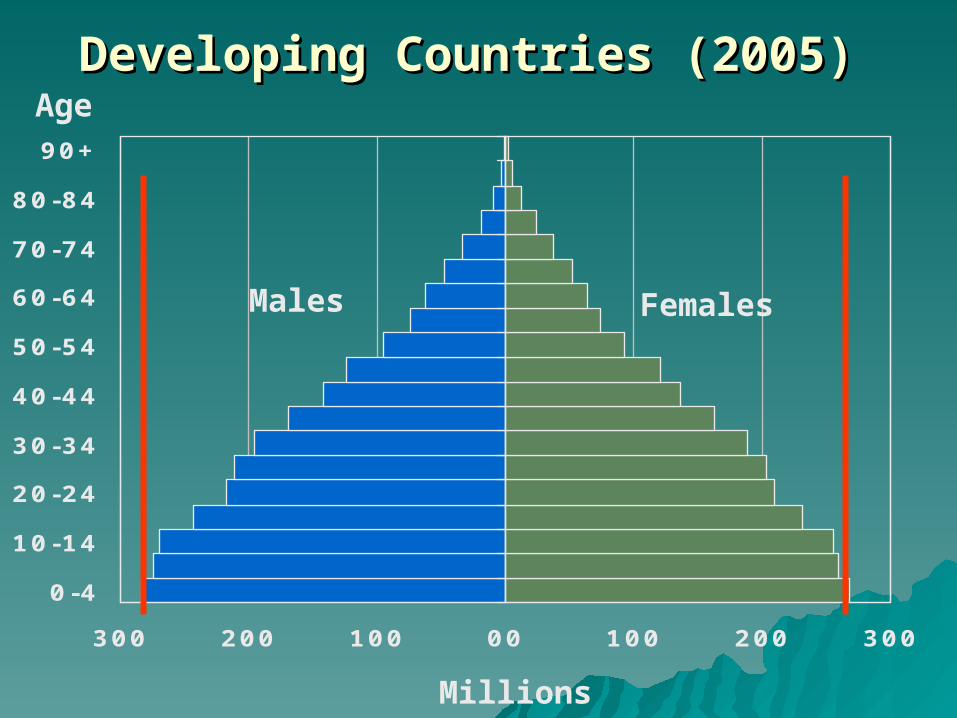
300 200 100 00 100 200 300
0-4
10-14
20-24
30-34
40-44
50-54
60-64
70-74
80-84
90+
Females
Age
Males
Millions
Developing Countries (2005)Developing Countries (2005)
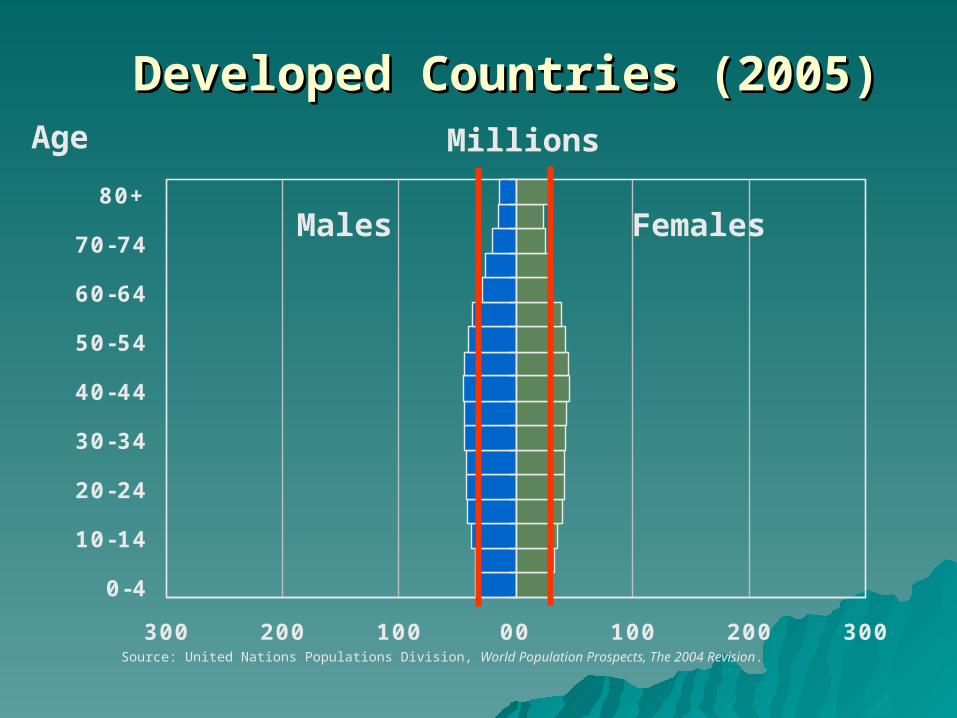
300 200 100 00 100 200 300
0-4
10-14
20-24
30-34
40-44
50-54
60-64
70-74
80+
Females
Source: United Nations Populations Division, World Population Prospects, The 2004 Revision.
Age
Males
Millions
Developed Countries (2005)Developed Countries (2005)
http://www.census.gov/ipc/www/idb/http://www.census.gov/ipc/www/idb/pyramids.html pyramids.html
AssignmentAssignment
Draw your own population pyramidDraw your own population pyramid
Include whether your population is Include whether your population is increasing, stabilizing, or shrinkingincreasing, stabilizing, or shrinking
Turn statistics page in with your Turn statistics page in with your graphgraph