Embed Size (px)
Citation preview
Slide 1
PENSION PATTERNS & REFORM CHALLENGES IN SUB-SAHARAN AFRICA
Pensions Core Course
Mark Dorfman
The World Bank
March 7, 2014
Slide 2 March 7, 2014
Organization
1. Design summary 2. Challenges 3. Design reform principles 4. A process for evaluation
Slide 3 March 7, 2014
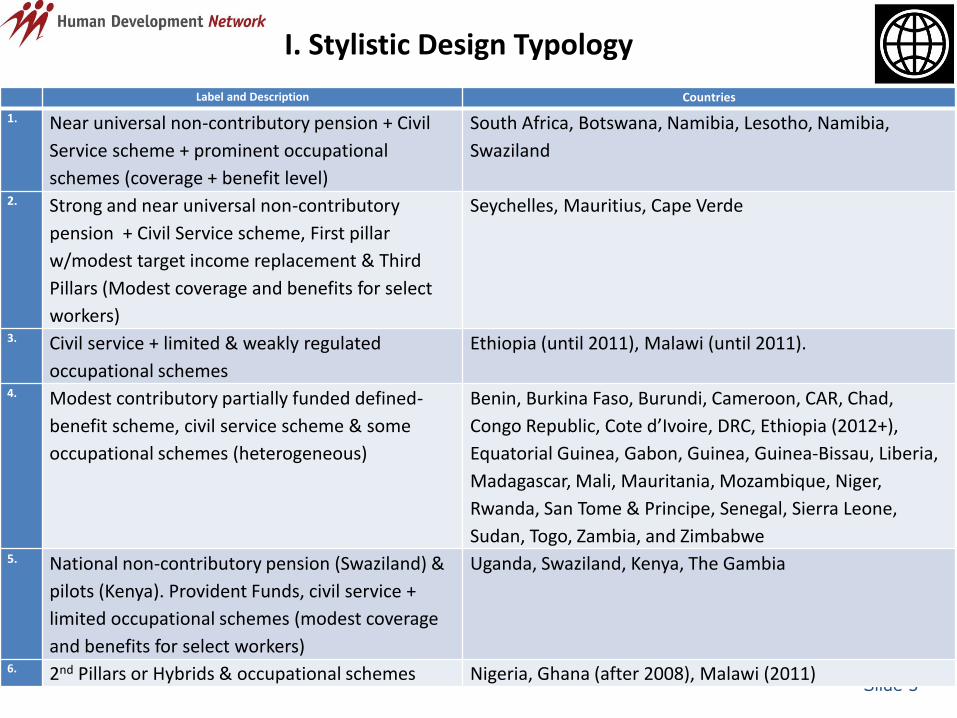
I. Stylistic Design Typology
Label and Description Countries
1. Near universal non-contributory pension + Civil
Service scheme + prominent occupational
schemes (coverage + benefit level)
South Africa, Botswana, Namibia, Lesotho, Namibia,
Swaziland
2. Strong and near universal non-contributory
pension + Civil Service scheme, First pillar
w/modest target income replacement & Third
Pillars (Modest coverage and benefits for select
workers)
Seychelles, Mauritius, Cape Verde
3. Civil service + limited & weakly regulated
occupational schemes
Ethiopia (until 2011), Malawi (until 2011).
4. Modest contributory partially funded defined-
benefit scheme, civil service scheme & some
occupational schemes (heterogeneous)
Benin, Burkina Faso, Burundi, Cameroon, CAR, Chad,
Congo Republic, Cote d’Ivoire, DRC, Ethiopia (2012+),
Equatorial Guinea, Gabon, Guinea, Guinea-Bissau, Liberia,
Madagascar, Mali, Mauritania, Mozambique, Niger,
Rwanda, San Tome & Principe, Senegal, Sierra Leone,
Sudan, Togo, Zambia, and Zimbabwe 5. National non-contributory pension (Swaziland) &
pilots (Kenya). Provident Funds, civil service +
limited occupational schemes (modest coverage
and benefits for select workers)
Uganda, Swaziland, Kenya, The Gambia
6. 2nd Pillars or Hybrids & occupational schemes Nigeria, Ghana (after 2008), Malawi (2011)
Slide 4 March 7, 2014
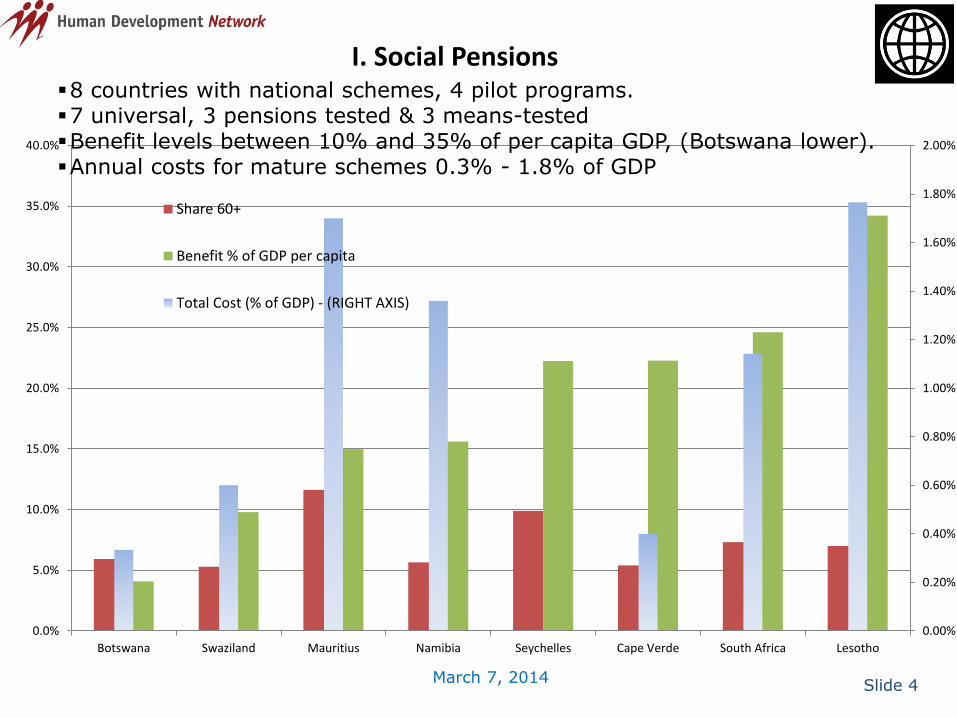
I. Social Pensions
0.00%
0.20%
0.40%
0.60%
0.80%
1.00%
1.20%
1.40%
1.60%
1.80%
2.00%
0.0%
5.0%
10.0%
15.0%
20.0%
25.0%
30.0%
35.0%
40.0%
Botswana Swaziland Mauritius Namibia Seychelles Cape Verde South Africa Lesotho
Share 60+
Benefit % of GDP per capita
Total Cost (% of GDP) - (RIGHT AXIS)
8 countries with national schemes, 4 pilot programs. 7 universal, 3 pensions tested & 3 means-tested Benefit levels between 10% and 35% of per capita GDP, (Botswana lower). Annual costs for mature schemes 0.3% - 1.8% of GDP
Slide 5 March 7, 2014
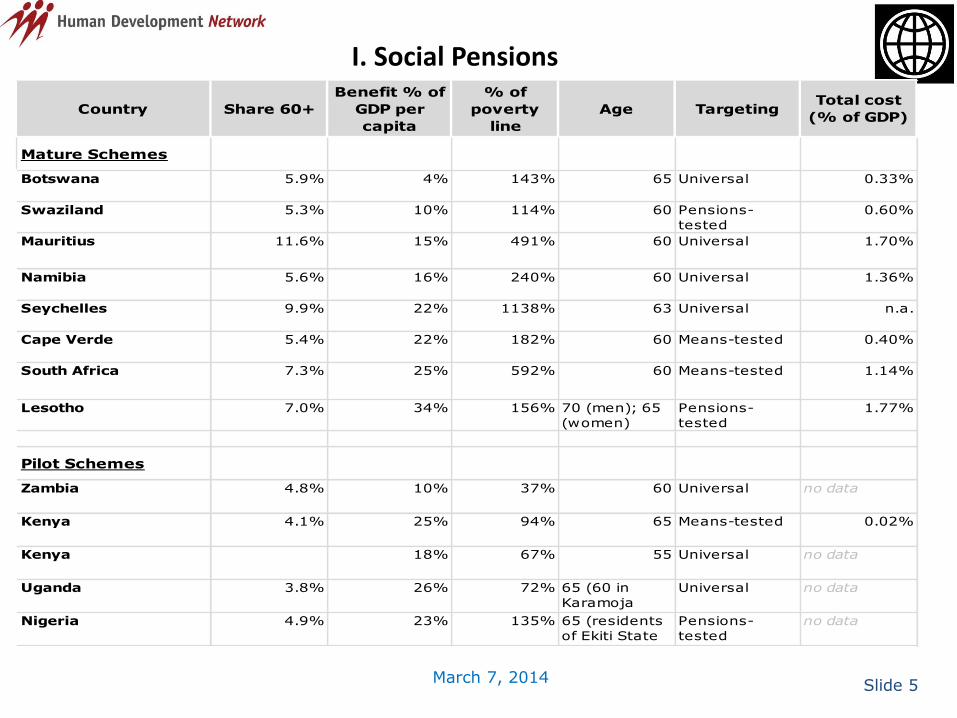
I. Social Pensions
Country Share 60+
Benefit % of
GDP per
capita
% of
poverty
line
Age TargetingTotal cost
(% of GDP)
Mature Schemes
Botswana 5.9% 4% 143% 65 Universal 0.33%
Swaziland 5.3% 10% 114% 60 Pensions-
tested
0.60%
Mauritius 11.6% 15% 491% 60 Universal 1.70%
Namibia 5.6% 16% 240% 60 Universal 1.36%
Seychelles 9.9% 22% 1138% 63 Universal n.a.
Cape Verde 5.4% 22% 182% 60 Means-tested 0.40%
South Africa 7.3% 25% 592% 60 Means-tested 1.14%
Lesotho 7.0% 34% 156% 70 (men); 65
(women)
Pensions-
tested
1.77%
Pilot Schemes
Zambia 4.8% 10% 37% 60 Universal no data
Kenya 4.1% 25% 94% 65 Means-tested 0.02%
Kenya 18% 67% 55 Universal no data
Uganda 3.8% 26% 72% 65 (60 in
Karamoja
Region)
Universal no data
Nigeria 4.9% 23% 135% 65 (residents
of Ekiti State
only)
Pensions-
tested
no data
Slide 6 March 7, 2014
II. Challenges - Earnings-related schemes have largely failed
1.Coverage. Small fraction of covered workers & elderly
2.Fiscal pressure. Civil servant scheme maturation & some aging
3.Efficiency & weak reserve management yielded poor returns & incentives (augmented by administrative costs)
4.Alignment of designs to needs
Slide 7 March 7, 2014
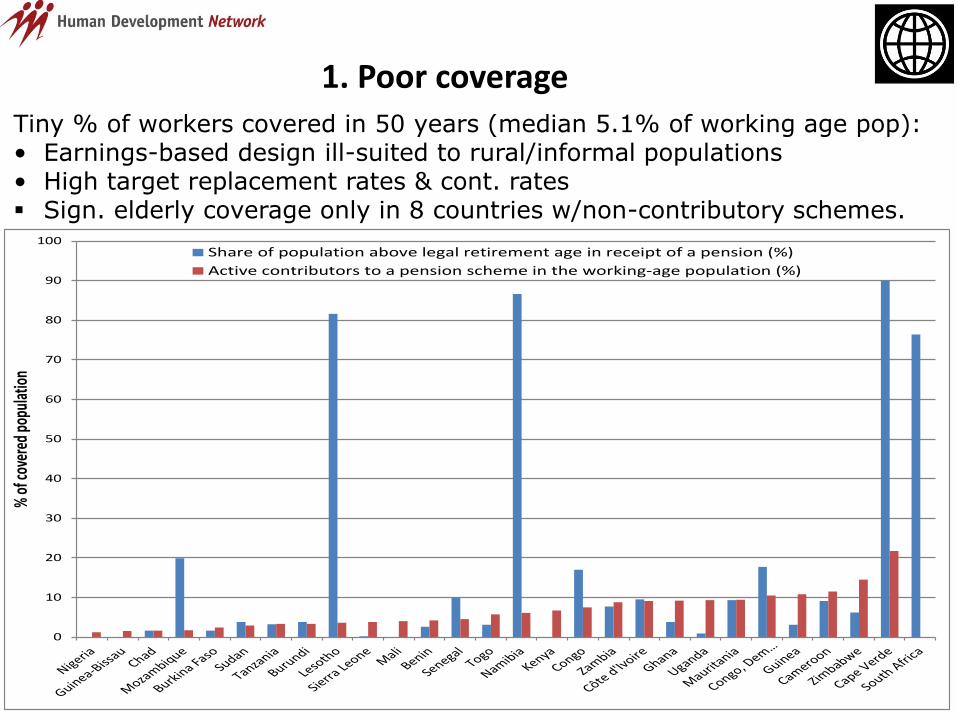
1. Poor coverage
0
10
20
30
40
50
60
70
80
90
100
% o
f cov
ered
pop
ulat
ion
Share of population above legal retirement age in receipt of a pension (%)
Active contributors to a pension scheme in the working-age population (%)
Tiny % of workers covered in 50 years (median 5.1% of working age pop): • Earnings-based design ill-suited to rural/informal populations • High target replacement rates & cont. rates Sign. elderly coverage only in 8 countries w/non-contributory schemes.
Slide 8 March 7, 2014
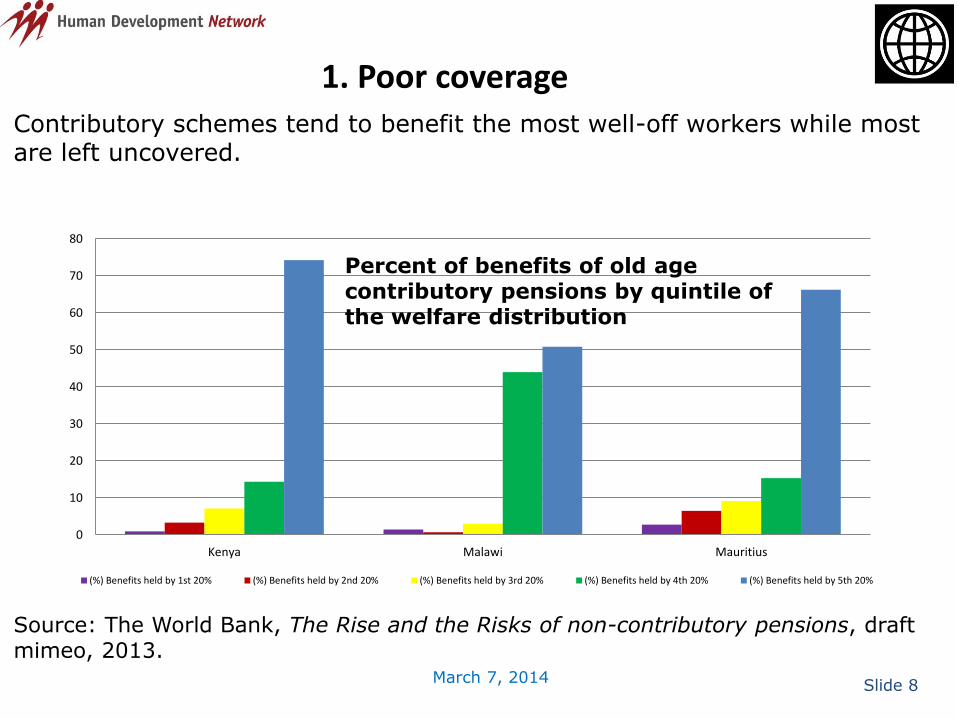
1. Poor coverage
Contributory schemes tend to benefit the most well-off workers while most are left uncovered.
0
10
20
30
40
50
60
70
80
Kenya Malawi Mauritius
(%) Benefits held by 1st 20% (%) Benefits held by 2nd 20% (%) Benefits held by 3rd 20% (%) Benefits held by 4th 20% (%) Benefits held by 5th 20%
Percent of benefits of old age contributory pensions by quintile of the welfare distribution
Source: The World Bank, The Rise and the Risks of non-contributory pensions, draft mimeo, 2013.
Slide 9 March 7, 2014
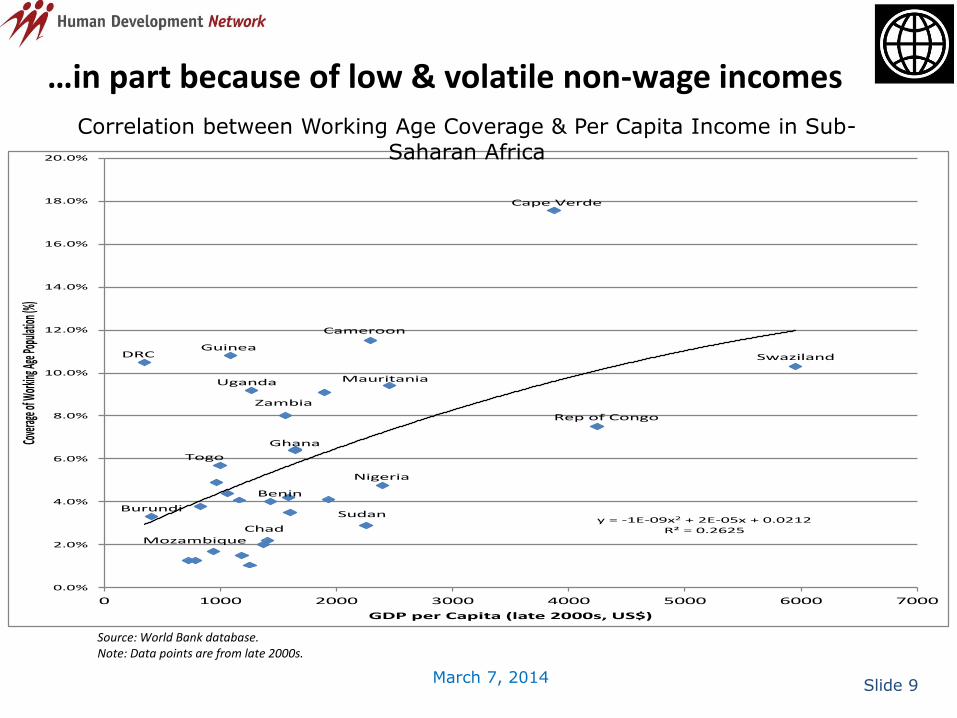
…in part because of low & volatile non-wage incomes
y = -1E-09x2 + 2E-05x + 0.0212R² = 0.2625
0.0%
2.0%
4.0%
6.0%
8.0%
10.0%
12.0%
14.0%
16.0%
18.0%
20.0%
0 1000 2000 3000 4000 5000 6000 7000
Cover
age of
Work
ing Ag
e Pop
ulatio
n (%)
GDP per Capita (late 2000s, US$)
Cape Verde
Cameroon
Uganda
GuineaSwazilandDRC
Mauritania
Nigeria
Ghana
Rep of Congo
SudanBurundi
Chad
Togo
Mozambique
Benin
Zambia
Source: World Bank database. Note: Data points are from late 2000s.
Correlation between Working Age Coverage & Per Capita Income in Sub-Saharan Africa
Slide 10 March 7, 2014
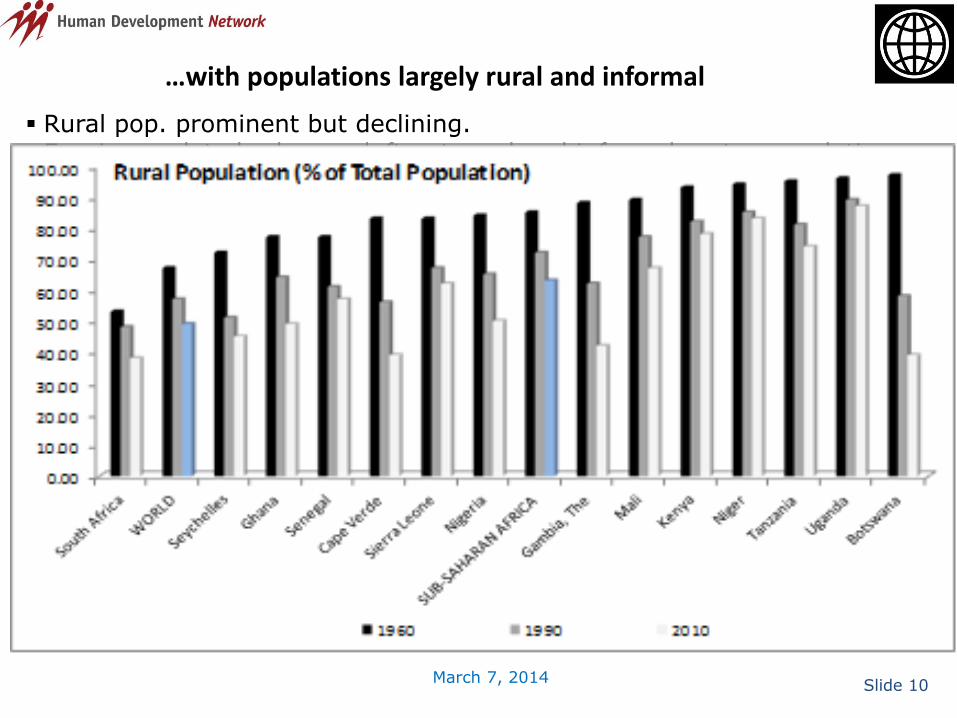
…with populations largely rural and informal
Rural pop. prominent but declining. Earnings-related schemes left out rural and informal sector populations.
Slide 11 March 7, 2014
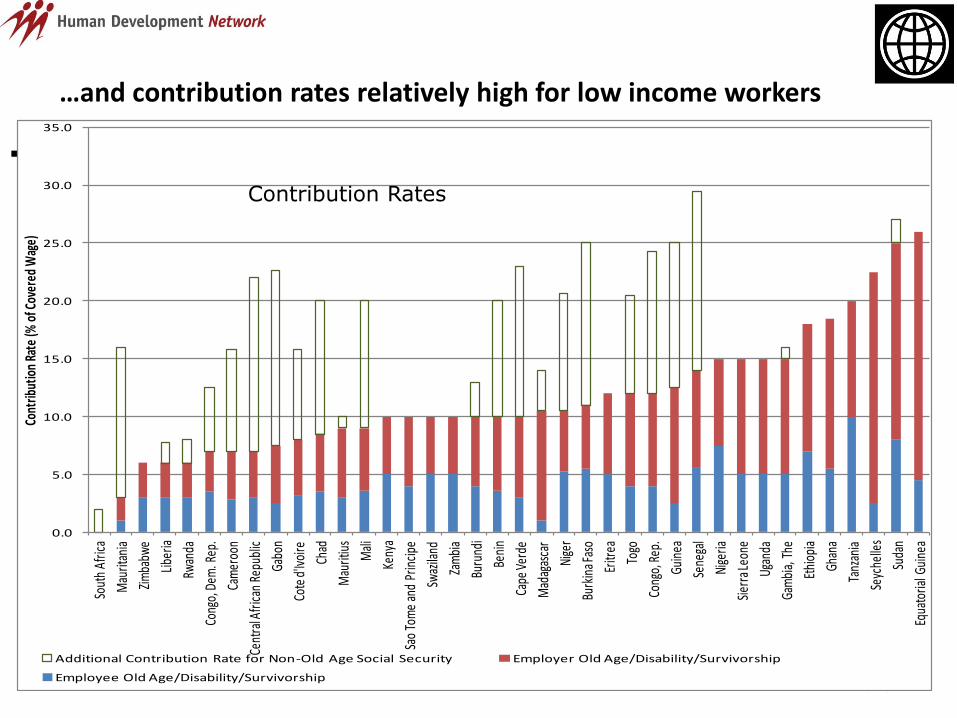
…and contribution rates relatively high for low income workers
A
0.0
5.0
10.0
15.0
20.0
25.0
30.0
35.0
Sout
h Af
rica
Mau
ritan
ia
Zimba
bwe
Liber
ia
Rwan
da
Cong
o, D
em. R
ep.
Cam
eroo
n
Cent
ral A
frica
n Re
publ
ic
Gabo
n
Cote
d'Iv
oire
Chad
Mau
ritiu
s
Mal
i
Keny
a
Sao
Tom
e an
d Pr
incip
e
Swaz
iland
Zam
bia
Buru
ndi
Beni
n
Cape
Verd
e
Mad
agas
car
Nige
r
Burk
ina F
aso
Eritr
ea
Togo
Cong
o, R
ep.
Guin
ea
Sene
gal
Nige
ria
Sierr
a Leo
ne
Ugan
da
Gam
bia,
The
Ethi
opia
Ghan
a
Tanz
ania
Seyc
helle
s
Suda
n
Equa
toria
l Gui
nea
Cont
ribut
ion
Rate
(% o
f Cov
ered
Wag
e)
Additional Contribution Rate for Non-Old Age Social Security Employer Old Age/Disability/Survivorship
Employee Old Age/Disability/Survivorship
Contribution Rates
Slide 12 March 7, 2014
2. Compounding the inequity of support is an emerging fiscal sustainability issue, particularly in civil servant schemes
•Many pensions, especially for civil servants, starting to consume an increasing portion of government budgets, potentially crowding out other programs.
• Partly due to flawed parameters (contribution rates and benefit formulae) inconsistent w/long-run balances & partly worsening scheme demographics.
• Early stage in demographic transition, but covered workforce (esp. in civil servant schemes) older and aging more rapidly.
•Separate civil service & national schemes (except CV, Zambia, Ghana) segment labor markets
Slide 13 March 7, 2014
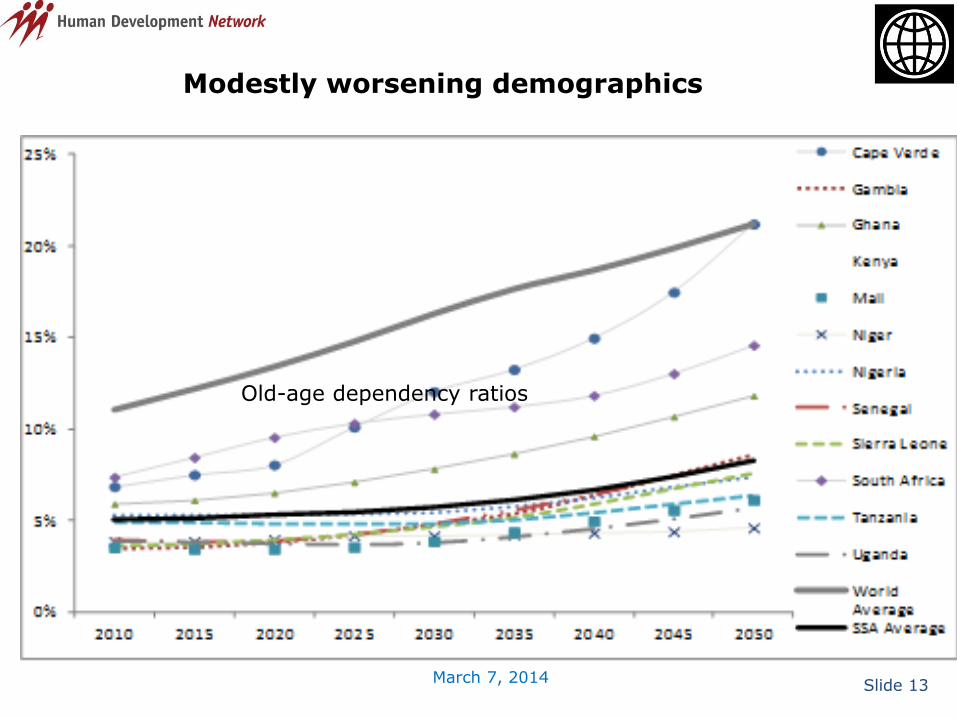
Modestly worsening demographics
Old-age dependency ratios
Slide 14 March 7, 2014
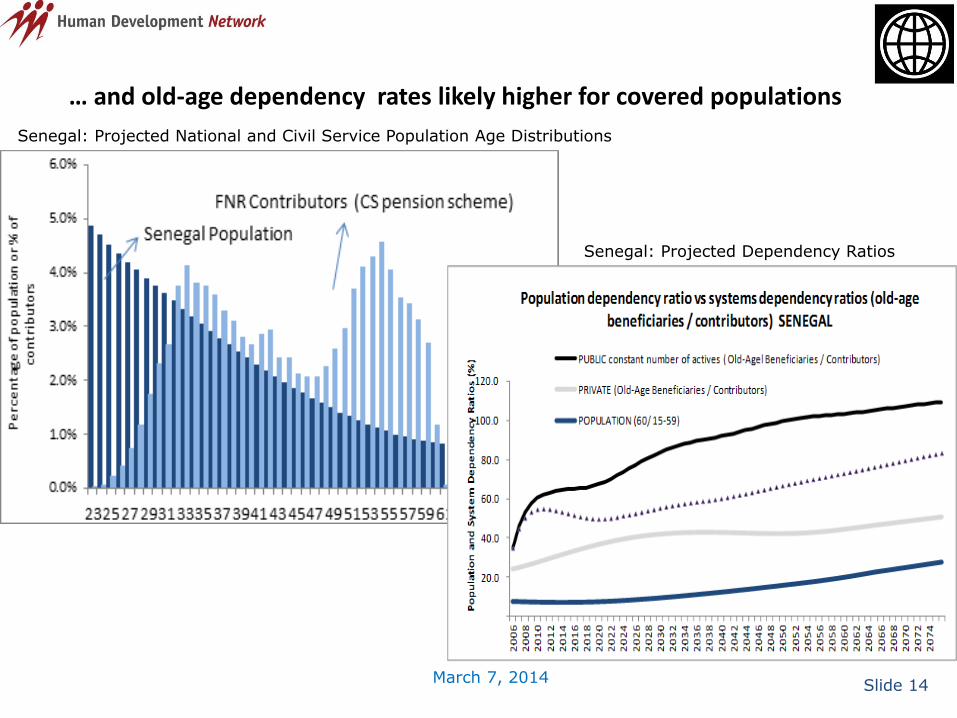
… and old-age dependency rates likely higher for covered populations
Senegal: Projected National and Civil Service Population Age Distributions
Senegal: Projected Dependency Ratios
Slide 15 March 7, 2014
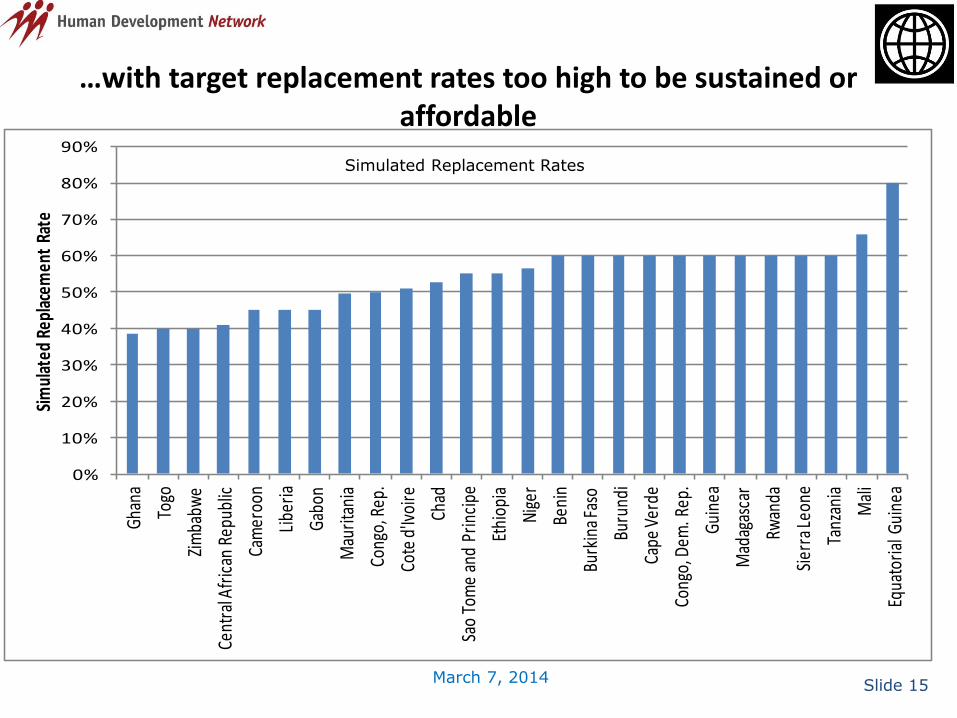
…with target replacement rates too high to be sustained or affordable
0%
10%
20%
30%
40%
50%
60%
70%
80%
90%Gh
ana
Togo
Zim
babw
e
Cent
ral A
fric
an R
epub
lic
Cam
eroo
n
Libe
ria
Gabo
n
Mau
ritan
ia
Cong
o, R
ep.
Cote
d'Iv
oire
Chad
Sao
Tom
e an
d Pr
inci
pe
Ethi
opia
Nige
r
Beni
n
Burk
ina F
aso
Buru
ndi
Cape
Ver
de
Cong
o, D
em. R
ep.
Guin
ea
Mad
agas
car
Rwan
da
Sier
ra Le
one
Tanz
ania
Mal
i
Equa
toria
l Gui
nea
Sim
ulat
ed R
epla
cem
ent
Rate
Simulated Replacement Rates
Slide 16 March 7, 2014
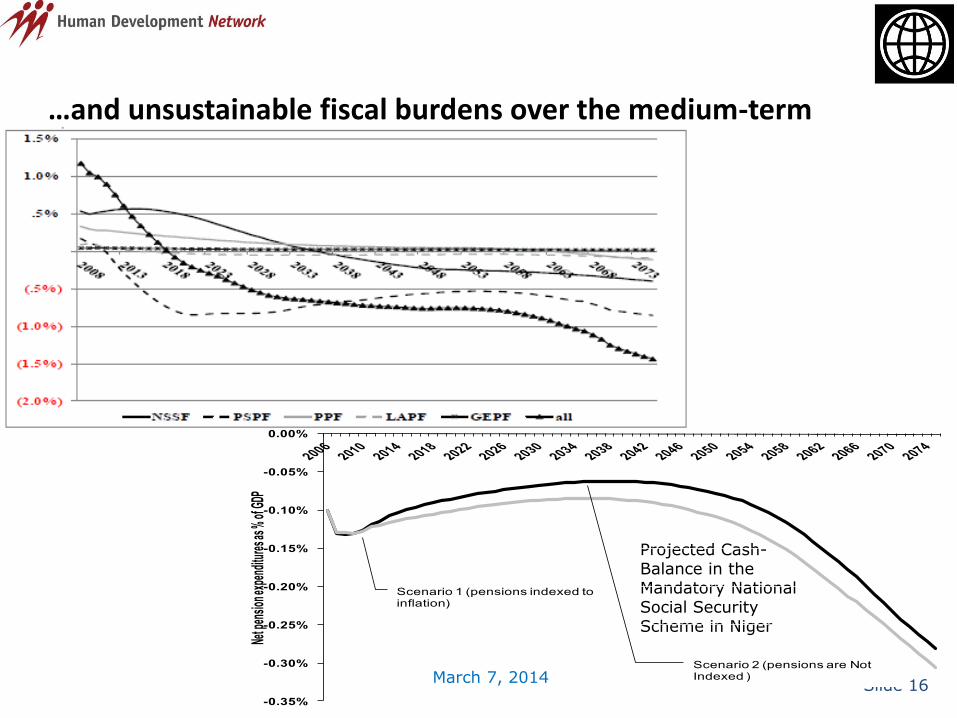
…and unsustainable fiscal burdens over the medium-term
Tanzania: Pension Financing Gaps
Projected Cash-Balance in the Mandatory National Social Security Scheme in Niger
-0.35%
-0.30%
-0.25%
-0.20%
-0.15%
-0.10%
-0.05%
0.00%
Net p
ensio
n exp
endit
ures
as %
of G
DP
Scenario 1 (pensions indexed to inflation)
Scenario 2 (pensions are Not Indexed )
Slide 17 March 7, 2014
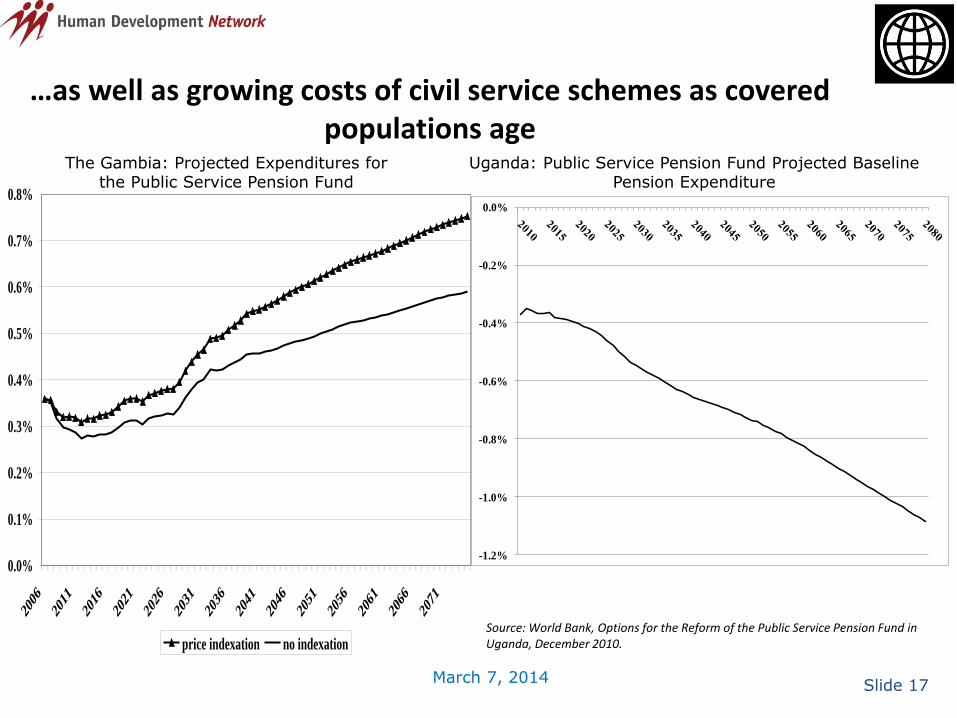
…as well as growing costs of civil service schemes as covered populations age
0.0%
0.1%
0.2%
0.3%
0.4%
0.5%
0.6%
0.7%
0.8%
2006
2011
2016
2021
2026
2031
2036
2041
2046
2051
2056
2061
2066
2071
price indexation no indexation
The Gambia: Projected Expenditures for the Public Service Pension Fund
Uganda: Public Service Pension Fund Projected Baseline Pension Expenditure
-1.2%
-1.0%
-0.8%
-0.6%
-0.4%
-0.2%
0.0%
Source: World Bank, Options for the Reform of the Public Service Pension Fund in Uganda, December 2010.
Slide 18 March 7, 2014
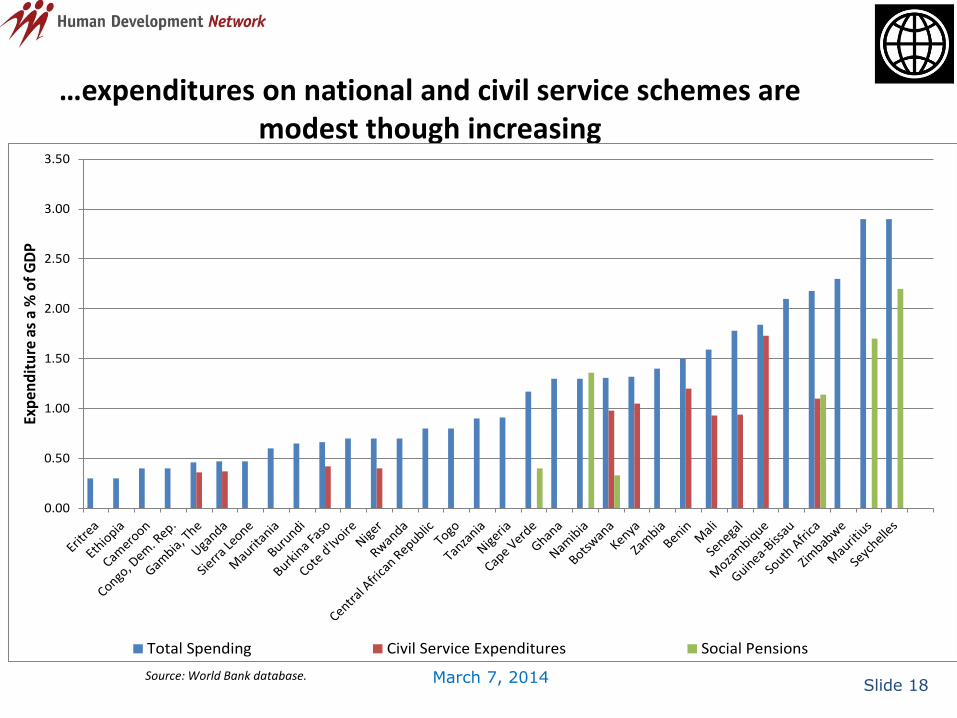
…expenditures on national and civil service schemes are modest though increasing
Pension Spending and Civil Service Pension Spending (% of GDP – late 2000s)
Source: World Bank database.
0.00
0.50
1.00
1.50
2.00
2.50
3.00
3.50
Exp
end
itu
re a
s a
% o
f G
DP
Total Spending Civil Service Expenditures Social Pensions
Slide 19 March 7, 2014
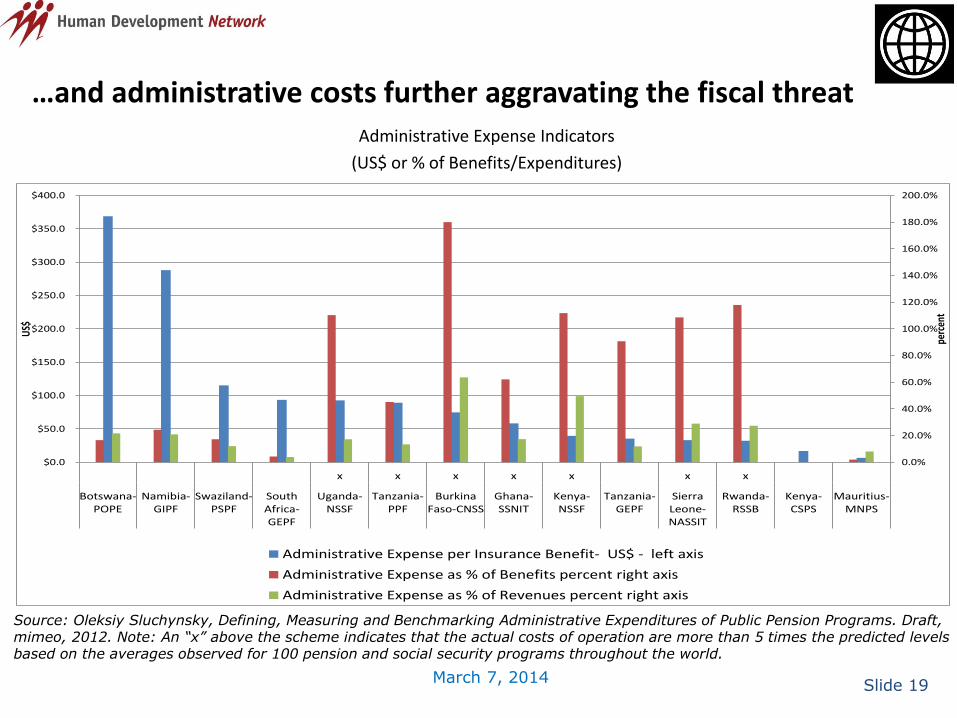
…and administrative costs further aggravating the fiscal threat Administrative Expense Indicators
(US$ or % of Benefits/Expenditures)
0.0%
20.0%
40.0%
60.0%
80.0%
100.0%
120.0%
140.0%
160.0%
180.0%
200.0%
$0.0
$50.0
$100.0
$150.0
$200.0
$250.0
$300.0
$350.0
$400.0
x x x x x x x
Botswana-POPE
Namibia-GIPF
Swaziland-PSPF
SouthAfrica-GEPF
Uganda-NSSF
Tanzania-PPF
BurkinaFaso-CNSS
Ghana-SSNIT
Kenya-NSSF
Tanzania-GEPF
SierraLeone-NASSIT
Rwanda-RSSB
Kenya-CSPS
Mauritius-MNPS
perc
ent
US$
Administrative Expense per Insurance Benefit- US$ - left axis
Administrative Expense as % of Benefits percent right axis
Administrative Expense as % of Revenues percent right axis
Source: Oleksiy Sluchynsky, Defining, Measuring and Benchmarking Administrative Expenditures of Public Pension Programs. Draft, mimeo, 2012. Note: An “x” above the scheme indicates that the actual costs of operation are more than 5 times the predicted levels based on the averages observed for 100 pension and social security programs throughout the world.
Slide 20 March 7, 2014
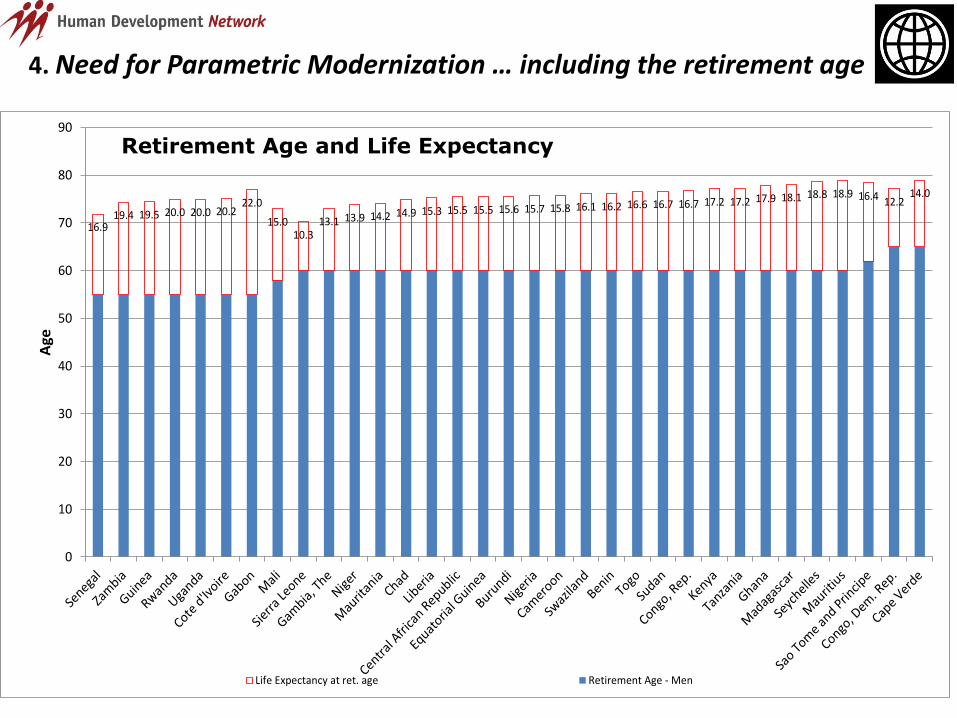
4. Need for Parametric Modernization … including the retirement age
16.9
19.4 19.5 20.0 20.0 20.222.0
15.010.3
13.1 13.9 14.2 14.9 15.3 15.5 15.5 15.6 15.7 15.8 16.1 16.2 16.6 16.7 16.7 17.2 17.2 17.9 18.1 18.8 18.9 16.4 12.214.0
0
10
20
30
40
50
60
70
80
90
Age
Life Expectancy at ret. age Retirement Age - Men
Retirement Age and Life Expectancy
Slide 21 March 7, 2014
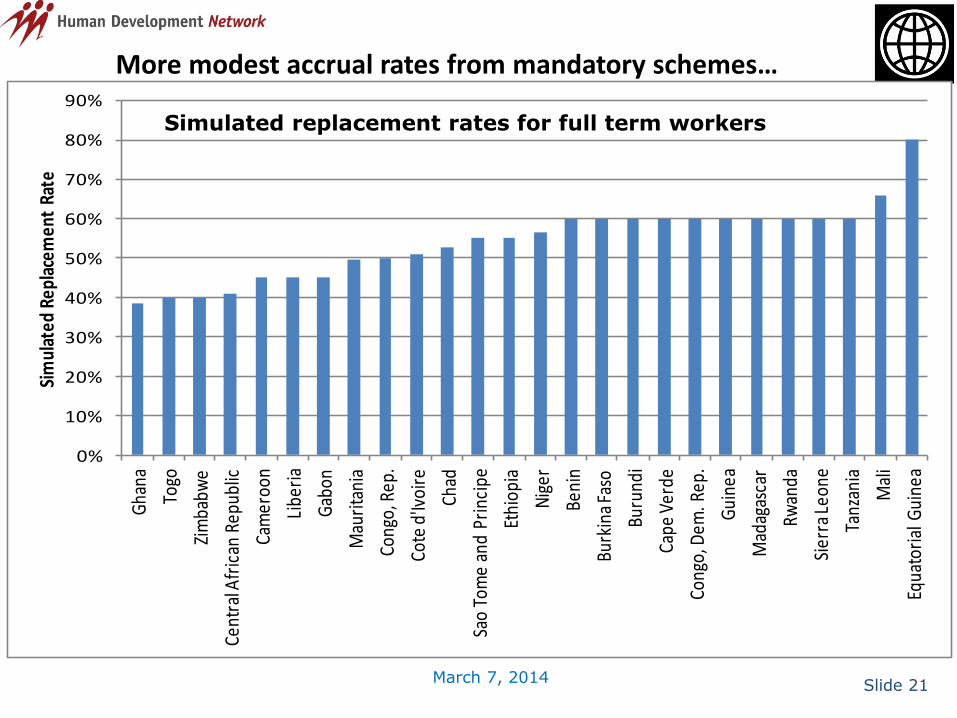
More modest accrual rates from mandatory schemes…
Simulated Replacement Rates
0%
10%
20%
30%
40%
50%
60%
70%
80%
90%
Gha
na
Togo
Zim
babw
e
Cent
ral A
fric
an R
epub
lic
Cam
eroo
n
Libe
ria
Gab
on
Mau
rita
nia
Cong
o, R
ep.
Cote
d'Iv
oire
Chad
Sao
Tom
e an
d Pr
inci
pe
Ethi
opia
Nig
er
Beni
n
Burk
ina
Faso
Buru
ndi
Cape
Ver
de
Cong
o, D
em. R
ep.
Gui
nea
Mad
agas
car
Rwan
da
Sier
ra L
eone
Tanz
ania
Mal
i
Equa
tori
al G
uine
a
Sim
ulat
ed R
epla
cem
ent
Rate
Simulated replacement rates for full term workers
Slide 22 March 7, 2014
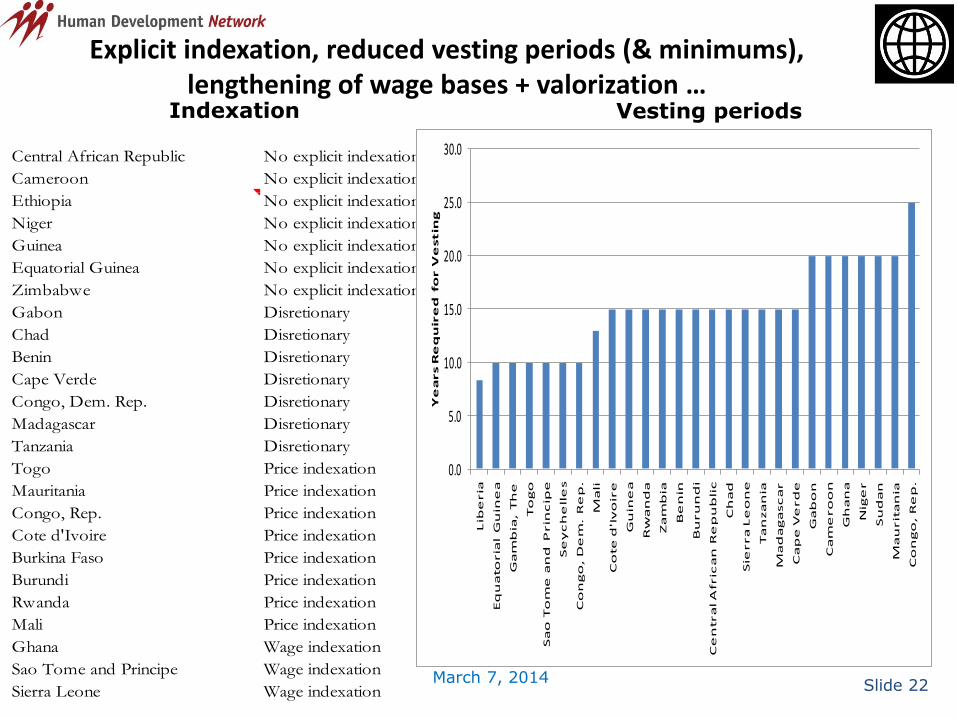
Explicit indexation, reduced vesting periods (& minimums), lengthening of wage bases + valorization …
Indexation
Central African Republic No explicit indexation
Cameroon No explicit indexation
Ethiopia No explicit indexation
Niger No explicit indexation
Guinea No explicit indexation
Equatorial Guinea No explicit indexation
Zimbabwe No explicit indexation
Gabon Disretionary
Chad Disretionary
Benin Disretionary
Cape Verde Disretionary
Congo, Dem. Rep. Disretionary
Madagascar Disretionary
Tanzania Disretionary
Togo Price indexation
Mauritania Price indexation
Congo, Rep. Price indexation
Cote d'Ivoire Price indexation
Burkina Faso Price indexation
Burundi Price indexation
Rwanda Price indexation
Mali Price indexation
Ghana Wage indexation
Sao Tome and Principe Wage indexation
Sierra Leone Wage indexation
0.0
5.0
10.0
15.0
20.0
25.0
30.0
Lib
eria
Eq
ua
to
ria
l G
uin
ea
Ga
mb
ia,
Th
e
To
go
Sa
o T
om
e a
nd
P
rin
cip
e
Se
yc
he
lle
s
Co
ng
o,
De
m.
Re
p.
Ma
li
Co
te
d'I
vo
ire
Gu
ine
a
Rw
an
da
Za
mb
ia
Be
nin
Bu
ru
nd
i
Ce
ntra
l A
fric
an
Re
pu
bli
c
Ch
ad
Sie
rra
Le
on
e
Ta
nza
nia
Ma
da
ga
sc
ar
Ca
pe
Ve
rd
e
Ga
bo
n
Ca
me
ro
on
Gh
an
a
Nig
er
Su
da
n
Ma
urit
an
ia
Co
ng
o,
Re
p.
Ye
ars R
eq
uir
ed
fo
r V
estin
g
Vesting periods
Slide 23 March 7, 2014
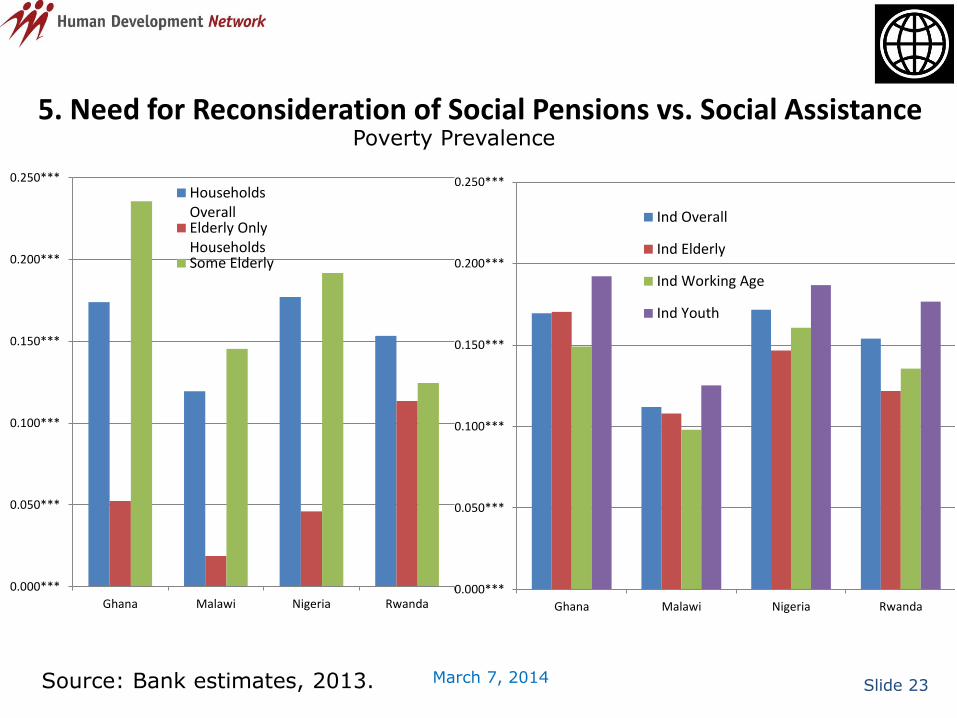
5. Need for Reconsideration of Social Pensions vs. Social Assistance
0.000***
0.050***
0.100***
0.150***
0.200***
0.250***
Ghana Malawi Nigeria Rwanda
Ind Overall
Ind Elderly
Ind Working Age
Ind Youth
0.000***
0.050***
0.100***
0.150***
0.200***
0.250***
Ghana Malawi Nigeria Rwanda
HouseholdsOverallElderly OnlyHouseholdsSome Elderly
Poverty Prevalence
Source: Bank estimates, 2013.
Slide 24 March 7, 2014
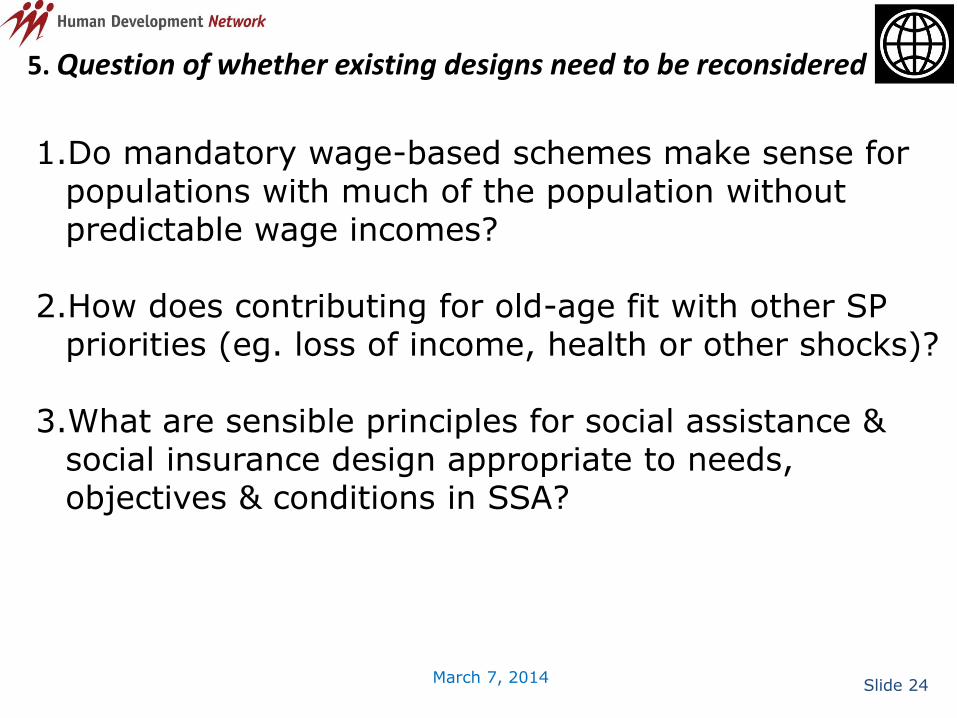
5. Question of whether existing designs need to be reconsidered
1.Do mandatory wage-based schemes make sense for populations with much of the population without predictable wage incomes?
2.How does contributing for old-age fit with other SP priorities (eg. loss of income, health or other shocks)?
3.What are sensible principles for social assistance & social insurance design appropriate to needs, objectives & conditions in SSA?
Slide 25 March 7, 2014
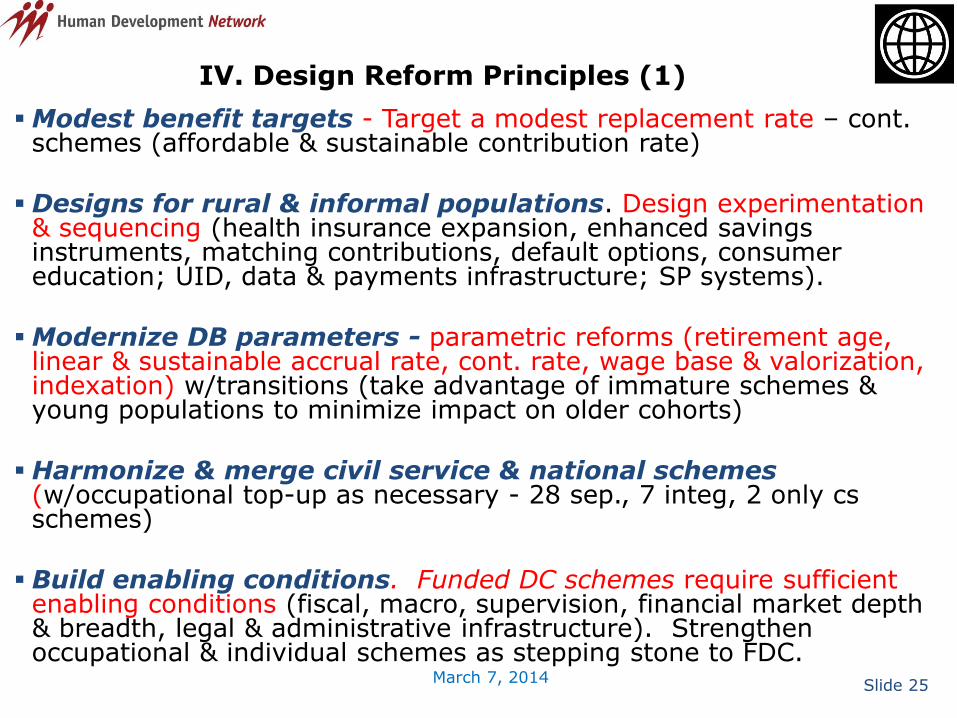
IV. Design Reform Principles (1)
Modest benefit targets - Target a modest replacement rate – cont. schemes (affordable & sustainable contribution rate)
Designs for rural & informal populations. Design experimentation & sequencing (health insurance expansion, enhanced savings instruments, matching contributions, default options, consumer education; UID, data & payments infrastructure; SP systems).
Modernize DB parameters - parametric reforms (retirement age, linear & sustainable accrual rate, cont. rate, wage base & valorization, indexation) w/transitions (take advantage of immature schemes & young populations to minimize impact on older cohorts)
Harmonize & merge civil service & national schemes (w/occupational top-up as necessary - 28 sep., 7 integ, 2 only cs schemes)
Build enabling conditions. Funded DC schemes require sufficient enabling conditions (fiscal, macro, supervision, financial market depth & breadth, legal & administrative infrastructure). Strengthen occupational & individual schemes as stepping stone to FDC.
Slide 26 March 7, 2014
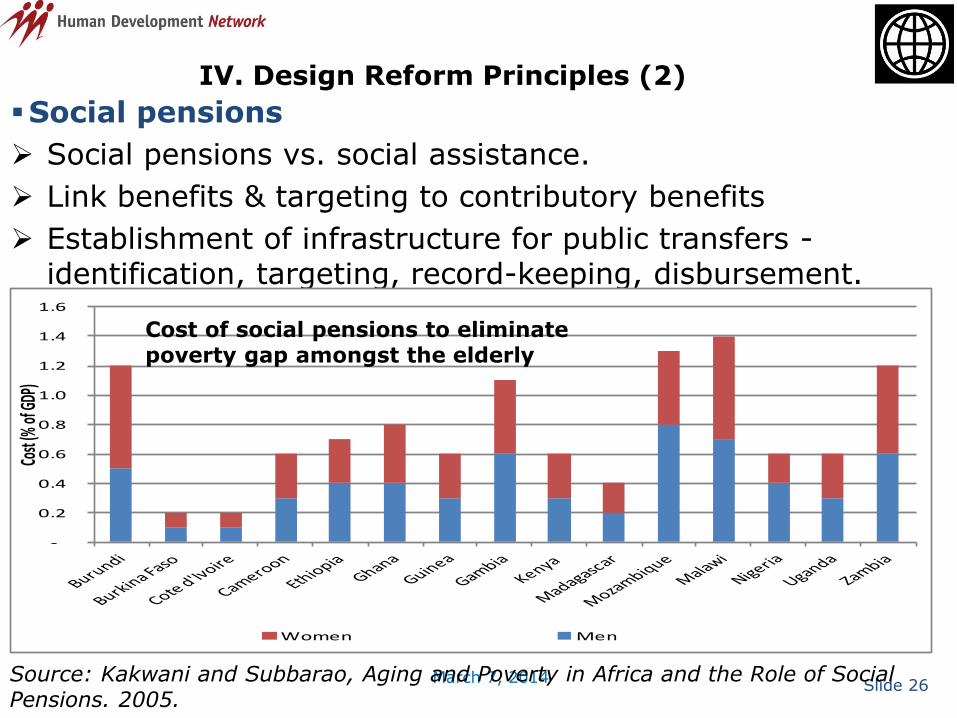
IV. Design Reform Principles (2)
Social pensions
Social pensions vs. social assistance.
Link benefits & targeting to contributory benefits
Establishment of infrastructure for public transfers - identification, targeting, record-keeping, disbursement.
-
0.2
0.4
0.6
0.8
1.0
1.2
1.4
1.6
Cost
(% of
GDP)
Women Men
Cost of social pensions to eliminate poverty gap amongst the elderly
Source: Kakwani and Subbarao, Aging and Poverty in Africa and the Role of Social Pensions. 2005.
Slide 27 March 7, 2014
V. A Process to Consider Reform
• Evaluate full scope & sequencing of social protection measures for coverage expansion (health insurance, old-age, survivorship, CCTs)
• Map programs to satisfy institutional requirements & enabling conditions + consider systemic approach
• Project baselines of existing schemes & parametric reforms with actuarial modeling (PROST)