Embed Size (px)
Citation preview

Aon HewittRetirement and Investment
Investment advice and consulting services provided by Aon Hewitt Investment Consulting, Inc., an Aon Company.
Nothing in this document should be construed as legal or investment advice. Please consult with your independent professional for any such advice. To protect the confidential and proprietary information included in this material, it may not be disclosed or provided to any third parties without the approval of Aon Hewitt.
Pension Risk Study ResultsMichigan State Employees' Retirement System (MSERS)October 2015
Aon Hewitt | Retirement and InvestmentProprietary & Confidential Investment advice and consulting services provided by Aon Hewitt Investment Consulting, Inc., an Aon Company. 2
Table of Contents
Asset-Liability Management Background– Our Investment Philosophy– Asset-Liability Profile
Asset-Liability Analysis– Investment Analysis– Projection Analysis
Appendix– Additional Analysis– Assumptions– Public Pension Peer Review– Regulatory Update– About This Material
Aon Hewitt | Retirement and InvestmentProprietary & Confidential Investment advice and consulting services provided by Aon Hewitt Investment Consulting, Inc., an Aon Company. 3
Asset-Liability Management Background
Aon Hewitt | Retirement and InvestmentProprietary & Confidential Investment advice and consulting services provided by Aon Hewitt Investment Consulting, Inc., an Aon Company. 4
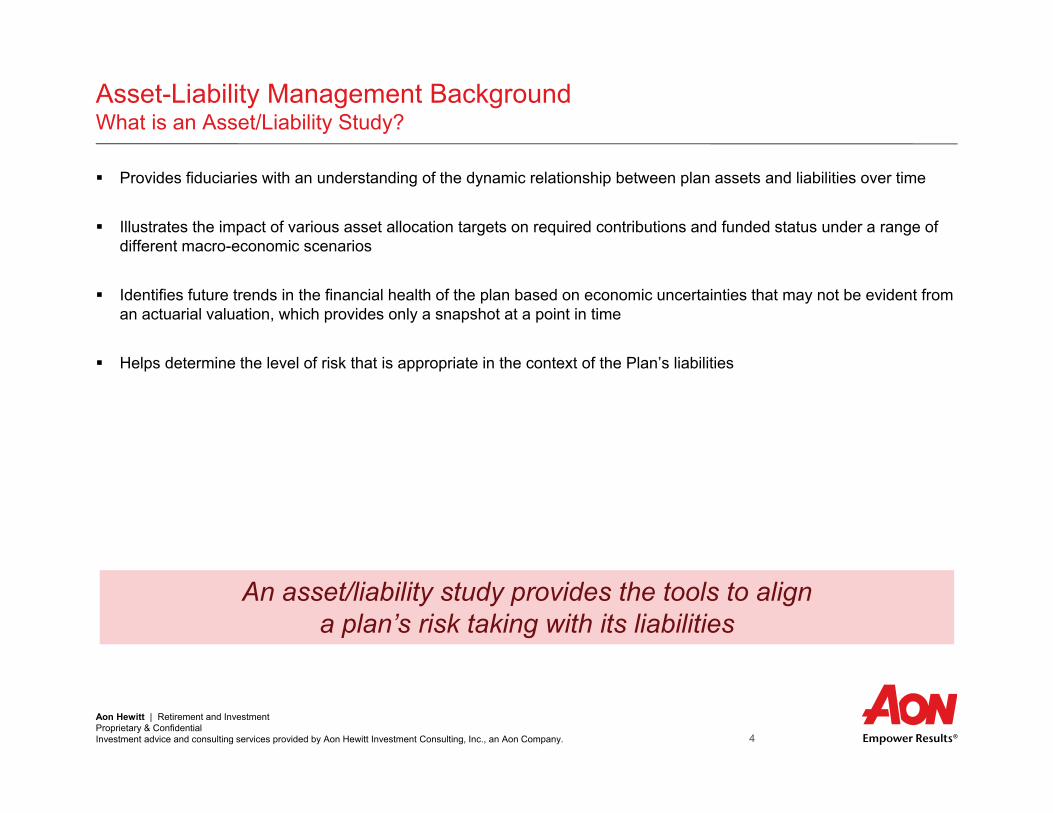
Asset-Liability Management BackgroundWhat is an Asset/Liability Study?
Provides fiduciaries with an understanding of the dynamic relationship between plan assets and liabilities over time
Illustrates the impact of various asset allocation targets on required contributions and funded status under a range of different macro-economic scenarios
Identifies future trends in the financial health of the plan based on economic uncertainties that may not be evident from an actuarial valuation, which provides only a snapshot at a point in time
Helps determine the level of risk that is appropriate in the context of the Plan’s liabilities
An asset/liability study provides the tools to aligna plan’s risk taking with its liabilities

Aon Hewitt | Retirement and InvestmentProprietary & Confidential Investment advice and consulting services provided by Aon Hewitt Investment Consulting, Inc., an Aon Company. 5
Asset-Liability Management BackgroundBalance of Liabilities and Assets
Assets$ Liabilities
$
PENSION PLAN+ New Benefit
Accrual
+ Cash Contributions
+ Asset Return+ Liability
Return
- Benefit Payments
- Benefit Payments
Aon Hewitt | Retirement and InvestmentProprietary & Confidential Investment advice and consulting services provided by Aon Hewitt Investment Consulting, Inc., an Aon Company. 6
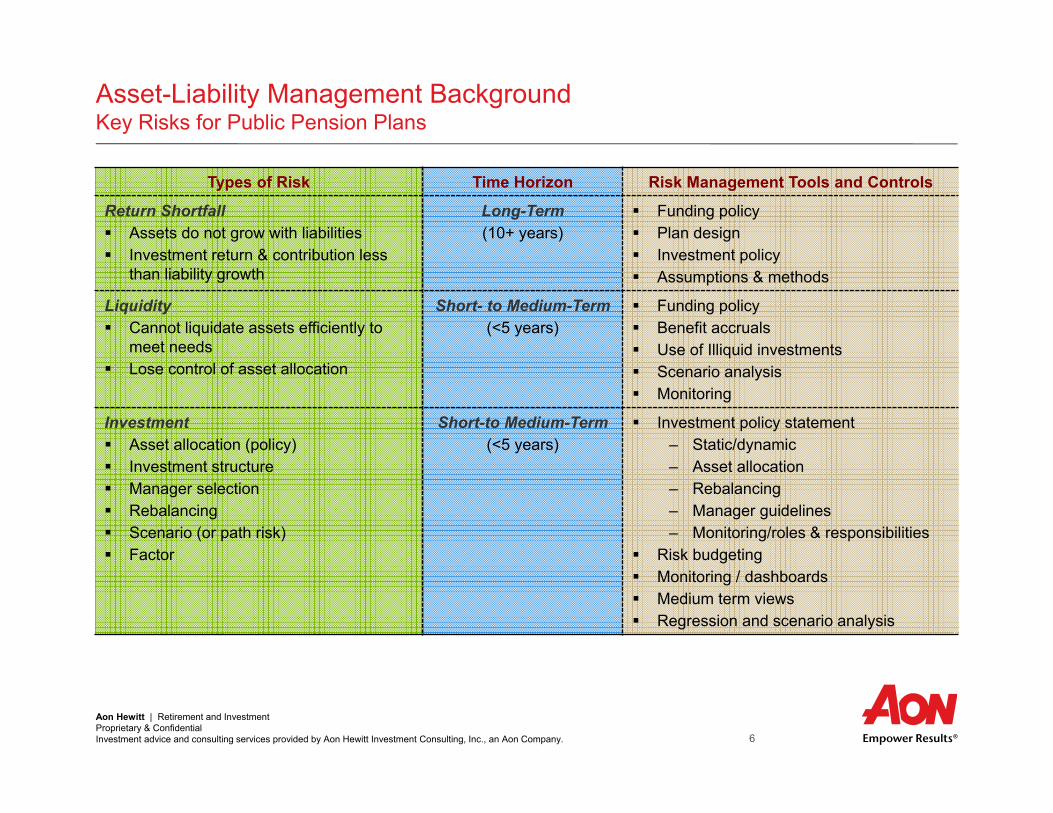
Types of Risk Time Horizon Risk Management Tools and Controls
Return Shortfall Assets do not grow with liabilities Investment return & contribution less
than liability growth
Long-Term(10+ years)
Funding policy Plan design Investment policy Assumptions & methods
Liquidity Cannot liquidate assets efficiently to
meet needs Lose control of asset allocation
Short- to Medium-Term(<5 years)
Funding policy Benefit accruals Use of Illiquid investments Scenario analysis Monitoring
Investment Asset allocation (policy) Investment structure Manager selection Rebalancing Scenario (or path risk) Factor
Short-to Medium-Term(<5 years)
Investment policy statement– Static/dynamic– Asset allocation– Rebalancing– Manager guidelines– Monitoring/roles & responsibilities
Risk budgeting Monitoring / dashboards Medium term views Regression and scenario analysis
Asset-Liability Management Background Key Risks for Public Pension Plans
Aon Hewitt | Retirement and InvestmentProprietary & Confidential Investment advice and consulting services provided by Aon Hewitt Investment Consulting, Inc., an Aon Company. 7
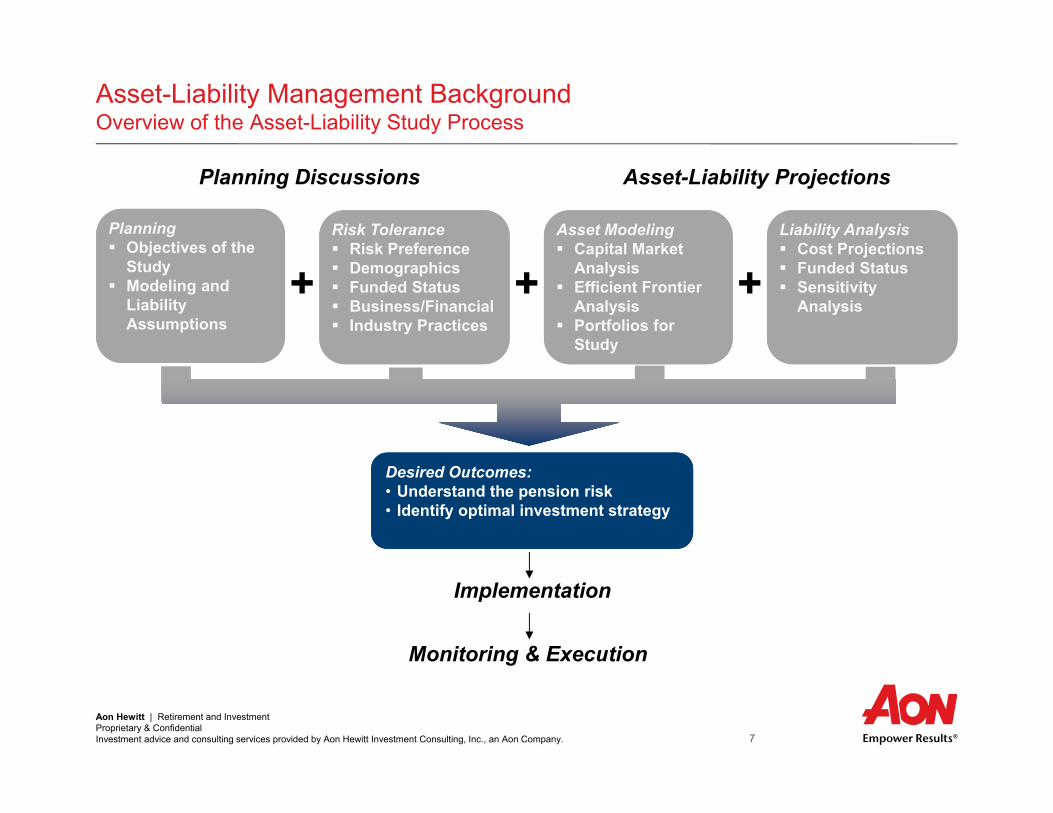
Asset-Liability Management BackgroundOverview of the Asset-Liability Study Process
+ ++Planning Objectives of the
Study Modeling and
Liability Assumptions
Risk Tolerance Risk Preference Demographics Funded Status Business/Financial Industry Practices
Liability Analysis Cost Projections Funded Status Sensitivity
Analysis
Asset Modeling Capital Market
Analysis Efficient Frontier
Analysis Portfolios for
Study
Desired Outcomes:• Understand the pension risk• Identify optimal investment strategy
Planning Discussions Asset-Liability Projections
Implementation
Monitoring & Execution
Aon Hewitt | Retirement and InvestmentProprietary & Confidential Investment advice and consulting services provided by Aon Hewitt Investment Consulting, Inc., an Aon Company. 8
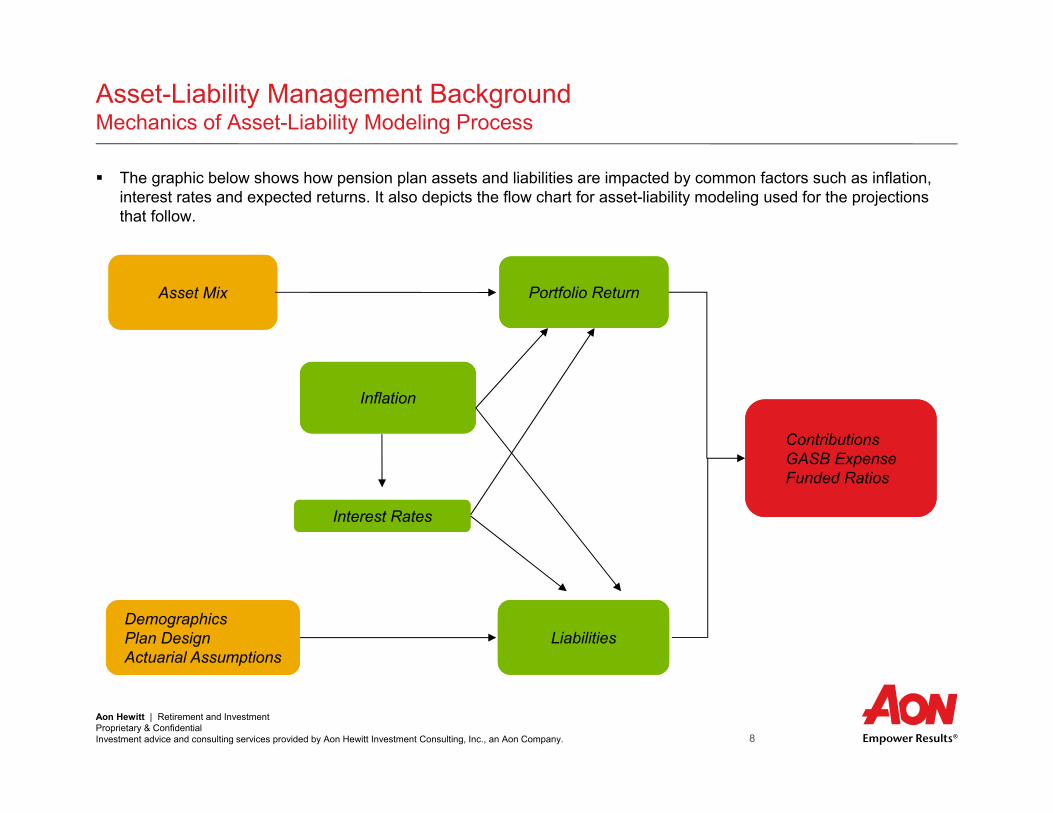
Asset-Liability Management Background Mechanics of Asset-Liability Modeling Process
The graphic below shows how pension plan assets and liabilities are impacted by common factors such as inflation, interest rates and expected returns. It also depicts the flow chart for asset-liability modeling used for the projections that follow.
LiabilitiesDemographicsPlan DesignActuarial Assumptions
Asset Mix Portfolio Return
Liabilities
Inflation
Interest Rates
ContributionsGASB ExpenseFunded Ratios

Aon Hewitt | Retirement and InvestmentProprietary & Confidential Investment advice and consulting services provided by Aon Hewitt Investment Consulting, Inc., an Aon Company. 9
Asset-Liability Management Background Modeling Process
Goals of an asset-liability study:– Understand the pension plan’s asset-liability risk, and– Identify the optimal investment strategies
Stochastic, Monte Carlo simulation analysis used– 5,000 independent economic trials– Building block approach
• Starts with inflation and interest rates• Using a multi-factor regression analysis, other asset classes are then modeled
– Assets and liabilities are modeled over the projection period• Projections include contribution requirements, and funded ratios
Asset-liability studies are best-suited to determine the optimal mix of Return-Seeking (e.g., equity) and Fixed Income assets for the pension fund
– Asset mix is the single most important investment decision for the plan sponsor• Is it worthwhile to have a more aggressive allocation in order to reduce long term cost in exchange for risk of
higher costs in a bad outcome?• Is it worthwhile to have a more conservative allocation in order to have a more predictable cost in exchange
for potentially higher average costs?
Aon Hewitt | Retirement and InvestmentProprietary & Confidential Investment advice and consulting services provided by Aon Hewitt Investment Consulting, Inc., an Aon Company. 10
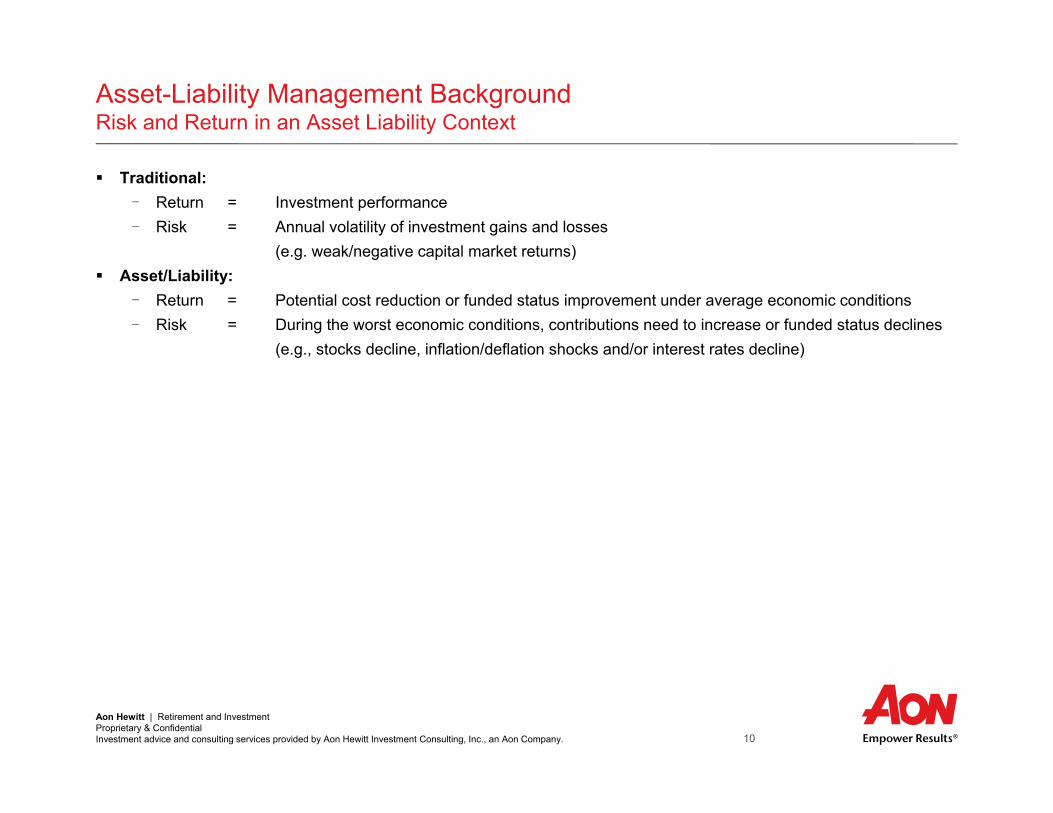
Asset-Liability Management Background Risk and Return in an Asset Liability Context
Traditional:- Return = Investment performance- Risk = Annual volatility of investment gains and losses
(e.g. weak/negative capital market returns) Asset/Liability:
- Return = Potential cost reduction or funded status improvement under average economic conditions- Risk = During the worst economic conditions, contributions need to increase or funded status declines
(e.g., stocks decline, inflation/deflation shocks and/or interest rates decline)

Aon Hewitt | Retirement and InvestmentProprietary & Confidential Investment advice and consulting services provided by Aon Hewitt Investment Consulting, Inc., an Aon Company. 11
Asset-Liability Management Background Key Factors Affecting the Risk/Reward Trade-off
The key take-away from the A/L study is the allocation between equity (“return-seeking”) vs. fixed income (“risk-mitigating”)
Major factors affecting the ultimate mix are:– Time horizon (or amortization period of unfunded liability) to fund the liability: a longer time horizon supports more
risk taking– Characteristics of plan participants: a growing population of active participants supports more risk taking; a
mature population with significant retirees might need a more conservative policy– Funded status: a less funded plan can utilize additional returns from equity investments– Nature of plan benefits: a pension with sensitivity to wage inflation growth can benefit from equities in the long-
term; an increased need in liquidity due to significant benefit payments in the near future can have a more conservative policy
Aon Hewitt | Retirement and InvestmentProprietary & Confidential Investment advice and consulting services provided by Aon Hewitt Investment Consulting, Inc., an Aon Company. 12
Asset-Liability Management Background Our Investment Philosophy
Aon Hewitt | Retirement and InvestmentProprietary & Confidential Investment advice and consulting services provided by Aon Hewitt Investment Consulting, Inc., an Aon Company. 13
Review
ManagerResearch
Investment Structure
Asset Liability Analysis/Asset Allocation
Foundation: Understand Objectives
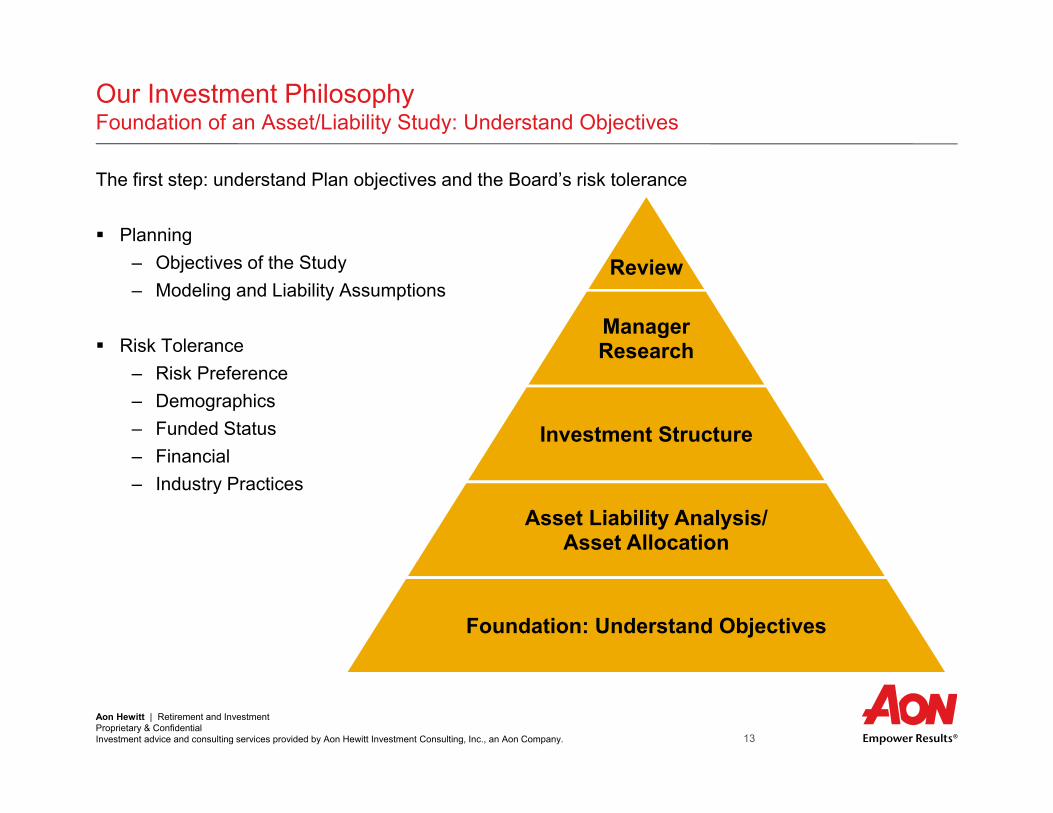
Our Investment PhilosophyFoundation of an Asset/Liability Study: Understand Objectives
The first step: understand Plan objectives and the Board’s risk tolerance
Planning– Objectives of the Study– Modeling and Liability Assumptions
Risk Tolerance– Risk Preference– Demographics– Funded Status– Financial– Industry Practices

Aon Hewitt | Retirement and InvestmentProprietary & Confidential Investment advice and consulting services provided by Aon Hewitt Investment Consulting, Inc., an Aon Company. 14
Our Investment PhilosophyComprehensive Approach to Investment Policy and Asset Allocation
ResultEffective and
Efficient Investment Program
Determine Asset Mix via Asset
Allocation Study
Develop Manager Structure
Determine Investment
Policies
Conduct Ongoing
Evaluation
Understand investment objectives Relevant time horizon Cost constraints Liquidity needs Risk preferences
Parameters for manager selection Active vs. passive management Role of alternative investments Role of multi-asset managers Role of opportunistic investments
Asset allocation targets and ranges Capital appreciation vs. capital
preservation Parameters for returns and
ongoing monitoring Rebalancing procedures
Procedures for measuring compliance vs. policies
Performance review Ongoing manager surveillance Parameters for replacing managers
Aon Hewitt | Retirement and InvestmentProprietary & Confidential Investment advice and consulting services provided by Aon Hewitt Investment Consulting, Inc., an Aon Company. 15
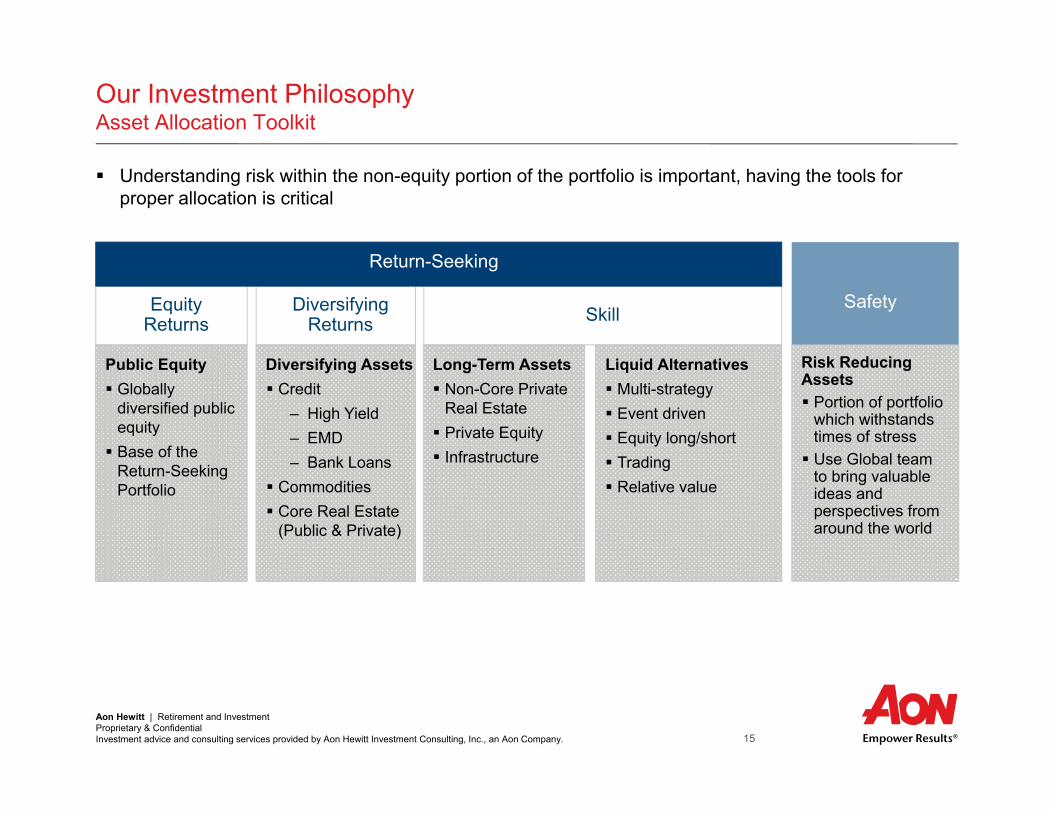
Our Investment PhilosophyAsset Allocation Toolkit
Understanding risk within the non-equity portion of the portfolio is important, having the tools for proper allocation is critical
Public Equity Globally
diversified public equity Base of the
Return-Seeking Portfolio
EquityReturns
Diversifying Returns
Diversifying Assets Credit
– High Yield– EMD– Bank Loans
Commodities Core Real Estate
(Public & Private)
Skill
Long-Term Assets Non-Core Private
Real Estate Private Equity Infrastructure
Risk Reducing Assets Portion of portfolio
which withstands times of stress Use Global team
to bring valuable ideas and perspectives from around the world
Return-Seeking
Safety
Liquid Alternatives Multi-strategy Event driven Equity long/short Trading Relative value

Aon Hewitt | Retirement and InvestmentProprietary & Confidential Investment advice and consulting services provided by Aon Hewitt Investment Consulting, Inc., an Aon Company. 16
Asset-Liability Management Background Asset-Liability Profile
Aon Hewitt | Retirement and InvestmentProprietary & Confidential Investment advice and consulting services provided by Aon Hewitt Investment Consulting, Inc., an Aon Company. 17
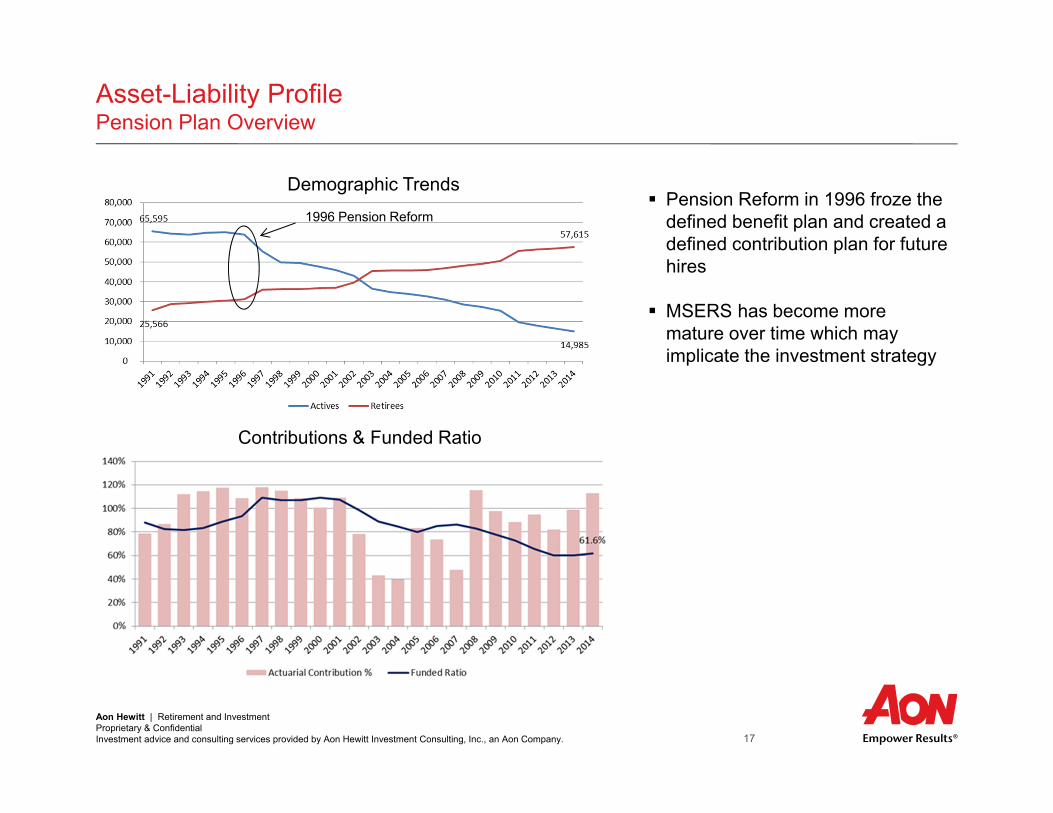
Asset-Liability ProfilePension Plan Overview
Demographic Trends Pension Reform in 1996 froze the
defined benefit plan and created a defined contribution plan for future hires
MSERS has become more mature over time which may implicate the investment strategy
1996 Pension Reform
Contributions & Funded Ratio

Aon Hewitt | Retirement and InvestmentProprietary & Confidential Investment advice and consulting services provided by Aon Hewitt Investment Consulting, Inc., an Aon Company. 18
Asset-Liability ProfileAs of September 30, 2014
Metric ($, Millions) Value Fund %: (MVA) (AVA) Metric ($, Millions) Value Alloc %Market Value of Assets $10,975Actuarial Value of Assets $9,962 $3,073 28.0%Liability Metrics $1,756 16.0%Actuarial Liability (AL) - Accounting $16,122 1 68.1% 61.8% $1,975 18.0%Actuarial Liability (AL) - Funding $16,173 2 67.9% 61.6% $658 6.0%Sensitivity Analysis (based on Accounting Liability) $1,097 10.0%-1% Sensitivity to Liability $17,672 3 62.1% 56.4% $1,043 9.5%+1% Sensitivity to Liability $14,788 4 74.2% 67.4% $9,603 87.5%
$219 2.0%$1,152 10.5%$1,372 12.5%
$10,975 100.0%
Metric ($, Millions) Value % Liability % AssetsAL Interest Cost $1,293.8 8.0% 11.8%AL Normal Cost $80.4 0.5% 0.7%Total Liability Hurdle Rate $1,374.2 8.5% 12.5%Expected Return on Assets $878.0 5.4% 8.0%ER + EE Contributions $694.6 4.3% 6.3%Total Exp. Asset Growth $1,572.6 9.7% 14.3%Hurdle Rate Shortfall -$198.4 -1.2% -1.8%Est. Benefit Payments $1,219.9 7.5% 11.1%
1 Based on plan's valuation interest rate o f 8.00% from the FYE 2014 actuarial valuation report (Accounting)
2 Based on plan's valuation interest rate o f 8.00% from the FYE 2014 actuarial valuation report (Funding)
3 Based on a valuation interest rate o f 7.00% from the FYE 2014 actuarial valuation report (Accounting)
4 Based on a valuation interest rate o f 9.00% from the FYE 2014 actuarial valuation report (Accounting)
Asset-Liability Growth Metrics (based on Funding Liability)
- Real Estate / Infrastructure
- TotalTotal
Return-Seeking
Target Asset Allocation as of 9/30/2014
Estimated Benefit Payments
Asset-Liability Snapshot as of 9/30/2014
- U.S. Equity - International Equity - Private Equity - Absolute Return
- Real Return / Opportunistic - TotalRisk-Reducing - Cash & Short Duration Fixed Income - Core Fixed Income
$0$200$400$600$800
$1,000$1,200$1,400$1,600
2014 2024 2034 2044
$Mill
ions
Aon Hewitt | Retirement and InvestmentProprietary & Confidential Investment advice and consulting services provided by Aon Hewitt Investment Consulting, Inc., an Aon Company. 19
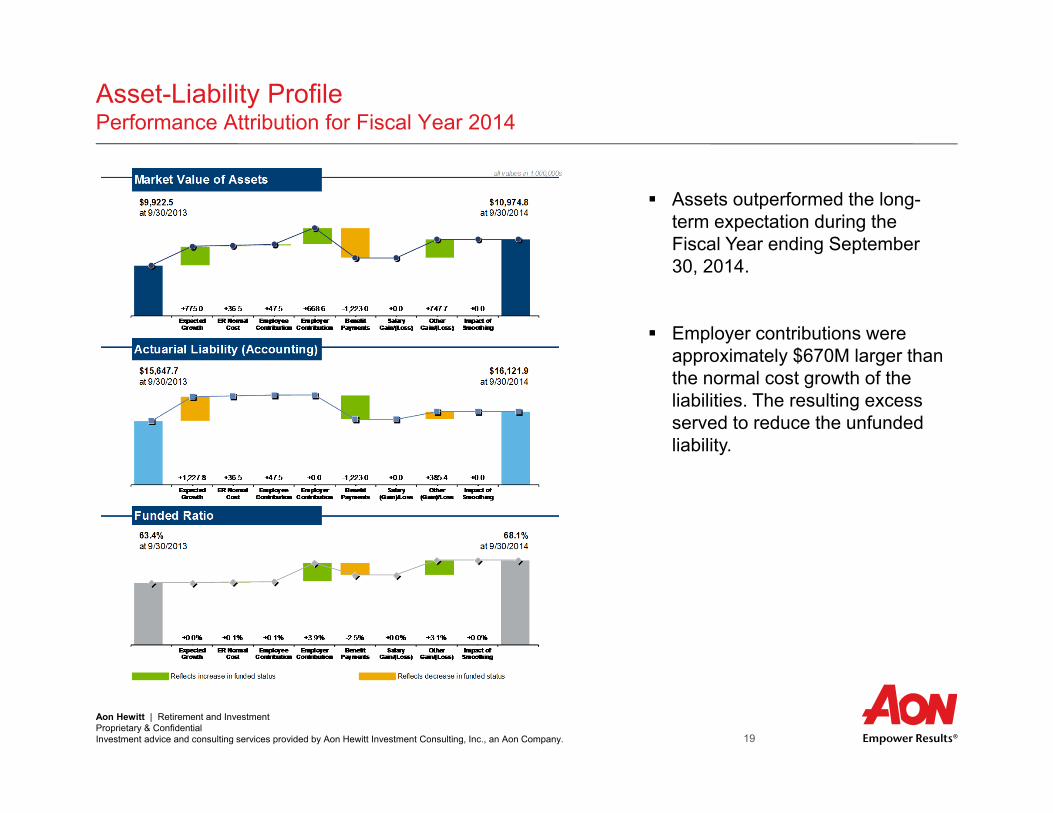
Asset-Liability ProfilePerformance Attribution for Fiscal Year 2014
Assets outperformed the long-term expectation during the Fiscal Year ending September 30, 2014.
Employer contributions were approximately $670M larger than the normal cost growth of the liabilities. The resulting excess served to reduce the unfunded liability.

Aon Hewitt | Retirement and InvestmentProprietary & Confidential Investment advice and consulting services provided by Aon Hewitt Investment Consulting, Inc., an Aon Company. 20
Asset-Liability Analysis Investment Analysis
Aon Hewitt | Retirement and InvestmentProprietary & Confidential Investment advice and consulting services provided by Aon Hewitt Investment Consulting, Inc., an Aon Company. 21
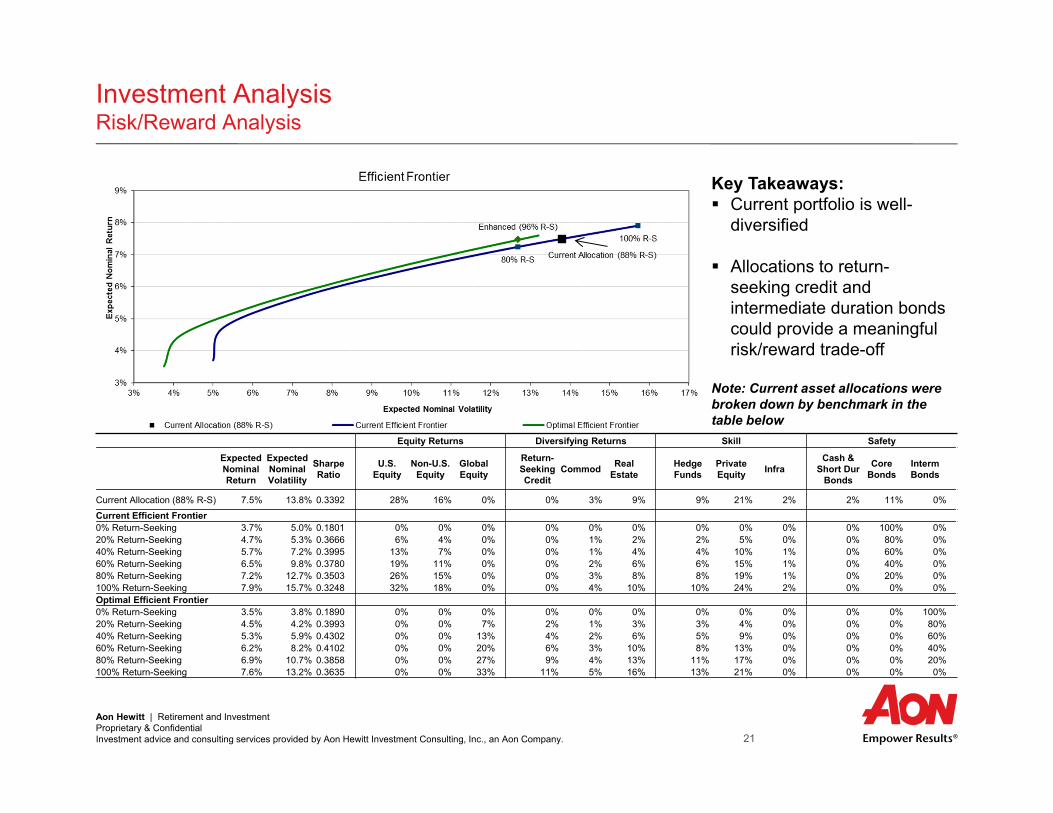
Investment AnalysisRisk/Reward Analysis
Key Takeaways: Current portfolio is well-
diversified
Allocations to return-seeking credit and intermediate duration bonds could provide a meaningful risk/reward trade-off
Note: Current asset allocations were broken down by benchmark in the table below
Equity Returns Diversifying Returns Skill Safety
Expected Nominal Return
Expected Nominal Volatility
Sharpe Ratio
U.S. Equity
Non-U.S. Equity
Global Equity
Return-Seeking Credit
Commod Real Estate
Hedge Funds
Private Equity Infra
Cash & Short Dur
Bonds
Core Bonds
Interm Bonds
Current Allocation (88% R-S) 7.5% 13.8% 0.3392 28% 16% 0% 0% 3% 9% 9% 21% 2% 2% 11% 0%
Current Efficient Frontier0% Return-Seeking 3.7% 5.0% 0.1801 0% 0% 0% 0% 0% 0% 0% 0% 0% 0% 100% 0%20% Return-Seeking 4.7% 5.3% 0.3666 6% 4% 0% 0% 1% 2% 2% 5% 0% 0% 80% 0%40% Return-Seeking 5.7% 7.2% 0.3995 13% 7% 0% 0% 1% 4% 4% 10% 1% 0% 60% 0%60% Return-Seeking 6.5% 9.8% 0.3780 19% 11% 0% 0% 2% 6% 6% 15% 1% 0% 40% 0%80% Return-Seeking 7.2% 12.7% 0.3503 26% 15% 0% 0% 3% 8% 8% 19% 1% 0% 20% 0%100% Return-Seeking 7.9% 15.7% 0.3248 32% 18% 0% 0% 4% 10% 10% 24% 2% 0% 0% 0%Optimal Efficient Frontier0% Return-Seeking 3.5% 3.8% 0.1890 0% 0% 0% 0% 0% 0% 0% 0% 0% 0% 0% 100%20% Return-Seeking 4.5% 4.2% 0.3993 0% 0% 7% 2% 1% 3% 3% 4% 0% 0% 0% 80%40% Return-Seeking 5.3% 5.9% 0.4302 0% 0% 13% 4% 2% 6% 5% 9% 0% 0% 0% 60%60% Return-Seeking 6.2% 8.2% 0.4102 0% 0% 20% 6% 3% 10% 8% 13% 0% 0% 0% 40%80% Return-Seeking 6.9% 10.7% 0.3858 0% 0% 27% 9% 4% 13% 11% 17% 0% 0% 0% 20%100% Return-Seeking 7.6% 13.2% 0.3635 0% 0% 33% 11% 5% 16% 13% 21% 0% 0% 0% 0%

Aon Hewitt | Retirement and InvestmentProprietary & Confidential Investment advice and consulting services provided by Aon Hewitt Investment Consulting, Inc., an Aon Company. 22
Investment AnalysisFunding/Investment Analysis
1 Expected annual funding to maintain funded ratio is equal to the sum of the net interest cost and normal cost2 Expected annual return under a one standard deviation adverse event3 Additional annual funding under a one standard deviation adverse event to maintain current funded status
Key Takeaways:
The growth rate required of the assets to keep pace with the liability growth (the “hurdle rate”) is currently 12.5%:
The hurdle rate is covered by a combination of investment returns and cash funding
Higher allocations to return-seeking assets produce lower expected funding amounts, but with more volatility
Interest Cost 11.8%Normal Cost 0.7%Total 12.5%Modeling Metric
Expected Nominal Return
Shortfall Versus
Required Return
Expected Annual
Funding¹
Expected Nominal Volatility
1-Year Downside
Return2
Additional Annual
Funding at Risk3
Current Allocation (88% R-S) 7.5% 5.0% $550.6 13.8% -5.3% $1,954.7 Current Efficient Frontier0% Return-Seeking 3.7% 8.8% $965.8 5.0% -1.2% $1,499.9 20% Return-Seeking 4.7% 7.8% $852.9 5.3% -0.4% $1,414.4 40% Return-Seeking 5.7% 6.8% $750.7 7.2% -1.2% $1,506.9 60% Return-Seeking 6.5% 6.0% $658.8 9.8% -2.8% $1,677.1 80% Return-Seeking 7.2% 5.3% $576.8 12.7% -4.6% $1,875.6 100% Return-Seeking 7.9% 4.6% $504.1 15.7% -6.5% $2,084.7 Optimal Efficient Frontier0% Return-Seeking 3.5% 9.0% $986.6 3.8% -0.2% $1,390.8 20% Return-Seeking 4.5% 8.0% $882.4 4.2% 0.4% $1,328.6 40% Return-Seeking 5.3% 7.2% $785.7 5.9% -0.4% $1,413.9 60% Return-Seeking 6.2% 6.3% $696.2 8.2% -1.7% $1,555.7 80% Return-Seeking 6.9% 5.6% $613.6 10.7% -3.1% $1,717.2 100% Return-Seeking 7.6% 4.9% $537.6 13.2% -4.7% $1,885.9
Aon Hewitt | Retirement and InvestmentProprietary & Confidential Investment advice and consulting services provided by Aon Hewitt Investment Consulting, Inc., an Aon Company. 23
Asset-Liability Analysis Projection Analysis
Aon Hewitt | Retirement and InvestmentProprietary & Confidential Investment advice and consulting services provided by Aon Hewitt Investment Consulting, Inc., an Aon Company. 24
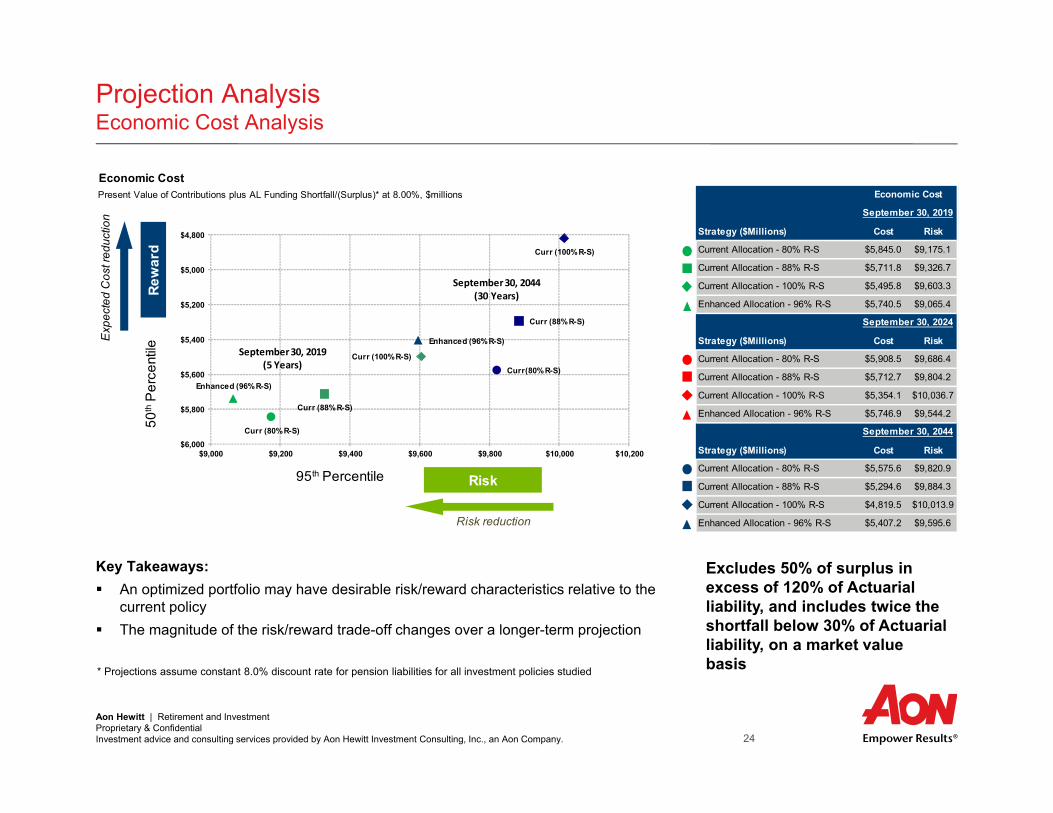
Projection AnalysisEconomic Cost Analysis
Key Takeaways: An optimized portfolio may have desirable risk/reward characteristics relative to the
current policy The magnitude of the risk/reward trade-off changes over a longer-term projection
* Projections assume constant 8.0% discount rate for pension liabilities for all investment policies studied
Excludes 50% of surplus in excess of 120% of Actuarial liability, and includes twice the shortfall below 30% of Actuarial liability, on a market value basis
Economic CostPresent Value of Contributions plus AL Funding Shortfall/(Surplus)* at 8.00%, $millions
Strategy ($Millions) Cost Risk
18 Current Allocation - 80% R-S $5,845.0 $9,175.1
57 Current Allocation - 88% R-S $5,711.8 $9,326.7
57 Current Allocation - 100% R-S $5,495.8 $9,603.3
Enhanced Allocation - 96% R-S $5,740.5 $9,065.4
48
10 Strategy ($Millions) Cost Risk
10 Current Allocation - 80% R-S $5,908.5 $9,686.4
Current Allocation - 88% R-S $5,712.7 $9,804.2
Current Allocation - 100% R-S $5,354.1 $10,036.7
Enhanced Allocation - 96% R-S $5,746.9 $9,544.2
Strategy ($Millions) Cost Risk
Current Allocation - 80% R-S $5,575.6 $9,820.9
Current Allocation - 88% R-S $5,294.6 $9,884.3
Current Allocation - 100% R-S $4,819.5 $10,013.9
Enhanced Allocation - 96% R-S $5,407.2 $9,595.6
Economic Cost
Exp
ecte
d C
ost r
educ
tion September 30, 2019
September 30, 2024
September 30, 2044Curr (80% R-S)
Curr (88% R-S)
Curr (100% R-S)
Enhanced (96% R-S)
Curr(80% R-S)
Curr (88% R-S)
Curr (100% R-S)
Enhanced (96% R-S)
$4,800
$5,000
$5,200
$5,400
$5,600
$5,800
$6,000$9,000 $9,200 $9,400 $9,600 $9,800 $10,000 $10,200
Risk95th Percentile
Risk reduction
Rew
ard
50th
Per
cent
ile September 30, 2019 (5 Years)
September 30, 2044 (30 Years)
Aon Hewitt | Retirement and InvestmentProprietary & Confidential Investment advice and consulting services provided by Aon Hewitt Investment Consulting, Inc., an Aon Company. 25
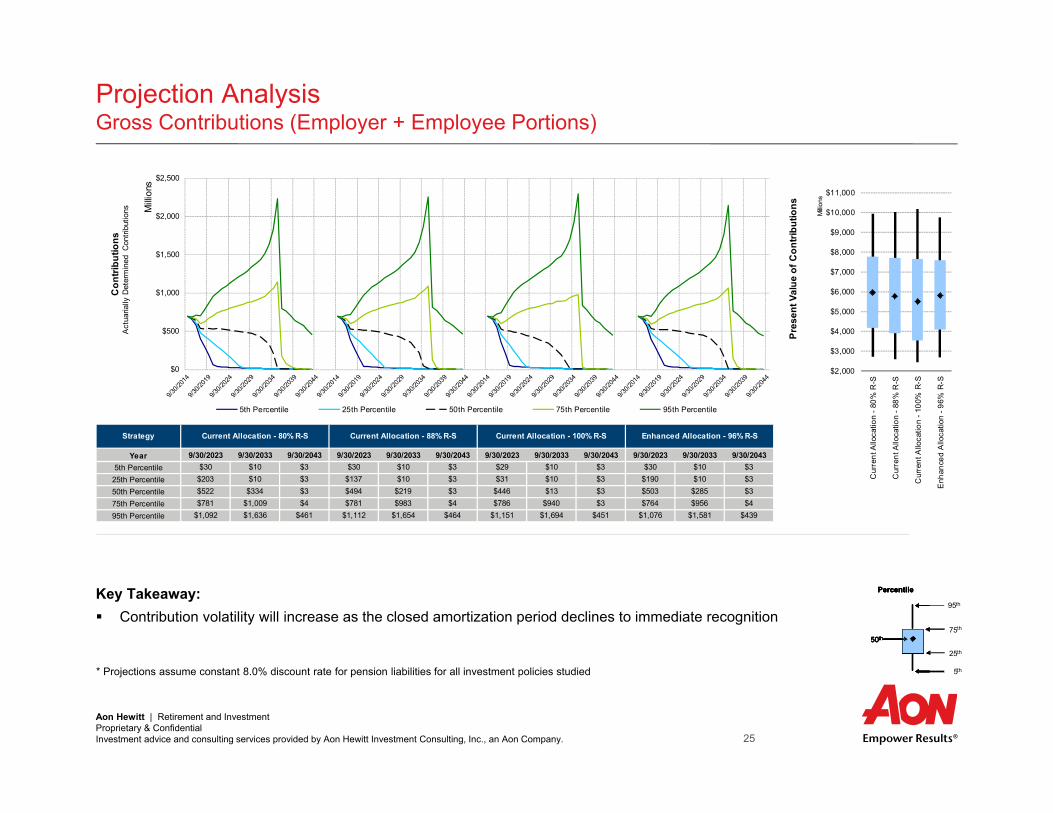
Projection AnalysisGross Contributions (Employer + Employee Portions)
Key Takeaway: Contribution volatility will increase as the closed amortization period declines to immediate recognition
* Projections assume constant 8.0% discount rate for pension liabilities for all investment policies studied
50th
95th
75th
25th
5th
Percentile
50th
95th
75th
25th
5th
Percentile
50th
95th
75th
25th
5th
Percentile
50th
95th
75th
25th
5th
Percentile
9/30/2023 9/30/2033 9/30/2043 9/30/2023 9/30/2033 9/30/2043 9/30/2023 9/30/2033 9/30/2043 9/30/2023 9/30/2033 9/30/2043 9/30/2023 9/30/2033 9/30/2043$30 $10 $3 $30 $10 $3 $29 $10 $3 $30 $10 $3 #REF! #REF! #REF!
$203 $10 $3 $137 $10 $3 $31 $10 $3 $190 $10 $3 #REF! #REF! #REF!$522 $334 $3 $494 $219 $3 $446 $13 $3 $503 $285 $3 #REF! #REF! #REF!$781 $1,009 $4 $781 $983 $4 $786 $940 $3 $764 $956 $4 0% 0% 0%
$1,092 $1,636 $461 $1,112 $1,654 $464 $1,151 $1,694 $451 $1,076 $1,581 $439 0% 0% 0%
Current Allocation - 100% R-S Enhanced Allocation - 96% R-S #N/A
Year5th Percentile
25th Percentile50th Percentile75th Percentile95th Percentile
Strategy Current Allocation - 80% R-S Current Allocation - 88% R-S
$0
$500
$1,000
$1,500
$2,000
$2,500
Con
tribu
tions
Milli
ons
5th Percentile 25th Percentile 50th Percentile 75th Percentile 95th Percentile
Act
uaria
lly D
eter
min
ed C
ontri
butio
ns
$2,000
$3,000
$4,000
$5,000
$6,000
$7,000
$8,000
$9,000
$10,000
$11,000
Cur
rent
Allo
catio
n - 8
0% R
-S
Cur
rent
Allo
catio
n - 8
8% R
-S
Cur
rent
Allo
catio
n - 1
00%
R-S
Enh
ance
d A
lloca
tion
- 96%
R-S
Pres
ent V
alue
of C
ontri
butio
ns
Milli
ons

Aon Hewitt | Retirement and InvestmentProprietary & Confidential Investment advice and consulting services provided by Aon Hewitt Investment Consulting, Inc., an Aon Company. 26
Projection AnalysisActuarial Value of Assets / Actuarial Liability Funded Ratio
Key Takeaway: Contribution policy will close the funding shortfall and then asset returns will outpace the liability growth rate further driving up the
funded ratio in our expected case* Projections assume constant 8.0% discount rate for pension liabilities for all investment policies studied
9/30/2024 9/30/2034 9/30/2044 9/30/2024 9/30/2034 9/30/2044 9/30/2024 9/30/2034 9/30/2044 9/30/2024 9/30/2034 9/30/204442% 68% 93% 41% 67% 93% 39% 66% 93% 43% 68% 93%59% 81% 108% 59% 82% 113% 59% 83% 124% 60% 82% 112%74% 96% 173% 76% 99% 194% 79% 107% 244% 75% 97% 179%93% 139% 380% 97% 156% 469% 105% 196% 649% 94% 143% 403%129% 327% 1568% 140% 389% 1956% 161% 522% 2820% 132% 341% 1692%21% 48% 86% 24% 50% 88% 30% 57% 90% 22% 48% 88%
Strategy Current Allocation - 80% R-S Current Allocation - 88% R-S Current Allocation - 100% R-S Enhanced Allocation - 96% R-S
Probability > 100%
Year5th Percentile25th Percentile50th Percentile75th Percentile95th Percentile
25%
50%
75%
100%
125%
150%
175%
200%
225%
250%
AVA
/ AL
Fund
ed R
atio
5th Percentile 25th Percentile 50th Percentile 75th Percentile 95th Percentile
Mar
ket V
alue
of A
sset
s / L
iabi
litie
s
Aon Hewitt | Retirement and InvestmentProprietary & Confidential Investment advice and consulting services provided by Aon Hewitt Investment Consulting, Inc., an Aon Company. 27
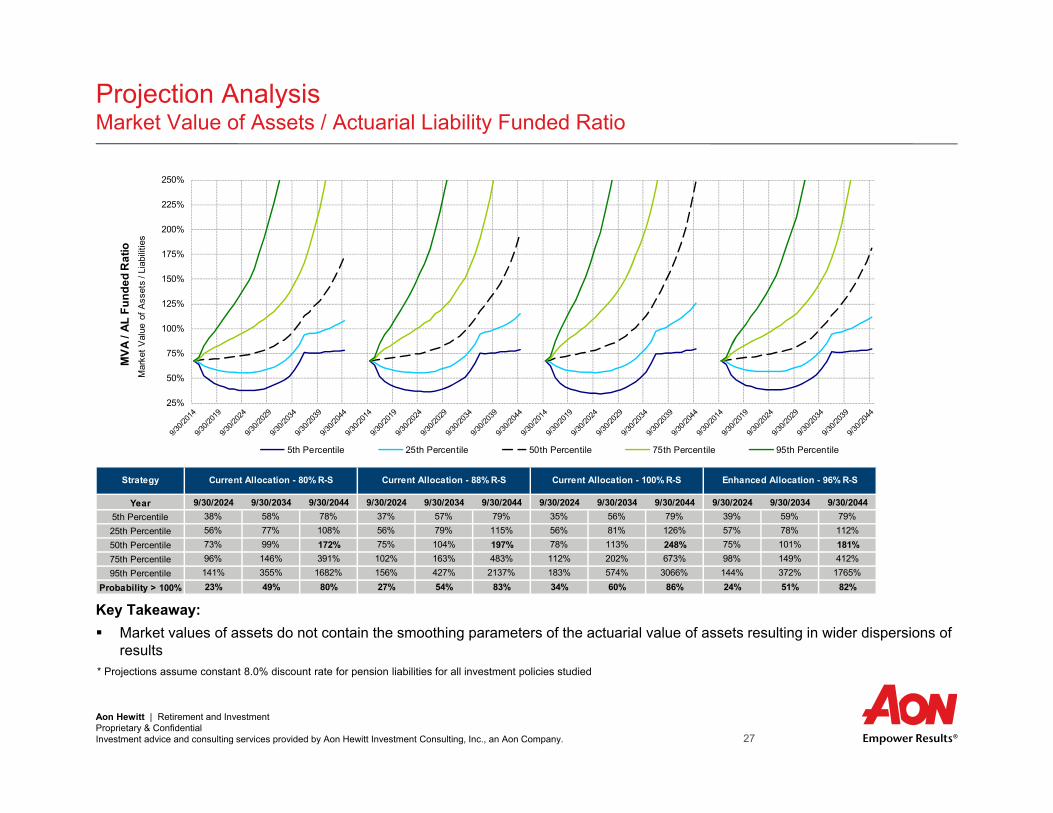
Projection AnalysisMarket Value of Assets / Actuarial Liability Funded Ratio
Key Takeaway: Market values of assets do not contain the smoothing parameters of the actuarial value of assets resulting in wider dispersions of
results* Projections assume constant 8.0% discount rate for pension liabilities for all investment policies studied
9/30/2024 9/30/2034 9/30/2044 9/30/2024 9/30/2034 9/30/2044 9/30/2024 9/30/2034 9/30/2044 9/30/2024 9/30/2034 9/30/204438% 58% 78% 37% 57% 79% 35% 56% 79% 39% 59% 79%56% 77% 108% 56% 79% 115% 56% 81% 126% 57% 78% 112%73% 99% 172% 75% 104% 197% 78% 113% 248% 75% 101% 181%96% 146% 391% 102% 163% 483% 112% 202% 673% 98% 149% 412%141% 355% 1682% 156% 427% 2137% 183% 574% 3066% 144% 372% 1765%23% 49% 80% 27% 54% 83% 34% 60% 86% 24% 51% 82%
Current Allocation - 100% R-S Enhanced Allocation - 96% R-S
Probability > 100%
Year5th Percentile25th Percentile50th Percentile75th Percentile95th Percentile
Strategy Current Allocation - 80% R-S Current Allocation - 88% R-S
25%
50%
75%
100%
125%
150%
175%
200%
225%
250%
MVA
/ AL
Fun
ded
Rat
io
5th Percentile 25th Percentile 50th Percentile 75th Percentile 95th Percentile
Mar
ket V
alue
of A
sset
s / L
iabi
litie
s

Aon Hewitt | Retirement and InvestmentProprietary & Confidential Investment advice and consulting services provided by Aon Hewitt Investment Consulting, Inc., an Aon Company. 28
Projection AnalysisNet Outflow Analysis: (Benefit Payments less Contributions) / Market Value of Assets
Key Takeaways: Net outflow will increase once the current amortization period expires Allocations to illiquid assets will need to be monitored as the net outflow reaches higher levels* Projections assume constant 8.0% discount rate for pension liabilities for all investment policies studied
9/30/2023 9/30/2033 9/30/2043 9/30/2023 9/30/2033 9/30/2043 9/30/2023 9/30/2033 9/30/2043 9/30/2023 9/30/2033 9/30/20435% -6% 1% 5% -6% 1% 4% -7% 0% 5% -5% 1%7% 3% 4% 7% 2% 3% 6% 2% 2% 7% 3% 4%8% 6% 8% 8% 6% 7% 7% 5% 6% 8% 6% 7%8% 9% 11% 8% 9% 11% 8% 8% 10% 8% 9% 11%
10% 11% 14% 10% 11% 14% 10% 11% 14% 10% 11% 14%<5% <5% <5% <5% <5% <5% <5% <5% <5% <5% <5% <5%
Strategy Current Allocation - 80% R-S Current Allocation - 88% R-S Current Allocation - 100% R-S Enhanced Allocation - 96% R-S
Probability > 100%
Year5th Percentile25th Percentile50th Percentile75th Percentile95th Percentile
-20%
-15%
-10%
-5%
0%
5%
10%
15%
20%
Net
Out
flow
/ M
arke
t Val
ue o
f Ass
ets
5th Percentile 25th Percentile 50th Percentile 75th Percentile 95th Percentile
Aon Hewitt | Retirement and InvestmentProprietary & Confidential Investment advice and consulting services provided by Aon Hewitt Investment Consulting, Inc., an Aon Company. 29
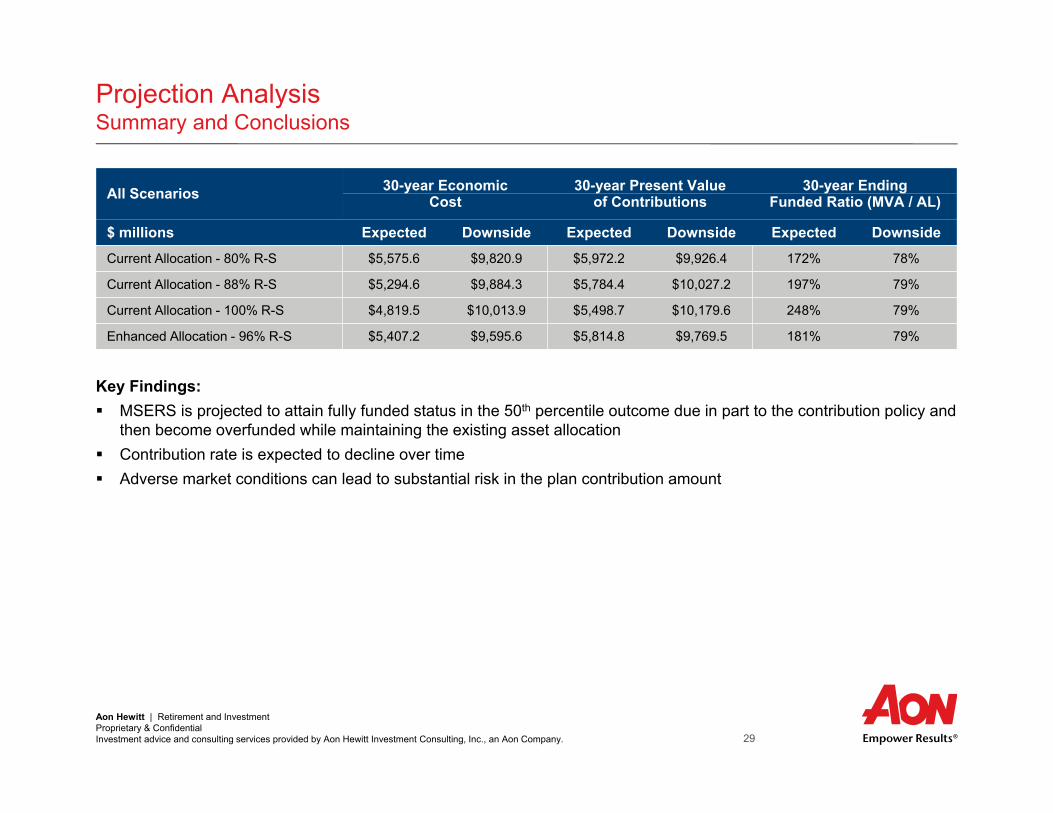
Projection AnalysisSummary and Conclusions
Key Findings: MSERS is projected to attain fully funded status in the 50th percentile outcome due in part to the contribution policy and
then become overfunded while maintaining the existing asset allocation Contribution rate is expected to decline over time Adverse market conditions can lead to substantial risk in the plan contribution amount
All Scenarios 30-year Economic 30-year Present Value 30-year EndingCost of Contributions Funded Ratio (MVA / AL)
$ millions Expected Downside Expected Downside Expected Downside
Current Allocation - 80% R-S $5,575.6 $9,820.9 $5,972.2 $9,926.4 172% 78%
Current Allocation - 88% R-S $5,294.6 $9,884.3 $5,784.4 $10,027.2 197% 79%
Current Allocation - 100% R-S $4,819.5 $10,013.9 $5,498.7 $10,179.6 248% 79%
Enhanced Allocation - 96% R-S $5,407.2 $9,595.6 $5,814.8 $9,769.5 181% 79%

Aon Hewitt | Retirement and InvestmentProprietary & Confidential Investment advice and consulting services provided by Aon Hewitt Investment Consulting, Inc., an Aon Company. 30
Appendix Additional Analysis

Aon Hewitt | Retirement and InvestmentProprietary & Confidential Investment advice and consulting services provided by Aon Hewitt Investment Consulting, Inc., an Aon Company. 31
Economic CostPresent Value of Contributions plus AL Funding Shortfall/(Surplus)* at 8.00%, $millions
Exp
ecte
d C
ost r
educ
tion
0% RS
100% RS
0% RS
100% RS
0% RS
100% RS$4,500
$5,300
$6,100
$6,900
$7,700
$8,500
$9,300$8,100 $8,900 $9,700 $10,500
Risk95th Percentile
Risk reduction
Rew
ard
50th
Per
cent
ile September 30, 2019 (5 Years)
September 30, 2024 (10 Years)
September 30, 2044 (30 Years)
Additional AnalysisEconomic Cost Analysis
Key Takeaway:
The magnitude of the risk/reward trade-off changes over a longer-term projection
* Projections assume constant 8.0% discount rate for pension liabilities for all investment policies studied
Excludes 50% of surplus in excess of 120% of Actuarial liability, and includes twice the shortfall below 30% of Actuarial liability, on a market value basis
Aon Hewitt | Retirement and InvestmentProprietary & Confidential Investment advice and consulting services provided by Aon Hewitt Investment Consulting, Inc., an Aon Company. 32
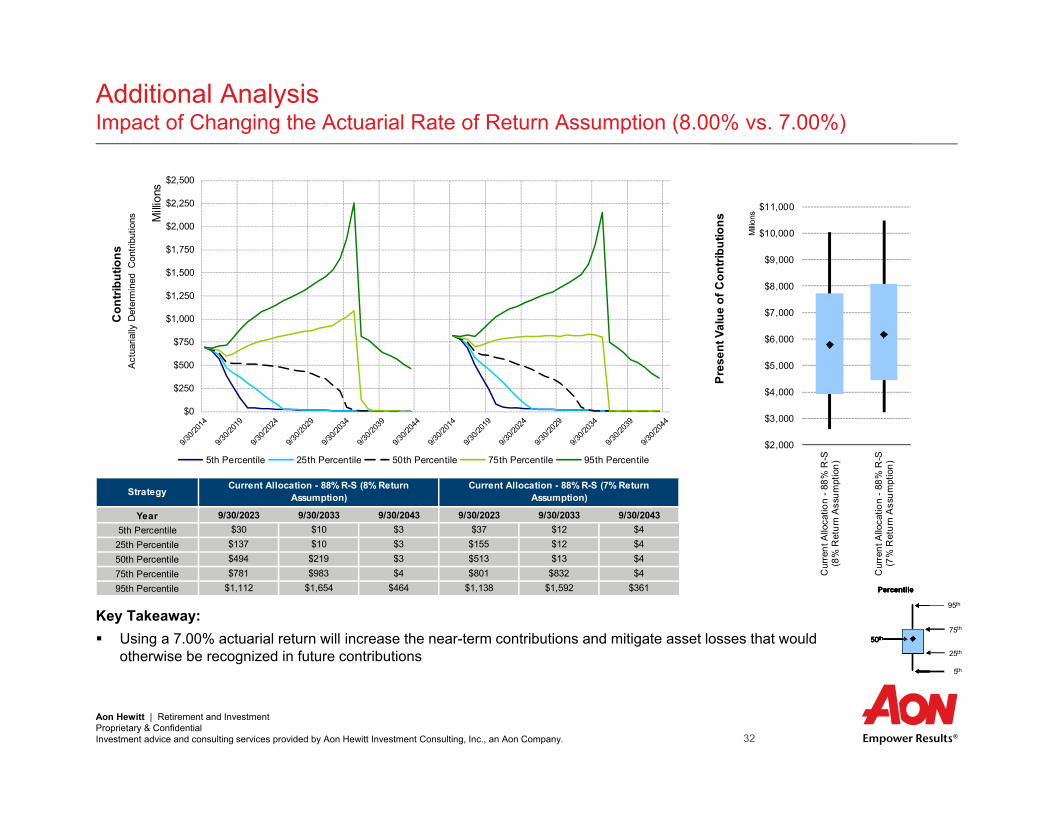
9/30/2023 9/30/2033 9/30/2043 9/30/2023 9/30/2033 9/30/2043 1/0/1900$30 $10 $3 $37 $12 $4 #N/A
$137 $10 $3 $155 $12 $4 #N/A$494 $219 $3 $513 $13 $4 #N/A$781 $983 $4 $801 $832 $4 #N/A
$1,112 $1,654 $464 $1,138 $1,592 $361 #N/A
Year5th Percentile
25th Percentile50th Percentile75th Percentile95th Percentile
Strategy Current Allocation - 88% R-S (8% Return Assumption)
Current Allocation - 88% R-S (7% Return Assumption)
$0
$250
$500
$750
$1,000
$1,250
$1,500
$1,750
$2,000
$2,250
$2,500
Con
tribu
tions
Milli
ons
5th Percentile 25th Percentile 50th Percentile 75th Percentile 95th Percentile
Act
uaria
lly D
eter
min
ed C
ontri
butio
ns
$2,000
$3,000
$4,000
$5,000
$6,000
$7,000
$8,000
$9,000
$10,000
$11,000
Cur
rent
Allo
catio
n - 8
8% R
-S(8
% R
etur
n A
ssum
ptio
n)
Cur
rent
Allo
catio
n - 8
8% R
-S(7
% R
etur
n A
ssum
ptio
n)
Pres
ent V
alue
of C
ontri
butio
ns
Milli
ons
Additional AnalysisImpact of Changing the Actuarial Rate of Return Assumption (8.00% vs. 7.00%)
Key Takeaway: Using a 7.00% actuarial return will increase the near-term contributions and mitigate asset losses that would
otherwise be recognized in future contributions50th
95th
75th
25th
5th
Percentile
50th
95th
75th
25th
5th
Percentile
50th
95th
75th
25th
5th
Percentile
50th
95th
75th
25th
5th
Percentile

Aon Hewitt | Retirement and InvestmentProprietary & Confidential Investment advice and consulting services provided by Aon Hewitt Investment Consulting, Inc., an Aon Company. 33
Appendix Assumptions
Aon Hewitt | Retirement and InvestmentProprietary & Confidential Investment advice and consulting services provided by Aon Hewitt Investment Consulting, Inc., an Aon Company. 34
Review of Actuarial Assumptions and Methods
Actuarial Rate of Investment Return– 8.00%
Asset Value– Fair market value of assets as of September 30, 2014– 4.96% net asset return from September 30, 2014 through June 30, 2015 was included in our analysis
Asset Allocation– Real Estate / Infrastructure target allocation of 10% was modeled as 85% Core Real Estate and 15%
Infrastructure– Real Return / Opportunistic target allocation of 9.5% was modeled as 33.3% Commodities, 33.3% Private Equity,
and 33.3% Direct Hedge Funds Participant Data
– Based on the September 30, 2014 actuarial valuation Contributions
– Participants contribute 4% of salary– MSERS contributes an actuarially determined amount comprised of the following:
• Normal Cost• Amortization of Unfunded Actuarial Liability using a closed, 22-year amortization period that will decrease to
immediate recognition at expiry• Early Retirement Incentive amortization payments (if applicable to projection year)• Reduced for participant contributions

Aon Hewitt | Retirement and InvestmentProprietary & Confidential Investment advice and consulting services provided by Aon Hewitt Investment Consulting, Inc., an Aon Company. 35
Review of Actuarial Assumptions and Methods
In calculating plan contributions, Actuarial Liability was adjusted for the present value of the following offset amounts. No other offsets are applied once these are exhausted.
Fiscal Year Early Retirement Incentive
Future Reconciliation Payments
2015 $77.95M $153.18M
2016 $77.95M $106.65M
2017 $77.95M $71.40M
2018 $30.71M
2019 ($4.34M)
2020 ($6.40M)
Aon Hewitt | Retirement and InvestmentProprietary & Confidential Investment advice and consulting services provided by Aon Hewitt Investment Consulting, Inc., an Aon Company. 36
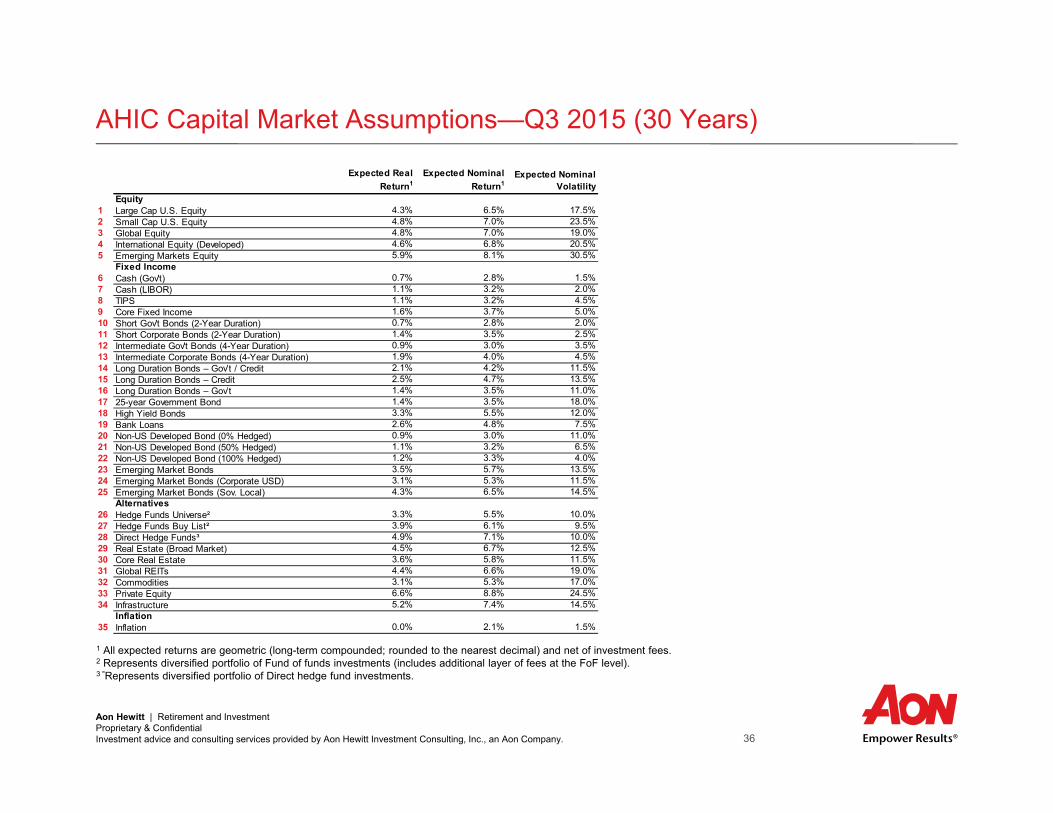
AHIC Capital Market Assumptions—Q3 2015 (30 Years)
1 All expected returns are geometric (long-term compounded; rounded to the nearest decimal) and net of investment fees.2 Represents diversified portfolio of Fund of funds investments (includes additional layer of fees at the FoF level).3 "Represents diversified portfolio of Direct hedge fund investments.
Expected Real Return1
Expected Nominal Return1
Expected Nominal Volatility
Equity1 Large Cap U.S. Equity 4.3% 6.5% 17.5%2 Small Cap U.S. Equity 4.8% 7.0% 23.5%3 Global Equity 4.8% 7.0% 19.0%4 International Equity (Developed) 4.6% 6.8% 20.5%5 Emerging Markets Equity 5.9% 8.1% 30.5%
Fixed Income6 Cash (Gov't) 0.7% 2.8% 1.5%7 Cash (LIBOR) 1.1% 3.2% 2.0%8 TIPS 1.1% 3.2% 4.5%9 Core Fixed Income 1.6% 3.7% 5.0%10 Short Gov't Bonds (2-Year Duration) 0.7% 2.8% 2.0%11 Short Corporate Bonds (2-Year Duration) 1.4% 3.5% 2.5%12 Intermediate Gov't Bonds (4-Year Duration) 0.9% 3.0% 3.5%13 Intermediate Corporate Bonds (4-Year Duration) 1.9% 4.0% 4.5%14 Long Duration Bonds – Gov’t / Credit 2.1% 4.2% 11.5%15 Long Duration Bonds – Credit 2.5% 4.7% 13.5%16 Long Duration Bonds – Gov’t 1.4% 3.5% 11.0%17 25-year Government Bond 1.4% 3.5% 18.0%18 High Yield Bonds 3.3% 5.5% 12.0%19 Bank Loans 2.6% 4.8% 7.5%20 Non-US Developed Bond (0% Hedged) 0.9% 3.0% 11.0%21 Non-US Developed Bond (50% Hedged) 1.1% 3.2% 6.5%22 Non-US Developed Bond (100% Hedged) 1.2% 3.3% 4.0%23 Emerging Market Bonds 3.5% 5.7% 13.5%24 Emerging Market Bonds (Corporate USD) 3.1% 5.3% 11.5%25 Emerging Market Bonds (Sov. Local) 4.3% 6.5% 14.5%
Alternatives26 Hedge Funds Universe² 3.3% 5.5% 10.0%27 Hedge Funds Buy List² 3.9% 6.1% 9.5%28 Direct Hedge Funds³ 4.9% 7.1% 10.0%29 Real Estate (Broad Market) 4.5% 6.7% 12.5%30 Core Real Estate 3.6% 5.8% 11.5%31 Global REITs 4.4% 6.6% 19.0%32 Commodities 3.1% 5.3% 17.0%33 Private Equity 6.6% 8.8% 24.5%34 Infrastructure 5.2% 7.4% 14.5%
Inflation35 Inflation 0.0% 2.1% 1.5%

Aon Hewitt | Retirement and InvestmentProprietary & Confidential Investment advice and consulting services provided by Aon Hewitt Investment Consulting, Inc., an Aon Company. 37
AHIC Capital Market Assumptions—Q3 2015 (30 Years)
Nominal Correlations 1 2 3 4 5 6 7 8 9 10 11 12 13 14 15 16 17 18 19 20 21 22 23 24 25 26 27 28 29 30 31 32 33 34 351 Large Cap U.S. Equity 1.00 0.92 0.95 0.79 0.80 0.08 0.08 -0.06 0.06 0.03 0.10 -0.05 0.10 0.00 0.09 -0.12 -0.13 0.58 0.41 -0.04 -0.03 0.00 0.42 0.39 0.44 0.60 0.48 0.60 0.40 0.39 0.66 0.30 0.70 0.38 0.04
2 Small Cap U.S. Equity 0.92 1.00 0.87 0.73 0.73 0.06 0.06 -0.06 0.05 0.02 0.09 -0.06 0.09 -0.01 0.08 -0.12 -0.12 0.54 0.38 -0.03 -0.03 -0.01 0.38 0.35 0.39 0.55 0.44 0.55 0.38 0.36 0.61 0.26 0.66 0.36 0.03
3 Global Equity 0.95 0.87 1.00 0.93 0.90 0.07 0.07 -0.06 0.06 0.02 0.09 -0.06 0.10 0.00 0.10 -0.12 -0.13 0.63 0.42 0.17 0.15 -0.01 0.46 0.44 0.55 0.60 0.48 0.59 0.41 0.39 0.64 0.39 0.67 0.37 0.06
4 International Equity (Developed) 0.79 0.73 0.93 1.00 0.84 0.03 0.03 -0.05 0.05 0.00 0.06 -0.06 0.08 0.00 0.09 -0.10 -0.11 0.56 0.37 0.40 0.34 -0.02 0.42 0.41 0.57 0.52 0.42 0.52 0.37 0.35 0.54 0.43 0.57 0.32 0.07
5 Emerging M arkets Equity 0.80 0.73 0.90 0.84 1.00 0.06 0.06 -0.05 0.08 0.02 0.09 -0.06 0.12 0.01 0.13 -0.12 -0.13 0.66 0.44 0.22 0.19 0.00 0.49 0.46 0.55 0.54 0.43 0.54 0.37 0.36 0.54 0.35 0.58 0.32 0.06
6 Cash (Gov't) 0.08 0.06 0.07 0.03 0.06 1.00 0.98 0.43 0.49 0.92 0.80 0.65 0.51 0.22 0.18 0.24 0.15 0.12 0.05 0.12 0.30 0.64 0.16 0.08 0.00 -0.04 -0.03 -0.04 0.14 0.15 0.08 0.20 0.09 0.11 0.46
7 Cash (LIBOR) 0.08 0.06 0.07 0.03 0.06 0.98 1.00 0.42 0.49 0.91 0.80 0.64 0.52 0.22 0.19 0.23 0.15 0.13 0.06 0.12 0.30 0.63 0.17 0.08 0.00 -0.03 -0.02 -0.03 0.13 0.15 0.08 0.19 0.08 0.11 0.45
8 TIPS -0.06 -0.06 -0.06 -0.05 -0.05 0.43 0.42 1.00 0.48 0.56 0.48 0.57 0.45 0.29 0.25 0.30 0.22 0.10 -0.09 0.07 0.13 0.22 0.13 0.04 -0.02 -0.11 -0.09 -0.11 0.02 0.02 -0.03 0.17 -0.05 0.00 0.40
9 Core Fixed Income 0.06 0.05 0.06 0.05 0.08 0.49 0.49 0.48 1.00 0.69 0.77 0.87 0.95 0.84 0.85 0.74 0.64 0.36 0.13 0.19 0.34 0.61 0.52 0.27 0.16 0.07 0.05 0.07 0.07 0.08 0.06 0.08 0.05 0.06 0.14
10 Short Gov't Bonds (2-Year Duration) 0.03 0.02 0.02 0.00 0.02 0.92 0.91 0.56 0.69 1.00 0.86 0.87 0.68 0.39 0.32 0.42 0.29 0.12 -0.08 0.15 0.33 0.67 0.21 0.09 0.01 -0.12 -0.10 -0.12 0.11 0.12 0.05 0.18 0.04 0.08 0.44
11 Short Corporate Bonds (2-Year Duration) 0.10 0.09 0.09 0.06 0.09 0.80 0.80 0.48 0.77 0.86 1.00 0.75 0.87 0.42 0.43 0.35 0.24 0.30 0.22 0.15 0.32 0.62 0.39 0.22 0.11 0.07 0.06 0.07 0.13 0.14 0.10 0.16 0.10 0.11 0.36
12 Intermediate Gov't Bonds (4-Year Duration) -0.05 -0.06 -0.06 -0.06 -0.06 0.65 0.64 0.57 0.87 0.87 0.75 1.00 0.76 0.69 0.59 0.75 0.62 0.05 -0.26 0.18 0.35 0.64 0.23 0.06 -0.01 -0.23 -0.18 -0.22 0.04 0.05 -0.02 0.10 -0.04 0.02 0.25
13 Intermediate Corporate Bonds (4-Year Duration) 0.10 0.09 0.10 0.08 0.12 0.51 0.52 0.45 0.95 0.68 0.87 0.76 1.00 0.70 0.75 0.56 0.46 0.42 0.31 0.17 0.32 0.57 0.55 0.31 0.19 0.17 0.13 0.17 0.10 0.10 0.09 0.09 0.09 0.09 0.18
14 Long Duration Bonds – Gov’ t / Credit 0.00 -0.01 0.00 0.00 0.01 0.22 0.22 0.29 0.84 0.39 0.42 0.69 0.70 1.00 0.96 0.94 0.92 0.19 -0.05 0.17 0.30 0.51 0.40 0.17 0.10 -0.01 -0.01 -0.01 0.02 0.02 0.00 -0.02 0.00 0.01 -0.09
15 Long Duration Bonds – Credit 0.09 0.08 0.10 0.09 0.13 0.18 0.19 0.25 0.85 0.32 0.43 0.59 0.75 0.96 1.00 0.80 0.78 0.42 0.21 0.16 0.28 0.47 0.56 0.31 0.21 0.18 0.14 0.18 0.06 0.06 0.07 -0.01 0.08 0.06 -0.08
16 Long Duration Bonds – Gov’ t -0.12 -0.12 -0.12 -0.10 -0.12 0.24 0.23 0.30 0.74 0.42 0.35 0.75 0.56 0.94 0.80 1.00 0.97 -0.11 -0.35 0.17 0.30 0.51 0.16 -0.02 -0.04 -0.24 -0.20 -0.24 -0.04 -0.03 -0.08 -0.04 -0.10 -0.04 -0.10
17 25-year Government Bond -0.13 -0.12 -0.13 -0.11 -0.13 0.15 0.15 0.22 0.64 0.29 0.24 0.62 0.46 0.92 0.78 0.97 1.00 -0.14 -0.33 0.15 0.26 0.45 0.13 -0.04 -0.05 -0.22 -0.18 -0.22 -0.05 -0.05 -0.08 -0.07 -0.11 -0.05 -0.16
18 High Yield Bonds 0.58 0.54 0.63 0.56 0.66 0.12 0.13 0.10 0.36 0.12 0.30 0.05 0.42 0.19 0.42 -0.11 -0.14 1.00 0.76 0.16 0.17 0.10 0.75 0.63 0.57 0.64 0.51 0.63 0.26 0.25 0.40 0.35 0.44 0.25 0.17
19 Bank Loans 0.41 0.38 0.42 0.37 0.44 0.05 0.06 -0.09 0.13 -0.08 0.22 -0.26 0.31 -0.05 0.21 -0.35 -0.33 0.76 1.00 0.05 0.05 0.00 0.46 0.55 0.44 0.69 0.55 0.68 0.17 0.17 0.28 0.15 0.30 0.17 0.07
20 Non-US Developed Bond (0% Hedged) -0.04 -0.03 0.17 0.40 0.22 0.12 0.12 0.07 0.19 0.15 0.15 0.18 0.17 0.17 0.16 0.17 0.15 0.16 0.05 1.00 0.96 0.31 0.22 0.21 0.50 0.03 0.02 0.03 0.00 0.00 -0.02 0.43 -0.01 0.02 0.14
21 Non-US Developed Bond (50% Hedged) -0.03 -0.03 0.15 0.34 0.19 0.30 0.30 0.13 0.34 0.33 0.32 0.35 0.32 0.30 0.28 0.30 0.26 0.17 0.05 0.96 1.00 0.57 0.26 0.22 0.45 0.01 0.00 0.01 0.02 0.02 -0.01 0.40 0.00 0.03 0.18
22 Non-US Developed Bond (100% Hedged) 0.00 -0.01 -0.01 -0.02 0.00 0.64 0.63 0.22 0.61 0.67 0.62 0.64 0.57 0.51 0.47 0.51 0.45 0.10 0.00 0.31 0.57 1.00 0.25 0.12 0.08 -0.04 -0.03 -0.04 0.06 0.07 0.02 0.09 0.01 0.05 0.19
23 Emerging M arket Bonds 0.42 0.38 0.46 0.42 0.49 0.16 0.17 0.13 0.52 0.21 0.39 0.23 0.55 0.40 0.56 0.16 0.13 0.75 0.46 0.22 0.26 0.25 1.00 0.72 0.64 0.53 0.42 0.52 0.18 0.18 0.28 0.21 0.30 0.17 0.07
24 Emerging M arket Bonds (Corporate USD) 0.39 0.35 0.44 0.41 0.46 0.08 0.08 0.04 0.27 0.09 0.22 0.06 0.31 0.17 0.31 -0.02 -0.04 0.63 0.55 0.21 0.22 0.12 0.72 1.00 0.62 0.56 0.44 0.56 0.15 0.15 0.25 0.25 0.26 0.15 0.08
25 Emerging M arket Bonds (Sov. Local) 0.44 0.39 0.55 0.57 0.55 0.00 0.00 -0.02 0.16 0.01 0.11 -0.01 0.19 0.10 0.21 -0.04 -0.05 0.57 0.44 0.50 0.45 0.08 0.64 0.62 1.00 0.46 0.37 0.46 0.10 0.10 0.27 0.42 0.18 0.11 0.00
26 Hedge Funds Universe² 0.60 0.55 0.60 0.52 0.54 -0.04 -0.03 -0.11 0.07 -0.12 0.07 -0.23 0.17 -0.01 0.18 -0.24 -0.22 0.64 0.69 0.03 0.01 -0.04 0.53 0.56 0.46 1.00 0.72 0.99 0.24 0.23 0.40 0.27 0.42 0.23 0.03
27 Hedge Funds Buy List² 0.48 0.44 0.48 0.42 0.43 -0.03 -0.02 -0.09 0.05 -0.10 0.06 -0.18 0.13 -0.01 0.14 -0.20 -0.18 0.51 0.55 0.02 0.00 -0.03 0.42 0.44 0.37 0.72 1.00 0.71 0.19 0.19 0.33 0.22 0.33 0.18 0.03
28 Direct Hedge Funds³ 0.60 0.55 0.59 0.52 0.54 -0.04 -0.03 -0.11 0.07 -0.12 0.07 -0.22 0.17 -0.01 0.18 -0.24 -0.22 0.63 0.68 0.03 0.01 -0.04 0.52 0.56 0.46 0.99 0.71 1.00 0.24 0.23 0.40 0.27 0.41 0.23 0.03
29 Real Estate (Broad M arket) 0.40 0.38 0.41 0.37 0.37 0.14 0.13 0.02 0.07 0.11 0.13 0.04 0.10 0.02 0.06 -0.04 -0.05 0.26 0.17 0.00 0.02 0.06 0.18 0.15 0.10 0.24 0.19 0.24 1.00 0.96 0.50 0.08 0.35 0.20 0.07
30 Core Real Estate 0.39 0.36 0.39 0.35 0.36 0.15 0.15 0.02 0.08 0.12 0.14 0.05 0.10 0.02 0.06 -0.03 -0.05 0.25 0.17 0.00 0.02 0.07 0.18 0.15 0.10 0.23 0.19 0.23 0.96 1.00 0.47 0.08 0.33 0.19 0.08
31 Global REITs 0.66 0.61 0.64 0.54 0.54 0.08 0.08 -0.03 0.06 0.05 0.10 -0.02 0.09 0.00 0.07 -0.08 -0.08 0.40 0.28 -0.02 -0.01 0.02 0.28 0.25 0.27 0.40 0.33 0.40 0.50 0.47 1.00 0.19 0.48 0.27 0.04
32 Commodities 0.30 0.26 0.39 0.43 0.35 0.20 0.19 0.17 0.08 0.18 0.16 0.10 0.09 -0.02 -0.01 -0.04 -0.07 0.35 0.15 0.43 0.40 0.09 0.21 0.25 0.42 0.27 0.22 0.27 0.08 0.08 0.19 1.00 0.10 0.08 0.41
33 Private Equity 0.70 0.66 0.67 0.57 0.58 0.09 0.08 -0.05 0.05 0.04 0.10 -0.04 0.09 0.00 0.08 -0.10 -0.11 0.44 0.30 -0.01 0.00 0.01 0.30 0.26 0.18 0.42 0.33 0.41 0.35 0.33 0.48 0.10 1.00 0.33 0.05
34 Infrastructure 0.38 0.36 0.37 0.32 0.32 0.11 0.11 0.00 0.06 0.08 0.11 0.02 0.09 0.01 0.06 -0.04 -0.05 0.25 0.17 0.02 0.03 0.05 0.17 0.15 0.11 0.23 0.18 0.23 0.20 0.19 0.27 0.08 0.33 1.00 0.06
35 Inflation 0.04 0.03 0.06 0.07 0.06 0.46 0.45 0.40 0.14 0.44 0.36 0.25 0.18 -0.09 -0.08 -0.10 -0.16 0.17 0.07 0.14 0.18 0.19 0.07 0.08 0.00 0.03 0.03 0.03 0.07 0.08 0.04 0.41 0.05 0.06 1.00

Aon Hewitt | Retirement and InvestmentProprietary & Confidential Investment advice and consulting services provided by Aon Hewitt Investment Consulting, Inc., an Aon Company. 38
Explanation of Capital Market Assumptions—Q3 2015 (30 Years)
The following capital market assumptions were developed by Aon Hewitt's Global Asset Allocation Team and represent the long-term capital market outlook (i.e., 30 years) based on data at the end of the second quarter of 2015. The assumptions were developed using a building block approach, reflecting observable inflation and interest rate information available in the fixed income markets as well as Consensus Economics forecasts. Our long-term assumptions for other asset classes are based on historical results, current market characteristics, and our professional judgment.
Inflation – Expected Level (2.1%)Based on Consensus Economics long-term estimates and our near-term economic outlook, we expect U.S. consumer price inflation to be approximately 2.1% during the next 30 years.
Real Returns for Asset Classes Fixed Income Cash (0.7%) – Over the long run, we expect the real yield on cash and money market instruments to produce a real
return of 0.7% in a moderate- to low-inflationary environment. TIPS (1.1%) – We expect intermediate duration Treasury Inflation-Protected Securities to produce a real return of
about 1.1%. Core Fixed Income (i.e., Market Duration) (1.6%) – We expect intermediate duration Treasuries to produce a real
return of about 0.9%. We estimate the fair value credit spread (credit risk premium - expected losses from defaults and downgrades) to be 0.7%, resulting in a long-term real return of 1.6%.
Long Duration Bonds – Government and Credit (2.1%) – We expect Treasuries with a duration comparable to the Long Government Credit Index to produce a real return of 1.4%. We estimate the fair value credit spread (credit risk premium - expected losses from defaults and downgrades) to be 0.7%, resulting in an expected real return of 2.1%.
Aon Hewitt | Retirement and InvestmentProprietary & Confidential Investment advice and consulting services provided by Aon Hewitt Investment Consulting, Inc., an Aon Company. 39
Explanation of Capital Market Assumptions—Q3 2015 (30 Years)
Long Duration Bonds – Credit (2.5%) – We expect Treasuries with a duration comparable to the Long Credit Index to produce a real return of 1.4%. We estimate the fair value credit spread (credit risk premium - expected losses from defaults and downgrades) to be 1.1%, resulting in an expected real return of 2.5%.
Long Duration Bonds – Government (1.4%) – We expect Treasuries with a duration of ~12 years to produce a real return of 1.4% during the next 30 years.
High Yield Bonds (3.3%) – We expect intermediate duration Treasuries to produce a real return of about 0.9%. We estimate the fair value credit spread (credit risk premium - expected losses from defaults and downgrades) to be 2.4%, resulting in an expected real return of 3.3%.
Bank Loans (2.6%) – We expect LIBOR to produce a real return of about 1.1%. We estimate the fair value credit spread (credit risk premium - expected losses from defaults) to be 1.5%, resulting in an expected real return of 2.6%.
Non-US Developed Bonds: 50% Hedged (1.1%) – We forecast real returns for non-US developed market bonds to be 1.1% over a 30-year period after adjusting for a 50% currency hedge. We assume a blend of one-third investment grade corporate bonds and two-thirds government bonds. We also produce assumptions for 0% hedged and 100% hedged non-US developed bonds.
Emerging Market Bonds (Sovereign; USD) (3.5%) – We forecast real returns for emerging market sovereign bonds denominated in USD to be 3.5% over a 30-year period.
Emerging Market Bonds (Corporate; USD) (3.1%) – We forecast real returns for emerging market corporate bonds denominated in USD to be 3.1% over a 30-year period.
Emerging Market Bonds (Sovereign; Local) (4.3%) – We forecast real returns for emerging market sovereign bond denominated in local currency to be 4.3% over a 30-year period.

Aon Hewitt | Retirement and InvestmentProprietary & Confidential Investment advice and consulting services provided by Aon Hewitt Investment Consulting, Inc., an Aon Company. 40
Explanation of Capital Market Assumptions—Q3 2015 (30 Years)
Equities Large Cap U.S. Equity (4.3%) – This assumption is based on our 30-year outlook for large cap U.S. company
dividends and real earnings growth. Adjustments are made for valuations as needed. Small Cap U.S. Equity (4.8 %) – Adding a 0.5% return premium for small cap U.S. equity over large cap U.S. equity
results in an expected real return of 4.8%. This return premium is theoretically justified by the higher risk inherent in small cap U.S. equity versus large cap U.S. equity, and is also justified by historical data. In recent years, higher small cap valuations relative large cap equity has reduced the small cap premium.
Global Equity (Developed & Emerging Markets) (4.8%) – We employ a building block process similar to the U.S. equity model using the developed and emerging markets that comprise the MSCI All-Country World Index. Our roll-up model produces an expected real return of 4.8% for global equity.
International (Non-U.S.) Equity, Developed Markets (4.6%) – We employ a building block process similar to the U.S. equity model using the non-U.S. developed equity markets that comprise the MSCI EAFE Index.
Emerging Market Stocks (5.9%) - We employ a building block process similar to the U.S. equity model using the non-U.S. emerging equity markets that comprise the MSCI Emerging Markets Index.
Alternative Asset Classes Hedge Fund-of-Funds Universe (3.3%) – The generic category “hedge funds” encompasses a wide range of
strategies accessed through “fund-of-funds” vehicles. Our assumption is somewhat more conservative than historical results to account for flaws inherent in hedge funds indices, including survivorship bias and self-reporting bias. We also assume the median manager is selected and also allow for the additional costs associated with Fund-of-Funds management. A top-tier portfolio of individual managers (hedge fund-of-funds buy-list) could add an additional 0.7% in return at similar volatility based on alpha, lower fees, and better risk management.

Aon Hewitt | Retirement and InvestmentProprietary & Confidential Investment advice and consulting services provided by Aon Hewitt Investment Consulting, Inc., an Aon Company. 41
Explanation of Capital Market Assumptions—Q3 2015 (30 Years)
Broad Hedge Funds (4.9%) – Represents a diversified portfolio of direct hedge fund investments. This investment will tend to be less diversified than a typical “fund-of-funds” strategy as there will be fewer underlying managers.
Real Estate (4.5%) – Our real return assumption for broad real estate market is based on a gross income of about 6.5%, management fees of roughly 2%, and future capital appreciation near the rate of inflation during the next 30 years. We assume a portfolio of equity real estate holdings that is diversified by property type and by geographic region.
Core Real Estate (3.6%) – Our real return assumption for core real estate is based on a gross income of about 5.6%, management fees of roughly 2%, and future capital appreciation near the rate of inflation during the next 30 years. We assume a portfolio of equity real estate holdings that is diversified by property type and geographic region.
U.S. REITs (4.4%) – Our real return assumption for U.S. REITs is based on income of about 4.4% and future capital appreciation near the rate of inflation during the next 30 years. REITs are a sub-set of the U.S. small/mid cap equity universe.
Commodities (3.1%) – Our commodity assumption is for a diversified portfolio of commodity futures contracts. Commodity futures returns are composed of three parts: spot price appreciation, collateral return, and roll return (positive or negative change implied by the shape of the future curve). We believe that spot prices will converge with CPI over the long run (i.e., 2.0%). Collateral is assumed to be LIBOR cash 1.1%. Also, we believe the roll effect will be near zero, resulting in a real return of approximately 3.1% for commodities.
Private Equity (6.6%) – Our private equity assumption reflects a diversified fund of funds with exposure to buyouts, venture capital, distressed debt, and mezzanine debt.
Infrastructure (5.2%) – Our infrastructure assumption is formulated using a cash flow based approach that projects cash flows (on a diversified portfolio of assets) over a 30 year period. Income and capital growth as well as gearing levels, debt costs and terms, relevant tax and management expenses are all taken into consideration. Our approach produces an expected real return of 5.2% for infrastructure.
Aon Hewitt | Retirement and InvestmentProprietary & Confidential Investment advice and consulting services provided by Aon Hewitt Investment Consulting, Inc., an Aon Company. 42
Explanation of Capital Market Assumptions—Q3 2015 (30 Years)
Volatility / Correlation AssumptionsAssumed volatilities are formulated with reference to implied volatilities priced into option contracts of various terms, as well as with regard to historical volatility levels. For asset classes which are not marked to market (for example real estate), we “de-smooth” historical returns before calculating volatilities. Importantly, we consider expected volatility trends in the future – in recent years we assumed the re-emergence of an economic cycle and a loss of confidence in central bankers would lead to an increase in volatility. Correlation assumptions are generally similar to actual historical results; however, we do make adjustments to reflect our forward-looking views as well as current market fundamentals.

Aon Hewitt | Retirement and InvestmentProprietary & Confidential Investment advice and consulting services provided by Aon Hewitt Investment Consulting, Inc., an Aon Company. 43
Capital Market Assumption Overview
We have what we consider a consistent and conservative approach to modeling asset class returns, risk, and correlations
AHIC regularly reviews these critical inputs relative to peer consultants as well as the investment management community
The following slides include a review of 2015 assumptions relative to a study of peer averages– AHIC is often more conservative from an expected return standpoint than the peer average– While we do not seek to change our approach based on how we stack up to peers, it is a helpful double-check to
make sure we are not too far off from others in the industry
Aon Hewitt | Retirement and InvestmentProprietary & Confidential Investment advice and consulting services provided by Aon Hewitt Investment Consulting, Inc., an Aon Company. 44
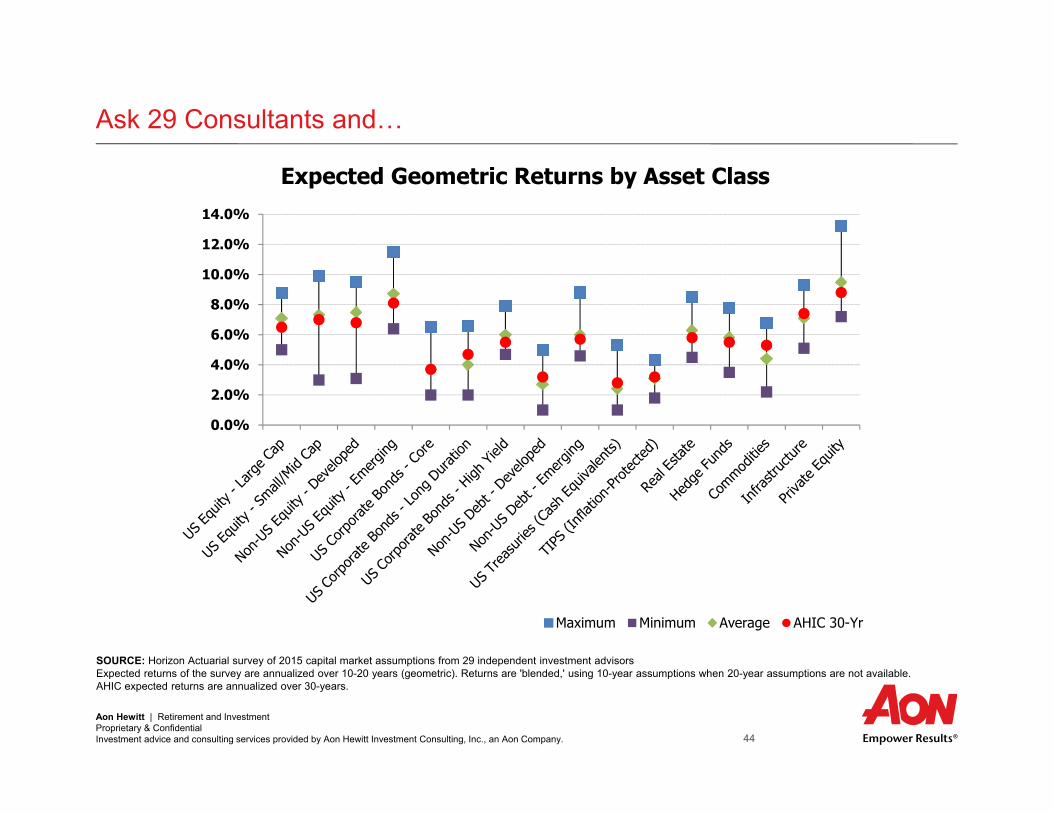
Ask 29 Consultants and…
SOURCE: Horizon Actuarial survey of 2015 capital market assumptions from 29 independent investment advisorsExpected returns of the survey are annualized over 10-20 years (geometric). Returns are 'blended,' using 10-year assumptions when 20-year assumptions are not available.AHIC expected returns are annualized over 30-years.
0.0%
2.0%
4.0%
6.0%
8.0%
10.0%
12.0%
14.0%
Expected Geometric Returns by Asset Class
Maximum Minimum Average AHIC 30-Yr
Aon Hewitt | Retirement and InvestmentProprietary & Confidential Investment advice and consulting services provided by Aon Hewitt Investment Consulting, Inc., an Aon Company. 45
Reasons for Differences
Methodology Time Horizon Arithmetic vs. Geometric forecasts* Alpha (active management)* Inflation Investment Fees Asset class definition
* While some firms in Horizon survey responded with Arithmetic forecasts, the results have been converted to Geometric forecasts for comparison purposes. Additionally, the return expectations included in the Horizon survey are based on indexed returns (no “alpha”). However, AHIC return assumptions for certain asset classes include “alpha” or active management premium (e.g., Private Equity and Hedge Funds)

Aon Hewitt | Retirement and InvestmentProprietary & Confidential Investment advice and consulting services provided by Aon Hewitt Investment Consulting, Inc., an Aon Company. 46
Leading Methodologies
Building Block Global Capital Asset Pricing Model (Global CAPM) Surveys Historical data (as a guide to future) Black-Litterman (combination of building block and CAPM)
Aon Hewitt | Retirement and InvestmentProprietary & Confidential Investment advice and consulting services provided by Aon Hewitt Investment Consulting, Inc., an Aon Company. 47
AHIC Capital Market Assumptions
Long-term (10 and 30 year forecasts) forward-looking assumptions (asset class geometric return, volatility and correlations)
Building Block approach. Primarily based on consensus expectations and market based inputs Best estimates of annualized returns (50/50 better or worse) Market returns: no active management value added (other than hedge funds and private equity) Net of investment fees

Aon Hewitt | Retirement and InvestmentProprietary & Confidential Investment advice and consulting services provided by Aon Hewitt Investment Consulting, Inc., an Aon Company. 48
AHIC Versus Peers (2015 Horizon Survey)
Expected RiskAsset Class Maximum Minimum Average Average Expected Return Expected Risk Expected Return Expected RiskUS Equity - Large Cap 8.8% 5.0% 7.1% 17.1% 6.5% 17.0% 6.5% 17.5%US Equity - Small/Mid Cap 9.9% 3.0% 7.3% 21.0% 6.7% 23.0% 7.0% 23.5%Non-US Equity - Developed 9.5% 3.1% 7.5% 19.6% 6.9% 20.0% 6.8% 20.5%Non-US Equity - Emerging 11.5% 6.4% 8.7% 26.6% 8.0% 30.0% 8.1% 30.5%US Fixed Income - Core 6.5% 2.0% 3.7% 5.6% 2.9% 4.0% 3.7% 5.0%US Fixed Income - Long Duration Corp 6.6% 2.0% 4.0% 10.8% 4.4% 11.5% 4.7% 13.5%US Fixed Income - High Yield 7.9% 4.7% 6.0% 11.2% 4.7% 12.0% 5.5% 12.0%Non-US Fixed Income - Developed 5.0% 1.0% 2.7% 7.4% 2.3% 5.5% 3.2% 6.5%Non-US Fixed Income - Emerging 8.8% 4.6% 6.0% 11.7% 4.6% 13.0% 5.7% 13.5%Treasuries (Cash Equivalents) 5.3% 1.0% 2.4% 2.8% 2.1% 1.0% 2.8% 1.5%TIPS (Inflation-Protected) 4.3% 1.8% 3.1% 6.3% 2.7% 4.5% 3.2% 4.5%Real Estate 8.5% 4.5% 6.3% 13.6% 5.8% 11.5% 5.8% 11.5%Hedge Funds 7.8% 3.5% 5.8% 8.3% 5.0% 9.0% 5.5% 10.0%Commodities 6.8% 2.2% 4.4% 18.0% 4.5% 17.0% 5.3% 17.0%Infrastructure 9.3% 5.1% 7.1% 13.1% 7.2% 14.5% 7.4% 14.5%Private Equity 13.2% 7.2% 9.5% 23.6% 8.8% 24.0% 8.8% 24.5%Inflation 2.8 1.7 2.2% 1.8% 2.1% 1.0% 2.1% 1.5%
Notes (Horizon Survey):Source: Horizon Actuarial survey of 2015 capital market assumptions from 29 independent investment advisorsExpected returns are annualized over 10-20 years (geometric). Returns are 'blended,' using 10-year assumptions when 20-year assumptions are not available.
Notes (AHIC Forecasts):AHIC Forecasts are for Q3 2015US Equity - Small/Mid Cap forecasts represents AHIC forecasts for US Small Cap US Fixed Income - Long Duration forecasts represents AHIC forecasts for Long Duration CreditNon-US Fixed Income - Developed forecasts represents AHIC forecasts for Non-US Fixed Income - Developed (50% Hedged)Non-US Fixed Income- Emerging forecasts represents AHIC forecasts for Non-US Fixed Income- Emerging Sovereign USDReal Estate forecasts represents AHIC forecasts for Core Private Real EstateHedge Funds forecasts represents AHIC forecasts for Hedge Fund-of-Funds
Expected Geometric Returns 10 Year Forecasts 30 Year ForecastsHorizon Survey AHIC

Aon Hewitt | Retirement and InvestmentProprietary & Confidential Investment advice and consulting services provided by Aon Hewitt Investment Consulting, Inc., an Aon Company. 49
AHIC Versus Peers: Observations
Compared to 2014, 2015 survey results indicate a decline in return assumptions of both risky assets (equity-like) and fixed income asset classes
– Equity return assumptions are lower by an average of 0.3%– Fixed income return assumptions are lower by an average of 0.3%– Alternative asset class return assumptions are lower by an average of 0.4%
2015 AHIC assumptions tend to be lower than the survey average– AHIC equity assumptions are driven by market valuations, earnings growth expectations and
assumed payouts to investors. Recent experience suggests strong equity market performance has been driven more by increasing valuations than increasing profits. As markets have become more expensive, our equity return assumptions have consequently fallen
– AHIC fixed income assumptions reflect rising yields and steepening of yield curves during the second quarter of 2015
– AHIC alternative asset class assumptions are generally lower due to methodological and inflation forecast differences compared to survey participant forecasts
In conclusion, AHIC assumptions appear somewhat more conservative than peers included in the 2015 Horizon Survey of capital market assumptions

Aon Hewitt | Retirement and InvestmentProprietary & Confidential Investment advice and consulting services provided by Aon Hewitt Investment Consulting, Inc., an Aon Company. 50
Appendix Public Pension Peer Review

Aon Hewitt | Retirement and InvestmentProprietary & Confidential Investment advice and consulting services provided by Aon Hewitt Investment Consulting, Inc., an Aon Company. 51
Public Pension Peer ReviewOverview
Public Fund Peer Asset Allocation Comparison– Asset allocation should be matched to each defined benefits unique design– Peer comparison is meant to inform and not dictate policy

Aon Hewitt | Retirement and InvestmentProprietary & Confidential Investment advice and consulting services provided by Aon Hewitt Investment Consulting, Inc., an Aon Company. 52
Public Pension Peer ReviewMSERS’s Asset Allocation versus Public Peers
Asset Allocation MSERSLarge Public Pension Plans (<$500m)*
Large Public Pension Plans ($501m‐1B)*
Large Public Pension Plans ($1‐
5B)*
Large Public Pension Plans
(>$5B)*
Total Public Pension Universe*
Wilshire Report on State Retirement
Systems **
Equity ExposureGlobal Equity 0.0%
Total U.S. Equity 28.0% 37.9% 40.4% 30.8% 24.0% 24.7% 27.9%Total Int'l Equity 16.0% 19.7% 19.6% 21.3% 23.3% 23.2% 21.0%Private Markets 21.2% 2.4% 2.6% 4.9% 9.4% 9.0% 10.1%
Total Equity 65.2% 60.0% 62.6% 57.0% 56.7% 56.9% 59.0%
Fixed Income ExposureU.S. Fixed Income 10.5% 22.3% 21.2% 17.5% 19.0% 18.9% 21.4%
High Yield Bonds / Bank Loans 0.0%Non‐US Developed Bonds 0.0% 2.2% 1.5% 4.0% 3.2% 3.2% 2.1%
Emerging Market Debt 0.0% 0.5% 0.2% 0.8% 1.4% 1.4%Inflation Protected 0.0%Total Fixed Income 10.5% 25.0% 22.9% 22.3% 23.6% 23.5% 23.5%
Real Asset ExposureUS Infrastructure 1.5%
Commodities 3.2% 1.2% 1.3% 1.4% 1.0% 1.0%Real Estate 8.5% 6.8% 7.2% 6.9% 8.0% 7.9% 7.2%
Total Real Assets 13.2% 8.0% 8.5% 8.3% 9.0% 8.9% 7.2%
Hedge Funds 9.2% 2.6% 2.9% 5.2% 4.3% 4.3%Multi‐Asset / Risk Parity 0.8% 0.4% 2.8% 1.5% 1.6%Money Market / Cash 2.0% 0.5% 0.8% 0.6% 1.6% 1.5%Other 0.0% 3.2% 2.1% 3.7% 3.4% 3.4% 10.3%
Net Other 11.2% 7.1% 6.2% 12.3% 10.8% 10.8% 10.3%
Total 100% 100% 100% 100% 100% 100% 100%
* Source: "2014 United States Institutional Investors ‐ Market Trends ‐ Consutling Business", Greenwich Associates** Source: "2015 Report on State Retirement Systems: Funding Levels and Asset Allocation", Wilshire Consulting
Aon Hewitt | Retirement and InvestmentProprietary & Confidential Investment advice and consulting services provided by Aon Hewitt Investment Consulting, Inc., an Aon Company. 53
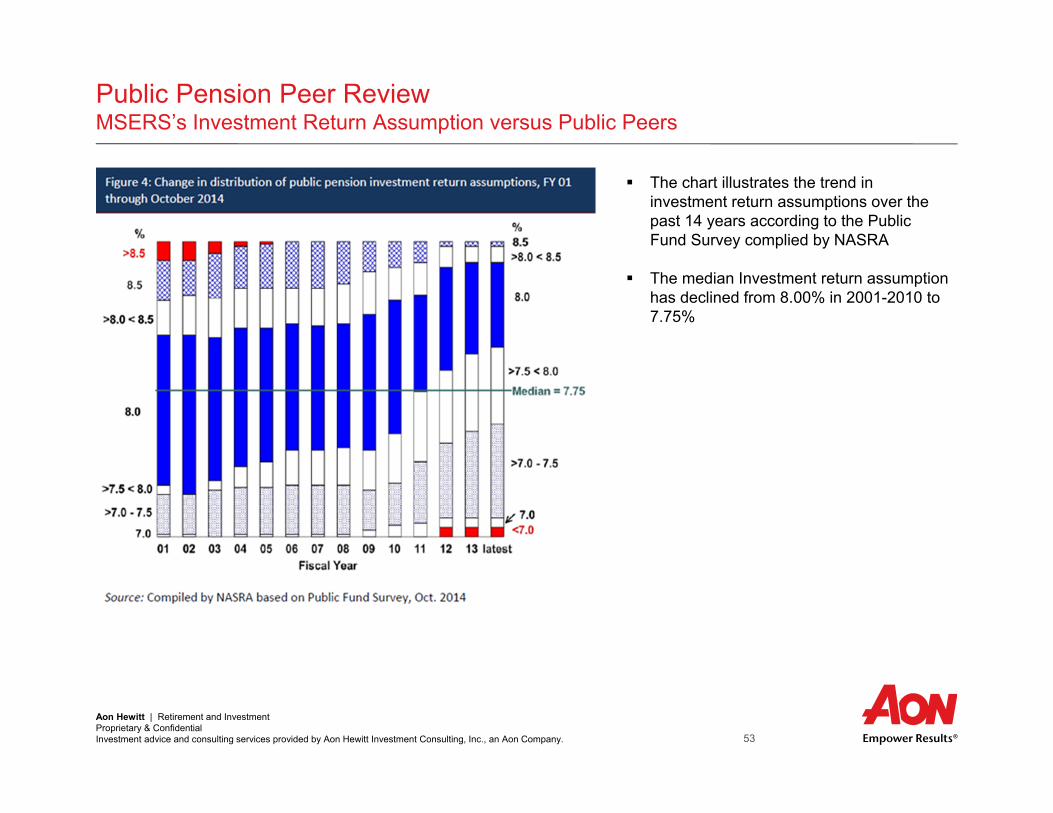
Public Pension Peer Review MSERS’s Investment Return Assumption versus Public Peers
The chart illustrates the trend in investment return assumptions over the past 14 years according to the Public Fund Survey complied by NASRA
The median Investment return assumption has declined from 8.00% in 2001-2010 to 7.75%

Aon Hewitt | Retirement and InvestmentProprietary & Confidential Investment advice and consulting services provided by Aon Hewitt Investment Consulting, Inc., an Aon Company. 54
Appendix Regulatory Update
Aon Hewitt | Retirement and InvestmentProprietary & Confidential Investment advice and consulting services provided by Aon Hewitt Investment Consulting, Inc., an Aon Company. 55
Regulatory UpdateOverview
In an effort to improve the consistency and transparency of reporting, GASB voted on June 25, 2012 to approve:– Statement No. 67, Financial Reporting for Pension Plans (an amendment of GASB Statement No. 25) effective
for fiscal years beginning after June 15, 2013– Statement No. 68, Accounting and Financial Reporting for Pensions (an amendment of GASB Statement No. 27)
effective for fiscal years beginning after June 15, 2014
Changes in the Statements relate only to accounting and financial reporting for pensions– No changes required to current funding methods—effectively separates accounting and funding valuations
These Statements apply to pensions in which all of the following apply:– The plan is administered through a trust or equivalent arrangement– Contributions and earnings on those contributions are irrevocable– Trust assets are dedicated to providing pensions to plan members– Trust assets are legally protected from creditors
Therefore, for example, these Statements do not apply to pensions funded through a rabbi trust

Aon Hewitt | Retirement and InvestmentProprietary & Confidential Investment advice and consulting services provided by Aon Hewitt Investment Consulting, Inc., an Aon Company. 56
Regulatory UpdateOverview of GASB 67 Changes
GASB 67 requires defined benefit pension plans to present two financial statements:– A statement of fiduciary net position– A statement of changes in fiduciary net positions
This Statement sets forth the requirements to be used in calculating pension liability– Actuarial Cost Method must be Entry Age Normal– Discount rates are the assumed investment rate of return blended with a 20-year municipal bond rate (AA/Aa or
higher) if projected plan assets are not expected to cover future benefit payments
Additional disclosures in the notes to the financial statements and required supplementary information are also required, such as the following:– Plan information– Documentation of the investment policy – Long-term rate of return– Target asset allocations– Sensitivity of the Net Pension Liability– Significant assumptions such as inflation, salary changes, ad hoc postemployment benefit changes

Aon Hewitt | Retirement and InvestmentProprietary & Confidential Investment advice and consulting services provided by Aon Hewitt Investment Consulting, Inc., an Aon Company. 57
Regulatory UpdateOverview of GASB 68 Changes
Current (GASB 27) New (GASB 68) Impact
Funding Method May use one of several approved methods; Projected Unit Credit (mandated under FASB) is common Must use Entry Age Normal method Entry Age Normal method may result in a higher
liability measure than current method
Measurment DatePractice varies; some employers report funded status
based on beginning of fiscal year valuation results; others estimate fiscal year-end funded status
As early as prior fiscal year-end; results from an earlier valuation (up to 30 months and 1 day prior to FYE) may be rolled forward to measurement date
More flexibility than was contained in Exposure Draft; may require valuation in 2014 under new rules for transition if earlier measurement date is adopted
Asset Method Asset gains and losses may be smoothed; 5-year smoothing is common
Market Value with no smoothing Increased volatility in both expense and balance sheet if previously smoothing
Amortization Period for Liability Gains/Losses
Up to 30 years permittedAmortization period based on average Expected Remaining Service Life for actives and inactives
combined **
Accelerated recognition of gains and losses; increased volatility in expense
Amortization Period for Asset Gains/Losses
Up to 30 years permitted 5 years Accelerated recognition of gains and losses; increased volatility in expense
Amortization Method Open or Closed amortization period may be used (Open is common)
Closed amortization period commencing in year following measurement date
Increased volatility in expense
Impact of Plan Amendments
Amortized over up to 30 years Recognition on measurement date immediately following amendment
Full increase (decrease) in liability due to amendment must be expensed in fiscal year associated with next
following measurement date
Components of Annual Pension Cost
If open amortization period is used, 2 components, Normal Cost and fresh-start amortization amount
Several components (Service Cost, Interest Cost, Impact of Plan Amendments, Gain/Loss
Amortizations, Expected Return on Assets)Components similar to FASB 87
Balance Sheet LiabilityCumulative difference, if any, between actual
contributions and Annual Pension Cost shown as Net Pension Obligation (NPO)
Actual funded status on market value basis Replacing NPO with actual funded status may result in large swing on balance sheet upon adoption
Discount Rate Based on expected long-term return on plan assets20- year municipal bond rate (AA/Aa or higher)
required for discounting projected benefit payments not expected to be covered by projected plan assets
May increase liability for underfunded plans and plans where employer is not contributing full actuarially determined amounts; funding policy will impact
Scope of Applicability Defines both a target funding amount (ARC) and accounting expense (Annual Pension Cost) Changes only affect financial accounting, not funding
Funding policy may be based on different methods/assumptions; replacing NPO with funded
status may promote separate funding policies
* Effective for fiscal years beginning after 6/15/2014; restatement for prior periods not required unless information for prior years on new basis is available** Includes impact on liability of any changes in actuarial assumptions
Final GASB Pension Accounting Changes (GASB 68) *

Aon Hewitt | Retirement and InvestmentProprietary & Confidential Investment advice and consulting services provided by Aon Hewitt Investment Consulting, Inc., an Aon Company. 58
Appendix About This Material
Aon Hewitt | Retirement and InvestmentProprietary & Confidential Investment advice and consulting services provided by Aon Hewitt Investment Consulting, Inc., an Aon Company. 59
About This Material
This material includes a summary of calculations and consulting related to the finances of Michigan State Employees' Retirement System (MSERS). The following variables have been addressed: Contributions Economic Cost Funded Ratio Hurdle Rate Net Outflow
This analysis is intended to assist the Investment Committee with a review of the associated issues and options, and its use may not be appropriate for other purposes. This analysis has been prepared solely for the benefit of the Investment Committee. Any further dissemination of this report is not allowed without the written consent of Aon Hewitt Investment Consulting, Inc.Our calculations were generally based on the methodologies identified in the actuary’s valuation report for MSERS. We believe the methodology used in these calculations conforms to the applicable standards identified in the report. Experience different than anticipated could have a material impact on the ultimate costs of the benefits. In addition, changes in plan provisions or applicable laws could have a significant impact on cost. Actual experience may differ from our modeling assumptions.Our calculations were based on data provided by the plan actuary. The actuarial assumptions and methods and plan provisions reflected in these projections are the same as those used for the 2014 fiscal year actuarial valuation for MSERS as noted in the actuarial report, except where noted in this report. Unless specifically noted, our calculations do not reflect any other changes or events after September 30, 2014.In conducting these projections, we have relied on plan design, demographic and financial information provided by other parties, including the plan’s actuary and plan sponsor. While we cannot verify the accuracy of all of the information, the supplied information was reviewed for consistency and reasonableness. As a result of this review, we have no reason to doubt the substantial accuracy or completeness of the information and believe that it has produced appropriate results. These projections have been conducted in accordance with generally accepted actuarial principles and practices, including applicable Actuarial Standards of Practice as issued by the Actuarial Standards Board. The undersigned actuary is familiar with the near-term and long-term aspects of pension valuations and meets the Qualification Standards of the American Academy of Actuaries necessary to render the actuarial opinions contained herein. All sections of this report are considered an integral part of the actuarial opinions. To our knowledge, no associate of Aon Hewitt Investment Consulting, Inc. providing services to MSERS has any direct financial interest or indirect material interest in MSERS. Thus, we believe there is no relationship existing that might affect our capacity to prepare and certify this report for MSERS. Aon Hewitt Investment Consulting, Inc.Phil Kivarkis FSA, EA, CFA
Aon Hewitt | Retirement and InvestmentProprietary & Confidential Investment advice and consulting services provided by Aon Hewitt Investment Consulting, Inc., an Aon Company. 60
Legal Disclosures and Disclaimers
Investment advice and consulting services provided by Aon Hewitt Investment Consulting, Inc. (“AHIC”). The information contained herein is given as of the date hereof and does not purport to give information as of any other date. The delivery at any time shall not, under any circumstances, create any implication that there has been a change in the information set forth herein since the date hereof or any obligation to update or provide amendments hereto.
This document is not intended to provide, and shall not be relied upon for, accounting, legal or tax advice or investment recommendations. Any accounting, legal, or taxation position described in this presentation is a general statement and shall only be used as a guide. It does not constitute accounting, legal, and tax advice and is based on AHIC’s understanding of current laws and interpretation.
This document is intended for general information purposes only and should not be construed as advice or opinions on any specific facts or circumstances. The comments in this summary are based upon AHIC’s preliminary analysis of publicly available information. The content of this document is made available on an “as is” basis, without warranty of any kind. AHIC disclaims any legal liability to any person or organization for loss or damage caused by or resulting from any reliance placed on that content. AHIC. reserves all rights to the content of this document. No part of this document may be reproduced, stored, or transmitted by any means without the express written consent of AHIC.
© Aon plc 2015. All rights reserved.

Aon Hewitt | Retirement and InvestmentProprietary & Confidential Investment advice and consulting services provided by Aon Hewitt Investment Consulting, Inc., an Aon Company. 61
About Aon Hewitt
Aon Hewitt empowers organizations and individuals to secure a better future through innovative talent, retirement and health solutions. We advise, design and execute a wide range of solutions that enable clients to cultivate talent to drive organizational and personal performance and growth, navigate retirement risk while providing new levels of financial security, and redefine health solutions for greater choice, affordability and wellness. Aon Hewitt is the global leader in human resource solutions, with over 30,000 professionals in 90 countries serving more than 20,000 clients worldwide. For more information, please visit aonhewitt.com.