Embed Size (px)
Citation preview

Electronic copy available at: http://ssrn.com/abstract=1916686
Pension funds�allocations to hedge funds: an empirical
analysis of US and Canadian de�ned bene�t plans �
Vincent Bouvatiery Sandra Rigotz
August 2011
Abstract
This paper investigates the characteristics of US and Canadian pension funds thatallocate assets to hedge funds. The typical pension fund that invests in hedge funds isa large sophisticated pension fund that diversi�es its portfolio across numerous classesof investments, private equity in particular, uses a core-satellite organization and hasaccess to low delegation costs for alternative assets. Moreover, we �nd that pensionfunds investing in hedge funds signi�cantly obtained higher global returns.
JEL classi�cation: G23Keywords: pension funds, hedge funds, asset allocation, diversi�cation
�We would like to thank Michel Aglietta and Gunther Capelle-Blancard for helpful remarks and sugges-tions. The usual disclaimer applies.
yEconomiX, Université de Paris Ouest - CNRS, 200 Avenue de la République, 92001 Nanterre Cedex,France. E-mail: [email protected]
zCEPN, Université de Paris Nord - CNRS, 99 avenue Jean-Baptiste Clément, 93430 Villetaneuse, France.E-mail: [email protected]
1

Electronic copy available at: http://ssrn.com/abstract=1916686
1 Introduction
Since 2000, institutional investors have been improving their portfolio diversi�cation and
allocating more funds to alternative assets.1 In particular, hedge fund investments became a
signi�cant asset class in the portfolios of numerous institutional investors. In 2007, institu-
tional investors accounted for more than 50% of hedge funds in�ows for the �rst time (Mac
Kinsey, 2007); the largest share of hedge funds�capital has historically come from high net
worth individuals (Prequin, 2009; US GAO, 2008). Pension funds and funds of funds are the
main contributors to this change in the client structures of hedge funds.2
In this paper, we investigate the characteristics of pension funds that invest in hedge
funds. The growing interest that pension funds have taken in hedge funds occurs in a global
context. After the stock market crash of 2001-2002 and the decline in long term interest
rates, pension funds have been looking for sources of higher returns.3 Consequently, pen-
sion funds steadily reorganized their management to improve their strategic asset allocation.
They employ a core-satellite organization, which comes from asset-liabilities management
(Sharpe and Tint, 1990). This structure is known to be an e¢ cient strategy for portfolio
diversi�cation through active management (Amenc et al., 2004). It consists of de�ning a
strategic asset allocation and dividing assets between two components: core and satellite.
The �rst (75%-90%) aims to match the liabilities of pension funds via immunization tech-
niques. The objective is to avoid risks related to the variability of the assets of pension funds.
The core is generally invested in traditional asset classes in liquid markets (large caps, bonds,
etc.) and the assets can be managed in either an active or passive way, as well as internally
or externally. The second component (10%-25%) is almost exclusively invested in alterna-
tive assets (real estate, hedge funds, private equity, infrastructure, etc.). The satellite looks
for higher performance (by generating positive alpha returns) and a better diversi�cation of
risk (by improving beta).4 In addition, satellites are exclusively managed externally because
1Alternative assets are made up of private equity, real assets and hedge fund investments.2Funds of funds are collective investment vehicles that allocate assets to several hedge funds to bene�t
through a diversi�cation of bene�ts. As a general rule, they are managed by private banks, mutual funds orinstitutional asset managers.
3The high returns earned by hedge funds in bear markets between 2001 and 2003 explain the importanceof hedge funds in�ows over these years.
4Alternative investments allow a portfolio diversi�cation because their return drivers di¤er from the equity
2

these active investments require speci�c expertise that pension funds do not have in-house.
The hedge funds industry, with its objectives of high and allegedly uncorrelated returns,
seemed therefore particularly attractive for the satellite component.
Regulators viewed hedge funds as having a positive in�uence on �nancial markets (Daniels-
son and Zigrand, 2007). However, their light regulation and their speci�c governance raise
issues beyond those posed by traditional investments. These issues include risks and chal-
lenges related to valuation, leverage, liquidity and the operational risk of hedge fund in-
vestments (US GAO, 2010). Indeed, investors in hedge funds have limited information on
the valuation of and the assets underlying their investments. Hedge funds are engaged in
complex investment techniques that can involve various �nancial instruments for which there
is no benchmark and no market. In addition, hedge funds often have broad latitude to use
leverage, which ampli�es both potential gains and losses. As a result, some of the most suc-
cessful hedge fund strategies display a vulnerability to extreme losses, i.e., negative skewness
and very large kurtosis (Amin and Kat, 2002; Agarwal et al, 2004; Khanniche, 2008). Hedge
funds also have speci�c rules that limit an investor�s ability to redeem an investment for a
de�ned period of time; generally corresponding to a one year lockup period. Additionally,
hedge funds impose higher fees.5 As a result, investors need to earn a higher gross return
to achieve a higher net return (Ackermann et al., 1999). Finally, a hedge fund�s active or
risky trading activity may result in losses due to operational failures such as trading errors
or outright fraud (operational risk).
The particulars of hedge fund investments -related mainly to valuation, leverage, liquidity
and operational risk- imply that many pension funds do not have the necessary abilities or
incentives to invest in this category of alternative assets. Investments in hedge funds should,
for example, be made by those with the skills required to select hedge funds managers
and require su¢ cient bargaining power to negotiate contractual terms related to fees and
information disclosure.
Attention had increasingly focused on the management and investment practices of pen-
and bond markets drivers (Schneeweis, Kazemi and Martin, 2001).5Investors are charged 3 types of fees: management fees (1%-2%), performance fees (15%-20%) and early
termination fees (1%-2%) in the event of an early liquidation.
3

sion funds. However, few studies focus on pension funds� contractual delegation to their
hedge fund managers. This paper aims to bridge this gap through the use of an original and
representative database from CEM benchmarking. This database concerns the investment
strategies of US and Canadian De�ned Bene�ts pension funds, over the period 2000-2008.
The �rst aim of this article is to analyze the extent to which US and Canadian pension funds
allocate to hedge funds and to identify the main characteristics of the pension funds investing
in hedge funds. Second, we investigate the implications of allocating pension fund assets to
hedge funds. More precisely, we propose to evaluate the bene�ts of hedge fund investments
with respect to returns and to question to what extent pension funds have tackled speci�c
agency problems in their delegation to hedge funds.
The remainder of the paper is organized as follows. Section 2 presents the data and
descriptive statistics. Section 3 assesses the characteristics of the pension funds allocating to
hedge funds. Section 4 investigates the relationship between pension funds�global returns
and their allocation to hedge funds. Section 5 concludes the paper.
2 Dataset and descriptive statistics
We use the CEM benchmarking database, which provides data on individual de�ned bene�t
pension plans from the US and Canada from 1990 to 2008. The data include assets under
management (in millions of dollars); costs and returns, which are available by asset class
and by the nature of their delegation (active/passive and external/internal).6 In addition,
the database provides the policy asset allocations (in %) (i.e., strategic asset allocations,
de�ned before buy and sell decisions) and their expected return by asset class as well as
other information regarding global costs (custody, consulting and oversight). The database
also indicates whether the fund is publicly or privately owned.
According to Mac Kinsey (2007), OECD (2008) and US GAO (2008), US de�ned bene�t
(DB) pension funds were valued at $4,250 billion in 2007.7 Assets under the management
6Total assets are disaggregated into 7 classes: equity, �xed income, real assets, private equity, hedgefunds, cash and tactical asset allocation (TAA). In addition, for assets under management, equities and �xedincome assets are also disaggregated into subclasses.
7More precisely, total assets managed by US pension funds amounted to $9,500 billion in 2007 and
4

of the US pension funds listed in the CEM benchmarking database accounted for $2,500
billion in 2007, i.e., around half the value of US DB pension funds in terms of assets under
management. Concerning Canada, more than 93% of pension funds were de�ned bene�t in
2004, while their assets under management amounted to about $700 billion in 2006 (OECD,
2007). The CEM benchmarking database seems to be representative, as it reports that $460
billion of assets were under management in 2006.
We focus our empirical analysis on the period from 2000 to 2008 because pension funds
began allocating to hedge funds in 2000.8 More precisely, we have an unbalanced panel of
1,973 observations for 407 pension funds, among which 86 invested in hedge funds for at
least one period. Concerning the geographic distribution, 274 pension funds in our dataset
come from the US, and 72 of these US pension funds invested in hedge funds for at least one
period. To our knowledge, the information provided by the CEM benchmarking database
concerning allocations to hedge funds has rarely been used in related pension fund studies.9
In this section, we present general descriptive statistics concerning pension funds�allo-
cations to hedge funds. In addition, we suggest several characteristics of pension funds that
could be related to the decision to invest in hedge funds.
2.1 Allocation to hedge funds
Table 1 shows the average portfolio allocation for the full sample and for the subsample of
pension funds investing in hedge funds. In the full sample, equities are the primary assets
and account for approximately 60% of the portfolio, followed by �xed income assets, which
represent approximately 30% of the portfolio. The remainder of the portfolio is allocated to
alternative assets, mainly real assets (approximately 4%) and private equity (approximately
3%). Allocations to hedge funds only represent 0.61%, indicating both that numerous pension
funds do not invest in hedge funds and that pension funds consider the three categories
approximately half of those assets were managed by DB pension funds.8There is no distinction in the database between allocations to hedge funds or to funds of hedge funds.9For example, French and Kenneth (2008) compare the fees, expenses and trading costs society pays to
invest in the U.S. stock market along with an estimate of what would be paid if everyone invested passively.Bauer, Cremers and Frehen (2010) document the performance and costs of the domestic equity investmentsof a large sample of US pension funds (small-large size) in comparison with mutual funds.
5

of alternative assets di¤erently. Focusing on the subsample of pension funds investing in
hedge funds, Table 1 highlights how the portfolio allocation is modi�ed when pension funds
decide to invest in hedge funds. The average allocation to hedge funds jumps to 4.57%.
The allocation to other alternative assets also increases. Real assets and private equity
represent 6.16% and 4.98% of total assets respectively. These reallocations are made through
a reduction in equities, which account for 52.52% of total assets.
To illustrate more precisely the pension funds�allocations to hedge funds (HFi;t), Figure
1 represents the percent distribution of HFi;t for the subsample of pension funds investing
in hedge funds. For more than 50% of these pension funds, investments in hedge funds
represent less than 3% of total assets. However, several pension funds are investing more
than 10% of their total assets in hedge funds with a maximum of 36.69%. In the US, the
federal government does not speci�cally limit or monitor private sector de�ned bene�t plans
investments in hedge funds, and state approaches to public pension plans vary.10 Under
the Employee Retirement Income Security Act (ERISA) of 1974, �duciaries (pension fund
administrators) must comply with a standard of prudence (including the diversi�cation of
assets and minimizing the risk of large losses), but there is no explicit restrictions on allo-
cations to hedge funds. The prudent man standard does not explicitly prohibit investment
in any speci�c category. An unsuccessful individual investment is not considered a per se
violation of the prudent man standard.
Table 2 gives a breakdown of the number of pension funds by year in the full sample. In
addition, Table 2 displays the proportion of pension funds investing in the three categories
of alternative assets and the average allocation. The number of pension funds investing in
hedge funds has increased over the years. From 2000 to 2008, the percent of pension funds
investing in hedge funds increased from 1.35% to 25.42%. However, the average allocation
has not increased over time. Real assets and private equity are more commonly managed by
10We can classify pension funds by two criteria that can be mixed: the �rst is concerned with bene�ts,which can be de�ned or not; the second relates to sponsorship, which can be private or public. A de�nedbene�t (DB) plan promises participants a speci�ed monthly bene�t at retirement. In this context, plansponsors bear the investment risk. On the contrary, a de�ned contribution (DC) plan does not promise aspeci�c amount of bene�ts at retirement. In addition, public and private DB plans are not subject to thesame regulatory framework. The federal government monitors private sector DB plan investments and stategovernments monitor the investments of public DB plans.
6

pension funds. From 2000 to 2008, the percentage of pension funds investing in real assets
increased from 69.68% to 78.81%. Concerning private equity, the percentage increased from
51.13% to 63.98%. Similar to investments in hedge funds, the average allocations do not
exhibit a trend.
The interest of pension funds in hedge funds may also be highlighted by the strategic al-
location, also known as the policy weight (PWi;t). Table 3 reports some descriptive statistics
for several variables used in our empirical analysis. The average policy weight of hedge funds
is higher than the e¤ective allocation (HFi;t) and reaches 1.03% in the full sample. Focus-
ing on the subsample of pension funds investing in hedge funds, the policy weight and the
e¤ective allocation seem very close on average, at 4.62% and 4.57% respectively. However,
the policy weight and the e¤ective allocation can diverge noticeably. Several pension funds
investing in hedge funds report a policy weight equal to 0, and conversely, several pension
funds reporting a positive policy weight do not invest in hedge funds. For example, the policy
weight is equal to 0 for 36% of the subsample of pension funds investing in hedge funds.11
As a result, the policy weight of hedge funds can provide a distorted representation of the
e¤ective investments pension funds make in hedge funds. Therefore, we focus our empirical
analysis on the e¤ective allocation (HFi;t) rather than on the policy weight (PWi;t).
2.2 Sophistication of pension funds
Hedge funds represent one category of alternative assets in which pension funds invest. Real
assets and private equity are the two other categories. Private equity funds are funds spe-
cializing in funding innovation via corporate creation (venture capital), growth of small and
mid-sized �rms (expansion) and the purchase of diverse �rms (leverage buyouts). Real assets
include real estate investment trusts (REITs), real estate, commodities and infrastructure
(mainly for corporations o¤ering public services, e.g., natural monopolies).
Table 3 reports the percentages of private equity (PRIVi;t) and real assets (REALi;t)
in total assets as well as the sum of these two components (ALTi;t). The average of ALTi;t
11In addition, considering the subsample where PWi;t > 0 (315 observations); the average policy weight is6.49%, the average e¤ective allocation is 2.57% and 46% of observations in this subsample have an e¤ectiveallocation equal to 0.
7

is 6.45% in the full sample and 11.15% for pension funds investing in hedge funds. The
averages suggest therefore that pension funds that invest more in private equity and real
assets have the increased incentives or skills to invest in hedge funds.
The degree of sophistication of pension funds can be evaluated more generally through
di¤erent indicators. De Dreu and Bikker (2009) suggest that the home bias in asset allo-
cation reveals the "degree of shortsightedness" of investors. International diversi�cation in
investment allocation could, therefore, be positively associated with the degree of sophistica-
tion of pension funds. International diversi�cation (FORi;t) is measured by the percentage
of foreign equities in the equity portfolio. Foreign equities represent 37.64% of the equity
portfolio in the full sample and 43.44% for pension funds investing in hedge funds (Table 3).
Pension funds with a lower home bias tend to invest more in hedge funds.
Policy weight could also be informative with respect to the identi�cation of sophisticated
funds. Figure 2 represents the percent distribution of policy weights for equities. Policy
weights are frequently a multiple of 5%. More precisely, the policy weight for equities is �xed
at 55%, 60%, 65% or 70% for more than 40% of our sample. De Dreu and Bikker (2009)
suggest that the use of these attractive numbers reveals a lack of a sophisticated method of
selecting investments. Indeed, asset allocation models should give an accurate number, while
rounding to the nearest 5% indicates the use of human judgment. We create the dummy
variable RNDi;t; which takes the value one if the policy weight for equities is a multiple of
5% and zero otherwise. In the full sample, approximately 50% of the observations round
their equity policy weights. In the subsample of pension funds investing in hedge funds, this
percentage is reduced to 30%, which could indicate that pension funds using an accurate
method to choose equity policy weights also tend to invest in hedge funds.
We consider a �nal indicator of sophistication based on performances in traditional asset
classes, i.e., in �xed incomes and equities. All pension funds hold traditional assets, which
can be managed actively or passively and externally or internally.12 According to the smart
money e¤ect, sophisticated investors make smart choices to identify funds that subsequently
perform well. As a result, decisions made by sophisticated pension funds should lead on
12Passive management corresponds to indexed management and external management corresponds todelegated management to a third asset manager.
8

average to better performances in the core component. We compute a dummy variable SFi
that takes the value one if the pension fund has an average return (net of delegation costs)
in the core component higher than the average obtained for the full sample. By de�nition,
approximately 50% of pension funds are classi�ed as sophisticated in the full sample using
variable SFi.13 In the subsample of pension funds investing in hedge funds, this percentage
rises to 58%. The descriptive statistics provide evidence that funds that are smart in the
core component also tend to invest in hedge funds.
2.3 Portfolio management
Portfolio management is noticeably di¤erent across pension funds. Practices regarding dele-
gation and diversi�cation can highlight these di¤erences. Ownership and size can also a¤ect
portfolio management, speci�cally concerning preferences about allocations to hedge funds.
The management can be active or passive and external or internal. In our dataset, pension
funds generally manage their assets through external and active management. Table 3 shows
that the percentage of assets under external and active management (EAi;t) represents on
average approximately 70% of total assets, both in the full sample and in the subsample
of pension funds investing in hedge funds. Consequently, the descriptive statistics do not
exhibit a clear link between preferences regarding delegation and allocation to hedge funds.
The degree of diversi�cation is assessed by the sum of the squares of the percentage asset
allocations (DIVi;t).14 This measure is computed in the spirit of a Her�ndahl index. Table 3
shows that the variable DIVi;t is on average lower for pension funds investing in hedge funds
(0.17) than in the full sample (0.23). As a result, pension funds pursuing a higher portfolio
diversi�cation invest more in hedge funds.
Pension funds are owned either publicly or privately. In the full sample, 259 pension
funds (out of 407) are owned privately, i.e., approximately 60% of the pension funds in the
13This is not exactly 50% because the dataset is not balanced.14Total assets are divided into 7 categories (equity, �xed income, real assets, private equity, hedge funds,
cash, TAA) and each category can be subsequently disaggregated into 3 dimensions at most: (i) a subcat-egory (only for equity and �xed income); (ii) internal/external delegation; (iii) active/passive delegation.Subcategories refer to a geographical criterion (US, Canada, EAFE, Emerging, etc.) or an asset speci�city(high yield bonds, mortgage bonds, etc.).
9

dataset. A similar division is observed in the subsample of pension funds investing in hedge
funds, with 48 pension funds (out of 86) are owned privately. Table 3 reports descriptive
statistics for the subsample of private pension funds. These statistics are similar to those
obtained for the full sample, which suggests that private and public pension funds share
several characteristics. For example, allocation to hedge funds (HFi;t) is on average similar
in the full sample and in the subsample of private funds. When pension funds invest in
hedge funds, the average allocation is 4.57% in the full sample and 4.33% in the subsample
of private funds.
The size of investors is frequently informative for an understanding of investment policies.
The average of total assets for the pension funds in the full sample is $10,878 million. Pension
funds investing in hedge funds are signi�cantly larger with an average of total assets of
$22,802 million. Therefore, a size e¤ect could have an e¤ect on the investments pension
funds make in hedge funds.
2.4 Costs and returns
Delegation costs for alternative assets under external and active management (DCAEAi;t ) are
particularly high. On average, these delegation costs are 1.77% in the full sample and 1.84%
for pension funds investing in hedge funds. Delegation costs for equity (DCEi;t), the main
asset of pension funds, are around 0.30%. Pension funds therefore face delegation costs
5 or 6 times higher when they decide to invest in alternative assets under external and
active management rather than in equity. In addition, the standard deviation of the variable
DCAEAi;t is high, suggesting that pension funds do not face similar conditions when investing
in alternative assets.
These prohibitive costs can be explained by several factors. Most hedge funds strategies
use high trading volume with a great deal of operational support and incur important re-
search (front o¢ ce) costs. Moreover, hedge funds are often small entities with few employees
(Cumming and Dai, 2007). They are typically called "boutiques". Hedge funds managers
are therefore more eager to concentrate their e¤orts on the front o¢ ce tasks (to bene�t from
opportunities) than administrative tasks. Hedge funds tend to delegate other operations
to specialized services providers (administration, IT, back o¢ ce, middle o¢ ce, compliance
10

services, legal services, etc.). These services do not require the particular expertise of hedge
funds managers. They are more the business of investment bankers. This increasing exter-
nalization of supporting services/activities has two consequences: an increase in the costs
of delegation management and more di¢ cult monitoring resulting from a lengthening of the
investment channel with more numerous intermediates (see KPMG (2008) for a survey of
hedge fund cost structures).
Table 3 shows that the average return from hedge fund investments (RHFi;t ) is 2.41%.
However, the average value results from volatile returns; the standard deviation is very high.
For example, the average return reached 12.73% in 2003 and fell to -16.25% in 2008.
3 Characteristics of pension funds allocating in hedge
funds
The characteristics of the pension funds investing in hedge funds are identi�ed with a Tobit
model. Numerous pension funds do not invest in hedge funds and the Tobit model allows
us to account for the censoring of the data. We consider the di¤erent variables stated in the
previous section as explanatory variables.
3.1 Empirical framework
We consider the following empirical speci�cation15:
HFi;t =
8<: HF �i;t if HF�i;t > 0
0 otherwise(1)
with:
HF �i;t = �i + j;t +X0i;t� + "i;t; (2)
where �i � N(0; �2�) is a time-invariant individual random e¤ect, j;t is a country-and-time
�xed e¤ect, Xi;t is the regressor vector (including an intercept), � is a vector of unknown
15The subscript i indexes pension funds, t indexes years and j indexes countries (Canada or the US). Forsimplicity, the subscript j is used only for the country-and-time �xed e¤ect.
11

parameters and "i;t � N(0; �2") is a time-varying idiosyncratic random error. The regressor
vector is given by: X0i;t = [PRIVi;t�1 REALi;t�1 FORi;t RNDi;t SFi EAi;t�1 DIVi;t
TY Pi SIZEi;t�1 DCAEAi;t RHFi;t�1 C] where C is the intercept and TY Pi is a dummy variable
that takes the value 1 if the pension fund is publicly owned and 0 otherwise. Variables
PRIVi;t�1; REALi;t�1; EAi;t�1 and SIZEi;t�1 are included with a lag to avoid simultaneity
and endogeneity problems. Furthermore, we compute the variance in�ation factors (VIF) to
assess whether there is a collinearity problem between the regressors. The average VIF is
1.30 and the maximum is 1.78, which suggests that the regressors are independent.
The model is �rst estimated with the random-e¤ects maximum likelihood estimator
(MLE).16 This estimator assumes that random e¤ects are independent of the regressors.
This assumption is relaxed with the Mundlak (1978) correction, which supposes that unob-
served heterogeneity is a function of the means of the regressors. In a second speci�cation
including the Mundlak (1978) correction, random e¤ects are de�ned as:
�i = �X0i� + !i; (3)
where � is a vector of unknown parameters and !i � N(0; �2!) is a time-invariant individual
random e¤ect: Equation (3) allows us to tackle the correlation between unobserved e¤ects
and the regressors in the Tobit framework.
The estimated coe¢ cients measure the marginal e¤ect of the independent variable on
the latent variable (HF �i;t). We also report the marginal e¤ects for the expected value of the
dependent variable conditional on it being uncensored. Considering the marginal e¤ects of
the regressors on the observed variable (HFi;t) allows for a quantitative interpretation of the
results.
3.2 Results
Results are displayed in Table (4). Speci�cation (1:a) corresponds to the estimations of
Equation (2) with the random-e¤ects MLE. In speci�cation (1:b), the Mundlak (1978) cor-
rection is included. Including the Mundlak correction does not modify the conclusions.
16In short panels, the �xed e¤ects MLE is inconsistent (see Cameron and Trivedi (2005)).
12

First, allocations to private equity and real assets do not a¤ect the allocation to hedge
funds in the same way. The results show a positive and signi�cant relationship between
private equity (PRIVi;t�1) and hedge fund allocations, while real assets (REALi;t�1) do
not have a signi�cant e¤ect. More precisely, the estimated marginal e¤ects in Table (4)
from speci�cation (1:b) show that a 1% increase in the private equity allocation leads to a
0.059% increase in the hedge fund allocation. This result highlights the fact that private
equity and hedge funds have similarities. More and more hedge funds are turning to a spe-
ci�c investment style: event driven, which is a strategy very similar to that used in private
equity. Indeed, event driven strategies involve long or short term investments in the securi-
ties of corporations undergoing signi�cant change (e.g., spin-o¤s, mergers, liquidations and
bankruptcies). Such changes often provide managers with a tangible catalyst by which the
manager may be able to perceive the expected change in value in the underlying security.
Substantial pro�ts may be generated by managers who correctly analyze the impact of the
anticipated corporate event, predict the course of restructuring and take positions accord-
ingly. In 2010, the event driven strategy was that used the most frequently by hedge fund
managers (HFR, 2010). The di¤erence between hedge funds and private equity is becoming
increasingly blurred. Consequently, hedge funds and private equity occupy a particular place
in the class of alternatives. They are considered to be more risky strategies than real assets
are. Pension funds that invest in real assets are less interested in superior returns than in
protection against in�ation because pension bene�ts are in real terms (Alestalo and Putto-
nen, 2005). Real assets tend to be placed among the traditional asset classes. According
to the de�nition used by CEM Benchmarking, real assets are included in real estate and
infrastructure. These assets incorporate bond and stock characteristics because of rent and
right of use, respectively, and by the variation in asset value.
Second, concerning sophistication indicators, we �nd a positive and signi�cant e¤ect for
the variable FORi;t (related to home bias) and SFi (related to performance in the core
component), while the use of attractive numbers in the policy weights (the variable RNDi;t)
does not have a signi�cant impact at the 10% level. As a result, sophisticated pension funds
characterized by a lower home bias and better performance in traditional assets invest more
in hedge funds. More precisely, the estimated marginal e¤ects for speci�cation (1:b) show
13

that a 1% increase in the proportion of foreign equities in the equity portfolio leads to a
0.010% increase in hedge fund allocations. Smart pension funds, identi�ed by the variable
SFi, invest 0.488% more in hedge funds. Additionally, contrary to what one might expect
from the descriptive statistics, unsophisticated pension funds that round their policy weights
are not signi�cantly less involved in hedge funds. De Dreu and Bikker (2009), who investigate
strategic bond allocations (i.e., in unsophisticated assets) for Dutch pension funds, �nd that
this indicator is relevant to explanations of the behavior of pension funds.
Third, several variables related to the portfolio management signi�cantly a¤ect alloca-
tion to hedge funds. Pension funds that are more involved in external and active delegation
(EAi;t�1) and more diversi�ed (DIVi;t) invest signi�cantly more in hedge funds. For exam-
ple, the estimated marginal e¤ects for speci�cation (1:b) show that a 1% increase in the
proportion of assets under an external and active delegation leads to a 0.016% increase in
hedge fund allocations. The positive e¤ect of variable EAi;t�1 might result from the adoption
of core-satellite management by pension funds beginning in 2000 and a particular interest
in hedge funds in the satellite component. Furthermore, we �nd a size e¤ect. The variable
SIZEi;t�1 has a positive and signi�cant e¤ect. The estimated marginal e¤ects for speci�ca-
tion (1:b) show that hedge fund allocations increase by 0.342% when the log of total assets
increases by 1. This result con�rms that management delegation in alternative assets implies
a long and costly process of selecting hedge funds or a style of hedge funds. Large pension
funds are therefore in a better position to invest in hedge funds (Rigot and Tadjeddine, 2010).
Finally, concerning ownership, the coe¢ cient of variable TY Pi is not signi�cant at the 10%
level. The �exible prudent man rule is more and more frequently applied by public pension
funds, even though some restrictive quantitative rules remain. This trend could explain why
we do not �nd di¤erences between the regulatory frameworks for public and private pension
funds.
Lastly, the descriptive statistics showed that delegation costs for alternative assets under
external and active management (DCAEAi;t ) are particularly high on average. We �nd that this
variable has a negative and signi�cant coe¢ cient. This result suggests that costs matter for
allocations to hedge funds. Conversely, past performance does not seem relevant. The lagged
return from hedge fund investments (RHFi;t�1) does not have a signi�cant e¤ect. The estimated
14

marginal e¤ects in speci�cation (1:b) show that a 1% increase in variable DCAEAi;t leads to
0.105% decrease in hedge fund allocations. Pension funds with lower management costs invest
more in hedge funds. We can presume that some pension funds are more able to negotiate
these costs for alternative assets.17 Indeed, focusing on hedge funds, the contract between
hedge fund managers and their investors is speci�c (concerning for example information
disclosures, liquidity conditions and performance fees). There is no standardized contract
because hedge funds are not regulated like the other mutual funds. In the name of the
importance of contractual freedom, contractual terms are mainly de�ned by co-contractors.
Consequently, the degree of transparency, liquidity and the terms of performance are the
result of the balance of power between hedge fund managers and pension fund administrators.
In this contractual framework, some pension funds can demand more relevant and detailed
information and negotiate contractual terms related to fees. For example, large pension
funds naturally have a greater bargaining power (Rigot and Tadjeddine, 2010). However,
the subprime crisis has revealed that this balance of power was rather in the hedge funds�
favor. Indeed, until the crisis, pension funds tended to trust their hedge fund managers (e.g.,
they did not negotiate contractual terms or require the disclosure of information disclosures)
as long as the hedge fund�s performance was high and decorrelated. This passive behavior
prevents pension funds from making a good risk evaluation, and may be prejudicial because
pension funds are institutional investors that collect savings from employees (�nal investors)
to pay long term retirement bene�ts. The large losses registered by pension funds in their
hedge fund allocations in 2008 have induced mistrust and have incited pension funds to
negotiate lower fees, shorter lockup periods and more informational disclosures as well as
the use of independent service providers to monitor returns (Shabad, 2009).
In conclusion, the typical pension fund that invests in hedge funds is a large private
sophisticated pension fund that diversi�es its portfolio across numerous classes (in private
equity in particular), uses core-satellite organization and has access to low delegation costs
for alternative assets. Now that we have identi�ed the characteristics of the pension funds
allocating to hedge funds, we can consider the potential bene�ts of this allocation.
17Bikker and De Dreu (2009) �nd that economies of scale exist for largest pension funds with regard toinvestment costs.
15
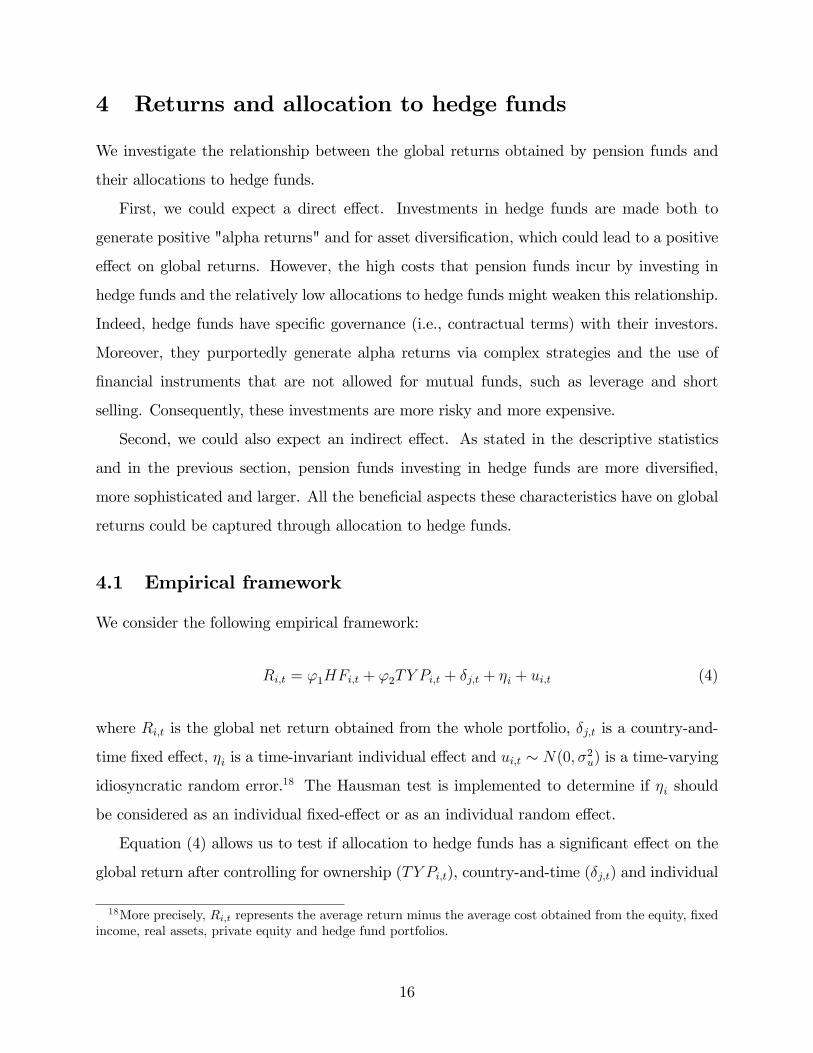
4 Returns and allocation to hedge funds
We investigate the relationship between the global returns obtained by pension funds and
their allocations to hedge funds.
First, we could expect a direct e¤ect. Investments in hedge funds are made both to
generate positive "alpha returns" and for asset diversi�cation, which could lead to a positive
e¤ect on global returns. However, the high costs that pension funds incur by investing in
hedge funds and the relatively low allocations to hedge funds might weaken this relationship.
Indeed, hedge funds have speci�c governance (i.e., contractual terms) with their investors.
Moreover, they purportedly generate alpha returns via complex strategies and the use of
�nancial instruments that are not allowed for mutual funds, such as leverage and short
selling. Consequently, these investments are more risky and more expensive.
Second, we could also expect an indirect e¤ect. As stated in the descriptive statistics
and in the previous section, pension funds investing in hedge funds are more diversi�ed,
more sophisticated and larger. All the bene�cial aspects these characteristics have on global
returns could be captured through allocation to hedge funds.
4.1 Empirical framework
We consider the following empirical framework:
Ri;t = '1HFi;t + '2TY Pi;t + �j;t + �i + ui;t (4)
where Ri;t is the global net return obtained from the whole portfolio, �j;t is a country-and-
time �xed e¤ect, �i is a time-invariant individual e¤ect and ui;t � N(0; �2u) is a time-varying
idiosyncratic random error.18 The Hausman test is implemented to determine if �i should
be considered as an individual �xed-e¤ect or as an individual random e¤ect.
Equation (4) allows us to test if allocation to hedge funds has a signi�cant e¤ect on the
global return after controlling for ownership (TY Pi;t), country-and-time (�j;t) and individual
18More precisely, Ri;t represents the average return minus the average cost obtained from the equity, �xedincome, real assets, private equity and hedge fund portfolios.
16

(�i) e¤ects. Alternatively, Equation (4) is estimated with the variable hfi;t �a dummy
variable that takes the value 1 if the pension fund invests in hedge funds and 0 otherwise�
instead of HFi;t: Bene�cial aspects on global returns could be related to the decision to invest
in hedge funds rather than the proportion allocated to hedge funds. Therefore, considering
hfi;t instead of HFi;t allows us to identify if the e¤ect of hedge funds on global returns is
direct (i.e., related to the proportion allocated) or indirect (i.e., related to the decision to
allocate).
The distinction between the direct and indirect e¤ects is also assessed with a modi�cation
of the endogenous variable in Equation (4). We de�ne R0i;t as the net return obtained from
the sub-portfolio excluding allocations to hedge funds. As a result, considering variable R0i;t
instead of Ri;t in Equation (4) removes the potential direct e¤ect of the allocation to hedge
funds that one might expect. A positive relationship between HFi;t (or hfi;t) and R0i;t could
only be explained by an indirect e¤ect.
Finally, we consider the net return in the core component (Rci;t) as an endogenous variable
to investigate whether pension funds investing in hedge funds outperform other pension
funds, even in the core component. Indeed, the ability of pension funds investing in hedge
funds to make smart choices in selecting funds also concerns investments in traditional assets.
4.2 Results
Table (5) displays the results obtained with the random e¤ect estimator. The Hausman test
indicates that this estimator is consistent. Furthermore, controlling for ownership, country-
and-time and individual e¤ects explain the relatively high R2 value:
Speci�cation (2:a) in Table (5) shows that allocation to hedge funds (HFi;t) has a pos-
itive and signi�cant e¤ect on global returns (Ri;t). The estimated coe¢ cient is 0.1494. In
speci�cation (2:b) the variable hfi;t is used instead of HFi;t identify whether the e¤ect is
direct or indirect: We also obtain a positive and signi�cant coe¢ cient. Global returns are,
on average, higher for pension funds investing in hedge funds. More precisely, global returns
increase by 1.1377%. The bene�cial aspects of hedge funds therefore seem to be related to
the decision to invest in hedge funds and not especially to the proportion of the allocation.
In speci�cations (2:c) and (2:d), variable R0i;t is used as endogenous variable to con-
17

�rm the importance of the indirect e¤ect. The proportion invested in hedge funds and the
decision to invest in hedge funds both have a positive and signi�cant e¤ect on the net re-
turns obtained from the sub-portfolio excluding allocations to hedge funds. In particular,
net returns in the sub-portfolio (R0i;t) is 1.1894% higher for pension funds investing in hedge
funds. Consequently, our results are primarily driven by an indirect e¤ect. Pension funds
investing in hedge funds combine several characteristics that improve their returns. This
e¤ect illustrates a positive aspect resulting from core-satellite organization and from the
sophistication of pension funds. However, the bene�t could be higher if pension funds were
to adopt stronger governance concerning hedge fund delegation. For example, large pension
funds should use their bargaining power to require more disclosures to better evaluate hedge
funds risks and lower performance fees. This is already the case for the biggest US DB public
pension fund (CalPERS), which announced in 2009 that it would only enter partnerships
with hedge funds under these renegotiated conditions.
Finally, in speci�cations (2:e) and (2:f), variable Rci;t is the endogenous variable. The
proportions invested in hedge funds (HFi;t) do not signi�cantly a¤ect net returns of the
core component (Rci;t). However, we �nd a positive and signi�cant relationship between the
decision to invest in hedge funds (hfi;t) and Rci;t. Returns in the core component increase by
1.0067% for pension funds investing in hedge funds. The incentives and skills that lead some
pension funds to invest in hedge funds therefore also have positive e¤ects on the pension
funds� abilities to outperform in traditional assets. The sophistication of pension funds
does not only matter for the selection of funds specializing in alternative assets but for the
construction of the core component portfolio as well.
5 Conclusion
Institutional investors have had an increasing interest in hedge funds since the beginning
of the 2000�s due to their promises of high and decorrelated returns. In this paper, we
investigate the characteristics of pension funds allocating to hedge funds, and we question
the potential bene�ts of these speci�c alternative investments. We �nd evidence that the
typical pension fund investing in hedge funds is a large, sophisticated pension fund that
18

diversi�es its portfolio across numerous classes (in private equity in particular), uses core-
satellite organization and has access to low delegation costs for alternative assets. Moreover,
our results emphasize the bene�cial aspect of investments in hedge funds in terms of returns.
This positive e¤ect is more due to the decision to invest in hedge funds than to the size of
the allocation or the return on the hedge fund investments. Consequently, this bene�cial
aspect is mainly driven by an indirect e¤ect. Pension funds investing in hedge funds combine
several characteristics that positively a¤ect their returns such as improved diversi�cation.
Recent �nancial disturbances have shown, however, that hedge funds are not unsinkable.
Losses in hedge fund allocations were higher than those allocated to private equity and real
assets.19 Speci�c agency problems in hedge fund delegation and a certain passivity in the
behavior of pension funds could explain this lower performance. Bene�ts could therefore
be higher if pension funds were to adopt stronger monitoring concerning their delegation to
hedge funds. Private misallocations induced by such informational asymmetries may have
detrimental consequences in the case of pension funds because the retirement bene�ts of
millions of employees are at stake (the consequences include increased contributions and/or
decreased bene�ts).
These issues relating to the lack of transparency in the hedge fund industry were so
prominent in the 2007-2009 crisis that regulatory authorities decided to change hedge fund
regulations. They recognized that the opacity of hedge funds may lead to predictable dam-
ages: misallocations at the micro level and increasing �nancial instability and systemic risk
at the macro level. For the �rst time since the beginning of the hedge fund industry in the
1950�s, draft hedge fund draft regulations were promulgated in the European Union (EU)
and the US. The �rst is speci�c to hedge funds, while the second is a part of comprehensive
US �nancial reform.20 In spite of di¤erences in hedge fund regulations between the US and
the EU (Rigot and Tadjeddine, 2010), a modi�cation in investors�behavior towards hedge
fund managers is all the more crucial, as pension funds continue to allocate to hedge funds.
19In 2008, the returns on private equity and real asset allocations were between -5% and 10%.20Directive of the European Parliament and Council on Alternative Investment Fund Managers; (AIFM)
Second Proposal with amendments �November 2009 (Gauzes report); Directive of the European Parliamentand Council on Alternative Investment Fund Managers (AIFM) Final Proposal �May 2010;US Treasury �nancial regulation reform, Geithner Plan (June, 2009); Financial reform, a framework for
�nancial stability, Volcker plan (January 2010); US Financial reform bill, (July 2010)
19

References
Ackermann, C., MacEnally, R. and Ravenscraft, D. (1999). The Performance of Hedge Funds:
Risk, Return, and Incentives. Journal of Finance 54(3), 833-874.
Agarwal, V. and Naik, N. (2000a). Generalised Style Analysis of Hedge Funds. Journal of
Asset Management 1(1), 93-109.
Agarwal, V. and Naik, N. (2000b). On Taking the Alternatives Routes, Risk Rewards, Per-
formance Persistence of Hedge Funds. Journal of Alternative Investments 2(4), 6-23.
Agarwal, V. and Naik, N. (2004). Risks and Portfolio Decisions involving Hedge Funds.
Review of Financial Studies 17(1), 63-98.
Aglietta, M. and Rigot, S. (2009). Crise et rénovation de la �nance. Paris: éditions Odile
Jacob.
Alestalo, N. and Puttonen, V. (2006). Asset Allocation in Finnish Pension Funds. Journal
of Pension Economics and Finance 5(1), 27-44.
Amenc, N., Curtis, S. and Martellini, L. (2003). The Alpha and Omega of Hedge Fund
Performance Measurement. EDHEC, Working Paper.
Amin, G. and Kat, H. (2002). Stocks, Bonds and Hedge Funds: Not a Free Lunch! University
of Reading, ISMA Discussion Papers in Finance 2002-11.
Bauer, R., Cremers, M. and Frehen R. (2010). Pension Fund Performance and Costs: Small
is Beautiful. MPRA Paper No. 23556.
Bikker, J and De Dreu, J. (2009). Operating costs of pension funds: the impact of scale,
governance, and plan design. Journal of Pension Economics and Finance 8(1), 63-89.
Brown, S., Goetzmann, W. and Ibbotson, R. (1999). O¤shore Hedge Funds: Survival and
Performance 1989-1995. Journal of Business 72(1), 91-117.
Cameron, C. and Trivedi, P. (2005). Microeconometrics: Methods And Applications. New
York: Cambridge University Press.
20

Cumming, D. and Dai, N. (2007). A Law and Finance Analysis of Hedge Funds. Financial
Management 39(3), 997-1026.
Davis, E. and Hu, Y. (2009). Should Pension Investing be Regulated? Rotman International
Journal of Pension Management 2(1), 34-42.
De Dreu, J.and Bikker, J. (2009). Pension Fund Sophistication and Investment Policy. DNB,
Working Paper 211.
Favre, L. (2006). The Bene�ts of Hedge Funds: 2006 Update. Center for International Secu-
rities and Derivatives Markets, Working Paper.
French, K. (2008). Presidential address: The Cost of Active Investing. The Journal of Fi-
nance 63(4), 1537-1573.
Fung, W. and Hsieh, D. (2000). Performance Characteristics of Hedge Funds and CTA
Funds: Natural versus Spurious Bias. Journal of Financial and Quantitative Analysis 35(3),
291-307.
Fung, W. and Hsieh, D. (2002). Benchmarks of Hedge Fund Performance: Information
Content and Measurement Biases. Journal of Alternative Investments 58(1), 22-34.
Khanniche, S. (2008). Mesurer le risque des hedge funds. Groupama-Asset Management,
Working Paper.
KPMG LLP. (2008). Hedge Fund Cost Survey. Financial Advisory Services, September 2008.
Mundlak, Y. (1978). On the Pooling of Time Series and Cross-Section Data. Econometrica
46(1), 69-85.
OECD (2007). Pension Markets in Focus 4. OECD report, November 2007.
OECD (200). Pension Markets in Focus 5. OECD report, December 2008.
McKinsey & Compagny. (2007). The New Power Brokers: How Oil, Asia, Hedge Funds and
Private Equity are Shaping Global Capital Markets. McKinsey Global Institute.
21
Preqin Ltd. (2008). Overview of the Global Hedge Fund Institutional Investor Universe:
Special Report, November 2008.
Preqin, Ltd. (2010) Preqin Alternatives Investment Consultant Review.
Rigot, S. and Tadjeddine, Y. (2010). Emergence of a New Regulation: Informational Disclo-
sure Modalities in The Hedge Fund Opacity World. International Economics 123, 159-194.
Schneeweis, T. and Martin, G. (2001). The Bene�ts of Hedge Funds: Asset Allocation for
the Instutitional Investor. Journal of Alternative Investments 4(3), 7-26.
Shadab, H. (2009). The Law and Economics of Hedge Funds: Financial Innovation and
Investor Protection. Berkeley Business Law Journal 6(1), 240-297.
Sharpe, W. and Tint, L. (1990). Liabilities: a New Approach. Journal of Portfolio Manage-
ment 16(2), 5-10.
U.S. Government Accountability O¢ ce (GAO) (2008). Hedge Funds Regulators and Market
Participants are Taking Steps to Strengthen Market Discipline but Continued Attention is
Needed. Report to Congressional Requesters, GAO-08-200, January 2008.
22

Figure 1: Percent distribution of HFi;t for the subsample of pension funds investing in hedgefunds
05
1015
20Pe
rcen
t
0 10 20 30 40Allocation in Hedge Funds
Source: CEM benchmarking database
Figure 2: Percent distribution of the equity policy weight for the full sample
05
1015
Per
cent
0 20 40 60 80 100Equity Policy weight
Source: CEM benchmarking database
23

Table 1: Average portfolio allocation (2000-2008)
(% total assets)Equity
FixedIncome
RealAssets
PrivateEquity
HedgeFunds
Other
Full sample (1976 observations)Mean 59.19 31.53 4.01 2.43 0.61 2.19Standard Deviation 9.91 8.93 4.24 3.68 2.56 3.96Min / Max 0/96.63 0/89.95 0/26.11 0/22.76 0/36.69 0/39.82
Subsample of pension funds investing in hedge funds (267 observations)Mean 52.52 28.81 6.16 4.98 4.57 2.92Standard Deviation 12.38 10.09 5.05 4.14 5.55 3.98Min / Max 0/74.00 10.40/84.15 0/26.11 0/18.46 0.01/36.69 0/19.58
Note: Category Other merges allocations in cash and TAA.
Source: CEM benchmarking database.
Table 2: Breakdown of pension funds by year
2000 2001 2002 2003 2004 2005 2006 2007 2008No. of Pension Funds 221 228 215 210 223 207 206 230 236
% investing in hedge funds 1.35 3.94 6.97 9.52 11.65 15.94 21.35 24.78 25.42Average allocation 5.01 5.60 4.41 2.19 3.13 4.77 4.52 4.89 5.47
% investing in real assets 69.68 65.78 65.58 67.61 72.74 72.46 72.81 74.78 78.81Average allocation 4.00 5.06 5.46 5.24 4.84 5.25 6.01 6.63 7.70
% investing in private equity 51.13 50.00 50.23 52.85 52.91 55.07 56.79 61.73 63.98Average allocation 4.07 4.52 4.13 4.23 3.94 3.71 3.74 4.71 6.13
Note: Average allocation is expressed in % of total assets.
Source: CEM benchmarking database.
24

Table 3: General descriptive statistics : mean and standard deviation
Full sample Subsample of private fundsAllfunds
Funds withHFi;t > 0
Allfunds
Funds withHFi;t > 0
HFi;t 0.61(2.56)
4.57(5.55)
0.61(2.16)
4.33(4.13)
PWi;t 1.03(3.24)
4.62(6.01)
1.27(3.84)
5.76(6.94)
PRIVi;t 2.43(3.68)
4.98(4.14)
2.28(3.55)
5.16(4.40)
REALi;t 4.01(4.24)
6.16(5.05)
3.06(3.77)
5.07(4.46)
ALTi;t 6.45(6.48)
11.15(7.21)
5.34(5.91)
10.24(6.91)
FORi;t 37.64(15.77)
43.44(17.12)
38.42(16.11)
40.04(13.12)
EAi;t 69.35(26.75)
70.77(29.39)
73.39(26.11)
80.08(23.46)
DIVi;t 0.23(0.08)
0.17(0.06)
0.24(0.08)
0.19(0.07)
TAi;t 10878(23162)
22802(38083)
5495(10829)
14620(21206)
DCAEAi;t 1.77(2.03)
1.84(1.19)
1.70(1.63)
1.71(1.31)
DCEi;t 0.30(0.15)
0.33(0.20)
0.33(0.14)
0.36(0.15)
RHFi;t 2.41(13.91)
2.94(13.97)
No. funds 407 86 259 48Obs. 1976 267 1072 152
Note: Standard deviations are in brackets. Descriptive statistics for variable
DCAEAi;t are computed for pension funds which invest in alternative assets under
external and active management.
Source: CEM benchmarking database.
25

Table 4: Allocation to hedge funds: estimated coe¢ cients and marginal e¤ects (M.E.)
Endogenous variable : HFi;t(1:a) (1:b)
Coe¤ M.E Coe¤ M.E
PRIVi;t�1 0:418(0:158)
a 0:066(0:024)
a 0:398(0:124)
a 0:059(0:018)
a
REALi;t�1 -0:101(0:133)
-0:016(0:021)
-0:125(0:080)
-0:018(0:011)
FORi;t 0:084(0:037)
b 0:013(0:005)
b 0:066(0:025)
a 0:010(0:003)
a
RNDi;t -0:370(0:626)
-0:058(0:098)
0:111(0:539)
0:016(0:080)
SFi 2:845(0:583)
a 0:447(0:091)
a 3:317(1:346)
b 0:488(0:198)
b
EAi;t�1 0:067(0:021)
a 0:010(0:003)
a 0:112(0:028)
a 0:016(0:004)
a
DIVi;t -18:062(4:953)
a -2:876(0:787)
a -15:415(4:883)
a -2:306(0:732)
a
SIZEi;t�1 1:701(0:367)
a 0:270(0:058)
a 2:287(1:387)
c 0:342(0:208)
c
TY Pi -0:253(0:710)
-0:040(0:111)
-1:232(1:159)
-0:183(0:171)
DCAEAi;t -0:582(0::325)
c -0:092(0:051)
c -0:706(0:222)
a -0:105(0:033)
a
RHFi;t�1 0:037(0:325)
0:005(0:004)
0:038(0:029)
0:005(0:004)
Country-and-time e¤ect Yes Yes Yes YesMundlak�s correction Yes YesObs. 1976 1976 1976 1976Uncensored 267 267 267 267Log likelihood -979 -979 -964 -964�2 statistic[p�value]
202[0:00]
202[0:00]
444[0:00]
444[0:00]
Pseudo R2 0.175 0.175 0.187 0.187LR test[p�value]
573[0:00]
573[0:00]
555[0:00]
555[0:00]
Note: a, b and c indicate signi�cance respectively at the 1%, 5% and 10% levels. Stan-dard deviations are in brackets. Standard deviations reported in the table correspond
to the bootstraped standard deviations.
26

Table 5: Returns and allocation to hedge funds
Speci�cationEndogenousvariable
HFi;t hfi;t Hausman test[p�value]
R2 Obs.
(2:a) Ri;t0.1079c
(0.0620)21.34[0.26]
0.93 1976
(2:b) Ri;t1.1377a
(0.3391)21.33[0.26]
0.93 1976
(2:c) R0i;t0.1176c
(0.0671)20.95[0.28]
0.93 1976
(2:d) R0i;t1.1894a
(0.3461)21.15[0.27]
0.93 1976
(2:e) Rci;t0.1044(0.0776)
19.86[0.34]
0.93 1976
(2:f) Rci;t1.0067a
(0.3766)20.65[0.29]
0.93 1976
Note: a, b and c indicate signi�cance respectively at the 1%, 5% and 10% levels. Standard deviations
are in brackets. Standard deviations reported in the table correspond to the robust standard deviations.
All the estimates include ownership and country-and-time e¤ects.
27