Embed Size (px)
Citation preview
Harris County Hospital District Pension Plan
Independent Auditor's Report, Financial Statements and Required Supplementary Information
December 31, 2017 and 2016
Harris County Hospital District Pension Plan December 31, 2017 and 2016
Contents
Independent Auditor's Report ............................................................................................ 1
Management's Discussion and Analysis (Unaudited) ...................................................... 3
Financial Statements
Statements of Fiduciary Net Position .............................................................................................. 6
Statements of Changes in Fiduciary Net Position ........................................................................... 7
Notes to Financial Statements .......................................................................................................... 8
Required Supplementary Information (Unaudited)
Schedule of Changes in Net Pension Liability and Related Ratios ............................................... 22
Schedule of Investment Returns ................................................................................................... 23
Schedule of Employer Contributions ............................................................................................ 24
Notes to Required Supplementary Information ............................................................................ 25
Independent Auditor's Report
Board of Trustees, Pension and Disability
Committee and Plan Administrator
Harris County Hospital District,
d/b/a Harris Health System
Houston, Texas
We have audited the accompanying financial statements of Harris County Hospital District Pension Plan
(the Plan), which comprise the statement of fiduciary net position as of December 31, 2017, and the
related statement of changes in fiduciary net position for the year then ended, and the related notes to the
financial statements.
Management's Responsibility for the Financial Statements
Management is responsible for the preparation and fair presentation of these financial statements in
accordance with accounting principles generally accepted in the United States of America; this includes
the design, implementation and maintenance of internal control relevant to the preparation and fair
presentation of financial statements that are free from material misstatement, whether due to fraud or
error.
Auditor's Responsibility
Our responsibility is to express an opinion on these financial statements based on our audit. We
conducted our audit in accordance with auditing standards generally accepted in the United States of
America. Those standards require that we plan and perform the audit to obtain reasonable assurance
about whether the financial statements are free from material misstatement.
An audit involves performing procedures to obtain audit evidence about the amounts and disclosures in
the financial statements. The procedures selected depend on the auditor's judgment, including the
assessment of the risks of material misstatement of the financial statements, whether due to fraud or error.
In making those risk assessments, the auditor considers internal control relevant to the entity's preparation
and fair presentation of the financial statements in order to design audit procedures that are appropriate in
the circumstances, but not for the purpose of expressing an opinion on the effectiveness of the entity's
internal control. Accordingly, we express no such opinion. An audit also includes evaluating the
appropriateness of accounting policies used and the reasonableness of significant accounting estimates
made by management, as well as evaluating the overall presentation of the financial statements.
Board of Trustees, Pension and Disability
Committee and Plan Administrator
Harris County Hospital District,
d/b/a Harris Health System
Page 2
We believe that the audit evidence we have obtained is sufficient and appropriate to provide a basis for
our audit opinion.
Opinion
In our opinion, the 2017 financial statements referred to above present fairly, in all material respects, the
fiduciary net position of the Plan as of December 31, 2017, and the changes in fiduciary net position for
the year then ended in accordance with accounting principles generally accepted in the United States of
America.
Other Matters
Prior Year Audited by Other Auditors
The 2016 financial statements were audited by other auditors whose unmodified report on those
statements thereon, dated June 29, 2017, included an emphasis paragraph that described the adoption of
Governmental Accounting Standards Board (GASB) Statement No. 72, Fair Value Measurement and
Application.
Required Supplementary Information
Accounting principles generally accepted in the United States of America require that the management's
discussion and analysis and pension information as listed in the table of contents be presented to
supplement the basic financial statements. Such information, although not a part of the basic financial
statements, is required by GASB, who considers it to be an essential part of financial reporting for placing
the basic financial statements in an appropriate operational, economic or historical context. We have
applied certain limited procedures to the 2017 required supplementary information in accordance with
auditing standards generally accepted in the United States of America, which consisted of inquiries of
management about the methods of preparing the information and comparing the information for
consistency with management's responses to our inquiries, the basic financial statements and other
knowledge we obtained during our audit of the 2017 basic financial statements. We do not express an
opinion or provide any assurance on the information because the limited procedures do not provide us
with sufficient evidence to express an opinion or provide any assurance.
The other auditors did not express an opinion or provide any assurance on the 2016 required
supplementary information.
Houston, Texas
June 28, 2018
Harris County Hospital District Pension Plan Management's Discussion and Analysis (Unaudited)
December 31, 2017 and 2016
3
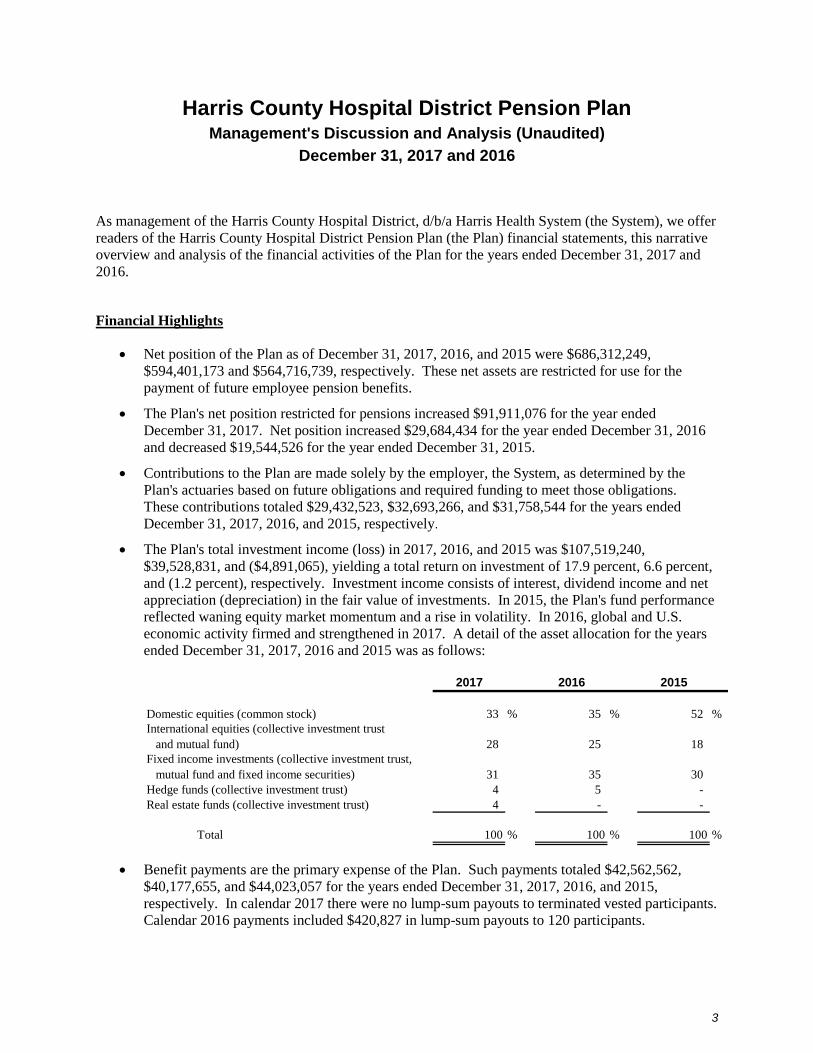
As management of the Harris County Hospital District, d/b/a Harris Health System (the System), we offer
readers of the Harris County Hospital District Pension Plan (the Plan) financial statements, this narrative
overview and analysis of the financial activities of the Plan for the years ended December 31, 2017 and
2016.
Financial Highlights
Net position of the Plan as of December 31, 2017, 2016, and 2015 were $686,312,249,
$594,401,173 and $564,716,739, respectively. These net assets are restricted for use for the
payment of future employee pension benefits.
The Plan's net position restricted for pensions increased $91,911,076 for the year ended
December 31, 2017. Net position increased $29,684,434 for the year ended December 31, 2016
and decreased $19,544,526 for the year ended December 31, 2015.
Contributions to the Plan are made solely by the employer, the System, as determined by the
Plan's actuaries based on future obligations and required funding to meet those obligations.
These contributions totaled $29,432,523, $32,693,266, and $31,758,544 for the years ended
December 31, 2017, 2016, and 2015, respectively.
The Plan's total investment income (loss) in 2017, 2016, and 2015 was $107,519,240,
$39,528,831, and ($4,891,065), yielding a total return on investment of 17.9 percent, 6.6 percent,
and (1.2 percent), respectively. Investment income consists of interest, dividend income and net
appreciation (depreciation) in the fair value of investments. In 2015, the Plan's fund performance
reflected waning equity market momentum and a rise in volatility. In 2016, global and U.S.
economic activity firmed and strengthened in 2017. A detail of the asset allocation for the years
ended December 31, 2017, 2016 and 2015 was as follows:
2017 2016 2015
Domestic equities (common stock) 33 % 35 % 52 %
International equities (collective investment trust
and mutual fund) 28 25 18
Fixed income investments (collective investment trust,
mutual fund and fixed income securities) 31 35 30
Hedge funds (collective investment trust) 4 5 -
Real estate funds (collective investment trust) 4 - -
Total 100 % 100 % 100 %
Benefit payments are the primary expense of the Plan. Such payments totaled $42,562,562,
$40,177,655, and $44,023,057 for the years ended December 31, 2017, 2016, and 2015,
respectively. In calendar 2017 there were no lump-sum payouts to terminated vested participants.
Calendar 2016 payments included $420,827 in lump-sum payouts to 120 participants.
4
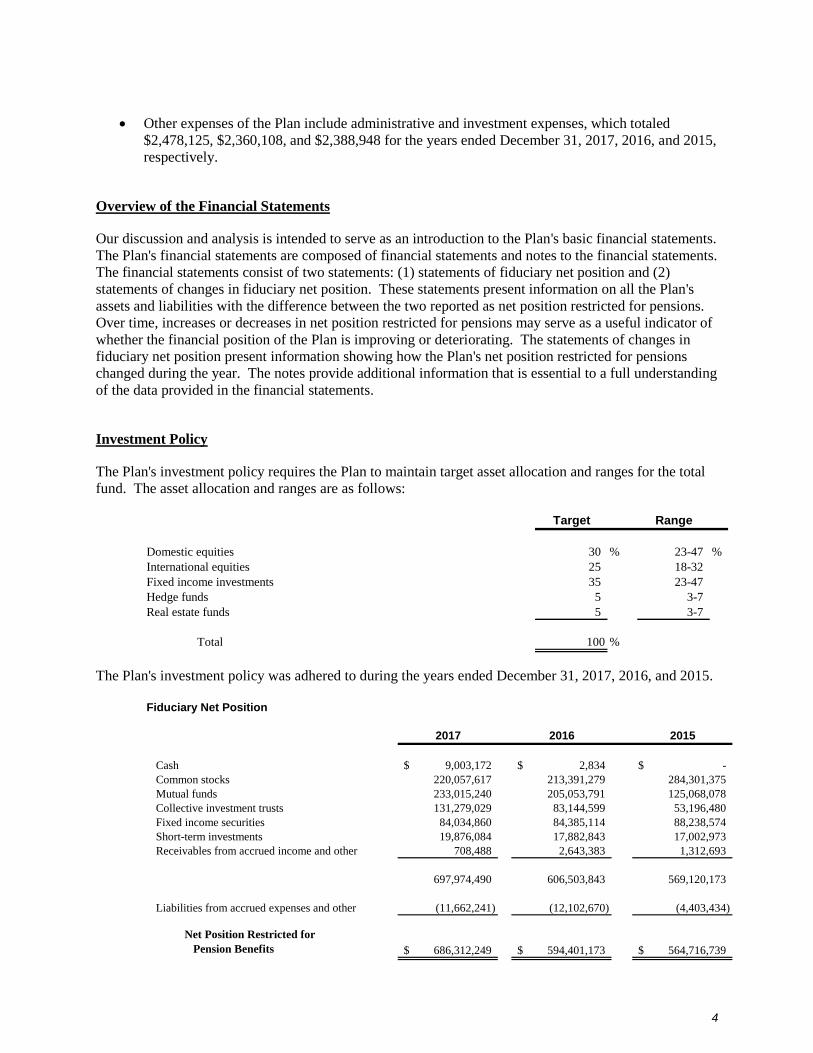
Other expenses of the Plan include administrative and investment expenses, which totaled
$2,478,125, $2,360,108, and $2,388,948 for the years ended December 31, 2017, 2016, and 2015,
respectively.
Overview of the Financial Statements
Our discussion and analysis is intended to serve as an introduction to the Plan's basic financial statements.
The Plan's financial statements are composed of financial statements and notes to the financial statements.
The financial statements consist of two statements: (1) statements of fiduciary net position and (2)
statements of changes in fiduciary net position. These statements present information on all the Plan's
assets and liabilities with the difference between the two reported as net position restricted for pensions.
Over time, increases or decreases in net position restricted for pensions may serve as a useful indicator of
whether the financial position of the Plan is improving or deteriorating. The statements of changes in
fiduciary net position present information showing how the Plan's net position restricted for pensions
changed during the year. The notes provide additional information that is essential to a full understanding
of the data provided in the financial statements.
Investment Policy
The Plan's investment policy requires the Plan to maintain target asset allocation and ranges for the total
fund. The asset allocation and ranges are as follows:
Target Range
Domestic equities 30 % 23-47 %
International equities 25 18-32
Fixed income investments 35 23-47
Hedge funds 5 3-7
Real estate funds 5 3-7
Total 100 %
The Plan's investment policy was adhered to during the years ended December 31, 2017, 2016, and 2015.
Fiduciary Net Position
2017 2016 2015
Cash 9,003,172$ 2,834$ -$
Common stocks 220,057,617 213,391,279 284,301,375
Mutual funds 233,015,240 205,053,791 125,068,078
Collective investment trusts 131,279,029 83,144,599 53,196,480
Fixed income securities 84,034,860 84,385,114 88,238,574
Short-term investments 19,876,084 17,882,843 17,002,973
Receivables from accrued income and other 708,488 2,643,383 1,312,693
697,974,490 606,503,843 569,120,173
Liabilities from accrued expenses and other (11,662,241) (12,102,670) (4,403,434)
Net Position Restricted for
Pension Benefits 686,312,249$ 594,401,173$ 564,716,739$
5
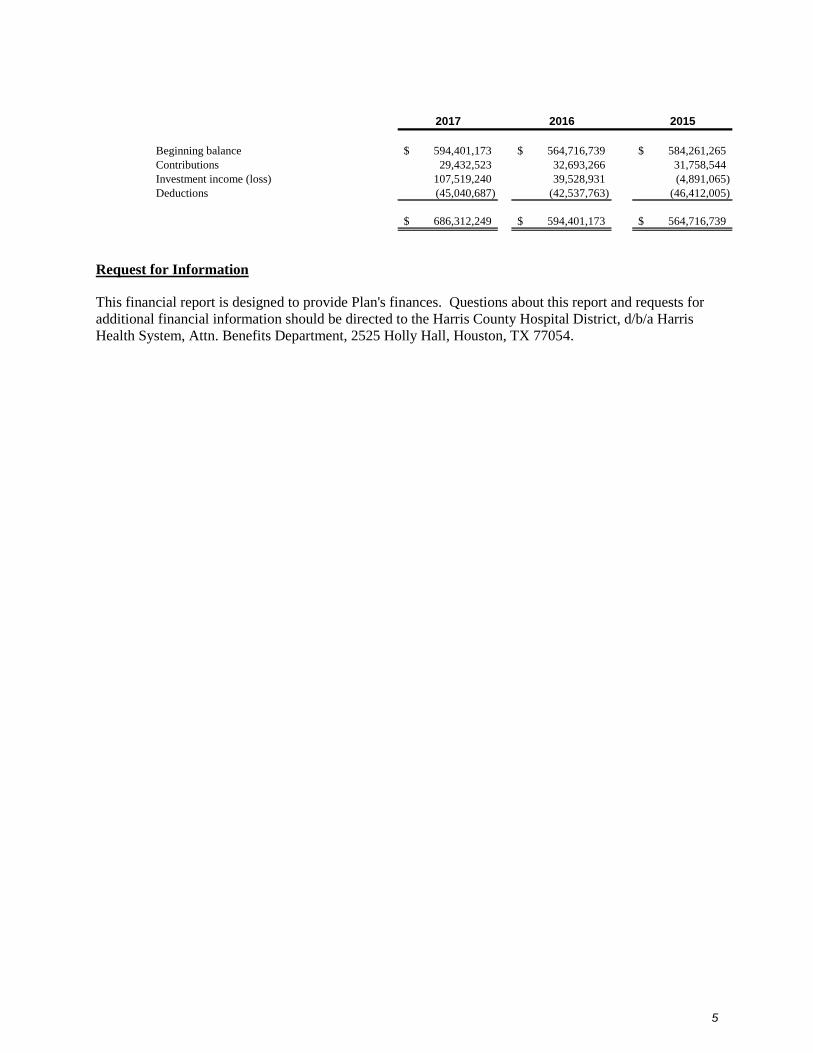
2017 2016 2015
Beginning balance 594,401,173$ 564,716,739$ 584,261,265$
Contributions 29,432,523 32,693,266 31,758,544
Investment income (loss) 107,519,240 39,528,931 (4,891,065)
Deductions (45,040,687) (42,537,763) (46,412,005)
686,312,249$ 594,401,173$ 564,716,739$
Request for Information
This financial report is designed to provide Plan's finances. Questions about this report and requests for
additional financial information should be directed to the Harris County Hospital District, d/b/a Harris
Health System, Attn. Benefits Department, 2525 Holly Hall, Houston, TX 77054.
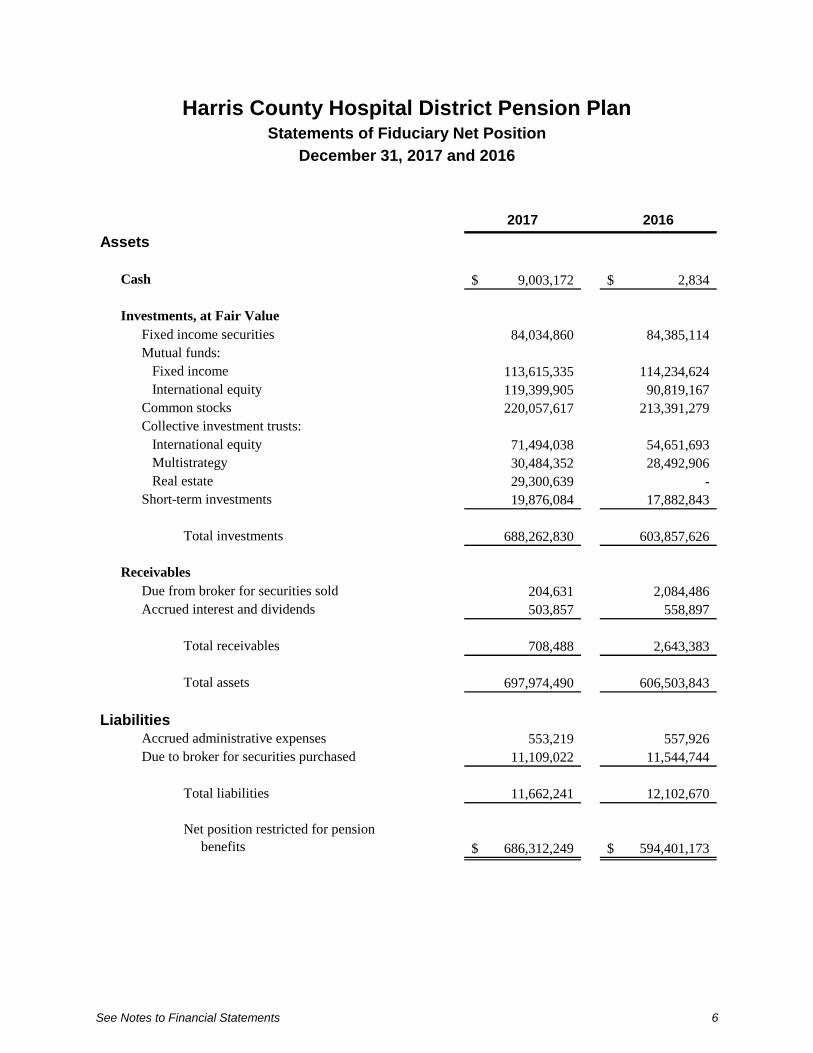
Harris County Hospital District Pension Plan Statements of Fiduciary Net Position
December 31, 2017 and 2016
See Notes to Financial Statements 6
2017 2016
Assets
Cash 9,003,172$ 2,834$
Investments, at Fair Value
Fixed income securities 84,034,860 84,385,114
Mutual funds:
Fixed income 113,615,335 114,234,624
International equity 119,399,905 90,819,167
Common stocks 220,057,617 213,391,279
Collective investment trusts:
International equity 71,494,038 54,651,693
Multistrategy 30,484,352 28,492,906
Real estate 29,300,639 -
Short-term investments 19,876,084 17,882,843
Total investments 688,262,830 603,857,626
Receivables
Due from broker for securities sold 204,631 2,084,486
Accrued interest and dividends 503,857 558,897
Total receivables 708,488 2,643,383
Total assets 697,974,490 606,503,843
LiabilitiesAccrued administrative expenses 553,219 557,926
Due to broker for securities purchased 11,109,022 11,544,744
Total liabilities 11,662,241 12,102,670
Net position restricted for pension
benefits 686,312,249$ 594,401,173$
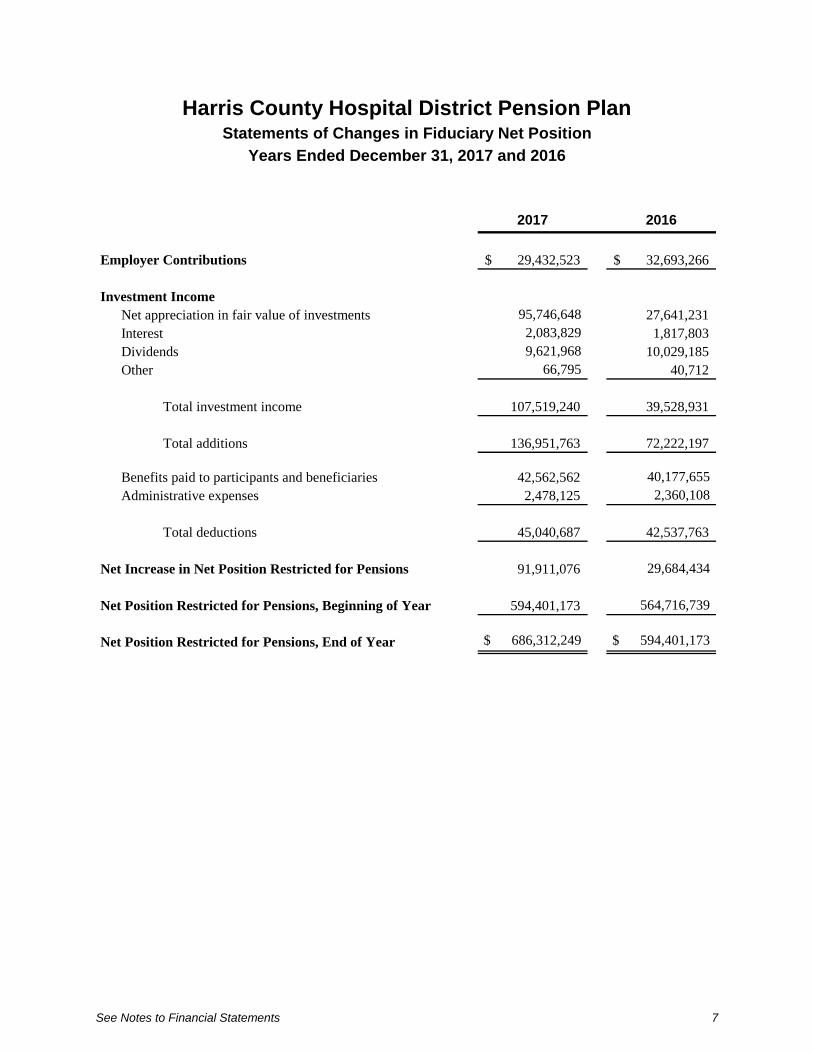
Harris County Hospital District Pension Plan Statements of Changes in Fiduciary Net Position
Years Ended December 31, 2017 and 2016
See Notes to Financial Statements 7
2017 2016
Employer Contributions 29,432,523$ 32,693,266$
Investment Income
Net appreciation in fair value of investments 95,746,648 27,641,231
Interest 2,083,829 1,817,803
Dividends 9,621,968 10,029,185
Other 66,795 40,712
Total investment income 107,519,240 39,528,931
Total additions 136,951,763 72,222,197
Benefits paid to participants and beneficiaries 42,562,562 40,177,655
Administrative expenses 2,478,125 2,360,108
Total deductions 45,040,687 42,537,763
Net Increase in Net Position Restricted for Pensions 91,911,076 29,684,434
Net Position Restricted for Pensions, Beginning of Year 594,401,173 564,716,739
Net Position Restricted for Pensions, End of Year $ 686,312,249 $ 594,401,173
Harris County Hospital District Pension Plan Notes to Financial Statements
December 31, 2017 and 2016
8
Note 1: Description of the Plan
The following description of Harris County Hospital District Pension Plan (the Plan) provides
only general information. Participants should refer to the Summary Plan Description for more
complete information, a copy of which is available from the Harris County Hospital District,
d/b/a Harris Health System (the System).
General
The Plan is a noncontributory, single-employer defined-benefit pension plan covering all full-
time employees of the System who meet the Plan's service requirements. As a governmental
plan, it is exempt from the reporting and disclosure requirements of the Employee Retirement
Income Security Act of 1974 and follows the reporting requirements as dictated by the
Governmental Accounting Standards Board (GASB).
In October 2006, the System Board of Trustees (Board) amended the Plan to close enrollment to
new hires effective January 1, 2007. The amended plan offers employees hired prior to January
1, 2007, a choice to either (1) continue with their current pension plan or (2) elect to participate in
the System's enhanced 401(k) retirement savings plan with a match, effective July 2007, of up to
5 percent of participant's compensation provided by the System. All new hires and rehires after
December 31, 2006 are only eligible for the System's 401(k) retirement savings plan with a match
up to 5 percent.
The Plan is administered by an administrative committee (the Committee) appointed by the Board
of the System. The Committee comprises nine members who are responsible for administering
the Plan under the terms that are established. The Board, as authorized in the Plan Document,
approves amendments to the Plan. State Street (the Trustee) serves as trustee and custodian for
the Plan.
Pension Benefits
Active employees with one or more years of service, who meet eligibility requirements are
entitled to a monthly pension payment beginning at normal retirement age (65) equal to the
benefit accrued based on compensation and years of service. The Plan permits early retirement at
ages 55 to 64, provided 10 years of service has been completed. If employees terminate after 5
years of service, they retain the right to vested benefits. Participants become 100 percent vested
in their accrued benefits after 5 years of service. Each participant shall have a monthly benefit
payable for life that is equal to the greater of (a) the number of years of service multiplied by 1.5
percent of the average monthly compensation (average base compensation received in the five
highest consecutive calendar years out of the 10 complete calendar years prior to retirement) or
(b) the accrued monthly retirement benefit determined as of January 1, 1989, plus the number of
years of future service earned after January 1, 1989, multiplied by 1.5 percent of the average
monthly compensation, subject to a minimum equal to the benefit earned under the Plan prior to
Harris County Hospital District Pension Plan Notes to Financial Statements
December 31, 2017 and 2016
9
the adoption of the sixth amendment as of September 30, 1991 (applies to non-highly
compensated employees only). Monthly benefit payments are subject to a minimum based on the
number of years of service multiplied by $6 and a maximum provision permitted to be paid under
Section 415 of the Internal Revenue Code (the Code). Participants may also elect to receive their
benefits in other optional forms.
If the present value of a terminating participant's vested benefit is $1,000 or less, the benefit will
automatically be paid in a lump sum.
During 2017 there were no lump-sum payments made to terminated participants. In 2016 the
Plan made lump-sum payments of $420,827 to 120 participants.
Death and Disability Benefits
If an active employee dies, a benefit equal to one-half of the normal pension benefit will be due to
the spouse of the participant if the participant has attained 10 years of service. The beneficiary of
a deceased retired participant is entitled to a lump-sum payment of $5,000. If a participant
becomes disabled, the participant will be paid 55 percent of his/her average monthly
compensation, less 64 percent of the monthly primary social security benefit at the time of
disability. Disability benefits will be paid during the participant's disability or until retirement
age is reached, whichever is shorter.
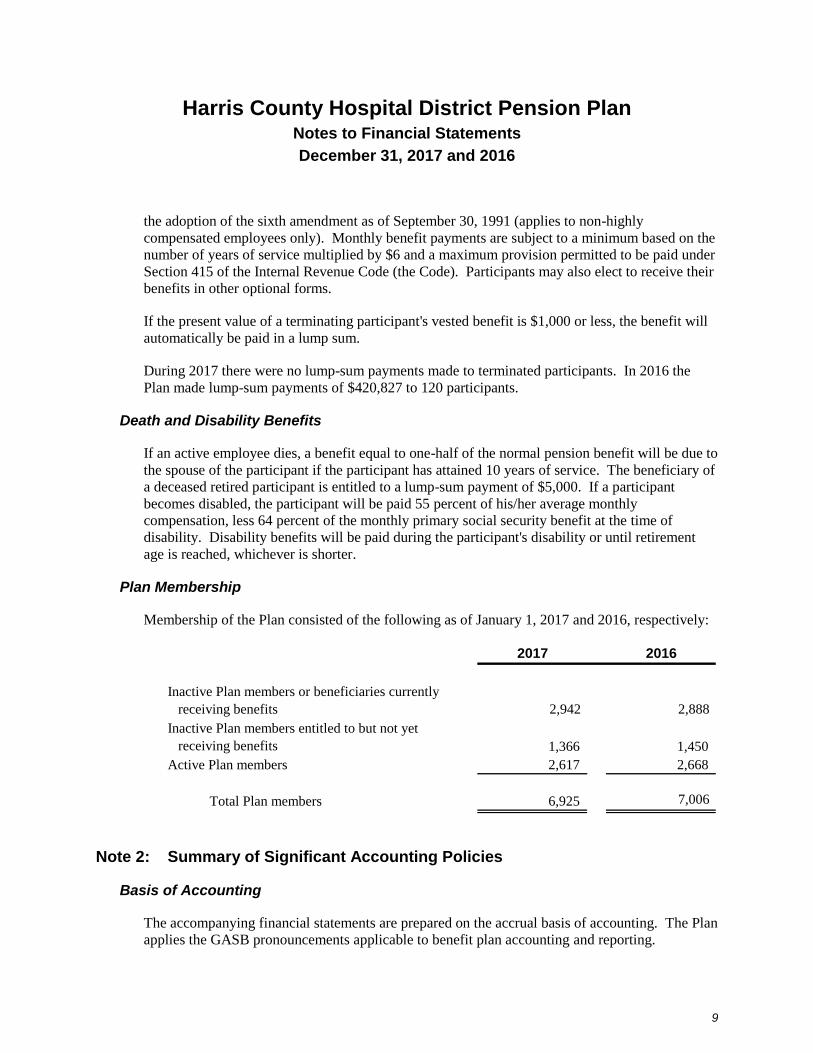
Plan Membership
Membership of the Plan consisted of the following as of January 1, 2017 and 2016, respectively:
2017 2016
Inactive Plan members or beneficiaries currently
receiving benefits 2,942 2,888
Inactive Plan members entitled to but not yet
receiving benefits 1,366 1,450
Active Plan members 2,617 2,668
Total Plan members 6,925 7,006
Note 2: Summary of Significant Accounting Policies
Basis of Accounting
The accompanying financial statements are prepared on the accrual basis of accounting. The Plan
applies the GASB pronouncements applicable to benefit plan accounting and reporting.
Harris County Hospital District Pension Plan Notes to Financial Statements
December 31, 2017 and 2016
10
Use of Estimates
The preparation of financial statements in conformity with accounting principles generally
accepted in the United States of America requires management to make estimates and
assumptions that affect the reported amounts of assets, liabilities and changes therein, disclosure
of contingent assets and liabilities and the actuarial present value of accumulated Plan benefits at
the date of the financial statements and changes therein. Actual results could differ from those
estimates.
Risks and Uncertainties
The Plan utilizes various investment securities, including U.S. government securities, corporate
debt instruments, mutual funds, corporate stocks, collective investment trust funds and real estate
investment trusts. Investment securities, in general, are exposed to various risks, such as interest
rate, credit risk, and overall market volatility risks. Due to the level of risk associated with
certain investment securities, it is reasonably possible that changes in the values of investment
securities will occur in the near term and that such changes could materially affect the amounts
reported in the financial statements.
The actuarial present value of accumulated Plan benefits is calculated based on economic and
demographic assumptions, including investment return rates, inflation rates, salary increases,
retirement ages and mortality rates. Due to uncertainties inherent in the estimations and
assumptions processes, it is at least reasonably possible that changes in these estimates and
assumptions in the near term would be material to the financial statements.
Valuation of Investments and Income Recognition
Investments are reported at fair value. Quoted market prices, if available, are used to value
investments. Mutual funds are valued at the net asset value (NAV) of shares held by the Plan at
year-end. Common stocks are valued at the closing price reported on the active market on which
the individual securities are traded. Fixed income securities are valued on the basis of yields
currently available on comparable securities of issuers with similar credit ratings. Units of
collective investment trust funds are stated at fair value as determined by the issuer of the fund
based on the fair value of the underlying investments
Purchases and sales of securities are recorded on a trade-date basis. Interest income is recorded
on the accrual basis. Dividends are recorded on the ex-dividend date. Net appreciation in fair
value of investments includes the Plan's gains and losses on investments bought and sold, as well
as held during the year.
Management fees and operating expenses charged to the Plan for investments in mutual funds are
deducted from income earned on a daily basis and are not separately reflected. Consequently,
management fees and operating expenses are reflected as a reduction of investment return for
such investments.
Harris County Hospital District Pension Plan Notes to Financial Statements
December 31, 2017 and 2016
11
Administrative Expenses
All administrative expenses incurred in the operation of the Plan are paid by the Plan as provided
in the Plan Document. The Plan Sponsor provides accounting and certain other administrative
services to the Plan at no charge.
Payment of Benefits
Benefit payments to participants are recorded upon distribution.
Contributions
Contributions to provide benefits under the Plan are made solely by the System. The System
makes annual contributions based on an actuarial valuation of the Plan. The actuarial
recommended contribution includes normal cost, plus amortization of the expected unfunded
liability, if any.
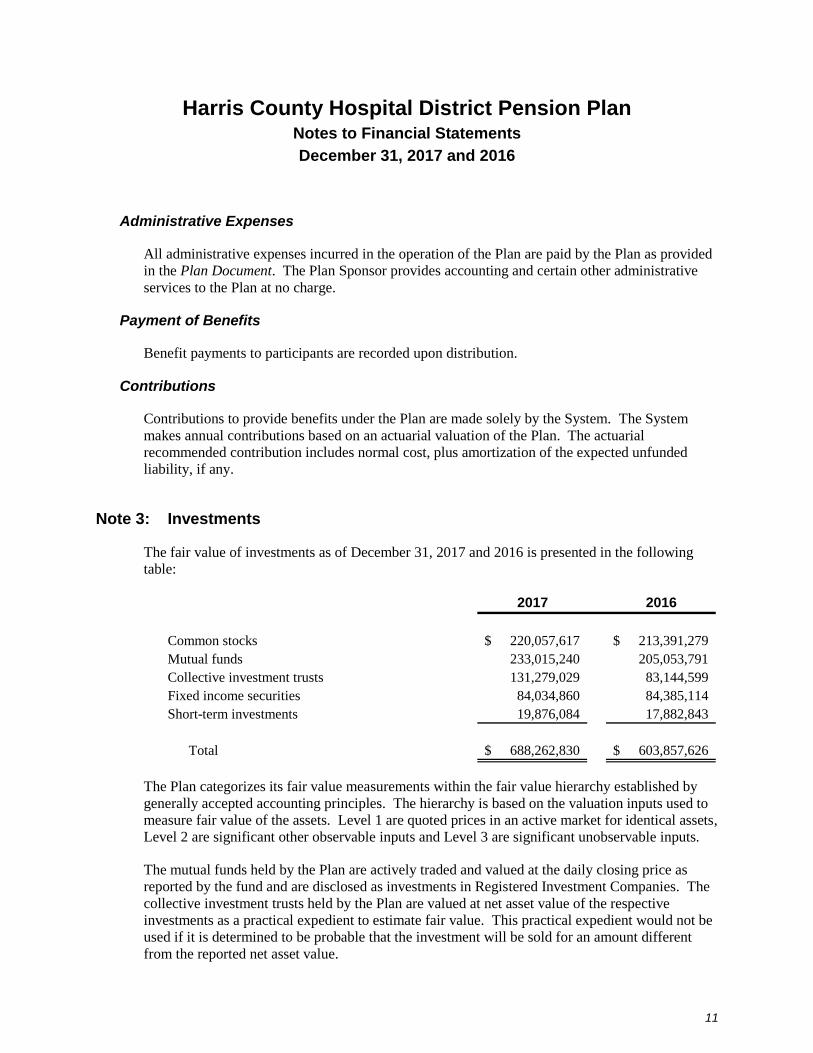
Note 3: Investments
The fair value of investments as of December 31, 2017 and 2016 is presented in the following
table:
2017 2016
Common stocks 220,057,617$ 213,391,279$
Mutual funds 233,015,240 205,053,791
Collective investment trusts 131,279,029 83,144,599
Fixed income securities 84,034,860 84,385,114
Short-term investments 19,876,084 17,882,843
Total 688,262,830$ 603,857,626$
The Plan categorizes its fair value measurements within the fair value hierarchy established by
generally accepted accounting principles. The hierarchy is based on the valuation inputs used to
measure fair value of the assets. Level 1 are quoted prices in an active market for identical assets,
Level 2 are significant other observable inputs and Level 3 are significant unobservable inputs.
The mutual funds held by the Plan are actively traded and valued at the daily closing price as
reported by the fund and are disclosed as investments in Registered Investment Companies. The
collective investment trusts held by the Plan are valued at net asset value of the respective
investments as a practical expedient to estimate fair value. This practical expedient would not be
used if it is determined to be probable that the investment will be sold for an amount different
from the reported net asset value.
Harris County Hospital District Pension Plan Notes to Financial Statements
December 31, 2017 and 2016
12
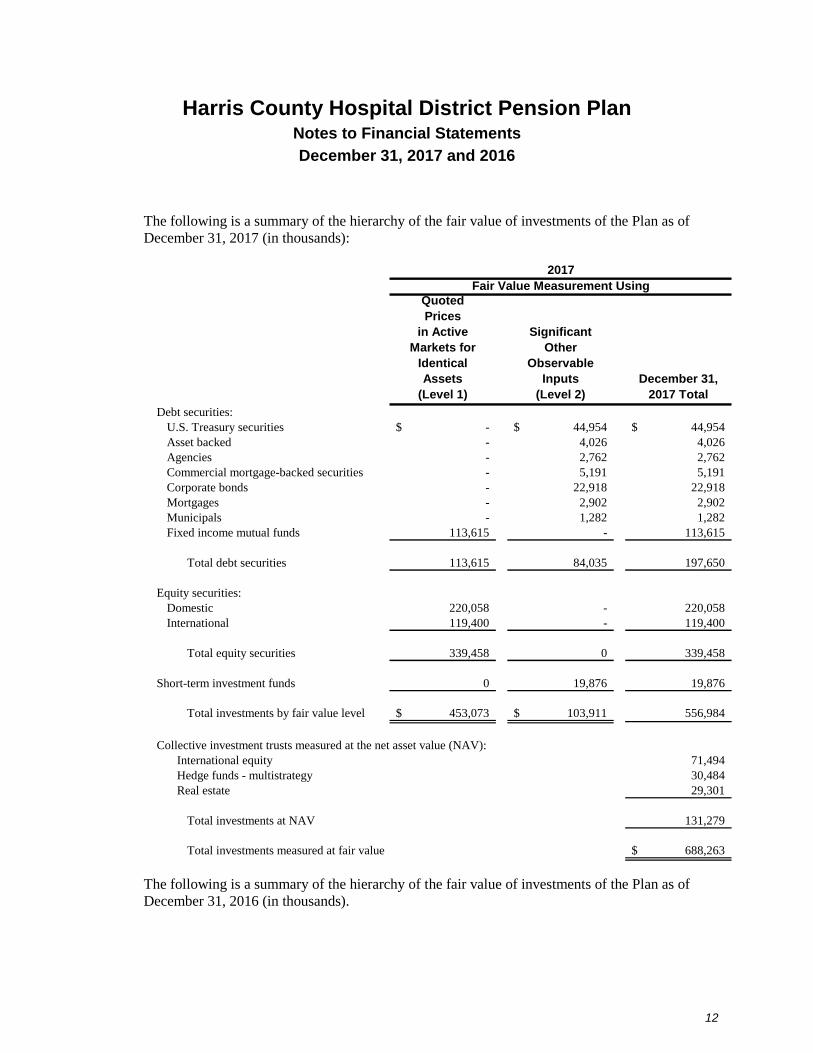
The following is a summary of the hierarchy of the fair value of investments of the Plan as of
December 31, 2017 (in thousands):
Quoted
Prices
in Active
Markets for
Identical
Assets
(Level 1)
Significant
Other
Observable
Inputs
(Level 2)
December 31,
2017 Total
Debt securities:
U.S. Treasury securities -$ 44,954$ 44,954$
Asset backed - 4,026 4,026
Agencies - 2,762 2,762
Commercial mortgage-backed securities - 5,191 5,191
Corporate bonds - 22,918 22,918
Mortgages - 2,902 2,902
Municipals - 1,282 1,282
Fixed income mutual funds 113,615 - 113,615
Total debt securities 113,615 84,035 197,650
Equity securities:
Domestic 220,058 - 220,058
International 119,400 - 119,400
Total equity securities 339,458 0 339,458
Short-term investment funds 0 19,876 19,876
Total investments by fair value level 453,073$ 103,911$ 556,984
Collective investment trusts measured at the net asset value (NAV):
International equity 71,494
Hedge funds - multistrategy 30,484
Real estate 29,301
Total investments at NAV 131,279
Total investments measured at fair value 688,263$
2017
Fair Value Measurement Using
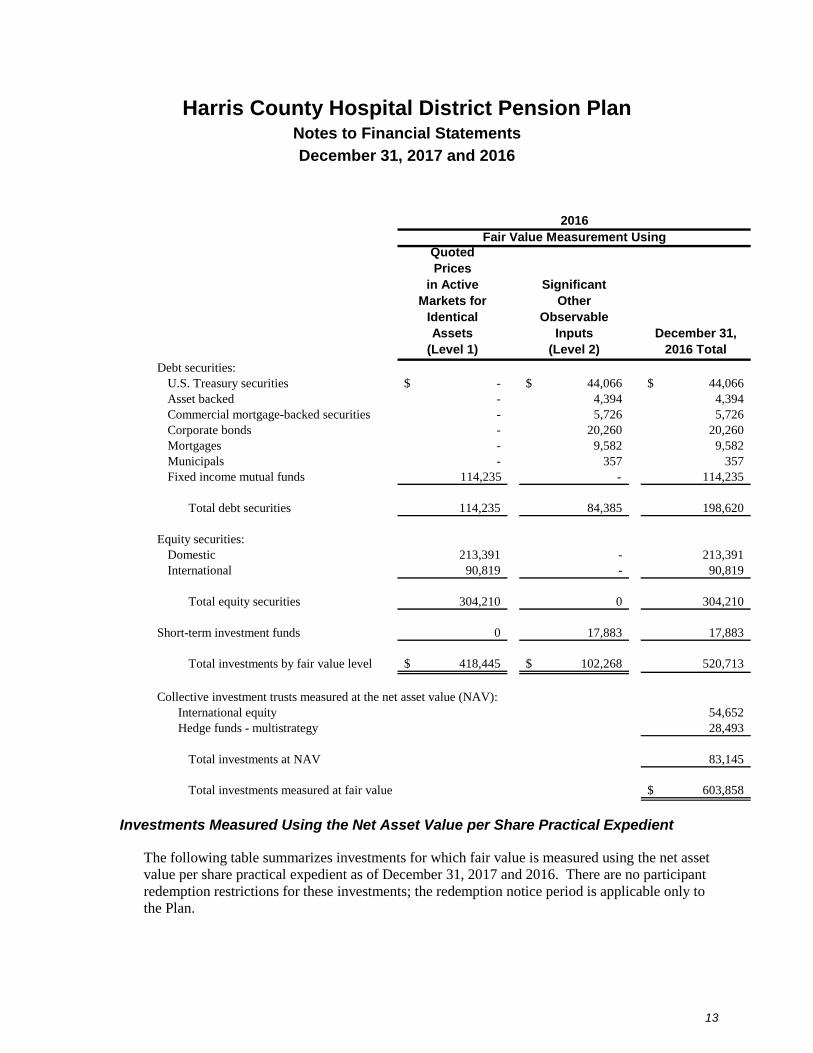
The following is a summary of the hierarchy of the fair value of investments of the Plan as of
December 31, 2016 (in thousands).
Harris County Hospital District Pension Plan Notes to Financial Statements
December 31, 2017 and 2016
13
Quoted
Prices
in Active
Markets for
Identical
Assets
(Level 1)
Significant
Other
Observable
Inputs
(Level 2)
December 31,
2016 Total
Debt securities:
U.S. Treasury securities -$ 44,066$ 44,066$
Asset backed - 4,394 4,394
Commercial mortgage-backed securities - 5,726 5,726
Corporate bonds - 20,260 20,260
Mortgages - 9,582 9,582
Municipals - 357 357
Fixed income mutual funds 114,235 - 114,235
Total debt securities 114,235 84,385 198,620
Equity securities:
Domestic 213,391 - 213,391
International 90,819 - 90,819
Total equity securities 304,210 0 304,210
Short-term investment funds 0 17,883 17,883
Total investments by fair value level 418,445$ 102,268$ 520,713
Collective investment trusts measured at the net asset value (NAV):
International equity 54,652
Hedge funds - multistrategy 28,493
Total investments at NAV 83,145
Total investments measured at fair value 603,858$
Fair Value Measurement Using
2016
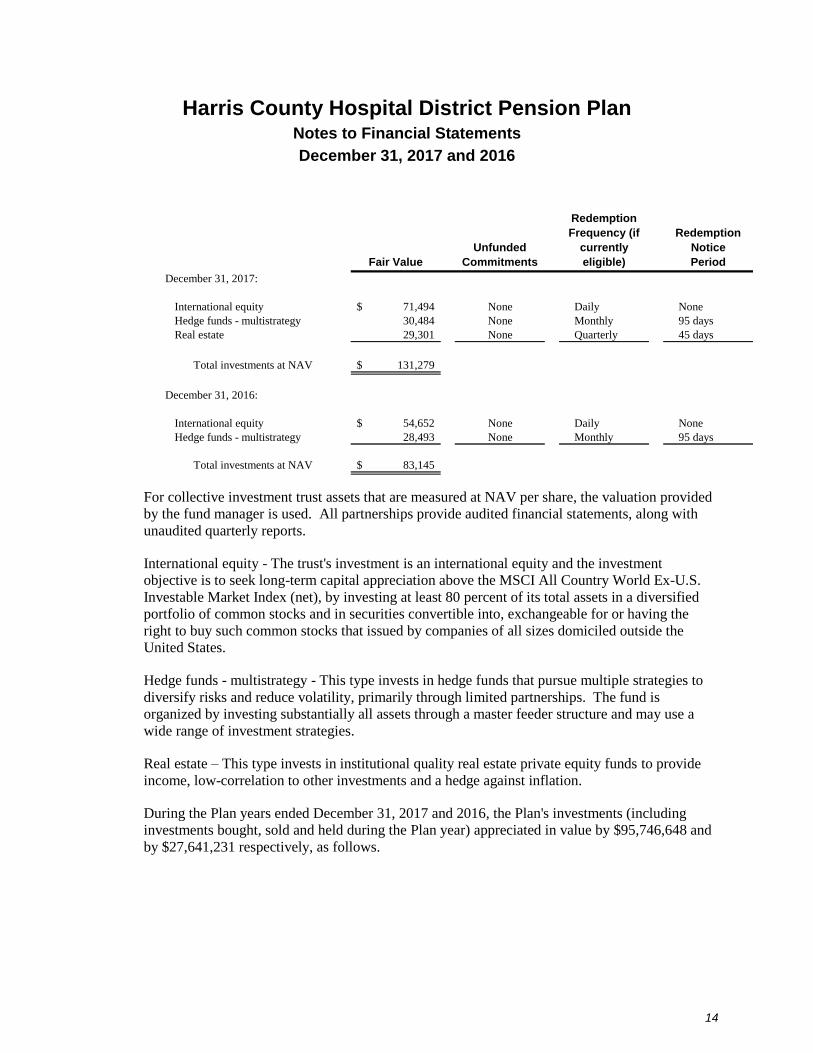
Investments Measured Using the Net Asset Value per Share Practical Expedient
The following table summarizes investments for which fair value is measured using the net asset
value per share practical expedient as of December 31, 2017 and 2016. There are no participant
redemption restrictions for these investments; the redemption notice period is applicable only to
the Plan.
Harris County Hospital District Pension Plan Notes to Financial Statements
December 31, 2017 and 2016
14
Fair Value
Unfunded
Commitments
Redemption
Frequency (if
currently
eligible)
Redemption
Notice
Period
December 31, 2017:
International equity 71,494$ None Daily None
Hedge funds - multistrategy 30,484 None Monthly 95 days
Real estate 29,301 None Quarterly 45 days
Total investments at NAV 131,279$
December 31, 2016:
International equity 54,652$ None Daily None
Hedge funds - multistrategy 28,493 None Monthly 95 days
Total investments at NAV 83,145$
For collective investment trust assets that are measured at NAV per share, the valuation provided
by the fund manager is used. All partnerships provide audited financial statements, along with
unaudited quarterly reports.
International equity - The trust's investment is an international equity and the investment
objective is to seek long-term capital appreciation above the MSCI All Country World Ex-U.S.
Investable Market Index (net), by investing at least 80 percent of its total assets in a diversified
portfolio of common stocks and in securities convertible into, exchangeable for or having the
right to buy such common stocks that issued by companies of all sizes domiciled outside the
United States.
Hedge funds - multistrategy - This type invests in hedge funds that pursue multiple strategies to
diversify risks and reduce volatility, primarily through limited partnerships. The fund is
organized by investing substantially all assets through a master feeder structure and may use a
wide range of investment strategies.
Real estate – This type invests in institutional quality real estate private equity funds to provide
income, low-correlation to other investments and a hedge against inflation.
During the Plan years ended December 31, 2017 and 2016, the Plan's investments (including
investments bought, sold and held during the Plan year) appreciated in value by $95,746,648 and
by $27,641,231 respectively, as follows.
Harris County Hospital District Pension Plan Notes to Financial Statements
December 31, 2017 and 2016
15
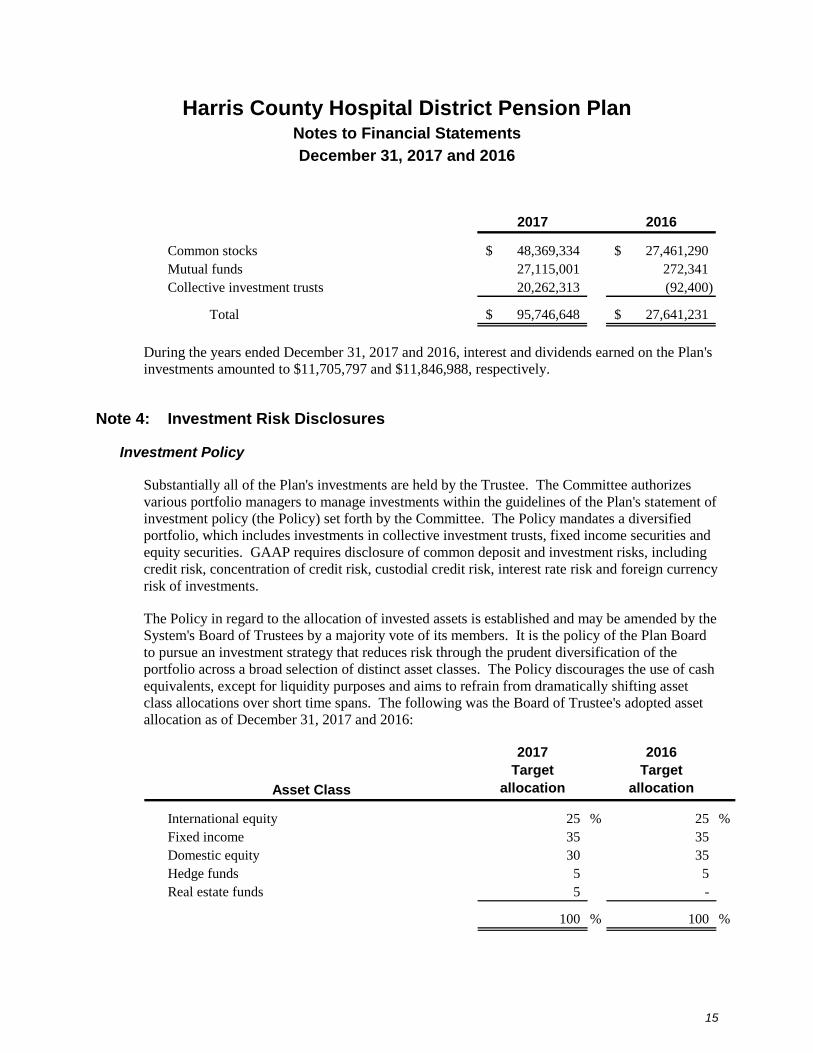
2017 2016
Common stocks 48,369,334$ 27,461,290$
Mutual funds 27,115,001 272,341
Collective investment trusts 20,262,313 (92,400)
Total 95,746,648$ 27,641,231$
During the years ended December 31, 2017 and 2016, interest and dividends earned on the Plan's
investments amounted to $11,705,797 and $11,846,988, respectively.
Note 4: Investment Risk Disclosures
Investment Policy
Substantially all of the Plan's investments are held by the Trustee. The Committee authorizes
various portfolio managers to manage investments within the guidelines of the Plan's statement of
investment policy (the Policy) set forth by the Committee. The Policy mandates a diversified
portfolio, which includes investments in collective investment trusts, fixed income securities and
equity securities. GAAP requires disclosure of common deposit and investment risks, including
credit risk, concentration of credit risk, custodial credit risk, interest rate risk and foreign currency
risk of investments.
The Policy in regard to the allocation of invested assets is established and may be amended by the
System's Board of Trustees by a majority vote of its members. It is the policy of the Plan Board
to pursue an investment strategy that reduces risk through the prudent diversification of the
portfolio across a broad selection of distinct asset classes. The Policy discourages the use of cash
equivalents, except for liquidity purposes and aims to refrain from dramatically shifting asset
class allocations over short time spans. The following was the Board of Trustee's adopted asset
allocation as of December 31, 2017 and 2016:
Asset Class
2017
Target
allocation
2016
Target
allocation
International equity 25 % 25 %
Fixed income 35 35
Domestic equity 30 35
Hedge funds 5 5
Real estate funds 5 -
100 % 100 %
Harris County Hospital District Pension Plan Notes to Financial Statements
December 31, 2017 and 2016
16
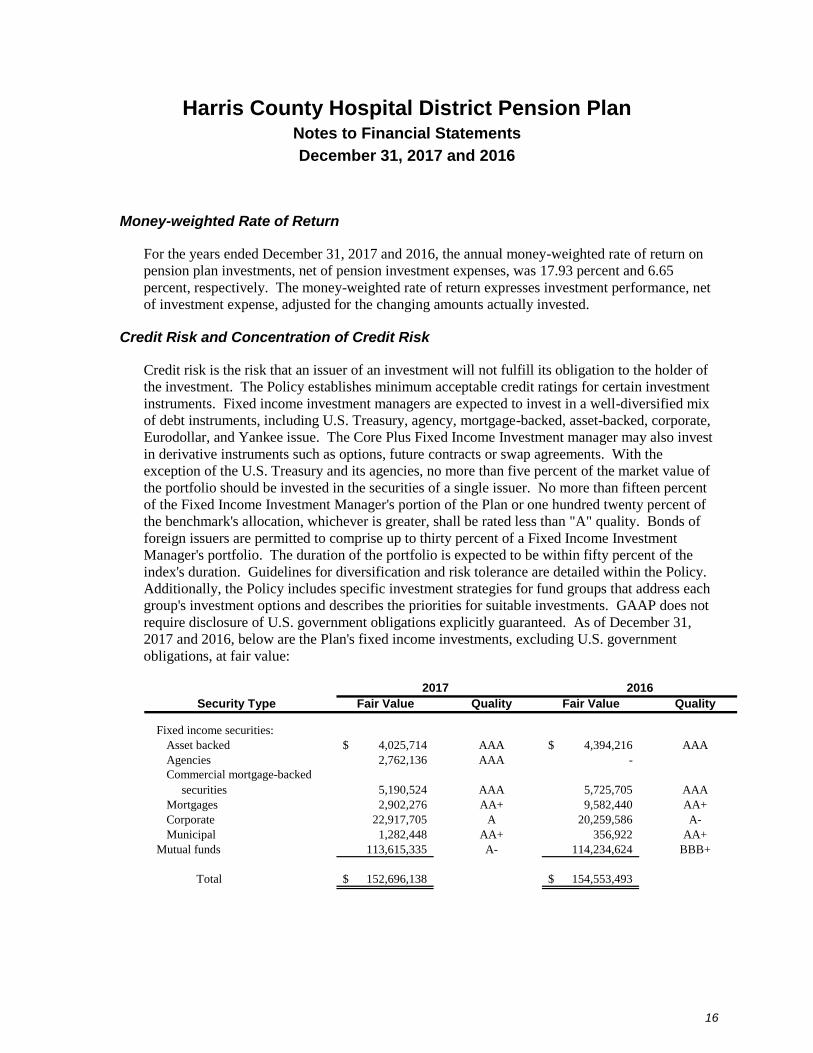
Money-weighted Rate of Return
For the years ended December 31, 2017 and 2016, the annual money-weighted rate of return on
pension plan investments, net of pension investment expenses, was 17.93 percent and 6.65
percent, respectively. The money-weighted rate of return expresses investment performance, net
of investment expense, adjusted for the changing amounts actually invested.
Credit Risk and Concentration of Credit Risk
Credit risk is the risk that an issuer of an investment will not fulfill its obligation to the holder of
the investment. The Policy establishes minimum acceptable credit ratings for certain investment
instruments. Fixed income investment managers are expected to invest in a well-diversified mix
of debt instruments, including U.S. Treasury, agency, mortgage-backed, asset-backed, corporate,
Eurodollar, and Yankee issue. The Core Plus Fixed Income Investment manager may also invest
in derivative instruments such as options, future contracts or swap agreements. With the
exception of the U.S. Treasury and its agencies, no more than five percent of the market value of
the portfolio should be invested in the securities of a single issuer. No more than fifteen percent
of the Fixed Income Investment Manager's portion of the Plan or one hundred twenty percent of
the benchmark's allocation, whichever is greater, shall be rated less than "A" quality. Bonds of
foreign issuers are permitted to comprise up to thirty percent of a Fixed Income Investment
Manager's portfolio. The duration of the portfolio is expected to be within fifty percent of the
index's duration. Guidelines for diversification and risk tolerance are detailed within the Policy.
Additionally, the Policy includes specific investment strategies for fund groups that address each
group's investment options and describes the priorities for suitable investments. GAAP does not
require disclosure of U.S. government obligations explicitly guaranteed. As of December 31,
2017 and 2016, below are the Plan's fixed income investments, excluding U.S. government
obligations, at fair value:
Security Type Fair Value Quality Fair Value Quality
Fixed income securities:
Asset backed 4,025,714$ AAA 4,394,216$ AAA
Agencies 2,762,136 AAA -
Commercial mortgage-backed
securities 5,190,524 AAA 5,725,705 AAA
Mortgages 2,902,276 AA+ 9,582,440 AA+
Corporate 22,917,705 A 20,259,586 A-
Municipal 1,282,448 AA+ 356,922 AA+
Mutual funds 113,615,335 A- 114,234,624 BBB+
Total 152,696,138$ 154,553,493$
2017 2016
Harris County Hospital District Pension Plan Notes to Financial Statements
December 31, 2017 and 2016
17
Concentration of credit risk is the risk of loss attributed to the magnitude of an investment in a
single issuer. The System mitigates these risks by emphasizing the importance of a diversified
portfolio. All funds must be sufficiently diversified to eliminate the risk of loss resulting from
overconcentration of assets in a specific maturity, a specific issuer or a specific class of securities.
In particular, no more than 5 percent of an equity portfolio may be invested in a single company
without consent of the Committee. Holdings in any one industry or sector are not to exceed 30
percent of the portfolio market value. No more than 20 percent of the portfolio may be invested
in cash equivalents and fixed income securities with fixed income securities not exceeding 15
percent. Concentration by issuer for other investment instruments is limited to 5 percent. The
Policy does specify that acceptable investment instruments must have high-quality credit ratings
and, consequently, risk is minimal.
As of December 31, 2017 and 2016, the Plan did not hold more than 5 percent of assets in any
single issuer other than mutual funds, U.S. government obligations, collective investment trust
funds or obligations of U.S. government chartered entities.
The Plan maintained no investments in derivatives as of December 31, 2017 or 2016,
Custodial Credit Risk
Custodial credit risk for deposits is the risk that, in the event of failure of a depository financial
institution, the Plan will not be able to recover its deposits or will not be able to recover collateral
securities that are in possession of an outside party. The custodial credit risk for investments is
the risk that, in the event of the failure of the counterparty to a transaction, the Plan will not be
able to recover the value of its investment or collateral securities that are in possession of another
party.
The Plan does not have a formal policy for custodial credit risk. As of December 31, 2017 and
2016, all investments are held in a nominee name of the custodian for the benefit of the Plan.
Interest Rate Risk
All investments carry the risk that changes in market interest rates will adversely affect the fair
value of an investment. Generally, the longer the maturity of an investment, the greater is the
sensitivity of its fair market value to changes in market interest rates. The Plan does not have a
formal investment policy that limits investment maturities as a means of managing its exposure to
fair value losses arising from changing interest rates. Interest rate risk is limited by the short-term
nature of the investments.
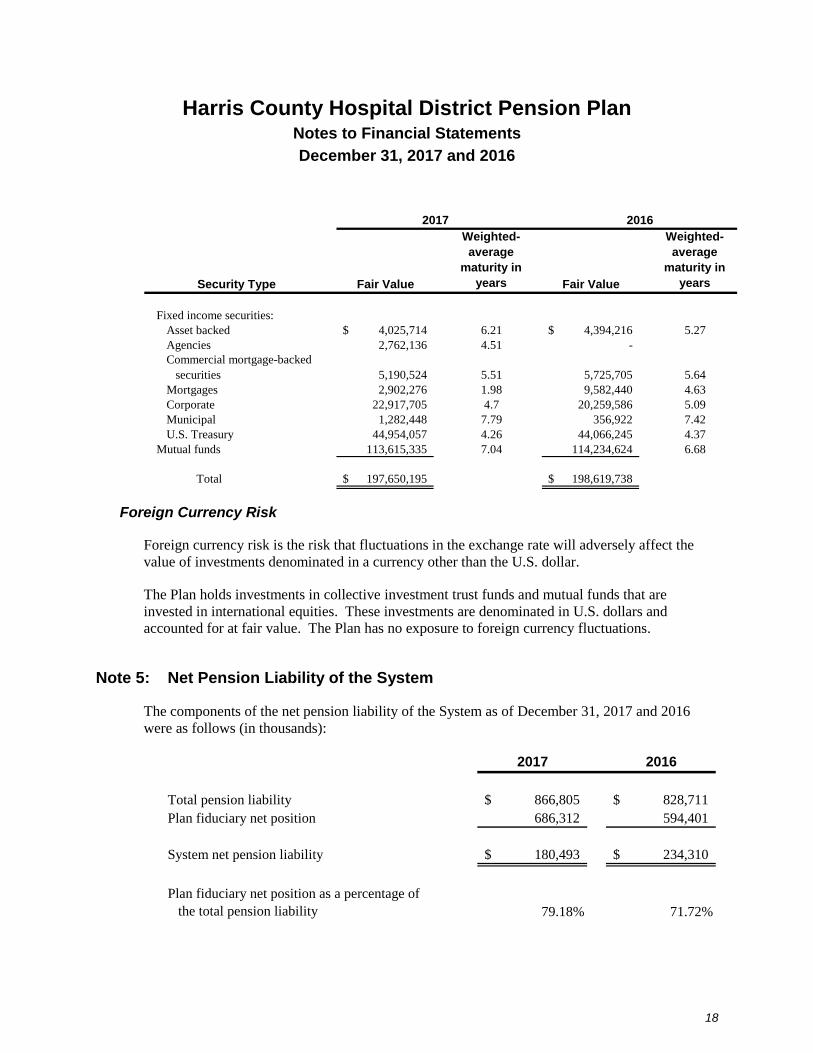
As of December 31, 2017 and 2016, the Plan had the following investments in its fixed income
accounts.
Harris County Hospital District Pension Plan Notes to Financial Statements
December 31, 2017 and 2016
18
Security Type Fair Value
Weighted-
average
maturity in
years Fair Value
Weighted-
average
maturity in
years
Fixed income securities:
Asset backed 4,025,714$ 6.21 4,394,216$ 5.27
Agencies 2,762,136 4.51 -
Commercial mortgage-backed
securities 5,190,524 5.51 5,725,705 5.64
Mortgages 2,902,276 1.98 9,582,440 4.63
Corporate 22,917,705 4.7 20,259,586 5.09
Municipal 1,282,448 7.79 356,922 7.42
U.S. Treasury 44,954,057 4.26 44,066,245 4.37
Mutual funds 113,615,335 7.04 114,234,624 6.68
Total 197,650,195$ 198,619,738$
2017 2016
Foreign Currency Risk
Foreign currency risk is the risk that fluctuations in the exchange rate will adversely affect the
value of investments denominated in a currency other than the U.S. dollar.
The Plan holds investments in collective investment trust funds and mutual funds that are
invested in international equities. These investments are denominated in U.S. dollars and
accounted for at fair value. The Plan has no exposure to foreign currency fluctuations.
Note 5: Net Pension Liability of the System
The components of the net pension liability of the System as of December 31, 2017 and 2016
were as follows (in thousands):
2017 2016
Total pension liability 866,805$ 828,711$
Plan fiduciary net position 686,312 594,401
System net pension liability 180,493$ 234,310$
Plan fiduciary net position as a percentage of
the total pension liability 79.18% 71.72%
Harris County Hospital District Pension Plan Notes to Financial Statements
December 31, 2017 and 2016
19
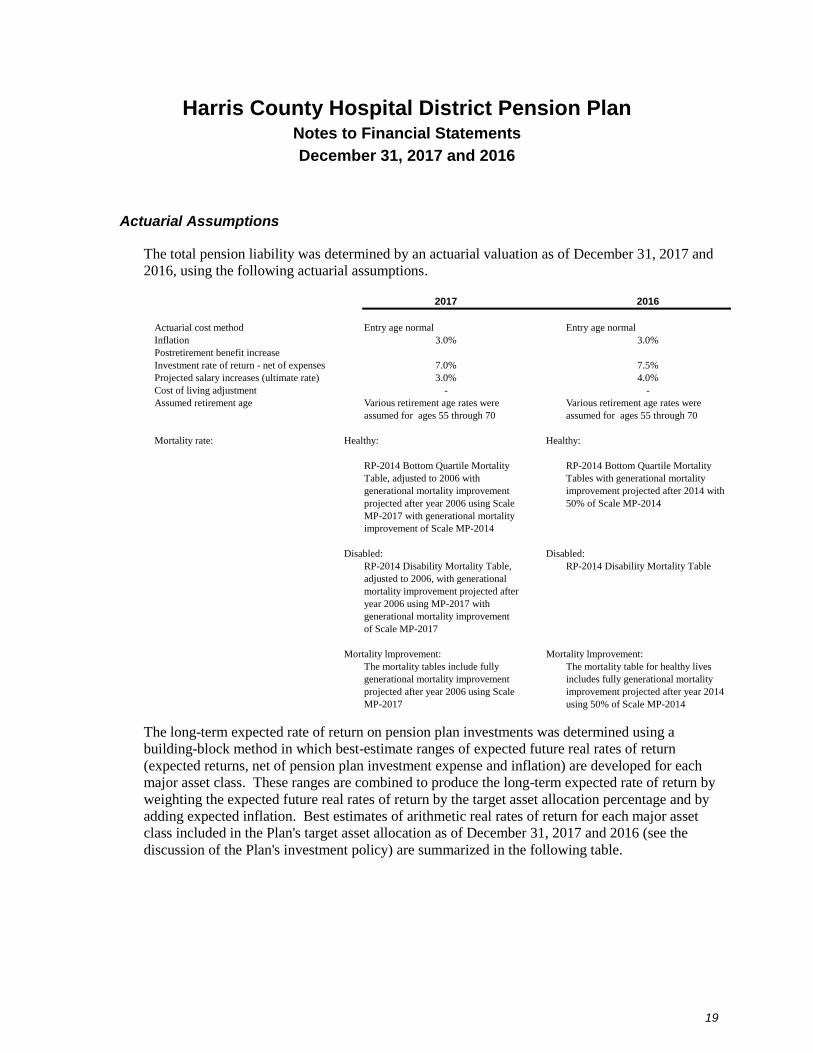
Actuarial Assumptions
The total pension liability was determined by an actuarial valuation as of December 31, 2017 and
2016, using the following actuarial assumptions.
2017 2016
Actuarial cost method Entry age normal Entry age normal
Inflation 3.0% 3.0%
Postretirement benefit increase
Investment rate of return - net of expenses 7.0% 7.5%
Projected salary increases (ultimate rate) 3.0% 4.0%
Cost of living adjustment - -
Assumed retirement age Various retirement age rates were Various retirement age rates were
assumed for ages 55 through 70 assumed for ages 55 through 70
Mortality rate: Healthy: Healthy:
RP-2014 Bottom Quartile Mortality RP-2014 Bottom Quartile Mortality
Table, adjusted to 2006 with Tables with generational mortality
generational mortality improvement improvement projected after 2014 with
projected after year 2006 using Scale 50% of Scale MP-2014
MP-2017 with generational mortality
improvement of Scale MP-2014
Disabled: Disabled:
RP-2014 Disability Mortality Table, RP-2014 Disability Mortality Table
adjusted to 2006, with generational
mortality improvement projected after
year 2006 using MP-2017 with
generational mortality improvement
of Scale MP-2017
Mortality lmprovement: Mortality lmprovement:
The mortality tables include fully The mortality table for healthy lives
generational mortality improvement includes fully generational mortality
projected after year 2006 using Scale improvement projected after year 2014
MP-2017 using 50% of Scale MP-2014
The long-term expected rate of return on pension plan investments was determined using a
building-block method in which best-estimate ranges of expected future real rates of return
(expected returns, net of pension plan investment expense and inflation) are developed for each
major asset class. These ranges are combined to produce the long-term expected rate of return by
weighting the expected future real rates of return by the target asset allocation percentage and by
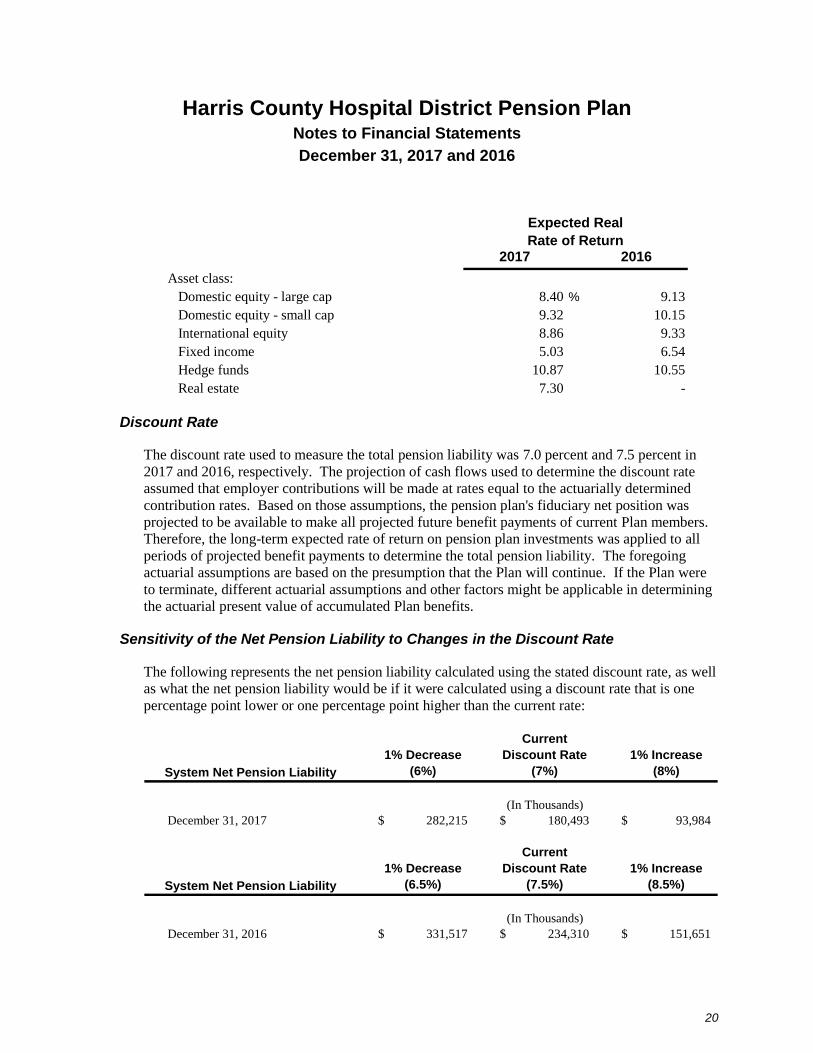
adding expected inflation. Best estimates of arithmetic real rates of return for each major asset
class included in the Plan's target asset allocation as of December 31, 2017 and 2016 (see the
discussion of the Plan's investment policy) are summarized in the following table.
Harris County Hospital District Pension Plan Notes to Financial Statements
December 31, 2017 and 2016
20
2017 2016
Asset class:
Domestic equity - large cap 8.40 % 9.13
Domestic equity - small cap 9.32 10.15
International equity 8.86 9.33
Fixed income 5.03 6.54
Hedge funds 10.87 10.55
Real estate 7.30 -
Expected Real
Rate of Return
Discount Rate
The discount rate used to measure the total pension liability was 7.0 percent and 7.5 percent in
2017 and 2016, respectively. The projection of cash flows used to determine the discount rate
assumed that employer contributions will be made at rates equal to the actuarially determined
contribution rates. Based on those assumptions, the pension plan's fiduciary net position was
projected to be available to make all projected future benefit payments of current Plan members.
Therefore, the long-term expected rate of return on pension plan investments was applied to all
periods of projected benefit payments to determine the total pension liability. The foregoing
actuarial assumptions are based on the presumption that the Plan will continue. If the Plan were
to terminate, different actuarial assumptions and other factors might be applicable in determining
the actuarial present value of accumulated Plan benefits.
Sensitivity of the Net Pension Liability to Changes in the Discount Rate
The following represents the net pension liability calculated using the stated discount rate, as well
as what the net pension liability would be if it were calculated using a discount rate that is one
percentage point lower or one percentage point higher than the current rate:
System Net Pension Liability
1% Decrease
(6%)
Current
Discount Rate
(7%)
1% Increase
(8%)
(In Thousands)
December 31, 2017 282,215$ 180,493$ 93,984$
System Net Pension Liability
1% Decrease
(6.5%)
Current
Discount Rate
(7.5%)
1% Increase
(8.5%)
(In Thousands)
December 31, 2016 331,517$ 234,310$ 151,651$
Harris County Hospital District Pension Plan Notes to Financial Statements
December 31, 2017 and 2016
21
Note 6: Tax Status
The Plan has received a determination letter from the Internal Revenue Service dated June 10,
2014, stating that the Plan and related trust, as then designed, were in compliance with the
applicable requirements of the Internal Revenue Code and therefore not subject to tax. The Plan
has been amended since receiving the determination letter. However, the Plan Administrator
believes that the Plan and related trust are currently designed and being operated in compliance
with the applicable requirements of the Internal Revenue Code.
Note 7: Plan Termination
Although it has not expressed any intention to do so, the System has the right under the Plan, in
certain circumstances, to discontinue contributions to the Plan and to terminate the Plan. In the
event that the Plan is terminated, the net assets of the Plan will be allocated generally to provide
the following benefits in the order indicated:
Benefits due to participants who have reached the age of 65 and to beneficiaries of
deceased participants
Benefits due to participants qualified for early retirement, as defined by the Plan
Benefits due to other participants in proportion to the actuarial value of their accumulated
benefits
In the event the assets are not sufficient to carry out any of the foregoing purposes in full, the
allocations to the accounts of individuals thereunder shall be made in the proportion that the
assets available bear to the assets required to carry out the purpose in full.

Required Supplementary Information (Unaudited)
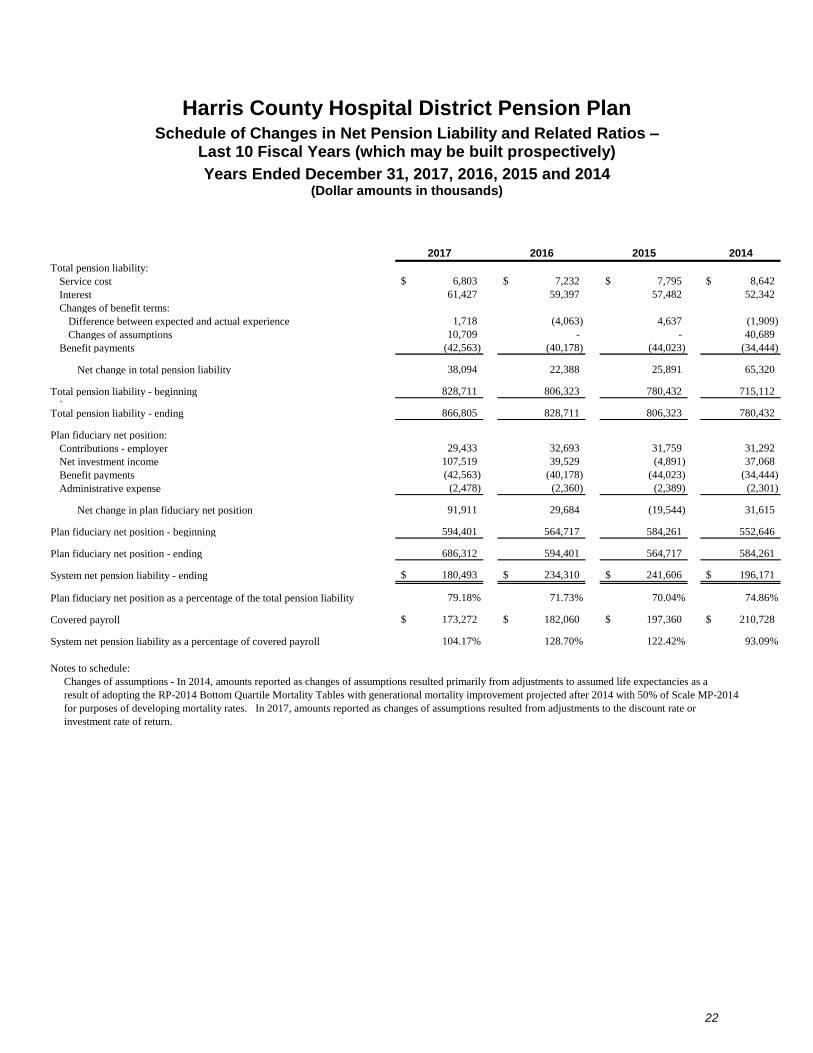
Harris County Hospital District Pension Plan Schedule of Changes in Net Pension Liability and Related Ratios –
Last 10 Fiscal Years (which may be built prospectively)
Years Ended December 31, 2017, 2016, 2015 and 2014 (Dollar amounts in thousands)
22
2017 2016 2015 2014
Total pension liability:
Service cost 6,803$ 7,232$ 7,795$ 8,642$
Interest 61,427 59,397 57,482 52,342
Changes of benefit terms:
Difference between expected and actual experience 1,718 (4,063) 4,637 (1,909)
Changes of assumptions 10,709 - - 40,689
Benefit payments (42,563) (40,178) (44,023) (34,444)
Net change in total pension liability 38,094 22,388 25,891 65,320 `
Total pension liability - beginning 828,711 806,323 780,432 715,112
`Total pension liability - ending 866,805 828,711 806,323 780,432
Plan fiduciary net position:
Contributions - employer 29,433 32,693 31,759 31,292
Net investment income 107,519 39,529 (4,891) 37,068
Benefit payments (42,563) (40,178) (44,023) (34,444)
Administrative expense (2,478) (2,360) (2,389) (2,301)
Net change in plan fiduciary net position 91,911 29,684 (19,544) 31,615
Plan fiduciary net position - beginning 594,401 564,717 584,261 552,646
Plan fiduciary net position - ending 686,312 594,401 564,717 584,261
System net pension liability - ending 180,493$ 234,310$ 241,606$ 196,171$
Plan fiduciary net position as a percentage of the total pension liability 79.18% 71.73% 70.04% 74.86%
Covered payroll 173,272$ 182,060$ 197,360$ 210,728$
System net pension liability as a percentage of covered payroll 104.17% 128.70% 122.42% 93.09%
Notes to schedule:
Changes of assumptions - In 2014, amounts reported as changes of assumptions resulted primarily from adjustments to assumed life expectancies as a
result of adopting the RP-2014 Bottom Quartile Mortality Tables with generational mortality improvement projected after 2014 with 50% of Scale MP-2014
for purposes of developing mortality rates. In 2017, amounts reported as changes of assumptions resulted from adjustments to the discount rate or
investment rate of return.
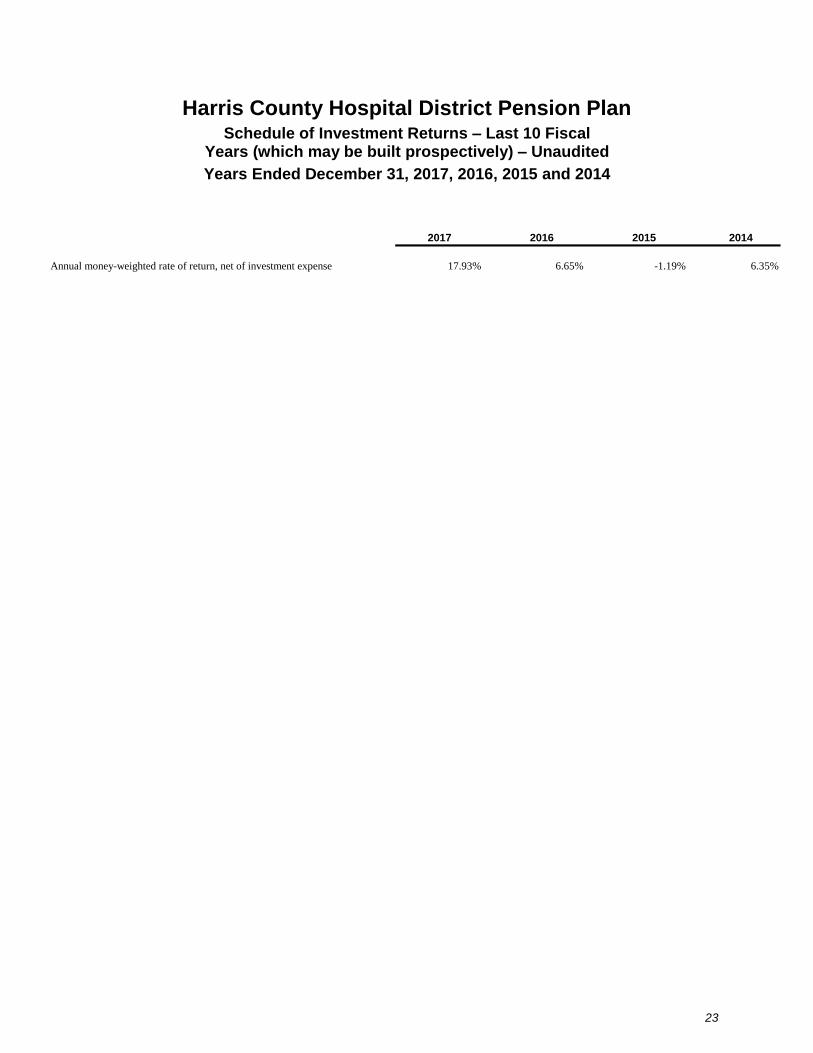
Harris County Hospital District Pension Plan Schedule of Investment Returns – Last 10 Fiscal
Years (which may be built prospectively) – Unaudited
Years Ended December 31, 2017, 2016, 2015 and 2014
23
2017 2016 2015 2014
Annual money-weighted rate of return, net of investment expense 17.93% 6.65% -1.19% 6.35%
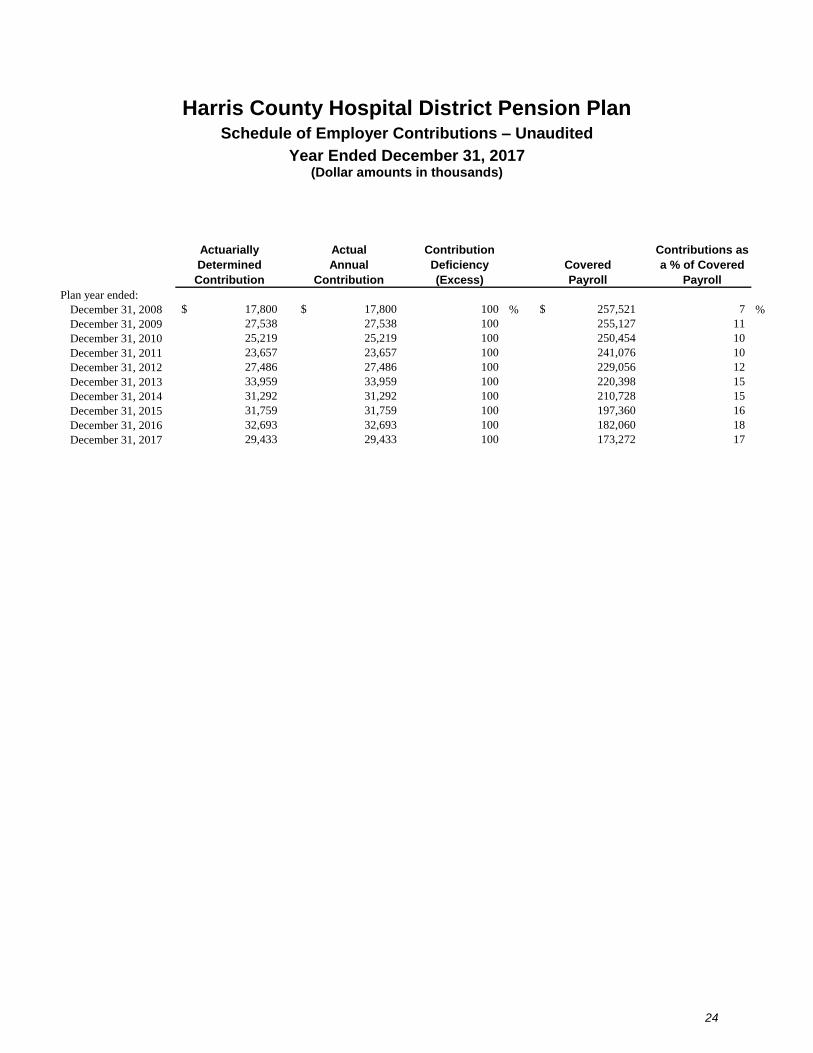
Harris County Hospital District Pension Plan Schedule of Employer Contributions – Unaudited
Year Ended December 31, 2017 (Dollar amounts in thousands)
24
Actuarially
Determined
Contribution
Actual
Annual
Contribution
Contribution
Deficiency
(Excess)
Covered
Payroll
Contributions as
a % of Covered
Payroll
Plan year ended:
December 31, 2008 17,800$ 17,800$ 100 % 257,521$ 7 %
December 31, 2009 27,538 27,538 100 255,127 11
December 31, 2010 25,219 25,219 100 250,454 10
December 31, 2011 23,657 23,657 100 241,076 10
December 31, 2012 27,486 27,486 100 229,056 12
December 31, 2013 33,959 33,959 100 220,398 15
December 31, 2014 31,292 31,292 100 210,728 15
December 31, 2015 31,759 31,759 100 197,360 16
December 31, 2016 32,693 32,693 100 182,060 18
December 31, 2017 29,433 29,433 100 173,272 17
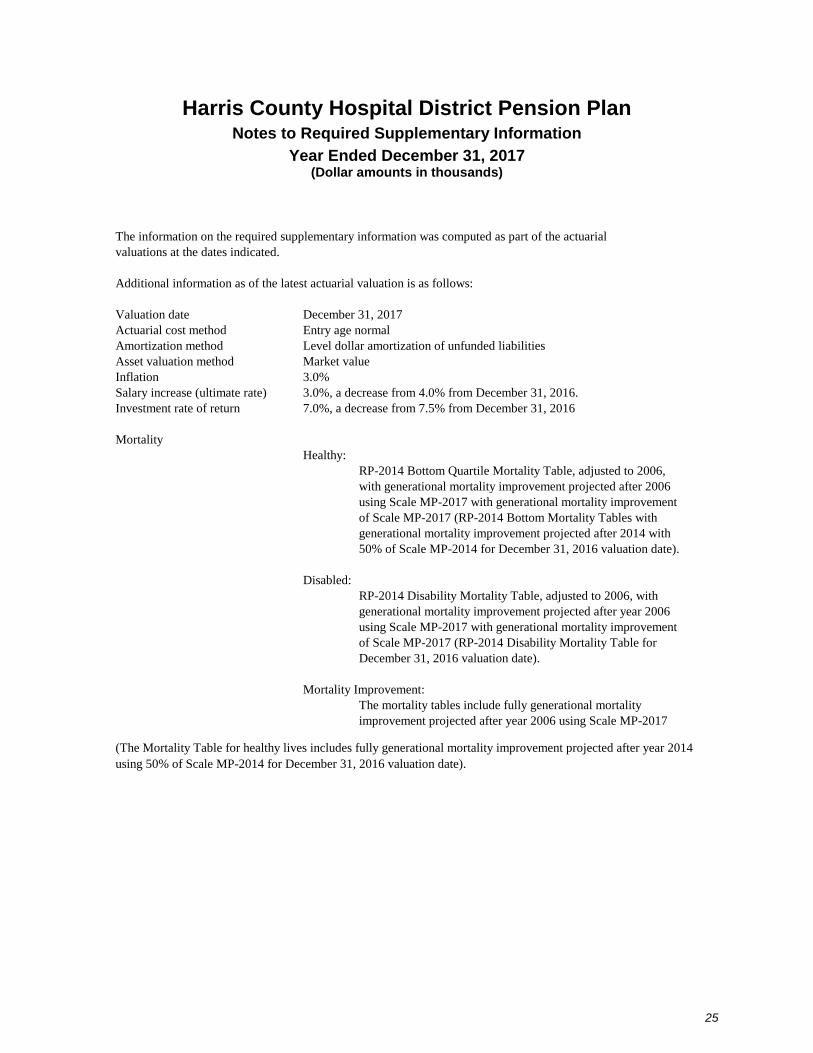
Harris County Hospital District Pension Plan Notes to Required Supplementary Information
Year Ended December 31, 2017 (Dollar amounts in thousands)
25
The information on the required supplementary information was computed as part of the actuarial
valuations at the dates indicated.
Additional information as of the latest actuarial valuation is as follows:
Valuation date December 31, 2017
Actuarial cost method Entry age normal
Amortization method Level dollar amortization of unfunded liabilities
Asset valuation method Market value
Inflation 3.0%
Salary increase (ultimate rate) 3.0%, a decrease from 4.0% from December 31, 2016.
Investment rate of return 7.0%, a decrease from 7.5% from December 31, 2016
Mortality
Healthy:
RP-2014 Bottom Quartile Mortality Table, adjusted to 2006,
with generational mortality improvement projected after 2006
using Scale MP-2017 with generational mortality improvement
of Scale MP-2017 (RP-2014 Bottom Mortality Tables with
generational mortality improvement projected after 2014 with
50% of Scale MP-2014 for December 31, 2016 valuation date).
Disabled:
RP-2014 Disability Mortality Table, adjusted to 2006, with
generational mortality improvement projected after year 2006
using Scale MP-2017 with generational mortality improvement
of Scale MP-2017 (RP-2014 Disability Mortality Table for
December 31, 2016 valuation date).
Mortality Improvement:
The mortality tables include fully generational mortality
improvement projected after year 2006 using Scale MP-2017
(The Mortality Table for healthy lives includes fully generational mortality improvement projected after year 2014
using 50% of Scale MP-2014 for December 31, 2016 valuation date).