Embed Size (px)
Citation preview
Pennsylvania
State Health Assessment
2013
Pennsylvania Department of Health Bureau of Health Planning December 2013 Includes December 2017 Update
This publication was supported by the Cooperative Agreement Number U58CD001297 from the Centers for Disease Control and Prevention. Its contents are solely the responsibility of the authors and do not necessarily represent the official views of the Centers for Disease Control and Prevention

.
Pennsylvania State Health Assessment, 2013 (2017 Update)
Pennsylvania State Health Assessment, 2013 (2017 Update)
2017 Update Project An advisory committee was convened in 2017 for the purpose of ongoing monitoring, refreshing and adding of data and data analysis. This group consisted of representatives of professional associations, representatives of specific populations with consideration of health inequities, and representatives of government agencies. Meetings were held to consider updates to three sections of the 2013 State Health Assessment and the addition of a new emerging health issue.
Revisions were made to:
• Key Health Findings • Context of Health • General Health Status
A new section was added:
• Opioids and the Prescription Drug Monitoring Program
The members of the 2017 advisory committee and the constituencies that they represent can be found in the 2017 Update Acknowledgements section in the following pages.
Pennsylvania State Health Assessment, 2013 (2017 Update) Table of Contents i
Table of Contents
Acknowledgements iv
List of Figures x
List of Tables xxvi
Key Health Findings xxxiii
Context of Health 1-1
The State and Its People 1-1
Health Insurance 1-32
Emergency Preparedness 1-36
General Health Status 2-1
Self-Assessed Health 2-1
Morbidity, Mortality and Life Expectancy 2-4
People with Disabilities 2-11
Major Risk and Protective Factors 3-1
Tobacco Use and Exposure 3-1
Obesity and Overweight 3-9
Physical Activity 3-15
Nutrition 3-19
Alcohol and Drugs 3-23
Mental Health 3-30
Oral Health 3-32
Occupational Health and Safety 4-1
Occupational Injuries 4-1
Farm-Related Fatalities 4-4
Pesticide Exposure 4-5
Lead Exposure 4-6
Infectious Diseases 5-1
Sexually Transmitted Diseases 5-1
HIV and AIDS 5-6
Tuberculosis 5-11
Pennsylvania State Health Assessment, 2013 (2017 Update) Table of Contents ii
Hepatitis A 5-14
Hepatitis B 5-17
Hepatitis C 5-20
Hospital-Related Healthcare Associated Infections 5-23
West Nile Virus 5-29
Lyme Disease 5-33
Rabies 5-37
Legionellosis 5-40
Salmonellosis 5-43
Campylobacteriosis 5-46
Enterohemorrhagic Escherichia Coli 5-49
Vaccine Preventable Diseases 5-53
Injury and Violence 6-1
Preventable Injuries 6-1
Unintentional Injuries 6-4
Violence 6-12
Traumatic Brain Injury 6-21
Maternal and Child Health 7-1
Context for Health 7-1
Unintended Pregnancy 7-3
Contraceptive Use 7-7
Adolescent Pregnancy and Childbearing 7-10
Preterm Birth and Low Birth Weight 7-18
Infant Mortality 7-26
Breastfeeding 7-31
Postpartum Depression 7-37
Childhood Screening 7-47
Children and Youth with Special Health Care Needs 7-51
Children’s Emotional Development 7-59
Environmental Health 8-1
Safe Drinking Water 8-1
Environmental Pesticide Exposure 8-9
Air Quality 8-12
Children’s Environmental Health 8-27
Pennsylvania State Health Assessment, 2013 (2017 Update) Table of Contents iii
Arsenic in Groundwater
8-34
Healthcare Services 9-1
Primary Health Care 9-1
Patient-Centered Medical Home 9-13
Prenatal and Preconception Care 9-17
Dental Care 9-26
Behavioral Health Care 9-34
Hospitals 9-41
Emergency Medical Service System 9-45
Long Term Care 9-56
Hospice Care 9-58
Health Information Technology 9-61
Chronic Diseases 10-1
Coronary Heart Disease 10-1
Stroke (Cerebrovascular Disease) 10-9
Chronic Obstructive Pulmonary Disease 10-15
Asthma 10-18
Cancer 10-27
Diabetes 10-45
Chronic Kidney Disease 10-50
Organ and Tissue Donation and Transplantation 10-55
Arthritis 10-68
Osteoporosis 10-73
Alzheimer’s Disease 10-75
Opioids and Prescription Drug Monitoring Program 11-1
Opioid Deaths 11-1
Prescription Drug Monitoring Program (PDMP) 11-1
Enhanced State Opioid Overdose Surveillance and Emergency Departments 11-2
Prescription Drug Monitoring Program Interactive Data Report 11-10
Prescription Drug Monitoring Program Education Plan 11-11
Statewide Health Assessment Process A-1
Technical Notes B-1
Key Data Sources C-1
Pennsylvania State Health Assessment, 2013 (2017 Update) Acknowledgements iv
Acknowledgements The purpose of this section is to recognize the many people who have contributed time and talent to the development of this report. Any omission is unintentional.
A special thank you to the Pennsylvania Department of Health, Bureau of Health Statistics and Research staff for providing statistical support, charts and other information that was critical to making this document meaningful to the reader.
This publication was supported by the Cooperative Agreement Number U58CD001297 from the Centers for Disease Control and Prevention. Its contents are solely the responsibility of the authors and do not necessarily represent the official views of the Centers for Disease Control and Prevention.
Unless otherwise noted, the affiliation is the Pennsylvania State Department of Health. Affiliations are at the time the individual contributed to this report.
* Person was on State Health Assessment Advisory Committee (SHAAC) **Person was an alternate to the committee
Consultant
Erin Dugan, Policy Studies Consulting Editor
Heidi Hauser Green, Contractor Core Committee (project oversight)
Janet Bargh Susan Guy Ellen S. Bierbower Katrina Kyle Elizabeth Dunlevey Sirisha Reddy Linda Garay Laura Rostolsky
Statewide Health Assessment Advisory Committee* Caryn Carr Charles McElwee** Cindi Christ** Samuel Monismith Lynn Cooper Ana Nunez Lisa Davis Dennis Olmstead Ronald Dendas Hector Ortiz Barry Denk Lyneice Parker-
Hunter** Arthur DiLoreto Natalie Perrin** Karen Ford** Robert Richardson
Patrick Keating Cheri Rinehart David Kelly Candace Robertson- Kathleen Kennedy** James** Camille Kostelac-Cherry Jennifer Ross** Diane Kripas David Scott James Logue Arlene Seid Crystal Lowe Erica Smith** Kenneth Martz Kelly Thompson Marina Matthew Phuoc Tran
Cathy Utz Brian Wright** Context of Health
Larry Baronner Pennsylvania Office of Rural Health
Caryn Carr* Elizabeth Colacicco
The Center for Rural Pennsylvania Lisa Davis*
Pennsylvania Office of Rural Health Barry Denk*
The Center for Rural Pennsylvania Sean Gilfillan Jonathan Johnson
The Center for Rural Pennsylvania Kathleen Kennedy**
Pennsylvania Dental Association Charles McElwee**
Pennsylvania Dental Association Dennis Olmstead*
Pennsylvania Medical Society Tracy Wilcox
General Health Status
Ronald Dendas* Dorothy Rider Pool Health Care Trust
Linda Drummand Pennsylvania Community Providers Association
Timothy Golightly Devon D. Grant
Governor's Cabinet and Advisory Committee for People with Disabilities
Jonathan Johnson The Center for Rural Pennsylvania
Samuel Monismith* Pennsylvania State University, Harrisburg Campus
Major Risk and Protective Factors
Dale Adair Department of Public Welfare
Sophia Allen
Pennsylvania State Health Assessment, 2013 (2017 Update) Acknowledgements v
Betsy Aumiller Penn State College of Medicine
Mary Burns Lynn Cooper*
Pennsylvania Community Providers Association Ekaterina Dimitrova-Doichinva Theodore Fallon, Jr. Psychotherapy/Psychoanalysis/ Psychiatry Kathleen Kennedy**
Pennsylvania Dental Association Grace Kindt
Pennsylvania Department of Drug and Alcohol Programs
Diane Kripas* PA Department of Conservation and Natural Resources
Doris Lebischak Chester County Child and Adolescent Psychiatrist
Charles McElwee** Pennsylvania Dental Association
Samuel Monismith* Penn State University, Harrisburg Campus
Judy Ochs Candace Robertson-James**
Drexel University College of Medicine Dana Shope Alden Small Erica Smith Gail Snyder
The Center for Nutrition and Physical Activity Paul Westerberg
Pennsylvania Department of Public Welfare
Infectious Disease Sameh Boktor Kimberly Buffington Barbara Bungy
Drexel University College of Medicine, Beth Butler
Tracina Cropper CDC Federal Advisor Jill Foster Drexel University College of Medicine Elizabeth Hunt Steven Kowalewski CDC Federal Advisor Leah Lind James Logue* Perrianne Lurie Chandra Marriott
Maria Moll Kenneth McGarvey Atmaram Nambiar Godwin Obiri Diane Ollivier Stephen Ostroff James Rankin Owen Simwale Aaron Smee Heather Stafford Kim Warren Brian Wright**
Chronic Disease
Melissa Bronstetter Debra Brown
American Lung Association Patricia Bucek
The Kidney Foundation of Central PA Vadim Drobin Keri-Ann Faley Alan Fleegal Matthew Fogg
Drexel University College of Medicine Marshal Ma Cynthia Malinen Samuel Monismith*
Penn State University, Harrisburg Campus Howard M. Nathan
Gift of Life Donor Program Ana Nunez*
Drexel University College of Medicine Diane Ollivier Robert Rosenwasser
Thomas Jefferson University Michael Waltz Jeremy Zuckero
Injury and Violence
Carol Thornton- Section Lead Amy Flaherty Denise Getgen Pennsylvania Department of Aging Fern Gilkerson
Providence Coalition Against Domestic Violence Amy Grippi Department of Public Welfare
Allison Longenberger Rebecca May-Cole
Pennsylvania Behavioral Health and Aging Coalition
Pennsylvania State Health Assessment, 2013 (2017 Update) Acknowledgements vi
Natalie Perrin Pennsylvania Department of Public Welfare
Debra Sanders Pennsylvania Department of Drug and Alcohol Programs
Barbara Sheaffer Pennsylvania Coalition Against Rape
Brian Smith The Hospital & Healthsystem Association of PA
Ronald Tringali Monica Vaccaro
Brain Injury Association of Pennsylvania Micah Victoria Omar Zalatimo
Penn State University College of Medicine Maternal and Child Health
Jason Baxter Jefferson Medical School
Debra L. Bogen Children's Hospital of Pittsburgh
Luann Cartwright Robert Cicco
PA Preemie Network Cynthia Dundas Theodore Fallon, Jr. Psychotherapy/Psychoanalysis/Psychiatry Joseph Fay
Alliance of Pennsylvania Councils Kimberly Fitzpatrick
Pennsylvania Department of Drug and Alcohol Programs
Amy Flaherty John Gallagher
American Congress of Obstetricians and Gynecologists
Giselle Hallden Steven Heuer Linda Hock-Long
Family Planning Council Karen Kleiman
Post-Partum Stress Center Mary Marshall
The Hospital & Healthsystem Association of PA Noelle Matta
Family Eye Group, Lancaster, Pennsylvania Tony Norwood Katja Pigur
Maternity Care Coalition Amy Rothenberger David Silbert
Family Eye Group, Lancaster, Pennsylvania Stephen Smith
Abington Medical School, Pennsylvania Linda Snyder
Adagio Health
Environmental Health Robert Altenburg
Pennsylvania Department of Environmental Protection
Joseph Foner James Logue* James Rankin David Scott*
Pennsylvania Department of Agriculture Caryl Waggert
Healthy Homes Healthy Children Program, Allegheny College
Jayanth Devasundaram Healthcare Services
Larry Baronner Pennsylvania Office of Rural Health
Barbara Bloom Kent Bream
University of Pennsylvania Cheryl Bumgardner
Pennsylvania Association of Community Health Centers
Cindi Christ** Pennsylvania Association of Community Health Centers
Robert Cooney Catherine Curley Lisa Davis*
Pennsylvania Office of Rural Health Arthur DiLoreto**
Pennsylvania Association of Area Agencies on Aging
Theodore Fallon, Jr. Psychotherapy/Psychoanalysis/Psychiatry Amy Flaherty Juliet Geiger
Pennsylvania Trauma Systems Foundation David Grinberg
Pennsylvania eHealth Partnership Authority Giselle Hallden Kathleen Kennedy**
Pennsylvania Dental Association Crystal Lowe*
Pennsylvania State Health Assessment, 2013 (2017 Update) Acknowledgements vii
Pennsylvania Association of Area Agencies on Aging
Charles McElwee** Pennsylvania Dental Association
Marcela Myers Tony Norwood Dennis Olmstead*
Pennsylvania Medical Society Karen Paris
Hospice of Central Pennsylvania Robert Richardson Cheri Rinehart*
Pennsylvania Association of Community Health Centers
Robert Rosenwasser Thomas Jefferson University
Richard Sabbara Pennsylvania eHealth Partnership Authority
Arlene Seid* Kelly Thompson*
The Hospital & Healthsystem Association of PA Omar Zaltimo
Penn State University College of Medicine
Occupational Health Leanne Johnson
The Hershey Company James Logue* Michael Makowski Pete Phelan
Pennsylvania Department of Labor and Industry David Scott*
Pennsylvania Department of Agriculture
Pennsylvania State Health Assessment, 2013 (2017 Update) Acknowledgements viii
Acknowledgements 2017 Update Editor Mark Milliron Core Committee (project oversight) Janet Bargh Brian Lentes Diah Evasari Husnulkhotimah Bureau of Family Health Amy Flaherty Bureau of Health Promotion and Risk Reduction Marshal Ma Center For Rural Pa. Barry Denk Jonathan Johnson Department of Drug and Alcohol Programs Barbara Quinn Health Informatics Brian Wright Innovation Stephanie Rovito Prescription Drug Monitoring Program Office Meghna Patel Women Infants and Children Program Abigail Coleman
Center for Population Health Research, Lankenau Institute for Medical Research Sharon Larson Free Clinic Association of Pennsylvania Margaret Rivello Kelly Ranieli Lafayette College Khadijah A. Mitchell Bradbury-Sullivan LGBT Community Center Adrian Shanker Penn State University Caprice Knapp Pennsylvania Association of Area Agencies on Aging Rebecca May-Cole Pennsylvania Coalition for Oral Health Helen Hawkey Pennsylvania Office of Rural Health Lisa Davis Pennsylvania State Nurses Association Betsy Snook Pennsylvania Chapter of the American Planning Association Justin Dula Lancaster General Health Alice Yoder Young Center for Anabaptist and Pietist Studies, Elizabethtown College Steven Nolt
Pennsylvania State Health Assessment, 2013 List of Figures ix
List of Figures Number Title Page
Figure 1.1 Rural and Urban Counties, Pennsylvania, 2016 1-1
Figure 1.2 Population Change, Pennsylvania, 1960 to 2040 1-2
Figure 1.3 Population Change by County, Pennsylvania, 2010 to 2016 1-3
Figure 1.4 Population by Age Groups by Sex, Pennsylvania, 2016 1-4
Figure 1.5 Adults Age 65 Years and Older by County, Pennsylvania, 2016 1-5
Figure 1.6 Population by Age Groups and County, Pennsylvania, 2016 1-6
Figure 1.7 Population by Race and Ethnicity, Pennsylvania, 2016 1-7
Figure 1.8 Top Five Non-English Languages Spoken at Home by Pennsylvanians Five Years Old and Older by Department of Health Regions, 2015
1-9
Figure 1.9 Types of Households, Pennsylvania, 2016 1-10
Figure 1.10 Home Ownership, Pennsylvania and United States, 1980 to 2016 1-11
Figure 1.11 Home Ownership Rates by Race and Ethnicity, Pennsylvania, 2010 and 2016 1-12
Figure 1.12 Median Housing Values by County, Pennsylvania, 2016 1-13
Figure 1.13 Inflation-Adjusted Median Household Income, Pennsylvania and United States, 2000 to 2016
1-16
Figure 1.14 Median Household Income by County, Pennsylvania, 2016 1-17
Figure 1.15 Inflation Adjusted Median Household Income by Race and Ethnicity, Pennsylvania, 2010 and 2016
1-18
Figure 1.16 Poverty Rate by Race and Ethnicity, Pennsylvania, 2010 and 2015 1-19
Figure 1.17 Highest Level of Education by Adults 25 Years and Older, Pennsylvania, 2007 to 2011 1-20
Figure 1.18 Adults Age 25 and Older with a Bachelor’s Degree or Higher by County, Pennsylvania, 2006
1-21
Figure 1.19 Adults Age 25 and Older with Only a High School Diploma Equivalent by Race and Ethnicity, Pennsylvania, 2010 and 2016
1-22
Pennsylvania State Health Assessment, 2013 List of Figures x
Number Title Page
Figure 1.20 Adults Age 25 and Older with a Bachelor’s Degree or Higher by Race and Ethnicity, Pennsylvania, 2010 and 2016
1-23
Figure 1.21 Average Annual Unemployment Rates, Pennsylvania and United States, 2000 to 2016 1-24
Figure 1.22 Average Annual Unemployment Rate by County, Pennsylvania, 2016 1-25
Figure 1.23 Employment by Industry, Pennsylvania, 2011 1-26
Figure 1.24 Employment in Health Care and Social Assistance by County, Pennsylvania, 2016 1-27
Figure 1.25 Farm and Mining Employment in Pennsylvania, 2001 to 2016 1-28
Figure 1.26 Farm Employment by County, 2016 1-29
Figure 1.27 Employment in Mining, Quarrying and Oil/Gas Extraction by County, 2016 1-30
Figure 1.28 Reported Violent Crimes per 100,000 Population, Pennsylvania and United States, 2000 to 2016
1-31
Figure 1.29 Residents Under 65 Years Old Without Health Insurance, Pennsylvania and United States, 2006 to 2015
1-32
Figure 1.30 Adults Under 65 Years Old Without Health Insurance by County, Pennsylvania, 2016 1-33
Figure 1.31 Residents Under 21 Years Old Enrolled in Medicaid and Under 19 Years Old Enrolled in CHIP, Pennsylvania, July 2014 to June 2017
1-34
Figure 2.1 Adults Who Reported “Fair” or “Poor” General Health by Age, Pennsylvania, 2016 2-1
Figure 2.2 Adults Who Reported “Fair” or “Poor” General Health by Sex, Pennsylvania, 2016 2-1
Figure 2.3 Adults Who Reported “Fair” or “Poor” General Health by Race and Ethnicity, Pennsylvania, 2016
2-2
Figure 2.4 Adults Who Reported “Fair” or “Poor” General Health by Household Income, Pennsylvania, 2016
2-2
Figure 2.5 Adults Who Reported “Fair” or “Poor” General Health by Education, Pennsylvania, 2016 2-3
Figure 2.6 Death Rates, Pennsylvania and United States, 1950 to 2015 2-4
Figure 2.7 Deaths Due to Heart Disease and Cerebrovascular Disease, Pennsylvania, 2004 to 2015 2-8
Figure 2.8 Deaths by Age Group and Sex, Pennsylvania, 2015 2-8
Figure 2.9 Resident Deaths by Race and Ethnicity, Pennsylvania, 2015 2-9
Figure 2.10 Life Expectancy, Pennsylvania and United States, 2000 to 2013 2-10
Pennsylvania State Health Assessment, 2013 List of Figures xi
Number Title Page
Figure 2.11 Disability Type, Pennsylvania and United States, 2011 to 2015 2-12
Map 2.1 Map 2.1 2015 Pennsylvania Resident Deaths: Age-Adjusted Rates per 100,000 2-5
Map 2.1 Percent of Non-Institutionalized Residents with Disability by County, Pennsylvania, 2015
2-13
Figure 3.1 Percent of Adults Who Smoked Cigarettes, Pennsylvania, 2009 to 2011 3-2
Figure 3.2 Percent of Residents Who Smoked Cigarettes, by Age, Pennsylvania, 2010 and 2011 3-3
Figure 3.3 Percent of Youth Who Smoked Cigarettes, by Sex, Pennsylvania, 2010 3-3
Figure 3.4 Percent of Adults Who Smoked Cigarettes, by Sex, Pennsylvania, 2011 3-3
Figure 3.5 Percent of Adults Who Smoked Cigarettes, by Race and Ethnicity, Pennsylvania, 2011 3-4
Figure 3.6 Percent of Adults Who Smoked Cigarettes, by Household Income and Education, Pennsylvania, 2011
3-4
Figure 3.7 Young Lungs at Play Initiative Sign 3-7
Figure 3.8 BMI Calculation 3-9
Figure 3.9 Percent of Overweight and Obese Adults, Pennsylvania, 2000 to 2011 3-9
Figure 3.10 Percent of Overweight and Obese Adults by Health District, Pennsylvania, 2011 3-10
Figure 3.11 Fewer than Five Servings of Fruits/Vegetables Daily, Adults, Pennsylvania and United States, 2009
3-12
Figure 3.12 Participated in Recommended Amount of Physical Activity, Adults, Pennsylvania, 2001, 2003, 2005, 2007, 2009
3-15
Figure 3.13 Participated in Recommended Amount of Physical Activity, by Age Group, Adults, Pennsylvania, 2011
3-16
Figure 3.14 Participated in Recommended Amount of Physical Activity by Sex and Race, Adults, Pennsylvania, 2011
3-16
Figure 3.15 Participated in Recommended Amount of Physical Activity by Income and Education, Adults, Pennsylvania, 2011
3-17
Figure 3.16 MyPlate Nutrition Guidance, U.S. Department of Agriculture 3-19
Figure 3.17 Reported Eating Five or More Servings of Fruits/Vegetables Daily by Age, Adults, Pennsylvania, 2009
3-20
Figure 3.18 Reported Eating Five or More Servings of Fruits/Vegetables Daily by Sex, Adults, Pennsylvania, 2009
3-20
Pennsylvania State Health Assessment, 2013 List of Figures xii
Number Title Page
Figure 3.19 Reported Eating Five or More Servings of Fruits/Vegetables Daily by Race and Ethnicity, Adults, Pennsylvania, 2009
3-20
Figure 3.20 Reported Eating Five or More Servings of Fruits/Vegetables Daily by Household Income, Adults, Pennsylvania, 2009
3-21
Figure 3.21 Reported Eating Five or More Servings of Fruits/Vegetables Daily by Education Level, Adults, Pennsylvania 2009
3-21
Figure 3.22 Substance Abuse and Dependence Treatment, 2010-2011 3-23
Figure 3.23 Youth Perception of Risk for Five or More Alcoholic Beverages Once or Twice a Week, Pennsylvania, 2007, 2008, 2009, 2010, 2011
3-27
Figure 3.24 Visited a Dentist in the Past 12 Months by Age Group, Adults, Pennsylvania, 2010 3-32
Figure 3.25 Visited a Dentist in the Past 12 Months by Sex, Adults, Pennsylvania, 2010 3-33
Figure 3.26 Visited a Dentist in the Past 12 Months by Race and Ethnicity, Adults, Pennsylvania, 2010
3-33
Figure 3.27 Visited a Dentist in the Past 12 Months by Household Income, Adults, Pennsylvania, 2010
3-34
Figure 3.28 Visited a Dentist in the Past 12 Months by Education, Adults, Pennsylvania, 2010 3-34
Figure 4.1 Occupational Fatalities by Selected Events, Pennsylvania and the United States, 2011 4-2
Figure 4.2 Distribution of Non-fatal Injuries and Illnesses Involving Days Away From Work, Private Industry, Pennsylvania, 2011
4-3
Figure 4.3 Blood Lead Testing by Industrial Sector for Workers Age 16 and Older, Pennsylvania, 2010 to 2012
4-7
Figure 4.4 Industry Sectors with Blood Lead Levels ≥ 25 µg/dL, Pennsylvania, 2010-2012 4-7
Figure 5.1 Reported Cases of Chlamydia, Pennsylvania, 1994 to 2012 5-1
Figure 5.2 Reported Cases of Gonorrhea, Pennsylvania, 1994 to 2012 5-2
Figure 5.3 Reported Cases of Primary and Secondary Syphilis, Pennsylvania, 1994 to 2012 5-3
Figure 5.4 Reported Cases of AIDS and HIV Without AIDS by Year of Diagnosis, Pennsylvania, 1980-2011
5-6
Figure 5.5 Reported Cases of AIDS and HIV Without AIDS by Current Vital Status and Year of Diagnosis, Pennsylvania, 1993 to 2011
5-7
Figure 5.6 Incidence of Acute Hepatitis A per 100,000 Population, Pennsylvania, 2000 to 2011 5-14
Pennsylvania State Health Assessment, 2013 List of Figures xiii
Number Title Page
Figure 5.7 Reported Cases of Acute Hepatitis A by County, Pennsylvania, 2011 5-15
Figure 5.8 Incidence of Acute Hepatitis B per 100,000 Population, Pennsylvania, 2006 to 2011 5-17
Figure 5.9 Incidence of Chronic and Unspecified Hepatitis B per 100,000 Population, Pennsylvania, 2006 to 2011
5-18
Figure 5.10 Reported Cases of Chronic Hepatitis B by County, per 100,000 Population, Pennsylvania, 2011
5-18
Figure 5.11 Incidence of Acute Hepatitis C per 100,000 Population, Pennsylvania, 2006 to 2011 5-20
Figure 5.12 Incidence of Past or Present Hepatitis C, 15 to 34 Age Group and All Ages, per 100,000 Population, Pennsylvania, 2006 to 2011
5-21
Figure 5.13 Reported Cases of Chronic Hepatitis C by County with Locations of State Correctional Facilities, Pennsylvania, 2011
5-21
Figure 5.14 Healthcare Associated Infections by Category, Pennsylvania, 2009 to 2011 5-23
Figure 5.15 Healthcare Associated Infections by Type and Age Group, Pennsylvania, 2010 5-24
Figure 5.16 Healthcare Associated Infections by Type and Race and Ethnicity, Pennsylvania, 2010 5-25
Figure 5.17 MRSA by Infection Type in Hospitals, Pennsylvania, 2008 to 2011 5-27
Figure 5.18 West Nile Virus, Human Cases, Pennsylvania, 2000 to 2012 5-30
Figure 5.19 Incidence Rates of West Nile Virus, Human Cases, Pennsylvania and United States, 2000 to 2012
5-31
Figure 5.20 Incidence Rates of Lyme Disease by County, Pennsylvania, 2007 to 2011 5-33
Figure 5.21 Incidence Rates of Lyme Disease by Region, Pennsylvania, 1980 to 2011 5-34
Figure 5.22 Confirmed and Probable Cases of Lyme Disease by Month, Pennsylvania, 2010 5-34
Figure 5.23 Reported Cases of Animal Rabies, Pennsylvania, 2007 to 2011 5-37
Figure 5.24 Animal Rabies Cases by Month, Pennsylvania 2007 to 2011 5-37
Figure 5.25 Animal Rabies Cases by Species, Pennsylvania, 2007 to 2011 5-38
Figure 5.26 Animal Rabies Cases by County, Pennsylvania, 2011 5-38
Figure 5.27 Reported Cases of Legionellosis, Pennsylvania, 2007 to 2011 5-40
Figure 5.28 Legionellosis Cases by Month, Pennsylvania, 2011 5-41
Figure 5.29 Legionellosis Cases by County, Pennsylvania, 2011 5-41
Pennsylvania State Health Assessment, 2013 List of Figures xiv
Number Title Page
Figure 5.30 Confirmed and Probable Cases of Salmonella by Month, Pennsylvania, 2011 5-43
Figure 5.31 Confirmed and Probable Cases of Salmonella by County, Pennsylvania, 2011 5-44
Figure 5.32 Confirmed Cases of Campylobacteriosis, Pennsylvania, 2007 to 2011 5-47
Figure 5.33 Confirmed Cases of Campylobacteriosis by Month, Pennsylvania, 2011 5-47
Figure 5.34 Reported Cases of STEC, Pennsylvania, 2006 to 2010 5-49
Figure 5.35 STEC Cases by Month, Pennsylvania, 2010 5-50
Figure 5.36 STEC Cases by Month, Pennsylvania, 2006 to 2010 5-50
Figure 5.37 STEC Cases, Number and Incidence Rate by Age Group, Pennsylvania, 2010 5-51
Figure 5.38 STEC Cases by Serotype, Pennsylvania, 2010 5-51
Figure 5.39 Confirmed Cases of Measles, Mumps, and Rubella, Pennsylvania, 2000 to 2011 5-54
Figure 5.40 Confirmed and Probable Cases of Pertussis by Month of Onset, Pennsylvania, 2011 5-55
Figure 5.41 Confirmed Pertussis Cases by Age Group, Pennsylvania, 2011 5-55
Figure 5.42 Confirmed Cases of Haemophilus Influenzae Invasive Disease, Pennsylvania, 2000 to 2011
5-56
Figure 5.43 Cases of Haemophilus Influenzae Type B in Children Younger than 5 Years, Pennsylvania, 2000 to 2011
5-56
Figure 5.44 Multi-Season Comparison of Reported Lab-Positive Influenza Cases, Pennsylvania, 2007-08 Season to 2012-13 Season
5-58
Figure 5.45 Circulating Influenza Subtypes, Pennsylvania, 2012-13 Season 5-59
Figure 6.1 Deaths by Injury, Non-Communicable Disease, Infectious Disease for Residents Aged 1 to 44, Pennsylvania, 2010
6-1
Figure 6.2 Deaths by Unintentional Injury and Cause, Pennsylvania, 1990 to 2010 6-4
Figure 6.3 Deaths Due to Falls by Rate and Age, Pennsylvania, 1990 to 2010 6-4
Figure 6.4 Hospitalizations Due to Falls by Age and Sex, Pennsylvania, 2010 6-5
Figure 6.5 Deaths Due to Motor Vehicle Accidents, Pennsylvania, 1990-2010 6-5
Figure 6.6 Motor Vehicle Accidents by Driver Age and Sex, with Hospitalizations, Pennsylvania, 2010
6-6
Pennsylvania State Health Assessment, 2013 List of Figures xv
Number Title Page
Figure 6.7 Deaths Due to Unintentional Drug Poisoning, with Opioid Prescriptions, Pennsylvania, 1990 to 2010
6-6
Figure 6.8 Deaths Due to Unintentional Drug Poisoning and Motor Vehicle Accidents, Males, Pennsylvania, 2010
6-7
Figure 6.9 Hospitalizations Due to Fire and Burns by Age, Pennsylvania, 2010 6-7
Figure 6.10 Hospitalizations and Deaths Due to Drowning by Age Group, Pennsylvania, 2010 6-8
Figure 6.11 Leading Causes of Homicides and Assaults, Pennsylvania, 2010 6-12
Figure 6.12 Deaths by Suicide, Three-Year Rates, Pennsylvania, 1998 to 2010 6-13
Figure 6.13 Leading Causes of Suicides and Self-Inflicted Hospitalizations, Pennsylvania, 2010 6-13
Figure 6.14 Sexual Violence to Adults, Pennsylvania, 2008-2009 to 2011-2012 (Fiscal Years) 6-14
Figure 6.15 Sexual Violence to Children, Pennsylvania, 2008-2009 to 2011-2012 (Fiscal Years) 6-14
Figure 6.16 Deaths Due to Domestic Violence by Sex of Victim, Pennsylvania, 2003 to 2012 6-15
Figure 6.17 Deaths Due to Domestic Violence by Sex of Perpetrator, Pennsylvania, 2003 to 2012 6-15
Figure 6.18 Child Abuse Reports, Pennsylvania, 2002 to 2011 6-16
Figure 6.19 Older Adult Abuse and Neglect Reports, Pennsylvania, 2008-2009, 2009-2010, and 2010-2011 (Fiscal Years)
6-17
Figure 6.20 Traumatic Brain Injury Hospitalizations, Pennsylvania, 2000 to 2010 6-21
Figure 6.21 Traumatic Brain Injury Hospitalizations by Cause, Pennsylvania, 2000 to 2010 6-22
Figure 6.22 Mean and Median Ages of Traumatic Brain Injuries, Pennsylvania, 2000 to 2010 6-22
Figure 6.23 Traumatic Brain Injury Hospitalization Rates by Age Group, Pennsylvania, 2000 to 2010 6-23
Figure 6.24 Traumatic Brain Injury Age-Adjusted Hospitalization Rates by Sex, Pennsylvania, 2000 to 2010
6-23
Figure 6.25 Traumatic Brain Injury Hospitalization Rates by Sex and Age Group, 2000 to 2010 6-24
Figure 6.26 Traumatic Brain Injury Rates of Death by Age Group, Pennsylvania, 2000 to 2010 6-26
Figure 6.27 Traumatic Brain Injury Rates of Death by Sex and Age Group, Pennsylvania, 2000 to 2010
6-26
Figure 7.1 Estimated Unintended and Unwanted Pregnancies, Pennsylvania, 2007 to 2010 7-4
Figure 7.2 Trends in Family Planning Users by Age Groups, Females, Pennsylvania, 2010 to 2012 7-8
Pennsylvania State Health Assessment, 2013 List of Figures xvi
Number Title Page
Figure 7.3 Teen Birth Rates by Race and Ethnicity, Ages 15 to 19, Females, Pennsylvania, 2008 to 2010
7-10
Figure 7.4 Geographic Distribution of Teen Births, Females Ages 15 to 19, Pennsylvania 2010 7-11
Figure 7.5 Teen Pregnancy by Race and Ethnicity and Age Groups, Females, Pennsylvania, 2010 7-12
Figure 7.6 Geographic Distribution of Teen Pregnancy, Females Ages 18 and 19, Pennsylvania 2010
7-12
Figure 7.7 Births with Maternal STD Infection Present or Treated and Age Group, Pennsylvania, 2006 to 2010
7-14
Figure 7.8 Births with Abnormal Conditions in the Newborn Period by Maternal Age Group, Pennsylvania, 2006 to 2010
7-14
Figure 7.9 Preterm Births by Race and Ethnicity, Pennsylvania, 2006 to 2010 7-20
Figure 7.10 Low Birth Weight Birth Rates by Race and Ethnicity, Pennsylvania, 2006 to 2010 7-21
Figure 7.11 Very Low Birth Weight Birth Rates by Race and Ethnicity, Pennsylvania, 2006 to 2010 7-21
Figure 7.12 Preterm Births by Maternal Age, Pennsylvania, 2006 to 2010 7-22
Figure 7.13 Low Birth Weight Births by Maternal Age, Pennsylvania, 2006 to 2010 7-22
Figure 7.14 Infant Mortality Rates by Race and Ethnicity, Pennsylvania, 2006 and Healthy People 2020 Goal
7-26
Figure 7.15 Neonatal Mortality Rates by Race and Ethnicity, Pennsylvania, 2006 to 2010 7-27
Figure 7.16 Post-neonatal Mortality Rates by Race and Ethnicity, Pennsylvania, 2006 to 2010 7-27
Figure 7.17 Infants Ever Breastfed, by County, Pennsylvania, 2010 7-32
Figure 7.18 Infants Ever Breastfed, Pennsylvania, 2003 to 2010 7-32
Figure 7.19 Breastfeeding Initiation by Race and Ethnicity, Pennsylvania, 2003 to 2010 7-33
Figure 7.20 Rates of Frequent Postpartum Depressive Symptoms, Self-Report by Mothers, 2007 to 2008
7-38
Figure 7.21 Rates of Frequent Postpartum Depression Symptoms, Pennsylvania, 2007 and 2008 7-38
Figure 7.22 Pregnancy Rates, Females Ages 15 to 19, Pennsylvania, 2008 to 2010 7-39
Figure 7.23 Rates of Postpartum Depression by Maternal Age, Pennsylvania, 2007 and 2008 7-40
Figure 7.24 Rates of Postpartum Depression by Race and Ethnicity, Pennsylvania, 2007 and 2008 7-40
Pennsylvania State Health Assessment, 2013 List of Figures xvii
Number Title Page
Figure 7.25 Rates of Postpartum Depression by Household Income Below $10,000, 2007 and 2008 7-41
Figure 7.26 Rates of Postpartum Depression by Prenatal Care Type, 2007 and 2008 7-41
Figure 7.27 Postpartum Depression Rates by Marital Status, 2007 and 2008 7-42
Figure 7.28 Pennsylvania Growth Screening Regulations 7-48
Figure 7.29 Children Ages 0 to 17 by Special Health Care Needs Status, and Race and Ethnicity, Pennsylvania, 2009-2010
7-53
Figure 7.30 Children Ages 0 to 17 with Special Health Care Needs, by Household Income, Pennsylvania and United States, 2009 to 2010
7-54
Figure 7.31 Children Ages 0 to 17 with Special Health Care Needs, by Highest Education Level in Household, Pennsylvania and United States, 2009 to 2010
7-54
Figure 8.1 Pennsylvania Water Systems and Population Served by Size Category, Pennsylvania, 2011
8-1
Figure 8.2 Public Water Systems by Source and System Type, Pennsylvania, 2011 8-6
Figure 8.3 Public Water Systems, Users by Source Type, Pennsylvania, 2011 8-7
Figure 8.4 Pesticide Exposures by Age, Pennsylvania, 2011 8-10
Figure 8.5 Medical Outcomes of Pesticide Exposures with Follow Up Calls, Pennsylvania, 2011 8-11
Figure 8.6 Fourth Highest Maximum Daily 8-Hour Ozone Concentrations, DEP-Monitored Counties, Pennsylvania, 2011
8-13
Figure 8.7 Second-Highest Maximum Daily 1-Hour Ozone Concentrations, DEP-Monitored Counties, Pennsylvania, 2011
8-13
Figure 8.8 Trends in Fourth-Highest Maximum Daily 8-Hour Ozone Concentrations, Averages in Parts Per Million, DEP-Monitored MSA Regions, Pennsylvania, 2011
8-14
Figure 8.9 Trends in Second-Highest Maximum Daily 1-Hour Ozone Concentrations, Averages in Parts Per Million, DEP-Monitored MSA Regions, Pennsylvania, 2011
8-15
Figure 8.10 Annual Mean Concentrations of PM2.5, DEP-Monitored Counties, Pennsylvania, 2011 8-16
Figure 8.11 98th Percentiles of 24-Hour PM2.5 Concentrations, DEP-Monitored Counties, Pennsylvania, 2011
8-16
Figure 8.12 Trends in Three-Year Averages of Annual Means for PM2.5 Concentrations, DEP-Monitored MSA Regions, Pennsylvania, 2002 to 2011
8-17
Pennsylvania State Health Assessment, 2013 List of Figures xviii
Number Title Page
Figure 8.13 Trends in Three-Year Averages of 98th Percentile 24-Hour PM2.5 Concentrations, DEP-Monitored MSA Regions, Pennsylvania, 2002 to 2011
8-18
Figure 8.14 Second-Highest Maximum Daily 24-Hour PM10 Concentrations, DEP-Monitored Counties, Pennsylvania, 2011
8-19
Figure 8.15 Trends in Second-Highest Maximum Daily 24-Hour PM10 Concentrations, MSA Regions, Pennsylvania, 2002 to 2011
8-19
Figure 8.16 99th Percentiles of 1-Hour Sulfur Dioxide Concentrations, DEP-Monitored Counties, Pennsylvania, 2011
8-20
Figure 8.17 Trends in Three-Year Averages of 99th Percentile 1-Hour Sulfur Dioxide Concentrations, DEP-Monitored MSA Regions, Pennsylvania, 2002 to 2011
8-21
Figure 8.18 Annual Mean Concentrations of Nitrogen Dioxide, DEP-Monitored Counties, Pennsylvania, 2011
8-22
Figure 8.19 98th Percentiles of 1-Hour Nitrogen Dioxide Concentrations, DEP-Monitored Counties, Pennsylvania, 2011
8-22
Figure 8.20 Trends in Nitrogen Dioxide Concentrations, DEP-Monitored MSA Regions Pennsylvania, 2002 to 2011
8-23
Figure 8.21 Second-Highest Maximum 8-Hour Running Mean, Ten-Year Trends in Carbon Monoxide, DEP-Monitored MSA Regions, Pennsylvania, 2002 to 2011
8-24
Figure 8.22 Trend in Maximum 3-Month Average of 24-Hour Mean Lead Concentrations, DEP Monitors Statewide, Pennsylvania, 2002 to 2011
8-25
Figure 8.23 Children < 72 Months of Age Tested for Lead, Pennsylvania, 2008 to 2011 8-27
Figure 8.24 Children < 72 Months of Age with Elevated Blood Lead Levels of ≥ 10 µg/dL, Pennsylvania, 2008 to 2011
8-28
Figure 8.25 Mean Blood Lead Levels of Children < 72 Months of Age Tested for Lead Exposure, Pennsylvania, 2008 to 2011
8-28
Figure 8.26 Elevated Blood Lead Levels, Children < 72 Months of Age, Pennsylvania and United States, 2006 to 2011
8-28
Figure 8.27 Distribution of Confirmed Elevated Blood Lead Levels by County, Pennsylvania, 2011 8-30
Figure 8.28 Arsenic Probability Map, Pennsylvania 8-35
Figure 9.1 Primary Care Physicians per 100,000 Population, United States, 2010 9-3
Pennsylvania State Health Assessment, 2013 List of Figures xix
Number Title Page
Figure 9.2 Primary Care Residents and Fellows per 100,000 Population, United States, 2010 9-3
Figure 9.3 Primary Care Physicians per 100,000 Population by County, Pennsylvania, 2010 9-4
Figure 9.4 Residents without a Personal Health Care Provider, Pennsylvania, 2007 to 2011 9-5
Figure 9.5 Residents Who Could Not Receive Care Due to Cost, by Household Income, Pennsylvania, 2007 to 2011
9-5
Figure 9.6 Population in Primary Care, Dental, and Mental Health HPSAs, Pennsylvania, United States, 2012
9-7
Figure 9.7 Number of Sites with NCQA PCMH Recognition, Pennsylvania, 2012 9-15
Figure 9.8 Number of County Residents per PCMH Site, Pennsylvania, 2012 9-15
Figure 9.9 Births to Mothers Who Reported No Prenatal Care, Pennsylvania, 2005 to 2010 9-17
Figure 9.10 Births to Mothers Who Obtained Prenatal Care During First Trimester, Pennsylvania, 2007 to 2010
9-17
Figure 9.11 Births by Maternal Age, Pennsylvania, 2008 to 2010 9-19
Figure 9.12 Births to Mothers Who Received No Prenatal Care, Pennsylvania, 2008 to 2010 (3-Year Summary)
9-20
Figure 9.13 Births to Mothers Who Obtained Prenatal Care During the First Trimester by Maternal Age, Pennsylvania, 2008 to 2010 (3-Year Summary)
9-20
Figure 9.14 Births to Mothers Who Obtained Prenatal Care During the First Trimester by Race and Ethnicity, Pennsylvania, 2005 to 2010
9-21
Figure 9.15 Barriers to Prenatal Care, Pennsylvania, 2007 and 2008 9-22
Figure 9.16 Prenatal Care by Pregnancy Intention, Pennsylvania, 2007 to 2008 9-23
Figure 9.17 Assessment of Pennsylvania’s Policy and Programs for Dental Health of Children 9-27
Figure 9.18 Children Receiving Dental Care by Type of Insurance, Pennsylvania, 2000 to 2009 9-28
Figure 9.19 Designated Dental Health Professional Shortage Areas, Pennsylvania, 2012 9-29
Figure 9.20 Dental Coverage Accepted by General Dentists Providing Direct Patient Care, Pennsylvania, 2011
9-30
Figure 9.21 Locations Where Dental Hygienists Provided Care to Uninsured or Uninsured Residents (Not Including Primary Job)
9-30
Figure 9.22 State Hospital Mental Health Patients, Pennsylvania, 2000 to 2009 9-35
Pennsylvania State Health Assessment, 2013 List of Figures xx
Number Title Page
Figure 9.23 HealthChoices Behavioral Health Program Zones, 2010 9-35
Figure 9.24 Licensed Hospitals, Pennsylvania, 2002 to 2011 9-41
Figure 9.25 Critical Access Hospitals, Pennsylvania, 2013 9-43
Figure 9.26 Leading Mechanisms of Injury, Pennsylvania, 2002 to 2011 9-46
Figure 9.27 Trauma Patient Cases and Mortality , Pennsylvania, 2002 to 2011 9-47
Figure 9.28 Access to Trauma Centers Within 60 Minutes by Air Transport, 2013 9-47
Figure 9.29 Access to Trauma Centers Within 60 Minutes by Ground Transport, 2013 9-48
Figure 9.30 Geriatric Patients of Trauma Centers, Pennsylvania, 2011 9-49
Figure 9.31 Accredited Stroke Centers, Pennsylvania, 2013 9-50
Figure 9.32 Heart Disease Death Rates by County, Adults Age ≥ 35, United States, 2007 to 2009 9-51
Figure 9.33 Adult Cardiac Catheterization Labs by County, Pennsylvania, 2011 9-52
Figure 9.34 Health Information Exchange Connectivity Model, Pennsylvania, 2014 9-64
Figure 9.35 Health Information Exchanges by County, Pennsylvania, 2014 9-65
Figure 10.1 Coronary Health Disease, Age-Adjusted Mortality Rate by Race and Ethnicity, Pennsylvania, 2001 to 2010
10-1
Figure 10.2 Coronary Heart Disease, Age-Adjusted Mortality Rate by Sex, Pennsylvania, 2001 to 2010
10-2
Figure 10.3 Coronary Heart Disease, Age-Adjusted Mortality Rate by Age Group, Pennsylvania, 2008 to 2010 Combined
10-2
Figure 10.4 Coronary Heart Disease, Age-Adjusted Mortality Rates by County, 2008 to 2010 Combined
10-3
Figure 10.5 Hospitalizations due to Coronary Heart Disease , Pennsylvania, 2000 to 2011 10-3
Figure 10.6 Hospitalizations due to Coronary Heart Disease, Cases and Age-adjusted Rates, Pennsylvania, 2000 to 2011
10-4
Figure 10.7 Coronary Heart Disease, Age-adjusted Hospitalization Rates by Sex, Pennsylvania, 2000 to 2011
10-4
Figure 10.8 Stroke, Age-Adjusted Mortality Rate by Sex, Pennsylvania, 2001 to 2010 10-9
Pennsylvania State Health Assessment, 2013 List of Figures xxi
Number Title Page
Figure 10.9 Stroke, Age-Adjusted Mortality Rate by Race and Ethnicity, Pennsylvania, 2001 to 2010 10-9
Figure 10.10
Stroke, Age-Adjusted Mortality Rate by Age Group, Pennsylvania, 2008 to 2010 Combined
10-10
Figure 10.11
Stroke, Age-Adjusted Mortality Rates by County, 2008 to 2010 Combined 10-10
Figure 10.12
Hospitalizations due to Stroke, Pennsylvania, 2000 to 2011 10-11
Figure 10.13
Age-Adjusted Rates of Hospitalization due to Stroke, by Race and Ethnicity, 2000 to 2011
10-11
Figure 10.14
Age-Adjusted Rates of Hospitalization due to Stroke, by Sex, 2000 to 2011 10-12
Figure 10.15
Hospitalizations due to Stroke, Cases and Age-adjusted Rates, Pennsylvania, 2000 to 2011
10-12
Figure 10.16
COPD and Impaired Lung Function, United States, 2011 10-15
Figure 10.17
Diagnosed with COPD, Emphysema, or Chronic Bronchitis, by Age Groups and Sex, Pennsylvania 2011
10-15
Figure 10.18
COPD, Age-Adjusted Mortality Rate and Cases, Pennsylvania, 1999 to 2010 10-16
Figure 10.19
COPD, Age-Adjusted Mortality Rate by Sex, Pennsylvania, 2010 10-16
Figure 10.20
Adult Self-Reported Current Asthma Prevalence Estimates by Race, Pennsylvania and United States, 2006 to 2010
10-18
Figure 10.21
Child Current Asthma Prevalence Estimates by Sex, Pennsylvania and United States, 2006 to 2010
10-19
Figure 10.22
Lifetime Asthma Prevalence among School Students, Pennsylvania, 1999-2000 to 2010-2011
10-20
Figure 10.23
Percent of Adults with Asthma Who Had an Asthma Episode Attack in the Past Year, Pennsylvania, 2010
10-21
Figure 10.24
Percent of Adults with Asthma Who Were Unable to Work or Do Usual Activities ≥ Once In the Past Year, Pennsylvania, 2010
10-21
Figure 10.25
Trends of Inpatient Hospitalization with Asthma as the Primary Discharge Diagnosis, by Race and Ethnicity, Pennsylvania, 2001 to 2010
10-22
Pennsylvania State Health Assessment, 2013 List of Figures xxii
Number Title Page
Figure 10.26
Rates of Inpatient Hospitalization with Asthma as the Primary Discharge Diagnosis Among Children and Adults, Pennsylvania, 2006 to 2010
10-23
Figure 10.27
Admission Types for Inpatient Hospitalizations with Asthma as the Primary Discharge Diagnosis, Pennsylvania, 2006 to 2010 Combined
10-23
Figure 10.28
Average Charges per Inpatient Hospitalization with Asthma as the Primary Discharge Diagnosis, Children and Adults, Pennsylvania, 2006 to 2010
10-24
Figure 10.29
Age-Adjusted Asthma Death Rates, Pennsylvania, 2000 to 2010 10-24
Figure 10.30
Projected Daily Cancer Cases and Deaths for Major Primary Cancer Sites, Males, Pennsylvania, 2012
10-28
Figure 10.31
Projected Daily Cancer Cases and Deaths for Major Primary Cancer Sites, Females, Pennsylvania, 2012
10-28
Figure 10.32
Age-Adjusted Invasive Cancer Incidence Rates by Sex, Pennsylvania, 1999 to 2009 10-29
Figure 10.33
Incidence of Invasive Cancer by Type, Pennsylvania and United States, 1999 to 2009 10-30
Figure 10.34
Age-Adjusted Invasive Cancer Death Rates by Sex, Pennsylvania, 1999 to 2010 10-32
Figure 10.35
Age-Adjusted Invasive Cancer Incidence and Death Rates by Race, Pennsylvania, 1999 to 2010
10-33
Figure 10.36
Mortality of Invasive Cancer by Type, Pennsylvania and United States, 1999 to 2009 10-33
Figure 10.37
Cancer Cases by Stage at Diagnosis, Pennsylvania, 1999 and 2009 10-35
Figure 10.38
Cancer Cases by Stage at Diagnosis, by Sex, Pennsylvania, 2009 10-35
Figure 10.39
Cancer Cases by Stage at Diagnosis, by Race and Ethnicity, Pennsylvania, 2009 10-36
Figure 10.40
Cancer Cases by Stage at Diagnosis, Black Residents, Pennsylvania, 1999 and 2009 10-36
Figure 10.41
Selected Behavioral Risk Factors by Race, Pennsylvania, 2010 and 2011 10-37
Pennsylvania State Health Assessment, 2013 List of Figures xxiii
Number Title Page
Figure 10.42
Prevalence of Diagnosed Diabetes, Adults, Pennsylvania, 1995 to 2010 10-45
Figure 10.43
Prevalence of Chronic Kidney Disease by Age Group, Adults, United States, 2000 to 2008
10-50
Figure 10.44
Age-adjusted Incident Rate of End-Stage Renal Disease by Race and Ethnicity, Adults, United States, 1980 to 2009
10-51
Figure 10.45
Age-adjusted Kidney Disease Death Rate by Age Group, Adults, Pennsylvania, 2008 to 2010 Combined
10-52
Figure 10.46
Age-adjusted Renal Failure Death Rate by Race and Ethnicity, Pennsylvania, 2001 to 2010
10-52
Figure 10.47
Organs and Tissues for Donation 10-55
Figure 10.48
Candidates Waiting for an Organ Transplant at Year End, Pennsylvania, 2003 to 2012 10-56
Figure 10.49
Candidates Waiting for Abdominal Organ Transplant at Year End, Pennsylvania, 2003 to 2012
10-57
Figure 10.50
Candidates Waiting for Cardiothoracic Organ Transplant at Year End, Pennsylvania, 2003 to 2012
10-57
Figure 10.51
Candidates Waiting for Organ Transplant by Organ and Wait, Pennsylvania, 2013 10-58
Figure 10.52
Organ Procurement Organization Service Areas by County, Pennsylvania 10-60
Figure 10.53
Organ Procurement Organization Service Areas, United States 10-61
Figure 10.54
Deceased Donors by Organ Procurement Organization, Pennsylvania, 1994 to 2012 10-61
Figure 10.55
Organs Recovered for Transplant from Deceased Donors by Organ Procurement Organizations, Pennsylvania, 1994 to 2012
10-62
Figure 10.56
Organ and Tissue Donation Process 10-63
Figure 10.57
Adult Arthritis Diagnoses by Race and Ethnicity, Pennsylvania, 2011 10-68
Pennsylvania State Health Assessment, 2013 List of Figures xxiv
Number Title Page
Figure 10.58
Arthritis Hospitalizations by Type, Pennsylvania, 2000 to 2011 10-69
Figure 10.59
Age-adjusted Rates of Arthritis Hospitalization, Pennsylvania, 2000 to 2011 10-69
Figure 10.60
Age-adjusted Arthritis Hospitalizations Rates by Sex, Pennsylvania, 2000 to 2011 10-70
Figure 10.61
Age-Adjusted Arthritis Hospitalization Rates by Race and Ethnicity, Pennsylvania, 2000 to 2011
10-70
Figure 10.62
Charges by Insurance Type for Arthritis Hospital Admissions, Pennsylvania, 2000 to 2011
10-71
Figure 10.63
Diagnosed with Osteoporosis, Women Age 50 and Older, Pennsylvania, 2008 10-73
Figure 10.64
Age-adjusted Alzheimer’s Disease Death Rate by Sex, Pennsylvania, 2001 to 2010 10-75
Figure 10.65
Deaths Due to Alzheimer’s Disease, by Sex, Pennsylvania, 2010 10-75
Figure 10.66
Age-adjusted Death Rate for Alzheimer’s Disease by Age Group, Pennsylvania, 2008 to 2010 Combined
10-76
Figure 10.67
Age-adjusted Death Rate for Alzheimer’s Disease by Race and Ethnicity, Pennsylvania, 2001 to 2010
10-76
Figure 10.68
Age-adjusted Alzheimer’s Disease Death Rate by County, 2008 to 2011 Combined 10-77
Figure 11.1 Percent of Emergency Visits Related to Suspected Overdose of Any Drug, Suspected Overdose of Any Opioid, and Suspected Overdose of Heroin*
11-2
Figure 11.2 Percent of Emergency Department Visits Related to Suspected Overdose of Any Drug* by Age
11-3
Figure 11.3 Percent of Emergency Department Visits Related to Suspected Overdose of Any Opioid* by Age
11-3
Figure 11.4 Percent of Emergency Department Visits Related to Suspected Overdose of Heroin* by Age
11-4
Figure 11.5 Percent of Emergency Department Visits Related to Suspected Overdose of Any Drug, Any Opioid, or Heroin* by Gender
11-4
Pennsylvania State Health Assessment, 2013 List of Figures xxv
Number Title Page
Figure 11.6 Counties Targeted for Prescription Drug Monitoring Program Education and Outreach Were Selected Based on the Analysis as Described in This Graph
11-11
Pennsylvania State Health Assessment, 2013 Key Health Findings At-A-Glance xxvi
List of Tables Number Title Page Table 1.1 Population Density by County, Pennsylvania, 2016 1-3
Table 1.2 Population by Race and Ethnicity, Pennsylvania, 2010 and 2016 1-8
Table 1.3 Top 10 Non-English Languages Spoken at Home by Pennsylvanians Five Years Old and Older, 2015
1-9
Table 1.4 Economic Indicators by County, Pennsylvania, 2016 and 2017 1-14
Table 1.5 Health Insurance Coverage, Pennsylvania and United States, 2016 1-34
Table 1.6 Percentage of Monthly Average of Managed Care Enrollment, Pennsylvania, 2016/2017 1-35
Table 1.7 Private Insurance Providers by County, Pennsylvania, 2017 1-35
Table 1.8 Top Hazards, Pennsylvania, 2013 1-38
Table 2.1 Pennsylvania Resident Deaths by Number, Age-Adjusted Rates per 100,000 and Confidence Intervals, 2015
2-4
Table 2.2 Resident Deaths by Number and Age-Adjusted Rates, Pennsylvania and United States, 2015
2-6
Table 2.3 Resident Deaths by Selected Causes, Pennsylvania, 2000, 2010 and 2015 2-6
Table 2.4 Percent Change of Resident Deaths, Adults 65 and Over, by Cause and Age, Pennsylvania, 2010 and 2015
2-7
Table 2.5 Prevalence of Selected Diagnoses, Pennsylvania and United States, 2012 and 2016 2-9
Table 2.6 Incidence of Cancer per 100,000 Residents, Pennsylvania and United States, 2009 and 2014
2-10
Table 3.1 Percent of Overweight and Obese Adults by Demographics, Pennsylvania, 2011 3-10
Table 3.2 Childhood BMI-for-Age Weight Status Categories and Corresponding Percentiles, United States
3-11
Pennsylvania State Health Assessment, 2013 Key Health Findings At-A-Glance xxvii
Number Title Page
Table 3.3 Percent of Obese Children by Age Group, 2007 to 2011 and HP 2020 Goals 3-11
Table 3.4 HealthChoices Drug and Alcohol Treatment Admissions by Age Groups and Race and Ethnicity, Pennsylvania, 2010-2011
3-24
Table 3.5 Abuse/Dependence of Illicit Drugs or Alcohol in the Past Year by Age Groups, Pennsylvania, 2008-2009, 2009-2010, 2010-2011
3-25
Table 3.6 Use of Alcohol or Drugs, Pennsylvania, 2008-2009, 2009-2010, 2010-2011 3-25
Table 3.7 Youth Perception of “Great Risk of Harm” for Marijuana and Alcohol, Pennsylvania, 2008-2009, 2009-2010, 2010-2011
3-26
Table 3.8 Adult Perception of “Great Risk of Harm” for Marijuana and Alcohol, Pennsylvania, 2008-2009, 2009-2010, 2010-2011
3-27
Table 4.1 Fatal Farm Related Incidents by Activity, Pennsylvania, 2010 and 2011 4-4
Table 4.2 Occupational Exposure by Pesticide Classification, 2011 4-5
Table 4.3 Blood Lead Testing by Sex for Workers Age 16 and Older, Pennsylvania, 2010 and 2012 4-6
Table 4.4 Workers with BLLs ≥25 µg/dL for Industry Subsectors with ≥25 Reported Cases, Pennsylvania, 2010 to 2012 Combined
4-8
Table 4.5 BLLs ≥25 µg/dL by Sex, for Workers Age 16 and Older, Pennsylvania, 2010 to 2012 Combined
4-8
Table 5.1 Combined Cases of AIDS and HIV without AIDS by Sex, Race/Ethnicity, and Year of Diagnosis, Pennsylvania, 2006 to 2011 with 1980 to 2011 Totals
5-7
Table 5.2 Combined Cases of AIDS and HIV without AIDS by Age Group and Year of Diagnosis, Pennsylvania, 2006-2011 with 1980 to 2011 Totals
5-8
Table 5.3 Combined Cases of AIDS and HIV without AIDS by Mode of Transmission and Year of Diagnosis, Pennsylvania, 2006 to 2011 and 1980 to 2011 Totals
5-8
Table 5.4 Tuberculosis Rates for U.S.-born Residents, Pennsylvania, 2010 to 2012 5-11
Table 5.5 Tuberculosis Testing for Persons with HIV, Pennsylvania, 2008 to 2012 5-11
Pennsylvania State Health Assessment, 2013 Key Health Findings At-A-Glance xxviii
Number Title Page
Table 5.6 Twelve Month Treatment Completion Rate with Newly Diagnosed TB, Pennsylvania, 2010 to 2012
5-12
Table 5.7 Persons with Active TB Who Completed Treatment, Pennsylvania, 2008 to 2012 5-12
Table 5.8 Healthcare Associated Infections, Pennsylvania, 2009 to 2011 5-23
Table 5.9 Healthcare Associated Infections per 100,000 Population by Age Group, Pennsylvania, 2009 and 2010
5-24
Table 5.10 Outcomes of Patients with and without Healthcare Associated Infection, Pennsylvania, 2010
5-25
Table 5.11 Catheter-Associated Urinary Tract Infections in Hospitals, Pennsylvania, 2008 to 2011 5-26
Table 5.12 Central Line-Associated Bloodstream Infections in Hospitals, Pennsylvania, 2008 to 2011
5-26
Table 5.13 Selected Surgical Site Infections in Hospitals, Pennsylvania, 2008 to 2011 5-26
Table 5.14 West Nile Virus, Human Cases, Pennsylvania, 2001 to 2012 5-29
Table 5.15 West Nile Virus, Animal Cases, Pennsylvania, 2001 to 2012 5-30
Table 5.16 Top Ten Most Commonly Reported Serotypes of Salmonella, Pennsylvania, 2011 5-43
Table 5.17 Confirmed and Probable Cases of Vaccine Preventable Diseases by Age Group, Pennsylvania, 2011
5-53
Table 5.18 Influenza Cases, Hospitalizations, Deaths, and Institutional Outbreaks Reported to the Pennsylvania Department of Health, by Influenza Season
5-58
Table 6.1 Injury Surveillance Data Sets, 2013 6-2
Table 6.2 Leading Causes of Death Due to Unintentional Injury by Age Group, Pennsylvania, 2006 to 2010
6-8
Table 6.3 Adverse Childhood Experience Score by Sex, Pennsylvania, 2010 6-15
Table 6.4 Adverse Childhood Experiences by Sex, Pennsylvania, 2010 6-16
Table 6.5 Childhood Maltreatment Rates per 1,000 Children, Pennsylvania, 2008 to 2010 6-17
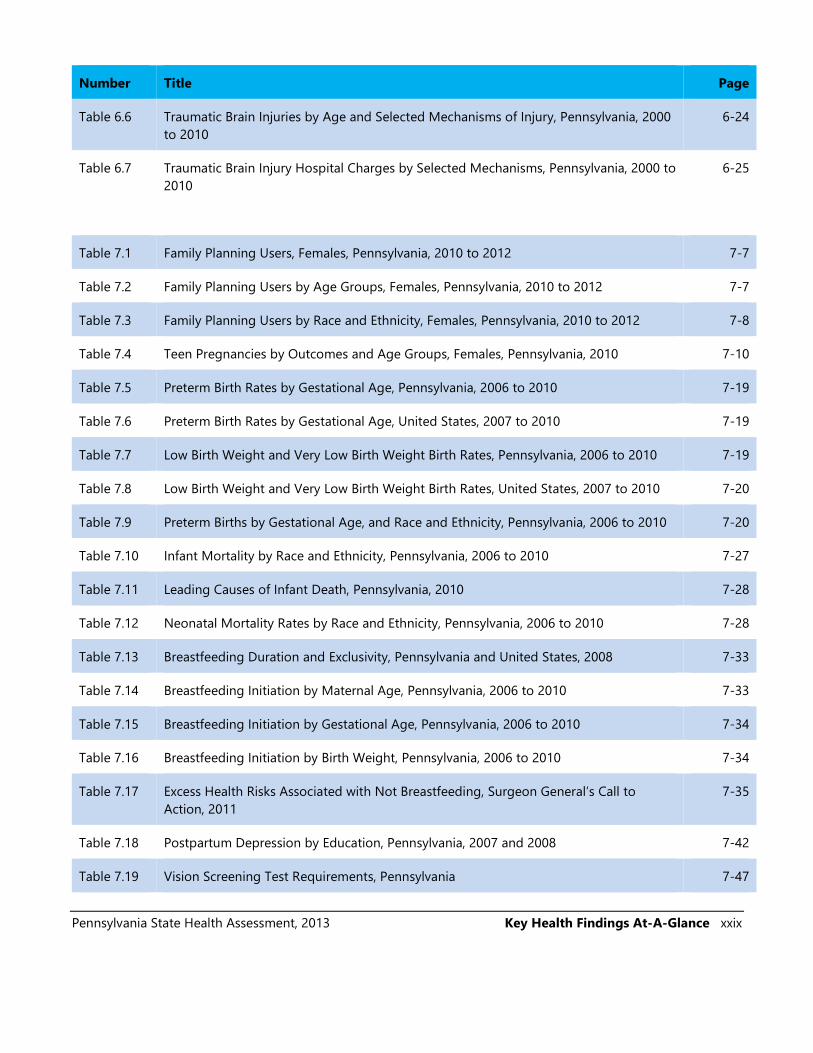
Pennsylvania State Health Assessment, 2013 Key Health Findings At-A-Glance xxix
Number Title Page
Table 6.6 Traumatic Brain Injuries by Age and Selected Mechanisms of Injury, Pennsylvania, 2000 to 2010
6-24
Table 6.7 Traumatic Brain Injury Hospital Charges by Selected Mechanisms, Pennsylvania, 2000 to 2010
6-25
Table 7.1 Family Planning Users, Females, Pennsylvania, 2010 to 2012 7-7
Table 7.2 Family Planning Users by Age Groups, Females, Pennsylvania, 2010 to 2012 7-7
Table 7.3 Family Planning Users by Race and Ethnicity, Females, Pennsylvania, 2010 to 2012 7-8
Table 7.4 Teen Pregnancies by Outcomes and Age Groups, Females, Pennsylvania, 2010 7-10
Table 7.5 Preterm Birth Rates by Gestational Age, Pennsylvania, 2006 to 2010 7-19
Table 7.6 Preterm Birth Rates by Gestational Age, United States, 2007 to 2010 7-19
Table 7.7 Low Birth Weight and Very Low Birth Weight Birth Rates, Pennsylvania, 2006 to 2010 7-19
Table 7.8 Low Birth Weight and Very Low Birth Weight Birth Rates, United States, 2007 to 2010 7-20
Table 7.9 Preterm Births by Gestational Age, and Race and Ethnicity, Pennsylvania, 2006 to 2010 7-20
Table 7.10 Infant Mortality by Race and Ethnicity, Pennsylvania, 2006 to 2010 7-27
Table 7.11 Leading Causes of Infant Death, Pennsylvania, 2010 7-28
Table 7.12 Neonatal Mortality Rates by Race and Ethnicity, Pennsylvania, 2006 to 2010 7-28
Table 7.13 Breastfeeding Duration and Exclusivity, Pennsylvania and United States, 2008 7-33
Table 7.14 Breastfeeding Initiation by Maternal Age, Pennsylvania, 2006 to 2010 7-33
Table 7.15 Breastfeeding Initiation by Gestational Age, Pennsylvania, 2006 to 2010 7-34
Table 7.16 Breastfeeding Initiation by Birth Weight, Pennsylvania, 2006 to 2010 7-34
Table 7.17 Excess Health Risks Associated with Not Breastfeeding, Surgeon General’s Call to Action, 2011
7-35
Table 7.18 Postpartum Depression by Education, Pennsylvania, 2007 and 2008 7-42
Table 7.19 Vision Screening Test Requirements, Pennsylvania 7-47
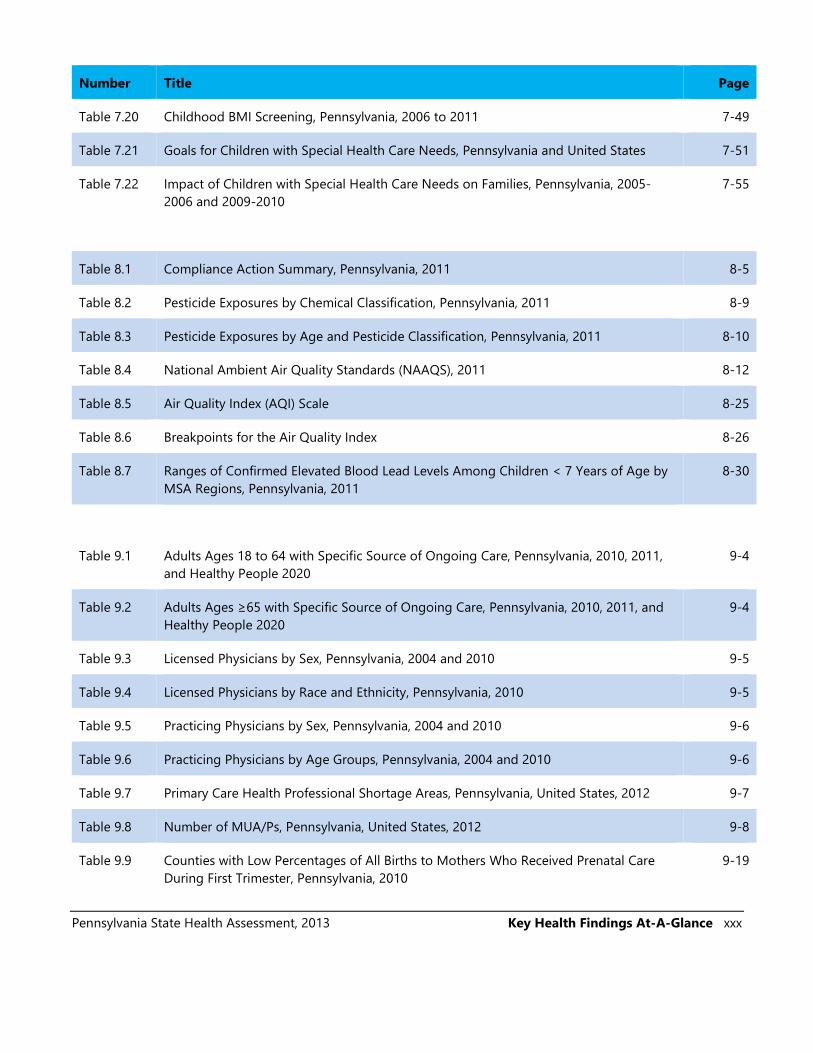
Pennsylvania State Health Assessment, 2013 Key Health Findings At-A-Glance xxx
Number Title Page
Table 7.20 Childhood BMI Screening, Pennsylvania, 2006 to 2011 7-49
Table 7.21 Goals for Children with Special Health Care Needs, Pennsylvania and United States 7-51
Table 7.22 Impact of Children with Special Health Care Needs on Families, Pennsylvania, 2005-2006 and 2009-2010
7-55
Table 8.1 Compliance Action Summary, Pennsylvania, 2011 8-5
Table 8.2 Pesticide Exposures by Chemical Classification, Pennsylvania, 2011 8-9
Table 8.3 Pesticide Exposures by Age and Pesticide Classification, Pennsylvania, 2011 8-10
Table 8.4 National Ambient Air Quality Standards (NAAQS), 2011 8-12
Table 8.5 Air Quality Index (AQI) Scale 8-25
Table 8.6 Breakpoints for the Air Quality Index 8-26
Table 8.7 Ranges of Confirmed Elevated Blood Lead Levels Among Children < 7 Years of Age by MSA Regions, Pennsylvania, 2011
8-30
Table 9.1 Adults Ages 18 to 64 with Specific Source of Ongoing Care, Pennsylvania, 2010, 2011, and Healthy People 2020
9-4
Table 9.2 Adults Ages ≥65 with Specific Source of Ongoing Care, Pennsylvania, 2010, 2011, and Healthy People 2020
9-4
Table 9.3 Licensed Physicians by Sex, Pennsylvania, 2004 and 2010 9-5
Table 9.4 Licensed Physicians by Race and Ethnicity, Pennsylvania, 2010 9-5
Table 9.5 Practicing Physicians by Sex, Pennsylvania, 2004 and 2010 9-6
Table 9.6 Practicing Physicians by Age Groups, Pennsylvania, 2004 and 2010 9-6
Table 9.7 Primary Care Health Professional Shortage Areas, Pennsylvania, United States, 2012 9-7
Table 9.8 Number of MUA/Ps, Pennsylvania, United States, 2012 9-8
Table 9.9 Counties with Low Percentages of All Births to Mothers Who Received Prenatal Care During First Trimester, Pennsylvania, 2010
9-19
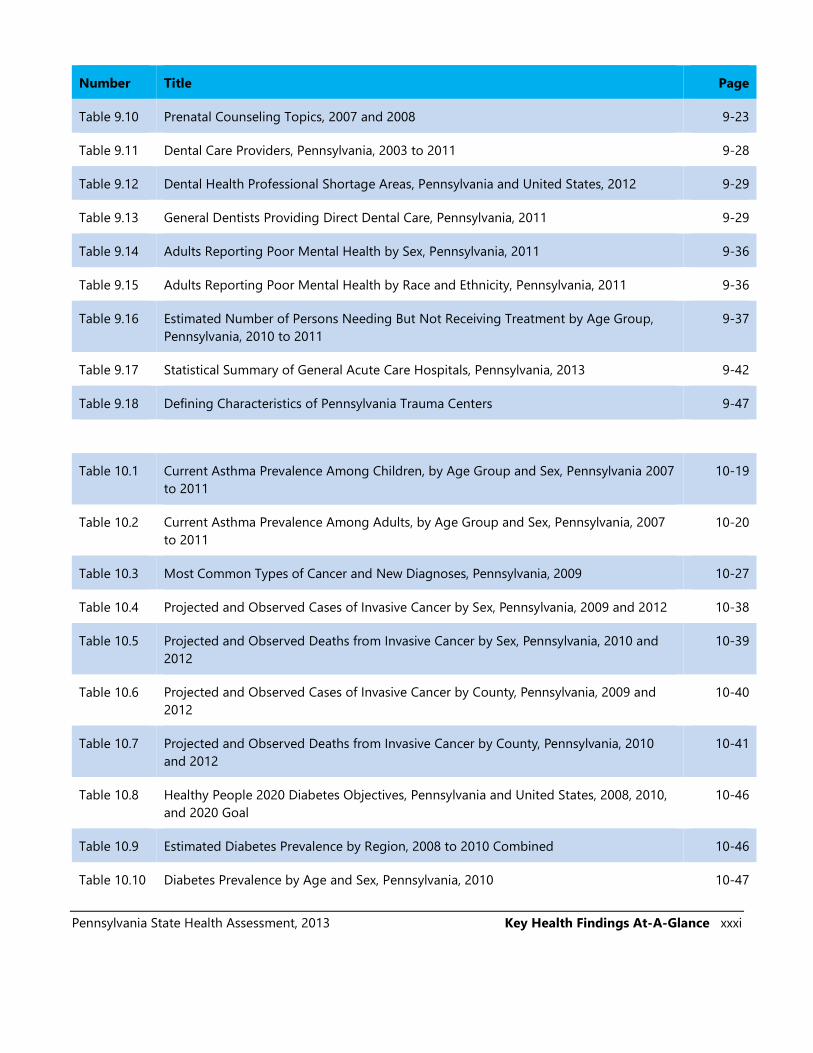
Pennsylvania State Health Assessment, 2013 Key Health Findings At-A-Glance xxxi
Number Title Page
Table 9.10 Prenatal Counseling Topics, 2007 and 2008 9-23
Table 9.11 Dental Care Providers, Pennsylvania, 2003 to 2011 9-28
Table 9.12 Dental Health Professional Shortage Areas, Pennsylvania and United States, 2012 9-29
Table 9.13 General Dentists Providing Direct Dental Care, Pennsylvania, 2011 9-29
Table 9.14 Adults Reporting Poor Mental Health by Sex, Pennsylvania, 2011 9-36
Table 9.15 Adults Reporting Poor Mental Health by Race and Ethnicity, Pennsylvania, 2011 9-36
Table 9.16 Estimated Number of Persons Needing But Not Receiving Treatment by Age Group, Pennsylvania, 2010 to 2011
9-37
Table 9.17 Statistical Summary of General Acute Care Hospitals, Pennsylvania, 2013 9-42
Table 9.18 Defining Characteristics of Pennsylvania Trauma Centers 9-47
Table 10.1 Current Asthma Prevalence Among Children, by Age Group and Sex, Pennsylvania 2007 to 2011
10-19
Table 10.2 Current Asthma Prevalence Among Adults, by Age Group and Sex, Pennsylvania, 2007 to 2011
10-20
Table 10.3 Most Common Types of Cancer and New Diagnoses, Pennsylvania, 2009 10-27
Table 10.4 Projected and Observed Cases of Invasive Cancer by Sex, Pennsylvania, 2009 and 2012 10-38
Table 10.5 Projected and Observed Deaths from Invasive Cancer by Sex, Pennsylvania, 2010 and 2012
10-39
Table 10.6 Projected and Observed Cases of Invasive Cancer by County, Pennsylvania, 2009 and 2012
10-40
Table 10.7 Projected and Observed Deaths from Invasive Cancer by County, Pennsylvania, 2010 and 2012
10-41
Table 10.8 Healthy People 2020 Diabetes Objectives, Pennsylvania and United States, 2008, 2010, and 2020 Goal
10-46
Table 10.9 Estimated Diabetes Prevalence by Region, 2008 to 2010 Combined 10-46
Table 10.10 Diabetes Prevalence by Age and Sex, Pennsylvania, 2010 10-47
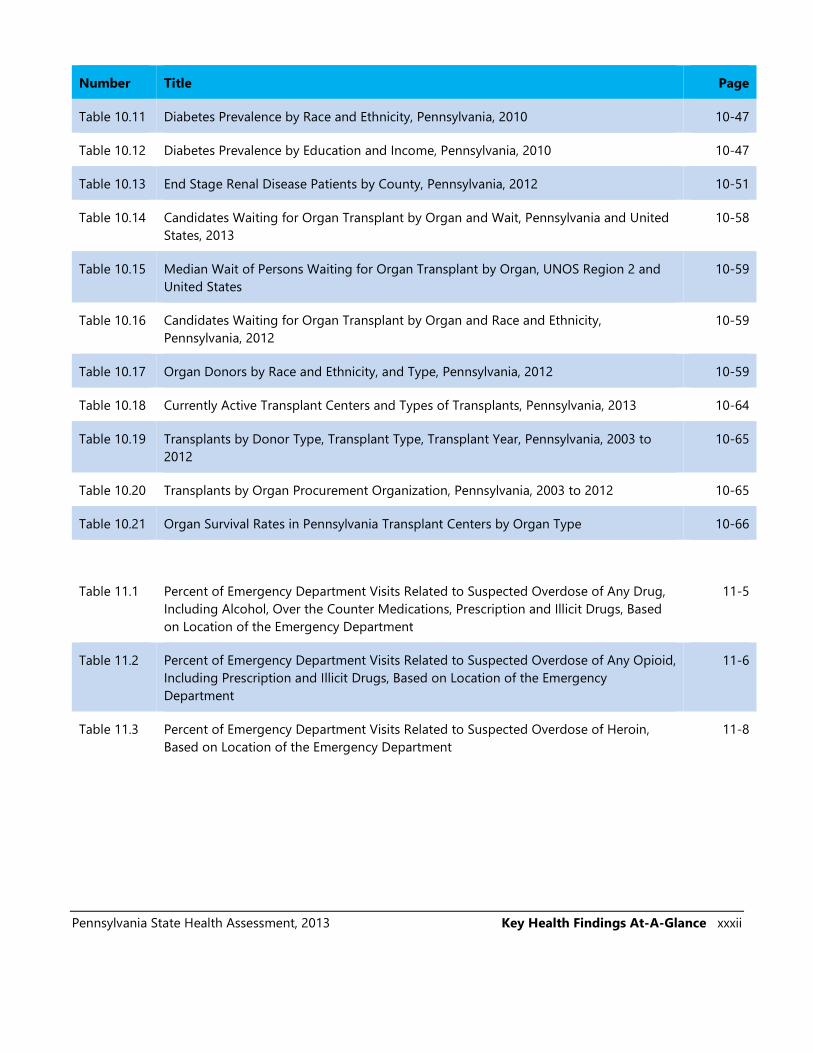
Pennsylvania State Health Assessment, 2013 Key Health Findings At-A-Glance xxxii
Number Title Page
Table 10.11 Diabetes Prevalence by Race and Ethnicity, Pennsylvania, 2010 10-47
Table 10.12 Diabetes Prevalence by Education and Income, Pennsylvania, 2010 10-47
Table 10.13 End Stage Renal Disease Patients by County, Pennsylvania, 2012 10-51
Table 10.14 Candidates Waiting for Organ Transplant by Organ and Wait, Pennsylvania and United States, 2013
10-58
Table 10.15 Median Wait of Persons Waiting for Organ Transplant by Organ, UNOS Region 2 and United States
10-59
Table 10.16 Candidates Waiting for Organ Transplant by Organ and Race and Ethnicity, Pennsylvania, 2012
10-59
Table 10.17 Organ Donors by Race and Ethnicity, and Type, Pennsylvania, 2012 10-59
Table 10.18 Currently Active Transplant Centers and Types of Transplants, Pennsylvania, 2013 10-64
Table 10.19 Transplants by Donor Type, Transplant Type, Transplant Year, Pennsylvania, 2003 to 2012
10-65
Table 10.20 Transplants by Organ Procurement Organization, Pennsylvania, 2003 to 2012 10-65
Table 10.21 Organ Survival Rates in Pennsylvania Transplant Centers by Organ Type 10-66
Table 11.1 Percent of Emergency Department Visits Related to Suspected Overdose of Any Drug, Including Alcohol, Over the Counter Medications, Prescription and Illicit Drugs, Based on Location of the Emergency Department
11-5
Table 11.2 Percent of Emergency Department Visits Related to Suspected Overdose of Any Opioid, Including Prescription and Illicit Drugs, Based on Location of the Emergency Department
11-6
Table 11.3 Percent of Emergency Department Visits Related to Suspected Overdose of Heroin, Based on Location of the Emergency Department
11-8