Embed Size (px)
Citation preview

PENN STATEINDICATORS REPORT
-2000-
Steps Toward A Sustainable University
Penn State Green Destiny Council
sus.tain vt. 1. to keep in existence; keep up 2. tomaintain; specif. to provide sustenance or nourishment for--SYN. support—sustain’a/ble adj.--sus.tain’/er n.
sus.tain.able uni.ver.si.ty adj., n. 1.university whose long term prospect for continuing to existis good; specif. such a university behaves in ways thatsustains the integrity and biodiversity of the local andplanetary ecosystems upon which all life depends 2. auniversity whose core values include: respect for the biotaand natural processes, mindfulness of place, living withinplanetary limits, accounting for full costs, and civicresponsibility 3. The kind of university that PENN STATEis striving to become.
The paper used in this report was made using 100% post-consumer recycledpaper and is chlorine-free.
Whatever you can do, or dream you can,begin it.
Boldness has genius, power and magic in it. J. Goethe
An Invitation to the Penn State CommunityThis report is intended for a wide range of readers--students, staff, faculty,
administrators, and members of the community at large. It reflects the University’s growingcommitment to environmental stewardship and builds on the literally hundreds of initiativesundertaken by University staff to promote sustainable practices.
We hope that those who read it will consider how they might contribute to making PennState more sustainable. We invite faculty to use this report in the classroom. Indeed, thecontent has relevance to almost every discipline offered at Penn State from engineering andarchitecture through business, philosophy and ethics to the natural and social sciences.
We especially invite students to use the ideas contained herein as a starting point fornew research projects or as jump-off points for concrete actions to promote sustainability atPenn State. For assistance, contact Matt McLaughlin (Student Coordinator for IndicatorsProject) at [email protected] or Christopher Uhl (Faculty Coordinator) at [email protected]. Wealso invite you to visit the Green Destiny website at: www.bio.psu.edu/greendestiny
TABLE OF CONTENTS
Executive Summary vii
Introduction 1
Energy 10
Water 19
Material Resources & Waste Disposal 29
Food 38
Land 46
Transportation 56
The Built Environment 65
Community 73
Research 82
Decision Making 95
Conclusion 101
EXECUTIVE SUMMARY
We live in an extraordinary moment in history—a period flush with opportunity butfraught with uncertainty. Age-old values and traditions are being pushed aside as acacophony of new ideas competes for our attention. In such times universities can play aspecial role. We rely on them to serve as anchors—places of reflection and moral integrity, aswell as loci of questioning and innovation.
As we look at the world, we see a finite planet being overwhelmed by humans. Ournumbers have doubled in the last 40 years and will increase by several more billion beforethere is any hope of stabilization. As population mushrooms, the seemingly insatiablehuman drive to consume has accelerated rather than abated. Human activities have degradedmany of earth's life support systems: soils are thinner, ground water increasingly pollutedand scarce, the atmosphere tainted, and many plant and animal species endangered. This isnot alarmism; it is a cool-headed summary of what our best scientists have been telling us fortwo decades.
A while back, humans imagined that they could take from the earth forever. Now weknow that earth's bounty is limited and cannot be taken for granted. The solution to ourproblems is not continual growth, as we once thought, but sustainable living—an approach tolife that is mindful of limits and that emphasizes quality rather than quantity. The concept ofsustainability—meeting present needs without compromising the ability of future generationsto meet their needs—challenges us to pay attention to the myriad ways in which we dependon the earth.
This report examines sustainability at Penn State using 33 different indicatorsdistributed among 10 University “systems.” These systems include, among others, energy,water, food, transportation, and decision-making. For each indicator we present data thatattempt to gauge if Penn State is moving toward sustainability. For example, Penn State hastaken many steps to encourage and facilitate recycling on campus, an indication that theUniversity is moving toward sustainability for this indicator.
Examining an institution through the lens of sustainability invites us to think aboutvalues. The values associated with sustainability are age-old precepts that are both sensibleand uplifting. They include a respect for the biota and natural processes, the exercise ofmindfulness of place, a commitment to live within limits and to consider full costs, and theassumption of civic responsibility.
A team of 30 students (both graduate and undergraduate) and several faculty mentorsand young professionals conducted the research presented here. The members of the researchteam displayed great tenacity and creativity in collecting the data for the various indicators.They visited the Somerset County landfill that receives Penn State’s trash, journeyed to theopen pit mines near Dubois that provide PSU’s coal, and walked through the local well fieldsthat supply the University with water. And this was just a start. They went on to look intocampus dumpsters to see what was being thrown away, to examine the food offerings in thedining halls, to study land transactions at the County deeds office, to calculate the loss ofcampus green space using maps in Pattee Library, to determine the numbers of exotic vs.native plants on campus through botanical surveys, to characterize the ecological literacy ofgraduating PSU seniors by administering questionnaires, and much more. These researchersconducted not an abstract educational exercise, but rather engaged in face-to-face interactionswith Penn State’s complex and often invisible support systems and the people responsiblefor running them.
The intent of this report is not simply to supply answers but to raise questions. Thequestions center on ecological responsibility, research ethics, the wisdom of continual growth,the openness of decision making, the uncritical acceptance of technology, and the moralresponsibilities of the University—in short, questions that are worthy of the attention of allvital institutions.
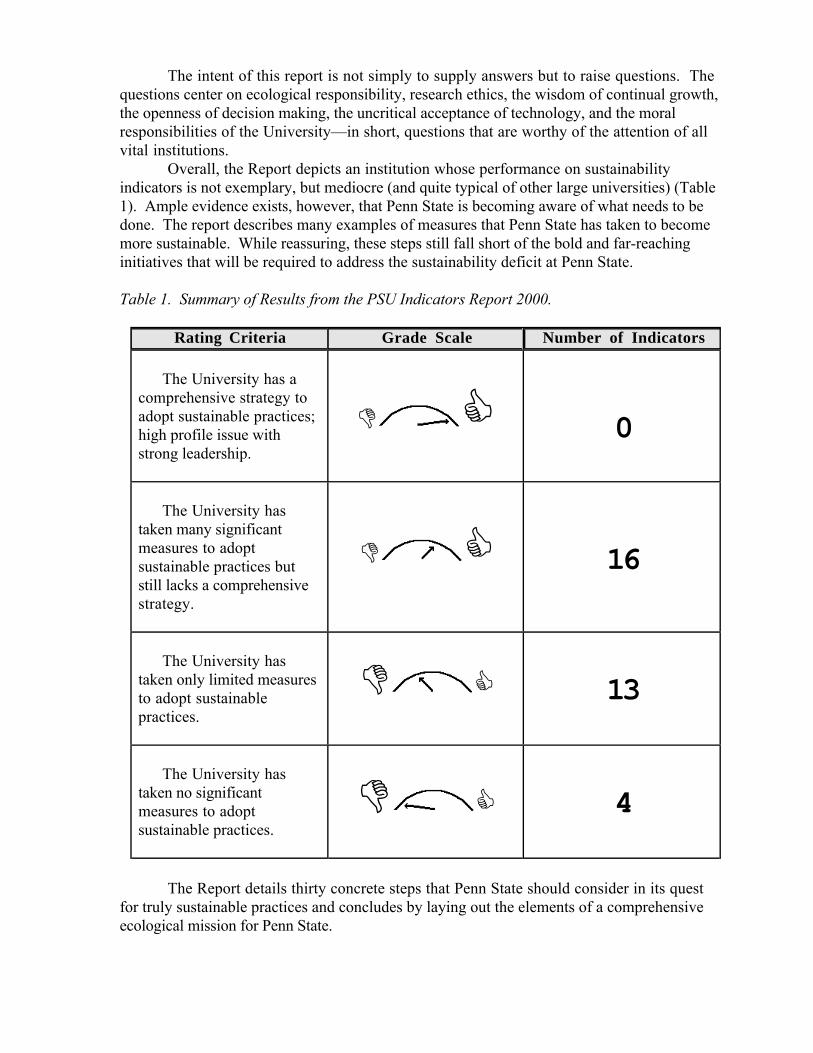
Overall, the Report depicts an institution whose performance on sustainabilityindicators is not exemplary, but mediocre (and quite typical of other large universities) (Table1). Ample evidence exists, however, that Penn State is becoming aware of what needs to bedone. The report describes many examples of measures that Penn State has taken to becomemore sustainable. While reassuring, these steps still fall short of the bold and far-reachinginitiatives that will be required to address the sustainability deficit at Penn State.
Table 1. Summary of Results from the PSU Indicators Report 2000.
Rating Criteria Grade Scale Number of Indicators
• The University has acomprehensive strategy toadopt sustainable practices;high profile issue withstrong leadership.
0
• The University hastaken many significantmeasures to adoptsustainable practices butstill lacks a comprehensivestrategy.
16
• The University hastaken only limited measuresto adopt sustainablepractices.
13
• The University hastaken no significantmeasures to adoptsustainable practices.
4
The Report details thirty concrete steps that Penn State should consider in its questfor truly sustainable practices and concludes by laying out the elements of a comprehensiveecological mission for Penn State.
1
THE PENN STATE INDICATORS REPORT*2000*
The first edition of the Penn State Indicators Report (1998) attracted national attention.Never had a university sought to forthrightly examine itself through the lens of sustainability.This 2000 edition of the Report offers: updates on all the indicators; eleven new micro analyses(presented as boxes); a new, more didactic system for evaluating the indicators; and a concreteset of proposals aimed at defining Penn State’s emerging ecological mission.
Introduction
Over the past fifty years, humans have slowly awakened to three sobering problems:• The first is the problem of rapid growth, most stunningly illustrated by the
explosion of the human population, but exhibited just as dramatically in scores ofproduction, consumption and waste trends.
• The second problem is that the earth is essentially a closed system--a blue planet,with an atmospheric blanket, orbiting a star; planetary resources are finite and thereare incontrovertible limits to growth.
• The third problem is that the large and growing human population is profoundlydisrupting planetary dynamics. We have already experienced these disruptions inthe form of wide-scale acid rain, ozone layer thinning, and extinction of species.
These problems—rapid growth in consumption and waste as human numbersincrease, the earth as a closed system with finite resources, and humanity's growing,planetary-scale disruptions of earth processes—are sensitizing us to the fragility of our homeplanet, but human alteration of the Earth continues (See Box).
Human Domination of the Earth’s EcosystemsThe lead article in a recent issue of Science Magazine described the magnitude of humanalteration of the Earth as follows:“Between one-third and one-half of the land surface [of the Earth] has been transformed byhuman action; the carbon dioxide concentration in the atmosphere has increased by nearly 30%since the beginning of the Industrial Revolution; more atmospheric nitrogen is now fixed byhumanity than by all natural terrestrial sources combined; more than half of all accessiblesurface fresh water is put to use by humanity; and about one-quarter of the bird species on earthhave been driven to extinction…All of these seemingly disparate phenomena trace to a singlecause—the growing scale of the human enterprise. The rates, scales, kinds, and combinations ofchanges occurring now are fundamentally different from those at any other time in history; weare changing Earth more rapidly than we are understanding it…In a very real sense, the world isin our hands—and how we handle it will determine its composition and dynamics, and our fate”Vitousek et al., 1997.
Vitousek and his Stanford colleagues are not alone. Indeed, there is a growingconsensus among intellectual leaders throughout the world that all is not well. Recently, 102Nobel Laureates in Science and 1600 other distinguished scientists from 70 countries issuedthis statement:
“Human beings and the natural world are on a COLLISION COURSE…If notchecked, many of our current practices put at serious risk the future that we wish forhuman society community…A great change in the stewardship of the earth and the life
2
on it is required, if vast human misery is to be avoided and our global home on thisplanet is not to be irretrievably mutilated." World Scientists' Warning to Humanity,1992 and 1997
The research coming out of our universities confirms the seriousness of our planetarysituation. Atmospheric chemists report steady rises in greenhouse gases; soil scientistsreport that our farm soils are eroding in many places more rapidly than they are forming;human physiologists tell us of increases in foreign, perhaps disease-causing and reproduction-impairing, chemicals in our bodies; ecologists register the impoverishment of ecosystems andthe extinction of species; sociologists report the breakdown of families and the deteriorationof communities; and philosophers and theologians observe the erosion of moral principles andthe alienation of humans from the natural world.
This report is concerned with the opportunities and responsibilities that Penn Statehas in these troubled times to serve as an anchor of wisdom and moral integrity and a locus ofcreativity and innovation.1
Goals and Definitions
"Sustainability means living, working and behaving in a way that will sustainthe integrity and biodiversity of the local, regional and planetary ecosystemupon which all life depends." Guy Dauncey
Sustainability needs to become a central organizing idea for higher education—awhole-systems framework within which a broad range of environmental, technological, andcultural problems can be discussed and addressed. The sustainable practices necessary tomove off our "collision course" require our civilization's major institutions, includinguniversities, to adhere to five principles (See Box).
Principles of Sustainability• Respect Life
Avoid actions that harm the integrity, stability, and beauty of the biotic community uponwhich we all depend.
• Live within LimitsRecognize that our natural resources are finite endowments to be used with care and
prudence at a rate consonant with their capacity for regeneration.• Value the Local
Help to create strong local and regional economies that respect the natural and cultural components of our neighborhoods, communities, and watersheds.
• Account for Full CostsRecognize that product prices should reflect "full costs” and confine purchases, to the
extentpossible, to enterprises and products that embody sustainable practices and full-costaccounting.
• Share PowerRealize that people, biota, and the physical world are interconnected, and that problemsare best solved through processes where all voices are heard and civil exchange isnurtured.
1 Since 1980, university presidents, historians, philosophers, and teachers have written a series of remarkablebooks, analyzing the rapidly changing university environment. For those wishing to dig deeper, werecommend: Bok (1982), Wilshire (1990), Smith (1990), Getman (1992), Pelikan (1992), Solomon andSolomon (1993), Tierney (1993), and Orr (1992, 1994).
3
Though the concept of sustainability is relatively new, the substance of its fiveprinciples is already embedded in societal values. What is "respect for life," but appreciationof life’s magnificence and mystery? "Living within limits" embodies the traditional values offrugality and thrift. "Full-cost accounting" emphasizes the value of honesty and completedisclosure. "Respect for what is local" honors history and traditions, and "sharing power" is,of course what democracy is all about.
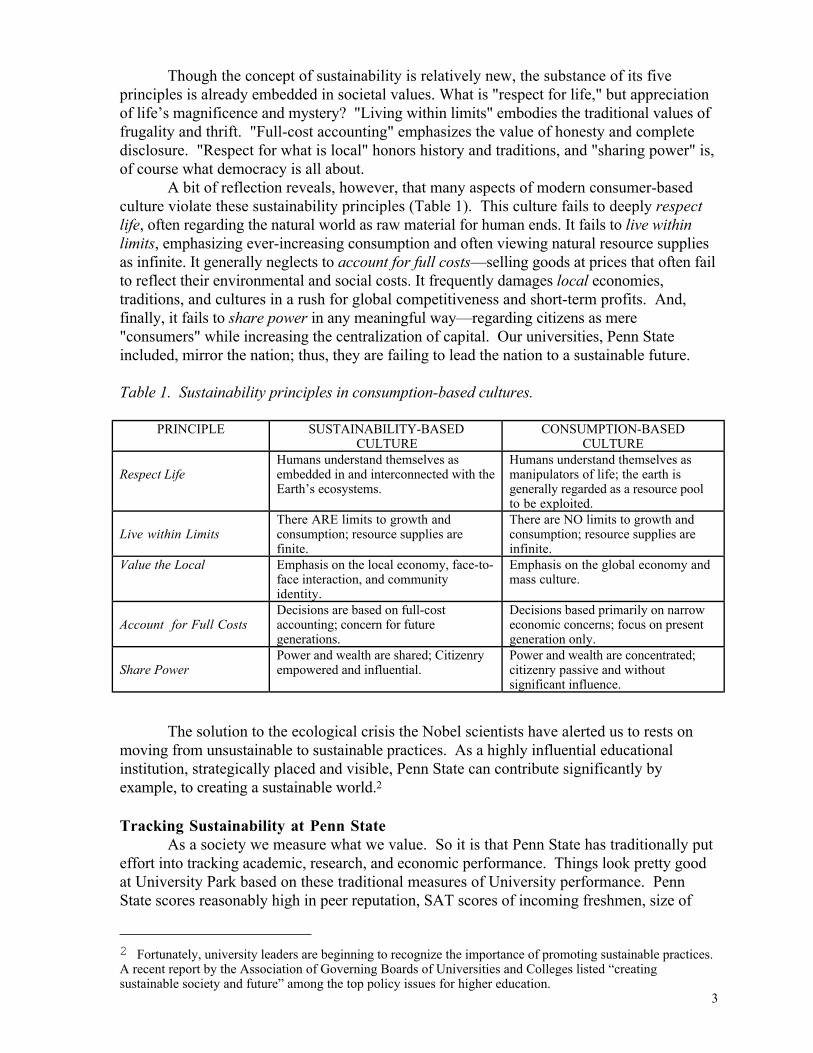
A bit of reflection reveals, however, that many aspects of modern consumer-basedculture violate these sustainability principles (Table 1). This culture fails to deeply respectlife, often regarding the natural world as raw material for human ends. It fails to live withinlimits, emphasizing ever-increasing consumption and often viewing natural resource suppliesas infinite. It generally neglects to account for full costs—selling goods at prices that often failto reflect their environmental and social costs. It frequently damages local economies,traditions, and cultures in a rush for global competitiveness and short-term profits. And,finally, it fails to share power in any meaningful way—regarding citizens as mere"consumers" while increasing the centralization of capital. Our universities, Penn Stateincluded, mirror the nation; thus, they are failing to lead the nation to a sustainable future.
Table 1. Sustainability principles in consumption-based cultures.
PRINCIPLE SUSTAINABILITY-BASEDCULTURE
CONSUMPTION-BASEDCULTURE
Respect LifeHumans understand themselves asembedded in and interconnected with theEarth’s ecosystems.
Humans understand themselves asmanipulators of life; the earth isgenerally regarded as a resource poolto be exploited.
Live within LimitsThere ARE limits to growth andconsumption; resource supplies arefinite.
There are NO limits to growth andconsumption; resource supplies areinfinite.
Value the Local Emphasis on the local economy, face-to-face interaction, and communityidentity.
Emphasis on the global economy andmass culture.
Account for Full CostsDecisions are based on full-costaccounting; concern for futuregenerations.
Decisions based primarily on narroweconomic concerns; focus on presentgeneration only.
Share PowerPower and wealth are shared; Citizenryempowered and influential.
Power and wealth are concentrated;citizenry passive and withoutsignificant influence.
The solution to the ecological crisis the Nobel scientists have alerted us to rests onmoving from unsustainable to sustainable practices. As a highly influential educationalinstitution, strategically placed and visible, Penn State can contribute significantly byexample, to creating a sustainable world.2
Tracking Sustainability at Penn StateAs a society we measure what we value. So it is that Penn State has traditionally put
effort into tracking academic, research, and economic performance. Things look pretty goodat University Park based on these traditional measures of University performance. PennState scores reasonably high in peer reputation, SAT scores of incoming freshmen, size of
2 Fortunately, university leaders are beginning to recognize the importance of promoting sustainable practices.A recent report by the Association of Governing Boards of Universities and Colleges listed “creatingsustainable society and future” among the top policy issues for higher education.

4
endowments, number of government research contracts, percentage of Ph.D.s on the faculty,and winning football seasons. But these traditional measures are not telling the full story, forthey fail to recognize the University’s strong dependence on the physical and biologicalworld and to consider PSU’s performance in this broader context. What is needed is ameasurement system for Penn State and other universities in which sustainable practices arehighlighted (See Box).
A New Ranking System for Colleges and UniversitiesIn a recent article, David Orr (1999), proposes to rank colleges and universities based on
whether they move the world in more sustainable directions. He employs five criteria as follows:1. What quantity of material goods does the university consume on a per capita basis?
(e.g., How much paper and water is used per student? How much CO2 is released per student forelectricity and heating needs?)
2. What are the university/college management policies for materials, waste, recycling,purchasing, landscaping, energy use, and building? (e.g., Is there a priority to use recycledmaterials? Is the use of toxic chemicals kept to a minimum?)
3. Does the curriculum engender ecological literacy? (e.g., Do graduates know the“stories” behind their food, water, and discarded materials? Are there opportunities to restorelocal rivers and degraded lands?
4. Do university/college finances help build sustainable regional economies? (e.g., Dofood purchases come from regional farms? Are endowment funds invested in enterprises thatemploy sustainable practices and produce goods that truly benefit society?
5. What do the graduates do in the world? (e.g., Does the work they do contribute to asustainable culture?)
This report lays the foundation for a new measurement system by examining PennState's performance and well-being through the lens of sustainability. We track energyconsumed and waste discarded per person. We examine Penn State’s policies andperformance in water conservation, recycling, purchasing, landscaping, energy use, buildingdesign, and research ethics. We take a hard look at Penn State’s food and transportationsystems and ask if they are moving the University in a sustainable direction. We check to seeif Penn State’s institutional power is being used to strengthen regional economies andpromote corporate responsibility, and much more.
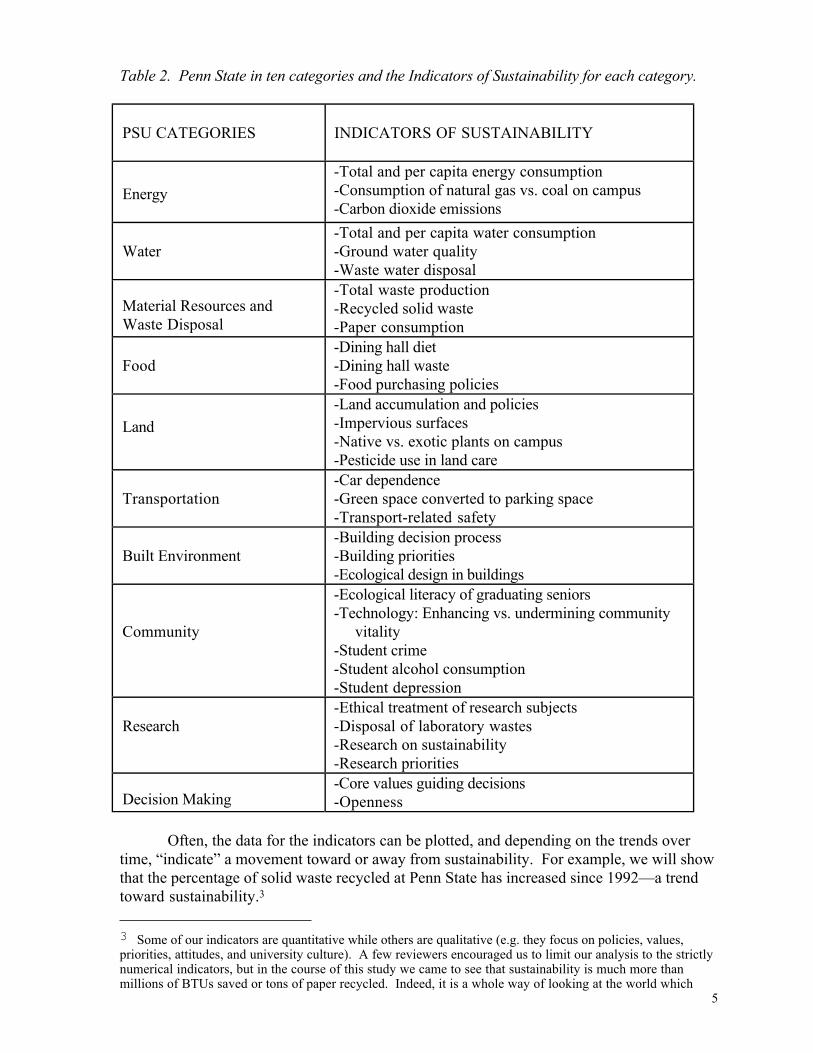
In organizing the information contained in this report, we have divided the functioningof PSU into ten categories. Each of these categories (e.g., Water, Food, Transportation, etc.)comprises a chapter of the Report. For each category (chapter) we examine several indicators(Table 2) that have clearly traceable links to sustainability. Several criteria were helpful inchoosing and developing indicators. Good indicators: 1) address what is fundamental to thelong-term educational, economic, environmental and/or social health of a community; 2) areunderstood by the community and accepted as valid signs of well-being or symptoms ofdistress; and 3) are easily measured (Sustainable Seattle, 1995).
5
Table 2. Penn State in ten categories and the Indicators of Sustainability for each category.
PSU CATEGORIES INDICATORS OF SUSTAINABILITY
Energy
-Total and per capita energy consumption-Consumption of natural gas vs. coal on campus-Carbon dioxide emissions
Water-Total and per capita water consumption-Ground water quality-Waste water disposal
Material Resources andWaste Disposal
-Total waste production-Recycled solid waste-Paper consumption
Food-Dining hall diet-Dining hall waste-Food purchasing policies
Land
-Land accumulation and policies-Impervious surfaces-Native vs. exotic plants on campus-Pesticide use in land care
Transportation-Car dependence-Green space converted to parking space-Transport-related safety
Built Environment-Building decision process-Building priorities-Ecological design in buildings
Community
-Ecological literacy of graduating seniors-Technology: Enhancing vs. undermining community vitality-Student crime-Student alcohol consumption-Student depression
Research-Ethical treatment of research subjects-Disposal of laboratory wastes-Research on sustainability-Research priorities
Decision Making-Core values guiding decisions-Openness
Often, the data for the indicators can be plotted, and depending on the trends overtime, “indicate” a movement toward or away from sustainability. For example, we will showthat the percentage of solid waste recycled at Penn State has increased since 1992—a trendtoward sustainability.3
3 Some of our indicators are quantitative while others are qualitative (e.g. they focus on policies, values,priorities, attitudes, and university culture). A few reviewers encouraged us to limit our analysis to the strictlynumerical indicators, but in the course of this study we came to see that sustainability is much more thanmillions of BTUs saved or tons of paper recycled. Indeed, it is a whole way of looking at the world which
6
When viewed together, the various indicators provide a kind of status report for theUniversity. They are analogous to the vital signs a doctor uses to assess the overall well-being of a patient. Like a patient's vital signs, an understanding of these measures ofinstitutional well-being can serve as a starting point for constructive change.
We begin each of the Reports’ ten categories (chapters) with a few paragraphsexplaining why the category is important to the sustainability of Penn State. Next, weintroduce the indicators for that category, explain their link to sustainability, and summarizethe findings for each indicator. Based on these findings we offer a sustainability assessmentfor each indicator as follows:
encompasses mindfulness of place, respect for natural processes, discernment of true needs, civic responsibility,and full-cost accounting. In this vein, the use of non-numerical indicators reminds us that some of what isimportant and worthy of our attention cannot be expressed in numbers.
• The University has a comprehensivestrategy to adopt sustainable practices;high profile issue with strongleadership.
• The University has taken manysignificant measures to adoptsustainable practices but still lacks acomprehensive strategy.
• The University has taken only limitedmeasures to adopt sustainablepractices.
• The University had taken nosignificant measures to adoptsustainable practices.
After assessing each of the indicators for a given category, we describe both short- and long-term steps necessary to achieve truly sustainable practices at Penn State.
The ultimate goal of this presentation is to build a more sustainable and vital PennState. This will be achieved only if we develop new ways of understanding PSU as aninstitution of higher learning, of evaluating Penn State’s mission, and of formulating PennState’s relationship to our region and the world.
Brief History of the ProjectIn 1995, Dr. Christopher Uhl, of the Penn State Biology Department, read about a
citizens’ initiative in Seattle to evaluate the well-being of that city based on “sustainabilityindicators” (Sustainable Seattle, 1995). Intrigued, he wondered if it might be possible to dosomething similar at Penn State. Meanwhile, Dr. Barbara Anderson, of the Science,
7
Technology and Society Program, was in the process of establishing Penn State’s Center forSustainability. These two streams of activity eventually gave rise to a small working groupwhich began making plans for research on Penn State.
Project participants read the "Campus Ecology" literature (e.g., Eagan and Orr, 1992;Smith, 1993; Keniry, 1995) and in the process, they learned that many universities wereengaged in campus audits (e.g., measuring trends in energy use, waste generation, water use).Early on, the research team decided to merge the idea of the campus audit with the moreholistic concept of sustainability. In so doing, they hoped to ground their analysis in a set ofvalues (See Box, pg.2) that are necessary for both planetary and university well-being. Theypresented the conceptual framework of their approach in a paper entitled, “Sustainability: aTouchstone Concept for University Operations, Education, and Research” (Uhl et al., 1996).
In Spring 1996, the team was ready to begin measuring sustainability at Penn Stateusing 33 indicators. Dominik Kulakowski, a MS Degree candidate in the Intercollege EcologyProgram, together with Uhl and a group of ten upper-level undergraduates, set to work. InJanuary 1997, ten new undergraduates were invited to join the team, together with a secondgraduate student. Each student was assigned an indicator to work on. In all, twenty-sevenundergraduates from five different Penn State colleges worked on the First Edition, as well asthree graduate students and two research assistants. In addition, scores of University staffhelped by providing information and guidance through reviewing the report (See Box).
The Review ProcessOnce the research team had produced an acceptable draft of the report, members of the
university community were invited to review it. This resulted in hundreds of suggestions andideas from more than seventy reviewers. In aggregate, the reviewer's criticisms and suggestionsled to dramatic changes in the First Edition of the report: several indicators were completelythrown out, four new indicators were created, and whole chapters were thoroughly reworked.
Even after extensive revision and refinement, some reviewers were still dismayed by whatthey perceived as a negative tone in this Report. Perhaps this is inevitable, given that theoverarching goal of the Report is to promote a fundamental shift from Penn State'scurrent—often unsustainable—practices to practices which are truly sustainable, over the longhaul. Thus, pointing out what Penn State is doing that is sustainable is important, but we believethat it is even more important to forthrightly acknowledge Penn State's sustainability deficit, andthen to articulate a comprehensive ecological mission for our University, as we have endeavoredto do in these pages.
This is the Second Edition of the Indicators Report. In the process of updating thereport we again solicited information from scores of Penn State staff and, again, received ahigh degree of cooperation. In addition to the updated information, this edition differs insignificant ways from the original report. For example, for this edition we developed a newsystem for evaluating the indicators, extensively revised the text, inserted new information(e.g., boxes) in many of the chapters, and unified the presentation by proposing a ten-foldecological mission for Penn State.
Recognizing that much more needs to be done, a group of faculty, staff, and studentshave recently formed Penn State’s Green Destiny Council, an association committed topromoting ecological responsibility at Penn State. The Council believes that institutions ofhigher education can be leverage points in the transition to a sustainable society in so far asthey model sustainable practices and foster ecological literacy. Penn State, because of itsreputation for excellence, is in a unique position to lead other universities in demonstratinghow U.S. society can adopt truly sustainable practices.
8
For further information on the Indicators Report and the Green Destiny Council,contact Dr. Christopher Uhl (Faculty Coordinator at 208 Mueller Lab, University Park, PA16802; 814-863-3893; [email protected]) or Matt McLaughlin (Student Coordinator [email protected]). The web site for the Green Destiny Council (and for this report) iswww.bio.psu.edu/greendestiny/.
ParticipantsCoordinators: Christopher Uhl, Garrett Fitzgerald, and Amy AndersonResearch and Editing for Second Edition: Autumn Hanna and Katherine ZimmermanGraphics: Holly Marzec, Jeff Mathison and Bill MoyerGraduate Researchers: Dominik Kulakowski, Sharmila Chaudhuri, Renee SharpUndergraduate Researchers: Amy Balog, Mark Chilton, Patricia Cole, Ai Yan Deng, Rajika
Dravviam, Denise Ecker, Jason Ezratty, Christie Fallat, Garrett Fitzgerald, DanielleFree, Gina Giazzoni, Anne Hermes, Nate Hersh, John Kepner, Brian Kloepfer,Elizabeth Kozak, Amy Marino, Matt McLaughlin, Tim Murrell, Kelly Orr, DebbyPeterman, Jennifer Petullo, Joanna Phillips, Tim Powderly, Erin Questad, DavidSandy, Tammy Sanner, Henry Sauer, Megan Schuster, Eric Sheffer, Jan Snyder, EricaSyvertsen, and Seth Wilberding
Non-University Researchers: Amy Anderson and Jennifer GorospeAdvisory Committee: Robert Brooks, Robert Burkholder, Robert Carline, James
Eisenstein, Caren Glotfelty and Paul Ruskin.
AcknowledgementsWe are grateful to the following for their generous financial support:
Penn State STIR Program of the Pennsylvania Space Grant ConsortiumPenn State Center for SustainabilityFELT (Fund for Excellence in Learning and Teaching)STS (Science Technology and Society Program)PSU Intercollege Program in EcologyPSU Biology Department
We would like to thank the following people for providing information about PennState operations: Deborah Blythe, Eric Boeldt, Dave Branigan, Charles Brueggebors, MaureenClaver, Teresa Davis, Doug Donovan, Ron Eckenroth, John Gaudlip, Tom Gesell, TomGibson, Doug Holmes, Tom Houck, John Joseph, Robert Killoren, Peg Kimble, MattLapinsky, Kate Lumley-Sapanski, Al Matyasovsky, Betty Moore, Michelle Newhard,Bonnie Ortiz, Sue Rankin, Paul Ruskin, Dwight Smith, Curtis Speaker, Kevin Stahl, WilburWadlington, Lisa Wandel and Ruth Ann Witmer.
Of course, we take full responsibility for the accuracy of the presentation.
9
References
Bok, D. 1982. Beyond the Ivory Tower. Harvard University Press, Cambridge, MA.
Eagan, D. and D. Orr. 1992. The Campus and Environmental Responsibility. Jossey-Bass, San Francisco,CA.
Getman, J. 1992. In the Company of Scholars. University of Texas Press, Austin, TX.
Keniry, J. 1995. Ecodemia. National Wildlife Federation, Washington D.C.
Orr, D. 1992. Ecological Literacy. State University of New York Press, Albany, NY.
Orr, D. 1994. Earth in Mind. Island Press, Washington D.C.
Orr, D. 1999. Rating colleges. Conservation Biology
Pelikan, Y. 1992. The Idea of the University. Yale University Press, New Haven, CT.
Smith, A. 1993. Campus Ecology. Living Planet Press, Los Angeles, CA.
Smith, P. 1990. Killing the Spirit. Viking Press, New York, NY.
Solomon R. and J. Solomon. 1993. Up the University. Addison-Wesley Publishing Company, New York,NY.
Sustainable Seattle. 1995. Sustainable Seattle: Indicators of Sustainable Community. Sustainable SeattleMetrocenter, Seattle, WA.
Tierney, W.G. 1993. Building Communities of Difference. Bergin & Garvey, Westport, CT.
Uhl, C., D. Kulakowski, J. Gerwing, M. Brown, and M. Cochrane. 1996. Sustainability: a touchstoneconcept
for university operations, education, and research. Conservation Biology 10: 1308-1311.
Vitousek, P. M., H. A. Mooney, J. Lubchenco, and J. M. Melillo. 1997. Human domination of earth’secosystems. Science, July 25, pp. 494-497.
Wilshire, B. 1990. The Moral Collapse of the University. State University of New York Press, Albany, NY.
World Scientist’s Warning to Humanity. 1997. Union of Concerned Scientists, Boston, MA.
10
ENERGY
“State government must lead by example. We cannot expect more fromPennsylvania residents than we are willing to do ourselves. If we expectPennsylvanians to shift their environmental expectations beyond compliance,then we must shift ours toward sustainability, including a goal of zeroemissions achieved through pollution prevention and energy efficiency.”
Tom Ridge, Governor of Pennsylvania
IntroductionThis century has been characterized by worldwide fossil fuel dependency. At Penn
State, the expansion of building space, the increased use of electronic devices, and a growinguniversity population have led to a significant increase in the use of fossil fuels over the lasttwo decades. However, during this same period there have been many technologicalbreakthroughs in the realm of energy-use efficiency and conservation (McKinney and Schoch,1997; Hawken et. al., 1999). Hence, it is now possible for a university like Penn State toexpand its infrastructure and services while significantly reducing its total energyconsumption. As a research institution, especially one with a strong engineering program,Penn State has a wonderful opportunity to be a leader in the design and implementation ofhighly efficient and environmentally benign energy systems.
A sustainable energy system has the following characteristics:• Conserving. Every effort is made to increase energy-use efficiency and to use energy
mindfully.• Generated from renewable resources. A sustainable energy system runs, as much as
possible, on energy income (e.g. solar, wind, biofuels), not on energy capital (i.e., fossilfuels).
• Non-polluting. Care is taken to minimize pollution associated with energyconsumption.
An institution which seeks to use energy efficiently and prioritizes sources of energythat are renewable and non-polluting is moving towards sustainability. With this in mind, weconsidered the following three indicators:
1. Total and Per Capita Energy Consumption2. Consumption of Natural Gas vs. Coal on Campus3. CO2 Emissions
Indicator 1. Total and Per Capita Energy ConsumptionAt present rates of consumption, global supplies of fossil fuel energy will be
exhausted, for all practical purposes, within the next few centuries (Miller, 1997). Of evengreater concern is the environmental degradation (e.g., air pollution, acid precipitation, globalwarming) associated with fossil fuel use.
11
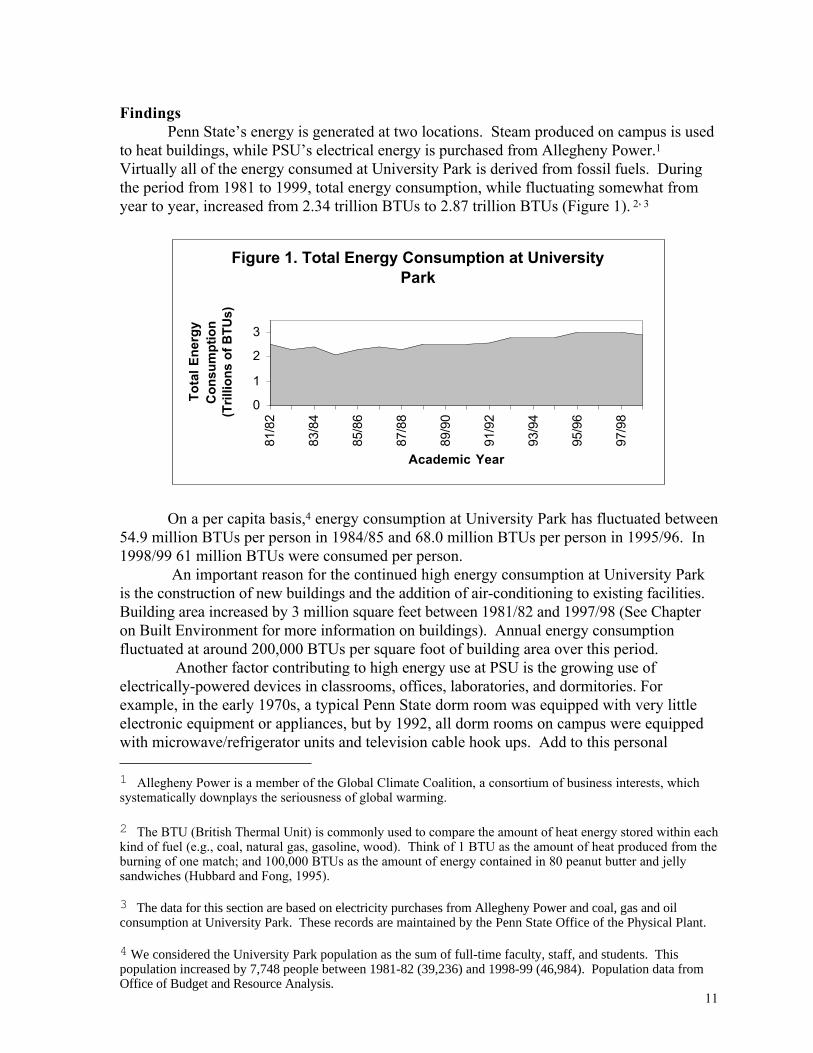
FindingsPenn State’s energy is generated at two locations. Steam produced on campus is used
to heat buildings, while PSU’s electrical energy is purchased from Allegheny Power.1
Virtually all of the energy consumed at University Park is derived from fossil fuels. Duringthe period from 1981 to 1999, total energy consumption, while fluctuating somewhat fromyear to year, increased from 2.34 trillion BTUs to 2.87 trillion BTUs (Figure 1). 2, 3
Figure 1. Total Energy Consumption at University Park
0
1
2
3
81/8
2
83/8
4
85/8
6
87/8
8
89/9
0
91/9
2
93/9
4
95/9
6
97/9
8
Academic Year
To
tal
En
erg
y C
on
sum
pti
on
(T
rilli
on
s o
f B
TU
s)
On a per capita basis,4 energy consumption at University Park has fluctuated between54.9 million BTUs per person in 1984/85 and 68.0 million BTUs per person in 1995/96. In1998/99 61 million BTUs were consumed per person.
An important reason for the continued high energy consumption at University Parkis the construction of new buildings and the addition of air-conditioning to existing facilities.Building area increased by 3 million square feet between 1981/82 and 1997/98 (See Chapteron Built Environment for more information on buildings). Annual energy consumptionfluctuated at around 200,000 BTUs per square foot of building area over this period.
Another factor contributing to high energy use at PSU is the growing use ofelectrically-powered devices in classrooms, offices, laboratories, and dormitories. Forexample, in the early 1970s, a typical Penn State dorm room was equipped with very littleelectronic equipment or appliances, but by 1992, all dorm rooms on campus were equippedwith microwave/refrigerator units and television cable hook ups. Add to this personal 1 Allegheny Power is a member of the Global Climate Coalition, a consortium of business interests, whichsystematically downplays the seriousness of global warming.
2 The BTU (British Thermal Unit) is commonly used to compare the amount of heat energy stored within eachkind of fuel (e.g., coal, natural gas, gasoline, wood). Think of 1 BTU as the amount of heat produced from theburning of one match; and 100,000 BTUs as the amount of energy contained in 80 peanut butter and jellysandwiches (Hubbard and Fong, 1995).
3 The data for this section are based on electricity purchases from Allegheny Power and coal, gas and oilconsumption at University Park. These records are maintained by the Penn State Office of the Physical Plant.
4 We considered the University Park population as the sum of full-time faculty, staff, and students. Thispopulation increased by 7,748 people between 1981-82 (39,236) and 1998-99 (46,984). Population data fromOffice of Budget and Resource Analysis.
12
computers and music systems and the amount of energy consumed in dorm rooms isconsiderable (See Box).
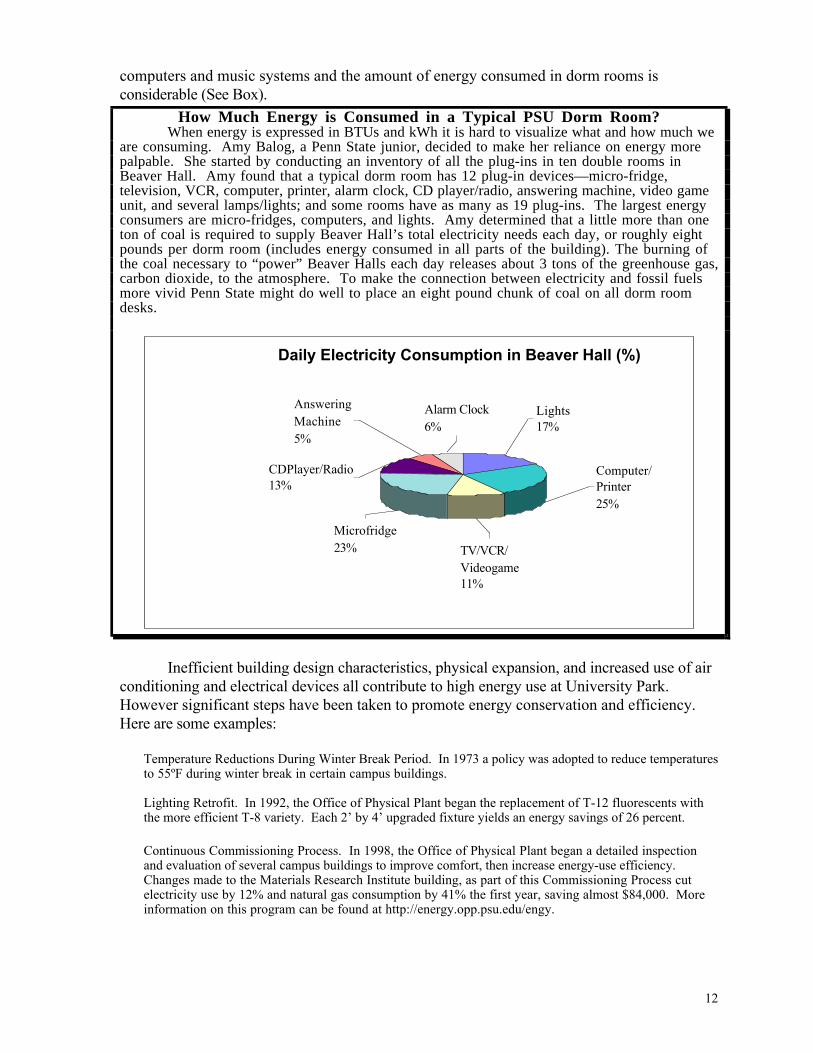
How Much Energy is Consumed in a Typical PSU Dorm Room?When energy is expressed in BTUs and kWh it is hard to visualize what and how much we
are consuming. Amy Balog, a Penn State junior, decided to make her reliance on energy morepalpable. She started by conducting an inventory of all the plug-ins in ten double rooms inBeaver Hall. Amy found that a typical dorm room has 12 plug-in devices—micro-fridge,television, VCR, computer, printer, alarm clock, CD player/radio, answering machine, video gameunit, and several lamps/lights; and some rooms have as many as 19 plug-ins. The largest energyconsumers are micro-fridges, computers, and lights. Amy determined that a little more than oneton of coal is required to supply Beaver Hall’s total electricity needs each day, or roughly eightpounds per dorm room (includes energy consumed in all parts of the building). The burning ofthe coal necessary to “power” Beaver Halls each day releases about 3 tons of the greenhouse gas,carbon dioxide, to the atmosphere. To make the connection between electricity and fossil fuelsmore vivid Penn State might do well to place an eight pound chunk of coal on all dorm roomdesks.
Daily Electricity Consumption in Beaver Hall (%)
Computer/Printer25%
Answering Machine5%
Alarm Clock6%
CDPlayer/Radio13%
Microfridge23% TV/VCR/
Videogame11%
Lights17%
Inefficient building design characteristics, physical expansion, and increased use of airconditioning and electrical devices all contribute to high energy use at University Park.However significant steps have been taken to promote energy conservation and efficiency.Here are some examples:
• Temperature Reductions During Winter Break Period. In 1973 a policy was adopted to reduce temperaturesto 55ºF during winter break in certain campus buildings.
• Lighting Retrofit. In 1992, the Office of Physical Plant began the replacement of T-12 fluorescents withthe more efficient T-8 variety. Each 2’ by 4’ upgraded fixture yields an energy savings of 26 percent.
• Continuous Commissioning Process. In 1998, the Office of Physical Plant began a detailed inspectionand evaluation of several campus buildings to improve comfort, then increase energy-use efficiency.Changes made to the Materials Research Institute building, as part of this Commissioning Process cutelectricity use by 12% and natural gas consumption by 41% the first year, saving almost $84,000. Moreinformation on this program can be found at http://energy.opp.psu.edu/engy.
13
• The Office of the Physical Plant is able to assess energy use in new campus buildings through a network ofbuilding sensors hooked to a Central Computer System. This sophisticated system allows OPP personnelto monitor building energy use minute-by-minute and to detect zones of energy waste. OPP is alsoinstalling electrical meters that can be read over the “backbone,” with trend data collected for analysis ofusage amounts and patterns.
A variety of measures have been undertaken over the years to reduce energyconsumption at Penn State; and improvements in energy efficiency in the late 90’s allowedPenn State to grow without increasing energy consumption. However, there is much morethat PSU could be doing. Penn State still lacks a comprehensive, long-term commitment tocreating the cleanest, most efficient, and sustainable energy system possible.
Indicator 2. Consumption of Natural Gas vs. Coal on CampusAs residents of Pennsylvania, we appreciate the tremendous benefits our coal
endowments have provided. At the same time, we know, first hand, the environmental andsocial costs of coal extraction and combustion: fatal accidents and disease, landscapedestruction, land subsidence, acid mine drainage, and acid rain (Miller, 1997).
Natural gas and coal are both non-renewable fossil fuels and their extraction,transport, and combustion have negative environmental impacts. But compared with coal,natural gas burns cleanly, emits only about half as much CO
2 per BTU generated, and usually
produces little or no CO, SOx, or particulate emissions (Sears, 1997 and Wilson and Morill,1998). Therefore, it is sensible to utilize this fuel as a transitional resource as we movetoward truly sustainable energy sources.
FindingsBetween 1981/82 and 1998/99, energy consumed from the burning of natural gas at
University Park decreased from 0.9 trillion BTUs to 0.25 trillion BTUs. This decreaseoccurred because Penn State instituted new particulate emissions control measures at itssteam plant in the mid-1980’s which reduced the demand for natural gas as a means ofmeeting air-quality standards.
While natural gas consumption declined from the 80s to the 90s, the burning of coalincreased from 1.6 trillion BTUs in 1981/82 to 2.6 trillion BTUs in 1998/99 (R. Watt, pers.comm., Allegheny Power; and PSU Office of the Physical Plant). Expressed as tonnage, PennState's total coal consumption increased steadily from about 87,000 tons in 1981/82 to157,400 tons in 1998/99. This translates to a per-capita increase of about 2,300 pounds(from about 4,400 pounds per person/year in 1981/82 to about 6,700 pounds/person in1998/99).5 All this coal is supplied from Pennsylvania coal fields (See Box).
5 Total coal consumption includes coal burned off-campus to provide electricity for University Park. This off-campus coal consumption is estimated from data on University Park energy consumption (OPP) and assumesthat Allegheny Power burns 0.8 pounds of coal to produce 1kWh of electricity (R. Watt, Energy Specialist,Allegheny Power).

14
From Coal Mines to Warm Buildings: Penn State’s Energy PathwayThe fossil fuels that we use in our cars,
offices and dorm rooms are derived from plantsthat grew on the earth long ago. Three hundredmillion years ago, the vegetation in large areas ofPennsylvania was swamp forest composed of giantferns and other primitive plants. As these plantsgrew and died, over tens of millions of years, theyformed deep organic matter deposits. Burial ledto increased pressure and temperature and graduallythe dead plant material was transformed into coal.When the temperature and pressure were very high,oil or gas were formed.
Thanks to these processes, Penn State has access to nearby coal. Currently our coal isextracted at an open-pit mine 110 miles from campus in West Freedom, Pennsylvania, by theK&C Coal Mining Company. After extraction, the coal is transported ten miles to the town ofSligo where it is cleaned and sorted before being trucked to PSU’s main steam plant at the cornerof College Avenue and Burrowes Street. In the course of a year, Penn State buys about 70,000tons of coal or 2,800 truck loads for heating purposes. The purchase price is $40.00 a ton. Alarge part of the remaining energy Penn State receives originates 45 miles from campus at a coal-burning, electricity generation plant in Shawville.
In sum, Penn State has come to rely increasingly on one of the more polluting forms ofenergy—coal (Indicator 2).
Indicator 3. Carbon Dioxide Emissions Associated with PSU Energy UseCoal is primarily composed of carbon and its combustion in the presence of oxygen
results in the emission of carbon dioxide. Penn State’s high energy consumption contributesto the rising pool of atmospheric CO
2.6 There is strong scientific consensus that increased
CO2 concentrations in the atmosphere are leading to climate change. The earth has already
heated up by a degree since the beginning of the Industrial Revolution; and the water level inoceans that cover most of the planet’s surface are clearly rising, both because of meltingglaciers and because water expands as it warms (McKibben, 1998).
FindingsThe emissions of carbon dioxide from the University Park, West Campus, Steam
Plant increased from about 118,000 tons in 1981/82 to about 178,000 tons in 1998/99. Thiscomes to just under four tons of CO2 emissions per person per year just for heating. Addingthe significant amount of energy (electricity) purchased from Allegheny Power and energyproduced from the combustion of natural gas, it turns out that in the 1990s, Penn State was
6
In addition to CO2 the PSU steam plant emits particulates, as well as nitrogen and sulfur oxides, and carbonmonoxide:
• Particulates. University Park particulate emissions were 14.4 tons in 1998. The inhalation ofparticulate matter can contribute to pulmonary distress and disease (Hall et. al.,1986).
• Nitrogen and sulfur oxides. University Park 1998 emissions of nitrogen oxides and sulfur oxidemeasured 309 tons and 1,679 tons respectively. These oxides are the primary contributors to acid rainwhich plagues our region (McKinney and Schoch, 1997).
• Carbon monoxide (CO). In 1998, 201 tons of CO were released from the University Park steam plant.CO in high concentrations has immediate health effects on humans and other mammals and can causerespiratory complications.
15
emitting 465,000 tons of carbon dioxide annually to supply its total energy needs.7 Thisamounted to approximately 10 tons per capita per year. A 1.6-acre patch of temperate forestwould be needed to sequester the amount of carbon dioxide emitted by each Penn Stater in1999 (Wackernagel and Rees, 1996).
Although Penn State has dramatically reduced emissions of particulates through theconstruction of a baghouse system at the West Campus Steam Plant, no significant measureshave been taken to reduce the CO2 emissions. However, there are initiatives that can be taken(See Box).
Reducing CO2 EmissionsIn a recent study Lachman (1999) showed how CO2 and other greenhouse gas emissions
could be halved at Penn State if certain measures are adopted; these include using natural gas forall energy needs and improving building energy efficiency by 20%.
One institution already working towards reducing its carbon dioxide emissions is theWorld Resources Institution (WRI). WRI is committed to reducing its CO2 emissions to zero by2005. Steps WRI is taking include turning off office equipment at night (expected to prevent 2.5tons of CO2 emissions annually), reducing paper use (a 10% reduction would reduce CO2
emissions by 4 tons), and videoconferencing instead of travelling (saving 88 pounds of CO2 per100 miles traveled by air). By taking these initiatives, WRI hopes to demonstrate that individualinstitutions can lead the way towards more sustainable practices.
Summary of Energy Indicators
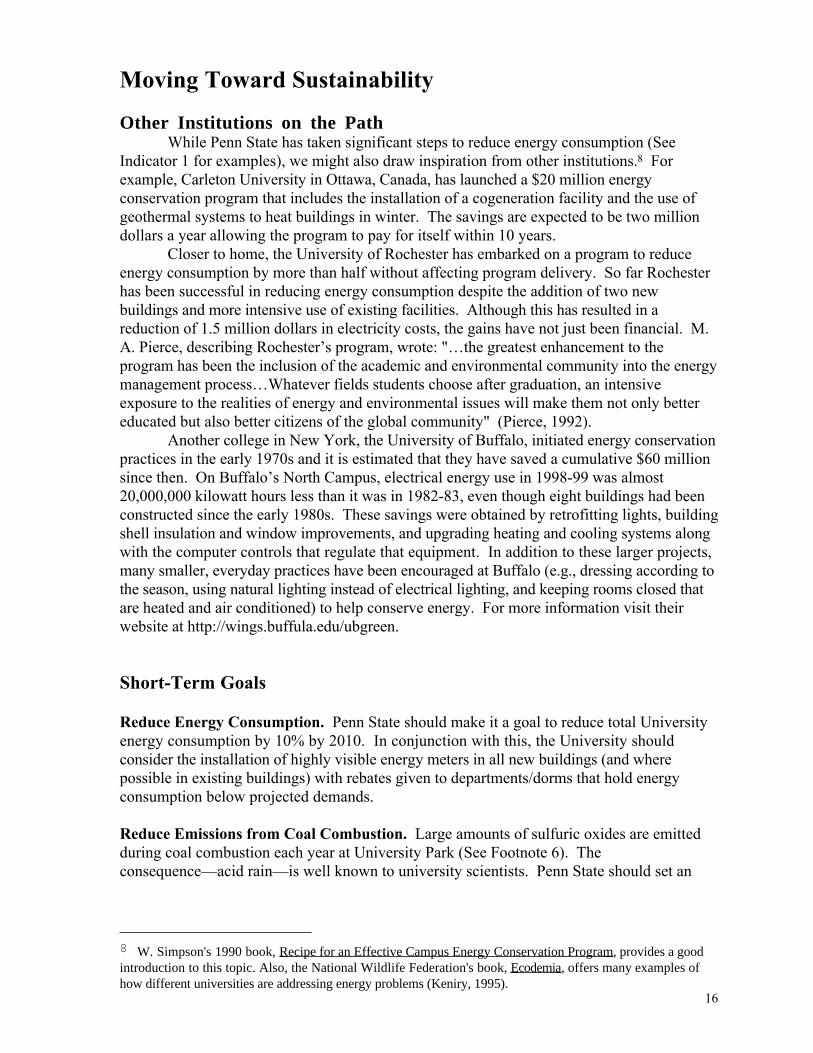
Total and perCapita EnergyConsumption
From the early 1980s to the mid-1990s, energyconsumption per capita at University Parkremained high, but in the late 1990s measurestaken to increase energy-use efficiency andthereby bring energy consumption downappeared to be yielding results; acomprehensive strategy aimed at reducing ourdependence on fossil fuels is still lacking.
Consumption ofNatural Gas vs.Coal on Campus
Between 1981 and 1999, coal consumption atUniversity Park increased by 1 trillion BTUswhile natural gas consumption decreased by0.65 trillion BTUs with no significant measurestaken to move towards renewable energyresources.
CO2 EmissionsAssociated withPSU Energy Use
Although the world’s scientists concur thatglobal warming is a serious problem, Penn Statepersists in releasing huge amounts ofCO2—about ten tons/person/year—into theatmosphere each year.
Although significant energy conservation measures have been undertaken at PennState in recent years, continued energy waste, increasing reliance on coal, and high emissionsof carbon dioxide all indicate that we need to do much more if we are to achieve sustainabilityin the energy realm.
7 Calculations are based on 2.86 lbs. CO2/kwh for electricity purchased from Allegheny Power and 124.6 lbs.CO2/million cubic feet for natural gas combustion (Hubbard and Fong, 1995).
16
Moving Toward Sustainability
Other Institutions on the PathWhile Penn State has taken significant steps to reduce energy consumption (See
Indicator 1 for examples), we might also draw inspiration from other institutions.8 Forexample, Carleton University in Ottawa, Canada, has launched a $20 million energyconservation program that includes the installation of a cogeneration facility and the use ofgeothermal systems to heat buildings in winter. The savings are expected to be two milliondollars a year allowing the program to pay for itself within 10 years.
Closer to home, the University of Rochester has embarked on a program to reduceenergy consumption by more than half without affecting program delivery. So far Rochesterhas been successful in reducing energy consumption despite the addition of two newbuildings and more intensive use of existing facilities. Although this has resulted in areduction of 1.5 million dollars in electricity costs, the gains have not just been financial. M.A. Pierce, describing Rochester’s program, wrote: "…the greatest enhancement to theprogram has been the inclusion of the academic and environmental community into the energymanagement process…Whatever fields students choose after graduation, an intensiveexposure to the realities of energy and environmental issues will make them not only bettereducated but also better citizens of the global community" (Pierce, 1992).
Another college in New York, the University of Buffalo, initiated energy conservationpractices in the early 1970s and it is estimated that they have saved a cumulative $60 millionsince then. On Buffalo’s North Campus, electrical energy use in 1998-99 was almost20,000,000 kilowatt hours less than it was in 1982-83, even though eight buildings had beenconstructed since the early 1980s. These savings were obtained by retrofitting lights, buildingshell insulation and window improvements, and upgrading heating and cooling systems alongwith the computer controls that regulate that equipment. In addition to these larger projects,many smaller, everyday practices have been encouraged at Buffalo (e.g., dressing according tothe season, using natural lighting instead of electrical lighting, and keeping rooms closed thatare heated and air conditioned) to help conserve energy. For more information visit theirwebsite at http://wings.buffula.edu/ubgreen.
Short-Term Goals
Reduce Energy Consumption. Penn State should make it a goal to reduce total Universityenergy consumption by 10% by 2010. In conjunction with this, the University shouldconsider the installation of highly visible energy meters in all new buildings (and wherepossible in existing buildings) with rebates given to departments/dorms that hold energyconsumption below projected demands.
Reduce Emissions from Coal Combustion. Large amounts of sulfuric oxides are emittedduring coal combustion each year at University Park (See Footnote 6). Theconsequence—acid rain—is well known to university scientists. Penn State should set an
8 W. Simpson's 1990 book, Recipe for an Effective Campus Energy Conservation Program , provides a goodintroduction to this topic. Also, the National Wildlife Federation's book, Ecodemia , offers many examples ofhow different universities are addressing energy problems (Keniry, 1995).
17
example by installing sulfur ‘scrubbers’ at our West Campus Steam Plant to reduce sulfuremissions.9
Switch to Natural Gas as Short-Term Transition Fuel. Natural gas burns clean andreleases only about one-half as much CO2/BTU as coal. Moving from coal to natural gaswould cost the University an additional four million dollars per year according to an OPPestimate—a significant outlay, yes, but still only a few tenths of one percent of theUniversity’s annual budget. Penn State should begin its transition to a fossil fuel-free,renewable energy future by substituting, to the extent possible, natural gas for coal at itsWest Campus Steam Plant. It is the ecologically responsible thing to do.
Long-Term Goal: Move Toward Fossil Fuel Independence
Penn State continues to rely completely on non-renewable sources of energy with nosign of shifting to renewable sources. The University needs to formulate a comprehensiveplan to guide it toward fossil-fuel independence over the next century. A way to begin is bypledging to increase the sustainable (renewable) portion of the University’s energy mix by10% of total consumption by 2010. How? Penn State now has the freedom to choose itsown energy provider. Rather than relying on a provider that depends almost exclusively oncoal for electricity production, PSU could begin to purchase a portion of its energy from a“green” supplier.10 Opportunities also exist for sustainable approaches to the heating andcooling of PSU’s buildings. For example, the use of geothermal heat pumps can lead tosignificant energy and cost savings.
In general, renewable energy alternatives are becoming increasingly competitive withconventional fossil-fuel technologies,11 and with research, interdisciplinary cooperation, andan engineering college as impressive as our own, Penn State could surely develop an energysystem that made significant use of the renewable resources available in our area.
Imagine a Penn State that runs entirely on energy ‘income’ instead of entirely onenergy ‘capital.’ Picture carefully designed buildings that use only one-tenth of the energy
9 Plans are underway to increase efficiency and reduce emissions of the West Campus Steam Plant by shiftingto a harder coal and making modifications on the boilers (e.g., modifying the ‘economizers’ so that less heatgoes out the stacks). Although this will help somewhat, it falls short of what is needed.
10 Public Institutions and businesses have an important role to play in ushering in a future based onsustainable energy. In California, government agencies are now the largest buyers of energy from renewableenergy suppliers (www.eren.doe.gov/); and in Pennsylvania, Kinkos, the photocopying and print servicescompany, has 15 of its stores using green (i.e., geothermal, hydro, wind, and solar) sources of electricity([email protected].). According to a March, 2000, OPP document, Penn State is also now consideringthe possibility of purchasing a portion of its electricity from a “green” energy supplier.
11 Usually unfairly dismissed as too costly to implement, major strides are now being made in the solar energyindustry to increase the efficiency and durability of solar technologies while simultaneously decreasing their cost(Walter et al., 1992). Although Pennsylvania’s northerly latitude and cloudy climate places limits on thepotential harvest of solar energy, modifications in the ways that we think about and design buildings wouldallow us to take advantage of the solar energy which is available. At present, not a single one of the almost700 buildings at University Park is designed or sited to take advantage of solar energy. Geothermal also offerspotential for our region. Local homeowners have already begun to adopt geothermal technologies for householdheating and cooling (Boyd, 1998); Penn State Office of the Physical Plant is interested in exploring geothermalenergy opportunities (P. Ruskin, pers. comm.)
18
that our present buildings require for heating, cooling, and lighting.12 Envision transparentsouth-facing walls designed to maximize solar gain in the winter and visualize rooftopsconstructed for the utilization of photovoltaic panels, solar heated water or wind turbineswhere appropriate.13 Finally, imagine Penn State taking a pioneering role in the developmentof sustainable geothermal technologies for the temperature regulation of buildings.
Sustainable energy use at Penn State should be characterized by energy conservationand the gradual transition to renewable and non-polluting energy sources. By becoming moresustainable we would not only create a cleaner environment, but we would also be creatingunique educational opportunities for students and faculty, and set an example for theCommonwealth.
References
Boyd, R. S. 1998. Global Warming Pact May Inspire New Energy Research. Pg. 38, Centre Daily Times,January 8.
Hall, C., J. Cutler, Cleveland, and R. Kaufmann. 1986. Energy and Resource Quality.John Wiley & Sons,
Inc. New York.
Hawken, P., A. Lovins, Hunter L. Lovins. 1999. Natural Capitalism. Little, Brown and Co. Boston, MA.
Hubbard, A. and C. Fong. 1995. Community Energy Workbook: A Guide to Building a SustainableEconomy. Rocky Mountain Institute. Snowmass, CO.
Keniry, J. 1995. Ecodemia. National Wildlife Federation, Washington, D.C.
Lachman, S. 1999. A Greenhouse Gas Inventory of the Pennsylvania State University Park Campus. MSThesis in Geography. Penn State University, University Park, PA.
McKibben, W. 1998. A special moment in history. Atlantic Monthly. Pages 55-60, 62-65, 68-73, 76.
McKinney, M. L. and R. M. Schoch. 1997. Environmental Science: Systems and Solutions. West Publ. Co.New York, NY.
Miller, G.T. 1997. Environmental Science. Wadsworth, New York.
Pierce, M. 1992. Campus Energy Management Programs. In Eagan, D. J., and Orr, D. W. (eds.), TheCampus and Environmental Responsibility. Jossey-Bass Publishers, San Francisco, CA.
Sears, P. 1997. Greenhouse Gas Reduction: Calculating Emissions Underscores Important Role of DistrictEnergy. District Energy, Fourth Quarter. Pages 8-10.
Simpson, W. 1990. Recipe for an Effective Campus Energy Conservation Program.Union of Concerned Scientists, Cambridge, MA.Wackernagel, M, and W. Rees. 1996. Our Ecological Footprint. New Society Publishers, Gabriola Island,
BC, Canada.
12 Such buildings are possible. They require that we implement conservation measures to reduce energyconsumption and adopt available technologies that dramatically increase energy-use efficiency (Hawken, et al.,1999).
13 Penn State will consider passive solar designs for new buildings and is presently evaluating a proposal touse photovoltaic power to supply a small portion of the Abington campus’ electricity needs.

19
Walter, B., L. Arkin, and R. Crenshaw. 1992. Sustainable Cities. Eco-Home Media, Los Angeles, CA.
Wilson, A. and J. Morill. 1998. Consumer Guide to Home Energy Savings. Amercian Council for anEnergy-Efficient Economy. Washingtion, D.C.
20
WATER “And how about water? Holy, Holy water. If you want to know how sacredwater is, then do as Native American Bill Wahpapah advised—go without it forfour days. One’s gratitude for the gift of water returns with that first sip.”
Matthew Fox
IntroductionWhen we spoke the word "water" to Penn State students, the words that frequently
came to their minds were "bottled", "tap" and "polluted." This is not surprising; we nolonger nurture our bodies with water; most of what we drink comes in cans and bottles. Howwe, as a university and as a culture, regard water says a lot about our prospects for creating asustainable world.
Although the United States is endowed with abundant surface and ground water, ourclean water supply is far from unlimited; careless water use and neglectful stewardship canlead to water contamination or even exhaustion.
Rapid growth is stressing the Spring Creek Watershed within which Penn State islocated. Citizens were first alerted to this in the 1970s when two highly toxic chemicals,kepone and mirex, manufactured at Nease Chemical (today known as Rutgers Organics) onBenner Pike, leaked from storage drums into the ground water and eventually into SpringCreek. To this day, Spring Creek's fish populations carry mirex in their tissues. Morerecently, activities associated with Penn State's airport expansion project resulted in sinkholeformation and rapid discharge of sediment-laden waters into Spring Creek. Another area ofconcern is PSU’s Big Hollow well field. Land adjacent to the well field has beencontaminated with: 1) chemical residues from fire fighter training activities and 2) leakagefrom Penn State gas tanks (Cheng, 1999; Pomponio, 1999; CDT staff, 1999).
Our porous limestone geology is delicate. On the one hand, it ensures us large storesof water, but on the other, it leaves our water open to contamination.
Sustainable water use has the following characteristics:• Conserving. Water is used carefully when needed, not wastefully.• Non-polluting. Surface and ground water are protected from contamination ensuring high
quality drinking water and demonstrating a respect for the biota and natural processes.• Cyclical. Water is captured and returned to the environment close to its point of use; the
biota cycle and clean “used” water.
If water consumption and disposal were steadily rising and our ground water wasshowing signs of pollution, we would have cause to be concerned about the long-termsustainability of our community. Based on this premise, we considered the followingindicators:
1. Total and Per Capita Water Consumption2. Ground Water Quality3. Waste Water Disposal
21
Indicator 1. Total and per Capita Water ConsumptionPenn State is located on top of a very large aquifer. The University’s easy access to a
seemingly endless supply of water may make us indifferent to water conservation.
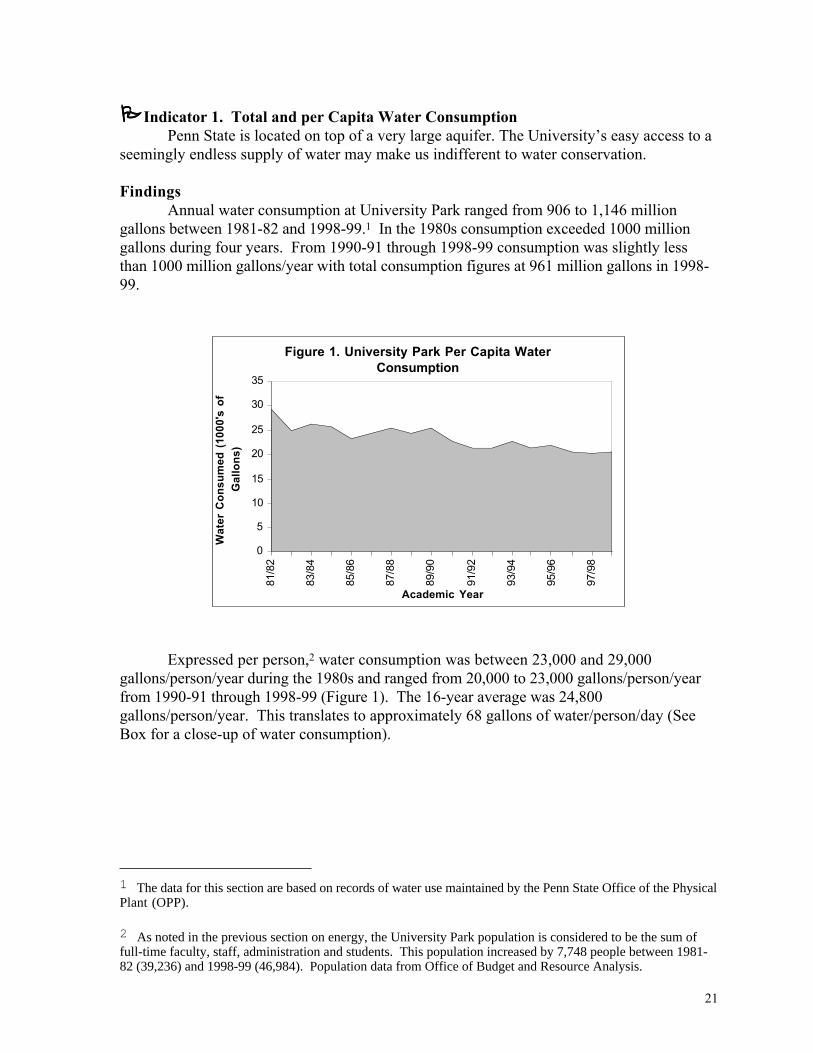
FindingsAnnual water consumption at University Park ranged from 906 to 1,146 million
gallons between 1981-82 and 1998-99.1 In the 1980s consumption exceeded 1000 milliongallons during four years. From 1990-91 through 1998-99 consumption was slightly lessthan 1000 million gallons/year with total consumption figures at 961 million gallons in 1998-99.
Figure 1. University Park Per Capita Water Consumption
0
5
10
15
20
25
30
35
81/8
2
83/8
4
85/8
6
87/8
8
89/9
0
91/9
2
93/9
4
95/9
6
97/9
8Academic Year
Wa
ter
Co
ns
um
ed
(1
00
0's
of
Ga
llo
ns
)
Expressed per person,2 water consumption was between 23,000 and 29,000gallons/person/year during the 1980s and ranged from 20,000 to 23,000 gallons/person/yearfrom 1990-91 through 1998-99 (Figure 1). The 16-year average was 24,800gallons/person/year. This translates to approximately 68 gallons of water/person/day (SeeBox for a close-up of water consumption).
1 The data for this section are based on records of water use maintained by the Penn State Office of the PhysicalPlant (OPP).
2 As noted in the previous section on energy, the University Park population is considered to be the sum offull-time faculty, staff, administration and students. This population increased by 7,748 people between 1981-82 (39,236) and 1998-99 (46,984). Population data from Office of Budget and Resource Analysis.
22
Water Use in Penn State DormsWe can appreciate the magnitude of water use at Penn State by examining the habits of
individual users. Take students living in Leete Hall, as an example. How do they use water?First, there are showers. The Leete Hall shower heads were installed in 1957 and have a
flow of 4-5 gallons of water per minute. There are a total of 40 shower stalls in the building.According to the results of a survey of Leete Hall residents, 85% of the students polled said thatthey showered once a day, and 75% of the respondents said that their shower time is between 10and 20 minutes. With a shower flow of 4 gallons per minute, one student would use an estimated40 gallons of water in a single 10-minute daily shower!
Another site of water use in Leete is the 48 flush toilets which were also installed in1957; they use 3.5 gallons of water per flush. Assuming that a student uses a flush toilet two tofive times per day, this adds 7-17 gallons of water consumption per day (not including urinal-related water use).
A third site for water use is bathroom faucets. The 1950s faucets in Leete have a flowrate of about 2.5 gallons per minute; this adds a couple more gallons to the tally.
The last major site for water use is the washing machines located in the basement ofLeete. Leete has 6 Maytag washers which use approximately 35 gallons of water per load.Assuming students do one load of wash per week adds another 5 gallons to daily waterconsumption. A summary of these various uses reveals that a typical Leete Hall residentconsumes about 60 gallons of water per day just in bathroom and clothes-washing relatedactivities [40 gallons (shower) + 10 gallons (toilet) + 2 gallons (sink) + 5 gallons (clotheswashing)].
The lower per capita water consumption in the 1990s vs. the 1980s is stronglysuggestive of a trend toward sustainability. The construction of a water cooling tower at theWest Campus Steam Plant to reduce water throughput, as well as efforts to remove once-through cooling for equipment in existing and new buildings are, in part, responsible fordeclining water consumption.3
The University’s comprehensive water-leak detection and repair protocols are alsocontributing to water conservation. Finally, water conservation has been accomplished bythe gradual shift to low-flow showerheads on campus: six hundred low-flow shower headswere installed in residence halls during the summer of 1999 and water-conservingshowerheads and toilets are now standard equipment in all new campus construction.
In sum, water use is declining at University Park and this is commendable.
Indicator 2. Ground Water QualityPenn State's water is vulnerable to several sources of contamination. In particular,
volatile organic compounds (VOCs) and nitrates can pose significant threats.4 VOCs includetetrachloroethylene (PCE), trichloroethylene, vinylchloride, as well as many othercompounds. PCE (used as a solvent in the dry cleaning industry) is a common contaminantof drinking water in Central Pennsylvania. This compound is toxic to aquatic animals,
3 It is important to note that OPP’s “Design and Construction Standards Manual” specifies water conservationmeasures (e.g., low volume flush valves and low flow shower heads) but there is sometimes a lengthy lag timebefore such recommendations are implemented.
4 The U.S. Environmental Protection Agency monitors about 70 water parameters.
23
carcinogenic to mice, and possibly carcinogenic to humans (Sitting, 1980). Nitrates, theprinciple other threat to the quality of Penn State’s water, occur naturally at low levels inunderground water supplies, but their levels can increase due to leaching of chemicalfertilizers and/or organic wastes. High nitrate levels in drinking water have been linked tomethemoglobinemia in infant mammals.Findings
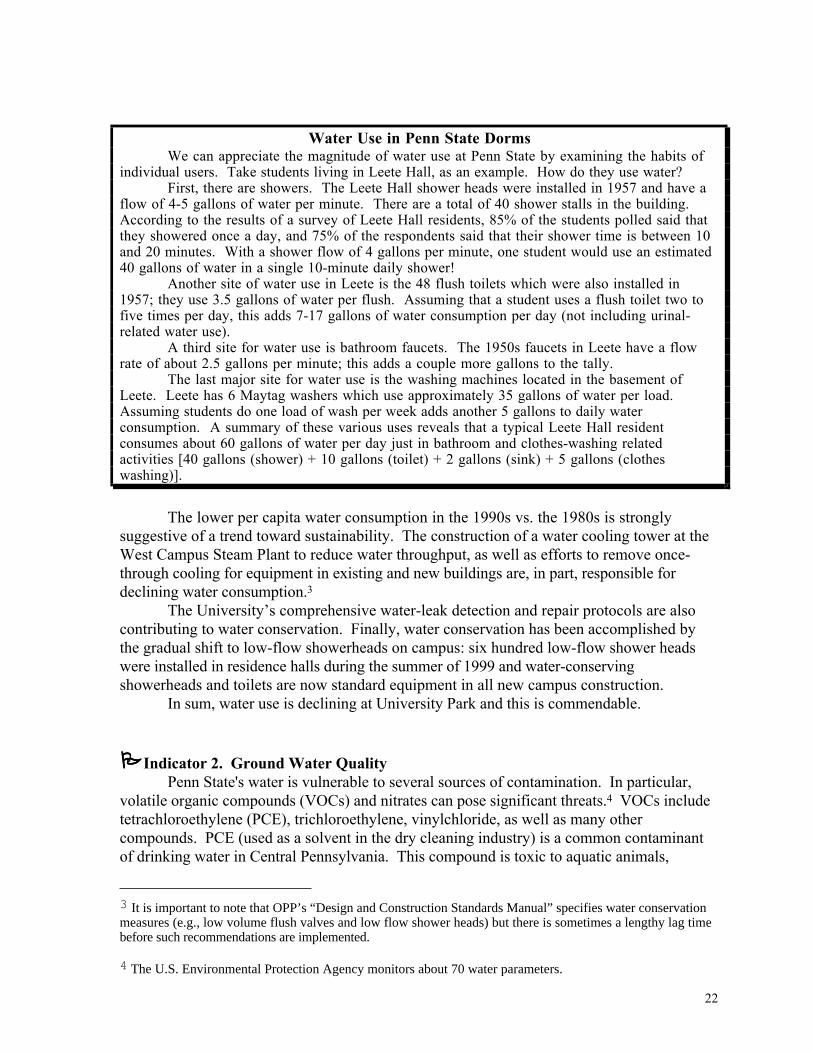
Average VOC concentrations in water drawn from PSU wells between 1988 and thefirst half of 1999 ranged from 0 to 0.6 ppb (Figure 2).5 While these averages are withinpublic health legal limits, water from some University wells was contaminated with VOCs inthe late 1980s. In 1987, three wells were closed due to high PCE concentrations (e.g., as highas 7 parts per billion). The "maximum allowable contaminant level" for PCE is 5 parts perbillion (Pennsylvania, DER).
Figure 2. Average VOC Concentration in University Park Well Water
0
0.1
0.2
0.3
0.4
0.5
0.6
0.7
Mar
-93
Sep
-93
Mar
-94
Sep
-94
Mar
-95
Sep
-95
Mar
-96
Sep
-96
Mar
-97
Sep
-97
Mar
-98
Sep
-98
Mar
-99
Av
era
ge
VO
C C
on
ce
ntr
ati
on
(P
art
s P
er
Bill
ion
)
PCE water contamination has become a concern in recent years. In August of 1997,high levels of PCE were discovered in a Penn State test well at Big Hollow Road. Threemonitoring holes were dug to check the groundwater; one tested 56 parts per billion of PCE,over 11 times the state regulation of 5 parts per billion. TCE, the cancer-causing chemicalfound in the drinking water in the feature film, A Civil Action, was also found at unsafe levelsat the site. Officials are uncertain of the source of PCE and other chemicals found in thegroundwater at Big Hollow (Cheng, 1999).
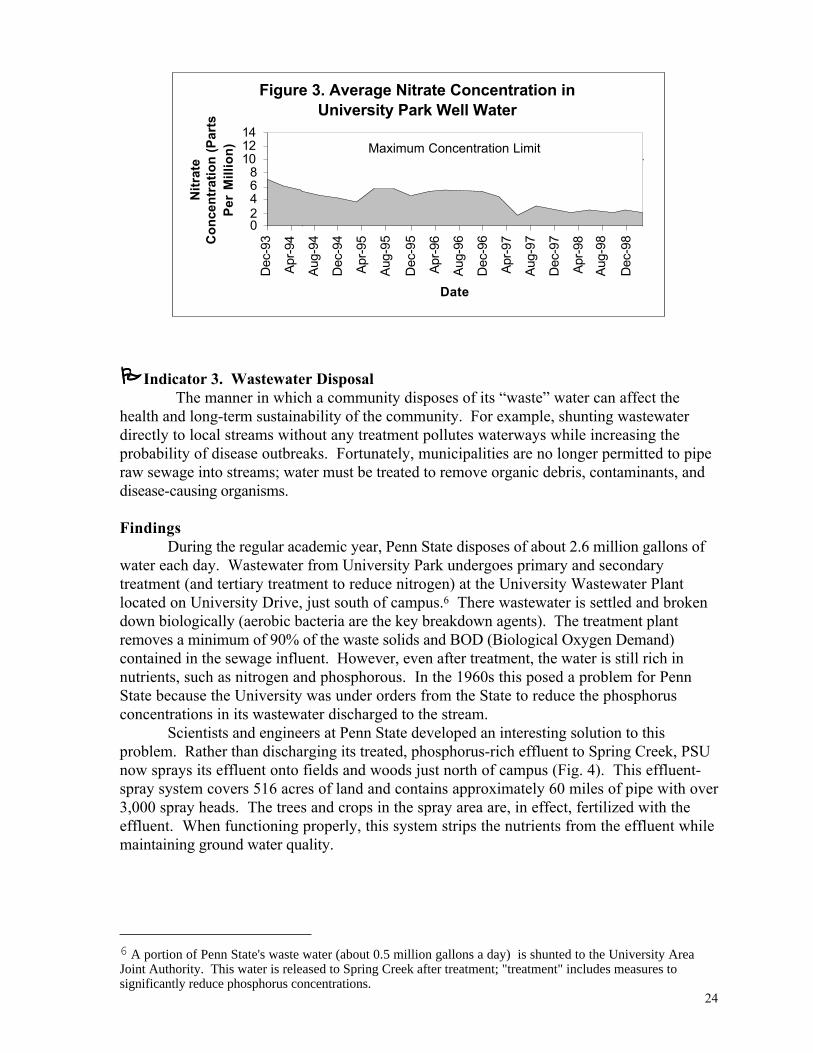
Average nitrate concentrations in PSU well water remained below 7 mg/l (7 parts permillion) between 1993 and early 1999 (Figure 3), although some individual wells had values ashigh as 8.8 parts per million. All values were below the EPA maximum allowablecontaminant limit of 10 parts per million.
In sum, although PSU’s water generally tests out as safe, there is growing concernabout long-term groundwater quality at Penn State.
5 Water in PSU wells/chlorine houses is tested every three months in accordance with Pennsylvania Departmentof Environmental Protection regulations.
24
Figure 3. Average Nitrate Concentration in University Park Well Water
02468
101214
Dec
-93
Apr
-94
Aug
-94
Dec
-94
Apr
-95
Aug
-95
Dec
-95
Apr
-96
Aug
-96
Dec
-96
Apr
-97
Aug
-97
Dec
-97
Apr
-98
Aug
-98
Dec
-98
Date
Nit
rate
C
on
cen
trat
ion
(P
arts
P
er
Mil
lio
n) Maximum Concentration Limit
Indicator 3. Wastewater Disposal The manner in which a community disposes of its “waste” water can affect the
health and long-term sustainability of the community. For example, shunting wastewaterdirectly to local streams without any treatment pollutes waterways while increasing theprobability of disease outbreaks. Fortunately, municipalities are no longer permitted to piperaw sewage into streams; water must be treated to remove organic debris, contaminants, anddisease-causing organisms.
FindingsDuring the regular academic year, Penn State disposes of about 2.6 million gallons of
water each day. Wastewater from University Park undergoes primary and secondarytreatment (and tertiary treatment to reduce nitrogen) at the University Wastewater Plantlocated on University Drive, just south of campus.6 There wastewater is settled and brokendown biologically (aerobic bacteria are the key breakdown agents). The treatment plantremoves a minimum of 90% of the waste solids and BOD (Biological Oxygen Demand)contained in the sewage influent. However, even after treatment, the water is still rich innutrients, such as nitrogen and phosphorous. In the 1960s this posed a problem for PennState because the University was under orders from the State to reduce the phosphorusconcentrations in its wastewater discharged to the stream.
Scientists and engineers at Penn State developed an interesting solution to thisproblem. Rather than discharging its treated, phosphorus-rich effluent to Spring Creek, PSUnow sprays its effluent onto fields and woods just north of campus (Fig. 4). This effluent-spray system covers 516 acres of land and contains approximately 60 miles of pipe with over3,000 spray heads. The trees and crops in the spray area are, in effect, fertilized with theeffluent. When functioning properly, this system strips the nutrients from the effluent whilemaintaining ground water quality.
6 A portion of Penn State's waste water (about 0.5 million gallons a day) is shunted to the University AreaJoint Authority. This water is released to Spring Creek after treatment; "treatment" includes measures tosignificantly reduce phosphorus concentrations.

25
Figure 4. A Highly Simplified Representation of the "Water Cycle" at Penn State.
Penn State's Water-Land Treatment System is innovative and approximates a naturalcycle,7 but considerable amounts of energy are required to pump and distribute thewastewater and there is a substantial opportunity cost associated with using a large tract ofland close to campus to receive the University’s wastewater. In addition, forested areasreceiving the spray have suffered severe winter ice damage, invasion of weedy edge species,and, in some cases, a general deterioration of forest structure. Finally there are concerns insome quarters that the present system is too small to continue to effectively cleanse the largeamounts of effluent being applied;8 however, the system is designed to receive a maximum of4 million gallons/day and current applications are only 2.7 million gallons/day (J. Gaudlip,pers. comm.).
7 Penn State’s Water-Land Treatment System has served as an important site for graduate training. Dozens ofPSU students in fields as diverse as Agronomy, Civil Engineering, Ecology, Geology, and Forestry, haveconducted Ph.D. and MS-level research at the site.
8 Several Penn State researchers expressed concerns about the long-term stability of the system (e.g.,Tamminga, 1995). One commented as follows: “I agree that the "living filter" (i.e., Water-Land TreatmentSystem) is innovative, but the University's system is not working properly and the University needs to fix it.The problem is that the system is undersized. The wastewater needs to be applied to a larger area of land.Forested areas should not be irrigated on a continuous basis. Dormant season storage should be added to thesystem. The University will need to spend money on the system. They know this but they are reluctant tobite the bullet.”
26
Summary of Water Indicators
Total and perCapita WaterConsumption
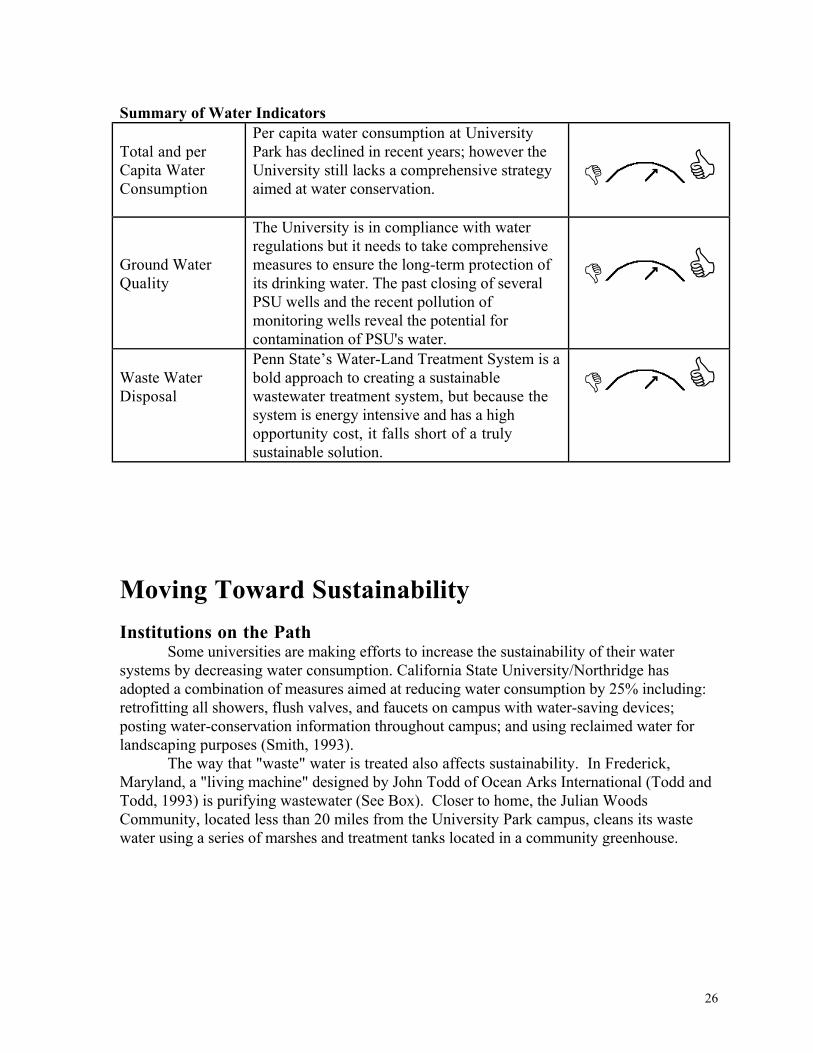
Per capita water consumption at UniversityPark has declined in recent years; however theUniversity still lacks a comprehensive strategyaimed at water conservation.
Ground WaterQuality
The University is in compliance with waterregulations but it needs to take comprehensivemeasures to ensure the long-term protection ofits drinking water. The past closing of severalPSU wells and the recent pollution ofmonitoring wells reveal the potential forcontamination of PSU's water.
Waste WaterDisposal
Penn State’s Water-Land Treatment System is abold approach to creating a sustainablewastewater treatment system, but because thesystem is energy intensive and has a highopportunity cost, it falls short of a trulysustainable solution.
Moving Toward Sustainability
Institutions on the PathSome universities are making efforts to increase the sustainability of their water
systems by decreasing water consumption. California State University/Northridge hasadopted a combination of measures aimed at reducing water consumption by 25% including:retrofitting all showers, flush valves, and faucets on campus with water-saving devices;posting water-conservation information throughout campus; and using reclaimed water forlandscaping purposes (Smith, 1993).
The way that "waste" water is treated also affects sustainability. In Frederick,Maryland, a "living machine" designed by John Todd of Ocean Arks International (Todd andTodd, 1993) is purifying wastewater (See Box). Closer to home, the Julian WoodsCommunity, located less than 20 miles from the University Park campus, cleans its wastewater using a series of marshes and treatment tanks located in a community greenhouse.
27
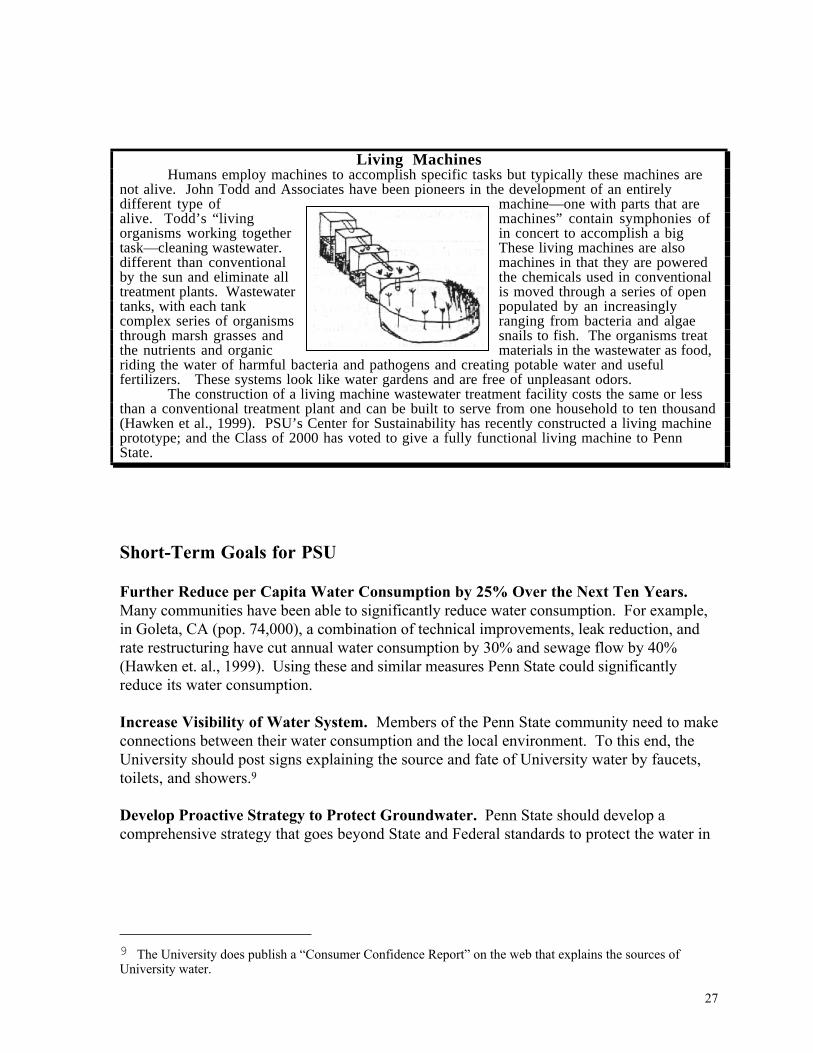
Living MachinesHumans employ machines to accomplish specific tasks but typically these machines are
not alive. John Todd and Associates have been pioneers in the development of an entirelydifferent type of machine—one with parts that arealive. Todd’s “living machines” contain symphonies oforganisms working together in concert to accomplish a bigtask—cleaning wastewater. These living machines are alsodifferent than conventional machines in that they are poweredby the sun and eliminate all the chemicals used in conventionaltreatment plants. Wastewater is moved through a series of opentanks, with each tank populated by an increasinglycomplex series of organisms ranging from bacteria and algaethrough marsh grasses and snails to fish. The organisms treatthe nutrients and organic materials in the wastewater as food,riding the water of harmful bacteria and pathogens and creating potable water and usefulfertilizers. These systems look like water gardens and are free of unpleasant odors.
The construction of a living machine wastewater treatment facility costs the same or lessthan a conventional treatment plant and can be built to serve from one household to ten thousand(Hawken et al., 1999). PSU’s Center for Sustainability has recently constructed a living machineprototype; and the Class of 2000 has voted to give a fully functional living machine to PennState.
Short-Term Goals for PSU
Further Reduce per Capita Water Consumption by 25% Over the Next Ten Years.Many communities have been able to significantly reduce water consumption. For example,in Goleta, CA (pop. 74,000), a combination of technical improvements, leak reduction, andrate restructuring have cut annual water consumption by 30% and sewage flow by 40%(Hawken et. al., 1999). Using these and similar measures Penn State could significantlyreduce its water consumption.
Increase Visibility of Water System. Members of the Penn State community need to makeconnections between their water consumption and the local environment. To this end, theUniversity should post signs explaining the source and fate of University water by faucets,toilets, and showers.9
Develop Proactive Strategy to Protect Groundwater. Penn State should develop acomprehensive strategy that goes beyond State and Federal standards to protect the water in
9 The University does publish a “Consumer Confidence Report” on the web that explains the sources ofUniversity water.
28
its aquifers.10 The plan should include “best management practices” for stormwatermanagement.
Long-Term Goal: End Water Waste
We envision a day in the near future when Penn State students, faculty andstaff, will be fully cognizant that water is a wellspring for life. In this moreenlightened Penn State, freshman orientation will include an initiationceremony—newcomers will be welcomed to the Spring Creek watershed and betaken out to the mountains and valleys to walk the headwater streams, searchunder rocks for aquatic insect larvae, visit wells, and enter caves that revealthis region’s limestone geology. At the end of the day, our newcomers will takeshowers recognizing that water doesn't simply come from a tap. Indeed, theywill see the entire watershed when they reach for the faucet.
With state-of-the art engineering and mindfulness, Penn State could reduce its waterconsumption by 4-fold. Here are some ideas for how this might be done: First, rather thantaking two perfectly good resources—pure water and human manure—and then ruining themboth through mixing to form wastewater, the University might keep them separate from thestart. There is a way to do this—the composting toilet. Second, rather than using 40 gallonsof water to bathe each day, University members could still have enjoyable showers, whileusing just 10 gallons of water. The answer: installation of more low-flow shower nozzles oncampus. Third, the amount of water used in the washing of dishes and clothes could be morethan halved using water saving technologies (Barnett and Browning, 1995). Fourth, there isno need to pump shower and washing water from wells and then shunt it to distant wastewaterprocessing facilities. Provided the materials are safe, the University can capture significantamounts of rainwater from its roof surfaces to use for washing purposes. Fifth, significantwater savings could be achieved by reusing graywater (i.e. water that has been used forwashing)11 rather than shunting it directly to wastewater treatment plants. Finally, the use of“living machines” to process building wastewater on site offers a cost-competitivetechnological alternative to conventional wastewater treatment facilities with remarkableeducational benefits. In sum, Penn State needs to shorten and tighten the water loop and in sodoing render wastewater a thing of the past.
References
Barnett, D.C. and W.D. Browning. 1995. A Primer on Sustainable Building. Green Development Series.Rocky Mountain Institute, Snowmass, CO.
CDT staff. 1999. Contaminated soil dig gets under way. Centre Daily Times, February. 10.
Cheng, Vicki. 1999. “DEP says drinking water is safe.” Centre Daily Times, January 10.
10 As an important step in this direction, the University has already delineated and mapped well headproduction areas for all well fields. All potential contamination sources (e.g., storage tanks, chemical storageareas, pesticide mixing facilities, and past contamination sites) are mapped within these protection areas.11 A graywater recovery system at the Roseland III office park (360,000 square feet) in Essex County, NewJersey, cut water use by 62% (Hawken et. al., 1999).
29
Hawken, P., A. Lovins and Hunter L. Lovins. 1999. Natural Capitalism. Little, Brown and Company,Boston.
Keniry, J. 1995. Ecodemia. National Wildlife Federation, Washington, D.C.
Pomponio, A. 1999. DEP: PSU waited to report gas leak. Centre Daily Times, October 6.
Sitting, M. 1980. Priority Toxic Pollutants: Health Impacts and Allowable Limits. Noyes Data Corporation,Park Ridge, NJ.
Smith, A. 1993. Campus Ecology. Living Planet Press, Los Angeles, CA.
Tamminga, K. 1995. Is the “living filter” sustainable? Assessing the land application of municipal effluent.The Environmental Professional. 17: 290-300.
Todd, J. and M. Todd. 1993. From Ecocities to Living Machines. North Atlantic Books, Berkeley CA.

30
MATERIAL RESOURCESAND WASTE DISPOSAL
"The wildfire spread of the consumer life-style around the world marks themost rapid and fundamental change in day-to-day existence the humanspecies has ever experienced. Over a few short generations, we havebecome car drivers, television watchers, mall shoppers, and throwawaybuyers."
AlanDurning
IntroductionMeasured in constant dollars, the world's people have consumed as many goods and
services since 1950 as all previous generations combined. Nowhere is consumerism morerampant than in the United States. On an average daily basis, each U.S. citizen nowconsumes (directly or indirectly) 115 pounds of basic materials—40 pounds of petroleumand coal, 29 pounds of minerals, 26 pounds of agricultural products and 20 pounds of forestproducts (Durning, 1992).
In terms of the consumption of materials, PSU shows no signs of straying from thenational pattern. A consequence of using such large amounts of materials is the generation ofimmense quantities of waste.
Sustainable materials use has the following characteristics:• Conserving. Products are carefully maintained and repaired; they are designed
intelligently with reuse in mind; and the use of virgin materials is kept to a minimum.• Non-polluting. Goods are manufactured in ways that minimize pollution.• Minimum waste. Material goods are always recycled thereby reducing the need for
virgin materials and lowering environmental costs associated with waste disposal.
When we treat our resources respectfully, reduce our reliance on superfluous goods,conserve and repair our possessions, and recycle our "wastes," we minimize damage to theenvironment and grow in self-reliance. We use three indicators to gauge the sustainability ofresource consumption and waste disposal at Penn State:
1. Total Waste Production2. Recycled Waste3. Paper Consumption
Indicator 1. Total Waste ProductionSolid waste is a by-product of consumption. This waste has to go somewhere, and in
the case of Penn State, it is either recycled or shipped to a landfill (See Box).
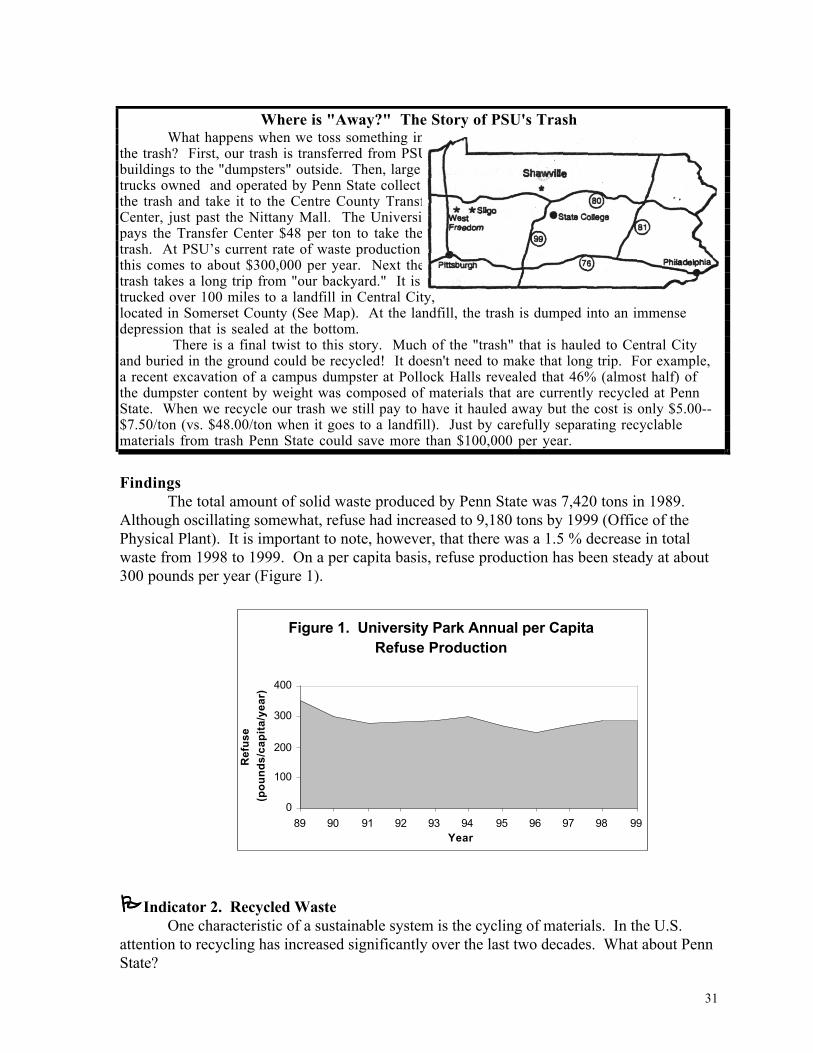
31
Where is "Away?" The Story of PSU's TrashWhat happens when we toss something in
the trash? First, our trash is transferred from PSUbuildings to the "dumpsters" outside. Then, largetrucks owned and operated by Penn State collectthe trash and take it to the Centre County TransferCenter, just past the Nittany Mall. The Universitypays the Transfer Center $48 per ton to take thetrash. At PSU’s current rate of waste productionthis comes to about $300,000 per year. Next thetrash takes a long trip from "our backyard." It istrucked over 100 miles to a landfill in Central City,located in Somerset County (See Map). At the landfill, the trash is dumped into an immensedepression that is sealed at the bottom.
There is a final twist to this story. Much of the "trash" that is hauled to Central Cityand buried in the ground could be recycled! It doesn't need to make that long trip. For example,a recent excavation of a campus dumpster at Pollock Halls revealed that 46% (almost half) ofthe dumpster content by weight was composed of materials that are currently recycled at PennState. When we recycle our trash we still pay to have it hauled away but the cost is only $5.00--$7.50/ton (vs. $48.00/ton when it goes to a landfill). Just by carefully separating recyclablematerials from trash Penn State could save more than $100,000 per year.
FindingsThe total amount of solid waste produced by Penn State was 7,420 tons in 1989.
Although oscillating somewhat, refuse had increased to 9,180 tons by 1999 (Office of thePhysical Plant). It is important to note, however, that there was a 1.5 % decrease in totalwaste from 1998 to 1999. On a per capita basis, refuse production has been steady at about300 pounds per year (Figure 1).
Figure 1. University Park Annual per Capita Refuse Production
0
100
200
300
400
89 90 91 92 93 94 95 96 97 98 99Year
Re
fus
e
(po
un
ds
/ca
pit
a/y
ea
r)
Indicator 2. Recycled WasteOne characteristic of a sustainable system is the cycling of materials. In the U.S.
attention to recycling has increased significantly over the last two decades. What about PennState?
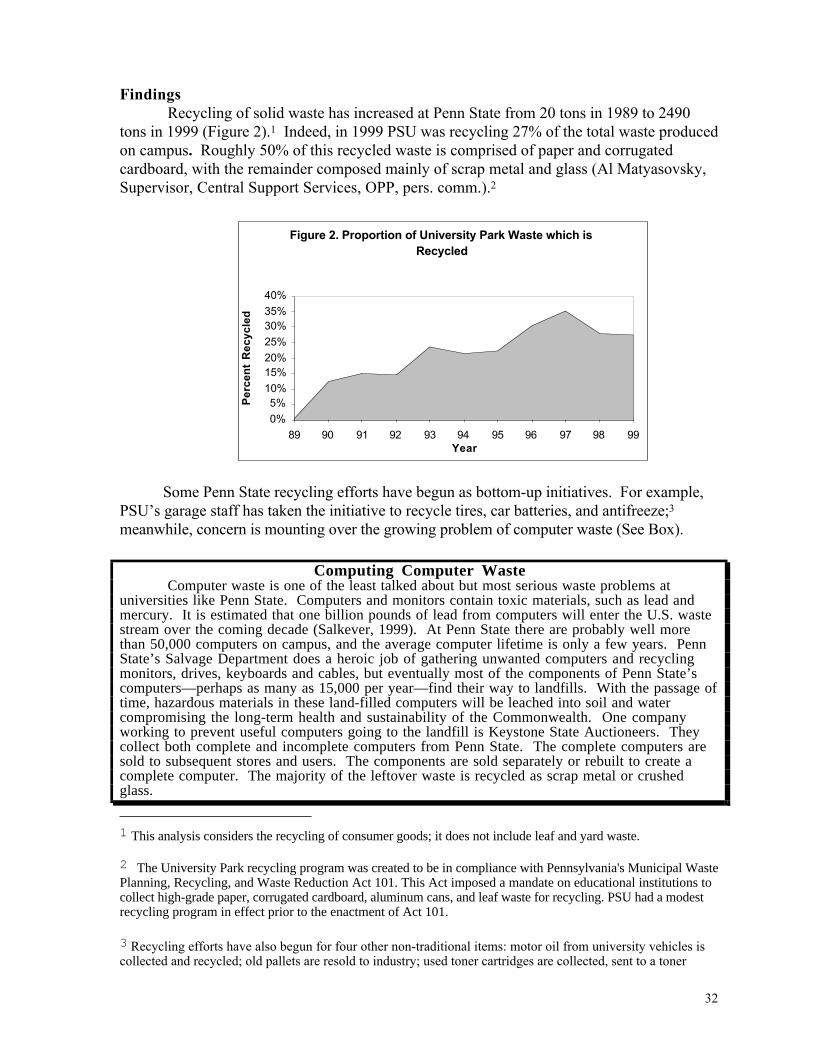
32
FindingsRecycling of solid waste has increased at Penn State from 20 tons in 1989 to 2490
tons in 1999 (Figure 2).1 Indeed, in 1999 PSU was recycling 27% of the total waste producedon campus. Roughly 50% of this recycled waste is comprised of paper and corrugatedcardboard, with the remainder composed mainly of scrap metal and glass (Al Matyasovsky,Supervisor, Central Support Services, OPP, pers. comm.).2
Figure 2. Proportion of University Park Waste which is Recycled
0%
5%10%
15%20%
25%
30%35%
40%
89 90 91 92 93 94 95 96 97 98 99Year
Pe
rce
nt
Re
cy
cle
d
Some Penn State recycling efforts have begun as bottom-up initiatives. For example,PSU’s garage staff has taken the initiative to recycle tires, car batteries, and antifreeze;3
meanwhile, concern is mounting over the growing problem of computer waste (See Box).
Computing Computer WasteComputer waste is one of the least talked about but most serious waste problems at
universities like Penn State. Computers and monitors contain toxic materials, such as lead andmercury. It is estimated that one billion pounds of lead from computers will enter the U.S. wastestream over the coming decade (Salkever, 1999). At Penn State there are probably well morethan 50,000 computers on campus, and the average computer lifetime is only a few years. PennState’s Salvage Department does a heroic job of gathering unwanted computers and recyclingmonitors, drives, keyboards and cables, but eventually most of the components of Penn State’scomputers—perhaps as many as 15,000 per year—find their way to landfills. With the passage oftime, hazardous materials in these land-filled computers will be leached into soil and watercompromising the long-term health and sustainability of the Commonwealth. One companyworking to prevent useful computers going to the landfill is Keystone State Auctioneers. Theycollect both complete and incomplete computers from Penn State. The complete computers aresold to subsequent stores and users. The components are sold separately or rebuilt to create acomplete computer. The majority of the leftover waste is recycled as scrap metal or crushedglass.
1 This analysis considers the recycling of consumer goods; it does not include leaf and yard waste.
2 The University Park recycling program was created to be in compliance with Pennsylvania's Municipal WastePlanning, Recycling, and Waste Reduction Act 101. This Act imposed a mandate on educational institutions tocollect high-grade paper, corrugated cardboard, aluminum cans, and leaf waste for recycling. PSU had a modestrecycling program in effect prior to the enactment of Act 101.
3 Recycling efforts have also begun for four other non-traditional items: motor oil from university vehicles iscollected and recycled; old pallets are resold to industry; used toner cartridges are collected, sent to a toner
33
In the past five years, Penn State has expanded its recycling efforts to include BeaverStadium football games. More than 165 tons of recyclable material have been saved from thelandfill as a result. Of course recycling helps but if consumption remains unchecked,sustainability will remain an illusive goal (See Box).
The Four “R’s”When it comes to addressing the problem of high resource consumption, there are four thingsthat Penn State might do. These have been called "The four R’s": Refuse, Reuse, Repair, andRecycle. The four R’s are listed in the order of their importance in contributing to sustainability:
1. Refuse. Begin by asking, "Does this product meet a true need?" By refusing to buy a product, we eliminate any impact and create no further demand for its production.
2. Reuse. If a product is necessary, it should be sturdy and capable of repeateduse.
3. Repair. The product should be easy to fix, thereby maximizing its useful life. 4. Recycle. The product should be capable of being recycled when its useful life
is over.At Penn State, we frequently prioritize the Four R's in reverse order (Recycling to Refuse).Sustainability is better served if we question the necessity of additional purchases and rely onrecycling only as a last resort.
Indicator 3. Paper ConsumptionThe use of paper worldwide has grown more than six-fold since 1950; and one-fifth of
all harvested wood goes to produce paper (www.greenatwork.com). At Penn State there aremany ways in which paper is used, from campus phone directories and course bulletins tonewspapers and notebooks. This should not be surprising. We are, afterall, a university andpaper is a wonderful medium for exchanging and storing information.
The paper that Penn State consumes is produced from trees—often natural forests inCanada or plantations in the southern United States. The forest trees that Penn Statedepends on are renewable resources: Cut them down and new ones grow back, provided thattree harvesting is done with care.
For this indicator we limit our focus to how carefully and conservatively Penn Stateuses paper resources. Profligate and wasteful use of paper will not be sustainable over thelong-term.
FindingsBecause of the myriad ways in which paper is used at Penn State, a measure of the
total amount of paper consumed is hard to obtain. But by examining PSU’s more paper-intensive activities we can gain an appreciation for the sheer volume of paper which theUniversity consumes.
General Stores purchases more than 100 different types of paper, accounting for closeto half of Penn State’s total paper consumption. About one fifth of the University’s paper-use is associated with the Daily Collegian. The Collegian is responsible for using about719,000 pounds of paper a year. Other major paper users include university publicationssuch as Intercom, The Penn Stater, and Research Penn State. The combined use of paper bythese three publications is approximately 300,000 pounds a year. Also, on a regular basis,each of Penn State’s 10 colleges puts out its own publication. For example, the College ofEngineering uses approximately 27,000 pounds for Engineering Penn State. Add to this the
cartridge refurbishing plant, and resold to General Stores at a reduced cost; and scrap metals from variouscampus locations are collected and marketed to off-campus vendors.
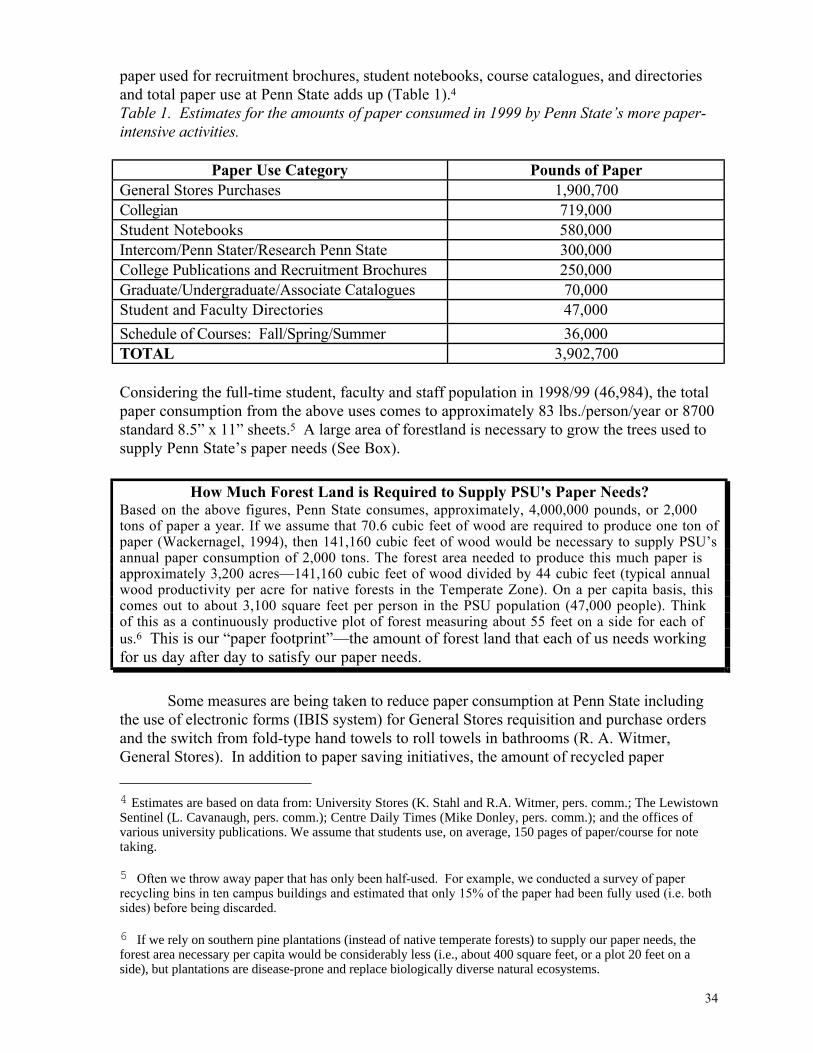
34
paper used for recruitment brochures, student notebooks, course catalogues, and directoriesand total paper use at Penn State adds up (Table 1).4
Table 1. Estimates for the amounts of paper consumed in 1999 by Penn State’s more paper-intensive activities.
Paper Use Category Pounds of PaperGeneral Stores Purchases 1,900,700Collegian 719,000Student Notebooks 580,000Intercom/Penn Stater/Research Penn State 300,000College Publications and Recruitment Brochures 250,000Graduate/Undergraduate/Associate Catalogues 70,000Student and Faculty Directories 47,000
Schedule of Courses: Fall/Spring/Summer 36,000TOTAL 3,902,700
Considering the full-time student, faculty and staff population in 1998/99 (46,984), the totalpaper consumption from the above uses comes to approximately 83 lbs./person/year or 8700standard 8.5” x 11” sheets.5 A large area of forestland is necessary to grow the trees used tosupply Penn State’s paper needs (See Box).
How Much Forest Land is Required to Supply PSU's Paper Needs?Based on the above figures, Penn State consumes, approximately, 4,000,000 pounds, or 2,000tons of paper a year. If we assume that 70.6 cubic feet of wood are required to produce one ton ofpaper (Wackernagel, 1994), then 141,160 cubic feet of wood would be necessary to supply PSU’sannual paper consumption of 2,000 tons. The forest area needed to produce this much paper isapproximately 3,200 acres—141,160 cubic feet of wood divided by 44 cubic feet (typical annualwood productivity per acre for native forests in the Temperate Zone). On a per capita basis, thiscomes out to about 3,100 square feet per person in the PSU population (47,000 people). Thinkof this as a continuously productive plot of forest measuring about 55 feet on a side for each ofus.6 This is our “paper footprint”—the amount of forest land that each of us needs workingfor us day after day to satisfy our paper needs.
Some measures are being taken to reduce paper consumption at Penn State includingthe use of electronic forms (IBIS system) for General Stores requisition and purchase ordersand the switch from fold-type hand towels to roll towels in bathrooms (R. A. Witmer,General Stores). In addition to paper saving initiatives, the amount of recycled paper
4 Estimates are based on data from: University Stores (K. Stahl and R.A. Witmer, pers. comm.; The LewistownSentinel (L. Cavanaugh, pers. comm.); Centre Daily Times (Mike Donley, pers. comm.); and the offices ofvarious university publications. We assume that students use, on average, 150 pages of paper/course for notetaking.
5 Often we throw away paper that has only been half-used. For example, we conducted a survey of paperrecycling bins in ten campus buildings and estimated that only 15% of the paper had been fully used (i.e. bothsides) before being discarded.
6 If we rely on southern pine plantations (instead of native temperate forests) to supply our paper needs, theforest area necessary per capita would be considerably less (i.e., about 400 square feet, or a plot 20 feet on aside), but plantations are disease-prone and replace biologically diverse natural ecosystems.
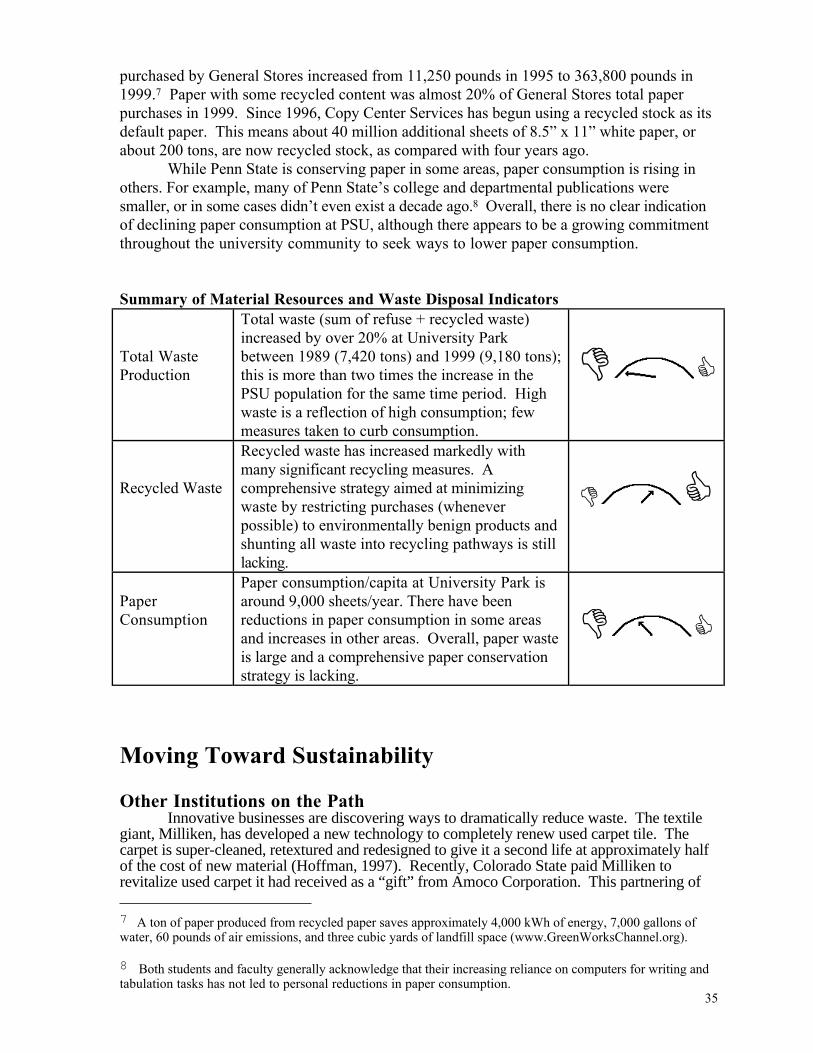
35
purchased by General Stores increased from 11,250 pounds in 1995 to 363,800 pounds in1999.7 Paper with some recycled content was almost 20% of General Stores total paperpurchases in 1999. Since 1996, Copy Center Services has begun using a recycled stock as itsdefault paper. This means about 40 million additional sheets of 8.5” x 11” white paper, orabout 200 tons, are now recycled stock, as compared with four years ago.
While Penn State is conserving paper in some areas, paper consumption is rising inothers. For example, many of Penn State’s college and departmental publications weresmaller, or in some cases didn’t even exist a decade ago.8 Overall, there is no clear indicationof declining paper consumption at PSU, although there appears to be a growing commitmentthroughout the university community to seek ways to lower paper consumption.
Summary of Material Resources and Waste Disposal Indicators
Total WasteProduction
Total waste (sum of refuse + recycled waste)increased by over 20% at University Parkbetween 1989 (7,420 tons) and 1999 (9,180 tons);this is more than two times the increase in thePSU population for the same time period. Highwaste is a reflection of high consumption; fewmeasures taken to curb consumption.
Recycled Waste
Recycled waste has increased markedly withmany significant recycling measures. Acomprehensive strategy aimed at minimizingwaste by restricting purchases (wheneverpossible) to environmentally benign products andshunting all waste into recycling pathways is stilllacking.
PaperConsumption
Paper consumption/capita at University Park isaround 9,000 sheets/year. There have beenreductions in paper consumption in some areasand increases in other areas. Overall, paper wasteis large and a comprehensive paper conservationstrategy is lacking.
Moving Toward Sustainability
Other Institutions on the PathInnovative businesses are discovering ways to dramatically reduce waste. The textile
giant, Milliken, has developed a new technology to completely renew used carpet tile. Thecarpet is super-cleaned, retextured and redesigned to give it a second life at approximately halfof the cost of new material (Hoffman, 1997). Recently, Colorado State paid Milliken torevitalize used carpet it had received as a “gift” from Amoco Corporation. This partnering of 7 A ton of paper produced from recycled paper saves approximately 4,000 kWh of energy, 7,000 gallons ofwater, 60 pounds of air emissions, and three cubic yards of landfill space (www.GreenWorksChannel.org).
8 Both students and faculty generally acknowledge that their increasing reliance on computers for writing andtabulation tasks has not led to personal reductions in paper consumption.
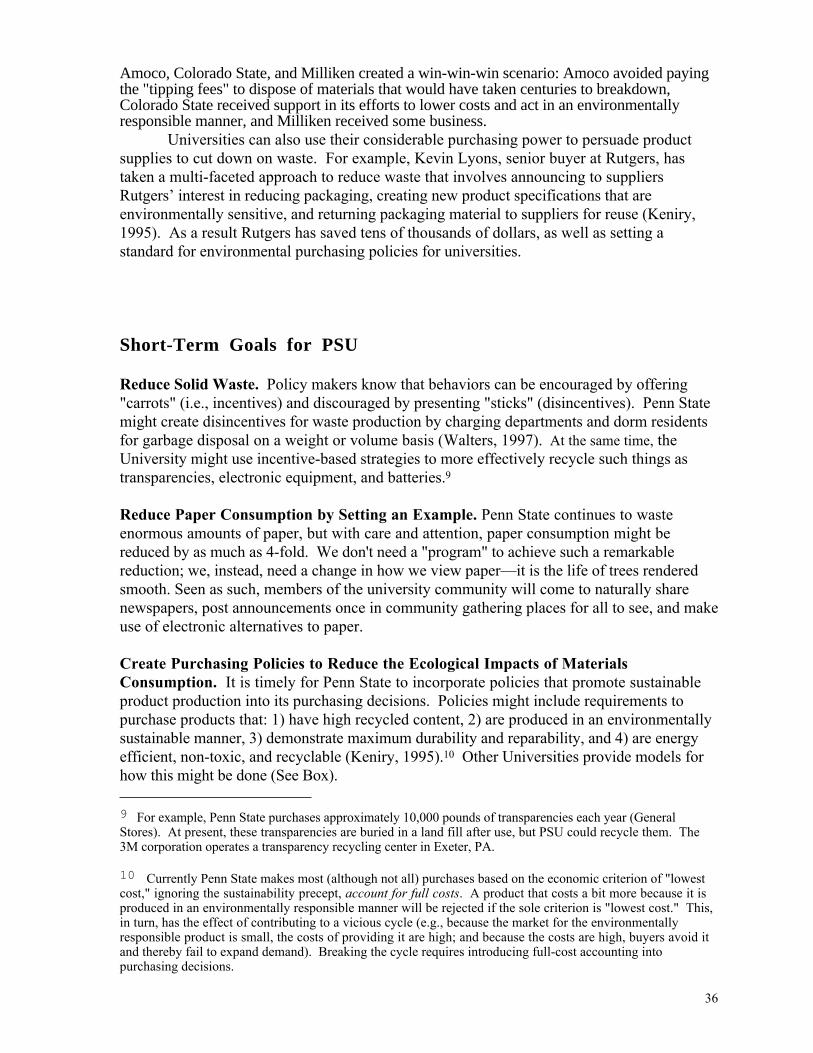
36
Amoco, Colorado State, and Milliken created a win-win-win scenario: Amoco avoided payingthe "tipping fees" to dispose of materials that would have taken centuries to breakdown,Colorado State received support in its efforts to lower costs and act in an environmentallyresponsible manner, and Milliken received some business.
Universities can also use their considerable purchasing power to persuade productsupplies to cut down on waste. For example, Kevin Lyons, senior buyer at Rutgers, hastaken a multi-faceted approach to reduce waste that involves announcing to suppliersRutgers’ interest in reducing packaging, creating new product specifications that areenvironmentally sensitive, and returning packaging material to suppliers for reuse (Keniry,1995). As a result Rutgers has saved tens of thousands of dollars, as well as setting astandard for environmental purchasing policies for universities.
Short-Term Goals for PSU
Reduce Solid Waste. Policy makers know that behaviors can be encouraged by offering"carrots" (i.e., incentives) and discouraged by presenting "sticks" (disincentives). Penn Statemight create disincentives for waste production by charging departments and dorm residentsfor garbage disposal on a weight or volume basis (Walters, 1997). At the same time, theUniversity might use incentive-based strategies to more effectively recycle such things astransparencies, electronic equipment, and batteries.9
Reduce Paper Consumption by Setting an Example. Penn State continues to wasteenormous amounts of paper, but with care and attention, paper consumption might bereduced by as much as 4-fold. We don't need a "program" to achieve such a remarkablereduction; we, instead, need a change in how we view paper—it is the life of trees renderedsmooth. Seen as such, members of the university community will come to naturally sharenewspapers, post announcements once in community gathering places for all to see, and makeuse of electronic alternatives to paper.
Create Purchasing Policies to Reduce the Ecological Impacts of MaterialsConsumption. It is timely for Penn State to incorporate policies that promote sustainableproduct production into its purchasing decisions. Policies might include requirements topurchase products that: 1) have high recycled content, 2) are produced in an environmentallysustainable manner, 3) demonstrate maximum durability and reparability, and 4) are energyefficient, non-toxic, and recyclable (Keniry, 1995).10 Other Universities provide models forhow this might be done (See Box).
9 For example, Penn State purchases approximately 10,000 pounds of transparencies each year (GeneralStores). At present, these transparencies are buried in a land fill after use, but PSU could recycle them. The3M corporation operates a transparency recycling center in Exeter, PA.
10 Currently Penn State makes most (although not all) purchases based on the economic criterion of "lowestcost," ignoring the sustainability precept, account for full costs. A product that costs a bit more because it isproduced in an environmentally responsible manner will be rejected if the sole criterion is "lowest cost." This,in turn, has the effect of contributing to a vicious cycle (e.g., because the market for the environmentallyresponsible product is small, the costs of providing it are high; and because the costs are high, buyers avoid itand thereby fail to expand demand). Breaking the cycle requires introducing full-cost accounting intopurchasing decisions.
37
Buffalo’s Procurement PolicyThe University of Buffalo has formally adopted thirteen environmental policies aimed at
“promoting environmental responsibility within the University community.” Buffalo’s campuspurchasing policy reads:
“SUNY Buffalo, through its strong commitment to environmental protection, will seek toutilize to the fullest extent possible, “environmentally friendly” products which, to whateverextent possible, have the following attributes or qualities:
--Durable, as opposed to single-use or disposable items--Made of recycled materials with high post-consumer content--Non-toxic or minimally toxic--Highly energy efficient in production and use--Manufactured in an environmentally sound, sustainable manner by companies with
goodenvironmental track records
--Causing minimal or no environmental damage during normal use or maintenance--Shipped with minimal packaging (consistent with care of the product), preferably made
of recycled and/or recyclable materials--Produced locally or regionally (to minimize the environmental costs associated with
shipping)” (http://wings.buffalo.edu/ubgreen).
Long-Term Goal: Become a Minimum-Waste University
"Nature's ecosystems have 3.8 billion years of experience in evolving efficient,complex, adaptive, resilient systems. Why should [institutions] reinvent thewheel, when the R & D has already been done?" G. Friend
Fifty years hence, it may well be that Penn State students and administrators willlook back at our current resource-intensive consumption model in astonishment, unable tocomprehend how an institution could consume so much and generate so much waste. If weachieve sustainability in the future, we will be relying only on a small fraction of the inputsthat we now require, and the wastes that we generate will be minuscule compared to today'samounts. We will have evolved from dependence on a wasteful "throughput" system to asustainable cyclic system.
Many business people and engineers are now working to create industrial processesthat eliminate waste altogether. These are referred to as "intelligent product systems"(Hawken, 1993). One strategy is to make products that are wholly biodegradable, (e.g.,capable of being transformed into food for another organism). In the case of durables whichcannot easily decompose (e.g., toasters, televisions, cars), an intelligent products approachwould entail leasing products to consumers. Products would be designed for easydisassembly and re-use. Already, car manufacturers are embracing this intelligent productapproach in Germany: Newer models are designed to be disassembled and parts are bar-codedto identify materials and facilitate re-use.
38
The idea of almost totally eliminating waste may sound radical but it isn't; rather it is asensible and necessary pre-requisite to true sustainability. Here, as in other areas, Penn Statecould, if it chooses, be among those leading the way. We could make it our mission to becomea "minimum-waste" university. We could do this through a series of well-conceived stepsdesigned to minimize waste on campus, while simultaneously coaxing our suppliers toward"zero waste" production technologies.11 Because of its size and prestige, Penn State alone, iscapable of sending strong signals to its suppliers and the collective power of all of America’s3,800 colleges and universities (combined annual buying power of $185 billion)—togetherwith their role as molders of vision and character—puts them in a unique position to promotezero-waste production systems throughout the nation (Cortese, 1999).
References
Cortese, A. 1999. The university as a model of sustainability. www.2nature.org
Durning, A. 1992. How Much is Enough? Worldwatch Environmental Alert Series. W. W. Norton, NewYork, NY.
Hawkin, P. 1993. The Ecology of Commerce. Harper Collins, New York, NY.
Hoffman, S. 1997. Eco-partners in education: a unique environmental initiative that bridges the gap betweencorporate America and the college campus. Pages 144-149 In: R. J. Koester (ed.), ConferenceProceedings: Greening of the Campus II: The Next Step. Ball State University, Muncie, IN.
Keniry, J. 1995. Ecodemia. National Wildlife Federation, Washington D.C.
Slakever, A. 1999. Information Age byproduct: a growing trail of toxic trash. Christian Science Monitor.
Thorpe, B. 1999. Citizens Guide to Clean Production. Clean Production Network, The University ofMassachusetts, Lowell.
Wackernagel, M. 1994. Biological Footprint and Appropriate Carrying Capacity: A Tool for PlanningToward Sustainability. UMI Dissertation Services, Ann Arbor, MI.
Walters, Laurel S. 1997. Coming soon to curbside: George Jetson gets your trash. The Christian ScienceMonitor, May 14.
11 How might Penn State exert its buying-power to encourage businesses to pursue zero-waste technologies?Two examples: 1) Penn State might announce independently, or in concert with other universities, that it willonly purchase products from companies that endorse the Valdez Principles (i.e., those that publicly commit towaste reduction, wise use of energy, and sustainable use of natural resources) (Thorpe, 1999). 2) Penn Statemight endorse the concept of Extended Producer Responsibility (EPR) by announcing that it will give specialpreference to companies that assume responsibility for taking back their products (e.g. computers, appliances,vehicles) at the end of their useful life. EPR has been enacted or is under serious consideration in Austria,Germany, Belgium, France, Japan, and the UK, as well as in numerous local jurisdictions (Thorpe, 1999).
39
FOOD “How we eat determines how the earth is used.” Wendell Berry
IntroductionFood: There is nothing more central to our existence! Throughout history humans
have sought it out in myriad forms, both animal and vegetable; they have celebrated itsplanting and its harvest; they have written poetry about it and fought wars over it.
Penn State is surrounded by farmland. Crop fields line many of our valley roads. Itcomes as a surprise to many that most of our local crop land is dedicated to growing food foranimals (e.g., roughly 99% of the corn produced in Centre County goes to feed animals;National Agricultural Statistical Summary) (See Box).
Our “Local” Food SystemOnly a small fraction of the food consumed at Penn State comes from local sources, but
our region could theoretically supply a significant portion of our dietary needs. Eric Sheffer(Penn State graduate student) has recently determined that each of us would require 0.6 acres ofCentre County cropland to provide our annual food needs (i.e., our grain, vegetable, fruit, dairy,and meat requirements), assuming a balanced (USDA-approved) diet. This means that theexisting cropland in Centre County (approximately 90,000 acres) could theoretically meet thedietary needs of the county’s entire population (158,000 people). Of course, such a diet wouldnot provide the variety of foods that we now enjoy year round, but Sheffer’s analysis does raisean important question: Might there be some happy medium between the impractical notion of100% local-food consumption and our present system of low local food consumption?
For Penn State students, a simple swipe of a card at one of the campus diningcommons provides access to fresh vegetables, fruits, hot entrees, sandwiches, soups, anddesserts. But don’t be fooled: The PSU food system is complex. It includes farm fieldactivities, as well as the processing, packaging, transport and retailing of the food we eat. Ateach step, the choices that are made have the potential to promote or underminesustainability.
A sustainable food system has the following characteristics:• Healthy diet. Food is wholesome; diet is balanced.• Low waste. Strong emphasis on waste elimination and recycling; food waste is
composted; packaging is minimized; disposable eating/drinking implements are rejected infavor of durable tableware.
• Regional orientation. Explicit linkages are made between a region's land and its foodproducing potential; government policies (both at federal and regional levels) fosterfarmland preservation, caps on farm size, crop and animal diversification, and regional (asopposed to predominantly global) alternatives to food production.
• Sound farming practices. Food is produced using non-damaging, ecologicallysustainable methods: Soils are carefully managed, becoming more fertile with time; pestsare controlled, to the extent possible, using biological and cultural techniques (as opposedto pesticides); and the amount of fossil fuel energy used to produce food is always less

40
than the energy contained in the food itself (i.e., the food system has a positive energybalance).1
A diet that is sustainable must foster both the health of the individual and the health ofthe environment. With this in mind we have selected three indicators of a sustainable foodsystem:
1. Dining Commons Diet2. Dining Commons Waste3. Food Purchasing Policies
Indicator 1. Dining Commons DietWith thousands of students being served every day in the Penn State dining halls,
there is tremendous potential for launching life-long healthy and responsible eating patternsby serving healthful food, educating students about nutrition, and demystifying our foodsystem.
FindingsMenu planning: Food Services at Penn State is a business that is primarily concerned
with satisfying the customer. Thus, the highest priority in menu planning at PSU is given tostudent preferences. “Acceptability ratings” are given to all entrees by calculating the averagenumber of servings taken by students at each meal. Decisions as to which foods to continueserving and the quantities to prepare are primarily based on these "student ratings" whichtend to be relatively high for things such as french fries, while low for others such asvegetables. However, Food Services is committed to providing healthy options to students.For example, at least one of the entrees served at each meal is nutritionally dense and one isvegetarian (Lisa Wandel, Associate Director of Food Services, pers. comm.; MicheleNewhard, Program Specialist, Food Services, pers. comm.).
Dining Commons education: Surrounded by an astounding array of foods at each meal,students may find it somewhat overwhelming to eat healthfully. For many years, FoodServices has provided labels with information on the fat and calorie content of the foods beingserved. More recently it implemented the "Five Star System" which provides furthernutritional information. Foods which are good sources of protein, for instance, have a proteinstar on the label. Information on such things as sensible eating, vitamins, and eating disordersis also made available through peer educators as part of PSU’s Health Works Programadministered jointly by the Nutrition Department and the Office of Health Promotion andEducation. A few attempts have even been made to elucidate the ecological and socialdimensions of our food system, including an advertising campaign, “Eat What You Take forEarth’s Sake.”
Student diet: We analyzed the food consumed during a typical Spring, 1998, week atRedifer, one of the Dining Commons at Penn State, to determine how closely student eatingpatterns match the healthful diet outlined in FDA’s Food Pyramid guide to healthy eating.2
1 The success of modern agriculture is due in large part to the availability of inexpensive fossil fuels. Indeed,we invest about ten times more energy (as fossil-fuel) to produce our food (includes energy used in foodprocessing, packaging, and transportation) than the food that we consume actually contains. Given thefiniteness of fossil fuel resources, this is not sustainable.
2 Our figures are based on total amounts of food consumed in the dining hall. The typical student diet will varyin so far as some students might eat more, some less, of the various food categories.
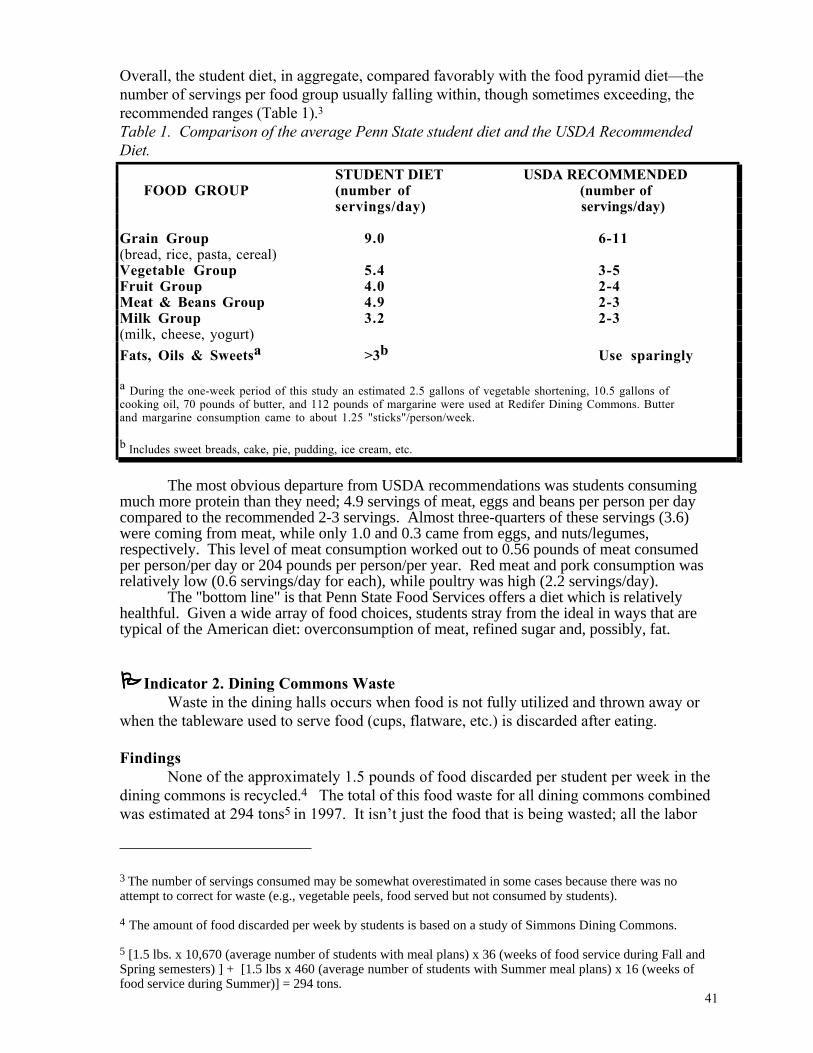
41
Overall, the student diet, in aggregate, compared favorably with the food pyramid diet—thenumber of servings per food group usually falling within, though sometimes exceeding, therecommended ranges (Table 1).3
Table 1. Comparison of the average Penn State student diet and the USDA RecommendedDiet.
STUDENT DIET USDA RECOMMENDEDFOOD GROUP (number of (number of
servings/day) servings/day)
Grain Group 9.0 6-11(bread, rice, pasta, cereal)Vegetable Group 5.4 3-5Fruit Group 4.0 2-4Meat & Beans Group 4.9 2-3Milk Group 3.2 2-3(milk, cheese, yogurt)
Fats, Oils & Sweetsa >3b Use sparingly
a During the one-week period of this study an estimated 2.5 gallons of vegetable shortening, 10.5 gallons ofcooking oil, 70 pounds of butter, and 112 pounds of margarine were used at Redifer Dining Commons. Butterand margarine consumption came to about 1.25 "sticks"/person/week.
b Includes sweet breads, cake, pie, pudding, ice cream, etc.
The most obvious departure from USDA recommendations was students consumingmuch more protein than they need; 4.9 servings of meat, eggs and beans per person per daycompared to the recommended 2-3 servings. Almost three-quarters of these servings (3.6)were coming from meat, while only 1.0 and 0.3 came from eggs, and nuts/legumes,respectively. This level of meat consumption worked out to 0.56 pounds of meat consumedper person/per day or 204 pounds per person/per year. Red meat and pork consumption wasrelatively low (0.6 servings/day for each), while poultry was high (2.2 servings/day).
The "bottom line" is that Penn State Food Services offers a diet which is relativelyhealthful. Given a wide array of food choices, students stray from the ideal in ways that aretypical of the American diet: overconsumption of meat, refined sugar and, possibly, fat.
Indicator 2. Dining Commons WasteWaste in the dining halls occurs when food is not fully utilized and thrown away or
when the tableware used to serve food (cups, flatware, etc.) is discarded after eating.
FindingsNone of the approximately 1.5 pounds of food discarded per student per week in the
dining commons is recycled.4 The total of this food waste for all dining commons combinedwas estimated at 294 tons5 in 1997. It isn’t just the food that is being wasted; all the labor
3 The number of servings consumed may be somewhat overestimated in some cases because there was noattempt to correct for waste (e.g., vegetable peels, food served but not consumed by students).
4 The amount of food discarded per week by students is based on a study of Simmons Dining Commons.
5 [1.5 lbs. x 10,670 (average number of students with meal plans) x 36 (weeks of food service during Fall andSpring semesters) ] + [1.5 lbs x 460 (average number of students with Summer meal plans) x 16 (weeks offood service during Summer)] = 294 tons.
42
and energy associated with the production, processing, transport, refrigeration, andpreparation of the discarded food is also wasted. On top of this, the University is obliged topay the tipping fees ($48.00/ton) to dispose of food "waste" (See Chapter on MaterialResources and Waste Disposal).
Efforts are underway to reduce food-related waste in the dining commons. In Fall of1996 several dedicated staff and faculty helped launch Project Earth Grow, a pilot program tocompost some of the waste produced in the dining commons. As of Fall 1999, 100% of thepre-consumer green waste6 and post-consumer paper napkins from seven PSU dining hallswas being composted.7 Although "throw-away" containers are still used for single servings ofitems like jelly, sugar and crackers, the tableware used to serve food is durable: plates andcups are porcelain, beverage containers are glass, and flatware is metal.8
In sum, although food continues to be wasted in Penn State’s dining halls, the use ofdurable tableware and the initiation of a strong food waste composting program are significantsteps toward sustainability.
Indicator 3. Food Purchasing PoliciesPenn State has the potential to exert great leverage through its food purchasing
decisions. Each dollar spent, in effect, is a vote for a certain way of doing things. Thus,through its food purchasing decisions, the University has the opportunity to pro-activelysupport a sustainable and just food system, if it so chooses.
FindingsIt is not easy to buy food for Penn State's myriad dining halls and food outlets. Thus,
it is natural that our food buyers seek dependable suppliers who offer a variety of foodproducts at reasonable prices (Lisa Wandel, Associate Director of Food Services, pers.comm.). While this certainly makes economic sense in the short term, it often does notpromote long-term food system sustainability.
Penn State Food Services has exclusive rights to provide all food on campus. Thismeans that campus food can only be supplied by specific certified food suppliers andvendors. This policy restricts access to certain highly desirable food types. For example,none of Penn State’s certified suppliers and vendors offer pesticide-free, organic foods.
In addition to price and convenience, an institution with a solid commitment topromoting a sustainable food system would consider the following:
• Practices involved in food production. In many cases the farming practices employed toproduce our food are not sustainable (Crews et al., 1991; Lacy, 1993) because they depletenatural capital—namely water and soil resources—upon which long-term food productiondepends. Penn State doesn't consider the sustainability of the practices involved in the
6 “Pre-consumer green waste” refers to plant wastes generated in meal preparation by the kitchen staff.
7 There are plans for a one-month pilot program to begin in Spring, 2000, to compost post-consumer greenwaste. The projected amount to be collected is close to 200 tons, which would bring the total for both pre- andpost-consumer composted waste to 500 tons. Composting this waste could result in projected savings of$24,000 (Al Matyasovsky, Supervisor, Central Support Services, OPP, pers. comm.).
8 However, paper, styrofoam and plastic containers are still the norm for serving food in the campus eateries(e.g., Ottos in Kern, The Cellar in the HUB).
43
production of the food it purchases. Consequently, it inevitably supports ecologicallyirresponsible farming, at least to some degree.
• Practices involved in packaging. Much of the food that we purchase, even that purchased indining halls, is excessively and wastefully packaged. Penn State has no policy which mightsteer it away from the purchase of excessively packaged foods, so the University misses anopportunity to use its buying power and prestige to signal producers regarding packagingpreferences.
• Treatment of animals. The treatment of poultry, swine and livestock raised in confinementfor human consumption is an issue of significant ethical concern in many quarters, but notone which enters into meat purchasing decisions at Penn State.
• Labor practices. The fact that U.S. food is relatively inexpensive often means thatconsumers are not paying the full costs involved in its production. Sometimes we fail to payenvironmental costs and pass on ecological debts to future generations. In other cases, wemay fail to pay social costs as when the production of food involves the unjust treatment offarm laborers. These concerns do not enter into Penn State's food purchasing decisions.
• Distances involved in food transport. Most of the food Penn State purchases comes from faraway (See Box). Some of these foods (e.g., coffee, tea, oranges, etc.) cannot be grown inPennsylvania and the fruits, vegetables and grains that can be grown here are only availableduring certain times of the year. Nevertheless, with the right policies and incentives, PennState could be consuming significant amounts of food from the Mid-Atlantic Region, therebycontributing to a healthy regional farm economy and significantly reducing the energyexpenditures involved in long-distance food transport. Penn State, however, does notconsider "distance" in its food purchasing decisions.
So Where Did that Lunch Come from?To gain a notion of the magnitude of our reliance on food produced in distant places, we
examined the dining hall lunch menu for one day (See Figure Below). We began by determiningthe ingredients of each menu item. Then we determined the distance each ingredient traveledfrom its last distribution point to Penn State. For example, the origins of the ingredients for thefirst item on the menu, New England Clam Chowder, were: clams from Seawatch International inMilford, Delaware; dried onions from Basic Vegetable Products in King City, California; frozenpotatoes from J.P. Simplot in Boise, Idaho; margarine from Dean Foods in Richmond, Virginia;flour from Pillsbury in Minneapolis, Minnesota; and white pepper from Atlantic Spices in Avenel,New Jersey. By de-constructing the entire menu in this way, we determined that the averagedistance traveled per menu ingredient was 873 miles. This was just the distance from the lastdistribution point to Penn State. The entire menu, summed over all ingredients, traveled over50,000 miles to reach Penn State.
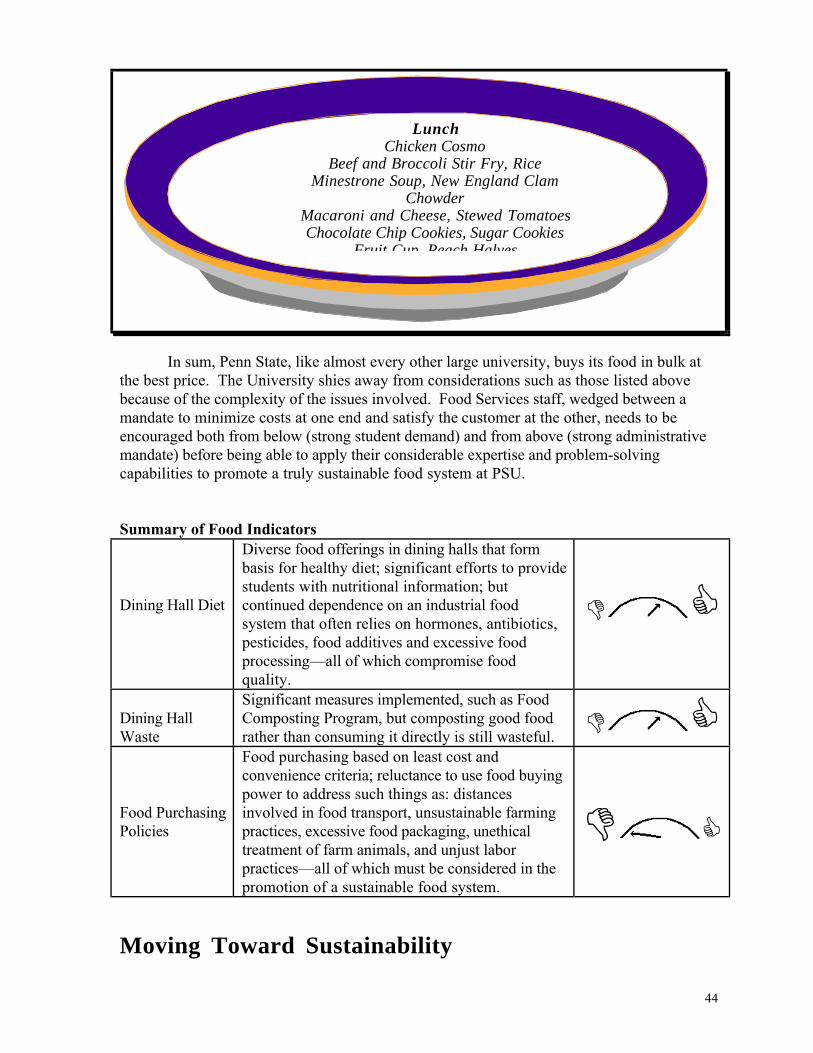
44
In sum, Penn State, like almost every other large university, buys its food in bulk atthe best price. The University shies away from considerations such as those listed abovebecause of the complexity of the issues involved. Food Services staff, wedged between amandate to minimize costs at one end and satisfy the customer at the other, needs to beencouraged both from below (strong student demand) and from above (strong administrativemandate) before being able to apply their considerable expertise and problem-solvingcapabilities to promote a truly sustainable food system at PSU.
Summary of Food Indicators
Dining Hall Diet
Diverse food offerings in dining halls that formbasis for healthy diet; significant efforts to providestudents with nutritional information; butcontinued dependence on an industrial foodsystem that often relies on hormones, antibiotics,pesticides, food additives and excessive foodprocessing—all of which compromise foodquality.
Dining HallWaste
Significant measures implemented, such as FoodComposting Program, but composting good foodrather than consuming it directly is still wasteful.
Food PurchasingPolicies
Food purchasing based on least cost andconvenience criteria; reluctance to use food buyingpower to address such things as: distancesinvolved in food transport, unsustainable farmingpractices, excessive food packaging, unethicaltreatment of farm animals, and unjust laborpractices—all of which must be considered in thepromotion of a sustainable food system.
Moving Toward Sustainability
LunchChicken Cosmo
Beef and Broccoli Stir Fry, RiceMinestrone Soup, New England Clam
ChowderMacaroni and Cheese, Stewed TomatoesChocolate Chip Cookies, Sugar Cookies
Fruit Cup Peach Halves
45
Other Institutions on the PathAlthough it is difficult to change deeply embedded food tastes and purchasing
patterns, several colleges have begun the exciting process of reinventing their food systems.For example, Hendrix College in Arkansas requires that food served in its cafeterias: 1) belocal when possible; 2) be grown using sustainable farming methods; 3) use minimal energy;4) leave marginal land out of production; and 5) involve the humane treatment of animals.When Hendrix initiated its program, less than 10% of the food served on campus came fromArkansas. Today, 30% comes from Arkansas and the college aims to reach 50%. Followingthe lead of Hendrix, both Carleton and Saint Olaf Colleges in Minnesota are also redesigningtheir food systems. Even at their more northerly latitudes, close to half of their foodpurchases could be local (Bakko and Woodwell, 1992). Closer to home, the Food Project atWilson College in Chambersburg, PA, is working to re-direct 30% of Wilson’s food budget tolocal growers.
These initiatives are not limited to small colleges. Both the University of Wisconsinand Cornell are altering their food buying practices. For example, at Cornell a studentorganization (The Cornell Food Project) works with Dining Services to increase the amountof locally produced foods served on campus. The Cornell Project also educates studentsthrough workshops held in dormitories and events such as "New York Harvest Week" (aweek in September when Cornell obtains all of its produce from local sources).
Short-Term Goals for PSU
Purchase Food from Central Pennsylvania. Penn State should formulate a clear policyto promote the purchase of regionally-grown (e.g., from a radius of 50 miles of UniversityPark) food for its dining halls and public eating places. Specifically, Penn State shouldcommit to purchase at least 10% of all its non-dairy food needs from regional growers by2010.9 A good place for PSU to start would be with crops such as onions, potatoes, wintersquash, beets, and carrots (i.e., crops that grow well in Central Pennsylvania and that couldbe purchased in large quantities at the end of the growing season and then stored inunderground “root cellars”). If Penn State sent a signal to local growers clearly indicating thatit was ready to buy significant quantities of these crops at prices that justly compensatedfarmers for their efforts, there is little doubt that farmers would respond.
Offer Organic Food in Dining Halls and Eateries. There is a growing demand for foodwhich is free of antibiotics, additives, and pesticide residues and which has not beengenetically modified—in short, certified organic food. Penn State should respond to thisdemand by offering organic food selections on campus.
Make the Food System Visible. Penn State needs to tell a more complete story about thefood it serves. For example, serving line labels in the dining commons could explain whereeach food offering comes from (Centre County, PA or Orange County, CA?) and whoprepared it (PSU or Nabisco?). Table "tents" could connect students with their food byeducating them about agriculture. On the whole, a more sustainable food system at Penn
9 At present, PSU spends about 13% of its food budget on PA-grown foods; most of this is dairy productswith small amounts of fruits and vegetables added in (Tom Gibson, pers. comm.).
46
State would be proactive rather than passive, recognizing that food is a great teacher (SeeBox) and taking advantage of this opportunity.
Union Street: Is PSU Traveling Down the Wrong Road?When Housing and Food Services began to plan for a redesigned food area named Union
Street in the expanded HUB/Robeson Center, they surveyed students and other universities togauge student preferences and trends in campus eateries. The surveys showed that PSU studentswere asking for national chains and that other universities were bringing “chains” on campus.Food Services decided that they would rename many of the restaurants from the old HUB, butalso develop new eateries around brand names such as Ortega, and recruit several national foodchains, such as Chick-Fil-A. Union Street was thus designed to create a “marketplaceatmosphere” that emphasizes “faster, more convenient service.”10
Most would agree that we need more space for social interaction on campus and, thus, theHUB expansion was greeted with considerable anticipation. However, Penn State may have goneastray by creating a space which: promotes national chains rather than local enterprises;encourages speed and convenience rather than mindful eating; and does all this in a"marketplace," rather than a "gathering place," atmosphere. To some extent, Union Streetreflects student preferences, but have we considered what it teaches?
Long-Term Goal: Purchase, to the Fullest Extent Possible, FoodsProduced Using Sustainable Practices
“Eating is a profoundly social and ecological event that connects us in the mostintimate and primary way to others, to our land, water, and soil, to the future,and to other species. As eaters, we not only consume agricultural products, wealso shape the relationship between agriculture and nature by our foodchoices.”
Dorothy Blair, Penn State Professor ofNutrition
Penn State should use its research and extension expertise to actively guide theCommonwealth toward a food system which respects life, family farms, healthy soil, regionaleconomies and wholesome food (instead of one increasingly centered on geneticallyengineered crops, industrial farming and excessively processed food).
If we are to create a truly sustainable food system, we will need to draw in oursupply lines. A more regionally-oriented food system would not only ease our reliance onfossil fuels for food delivery and processing (Valen, 1992), but help foster connectionsbetween urban residents, the land, and the farmers who work the land.
Penn State has power and prestige. Rather than settling for our current unsustainablefood system, the University could use its power and influence to promote a more sustainablefood system. If this occurs, it would create a “win-win” situation that meets the needs of thecampus population and earns the support of the people who live in our region. FollowingPenn State’s leadership, other institutions such as hospitals, corporations, and governmentagencies could become markets for regional food producers who use healthy andenvironmentally sensitive production methods.
10 David Gingher, Assistant Director of Food Services for Union Street, in the July 17, 1998, Intercom.
47
References
Bakko, E.B. and J.C. Woodwell. 1992. The Campus and the Biosphere Initiative at Carleton and Saint OlafColleges. In Eagan, D.J. and Orr, D.W. (eds.), The Campus and Environmental Responsibility.Jossey-Bass Publishers, San Francisco, CA.
Crews, T.E., C.L. Mohler, and A.G. Power. 1991. Energetics and ecosystem integrity:The defining principlesof sustainable agriculture. American Journal of Alternative Agriculture 6(3): 146-149.
Lacy, W.B. 1993. Can agricultural colleges meet the needs of sustainable agriculture? American Journal ofAlternative Agriculture 8(1): 40-45.
Pimentel, D., L. E. Armstrong, C. A. Flass, F. W. Hopf, R. B. Landy and M. H. Pimentel. 1989.Interdependence of food and natural resources. In D. Pimentel and C. W. Hall (eds.) Food andNatural Resources. Academic Press, Sand Diego, pp. 32-48.
Strange, M. 1988. Family Farming: A New Economic Vision. University of Nebraska Press, Lincoln, NB.
48
LAND "All ethics so far evolved rest upon a single premise: that the individual isa member of a community of interdependent parts…The land ethic simplyenlarges the boundaries of the community to include soils, waters, plants,and animals, or collectively: the land."
Aldo Leopold
IntroductionLand in the U.S. and throughout the world is increasingly seen as a
commodity—something to profit from in the short term with little thought for the future. So itis that farmlands in Central Pennsylvania are sold off to developers. Land that grew corn forgenerations now spawns housing tracts, four-lane highways, malls, and parking lots.
In the past, land carried deep meaning—tribal homeland, holy mountain, ancestralbirthplace, mother earth (See Box); but as we become more disconnected from our home place,land loses its deeper significance, often becoming a mere bargaining chip—a commodity—tobe bought and sold at strategic moments.
Sustainability Begins with Respect for the Land’s HistorySeveral Native American archeological sites exist on Penn State property. One such site
encompasses the land around the Orchard Road/Park Avenue intersection (just beyond BeaverStadium). This site was a Native American “quarry” used for several thousand years startingabout 8,000 years ago. Jasper, an iron-rich, flinty stone, occurs as scattered surface nodules in thisarea. The remains of several jasper “chipping stations” can still be found below the "quarry" (J.Hatch, PSU Professor of Archeology, pers. comm.). When archeological sites are altered, such asby development, they lose their scientific value and can no longer instruct us on the past.
Sustainable land stewardship has the following characteristics:• Values the native biota. Supporting and protecting the life that is native to a region
strengthens the community’s identity and ensures that the region’s unique naturalecosystems remain healthy.
• Respects natural processes. Allowing natural cycles and processes (e.g., birth/death,growth/decomposition) to operate reduces the cost of land maintenance and providesopportunities to promote ecological literacy.
• Conserves green space. Providing special protection to natural areas, open spaces, andfertile farmland helps ensure that poorly planned "development" does not sprawl across thelandscape.
In a sustainable landscape, land ownership should be guided by adherence to a well-thought-out land ethic; vegetation should be primarily composed of native species that haveplayed an important role in local history; impervious surfaces should be kept to a minimum;and campus grounds should be self-maintaining and pesticide free to the extent possible. Withthis in mind, we selected the following indicators:
1. Land Accumulation and Policies2. Percent of Campus Land Covered by Impervious Surfaces3. Native vs. Exotic Plants on Campus4. Pesticide Use in Land Care
Indicator 1. Land Accumulation and PoliciesAn ethic based on sustainability principles calls the University to be a wise steward of
its lands. Hence, we begin by examining Penn State's land holdings, paying particularattention to policies which might promote responsible land stewardship.
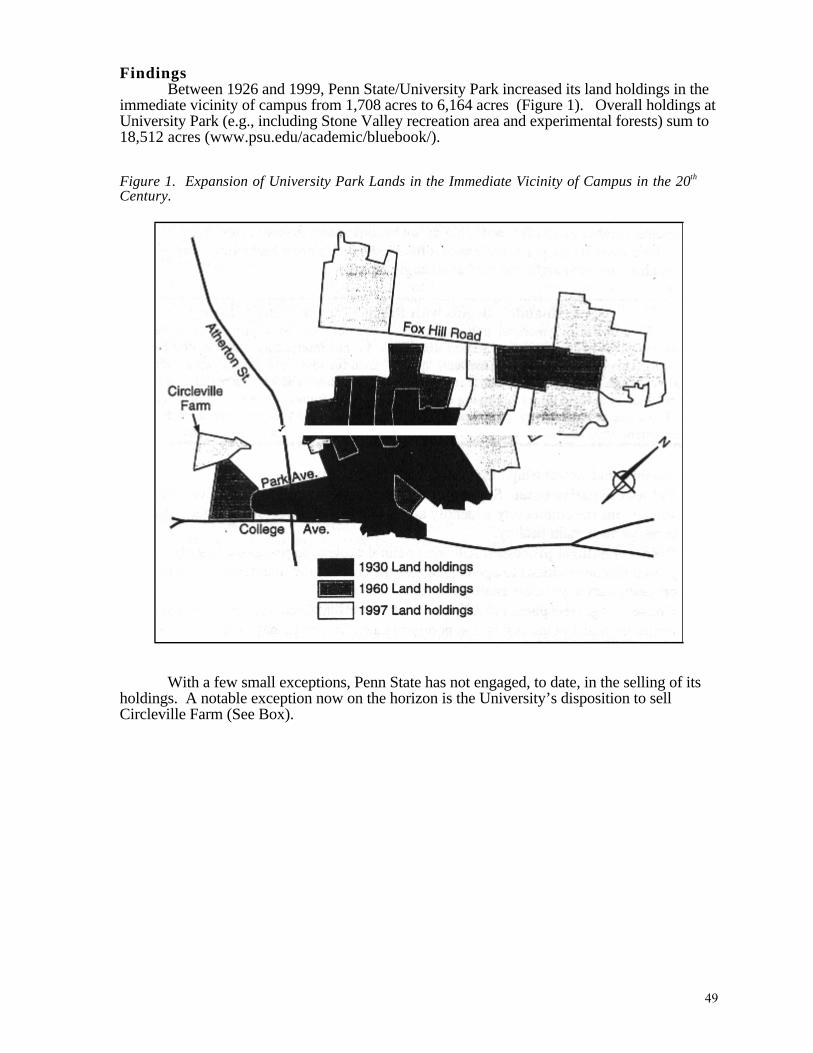
49
FindingsBetween 1926 and 1999, Penn State/University Park increased its land holdings in the
immediate vicinity of campus from 1,708 acres to 6,164 acres (Figure 1). Overall holdings atUniversity Park (e.g., including Stone Valley recreation area and experimental forests) sum to18,512 acres (www.psu.edu/academic/bluebook/).
Figure 1. Expansion of University Park Lands in the Immediate Vicinity of Campus in the 20th
Century.
With a few small exceptions, Penn State has not engaged, to date, in the selling of itsholdings. A notable exception now on the horizon is the University’s disposition to sellCircleville Farm (See Box).
50
Circleville Farm: An Opportunity for Penn State To Act as a Catalyst forEcologically Responsible Land Stewardship
The Circleville Farm is a 176-acre Penn State land holding adjacent to Circleville Roadabout one mile from the Main Campus (See Figure 1). Seventy-five percent of the landsurrounding the farm has been transformed into housing developments, 15% of the perimeterland is now zoned industrial, and the remaining 10% is bordered by the Penn State golf course.
Although Penn State intends to sell Circleville, it could stipulate that the buyer create aforward-looking, ecologically responsible village there. The “village” might embody many ofthe principles of sustainability that are highlighted in this Report such as:
--highly efficient, state-of-the-art energy systems (Energy Chapter)--zero-waste discharge water system (Water Chapter)--significant amounts of food grown on community land using sustainable farming
techniques (Food Chapter)--cluster housing with 75-80% of the site left in natural state (This Chapter)--structures designed and constructed using "green design principles" (Built
Environment Chapter).--car-free, bicycle/minibus transportation system (Transportation Chapter)--co-housing living arrangements centered on civic responsibility and democratic arts
(Community Chapter)Many Penn State professors and students, as well as citizens of Centre County, are actively
involved in the conceptualization and planning of this project.
Clearly land stewardship is a concern at Penn State.1 Increasingly, words such as"green space," "sustainability," and "preservation" appear in Penn State’s planningdocuments.2 However, the University still has no policy that specifies principles ofresponsible land stewardship.3
Indicator 2. Percent of Campus Land Covered by Impervious SurfacesImpervious surfaces, such as pavement and rooftops, are impenetrable to water.
Because water cannot penetrate the ground, it runs instead into stormwater drains, carryingpollutants (such as those associated with motor vehicles) into local streams.
FindingsAs University Park enrollment and programs have grown, the University has
constructed additional buildings and parking lots. In this process, green space has been lost.The percentage of the University Park campus covered by impervious surfaces increased from3.3 million square feet, or 29.9%, in the 1960s to about 4.9 million square feet, or 44.9%, inthe 1990s (Kulakowski, 1997).
1 For example, Penn State's Shaver's Creek complex provides environmental education opportunities forstudents and citizens; and the newly created Millbrook Marsh Nature Center (created in partnership with localgovernment and conservation groups) emphasizes environmental education and land stewardship.
2 For example, the Penn State Master Plan shows sensitivity to land stewardship as evidenced in the Plan’scommitment to:
--Protect and preserve the integrity of the open land and agricultural fields surrounding the core campus.--Demonstrate environmental stewardship by respecting sensitive natural and cultural areas and promoting environmentally responsible practices.--Base future land-use decisions on environmental impact considerations and evaluation (University Park Campus Master Plan/www.opp.psu.edu/upmp/upmp.htm).
3 Penn State does have a standard forest management plan for its experimental forest holdings located near StoneValley (R. Brooks, Professor of Wildlife Science, pers. comm.).
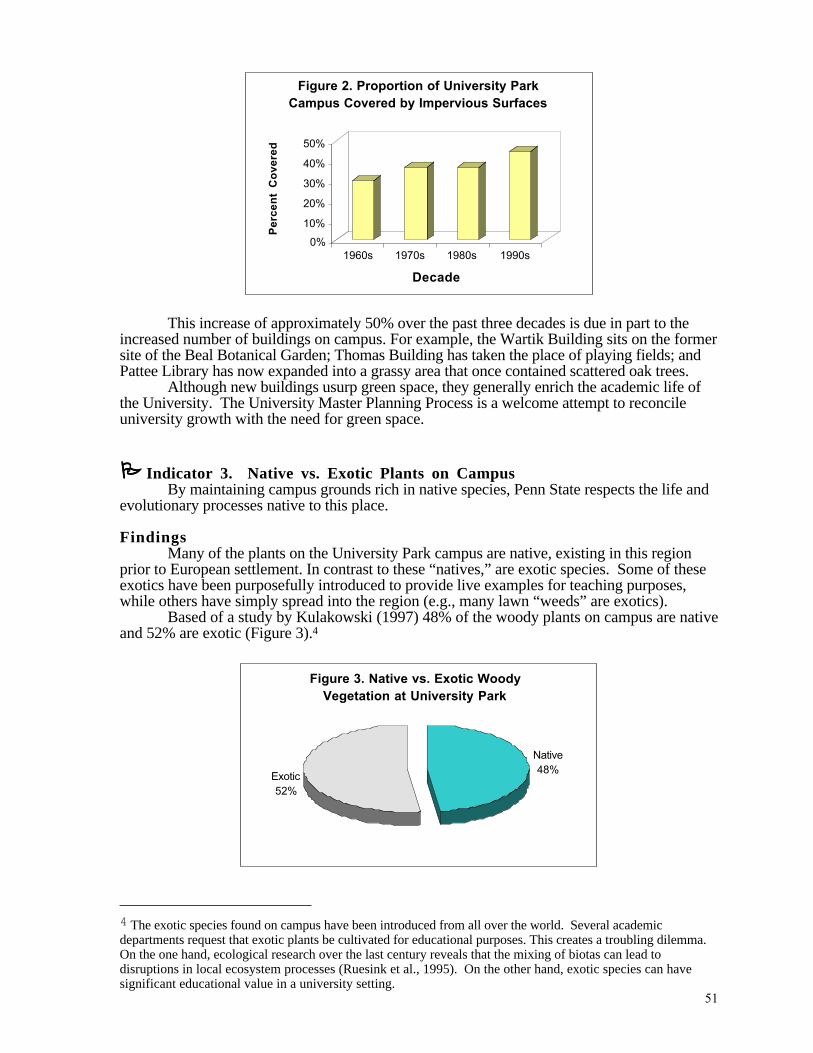
51
0%
10%
20%
30%
40%
50%
Pe
rce
nt
Co
ve
red
1960s 1970s 1980s 1990s
Decade
Figure 2. Proportion of University Park Campus Covered by Impervious Surfaces
This increase of approximately 50% over the past three decades is due in part to theincreased number of buildings on campus. For example, the Wartik Building sits on the formersite of the Beal Botanical Garden; Thomas Building has taken the place of playing fields; andPattee Library has now expanded into a grassy area that once contained scattered oak trees.
Although new buildings usurp green space, they generally enrich the academic life ofthe University. The University Master Planning Process is a welcome attempt to reconcileuniversity growth with the need for green space.
Indicator 3. Native vs. Exotic Plants on CampusBy maintaining campus grounds rich in native species, Penn State respects the life and
evolutionary processes native to this place.
FindingsMany of the plants on the University Park campus are native, existing in this region
prior to European settlement. In contrast to these “natives,” are exotic species. Some of theseexotics have been purposefully introduced to provide live examples for teaching purposes,while others have simply spread into the region (e.g., many lawn “weeds” are exotics).
Based of a study by Kulakowski (1997) 48% of the woody plants on campus are nativeand 52% are exotic (Figure 3).4
Figure 3. Native vs. Exotic Woody Vegetation at University Park
Exotic52%
Native48%
4 The exotic species found on campus have been introduced from all over the world. Several academicdepartments request that exotic plants be cultivated for educational purposes. This creates a troubling dilemma.On the one hand, ecological research over the last century reveals that the mixing of biotas can lead todisruptions in local ecosystem processes (Ruesink et al., 1995). On the other hand, exotic species can havesignificant educational value in a university setting.
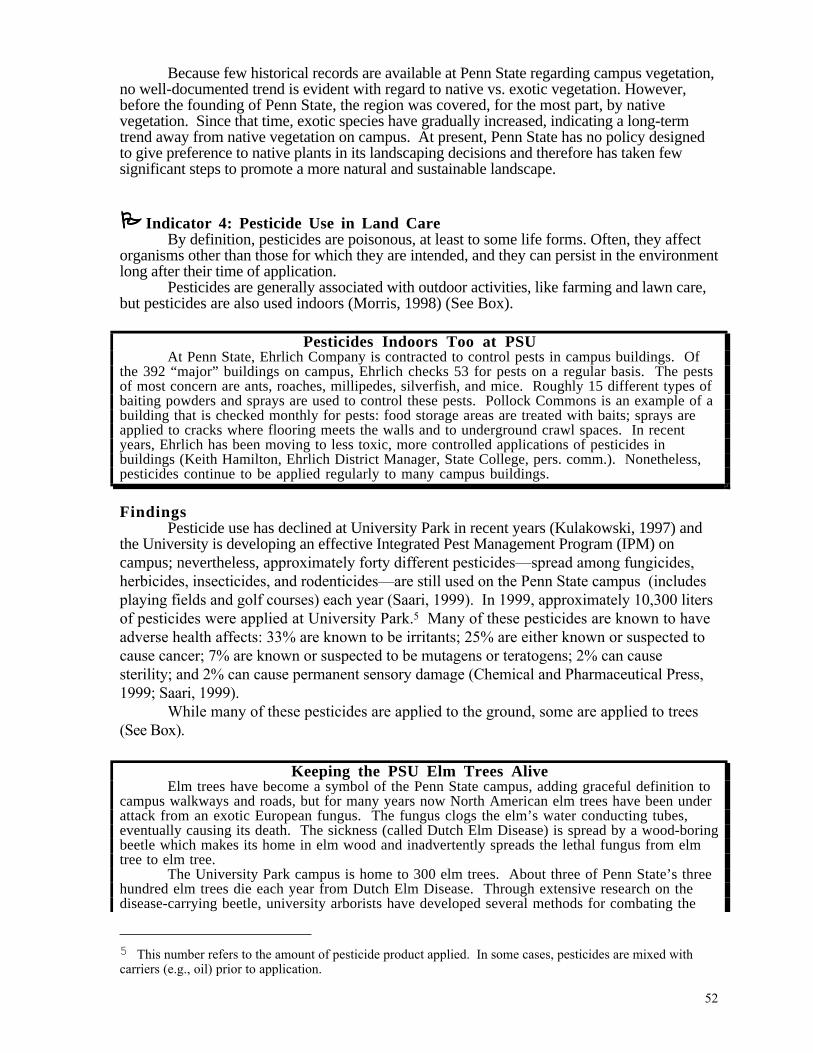
52
Because few historical records are available at Penn State regarding campus vegetation,no well-documented trend is evident with regard to native vs. exotic vegetation. However,before the founding of Penn State, the region was covered, for the most part, by nativevegetation. Since that time, exotic species have gradually increased, indicating a long-termtrend away from native vegetation on campus. At present, Penn State has no policy designedto give preference to native plants in its landscaping decisions and therefore has taken fewsignificant steps to promote a more natural and sustainable landscape.
Indicator 4: Pesticide Use in Land CareBy definition, pesticides are poisonous, at least to some life forms. Often, they affect
organisms other than those for which they are intended, and they can persist in the environmentlong after their time of application.
Pesticides are generally associated with outdoor activities, like farming and lawn care,but pesticides are also used indoors (Morris, 1998) (See Box).
Pesticides Indoors Too at PSUAt Penn State, Ehrlich Company is contracted to control pests in campus buildings. Of
the 392 “major” buildings on campus, Ehrlich checks 53 for pests on a regular basis. The pestsof most concern are ants, roaches, millipedes, silverfish, and mice. Roughly 15 different types ofbaiting powders and sprays are used to control these pests. Pollock Commons is an example of abuilding that is checked monthly for pests: food storage areas are treated with baits; sprays areapplied to cracks where flooring meets the walls and to underground crawl spaces. In recentyears, Ehrlich has been moving to less toxic, more controlled applications of pesticides inbuildings (Keith Hamilton, Ehrlich District Manager, State College, pers. comm.). Nonetheless,pesticides continue to be applied regularly to many campus buildings.
FindingsPesticide use has declined at University Park in recent years (Kulakowski, 1997) and
the University is developing an effective Integrated Pest Management Program (IPM) oncampus; nevertheless, approximately forty different pesticides—spread among fungicides,herbicides, insecticides, and rodenticides—are still used on the Penn State campus (includesplaying fields and golf courses) each year (Saari, 1999). In 1999, approximately 10,300 litersof pesticides were applied at University Park.5 Many of these pesticides are known to haveadverse health affects: 33% are known to be irritants; 25% are either known or suspected tocause cancer; 7% are known or suspected to be mutagens or teratogens; 2% can causesterility; and 2% can cause permanent sensory damage (Chemical and Pharmaceutical Press,1999; Saari, 1999).
While many of these pesticides are applied to the ground, some are applied to trees(See Box).
Keeping the PSU Elm Trees AliveElm trees have become a symbol of the Penn State campus, adding graceful definition to
campus walkways and roads, but for many years now North American elm trees have been underattack from an exotic European fungus. The fungus clogs the elm’s water conducting tubes,eventually causing its death. The sickness (called Dutch Elm Disease) is spread by a wood-boringbeetle which makes its home in elm wood and inadvertently spreads the lethal fungus from elmtree to elm tree.
The University Park campus is home to 300 elm trees. About three of Penn State’s threehundred elm trees die each year from Dutch Elm Disease. Through extensive research on thedisease-carrying beetle, university arborists have developed several methods for combating the
5 This number refers to the amount of pesticide product applied. In some cases, pesticides are mixed withcarriers (e.g., oil) prior to application.
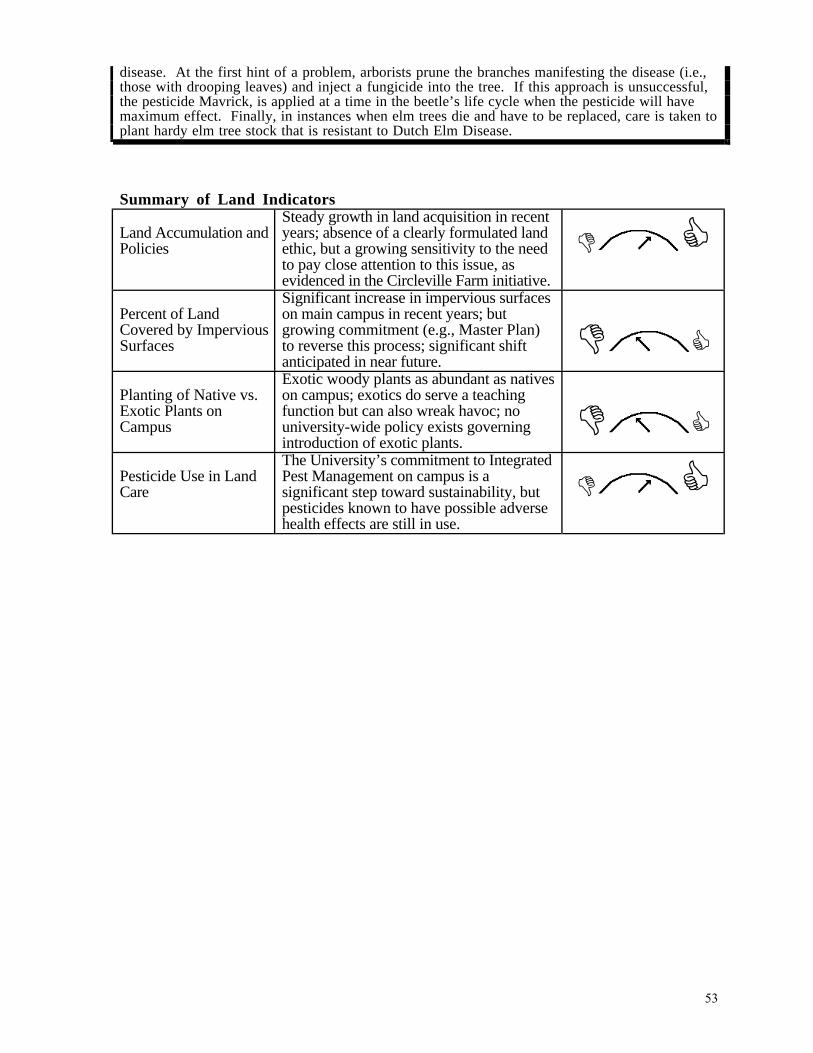
53
disease. At the first hint of a problem, arborists prune the branches manifesting the disease (i.e.,those with drooping leaves) and inject a fungicide into the tree. If this approach is unsuccessful,the pesticide Mavrick, is applied at a time in the beetle’s life cycle when the pesticide will havemaximum effect. Finally, in instances when elm trees die and have to be replaced, care is taken toplant hardy elm tree stock that is resistant to Dutch Elm Disease.
Summary of Land Indicators
Land Accumulation andPolicies
Steady growth in land acquisition in recentyears; absence of a clearly formulated landethic, but a growing sensitivity to the needto pay close attention to this issue, asevidenced in the Circleville Farm initiative.
Percent of LandCovered by ImperviousSurfaces
Significant increase in impervious surfaceson main campus in recent years; butgrowing commitment (e.g., Master Plan)to reverse this process; significant shiftanticipated in near future.
Planting of Native vs.Exotic Plants onCampus
Exotic woody plants as abundant as nativeson campus; exotics do serve a teachingfunction but can also wreak havoc; nouniversity-wide policy exists governingintroduction of exotic plants.
Pesticide Use in LandCare
The University’s commitment to IntegratedPest Management on campus is asignificant step toward sustainability, butpesticides known to have possible adversehealth effects are still in use.
54
Moving Toward Sustainability
Other Institutions on the Path In addition to Penn State, a number of other universities have begun the process of
harmonizing their human-constructed landscapes with nature, and their initiatives can furtherinspire Penn State to rethink the way it manages its land. For example, Connecticut Collegehas committed one-third of its property to serve as an arboretum devoted to the propagation ofnative plants. The arboretum's collection contains 288 taxa of trees, shrubs, and woody vines,all of which are indigenous to Eastern North America. Besides providing a source of nativeseeds and plants for regional restoration projects, the arboretum is devoted to developing aregional identity.
Nebraska Wesleyan University (NWU) has also recognized the value of nativevegetation. Twyla Hansen, NWU’s grounds manager, noted the high fertilizer, pesticide,water, and labor input necessary to maintain the campuses prevailing non-native landscape.Consequently, Hansen began replanting campus zones which had been disturbed byconstruction or other activities with low maintenance, native grasses and wildflowers.
These universities demonstrate that it is possible for institutions of higher learning torespect natural processes, value the native biota and conserve green space. With its abundantland and faculty expertise, Penn State is well positioned to become a leader among institutionsin furthering this movement.6
Short-Term Goals for PSU
Solidify Commitment to Creating an Arboretum at Penn State. Representativesfrom several colleges and the Office of the Physical Plant, in collaboration with SasaakiAssociates, have prepared a detailed proposal to establish Penn State’s arboretum in the BigHollow area just north of Park Avenue. The site is highly varied in slope, aspect, geology andrich in plant and animal species. This could be an arboretum for the 21st Century—anenvironmental classroom, a meeting place, and a center for interdisciplinary research.
Provide Examples of Sustainable Lawnscaping at Spruce/Birch/Pine Cottageson Campus. One of the loveliest parts of the Penn State Campus is around Spruce, Birch,and Pine cottages. This frequently visited area has the quaintness of a neighborhood in aPennsylvania town. It is a perfect area to showcase exciting alternatives to the traditionalAmerican lawnscape (See Box).
Why an Alternative to the American Lawnscape?The contemporary American lawn requires large amounts of energy, chemicals and money.Consider:
--An area about the size of Pennsylvania is covered by turf grass in the U.S. (This is moreland area than is devoted to any single crop).
6 Penn State is already taking a leading role in campus composting: The amount of leaves and brush whichhave been collected, composted, and returned to shrub beds on campus has increased from zero tons in 1992, to166 tons in 1998. These nutrient-rich resources were previously discarded (R. Eckenroth, Grounds MaintenanceSupervisor, OPP, pers. comm.).
55
--Americans spend more per acre, on average, to maintain their lawns than farmers spendper
acre on crops7; and they use up to ten times more chemical pesticides per acre on theirlawns
than farmers use on their fields (Bormann et. al., 1993).The sum total of the materials, energy and effort that we direct to our lawns is substantial. Withthis is mind, it is worthwhile to, at least, contemplate alternatives.
The land surrounding the three Penn State cottages could be used to showcase threedistinct approaches to household landscaping: 1) historical—plantings and grounds-carereflecting a turn-of-the-century house; 2) contemporary—high input/high maintenancelandscape characteristic of the contemporary yard; and 3) futuristic—low input/lowmaintenance, diverse naturescape with strong reliance on natural processes.8 A demonstrationof this sort would afford campus visitors with the opportunity to see the lawn in a historicaland ecological context and, in the process, might inspire them to experiment with alternatives tohigh input/high maintenance contemporary lawns at home.
Reduce Pesticide Use. As part of a land ethic Penn State should refrain from the use ofpesticides on campus. Indeed, scientists now know enough about the potential dangers ofsynthetic chemicals (Colburn et. al., 1996; Mitchell, 1997) that it behooves the University toeliminate their use in realms where they are not absolutely necessary.
Long-Term Goal: Create and Abide by a Land Ethic
“Over the past century, the earth was re-designed in the industrialimage…Over the next century, the mind of nature will redesign the earth.”
John Tillman Lyle
Penn State is a Land Grant institution without a clearly articulated land ethic! Thisshould change. The University could begin by simply drafting a statement of its land ethic.Aldo Leopold's (1949) often-quoted remark might serve as a starting point: "A thing is rightwhen it tends to preserve the integrity, stability, and beauty of the biotic community. It iswrong when it tends otherwise."
Sustainable land-use requires viewing the land on which we spend our daily lives in anew way; it requires us to adopt a new aesthetic. Instead of valuing monoculture, uniformity,and linearity, a sustainable land aesthetic would cultivate diversity, complexity, and variation.Guided by this new aesthetic, we might try to imagine a Penn State landscape rich in naturalhabitats.
Consider the Old Main lawn as an example. Its pleasing expanse of grass, symbolizes,according to the Victorian aesthetic, the values of success and plenty (Bormann et al., 1993),but it comes at a price in terms of fossil fuels, pesticides, and health. Imagine, for fun, thesame area, embodying a natural aesthetic: the Old Main meadow, a natural mixture of nativegrasses, clovers and wild flowers, a symbol of our area’s natural vitality and plenitude.9
7 Penn State spends $3.5 million per year maintaining the University Park campus grounds. This comes toabout $4,000 per acre—about twenty times more than what farmers spend per acre (Saari, 1999).
8 This is a project that offers exciting opportunities for learning across disciplines. Students from severaldifferent departments (e.g., Turfgrass Management, Horticulture, Landscape Architecture) could work together onthe design, creation and maintenance of these yardscapes.
9 Efforts are now underway to convert some corporate office parks in the Midwest to meadows. Themaintenance costs of these meadows are estimated to be one-tenth the costs for a conventional lawn (Malin,1995).
56
Finally, imagine a campus landscape that is not only pleasant but one that has ecologicallessons to teach. For example, West Campus might contain a student run CSA (CommunitySupported Agriculture) for the production of a small portion of the University's food, aconstructed wetland for processing a small portion of the University's waste water (See WaterChapter), or a regenerating forest to sequester carbon dioxide thereby counteracting, to adegree, the large amounts of carbon dioxide released at University Park (See Energy Chapter).Saari (1999) goes further and provides examples of how individual departments could designand maintain a landscape that reflects their academic viewpoint. For example, the Penn StateGeology Department could create a rock garden where it also teaches; the Music Departmentcould care for an outdoor amphitheater where it gives public concerts; and the GeographyDepartment could tend a living map of the vegetation zones of the United States. In theprocess, the students and faculty of these Departments would have the opportunity to use theirhands and appreciate natural processes.10 By becoming responsible stewards of the land thathas been entrusted to our care, we can all become healthy in body and in spirit, whilepromoting a vital, stable, and diverse landscape.
References
Affolter, James, C. Mihalko, and J. R. Stepp. 1999. The University of Georgia Latin Americanethnobotanical garden. Pages 150-153 in R.J. Koester (ed.) Greening the Campus III: Theory andReality. Ball State University, Muncie, IN
Bormann, F.H., D. Balmori, and G.T. Geballe, 1993. Redesigning the American Lawn. Yale UniversityPress, New Haven, CT.
Chemical and Pharmaceutical Press, Inc. 1999. Turf and Ornamental Reference for Plant ProtectionProducts. Chemical and Pharmaceutical Press, Inc. New York, NY.
Colburn, T., D. Dumanoski, and J.P. Meyers. 1996. Our Stolen Future. Sutton, New York.
Kulakowski, D. 1997. Sustainability and the Pennsylvania State University: A Case Study in Urban Ecology.Master of Science Thesis, Penn State University.
Leopold, A. 1949. A Sand County Almanac. Ballantine Books, New York.
Malin, N. 1995. Restoring the Tall-Grass Prairie. Environmental Building News 4 (4): 9-11.
Melnick, P.R. 1997. Act 101 Annual Recycling Report for Municipalities. Office of Physical Plant.Pennsylvania State University, University Park, PA.
Mitchell, J. 1997. Nowhere to hide. Worldwatch. pgs. 26-36, Worldwatch Institute, Washington, D.C.
Morris, S. 1998. Safer homes and gardens. Yes Magazine, Summer.
Penn State Blue Book. http://www.cac.psu.edu/academic/bluebook/ge.html.
Ruesink, J.L., I.M. Parker, M.J. Groom, and P.M. Kareiva. 1995. Reducing the risks of nonindigenousspecies introductions. BioScience 45:465-477.
Saari, S. 1999. Paradise Lost? An Examination of the Ecological, Economic and Educational Impacts of theSuburban and University Landscape. Thesis in Ecology. Penn State University, University Park, PA.
10 The University of Georgia has recently built an ethnobotanical garden that brings together academicdepartments, physical plant managers and the University’s botanical garden to be used for research, teaching andpublic outreach (Affolter et.al., 1999).
57
TRANSPORTATION “The car's appetite can never be satisfied." Dr. Peter Everett, Penn State TransportationSpecialist
IntroductionAmericans are often said to have a love affair with the automobile. We own 23 million
more cars than the number of licensed drivers; each year, we drive 2 trillion miles; we havecovered significant expanses of our arable land with roads; and one job in six in our country islinked to the car industry (Engwicht, 1993; Ohringer, 1992). Car-based transportation,although wonderful in many respects, has many hidden costs:
• It is expensive. A recent study by economists at the World Resources Institute, USA, entitled"The Going Rate: What it Really Costs to Drive," concluded that if the many hidden costs of car-based transport (e.g., highway and parking area construction and maintenance, police protection,chronic health problems caused by car-generated pollution, loss of productive land to roads, etc.)were passed on to the public at the gas pump, it would raise the price of gasoline to about $6dollars a gallon in the U.S.
• Car-based transport is inefficient. As any student knows: SPEED = DISTANCE/TIME. If wewere to divide our total annual car mileage (DISTANCE) by the sum total of all the TIME wespend earning the money to pay for our car, its maintenance, and its insurance plus all the time wespend stalled in traffic, looking for parking spaces, and caring for our cars, and so forth, our averagecar SPEED would be only about 10 mph (about the speed of biking).
• Car-based travel is a major contributor to global warming. Cars consume one-third of the world'soil production and account for about one-fifth of human-related global carbon dioxide releases.
• Car use is unsafe. In the U.S. 42,000 people are killed by cars each year. If jets were killing thismany people, one would be falling from the sky every day in the U.S.
In many ways, the transport system utilized by Penn State is indistinguishable from theU.S. transport system at large. Penn State’s ‘vision’ apparently includes new highways,loops, and extensions, as well as a strong commitment to airport expansion.1
A sustainable transportation system has the following characteristics:• Clustered. Communities are densely settled and designed (i.e., careful land-use planning)
so that the places people routinely visit—schools, shops, churches, parks—are close by(i.e., within easy walking or biking distance). Clustered development (as opposed tosprawl-type development) enhances human interaction while also maximizing green spaceon a regional level.
• Efficient public transportation. Reliable, clean, convenient public transportationalternatives are readily available: mini-buses for the elderly and young within town; lightrail, running at frequent intervals along main transportation corridors for longer trips.
• Traffic calming. The disruptive effects of cars (e.g., accidents, noise, air pollution) oncommunity life are acknowledged. Measures to "calm" traffic (e.g., narrowing rather thanwidening of roads, enforcing 15 mph speed limits in town, offering right-of-way to
1 Since 1963, Penn State has acquired 26 properties, covering 1201 acres, at a cost of $4,925,808 in theimmediate vicinity of the University Park airport (data from Bellefonte Court House). Land acquisitionaccelerated after 1985 in preparation for the airport expansion: 24 of the 26 acquisitions since 1963 and 99% ofthe land purchase expenditures have occurred since 1985.
58
pedestrians and bicyclists2) are recognized as essential to restoring the people-centeredvitality of the town/campus environment.
In short, the design of sustainable university transportation systems requires that webegin by viewing campuses, towns, and cities as an interactive people's places. The vitality ofcommunities comes form the rich diversity and concentration of culture, information,businesses, public places, and most of all people. Transport decisions which rob communitiesof their vitality (e.g., continually accommodating the automobile by widening roads andbuilding new roads) lead away from, rather than toward, sustainability (Engwicht, 1993).
Progress toward a sustainable transport system would be based (among other things)on developing and promoting alternatives to single-occupancy cars, preserving green space,and creating a safer environment. With this in mind, we used three indicators to examine PennState’s transportation system:
1. Car Dependence2. Green Space Converted to Parking Space3. Transport-Related Safety
Indicator 1. Car DependenceOnly about 20% of those who study and/or work at Penn State actually live on campus.
The rest of the population—approximately 40,000 faculty, staff, and students—either walk,bike, bus or drive to campus each day. The distance that these commuters travel, as well astheir mode of travel, bears directly on the sustainability of PSU’s transportation system.
FindingsAn estimated 90% of Penn State’s faculty and staff drive by car to University Park on a
daily basis. Very few ride the bus (4%), walk (5%) or bike (<1%). Seventy-three percent ofthose driving drive alone, and 27% carpool with at least one other person.3
In 1997, the average distance of a one-way commute to University Park was estimatedto be 10.6 miles, or 15% further than in 1988.4 Using these data, we estimate that the totalwork-related car miles driven by Penn State employees is approximately 108,000 miles. Thegasoline consumed in this daily routine amounts to some 5,375 gallons per work day(assuming 20 mpg). This magnitude of gasoline consumption generates, on a daily basis,approximately 113,480 pounds of emissions—106,400 pounds of the greenhouse gas, carbondioxide; 5,900 pounds of carbon monoxide, 800 pounds of hydrocarbons, and 380 pounds ofnitrogen oxides.5 In contrast to faculty and staff, walking is the primary form of commutingfor most students, although many students bring cars to college (See Box).
2 It seems fair to start from the principle that all travelers, whether on foot, bike or in a car, have equal rightsregardless of the transport mode they have chosen. But car travelers are better armed and better protected thanpedestrians and cyclists and thus a policy is needed to correct this bias. A logical policy might be to simplygive pedestrians and bicyclists right-of-way over cars in all circumstances, as is now the law in some Europeancities. Some argue that we should even go further and subsidize pedestrians and cyclists because they are muchcheaper to accommodate than cars and do little environmental harm (Engwicht, 1993).
3 These figures are based on the results of a phone survey of 116 randomly selected faculty and staff conducted inApril, 1997. Results from our sample indicate that approximately 65% of those interviewed would have neededparking permits (corrected for car pooling) in 1997. This is in line with data on faculty and staff parkingpermits issued for that year: sixty-four percent of Penn State's 15,607 full and part-time employees had parkingpermits in 1997 (D. Holmes, Transportation Facilities Coordinator, pers. comm.).
4 This was determined by selecting 960 names at random from Penn State's Faculty and Staff Directory for theyears of 1988 and 1997 and estimating the distance between the person's home address and University Park. Thedistance traveled for those living in State College was assumed to be 2 miles.
5 The combustion of one gallon of gas results in the release of 19.8 lbs. CO2, 1.1 lbs. CO, 0.15 lbs. HC, and0.07 lbs. NOx (Hubbard and Fong, 1995).
59
Students: What Does it Cost to Own a Car?There are many benefits to owning a car but there is also a downside—expense. Take the
case of Maria who grew up in Pittsburgh and is now a sophomore at Penn State. Maria commutesfour miles back and forth to campus each day from her apartment on North Atherton. This endsup costing her about $4.25 per day in commuting expenses when all the hidden costs ofinsurance, financing, depreciation, repairs, and registration are added to the obvious cost ofgasoline. Maria uses her car for other things and ends up driving 8,000 miles a year. The annualcost of operating her car (a 1994 Plymouth compact) comes to about $4,500. This is aboutthree-quarters of what Maria paid for tuition last year! Conclusion: Penn State students cansignificantly reduce the cost of their college education if they are able to satisfy theirtransportation needs through walking, biking, and public transportation (Poinsatte and Toor,1999).
Penn State has taken some measures to promote more sustainable transportationoptions. For example, the recently announced Transportation Demand Management Plancontains incentives to encourage car pooling and also includes provisions for “no fare” busrides on campus (implemented in Fall 1999) and the creation of new bicycle paths (Intercom,1999).6
Overall, faculty and staff car dependence appears to be increasing at Penn State; andalthough most students live within walking distance of campus, this is changing as newhousing options are located further from campus (See Built Environment Chapter, Footnote 2).In sum, Penn State now recognizes many of the problems associated with heavy cardependence but the University has stopped short of adopting comprehensive measures to“calm” traffic and de-emphasize car-based travel (in favor of walking, biking, and publictransportation).
Indicator 2. Green Space Converted to Parking SpaceCars require much more storage space than do most alternatives (e.g., 20 times more
space is needed to park 100 cars than 100 bikes). In fact, the family car consumes an estimatedthree times more space than the average family home, when all aspects of space-use (e.g.,roads, parking lots) are combined (Engwicht, 1993). The land area consumed by cars is evengreater when we consider the energy and raw materials necessary for car transportation (SeeBox).
6 The Penn State Master Plan is also sensitive to transportation issues within the campus community asevidenced in the Plan’s commitment to create “a well-defined and pleasant pedestrian circulation system thatencourages foot rather than vehicular travel within campus, thus reducing parking demand and traffic”(www.opp.psu.edu/upmp/upmp.htm).
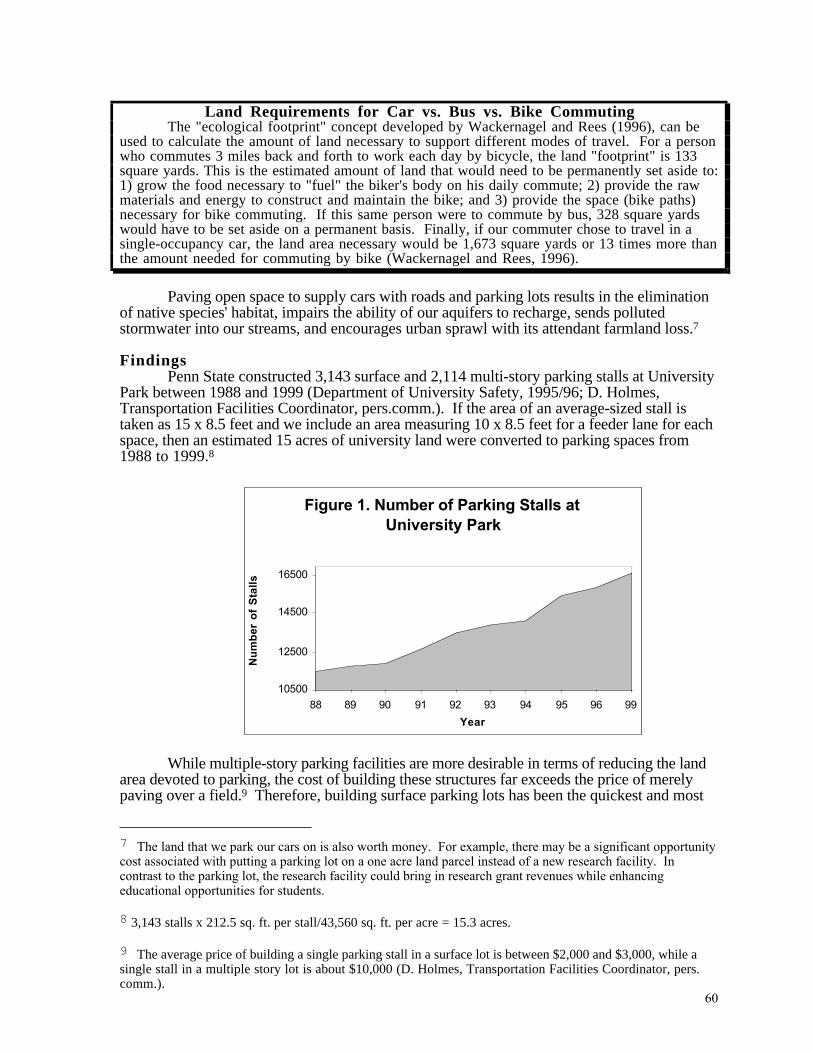
60
Land Requirements for Car vs. Bus vs. Bike CommutingThe "ecological footprint" concept developed by Wackernagel and Rees (1996), can be
used to calculate the amount of land necessary to support different modes of travel. For a personwho commutes 3 miles back and forth to work each day by bicycle, the land "footprint" is 133square yards. This is the estimated amount of land that would need to be permanently set aside to:1) grow the food necessary to "fuel" the biker's body on his daily commute; 2) provide the rawmaterials and energy to construct and maintain the bike; and 3) provide the space (bike paths)necessary for bike commuting. If this same person were to commute by bus, 328 square yardswould have to be set aside on a permanent basis. Finally, if our commuter chose to travel in asingle-occupancy car, the land area necessary would be 1,673 square yards or 13 times more thanthe amount needed for commuting by bike (Wackernagel and Rees, 1996).
Paving open space to supply cars with roads and parking lots results in the eliminationof native species' habitat, impairs the ability of our aquifers to recharge, sends pollutedstormwater into our streams, and encourages urban sprawl with its attendant farmland loss.7
FindingsPenn State constructed 3,143 surface and 2,114 multi-story parking stalls at University
Park between 1988 and 1999 (Department of University Safety, 1995/96; D. Holmes,Transportation Facilities Coordinator, pers.comm.). If the area of an average-sized stall istaken as 15 x 8.5 feet and we include an area measuring 10 x 8.5 feet for a feeder lane for eachspace, then an estimated 15 acres of university land were converted to parking spaces from1988 to 1999.8
Figure 1. Number of Parking Stalls at University Park
10500
12500
14500
16500
88 89 90 91 92 93 94 95 96 99
Year
Nu
mb
er
of
Sta
lls
While multiple-story parking facilities are more desirable in terms of reducing the landarea devoted to parking, the cost of building these structures far exceeds the price of merelypaving over a field.9 Therefore, building surface parking lots has been the quickest and most
7 The land that we park our cars on is also worth money. For example, there may be a significant opportunitycost associated with putting a parking lot on a one acre land parcel instead of a new research facility. Incontrast to the parking lot, the research facility could bring in research grant revenues while enhancingeducational opportunities for students.
8 3,143 stalls x 212.5 sq. ft. per stall/43,560 sq. ft. per acre = 15.3 acres.
9 The average price of building a single parking stall in a surface lot is between $2,000 and $3,000, while asingle stall in a multiple story lot is about $10,000 (D. Holmes, Transportation Facilities Coordinator, pers.comm.).
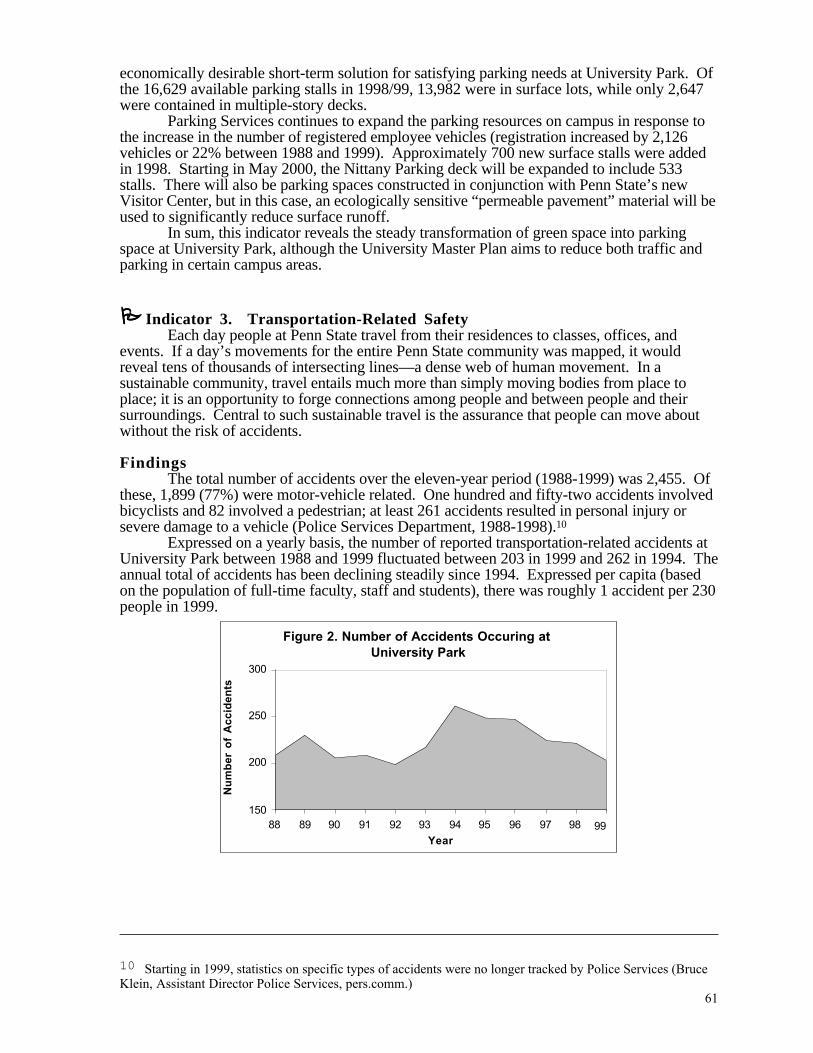
61
economically desirable short-term solution for satisfying parking needs at University Park. Ofthe 16,629 available parking stalls in 1998/99, 13,982 were in surface lots, while only 2,647were contained in multiple-story decks.
Parking Services continues to expand the parking resources on campus in response tothe increase in the number of registered employee vehicles (registration increased by 2,126vehicles or 22% between 1988 and 1999). Approximately 700 new surface stalls were addedin 1998. Starting in May 2000, the Nittany Parking deck will be expanded to include 533stalls. There will also be parking spaces constructed in conjunction with Penn State’s newVisitor Center, but in this case, an ecologically sensitive “permeable pavement” material will beused to significantly reduce surface runoff.
In sum, this indicator reveals the steady transformation of green space into parkingspace at University Park, although the University Master Plan aims to reduce both traffic andparking in certain campus areas.
Indicator 3. Transportation-Related SafetyEach day people at Penn State travel from their residences to classes, offices, and
events. If a day’s movements for the entire Penn State community was mapped, it wouldreveal tens of thousands of intersecting lines—a dense web of human movement. In asustainable community, travel entails much more than simply moving bodies from place toplace; it is an opportunity to forge connections among people and between people and theirsurroundings. Central to such sustainable travel is the assurance that people can move aboutwithout the risk of accidents.
FindingsThe total number of accidents over the eleven-year period (1988-1999) was 2,455. Of
these, 1,899 (77%) were motor-vehicle related. One hundred and fifty-two accidents involvedbicyclists and 82 involved a pedestrian; at least 261 accidents resulted in personal injury orsevere damage to a vehicle (Police Services Department, 1988-1998).10
Expressed on a yearly basis, the number of reported transportation-related accidents atUniversity Park between 1988 and 1999 fluctuated between 203 in 1999 and 262 in 1994. Theannual total of accidents has been declining steadily since 1994. Expressed per capita (basedon the population of full-time faculty, staff and students), there was roughly 1 accident per 230people in 1999.
Figure 2. Number of Accidents Occuring at University Park
150
200
250
300
88 89 90 91 92 93 94 95 96 97 98
Year
Nu
mb
er
of
Ac
cid
en
ts
99
10 Starting in 1999, statistics on specific types of accidents were no longer tracked by Police Services (BruceKlein, Assistant Director Police Services, pers.comm.)
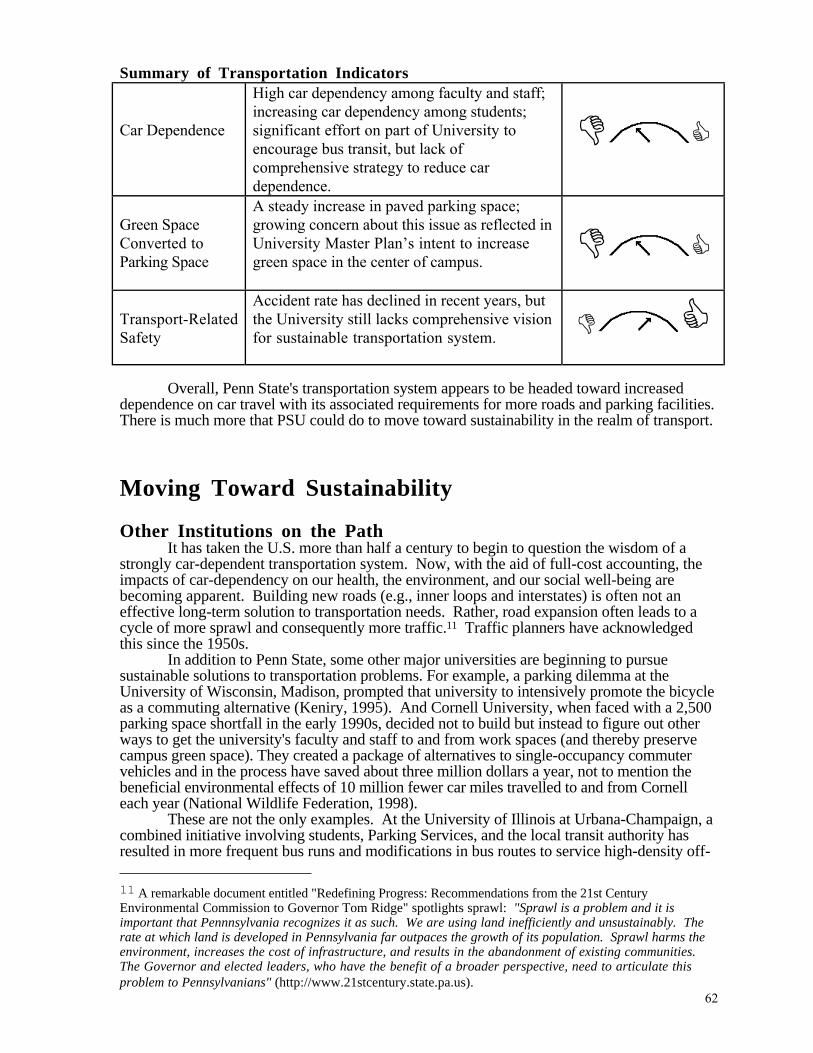
62
Summary of Transportation Indicators
Car Dependence
High car dependency among faculty and staff;increasing car dependency among students;significant effort on part of University toencourage bus transit, but lack ofcomprehensive strategy to reduce cardependence.
Green SpaceConverted toParking Space
A steady increase in paved parking space;growing concern about this issue as reflected inUniversity Master Plan’s intent to increasegreen space in the center of campus.
Transport-RelatedSafety
Accident rate has declined in recent years, butthe University still lacks comprehensive visionfor sustainable transportation system.
Overall, Penn State's transportation system appears to be headed toward increaseddependence on car travel with its associated requirements for more roads and parking facilities.There is much more that PSU could do to move toward sustainability in the realm of transport.
Moving Toward Sustainability
Other Institutions on the PathIt has taken the U.S. more than half a century to begin to question the wisdom of a
strongly car-dependent transportation system. Now, with the aid of full-cost accounting, theimpacts of car-dependency on our health, the environment, and our social well-being arebecoming apparent. Building new roads (e.g., inner loops and interstates) is often not aneffective long-term solution to transportation needs. Rather, road expansion often leads to acycle of more sprawl and consequently more traffic.11 Traffic planners have acknowledgedthis since the 1950s.
In addition to Penn State, some other major universities are beginning to pursuesustainable solutions to transportation problems. For example, a parking dilemma at theUniversity of Wisconsin, Madison, prompted that university to intensively promote the bicycleas a commuting alternative (Keniry, 1995). And Cornell University, when faced with a 2,500parking space shortfall in the early 1990s, decided not to build but instead to figure out otherways to get the university's faculty and staff to and from work spaces (and thereby preservecampus green space). They created a package of alternatives to single-occupancy commutervehicles and in the process have saved about three million dollars a year, not to mention thebeneficial environmental effects of 10 million fewer car miles travelled to and from Cornelleach year (National Wildlife Federation, 1998).
These are not the only examples. At the University of Illinois at Urbana-Champaign, acombined initiative involving students, Parking Services, and the local transit authority hasresulted in more frequent bus runs and modifications in bus routes to service high-density off-
11 A remarkable document entitled "Redefining Progress: Recommendations from the 21st CenturyEnvironmental Commission to Governor Tom Ridge" spotlights sprawl: "Sprawl is a problem and it isimportant that Pennnsylvania recognizes it as such. We are using land inefficiently and unsustainably. Therate at which land is developed in Pennsylvania far outpaces the growth of its population. Sprawl harms theenvironment, increases the cost of infrastructure, and results in the abandonment of existing communities.The Governor and elected leaders, who have the benefit of a broader perspective, need to articulate thisproblem to Pennsylvanians" (http://www.21stcentury.state.pa.us).
63
campus student housing. As a result, city bus use by students has increased 10-fold (Smith,1993). Finally, Northland College has introduced a "community share" bike program to itscampus in which old bikes are donated to the college and students and community memberspaint and repair them. New bike racks specifically for community bikes have also been builtaround campus (Cahalan and Cornett, 1997).
Short-Term Goals for PSU
Reduce Number of Cars. The number of student, staff, and faculty cars has increasedsignificantly in recent years and is leading to intolerable levels of congestion and localpollution. Penn State should develop a plan to reduce car use by 25% over the next 10 yearsthrough a package of incentives (and disincentives) that discourages members of the Penn Statecommunity from bringing cars to campus.
Promote Traffic Calming. Traffic congestion, unheard of only a decade ago, is now aproblem in State College. More cars usually means more accidents, more noise, more exhaustemissions, and more loss of public space to roads and parking. Penn State should work withthe State College Borough to promote traffic calming measures such as the narrowing ofexisting roads, lowering and enforcing of speed limits, and preferentially granting right-of-wayto pedestrians and bicyclists. These and like measures are necessary to maintain the people-centered vitality of the campus–town environment.
Expand Innovative Public Transportation Options. To be effective, publictransportation must be convenient (i.e., run at frequent intervals along common transportationcorridors). In some communities these prerequisites are now being satisfied with light railservice along major thoroughfares and minivans along secondary travel corridors. These andother innovative options merit investigation and final determinations should not be based solelyon short-term financial considerations. Penn State, with its technical expertise and state andnational connections, should be a catalyst in the development of a forward-looking, sustainabletransport system for Central Pennsylvania.12
Long-Term Goal: Create Alternatives to Car Transit
“People move well on their feet. People solely dependent on their feet aremore or less equal, move on the spur of the moment, at three to four milesper hour, in any direction and to any place from which they are not legallyor physically barred. An improvement on this native degree of mobilityshould be expected to safeguard these values and to add some new ones...” Ivan Illich, Penn State Visiting Professor
At present, Penn State exerts a huge impact on the Centre Region catalyzing, in concertwith other forces, haphazard growth. Instead of sprawling, inefficient, car-dependent landsettlement, Penn State should do what it can to create tight, compact patterns of land settlementand attractive alternatives to car transit. Indeed, Penn State, as the region’s largest employer,has the opportunity and the responsibility to encourage and model our most sustainabletransportation options—walking, bicycling, and clean, efficient public transportation, with cartravel as the option of last resort.13
12 As a step in this direction, Penn State’s Office of the Physical Plant is beginning to change over tocompressed natural gas vehicles (P. Ruskin, pers. comm.).
13 Perhaps because it is equated with poverty, or perhaps because our nation’s transportation system hasvirtually eliminated it as a clear or feasible choice, walking is often overlooked as a transportation option. Withproper design of community spaces, however, walking can be a viable transportation mode. Biking is a second
64
Over the long term, Penn State should use its expertise and vision to create a CentralPennsylvania with fewer rather than more roads, better public transportation, enforcement ofurban growth boundaries, protection of open spaces in sacred trust for future generations, andvibrant, people-centered town centers.
References
Cahalan, G. and R. Cornett. 1997. Campus transportation systems: The community bike program. Pages190-195 in R.J. Koester (ed.) Greening the Campus II: The Next Step. Ball State University, Muncie,IN.
Department of University Safety. 1995/96. Annual Report. Penn State University.
Engwicht, D. 1993. Reclaiming Our Cities and Towns. New Society Publishers, Philadelphia, PA.
Hubbard, A. and C. Fong. 1995. Community Energy Workbook: A Guide to Building a SustainableEconomy. Rocky Mountain Institute. Snowmass, CO.
Intercom. 1999. New transportation plan for University Park encourages carpooling, eases traffic flow. Pg. 3April 28.
Keniry, J. 1995. Ecodemia. National Wildlife Federation, Washington, D.C.
Klingenberg, H. 1996. Automobile Exhaust Emission Testing. Springer, New York, NY.
National Wildlife Federation. 1998. Green Investment, Green Return: How Practical Conservation ProjectsSave Millions on America's Campuses. National Wildlife Federation, Washington, D.C.
Ohringer, J. 1992. Our beloved cars: what a price we pay. In Context 33, 8-9.
Penn State University. 1988. Faculty and Staff Directory.
Penn State University. 1997. Faculty and Staff Directory.
Poinsatte, F. and W. Toor. 1999. Finding A New Way: Campus Transportation for the Twenty/FirstCentury. University of Colorado Environmental Center and Office of Energy Conservation, Boulder,CO.
Police Services Dept. 1988 through 1997. A Vehicle Code Accidents/Incidents, Penn State University.
Smith, A. 1993. Campus Ecology. Living Planet Press, Los Angeles, CA.
Wackernagel, M. and W. Rees. 1996. Our Ecological Footprint. New Society Publishers, Philadelphia, PA.
sustainable form of transportation. Bicyclists, like walkers, cause little negative environmental impact and, aswith walking, bicycling empowers people by building strength, stimulating the senses, and connecting themwith their neighbors and neighborhoods.
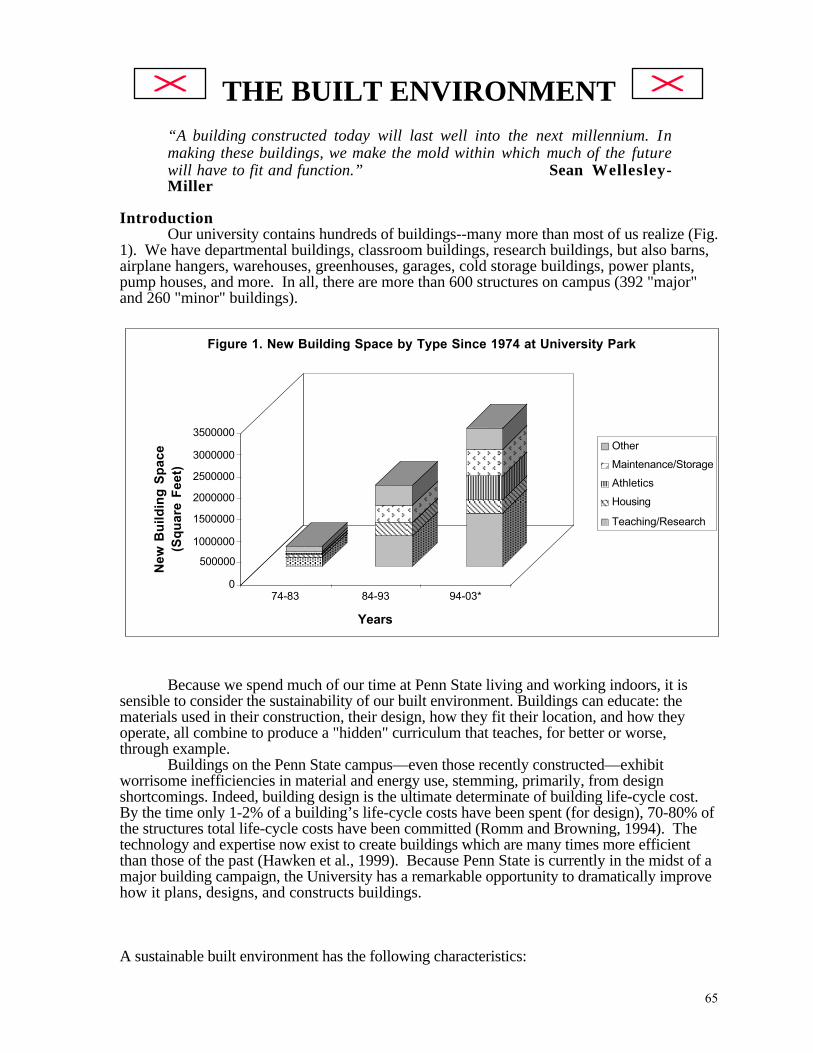
65
THE BUILT ENVIRONMENT “A building constructed today will last well into the next millennium. Inmaking these buildings, we make the mold within which much of the futurewill have to fit and function.” Sean Wellesley-Miller
IntroductionOur university contains hundreds of buildings--many more than most of us realize (Fig.
1). We have departmental buildings, classroom buildings, research buildings, but also barns,airplane hangers, warehouses, greenhouses, garages, cold storage buildings, power plants,pump houses, and more. In all, there are more than 600 structures on campus (392 "major"and 260 "minor" buildings).
0
500000
1000000
1500000
2000000
2500000
3000000
3500000
Ne
w B
uil
din
g S
pa
ce
(S
qu
are
Fe
et)
74-83 84-93 94-03*
Years
Figure 1. New Building Space by Type Since 1974 at University Park
Other
Maintenance/Storage
Athletics
Housing
Teaching/Research
Because we spend much of our time at Penn State living and working indoors, it issensible to consider the sustainability of our built environment. Buildings can educate: thematerials used in their construction, their design, how they fit their location, and how theyoperate, all combine to produce a "hidden" curriculum that teaches, for better or worse,through example.
Buildings on the Penn State campus—even those recently constructed—exhibitworrisome inefficiencies in material and energy use, stemming, primarily, from designshortcomings. Indeed, building design is the ultimate determinate of building life-cycle cost.By the time only 1-2% of a building’s life-cycle costs have been spent (for design), 70-80% ofthe structures total life-cycle costs have been committed (Romm and Browning, 1994). Thetechnology and expertise now exist to create buildings which are many times more efficientthan those of the past (Hawken et al., 1999). Because Penn State is currently in the midst of amajor building campaign, the University has a remarkable opportunity to dramatically improvehow it plans, designs, and constructs buildings.
A sustainable built environment has the following characteristics:
66
• Conserving. Sustainable buildings utilize materials produced in environmentally-soundways; they are energy efficient; and they minimize the loss of green space.
• Respectful of place. The design, placement, and function of sustainable buildings is intune with their locale; heating and cooling systems are designed with local geography andclimate in mind.
• Democratic. Sustainable structures are designed with the whole community in mind; theyare built as a response to a true need in the community; all stakeholders have a voice in thedesign and planning process.
Developing a sustainable built environment at University Park requires the fullparticipation of the Penn State community. When building priorities are carefully consideredand agreed upon, the University becomes more purposeful. Furthermore, when universitybuildings are designed to be in sync with their surroundings and to embody ecological designprinciples, environmental impacts are minimized. With this in mind, we selected threeindicators to assess the sustainability of Penn State's built environment:
1. Building Decision Process2. Building Priorities3. Ecological Design in Buildings
Indicator 1. Building Decision ProcessThough we may not realize it, we are affected emotionally and physically by the
buildings we inhabit (Barnett and Browning, 1996). Hence, it is desirable that all universitystakeholders have the opportunity to participate meaningfully in decisions about the types ofbuildings that are needed on campus and the planning, design, and construction of thesebuildings.
Findings Decisions concerning the creation of new buildings at Penn State are reached, in largepart, through the workings of three processes:
• The Master Planning Process: Several different committees and groups develop long-range plans for university development.
• The Strategic Planning Process. The University Planning Council (UPC) calls onuniversity leaders (e.g., academic deans at University Park and Branch Campuses) tosubmit proposals for new buildings and/or expansions; this call goes out every two tothree years.
• Facilities Resources Process. The Facilities Resources Committee (FRC), headed bythe Provost, evaluates proposals in view of Strategic Plan priorities, genuine need, andfiscal limitations. Each year the FRC submits a Capital Plan to the President forapproval; the Plan specifies how available funds will be allocated for Penn Statebuilding projects (D. Blythe, pers. comm).
The most recent Master Planning process occurred from 1996-1999 andattempted to involve all stakeholders in Penn State's long-range planning process. Forexample, the Master Plan Advisory Committee was composed of students, faculty, staff, anduniversity administrators. In addition, scores of university and community professionals wereinvolved in "focus group" sessions to examine the consequences of various Master Planrecommendations on such things as transportation, housing, utilities, and the environment.Finally, there were periodic open meetings to seek reactions from all stakeholders (e.g.,government leaders, local planning commissioners, environmental groups, business leaders)regarding Master Plan recommendations.
In sum, sincere efforts are being made to seek input from a broad range of stakeholdersconcerning Penn State's building and expansion decisions. However, certain crucial questions
67
do not appear to be open to discussion (e.g., Should Penn State continue to grow?). Also,major decisions are sometimes made quickly from the top. Of course, decisive top-downdecisions may be appropriate under certain circumstances, but it is important to acknowledgethat such decisions largely bypass the slower, more inclusive process described above.Recent examples of fast-tracked, top-down Penn State "growth" decisions which did notbenefit from substantive community discussion include: the creation of University Park'snew Innovation Boulevard, the establishment of a College of Information Science andTechnology, the University Park Airport Expansion, and the construction of a UniversityRetirement Center.
Indicator 2. Building PrioritiesWhile we at Penn State have been busy erecting a multi-million dollar sports arena (See
Box),
Building PrioritiesMany are reluctant to speak critically of some of Penn State's new buildings, such
as the Bryce Jordan Center, but we would be a much healthier community of learning if weactively discussed the merits of such structures? For example, we might begin by considering thecosts and benefits of the Bryce Jordan Center. What is its true cost? How much fossil fuel isconsumed with each event? How many tons of greenhouse gases are generated? In sum, whatdoes the Bryce Jordan Center ‘teach’? We don't have answers to these questions, but wouldn't itbe enriching to have lively, open discussions in which we wrestle with such issues fromphilosophical, economic, ethical, ecological, and other perspectives?
attracting business enterprises to our new Innovation Boulevard, and leasing land for aretirement village (all are expected to generate good long-term economic returns), have weoverlooked a central function of our university buildings—to provide a dwelling place for ourstudents? Indeed, ecological impacts could be reduced and sustainability served by offeringstudents attractive, ecologically sound living space on campus (i.e., within walking and bikingdistance of classes and downtown).
FindingsPrior to the 1960s, the majority of Penn State students lived on-campus, but as
enrollments have increased, no new undergraduate dormitories have been built. Presently, justunder one-third of the total student population (graduate + undergraduate) lives on-campus; theother two-thirds must live off-campus.
Predictably, the decision to increase enrollments but to cease building undergraduatedorms transformed downtown State College into a "dormitory park." Penn State has benefitedin that it has been able to increase enrollments without worrying about providing studenthousing, and developers have profited from the new construction and subsequent rentcollection.1 But, it appears that the spill-over of Penn State’s expanding student population hascontributed significantly to the fragmentation of the Highlands Neighborhood (located just tothe South of Beaver Avenue; Figure 2). Indeed, on some streets, the family neighborhoodcharacter has ceased to exist, a result of Penn State literally swelling out of its boundaries.Approximately 45% of all the residential space in the Highlands neighborhood is now occupiedby apartment buildings/townhouses or fraternities and one-third of all homes are now rentalproperties.
1 As space for high-rise apartments becomes limiting in downtown State College, developers are erecting largeapartment complexes on the outskirts of town. For example, the 216-unit University Commons (built byCapstone Development Corp. of Birmingham, AL) and 204-unit Jefferson Commons (built by Dallas-based JPI)are located on Vairo Boulevard. These two are being joined with the 294-unit The Pointe (built by IntegroupInc. of Jacksonville, FL) which will start housing students in August, 2000. Many of these developers are fromother regions with no long-standing interest in our community beyond its profit potential.

68
Figure 2. Fragmentation of the Highlands Neighborhood (located adjacent to the PennState campus).
By leaving housing to the private sector, Penn State is losing an opportunity to take aproactive role in helping students examine important life-style issues relating to consumption,health, community, civic responsibility, and sustainability particularly during their second andthird years at the University. Even more important, are we failing to offer students the chanceto live in accord with sustainable practices (See Northland College example, pg. 71). 2
Indicator 3. Ecological Design in BuildingsThe overall intent of ecological or "green" building design is simple: Create buildings
that take less from the earth and give more to people. The goal is to produce energeticallyefficient, aesthetically pleasing buildings which cause no harm in their construction and use.“Green buildings" are healthy, safe, and a pleasure to work in, in addition to beingconsiderably less expensive to operate.
FindingsAlthough there are many examples of buildings which reflect "green design" principles
throughout the United States (National Audubon Society and Croxton Collaborative,Architects, 1994; Romm and Browning, 1994; Barnett and Browning, 1995; Natural ResourceDefense Council, 1997), there are no buildings on the Penn State campus that embody theseprinciples (See Box).3
A Closer Look at the HUB RenovationsBecause of its recent renovation, the Hetzel Union Building (HUB) was chosen as a logical
choice for examining the application of ecological design principles in Penn State buildings.Using the U.S. Green Building Council’s Leadership in Energy and Environmental Design(LEED) building rating system (a program that establishes a standard for green buildings), theHUB was evaluated in five categories including building setting, energy efficiency, materials
2 Plans have been put forth to house 220 undergraduate students in McKee Hall (once the graduate studentsnow living there are relocated to new housing on West Campus). Also, the University intends to replace thegraduate units at East View Terrace (near Pollock Commons) with undergraduate dormitories (Tom Gibson,pers. comm.). The University should seize this opportunity and offer ecologically enlightened, state-of-the-arthousing to its students (again, refer to Northland College example, pg. 71).
3 Our buildings are designed by specialists, usually working independently from one another, and sometimesemployed by firms unfamiliar with our local landscape and community. This fragmentation of responsibilitymeans that designers seldom see the entire picture.
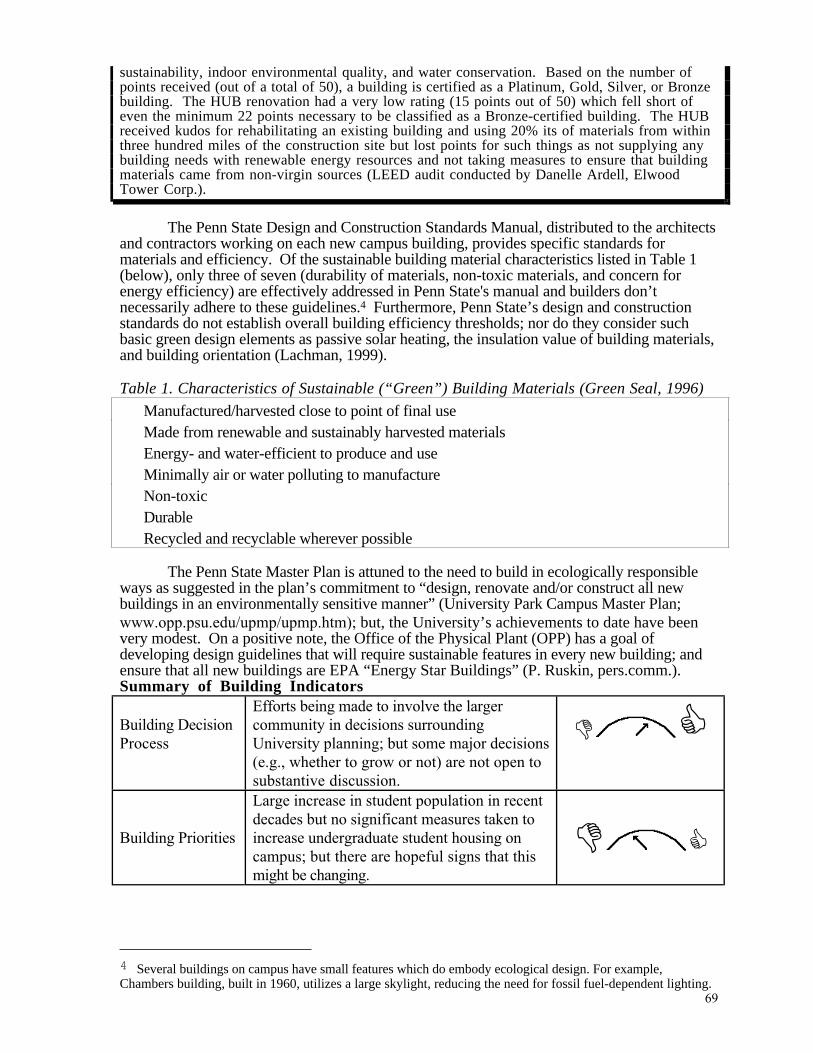
69
sustainability, indoor environmental quality, and water conservation. Based on the number ofpoints received (out of a total of 50), a building is certified as a Platinum, Gold, Silver, or Bronzebuilding. The HUB renovation had a very low rating (15 points out of 50) which fell short ofeven the minimum 22 points necessary to be classified as a Bronze-certified building. The HUBreceived kudos for rehabilitating an existing building and using 20% its of materials from withinthree hundred miles of the construction site but lost points for such things as not supplying anybuilding needs with renewable energy resources and not taking measures to ensure that buildingmaterials came from non-virgin sources (LEED audit conducted by Danelle Ardell, ElwoodTower Corp.).
The Penn State Design and Construction Standards Manual, distributed to the architectsand contractors working on each new campus building, provides specific standards formaterials and efficiency. Of the sustainable building material characteristics listed in Table 1(below), only three of seven (durability of materials, non-toxic materials, and concern forenergy efficiency) are effectively addressed in Penn State's manual and builders don’tnecessarily adhere to these guidelines.4 Furthermore, Penn State’s design and constructionstandards do not establish overall building efficiency thresholds; nor do they consider suchbasic green design elements as passive solar heating, the insulation value of building materials,and building orientation (Lachman, 1999).
Table 1. Characteristics of Sustainable (“Green”) Building Materials (Green Seal, 1996)
• Manufactured/harvested close to point of final use• Made from renewable and sustainably harvested materials• Energy- and water-efficient to produce and use• Minimally air or water polluting to manufacture• Non-toxic• Durable• Recycled and recyclable wherever possible
The Penn State Master Plan is attuned to the need to build in ecologically responsibleways as suggested in the plan’s commitment to “design, renovate and/or construct all newbuildings in an environmentally sensitive manner” (University Park Campus Master Plan;www.opp.psu.edu/upmp/upmp.htm); but, the University’s achievements to date have beenvery modest. On a positive note, the Office of the Physical Plant (OPP) has a goal ofdeveloping design guidelines that will require sustainable features in every new building; andensure that all new buildings are EPA “Energy Star Buildings” (P. Ruskin, pers.comm.).Summary of Building Indicators
Building DecisionProcess
Efforts being made to involve the largercommunity in decisions surroundingUniversity planning; but some major decisions(e.g., whether to grow or not) are not open tosubstantive discussion.
Building Priorities
Large increase in student population in recentdecades but no significant measures taken toincrease undergraduate student housing oncampus; but there are hopeful signs that thismight be changing.
4 Several buildings on campus have small features which do embody ecological design. For example,Chambers building, built in 1960, utilizes a large skylight, reducing the need for fossil fuel-dependent lighting.
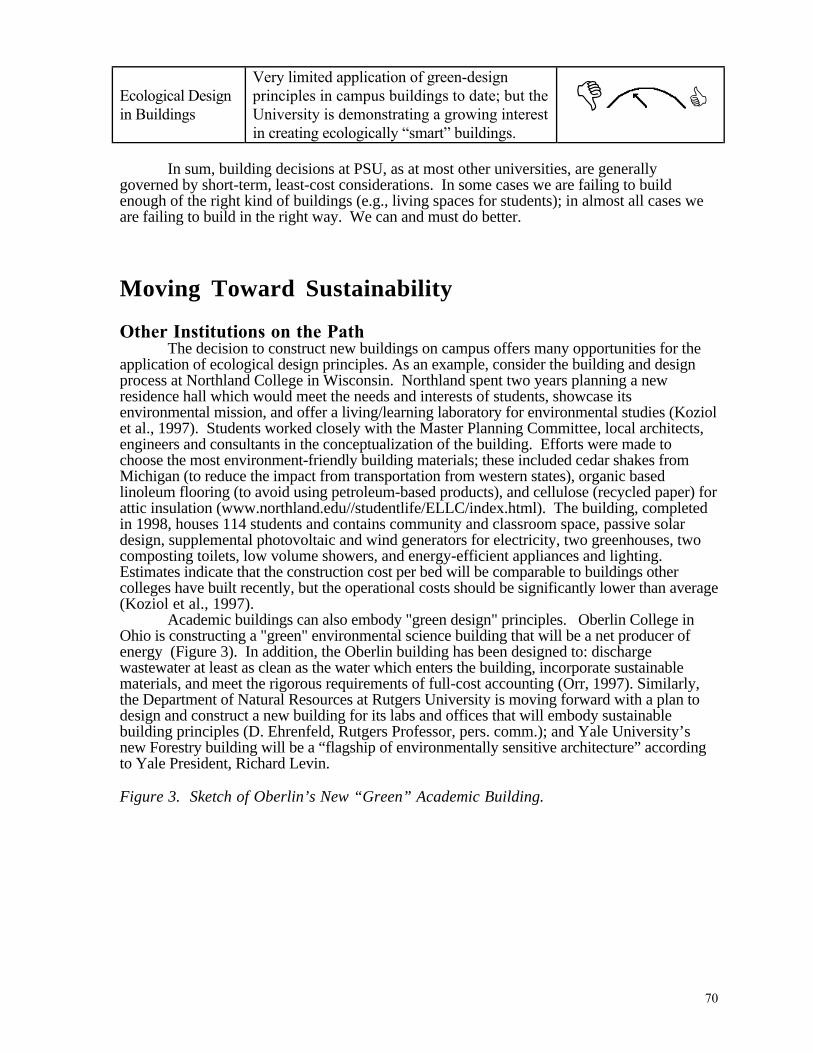
70
Ecological Designin Buildings
Very limited application of green-designprinciples in campus buildings to date; but theUniversity is demonstrating a growing interestin creating ecologically “smart” buildings.
In sum, building decisions at PSU, as at most other universities, are generallygoverned by short-term, least-cost considerations. In some cases we are failing to buildenough of the right kind of buildings (e.g., living spaces for students); in almost all cases weare failing to build in the right way. We can and must do better.
Moving Toward Sustainability
Other Institutions on the PathThe decision to construct new buildings on campus offers many opportunities for the
application of ecological design principles. As an example, consider the building and designprocess at Northland College in Wisconsin. Northland spent two years planning a newresidence hall which would meet the needs and interests of students, showcase itsenvironmental mission, and offer a living/learning laboratory for environmental studies (Koziolet al., 1997). Students worked closely with the Master Planning Committee, local architects,engineers and consultants in the conceptualization of the building. Efforts were made tochoose the most environment-friendly building materials; these included cedar shakes fromMichigan (to reduce the impact from transportation from western states), organic basedlinoleum flooring (to avoid using petroleum-based products), and cellulose (recycled paper) forattic insulation (www.northland.edu//studentlife/ELLC/index.html). The building, completedin 1998, houses 114 students and contains community and classroom space, passive solardesign, supplemental photovoltaic and wind generators for electricity, two greenhouses, twocomposting toilets, low volume showers, and energy-efficient appliances and lighting.Estimates indicate that the construction cost per bed will be comparable to buildings othercolleges have built recently, but the operational costs should be significantly lower than average(Koziol et al., 1997).
Academic buildings can also embody "green design" principles. Oberlin College inOhio is constructing a "green" environmental science building that will be a net producer ofenergy (Figure 3). In addition, the Oberlin building has been designed to: dischargewastewater at least as clean as the water which enters the building, incorporate sustainablematerials, and meet the rigorous requirements of full-cost accounting (Orr, 1997). Similarly,the Department of Natural Resources at Rutgers University is moving forward with a plan todesign and construct a new building for its labs and offices that will embody sustainablebuilding principles (D. Ehrenfeld, Rutgers Professor, pers. comm.); and Yale University’snew Forestry building will be a “flagship of environmentally sensitive architecture” accordingto Yale President, Richard Levin.
Figure 3. Sketch of Oberlin’s New “Green” Academic Building.
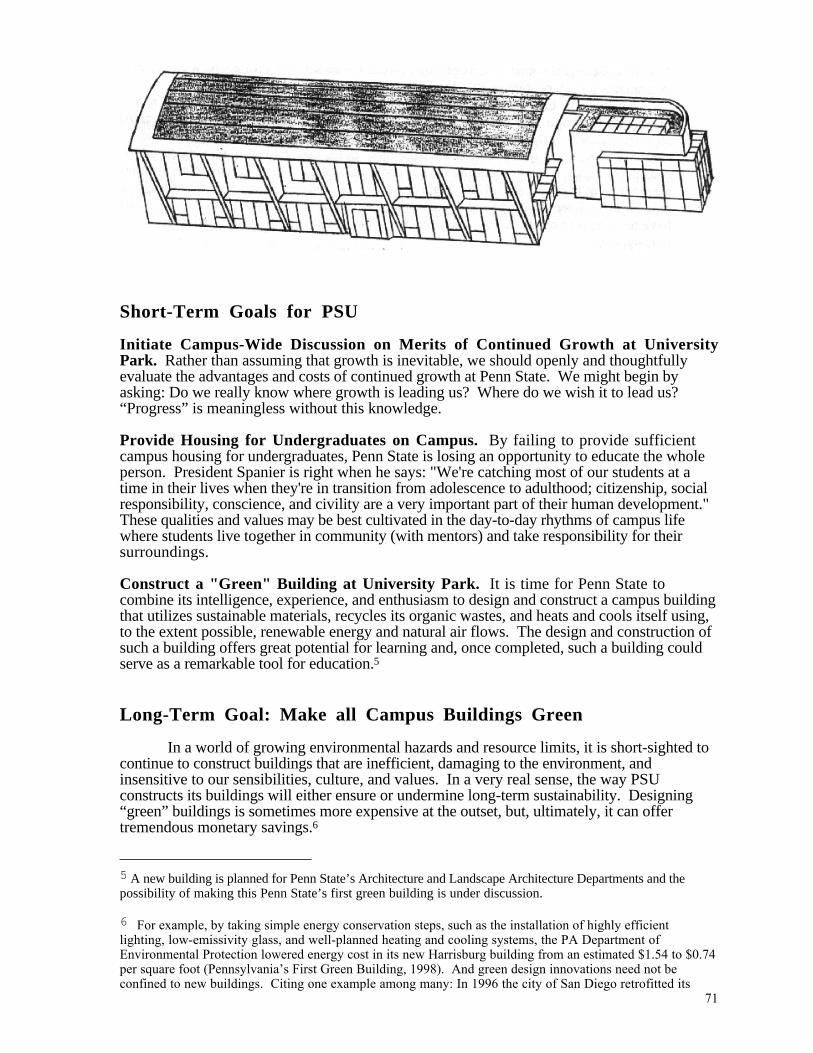
71
Short-Term Goals for PSU
Initiate Campus-Wide Discussion on Merits of Continued Growth at UniversityPark. Rather than assuming that growth is inevitable, we should openly and thoughtfullyevaluate the advantages and costs of continued growth at Penn State. We might begin byasking: Do we really know where growth is leading us? Where do we wish it to lead us?“Progress” is meaningless without this knowledge.
Provide Housing for Undergraduates on Campus. By failing to provide sufficientcampus housing for undergraduates, Penn State is losing an opportunity to educate the wholeperson. President Spanier is right when he says: "We're catching most of our students at atime in their lives when they're in transition from adolescence to adulthood; citizenship, socialresponsibility, conscience, and civility are a very important part of their human development."These qualities and values may be best cultivated in the day-to-day rhythms of campus lifewhere students live together in community (with mentors) and take responsibility for theirsurroundings.
Construct a "Green" Building at University Park. It is time for Penn State tocombine its intelligence, experience, and enthusiasm to design and construct a campus buildingthat utilizes sustainable materials, recycles its organic wastes, and heats and cools itself using,to the extent possible, renewable energy and natural air flows. The design and construction ofsuch a building offers great potential for learning and, once completed, such a building couldserve as a remarkable tool for education.5
Long-Term Goal: Make all Campus Buildings Green
In a world of growing environmental hazards and resource limits, it is short-sighted tocontinue to construct buildings that are inefficient, damaging to the environment, andinsensitive to our sensibilities, culture, and values. In a very real sense, the way PSUconstructs its buildings will either ensure or undermine long-term sustainability. Designing“green” buildings is sometimes more expensive at the outset, but, ultimately, it can offertremendous monetary savings.6
5 A new building is planned for Penn State’s Architecture and Landscape Architecture Departments and thepossibility of making this Penn State’s first green building is under discussion.
6 For example, by taking simple energy conservation steps, such as the installation of highly efficientlighting, low-emissivity glass, and well-planned heating and cooling systems, the PA Department ofEnvironmental Protection lowered energy cost in its new Harrisburg building from an estimated $1.54 to $0.74per square foot (Pennsylvania’s First Green Building, 1998). And green design innovations need not beconfined to new buildings. Citing one example among many: In 1996 the city of San Diego retrofitted its
72
Now is the time for Penn State to challenge itself to combine its intelligence andexperience to design and construct sustainable campus buildings. Green building planning isan enterprise which should involve the entire PSU community. There are aesthetic and culturalquestions, as well as technical challenges. In the cultural realm, it is important to considerwhat we want our buildings to say about us. What kinds of human relationships do we wantthem to encourage? How might we design buildings to foster civic competence andcitizenship? Given the range and depth of knowledge and creativity at Penn State, we surelyhave the means to create the most sustainable and life-affirming buildings in the history ofPennsylvania.
References
Barnett, D. L. and W. D. Browning. 1996. A Primer on Sustainable Building. Green Development Series.Rocky Mountain Institute, Snowmass, CO.
Green Seal. 1996. Choose Green Report. Green Seal, Washington, D.C., December.
Hawken, P., A. Lovins, L. Hunter Lovins. 1999. Natural Capitalism. Little, Brown and Company, Boston.
Koziol, L, B. Pasko, and T. Wojciechowski. 1997. A Residence Hall for the 21st Century. Pages 208-214 In:R. J. Koester (ed.), Conference Proceedings: Greening of the Campus II: The Next Step. Ball StateUniversity, Muncie, IN.
Lachman, S. 1999. A Greenhouse Gas Inventory of the Pennsylvania State University Park Campus. MSThesis in Geography. Penn State University, University Park, PA.
Lyle, J.T. 1994. Regenerative Design For Sustainable Development. John Wiley and Sons, New York, NY.
National Audubon Society and Croxton Collaborative, Architects. 1994. Audubon House: Building theEnvironmentally Responsible, Energy-Efficient Office. John Wiley and Sons, New York, NY.
Natural Resources Defense Council. 1997. The NRDC Webpage at http://www.nrdc.org.
Orr, D. 1997. Architecture as pedagogy II. Conservation Biology 11: 597-600.
Pennsylvania’s First Green Building. 1998. Video. Resource Communications Group.
Romm, J. J. and W. D. Browning. 1994. Greening the Building and the Bottom Line. Rocky MountainInstitute, Snowmass, CO.
COMMUNITY “All stakeholders in the University—students, faculty, staff,administrators, trustees, parents, and the public—have a right to expectthat the University will strive to be a civil community of learning; all havean obligation to make it happen.” Dr. FernWillits, PSU Professor
IntroductionMaintaining a healthy community requires a common and constant effort. Once
established, however, strong communities become a source of physical and emotional support,protection, belonging, and happiness. One of the roles of education should be to teach andprepare students for a successful and responsible life as part of society. What better way than
73,000 square-foot municipal office building and in the process reduced building energy costs by 60%; thepayback period was four years (Hawken et al., 1999).

73
to teach by example, creating a university that exhibits the characteristics of a healthy andresponsible community.
In 1996 Dr. F. Willits and colleagues conducted an assessment of community wellbeing at Penn State. The investigators discovered that many Penn State students and facultydid not feel that they were members of a purposeful, caring, and just community. Indeed, anestimated 33% of Penn State students felt that they were just a “number” at Penn State (Willitset al., 1996).1
A sustainable community displays the following characteristics:• Ecologically literate. Members of sustainable communities have the capacity to see
themselves as part of, rather than separate from, the environment in which they dwell (e.g.,they understand where their water comes from and where their waste goes).
• Safe. Sustainable communities are safe; community members share mutual respect andthis in turn fosters trust and social interaction.
• Healthy. Sustainable communities are open and vital. Community members share corevalues; they are emotionally and physically healthy; addictions are rare.
Social interaction and participation in community decisions are critical to social well-being and to sustainability. Ideally, we would like to have data on the frequency, nature, andquality of interactions among students, faculty, staff, administrators and townspeople but suchdata are not generally available. Nonetheless, there are some data and approaches that mayprovide a useful overview of community well-being at Penn State.
We use information in five areas to examine community sustainability.1. Ecological Literacy of Graduating Seniors2. Technology: Enhancing vs. Undermining Community Vitality3. Student Crime4. Student Alcohol Consumption5. Student Depression
Indicator 1. Ecological Literacy of Graduating SeniorsLiteracy is a central goal of the education enterprise. The university years provide an
opportunity to expand and deepen one’s understanding of the world. A quality educationshould, among other things, guarantee that students are helped to develop an abiding respectfor the biota and natural processes as well as a comprehensive understanding of their ownecological dependencies. This type of literacy, known as “ecological literacy”, is just asfundamental (some would argue even more fundamental) to living fully and wisely as thecapacity to read and write.
FindingsSince students spend much of their time at Penn State taking tests in specific subjects,
we wondered how well they would fare if they were given a test of a different nature—one thatfocused on their ecological literacy. In a survey of 150 graduating seniors (names chosenrandomly from a complete list of graduating seniors obtained from the Registrar's Office), wefound that:
--40% did not know the size of the world's population to the nearest billion;--63% were unable to name one federal or state law that protects the environment;--43% were not aware that acid rain is a common phenomenon in Pennsylvania;--72% had no idea that they were living within the Susquehanna River Basin; and
1 In addition to the Willits et al. study, PSU conducted a faculty and staff survey in 1996. This survey (basedon 5,000 responses and commissioned by the Office of the President) revealed that more than a quarter of therespondents would leave Penn State if another job with equal pay, benefits and working conditions wereavailable. In addition, roughly 40% of the respondents felt that PSU was a worse place to work in 1996 ascompared to three years before. While this level of disaffection is certainly not unique to Penn State, it doespoint to the need to pay careful attention to the changing quality of community life at PSU.
74
--40% were unable to name even two tree types on campus.
Unfortunately, our universities, Penn State included, often seem to cultivate ecologicalindifference rather than ecological literacy. For example, the prolific consumption of materialsat Penn State teaches (indirectly) that the Earth can supply personal needs, no matter how grandthey may be. Dining Hall food, arriving from all over the world, reinforces the mistakennotion that Penn Staters need not concern themselves with how or where their food is producedor with the loss of farmland close to home. And dumpsters bulging with refuse throughoutcampus delude students into believing that there is always an “away” for trash (Orr, 1994). Insum, Penn State students and U.S. college students, in general, are not learning nearly enoughabout how to live, day-to-day, in a sustainable fashion.
There are small signs, though, that Penn State is recognizing the need to educate forsustainability. For example, the University’s recent decision to offer an undergraduate minorin environmental studies is a step towards promoting ecological literacy. Also, PSU’s recentlyestablished Center for Sustainability has courses designed to offer students hands-onexperience in sustainable living. Finally, in recent years many PSU professors have begun toincorporate environmental issues and concerns into their course materials.
Indicator 2. Technology: Enhancing vs. Undermining CommunityWe are often dazzled by new technologies and adopt them without considering their
overall impacts—particularly their effects on the quality of human interactions. At a sustainableinstitution, technology is not permitted to undermine the quality of human interactions.
FindingsA quick reflection on our history reminds us that Penn State is becoming increasingly
dependent on technologies of all sorts. For many years after Penn State’s founding in 1855,there were no automobiles or telephones on campus. There were no synthetic pesticides orherbicides, leaf blowers, motorized leaf sweepers, weed whackers, wood chippers, powertrimmers, chain saws, power mowers, or snow blowers. There was no fluorescent lightingand no air conditioning. There was no education by television or by computer. Classroomswere not equipped with microphones, television sets, VCRs, slide projectors, film projectors,or over-heads. In the residence halls, there were no cable TV hook-ups, microwave/refrigeratorunits, washing machines, or clothes dryers. Neither were there any electronic copy machines,vending machines, or parking meters on campus. There was no nuclear reactor and no airport.
Only 20 years ago at Penn State there was no automated registration.2 There were nocomputer labs, fax machines, cellular phones, answering machines, pagers or e-mail accounts.
Some of the technologies adopted by Penn State over the years have brought immensebenefits and contributed to the sense of community, but some technologies might underminecommunity (See Box).
Can Some Technologies Undermine Community?The choice to adopt a technology to do something that we previously did on our own is
not always trivial. Consider the University's decision to replace the hand rake with the leafblower. The leaf blower technology has certain characteristics and affirms certain values. Whenwe use it, we are opting for fast (machine) pace rather than natural pace, noise rather than quiet,polluted air rather than clean air, and so forth. Of course, these things—fast pace, polluted airand noise—can negatively affect the frequency and quality of our social interactions (i.e., thequality of community life). Leaf blowers are an obvious case—but if we think about it—almostall of the technologies (answering machines, computers, motor vehicles, televisions, etc.) that we
2 For an example of how new technologies can reduce human interaction, consider the following: Before thecomputerization of registration, students were required to take a pre-registration form to their faculty advisor fora signature. This produced thousands of faculty/student interactions every semester and provided an opportunityfor students to seek out faculty for advice not only about requirements, but good courses, career plans, and studyhabits, among other things.
75
have adopted at PSU in recent decades have the potential to affect the quality of our communitylife for better or worse.
Generally, decisions to adopt new technologies at Penn State fail to consider overallimpacts. The most ill-advised way to respond to new technologies is to simply embrace all thatis offered without considering negative consequences; this is “technological sleep walking”(Franklin, 1990). In a community of learning it is essential to question the benefits and costsof each new technology that presents itself. Indeed, some technologies may free us frommisery, but others might addict us to imagined needs. Some might enhance the quality ofeducation, but others might subvert critical thinking and creative expression. Sometechnologies might foster community; others might undermine it. So far we at Penn State havebeen disinclined to critically examine the possible negative effects of our myriad technologieson the quality of community life.
Indicator 3. Student CrimeCrimes against individuals and property generate fear and show a lack of respect for
fellow community members; their prevalence suggests a lack in community strength andundermines sustainability.
FindingsCrime creates fear. A 1994 survey of 1,261 students, faculty, and staff conducted by
PSU’s Department of University Safety, showed that reasons for fear on campus wereoverwhelmingly from the possibility of human attacks of some kind. Forty-five percent ofrespondents reported never experiencing fear, while 55% experienced fear at least“occasionally,” and 6% “always” or “most of the time.” A possible solution to this problem isto install more lighting on campus, but there is a “downside” to this “solution” (See Box).
A Trade-Off: Dimming the Stars for SafetyStrolling outdoors on a clear night and gazing at the moon and stars is one of life’s
pleasures. But the installation of strong outdoor lighting for safety purposes makes it hard toview even the brightest constellations from our cities, neighborhoods and campuses.
Between 1995 and 2000, Penn State’s Department of Health and Safety spentapproximately $500,000 on outdoor lighting improvements in an effort to solve campus safetyissues. The lighting was installed in places on campus where people complained of feeling unsafeor where site assessors determine there to be dark spots. The cost of each new light fixture wasapproximately $1,000. Installation raised the total cost to over $2,000 per lamp (M. Claver,Director of Environmental Health and Safety, pers. comm.). The lights operate from dusk untildawn, 365 days a year. As we increase outdoor lighting on campus, our experience of night-timeis diminished—and so it is that we may gradually come to lose sight of the fact that we live in avast and mysterious universe.
On average, 8.5 crimes were committed per day by PSU students on and off campus in1998. Considering that the Department of University Safety (1994) has estimated that only39% of all crimes committed against university students and faculty are actually reported, theactual number of crimes per day in 1998 may be as high as 22. For the entire year of 1998, atotal of 845 reported instances of serious Part I crimes (i.e., rape, assault, larceny) and 2,242reported instances of less serious Part II crimes (i.e., sex offenses other than rape, crimesagainst property) were committed (data from University Police Services and State CollegeBureau Police records).Overall, the number of student Part 1 crimes per year has decreased in recent years while Part 2crimes have been fluctuating (Figure 1).
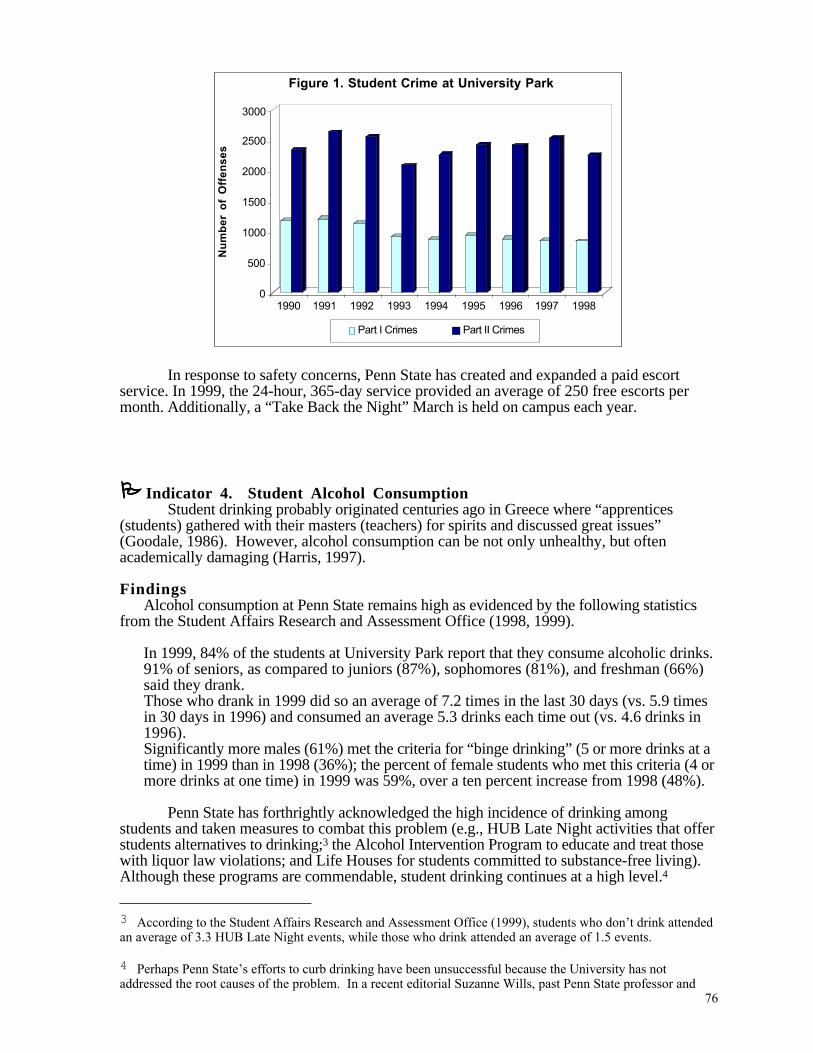
76
0
500
1000
1500
2000
2500
3000
Nu
mb
er
of
Off
en
se
s
1990 1991 1992 1993 1994 1995 1996 1997 1998
Figure 1. Student Crime at University Park
Part I Crimes Part II Crimes
In response to safety concerns, Penn State has created and expanded a paid escortservice. In 1999, the 24-hour, 365-day service provided an average of 250 free escorts permonth. Additionally, a “Take Back the Night” March is held on campus each year.
Indicator 4. Student Alcohol ConsumptionStudent drinking probably originated centuries ago in Greece where “apprentices
(students) gathered with their masters (teachers) for spirits and discussed great issues”(Goodale, 1986). However, alcohol consumption can be not only unhealthy, but oftenacademically damaging (Harris, 1997).
FindingsAlcohol consumption at Penn State remains high as evidenced by the following statistics
from the Student Affairs Research and Assessment Office (1998, 1999).
• In 1999, 84% of the students at University Park report that they consume alcoholic drinks.• 91% of seniors, as compared to juniors (87%), sophomores (81%), and freshman (66%)
said they drank.• Those who drank in 1999 did so an average of 7.2 times in the last 30 days (vs. 5.9 times
in 30 days in 1996) and consumed an average 5.3 drinks each time out (vs. 4.6 drinks in1996).
• Significantly more males (61%) met the criteria for “binge drinking” (5 or more drinks at atime) in 1999 than in 1998 (36%); the percent of female students who met this criteria (4 ormore drinks at one time) in 1999 was 59%, over a ten percent increase from 1998 (48%).
Penn State has forthrightly acknowledged the high incidence of drinking amongstudents and taken measures to combat this problem (e.g., HUB Late Night activities that offerstudents alternatives to drinking;3 the Alcohol Intervention Program to educate and treat thosewith liquor law violations; and Life Houses for students committed to substance-free living).Although these programs are commendable, student drinking continues at a high level.4
3 According to the Student Affairs Research and Assessment Office (1999), students who don’t drink attendedan average of 3.3 HUB Late Night events, while those who drink attended an average of 1.5 events.
4 Perhaps Penn State’s efforts to curb drinking have been unsuccessful because the University has notaddressed the root causes of the problem. In a recent editorial Suzanne Wills, past Penn State professor and
77
Indicator 5. Student DepressionDepression is a psychological disorder which has been linked to the absence of a strong
social support network (Koeske, 1991). A prevalence of depression in our community couldindicate a lack of mutual caring and support among community members.
FindingsDuring 1998/99, 2031 students sought treatment from the University’s Counseling and
Psychological Services (CAPS). Out of this number, 32% (641 students) were diagnosed withdepression-related disorders—up from 18% in 1991, making depression the most frequentlydiagnosed disorder group.5 Major depression, a specific type of depression, saw a 31%increase in the two year period from 1996/97 to 1998/99. CAPS is working hard on thisproblem and the increased incidence of depression is probably due to better diagnostic effortsby the CAPS staff and also to an increasing public awareness and publicity given to thisdisorder which may be causing once-reluctant students to seek treatment (W. Wadlington,Associate Director for Clinical Services, pers. comm.).
Summary of Community Indicators
Ecological Literacy ofGraduating Seniors
Graduating seniors appear to have a lowlevel of ecological literacy; the Universityhas taken some steps to begin to addressthis problem.
Technology:Enhancing vs.UnderminingCommunity Vitality
Disinclination to assess how theintroduction of new technologies tocampus might negatively affect the qualityof community life and long-termsustainability.
Student Crime
Decline in incidence of serious crimes(e.g., rape, violent assault); but steady andhigh level of more common crimes (e.g.,abuse of property). Some measures takento reduce crime, but a comprehensiveanalysis of crime causes and solutions stilllacking.
psychologist at CAPS (Counseling and Psychological Services) wrote: A sizable portion of my (CAPS)clientele were drinking heavily, sometimes several times a week. It was clear that the beer and the bourbonwere medications against the symptoms of mental disorders that had frequently gone undiagnosed anduntreated for months—sometimes for years. They were drinking to stop their pain…I have since beenconvinced that many binge-drinking students at Penn State are actually self-medicating for a variety ofuntreated mental disorders, personal issues and family problems. Tragically, their disorders remain largelyundiagnosed and untreated…If the university administrators are sincere about significantly reducing excessivedrinking by students, they need to rethink completely their approach to the problem (Wills, 1999).
5 Using these data, the estimated rate of depression in the total student population was 1.3% during 1998/99.However, this figure may be an underestimation because it accounts for only those students who soughttreatment at CAPS. A survey of 525 students conducted by Student Affairs Research and Assessment (1997)indicated that 72% of students surveyed wished to discuss “dealing with depression.”
78
Student AlcoholConsumption
The University has taken significantefforts to curb drinking, but still lacks acomprehensive strategy for how toaddress underlying causes for frequentdrinking (admittedly a daunting challenge).
Student Depression
Depression fairly common amongstudents; some measures taken todiagnose and provide assistance tostudents suffering from depression-relateddisorders, but comprehensive analysis ofproblem and possible solutions stilllacking.
Moving Toward Sustainability
Other Institutions on the PathMany organizations are endeavoring to facilitate the creation of more wholesome,
open, and just interactions while, at the same time, promoting ecological literacy. Forexample, the World Resources Institute is working with over 100 business schools tointegrate ecological literacy into business curricula (www.wri.org/wri/meb/); and theConsortium for Environmental Education in Medicine is working with medical schools toelucidate the relationship between human health and environmental health (www.ceem.org).
Universities are also taking initiative. Tufts recently created an Environmental LiteracyInstitute and made ecological literacy a goal for all students. Allegheny College is workingwith students to create environmental and economic improvements in biologically diverse buteconomically impoverished Northwest Pennsylvanian communities. Some schools have evenincorporated a commitment to ecological literacy into their mission statements. For example,Middlebury College…“is committed to environmental mindfulness and stewardship in all itsactivities. This commitment arises from a sense of concerned citizenship and…a desire to teachand lead by example. The College gives high priority to…respect and care for theenvironment, sustainable living, and intergenerational responsibility” (quoted from MiddleburyCollege Mission Statement).
Short-Term Goals for PSU
Critically Evaluate New Technologies before Accepting them. Major newtechnologies should not be introduced into Penn State until the University has carefullyconsidered their costs as well as their benefits. The University needs a policy that outlines thecriteria by which it might judge the “appropriateness” of technological innovations. J.Robertson (1985) provides a good guide when he writes: "A useful criterion [in examining aproposed technology] is to ask whether the new material, or equipment, or process, or systemis likely to enlarge the range of competence, control, and initiative of the people who will beaffected by it; or whether it is more likely to subordinate them to more powerful people andorganizations, and make them dependent on bureaucracies and machines which they cannotthemselves control."
79
Initiate Pledge of “Social and Environmental Responsibility” at Graduation.Graduating seniors at dozens of universities are now signing a statement which says: “I pledgeto investigate and take into account the social and environmental consequences of any jobopportunity I consider.” This pledge is printed on commencement programs and studentssigning the pledge wear green ribbons at graduation (www.machester.edu). Offering PennState graduates the opportunity to sign a wallet-size card containing this pledge would fosterecological responsibility.
Create a Constellation of Communities to Nurture Civic Responsibility. Tocreate a stronger sense of interconnection at Penn State, instead of assigning most students toresidence halls at random, Interest Houses (dorm floors to which students with commoninterests are assigned) could become the norm, allowing smaller, more intimate communities toemerge. Members of an Interest House might also be assigned specific responsibilities. Areasof responsibility could include landscape maintenance, food preparation, building andequipment care, and so forth. Allowing students to participate meaningfully in university lifewould generate feelings of connection, trust, and empowerment.Long-Term Goal: Promote Ecological Literacy of PSU Community
Does the graduate know that “he is only a cog in an ecological mechanism?That if he will work with that mechanism his mental wealth and hismaterial wealth can expand indefinitely? But that if he refuses to workwith it, it will ultimately grind him to dust…If education does not teach usthese things, then what is education for?” Aldo Leo
Our universities are educating the people who will eventually run society’s institutions.It is time for Penn State—through well-designed courses, labs, workshops andinternships—but most of all through example—to ensure that all its graduates achieveecological literacy. Specifically, Penn State should work, step-by-step, to ensure that itsgraduating seniors are:• Aware of their ecological dependencies: PSU graduates should learn how to identify,
wherever they live, the sources of their food, water, and energy, as well as the destiny oftheir waste.
• Grounded in the natural world: Graduates should be able to walk through Pennsylvania’sfields and forests and along streams and recognize the commonly occurring organisms(biodiversity); and they should be attuned to fundamental ecological processes (e.g.,energy flow, nutrient cycling, species interactions).
• Skilled at making ecological connections: Graduates should be able to take any ordinaryman-made object (e.g., a magic marker, three-ring binder, pair of sneakers) and elucidate,in a general way, the “upstream” and “downstream” ecological connections associated withthe product’s manufacture, use, and disposal.
• Mindful of their “ecological footprints”: Graduates should be able to calculate the size oftheir ecological footprint and be knowledgeable of measures they might take to minimize“footprint” size (Wackernagel and Rees, 1996).
References
Department of University Safety. 1994. Victimization/Campus Safety Survey. Pennsylvania State University,University Park, PA.
Franklin, V. 1990. The real world of technology. CBC Massey Lectures, Toronto, ON: CBC Enterprises.
Goodale, T. G. 1986. Alcohol and the College Student. Jossey-Bass Inc., San Francisco, CA.
Harris, A. 1997. Binge drinkers risk serious health problems. Centre Daily Times, Page A1, Oct. 10.
80
Koeske, G.F. 1991. Underestimation of social support buffering. Journal of Applied Behavioral Science.27(4): 475-489.
Orr, D. 1994. Earth in Mind. Island Press. Washington, D.C.
Roberston, J. 1985. Future Work: Jobs, Self-Employment, and Leisure After the Industrial Age. UniverseBooks, New York, NY.
Student Affairs Research and Assessment Office. 1998, 1999. Penn State Pulse: Student Drinking.The Pennsylvania State University, University Park, PA.
Wackernagel, M, and W. Rees. 1996. Our ecological footprint. New Society Publishers, Gabriola Island, BC,Canada.
Willits, F.K., J.O. Janota, B.L. Moore, and D.M. Enerson. 1996. Penn State as a Community of Learning:Faculty and Student Views. The Pennsylvania State University, University Park, PA.
Wills, S. 1999. The right to party may be excuse for escape. Centre Daily Times. Page 12a. Oct. 24.
81
RESEARCH
“…Although the scientific enterprise in the US and abroad has beenphenomenally successful in producing a wealth of knowledge which in turnhas brought untold benefits to humanity, the scientific enterprise is notsufficiently forward-looking and is not fully prepared to face the formidablechallenges ahead…I suggest that part of our collective responsibility tosociety should include a community-wide reexamination of our goals and analteration of our course…” Dr. Jane Lubchenco, PresidentialAddress to American Association for the Advancement of Science,February, 1997
IntroductionPenn State is recognized globally for the quantity and quality of its research. Across
the sciences and humanities the University has scores of world-renowned scholars. Thecontributions of Penn State faculty appear regularly in the world's most prestigious journals;PSU researchers have received almost every imaginable award. Moreover, the importance ofPenn State research increases with each passing year as reflected by the steady rises in thenumber of grants and in the size of the research budget (e.g., increasing from about 100million dollars in 1980 to over 390 million dollars today). Of particular note in recent years isthe rapid increase in funding from industry and other private sources (up 16% in 1999 from1996).
Of course, there is more to understanding university research than tallying prizes,grants and patents. For example, a Pennsylvania citizen or a Penn State Trustee or a studentmight wonder: Do the scientific discoveries and technological innovations coming out of PennState contribute measurably to health, harmony, and wholeness? Does PSU researchcontribute to local and global sustainability?
Research in a society which is committed to sustainability is characterized by the following:• Research uses sustainable means. Research activities endeavor to minimize harm to
the environment and to other beings. Strict ethical guidelines govern the treatment ofresearch subjects; research-related waste is kept to a minimum and disposed of carefully.
• Research seeks to promote sustainability. Creating a sustainable society requiresthat we conduct both basic and applied research with an emphasis on: deepening ourunderstanding of natural processes; the efficient and wise use of materials; the intricacies offull-cost accounting; and the social dimensions of democracy and civic responsibility.1
• Researchers are mindful of the values underlying their investigations.Researchers should acknowledge forthrightly that research is not "value-free"--that italways serves some value.2
1 Of course, this is not an exhaustive list. Basic research in such fields as medicine, physics, chemistry,astronomy, climatology, among many others, is also fundamental to contributing to a sustainable world.
2 Upon reading this statement, one reviewer wrote: "Strong objection! Research is or can be value-free. To"acknowledge" this [that research is value-laden] is to give legitimacy to the deliberate prostitution ofscience for idealogical purposes."
It is not our intention to suggest that the objectivity of our research enterprise is compromised byvalue-orientation. Rather, we simply wish to point out that values of some sort undergird all of our researchundertakings. Indeed, the questions that we ask are a reflection of our values. We believe that it is bothworthwhile and important for those engaged in research to examine the ways in which their work may serve thevalues of major societal institutions (particularly those institutions providing the money for their research).
82
Sustainability in the area of research is difficult to gauge. Therefore what follows isonly a first step in considering how research might be conducted with sustainability principlesin mind (Indicators 1 and 2); how it might produce knowledge that leads toward a moresustainable world (Indicator 3); and how research priorities could promote or underminesustainability (Indicator 4). 1. Treatment of Research Subjects 2. Disposal of Laboratory Wastes
3. Research on Sustainability4. Research Priorities
Indicator 1. Treatment of Research SubjectsIn disciplines such as psychology, physiology, sociology and nutrition, humans are
often used as research subjects. Moreover, because humans share anatomical, physiological,and genetic similarities with other animals, especially vertebrates, our understanding of humanbiology and psychology has been aided by laboratory investigations of animals. A universitythat is respectful of the biota and natural processes will endeavor to treat researchsubjects—both human and non-human—in an ethical manner.
FindingsHuman subjects . In 1999, Penn State's Office for Regulatory Compliance (ORC) coordinatedthe review and approval for 2,001 research protocols involving human subjects. Protocols areassigned to one of the three review levels (i.e., exempted review, expedited review, or fullreview). The level of review is determined by the potential risk to the participant(s). Duringthe review process, the Institutional Review Board (IRB) may require modification and/orclarification to the submitted protocol before approval can be considered. An estimated 6% ofthe 1999 protocols required "full review" by the IRB. The IRB and ORC are committed toworking closely with researchers in obtaining approval while maintaining compliance withgovernmental regulations. This commitment is evident in that fact that only three protocolshave been denied full approval by the IRB since 1991. (K. English, Research ComplianceCoordinator and C. Yekel, Director of Regulatory Affairs).
Non-human subjects . Information revealing the frequency of research projects that may bepotentially stressful to animal subjects is not generally released by ORC (C. Yekel, Director ofRegulatory Affairs).3 However, a review of PSU laboratory animal stress data received fromthe USDA through “Right to Know” channels revealed no reported incidences of animalssubjected to severe pain or distress in PSU research labs in recent years.
Overall, the ORC and IRB appear to do an exemplary job of ensuring that research isconducted in accordance with federal regulations. But, in the interest of sustainability, PSUshould consider exceeding these regulations. For example, regulations on “non-humansubjects” (see above), only apply to vertebrates, but vertebrates are not the only organisms thatexperience pain. Penn State might extend these regulations to all creatures with the capacity toexperience pain.
Indicator 2. Disposal of Laboratory WastesWaste is a byproduct of scientific research. Research-related wastes at University Park
take three principle forms: hazardous, infectious, and radioactive.
3 The Institutional Animal Care and Use Committee (IACUC) compile these data. The Penn State IACUCuses the following three USDA categories of animal treatment:
-The use of animals in teaching, testing, or experimental procedures that would be expected to causeslight or momentary pain or distress or no pain or distress.
-The use of animals in procedures that would cause pain or distress appropriately relieved byanalgesia, tranquilization or anesthesia.
-The use of animals in procedures that involve unrelieved pain or distress.

83
FindingsHazardous wastes . Approximately three-quarters of the hazardous waste generated at
Penn State comes from research laboratories (M. Claver, Director of Office of EnvironmentalHealth and Safety, pers. comm.).4 A wide array of chemical substances are used in theresearch and teaching of Chemistry, Biology, Physics, Materials and Polymer Science,Nutrition, and Earth and Mineral Sciences. Spent chemicals (i.e., unwanted end products ofresearch activity), old chemicals (chemical activity no longer considered reliable), and certainother research materials are disposed of as hazardous waste. Hazardous waste is generated atmany sites on the main campus (Figure 1).
Figure 1. Hazardous Waste Pick-up Sites on University Park Campus. (Not all buildingsthat generate hazardous waste are included.)
Hazardous waste production at University Park has been in the vicinity of 100,000 to150,000 lbs/year with the exception of 1996/97 when it increased sharply to 231,000 lbs(Department of University Health and Safety Annual Report, 1996/97).5 The disposal ofhazardous waste presents special challenges for a university striving to be ecologicallyresponsible (See Box).
Where Do Penn State’s Hazardous Wastes Go?Safety-Kleen (formerly Laidlaw Environmental Services), an international company with
headquarters in Columbia, South Carolina, collects and disposes of PSU’s hazardous waste.Safety-Kleen transports much of this waste either to Bridgeport or Deepwater, New Jersey, forincineration or treatment to Pinewood, South Carolina for landfilling. Poor rural communitieswith cash-flow problems are often, though not always, targets for hazardous waste disposal. Thisraises knotty ethical questions for an institution like Penn State which seeks to promote equalityand justice. If Penn State was required to dispose of all its hazardous wastes right here inPennsylvania there would be a powerful incentive to completely eliminate highly toxic waste fromcampus (i.e., waste that we would refuse to bury in our own “back yard”).
4 “Hazardous wastes”, as defined by the U.S. Resource Conservation and Recovery Act, are solids, liquids andgases which may: 1) cause or be a significant contributor to mortality or illness within an individual orpopulation; or 2) pose a hazard to the health of humans or the environment when managed improperly.
5 According to the Department of University Health and Safety’s 1996/97 Annual Report, this increase isattributable, at least in part, to two factors: 1) the disposal of gas cylinders (in the past, General Stores was ableto return most cylinders to the original manufacturer, but now manufacturers are no longer willing to providedisposal services); and 2) the disposal of a higher-than-normal number of lithium boilers.
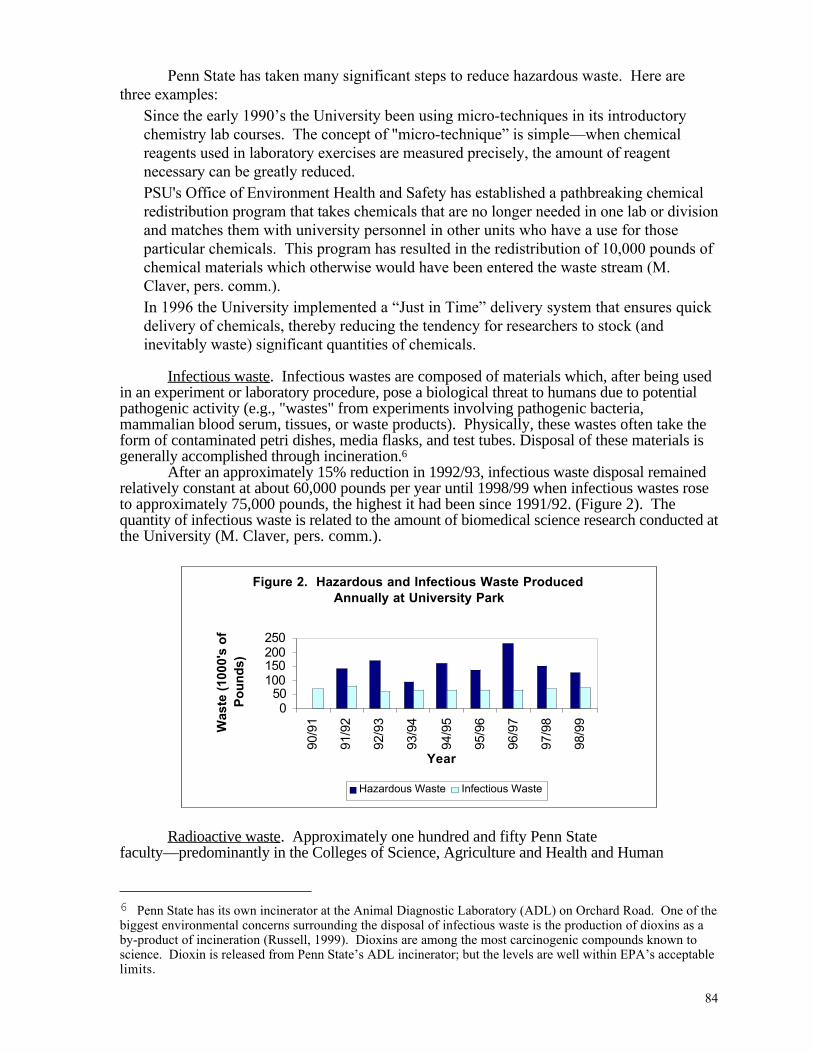
84
Penn State has taken many significant steps to reduce hazardous waste. Here arethree examples:• Since the early 1990’s the University been using micro-techniques in its introductory
chemistry lab courses. The concept of "micro-technique” is simple—when chemicalreagents used in laboratory exercises are measured precisely, the amount of reagentnecessary can be greatly reduced.
• PSU's Office of Environment Health and Safety has established a pathbreaking chemicalredistribution program that takes chemicals that are no longer needed in one lab or divisionand matches them with university personnel in other units who have a use for thoseparticular chemicals. This program has resulted in the redistribution of 10,000 pounds ofchemical materials which otherwise would have been entered the waste stream (M.Claver, pers. comm.).
• In 1996 the University implemented a “Just in Time” delivery system that ensures quickdelivery of chemicals, thereby reducing the tendency for researchers to stock (andinevitably waste) significant quantities of chemicals.
Infectious waste . Infectious wastes are composed of materials which, after being usedin an experiment or laboratory procedure, pose a biological threat to humans due to potentialpathogenic activity (e.g., "wastes" from experiments involving pathogenic bacteria,mammalian blood serum, tissues, or waste products). Physically, these wastes often take theform of contaminated petri dishes, media flasks, and test tubes. Disposal of these materials isgenerally accomplished through incineration.6
After an approximately 15% reduction in 1992/93, infectious waste disposal remainedrelatively constant at about 60,000 pounds per year until 1998/99 when infectious wastes roseto approximately 75,000 pounds, the highest it had been since 1991/92. (Figure 2). Thequantity of infectious waste is related to the amount of biomedical science research conducted atthe University (M. Claver, pers. comm.).
Figure 2. Hazardous and Infectious Waste Produced Annually at University Park
050
100150200250
90/9
1
91/9
2
92/9
3
93/9
4
94/9
5
95/9
6
96/9
7
97/9
8
98/9
9
Year
Was
te (
1000
's o
f P
ou
nd
s)
Hazardous Waste Infectious Waste
Radioactive waste . Approximately one hundred and fifty Penn Statefaculty—predominantly in the Colleges of Science, Agriculture and Health and Human
6 Penn State has its own incinerator at the Animal Diagnostic Laboratory (ADL) on Orchard Road. One of thebiggest environmental concerns surrounding the disposal of infectious waste is the production of dioxins as aby-product of incineration (Russell, 1999). Dioxins are among the most carcinogenic compounds known toscience. Dioxin is released from Penn State’s ADL incinerator; but the levels are well within EPA’s acceptablelimits.
85
Development—conduct research using radioisotopes. Penn State has a well-developedprotocol for receiving, tracking, and disposing of radioactive materials.
Most (about three-quarters) of Penn State’s radioactive waste is short lived. Forexample, the University generates anywhere from 400-1500 gallons of short-lived, liquidradioactive waste each year. This material is stored in the Academic Projects Building until itsactivity has declined to well below (< 10%) of regulatory limits at which time it is released tothe drainage system.
During the 1990s, Penn State’s Radiation Protection Office received, annually,approximately 12,000 pounds of solid waste (e.g., rubber gloves, bench paper, petri dishes,pipette tips, scintillation viles) contaminated by long- and short-lived radioisotopes.Approximately 4,000 pounds of the long-lived radioactive waste (in the form of tritium-contaminated scintillation viles) was shipped to Florida each year for disposal. Another 2,000pounds of long-lived radioactive waste was trucked, at a cost of $7-10/pound, to Washingtonwhere it was incinerated. Upon incineration, the long-lived isotopes were either diluted in theatmosphere or concentrated in the residual ash, which was placed in drums and buried. Theremaining 6,000 pounds consists of short-lived radioactive waste that was stored until it wasno longer radioactive. It was then surveyed and placed into the normal trash waste stream (E.Boeldt, pers. comm.).
In sum, Penn State produced, on average, about 250,000 pounds of hazardous,infectious, and radioactive waste per year in the 1990s. This amounts to about six pounds peryear for each full-time student at University Park. It is to Penn State’s credit that it has a highlyeffective system for monitoring and transferring research-related waste. Nevertheless, withlarge amounts of research-related waste generated by Penn State, the situation cannot be said tobe sustainable.
Indicator 3. Research on SustainabilityResearch that improves our understanding of ecology, seeks to discover ways to
harness renewable sources of energy, or increases the health of our soils, often contributesdirectly to sustainability. But the impact of many types of research on sustainability is,admittedly, difficult to discern. Indeed, Penn State has little knowledge of how its myriadresearch initiatives are linked to sustainability. Here we consider the research in Penn State’sCollege of Agriculture in the context of sustainability. Agriculture is an appropriate examplebecause of Penn State’s status as a Land Grant Institution.
Many attributes of the current U.S. food system are unsustainable (Lacy, 1993). Forexample, the system depends on unsustainable supplies of fossil fuels, often promotes theerosion of biological diversity and soils, depletes freshwater aquifers, and might evencompromise human health with it heavy use of pesticides, antibiotics, and hormones. Inresponse to these problems, there is an increasing emphasis on sustainable agriculture in ourLand-Grant universities (Francis et. al., 1995)
FindingsAt Penn State a growing amount of research attention is being directed to biotechnology
and “industrial” approaches to agriculture. This hi-tech emphasis can solve short-termproblems of food production and distribution, but may have deleterious long-termconsequences (See Box).
PSU and Biotechnology: Promise and PerilBiotechnology now gives humans the ability to take a gene from a trout and stick in into
a tomato. Why do this? To give the tomato some desirable trait that previously only the troutpossessed. Life forms created in this way are referred to as “transgenic species.”
At Penn State there are over one-hundred scientists working in the realm ofbiotechnology. The promises of biotechnology research (e.g., cloning to mass-produce animalsthat could be used as chemical factories to produce chemicals and drugs for human use) areexciting.
Humans have been quick to seize on the promises of biotechnology but slow toacknowledge the perils. Jeremy Rifkin (1999) raises five questions that prompt us to consider theperil behind the promise:
86
--In reprogramming the genetic codes of life, do we risk fatal interruption of millions ofyears of evolutionary development?
--Will the creation, mass production, and wholesale release of thousands of geneticallyengineered life forms into the environment cause irreversible damage to the biosphere, makinggenetic pollution an even greater threat to the planet than nuclear and petrochemical pollution?
--What are the consequences for the global economy and society of reducing the world’sgene pool to patented intellectual property controlled exclusively by a handful of multinationalcorporations?
--How will the patenting of life affect our deepest convictions about the sacred nature andintrinsic value of life?
--What is the educational and intellectual impact of growing up in a world where all oflife is treated as “invention” and “commercial property”?
It is remarkable that a technology which could substantially reconfigure, in unknownways, what it has meant to be human is not under discussion in every hallway, dorm suite,classroom, and street corner of our University. As Bill McKibben points out, “To ignore thisissue is to duck history.”
While it is true that Penn State lacks a well-coordinated research emphasis onsustainable agriculture, individual researchers and labs have made some significantcontributions to sustainable farming practices, most notably in the areas of soil fertility and pestmanagement. Outlined below are examples of a few Penn State research and extension projectsrelated to sustainable agriculture:
• Nutrient management to increase fertilizer-use efficiency and decrease pollution caused byexcess fertilizer runoff.
• Intensive pasture grazing systems to reduce costs and soil erosion as well as decreaseenergy, pesticide and herbicide use, while increasing herd health.
• Integrated Pest Management to control pests and reduce reliance on pesticides.• Pesticide education program aimed at the safe and proper use of pesticides, the fate of
pesticides in the environment, and the effects of pesticide exposure on human health.• Agricultural Extension Agent training to incorporate sustainable agricultural principles and
approaches into extension work through SARE (Sustainable Agriculture Research andEducation Task Force).
Although PSU’s College of Agriculture has some initiatives underway that explicitlyaim at promoting long-term ecological sustainability, there is much more that could be done(especially considering the size of the College of Agriculture’s annual State/Federal researchappropriation--approximately $28 million in 1998/99). Penn State still lacks, for example, astrong and comprehensive commitment to promoting sustainable vs. conventional (oftenunsustainable) farming practices. In general, there is an over-emphasis on large-scale, high-tech, high-input, corporate solutions to the agricultural challenges before us. Needed is aproactive, forward-looking agenda that promotes sustainable farming practices and healthfuleating and that leads to the creation of a tapestry of public policies that can nourish familyfarming, care for natural resources, and guarantee food security (See Box).
Using Sustainability Principles to Shape Penn State’s Ag Research MissionA sustainable agriculture respects the biota and natural processes, eliminating those
practices and substances that might compromise the well-being of present and future generationsof all species (not just humans). It embodies a commitment to live within limits, minimizing theinputs of non-renewable resources and carefully managing those inputs which are renewable. Asustainable agriculture also accounts for the environmental and social costs involved in foodproduction and these costs are reflected in food prices. Furthermore, a sustainable agriculture isintensely democratic and mindful of place, seeking to promote a diversified, healthy regionalfarm economy that links communities, to the degree possible, to the food they consume and thepeople who produce it. The transition to a sustainable agricultural system will require more than
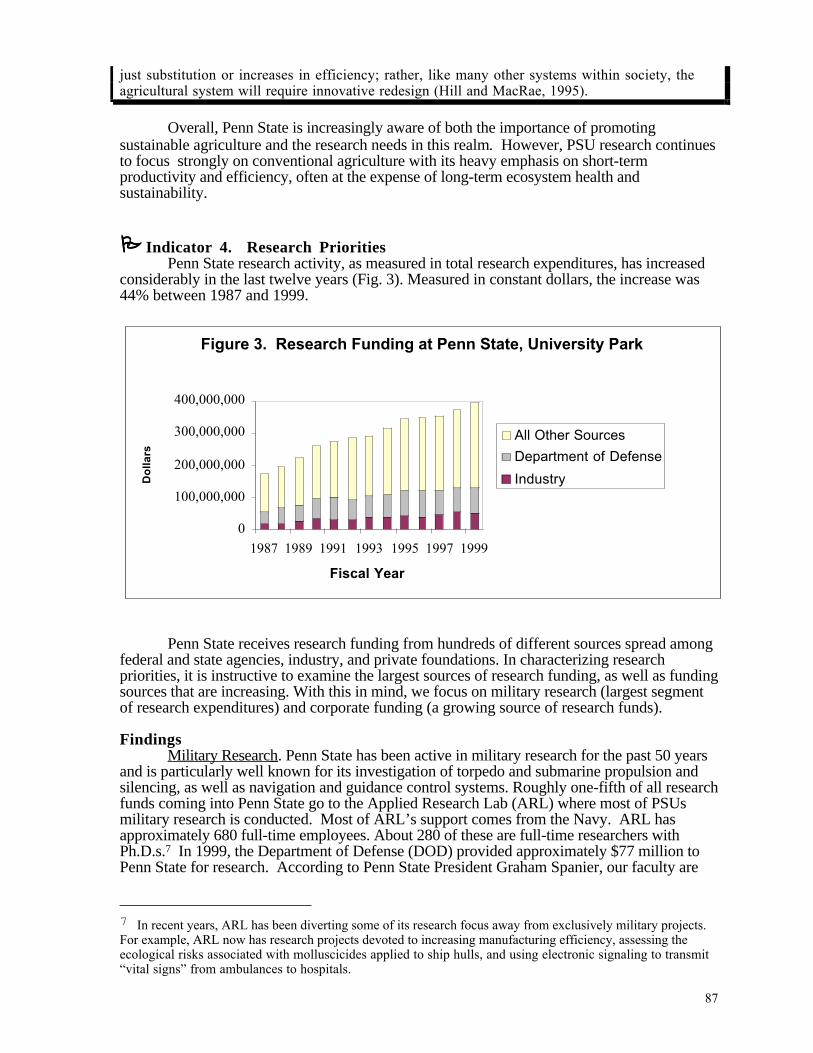
87
just substitution or increases in efficiency; rather, like many other systems within society, theagricultural system will require innovative redesign (Hill and MacRae, 1995).
Overall, Penn State is increasingly aware of both the importance of promotingsustainable agriculture and the research needs in this realm. However, PSU research continuesto focus strongly on conventional agriculture with its heavy emphasis on short-termproductivity and efficiency, often at the expense of long-term ecosystem health andsustainability.
Indicator 4. Research PrioritiesPenn State research activity, as measured in total research expenditures, has increased
considerably in the last twelve years (Fig. 3). Measured in constant dollars, the increase was44% between 1987 and 1999.
Figure 3. Research Funding at Penn State, University Park
0
100,000,000
200,000,000
300,000,000
400,000,000
1987 1989 1991 1993 1995 1997 1999
Fiscal Year
Do
lla
rs
All Other Sources
Department of Defense
Industry
Penn State receives research funding from hundreds of different sources spread amongfederal and state agencies, industry, and private foundations. In characterizing researchpriorities, it is instructive to examine the largest sources of research funding, as well as fundingsources that are increasing. With this in mind, we focus on military research (largest segmentof research expenditures) and corporate funding (a growing source of research funds).
Findings Military Research . Penn State has been active in military research for the past 50 years
and is particularly well known for its investigation of torpedo and submarine propulsion andsilencing, as well as navigation and guidance control systems. Roughly one-fifth of all researchfunds coming into Penn State go to the Applied Research Lab (ARL) where most of PSUsmilitary research is conducted. Most of ARL’s support comes from the Navy. ARL hasapproximately 680 full-time employees. About 280 of these are full-time researchers withPh.D.s.7 In 1999, the Department of Defense (DOD) provided approximately $77 million toPenn State for research. According to Penn State President Graham Spanier, our faculty are
7 In recent years, ARL has been diverting some of its research focus away from exclusively military projects.For example, ARL now has research projects devoted to increasing manufacturing efficiency, assessing theecological risks associated with molluscicides applied to ship hulls, and using electronic signaling to transmit“vital signs” from ambulances to hospitals.
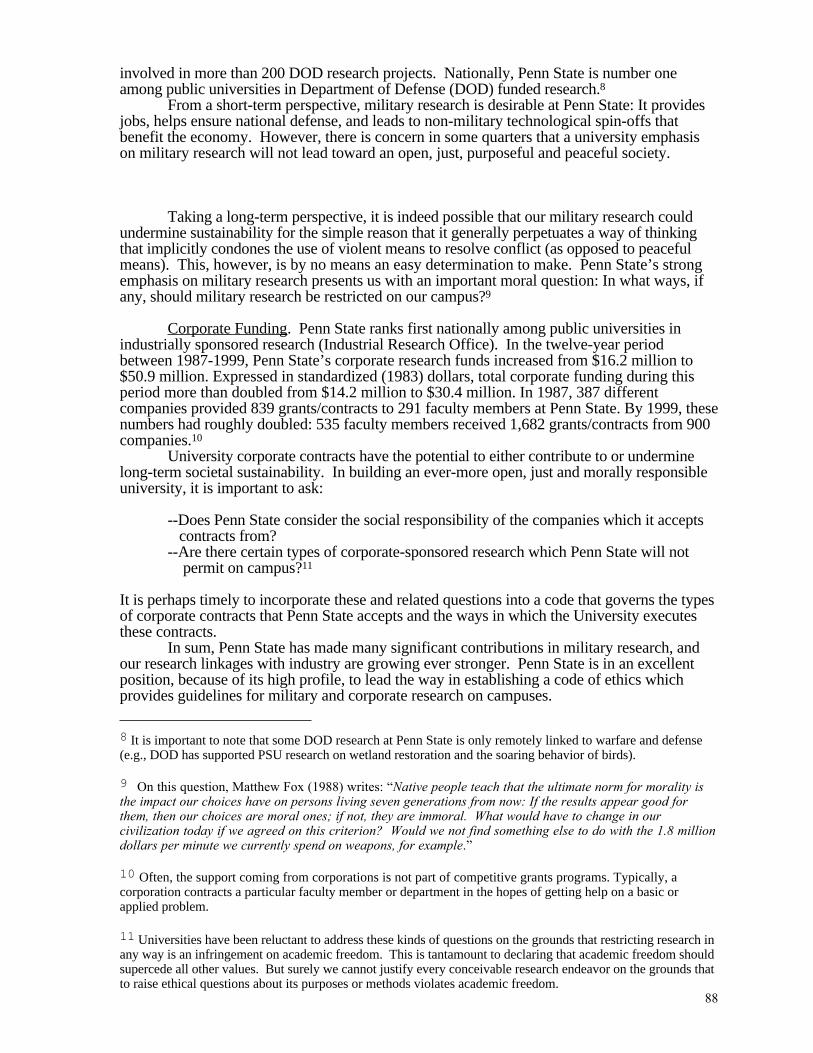
88
involved in more than 200 DOD research projects. Nationally, Penn State is number oneamong public universities in Department of Defense (DOD) funded research.8
From a short-term perspective, military research is desirable at Penn State: It providesjobs, helps ensure national defense, and leads to non-military technological spin-offs thatbenefit the economy. However, there is concern in some quarters that a university emphasison military research will not lead toward an open, just, purposeful and peaceful society.
Taking a long-term perspective, it is indeed possible that our military research couldundermine sustainability for the simple reason that it generally perpetuates a way of thinkingthat implicitly condones the use of violent means to resolve conflict (as opposed to peacefulmeans). This, however, is by no means an easy determination to make. Penn State’s strongemphasis on military research presents us with an important moral question: In what ways, ifany, should military research be restricted on our campus?9
Corporate Funding . Penn State ranks first nationally among public universities inindustrially sponsored research (Industrial Research Office). In the twelve-year periodbetween 1987-1999, Penn State’s corporate research funds increased from $16.2 million to$50.9 million. Expressed in standardized (1983) dollars, total corporate funding during thisperiod more than doubled from $14.2 million to $30.4 million. In 1987, 387 differentcompanies provided 839 grants/contracts to 291 faculty members at Penn State. By 1999, thesenumbers had roughly doubled: 535 faculty members received 1,682 grants/contracts from 900companies.10
University corporate contracts have the potential to either contribute to or underminelong-term societal sustainability. In building an ever-more open, just and morally responsibleuniversity, it is important to ask:
--Does Penn State consider the social responsibility of the companies which it accepts contracts from?--Are there certain types of corporate-sponsored research which Penn State will not permit on campus?11
It is perhaps timely to incorporate these and related questions into a code that governs the typesof corporate contracts that Penn State accepts and the ways in which the University executesthese contracts.
In sum, Penn State has made many significant contributions in military research, andour research linkages with industry are growing ever stronger. Penn State is in an excellentposition, because of its high profile, to lead the way in establishing a code of ethics whichprovides guidelines for military and corporate research on campuses.
8 It is important to note that some DOD research at Penn State is only remotely linked to warfare and defense(e.g., DOD has supported PSU research on wetland restoration and the soaring behavior of birds).
9 On this question, Matthew Fox (1988) writes: “Native people teach that the ultimate norm for morality isthe impact our choices have on persons living seven generations from now: If the results appear good forthem, then our choices are moral ones; if not, they are immoral. What would have to change in ourcivilization today if we agreed on this criterion? Would we not find something else to do with the 1.8 milliondollars per minute we currently spend on weapons, for example.”
10 Often, the support coming from corporations is not part of competitive grants programs. Typically, acorporation contracts a particular faculty member or department in the hopes of getting help on a basic orapplied problem.
11 Universities have been reluctant to address these kinds of questions on the grounds that restricting research inany way is an infringement on academic freedom. This is tantamount to declaring that academic freedom shouldsupercede all other values. But surely we cannot justify every conceivable research endeavor on the grounds thatto raise ethical questions about its purposes or methods violates academic freedom.
89
Summary of Research Indicators
Ethical Treatment ofResearch Subjects
PSU follows all national, state, and localguidelines regarding the ethical treatment ofresearch subjects; however sustainabilitycalls for even higher ethical standards.
Disposal ofLaboratory Wastes
The University’s Office of EnvironmentalHealth and Safety has taken significant stepsto reduce laboratory-related waste, but theUniversity continues to produceapproximately 250,000 pounds ofhazardous, infectious, and radioactive wasteeach year; still needed is a comprehensiveplan for dramatically reducing research-related waste.
Research onSustainability
The College of Agriculture has researchinitiatives that focus on sustainability butstill lacks a comprehensive commitment tosustainable agriculture.
Research Priorities
Few significant measures taken at PSU topromote research explicitly designed topromote sustainable practices. At the sametime there has been a disinclination to definecategories of research that, for ethicalreasons, the University might choose not toengage in.
Penn State has a strong commitment to research, but to date we have not fully considered theways in which our research directly contributes to or undermines sustainability.
Moving Toward Sustainability
Other Institutions on the PathSome forward-looking universities, including Penn State, are now developing training
and research programs that focus on sustainable practices. For example, the Georgia Instituteof Technology has made sustainable technology a core mission that permeates all universityendeavors from teaching through research to operations (Cortese, 1999). Also, the Center forEnergy and Environmental Studies at Boston University offers graduate training and researchopportunities in ecological economics, energy analysis and environmental modeling; theUniversity of Maryland provides graduate training and research in sustainability practicesthrough its program in Sustainable Development and Conservation Biology; and the Universityof Virginia School of Architecture has a strong emphasis on ecological principles and “green”design (Student Conservation Association, 1997).
Other universities, in addition to Penn State, are working on reducing the volume ofhazardous waste. For example, the University of Washington Environmental Health andSafety Office has adopted a policy to “minimize the amount of chemical waste that is going intothe environment whether it enters through incineration, landfill, or discharge into the water
90
system.” Through a chemical distillation redistribution program, UW—like PSU—is able toreduce both disposal costs and the need to purchase new chemicals (Keniry, 1995).Short-Term Goals for PSU
Establish an Ethical Code for Research Activities. Penn State needs an ethical codewhich clearly delineates the types of research which it might, in good conscience, choose not toconduct. The recently established student Pugwash Chapter at Penn State could help developsuch a code.12
Be an Advocate for Research that Focuses on Sustainable Practices. Researchadvances are determined, in large part, by funding priorities: Provide money for "Starwars"and the work gets done; prioritize research on AIDS and the pages of Science magazine arefilled with AIDS research. By the same token, provide funding for innovative technical andsocial solutions to over population, over consumption, environmental deterioration, andinjustice and great things might be accomplished, as well! PSU’s leaders should make thispoint to those with money in the federal government and the private sector. They will need toeducate, coax and cajole until support for research that promotes sustainability in concrete ways(e.g., sustainable food production systems, ecological building design, efficient energysystems, sustainable forestry and on and on) is forthcoming.
Appoint an Ombudsman for the Environment. Environmental issues generally don’t fitwithin traditional jurisdictions and management units. Hamburg and Ask (1992) resolved thisproblem at the University of Kansas by convincing their university to appoint an Ombudsmanfor the Environment. An “ombudsman” is someone who intercedes on behalf of someone else;an Environmental Ombudsman intervenes on behalf of the environment. The job of theOmbudsman at Kansas is to work with faculty, staff and students to identify and initiateresearch projects that seek to reduce environmental impacts. Projects are wide ranging (e.g.,solvent recycling, improvement of energy efficiency in lighting). The cost of running theOmbudsman Office at Kansas is more than covered by the savings attributable to the projectsthat have been undertaken (Hamburg and Ask, 1992). Penn State needs an EnvironmentalOmbudsman (together with a small technical staff) to begin the process of institutionalizingsustainability at University Park and the branch campuses.
Long-Term Goal: Prioritize Research for a Sustainable World
"The unprecedented powers that science now makes available must beaccompanied by unprecedented levels of ethical focus and concern by thescientific community as well as the most broadly based public educationinto the importance of science and democracy.” CarlSagan
If our civilization is to reverse the negative trends we see all about us, its leadingcenters of research will need to play a critical role. Penn State must begin to considersustainability as a legitimate theme for research across the disciplines (See Box).
Expanded Research Agenda for Penn State Based on Five SustainabilityPrecepts
12 Pugwash began in 1957 (in response to nuclear proliferation) at the urgings of such famous scientists asLinus Pauling and Albert Einstein. Pugwash maintains that citizens have an obligation to ensure that science isused responsibly; the organization works to examine the ethical, social, and global implications of science andtechnology.
91
Penn State could augment its powerful existing research enterprise with a new researchemphasis centered around the five sustainability precepts outlined in the introduction of thisdocument.
1. Promote a respect for the biota and natural processes: We must challenge our naturalscientists, philosophers, writers, and educators to seek a fuller understanding of global biodiversityand earth processes and, in so doing, to lead us to revitalize and restore the health of the planet.
2. Live within limits: We must employ our engineering, scientific, and social scienceexpertise to achieve a transition to a "factor-ten economy"--a 10-fold decrease in material use aswe dramatically increase energy efficiency and completely eliminate waste. 3. Show mindfulness of place: We must call on our historians, geographers, agronomists,architects, natural scientists, and artists to help us celebrate the uniqueness and richness of theplaces wherein we dwell and to build thriving local economies.
4. Create full-cost analyses of policy options: It is time for our business planners,economists, political scientists, and ecologists to take a leadership role in examining commerce inholistic ways so that product pricing is in accord with the true ecological and social cost ofproduction.
5. Promote civic responsibility: We must call on all those in our academic community tojoin together to pioneer in the development of more democratic forms of planning, decisionmaking, and conflict resolution.
It is also time for Penn State to consider “sustainability” as a critical theme for graduatetraining. The University must marshal the creativity and brain power to train graduate studentsto address key social, economic, technical, and environmental challenges, such as promotingenergy-use efficiency and conservation, designing and implementing sustainable farmingsystems, developing policies to ensure the inclusion of "externalities" in product pricing,creating "green" buildings, and many more. As we do this, we will surely discover that it ispossible to move purposefully toward the creation of a more healthy, just and sustainablesociety.
Finally, it behooves us to use our research prowess to institutionalize sustainablepractices right on campus. This report offers thirty short-term steps (three in each chapter)which Penn State might take to move forthrightly toward sustainable practices.
References
Cortese, A. 1999. The university as a model of sustainability. www.2nature.org
Fox, M. 1988. The Coming of the Cosmic Christ. Harper, San Francisco, CA.
Frances, C., C. Edwards, J. Gerber, R. Harwood, D. Keeney, W. Liebhardt and M. Liebman. 1995.Impact
of sustainable agriculture programs on U.S. landgrant universities. Journal of SustainableAgriculture 5: 19-33.
Hale, B. 1997. Research Up. Intercom. November 20.
Hamburg, S. and S. Ask. 1992. The Environmental Ombudsman at the University of Kansas in D. J. Eaganand D. W. Orr (eds.), The Campus and Environmental Responsibility. Jossey-Bass Publishers, SanFrancisco, CA.
Hill, S. B. and R. J. MacRae. 1995. Conceptual framework for the transition from conventional to sustainableAgriculture. Journal of Sustainable Agriculture 7: 81-87.
Keniry, J. 1995. Ecodemia. National Wildlife Federation, Washington, D.C.
Lacy, W. B. 1993. Can agricultural colleges meet the needs of sustainable agriculture? American Journal ofAlternative Agriculture 8: 40-45.
92
Penn State Department of University Health and Safety. 1996/97. Annual Report.
Rifkin, J. 1999. The Biotech Century. Penguin Putnam, Inc., New York, NY.
Russell, D. 2000. Health problems at the health-care industry. Amicus Journal. Pages 34-39. Winter.
Student Conservation Association. 1997. The Guide to Graduate Environmental Programs. Island Press,Washington, D.C.
U.S. Department of Agriculture and the U.S. Department of Health and Human Services. 1990. Nutrition andyour health: Dietary guidelines for Americans. Home and Garden Bulletin 232. Washington D.C.,GPO, 27 pp.

93
Decision Making "May no act of ours bring shame…May our lives but swell thy fame.”
Fred Lewis Pattee
IntroductionUniversity administrators throughout the U.S. generally rely on economic criteria in
decision making. Increasingly wedded to “bottom line” thinking, university officials often usethe language of business (e.g., deliverables, competitiveness, cost effectiveness,accountability, customer focus) to describe their goals.
At Penn State rarely a month passes without a major news story about a newinitiative—a new building, a new land acquisition, a new corporate alliance, a new college, anew merger. Indeed, the University is making big decisions. But is it making wise decisions?
A decision-making structure that promotes sustainability has the following characteristics:• Decisions based on deep-seated values. Sustainable institutions recognize that
economic considerations alone are not adequate bases for wise decision making; deep-seated values and ethics are central to sound decisions.
• Decision-making process is open. In a sustainable institution, information affectingcommunity members is shared unconditionally. On major issues, every effort is made toreach consensus; questioning and debate are encouraged.
Long-term societal sustainability is nurtured when narrow economistic thinking andopacity do not cripple organizational decisions. With this in mind, we examined two aspects ofdecision making at Penn State:
1. Core Values Guiding Decisions2. Openness
In neither case are we able to offer a definitive assessment. What follows is simply a firstattempt at thinking about some characteristics of decision making at Penn State that affectsustainability.
Indicator 1. Core Values Guiding DecisionsThe structure and function of American universities has become decidedly more
business-oriented over the course of the past several decades. Along with an increasingemphasis on “bottom line” thinking, there has also been an increase in the number and types ofbusiness arrangements with outside businesses. Indeed, a kind of “mutualism” has developedin many instances where both universities and business seem to benefit.1
Business acumen and attention to fiduciary responsibility, of course, are essential to thesuccessful operation of any university. But to the extent that a university's decision making isgoverned predominately by monetary considerations, the institution falls into an entirelymodern and, ultimately, non-sustainable way of functioning known as "economism" (SeeBox).
The Ascendancy of Economism in AmericaJust as racism and sexism are forms of discrimination based on race and gender,
“economism” is a form of discrimination stemming from the idea that the ECONOMY isseparate from, and superior to, the rest of life.
1 At Penn State the composition of the Board of Trustees reflects this marriage of business and academicinterests: 14 Board of Trustee members (i.e., more than 40%) are CEOs/Corporate Professionals; 6 members areGovernment Appointees; 5 members are agriculturists; 7 members represent theLaw/Education/Medicine/Communication professions; and 1 member is a Penn State student.

94
As Barbara Brandt (1995) points out: "Economism equates the goals and well-being ofbusinesses with the well-being of society as a whole. Thus, in our modern economistic system:
--the purpose of the natural environment is to provide resources that can be turned into more products to be sold by businesses.--the purpose of government is to promote policies that will help business.--the purpose of home and family is to consume the products of business.--the purpose of creative arts is to help sell business products.--the purpose of our schools is to teach students the skills they will need at work so that our businesses can remain competitive in the new global economy.”Modern economistic thinking is largely devoid of moral precepts. “Whatever generates
the greatest profit” has become the criterion for a false morality. The criterion is no longer “Isthis right or wrong?” but “Will this make money?” “Will it bring the highest return on myinvestment?” Under economism the needs and values of business have come to overwhelm therest of society.
FindingsPenn State is not immune, nor could it be, to a growing nation-wide emphasis on
economism. However, PSU’s strong service mission can act as a counter-balance to narrow,economistic decision making.
This balance, though, is difficult to maintain. Perhaps nowhere is this more evidentthan in the realm of university investments. Prompted by student activism, Penn State haswrestled with difficult ethical considerations regarding investments on a few occasions (e.g.,SouthAfrica). However, in general, PSU has preferred to allow economic concerns alone to dictateits investment decisions. In July, 1996, PSU’s Board of Trustees updated the EndowmentSpending and Investment Policy with a resolution which reads:
(5) In performing its duties delegated under this resolution, the InvestmentCommittee shall be guided solely by fiduciary principles. The committee shallconsider only financial criteria in formulating investment policies…
Penn State administrators acknowledge that economic considerations have not alwaysbeen such an important force at Penn State, but instead, have developed slowly over severaldecades and today are often taken for granted. Faculty and staff, for their part, have learned toframe discussions and proposals in economic terms—asserting that the proposed change willeither make or save money for the University.
But universities are not simply businesses; all evidence to the contrary. They have ahuge advantage over businesses. They can, if they choose, act on a vision that is notexcessively hobbled by bottom-line thinking and in so doing leverage society toward asustainable future. After all, the true bottom line at a university is represented by theaccumulated knowledge, moral fortitude and social responsibility of its graduates.
95
Indicator 2. OpennessPenn State is a huge enterprise and, by global standards, a wealthy university (1.38
billion dollar budget in 1998-1999). Publicly accountable and open decision making processesengender a sense of interconnectedness, trust, and cooperation.
FindingsThe research conducted by the numerous participants in this project involved gathering
information from many university sectors (e.g., Office of the Physical Plant, Housing andFood Services, Police Services). In almost all instances, the investigators were very wellreceived; they had no difficulty in acquiring the information that they sought.
The Indicators team did, however, encounter cases where information existed but wasoff-limits. For example, Old Main officials were unwilling to provide details on Penn State’scontracts with corporations such as AT&T, Nike, Pepsi and Cellular One. Information onUniversity investments was also off limits when the first edition of the Indiactors Report wasreleased but that changed in March, 2000 (See Box).
Penn State takes a Leading Role in Investment OpennessIn February, 2000, sixty student government members called on Penn State to reveal the
names of the companies in which the University invests (Wengerd, 2000a). After deliberating onthis matter, the University decided to release the list of the money managers who handle its $730million endowment; the University also agreed to provide an annual snapshot of its specificinvestments (Wengerd, 2000b).
A logical next step, in the interest of sustainability, is to “screen” University investments.Many investment companies (e.g., Calvert) now offer the option of screened investments. Thereis even a precedent for this at Penn State: Faculty and staff are given the choice of investing theirretirement funds in socially-screened stocks. Aside from the satisfaction that comes from actingon moral principles, there is strong evidence that, over the long term, social investors can expectto do as well as other investors. For example, the Domini Social Index-400, a socially-screenedstock index of 400 companies, has generally performed similar to or even better than theStandard and Poor’s Index (the standard by which most stocks are judged) (Melton, 1995).2 PSUmoney managers should be instructed to place screens on investments to ensure that PSU doesnot contribute to injustice or environmental harm.
PSU has taken other steps in recent years to become more open and responsive. Forexample, Penn State President Graham Spanier has initiated a monthly call-in radio show (“Tothe Best of My Knowledge”) in which community members are given a forum to discussissues of local and national concern. In addition, the minutes of the Board of Trusteesmeetings are open to public scrutiny (available upon request in the Penn State Room at PatteeLibrary) and the Penn State Budget is on the Worldwide Web. Finally, the University’sContinuous Quality Improvement Program has empowered staff to take greater control of theirwork environment and resulted in improvements in both efficiency and morale (P. Ruskin,Communications Coordinator, OPP, pers. comm.)
Although each of these examples is a step in the right direction, there have been nocomprehensive measures to promote openness in decision making. Of great concern is the factthat Penn State administrators and Trustees are now making far-reaching decisions about thefuture structure and operations of the University without the substantive participation of theacademic community itself.Summary of Decision-Making Indicators
Core ValuesGuiding Decisions
Penn State struggling to maintain a balance indecision making between economic concernsvs. ecological and social responsibility.
2 At the conclusion of the second quarter of 1999, two highly respected financial analysis teams—Morningstarand Lipper—gave top ratings to three out of the four large (funds with assets greater than $100 million) sociallyscreened funds (www.coopamerica.org).
96
OpennessPSU has made significant efforts to makesome categories of information more available,but still falls short of a truly open decision-making process.
Moving Toward Sustainability
Other Institutions on the PathSustainability is becoming a criterion in decision making at some colleges and
universities. These schools are finding that the use of sustainability “filters” in decisionmaking can actually save them money. A recent report, “Green Investment, Green Return,”demonstrated that 23 sustainability initiatives at 15 U.S. colleges and universities are saving$17 million each year (National Wildlife Federation, 1998).
Some colleges and universities are also beginning to introduce ethical (rather thanpurely monetary) concerns into contracting and investment decisions. For example, DukeUniversity has recently passed a “code of conduct” for all companies that manufacture productsemblazoned with the Duke name and/or logo. The code requires companies, such as Nike(which currently manufactures both PSU’s and Duke’s athletic apparel), to disclose thelocation of all factories and permits Duke to examine working conditions and labor practices atthese factories. If contractors are found to be in persistent violation of the code, Duke willterminate the contract.
This issue is also a concern at Penn State. PSU has recently joined more than 100other universities in signing the Fair Labor Association (FLA) Agreement. This agreementrequires Nike and other university licensees to disclose factory locations(www.nikebiz.com/labor/index/html) and bans child and forced labor within factories(Pomponio, 1999).3 Penn State President Graham Spanier is also developing a relationshipwith the Global Alliance for Workers and Communities that represents a partnership betweenprivate, public, and nonprofit institutions committed to improving the work and lifeopportunities for factory workers (www.theglobalalliance.org/) (Spanier, 2000).
On the investment front, some universities now pass investment decisions through a“screen” to eliminate companies that treat employees unjustly, produce dangerous products, orpollute the environment. For example, Harvard, Johns Hopkins, Tufts, and Northwestern donot invest in companies that manufacture tobacco products. Tufts includes manufacturers ofalcoholic beverages in its “screen.” Such a screen might be a forthright way for Penn State toglobally manifest its concern with campus drinking.4
3 Recent protests at the Universities of Michigan, Wisconsin, and Pennsylvania, however, have raisedquestions about the credibility of the FLA’s efforts (Associated Press, 2000). Students at the University ofWisconsin have urged their president to withdraw from the FLA and instead join the Worker Rights Consortium(www.nlcnet.org/elsalvador/wrcandes.html), an organization with a commitment to opening up factoryconditions to public scrutiny and responding to workers complaints. As this report goes to press, Penn Statestudents are calling on President Spanier to take a similar action.
4 Universities also have the leverage to promote corporate responsibility by voting on shareholder resolutions.Many schools have committees composed of students, faculty and administrators that review and vote onshareholder resolutions (PSU has no such committee; it delegates this responsibility to investment managers).Some universities have gone even further by filing resolutions to be voted on by stockholders. For example, afew years back, the University of Washington filed a resolution calling on Unocal, an oil company withoperations in Burma, to include “clear human rights criteria” in its code of conduct (Mercer, 1996).
97
Short-Term Goals for PSU
Make Alterations to Mission Statement. Penn State could demonstrate a fundamentalcommitment to sustainability by making several small, but significant, changes to its missionstatement (See Box).
Proposed Amendments to Penn State’s Mission StatementHere we quote Penn State's mission statement. Proposed new text is presented in
CAPITAL LETTERS.Education. Penn State strives to create new dimensions in the lives of its students by
introducing them to the collective knowledge, wisdom, and experience of human society ANDTHE NATURAL WORLD by encouraging them to acquire the skills and intellectual discipline tocomprehend the complexities of our times...
Research. Penn State strives to broaden human horizons by promoting scholarship,creativity and the advancement of knowledge, thus enhancing our understanding of ourselvesAND OUR PLACE in the many worlds around us.
Service. Penn State strives to contribute to ECOLOGICAL, economic and societal vitalityby offering informed views on critical and recurring issues, by providing opportunities forcultural and intellectual enrichment, and by contributing new ideas and new techniques...
Finally, Penn State’s ultimate purpose is to:...enhance the well-being of THE COMMUNITY OF LIFE LOCALLY, NATIONALLY
AND GLOBALLY.
Hold University-Wide Referenda for Major Decisions. Although they might beconsulted from time to time, faculty, staff, and students do no have a final say in thesubstantative issues that are shaping Penn State’s future (e.g., decisions about expansions,mergers, and policy). The University should develop mechanisms, such as university-widereferenda, which permit the voices of all members of the PSU community to be heard.
Develop New Ways of Rewarding Administrative Excellence. In the past, most ofthe significant year-to-year decisions at Penn State were in the academic realm and faculty hadthe authority to make many of those decisions (as they still do today). At present, however,the big decisions shaping the character and culture of Penn State are centered increasingly in thebusiness realm. Thus, our administrators are judged, to a significant degree, by their capacityto create new things (i.e., to promote growth in its various guises). We should considerrevising the incentive system for administrators to one which rewards efforts to make thingsphilosophically better or to achieve better balance or to enhance quality while reducing materialthroughput.5
Long-Term Goal: Ground Decisions in Sustainability Principles
"The university is an investment in a culture, in continuity and intelligence.It is not primarily a financial investment, and the rewards are notnecessarily financial either. There is more than one way for a communityto become rich." Robert Solomon
If sustainability is to permeate university culture, Penn State will need to develop aprotocol to ensure that important decisions are passed through a “sustainability filter.” Thatfilter might include such questions as: Does this decision lead to a deepening of our respect forlife? Does it account for full social and environmental costs? Does the decision recognize andrespect natural limits to growth? Does it respect local economies and local cultures? Have allvoices been considered in arriving at the decision? The use of such filters would help PennState and other universities address the ethics of, heretofore, often ignored issues such as the
5 This recommendation emerged from conversations with PSU administrators.
98
appropriateness of military research on campus or the investment of university monies incorporations with a history of environmental and/or human exploitation.
This last challenge—a challenge to base university decisions in profound ethicaltruths—is the most daunting of all. It calls us to take great risks. Not many universities havethe courage to contemplate such a challenge.
References
Associated Press. 2000. Michigan students occupy dean’s office. Centre Daily Times, February 18.
Brandt, B. 1995. Whole Life Economics. New Society Publishers, Philadelphia, PA.
Melton, J. 1995. Can you really do well by doing good? Co-op America Quarterly, 36:13-15.
Mercer, J. 1996. Morality in investing. The Chronicle of Higher Education. March 29. A49-50.
National Wildlife Federation. 1998. Green Investment, Green Return: How Practical Conservation ProjectsSave Millions on America's Campuses. National Wildlife Federation, Washington, D.C.
Pomponio, A. 1999. PSU seeks information on Nike labor practices. Centre Daily Times, October 17.
Spanier, G.B. 2000. PSU works hard to avoid dealing with sweatshops. Centre Daily Times, February 23.
Wengerd, E. 2000a. No secrets in PSU's portfolio, Spanier says. Centre Daily Times, February 9.
Wengerd, E. 2000b. Penn State’s investment practices debated. Centre Daily Times, March 12.
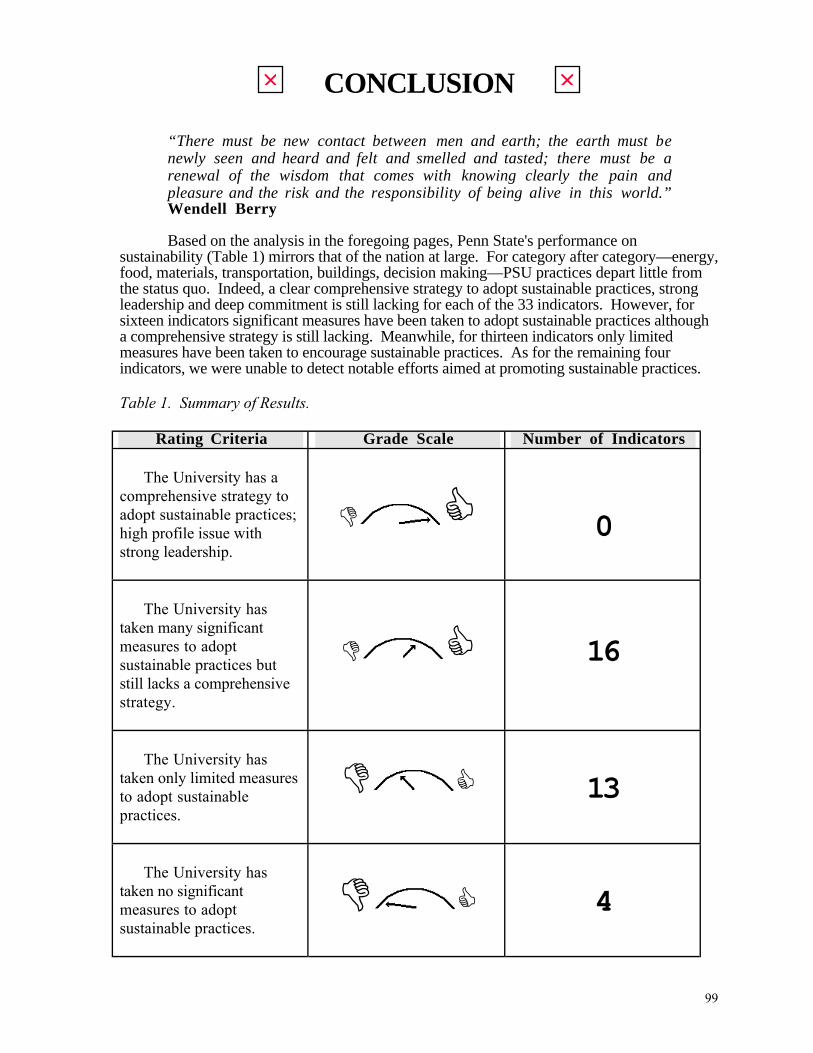
99
CONCLUSION
“There must be new contact between men and earth; the earth must benewly seen and heard and felt and smelled and tasted; there must be arenewal of the wisdom that comes with knowing clearly the pain andpleasure and the risk and the responsibility of being alive in this world.” Wendell Berry
Based on the analysis in the foregoing pages, Penn State's performance onsustainability (Table 1) mirrors that of the nation at large. For category after category—energy,food, materials, transportation, buildings, decision making—PSU practices depart little fromthe status quo. Indeed, a clear comprehensive strategy to adopt sustainable practices, strongleadership and deep commitment is still lacking for each of the 33 indicators. However, forsixteen indicators significant measures have been taken to adopt sustainable practices althougha comprehensive strategy is still lacking. Meanwhile, for thirteen indicators only limitedmeasures have been taken to encourage sustainable practices. As for the remaining fourindicators, we were unable to detect notable efforts aimed at promoting sustainable practices.
Table 1. Summary of Results.
Rating Criteria Grade Scale Number of Indicators
• The University has acomprehensive strategy toadopt sustainable practices;high profile issue withstrong leadership.
0
• The University hastaken many significantmeasures to adoptsustainable practices butstill lacks a comprehensivestrategy.
16
• The University hastaken only limited measuresto adopt sustainablepractices.
13
• The University hastaken no significantmeasures to adoptsustainable practices.
4
100
It is time to embrace a new way of living—a new way of thinking. Our university needs acomprehensive and deep-reaching mission aimed at achieving sustainability in all facets ofcampus life. Penn State has certainly begun to respond to this challenge. For each of the tencategories examined in this report, there are things the University can be proud of:
• Energy—Penn State’s Continuous Commissioning Process has been increasing energy-useefficiency in campus buildings through detailed evaluations and systems upgrades.
• Water—Penn State’s Water-Land Treatment System protects the integrity of Spring Creekby spraying treated wastewater on land rather than discharging it into Spring Creek.
• Material Resources and Waste Disposal—The tonnage of recycled solid waste at Penn Statehas increased significantly over the last ten years.
• Food—The healthfulness and diversity of food offered at PSU’s dining facilities isextraordinary.
• Land—Penn State’s commitment to create a blueprint for ecologically sound land settlementat its Circleville farm is visionary.
• Transportation—The expansion of university bus routes and the use of natural gas-fueledbuses are significant measures aimed at reducing our dependence on cars.
• Built Environment—The planned restoration of the Old Botany Greenhouse (year 2000Senior class gift), complete with a “living machine” to process the building’s wastewater isan outstanding green design project.
• Community—PSU’s newly instituted Environmental Studies minor should significantlyenhance ecological literacy.
• Research—Penn State’s newly created Environmental Consortium is well positioned tomake major research and education contributions in the realm of sustainable practices.
• Decision Making—The University has made sincere and comprehensive efforts to involvemany different constituencies in the Master Planning process.
These measures, and others like them, are noteworthy. Now, the time has come forPenn State to reach even higher by joining its various environmental efforts into acomprehensive Ecological Mission (Table 2).
Table 2. Leading the Way Toward Sustainability: PSU’s Emerging Ecological Mission.
ELEMENT GOAL SPECIFIC SHORT-TERMGOAL
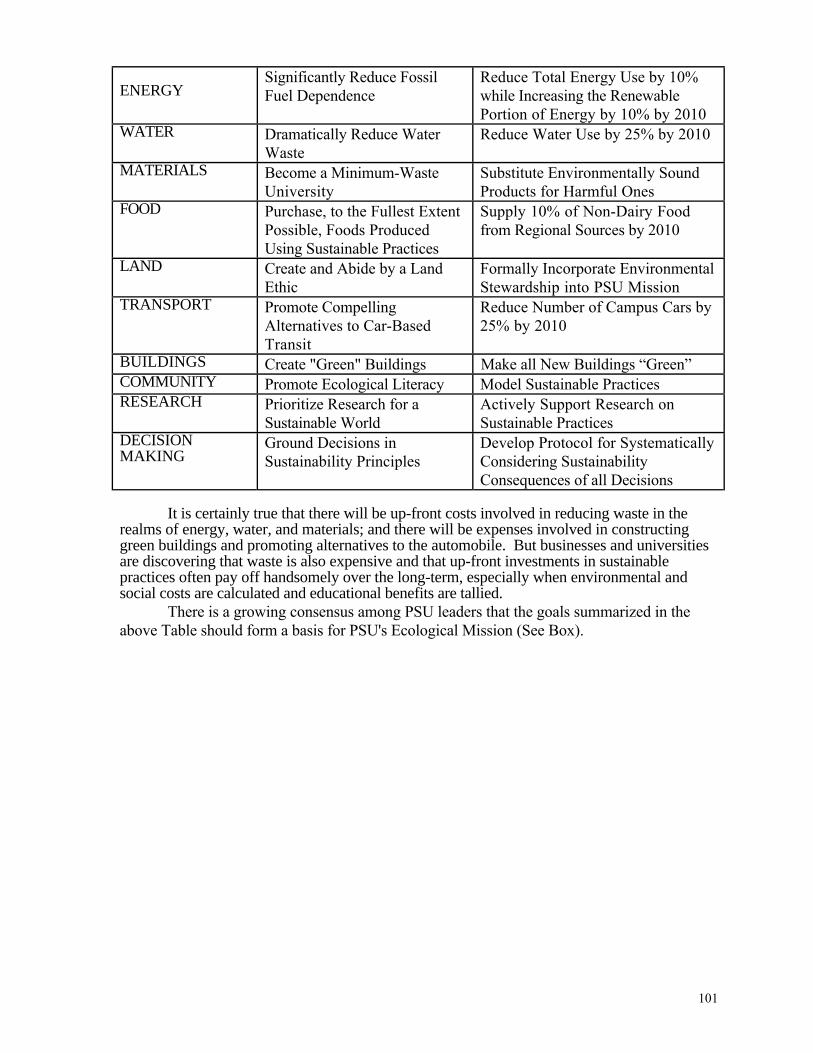
101
ENERGYSignificantly Reduce FossilFuel Dependence
Reduce Total Energy Use by 10%while Increasing the RenewablePortion of Energy by 10% by 2010
WATER Dramatically Reduce WaterWaste
Reduce Water Use by 25% by 2010
MATERIALS Become a Minimum-WasteUniversity
Substitute Environmentally SoundProducts for Harmful Ones
FOOD Purchase, to the Fullest ExtentPossible, Foods ProducedUsing Sustainable Practices
Supply 10% of Non-Dairy Foodfrom Regional Sources by 2010
LAND Create and Abide by a LandEthic
Formally Incorporate EnvironmentalStewardship into PSU Mission
TRANSPORT Promote CompellingAlternatives to Car-BasedTransit
Reduce Number of Campus Cars by25% by 2010
BUILDINGS Create "Green" Buildings Make all New Buildings “Green”COMMUNITY Promote Ecological Literacy Model Sustainable PracticesRESEARCH Prioritize Research for a
Sustainable WorldActively Support Research onSustainable Practices
DECISIONMAKING
Ground Decisions inSustainability Principles
Develop Protocol for SystematicallyConsidering SustainabilityConsequences of all Decisions
It is certainly true that there will be up-front costs involved in reducing waste in therealms of energy, water, and materials; and there will be expenses involved in constructinggreen buildings and promoting alternatives to the automobile. But businesses and universitiesare discovering that waste is also expensive and that up-front investments in sustainablepractices often pay off handsomely over the long-term, especially when environmental andsocial costs are calculated and educational benefits are tallied.
There is a growing consensus among PSU leaders that the goals summarized in theabove Table should form a basis for PSU's Ecological Mission (See Box).
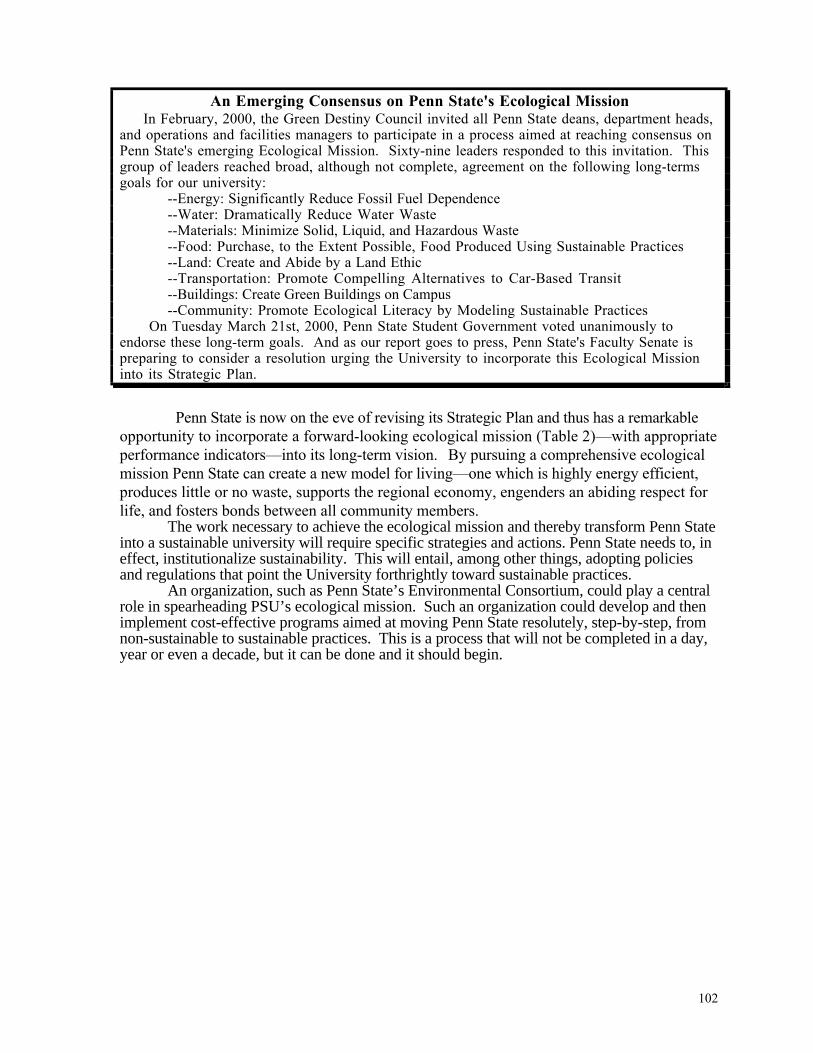
102
An Emerging Consensus on Penn State's Ecological Mission In February, 2000, the Green Destiny Council invited all Penn State deans, department heads,and operations and facilities managers to participate in a process aimed at reaching consensus onPenn State's emerging Ecological Mission. Sixty-nine leaders responded to this invitation. Thisgroup of leaders reached broad, although not complete, agreement on the following long-termsgoals for our university:
--Energy: Significantly Reduce Fossil Fuel Dependence--Water: Dramatically Reduce Water Waste--Materials: Minimize Solid, Liquid, and Hazardous Waste--Food: Purchase, to the Extent Possible, Food Produced Using Sustainable Practices--Land: Create and Abide by a Land Ethic--Transportation: Promote Compelling Alternatives to Car-Based Transit--Buildings: Create Green Buildings on Campus--Community: Promote Ecological Literacy by Modeling Sustainable Practices
On Tuesday March 21st, 2000, Penn State Student Government voted unanimously toendorse these long-term goals. And as our report goes to press, Penn State's Faculty Senate ispreparing to consider a resolution urging the University to incorporate this Ecological Missioninto its Strategic Plan.
Penn State is now on the eve of revising its Strategic Plan and thus has a remarkableopportunity to incorporate a forward-looking ecological mission (Table 2)—with appropriateperformance indicators—into its long-term vision. By pursuing a comprehensive ecologicalmission Penn State can create a new model for living—one which is highly energy efficient,produces little or no waste, supports the regional economy, engenders an abiding respect forlife, and fosters bonds between all community members.
The work necessary to achieve the ecological mission and thereby transform Penn Stateinto a sustainable university will require specific strategies and actions. Penn State needs to, ineffect, institutionalize sustainability. This will entail, among other things, adopting policiesand regulations that point the University forthrightly toward sustainable practices.
An organization, such as Penn State’s Environmental Consortium, could play a centralrole in spearheading PSU’s ecological mission. Such an organization could develop and thenimplement cost-effective programs aimed at moving Penn State resolutely, step-by-step, fromnon-sustainable to sustainable practices. This is a process that will not be completed in a day,year or even a decade, but it can be done and it should begin.