Embed Size (px)
Citation preview

PEGAS NONWOVENS SA Second Quarter 2017 Financial Results
Analyst Conference Call
24 Aug 2017
2
Cautionary Statement
This document has been prepared by PEGAS NONWOVENS SA (the “Company”) solely for use at the Presentation. Any forward looking statements concerning future economic and financial performance of the Company contained in this Presentation are based on assumptions and expectations of future development of factors having a material influence on the future economic and financial performance of the Company. These factors include, but are not limited to, the legal environment, the future macroeconomic situation, the market competition, the future demand for nonwoven textiles and other related products and services and development of raw material prices. The actual development of these factors, however, may be different. Consequently, the actual future financial performance of the Company could materially differ from that expressed in any forward looking statements contained in this Presentation.
Although the Company makes every effort to provide accurate information, we cannot accept liability for any misprints or other errors. In preparation of this document we used certain publicly available data. While the sources we used are generally regarded as reliable we did not verify their content. PEGAS does not accept any responsibility for using any such information.
This document is provided for information and as a matter of record only. It does not constitute an offer to sell or a solicitation of an offer to buy or sell securities or other financial instruments in any jurisdictions or any advice or recommendation with respect to such securities or other financial instruments of the Company.
The distribution of this document in certain jurisdictions may be restricted by law. This document may not be used for, or in connection with, and does not constitute, any offer to sell, or an invitation to purchase, any securities or other financial instruments of the Company in any jurisdiction in which such offer or invitation would be unlawful. Persons in possession of this document are required to inform themselves about and to observe any such restrictions. Any failure to comply with these restrictions may constitute a violation of the securities laws of any such jurisdiction.
3
Agenda
• Q2 and 1H 2017 Key Highlights
• Q2 and 1H 2017 Financial Performance
• 2017 Guidance Confirmation

4
Marian Rašík
František Řezáč
Chief Executive Officer
Chief Financial Officer
Presentation Team

• Total revenues in Q2 2017 EUR 56.0 million, up by 8.5% yoy mainly as a result of increase in polypropylene price
• EBITDA EUR 9.5 million, down by 15.6% yoy, due to the significantly negative effect of the pass through mechanism
• 1H 2017 EBITDA in line with the 2017 EBITDA guidance (EUR 43.0-50.0 million)
• Q2 2017 EBIT EUR 5.3 million, down by 26.1% yoy due to the same reasons impacting EBITDA
• Q2 2017 Net profit amounted to EUR 0.8 million, down by 88.7% primarily as a consequence of unrealized foreign exchange losses mainly related to the depreciation of USD against EUR
5
• ICIS in Q2 2017 was up by almost 15% compared to the prices in Q2 2016 and more that 10% since the beginning of the year.
• The level of inventories of finished goods increased slightly during Q2 2017 but still at optimal levels
Market & Business Production & Technology
Financial Performance
• Q2 2017 production of 27,085 tons, up by 5.6% yoy
• No major unexpected shutdowns or production disruptions in Q2 2017
• Regular maintenance shutdowns performed on two production lines in Q2 2017
• During Q2 2017 commercial production started on new line in the Czech Republic
Q2 and 1H 2017 Key Highlights
6
Key Financial Highlights
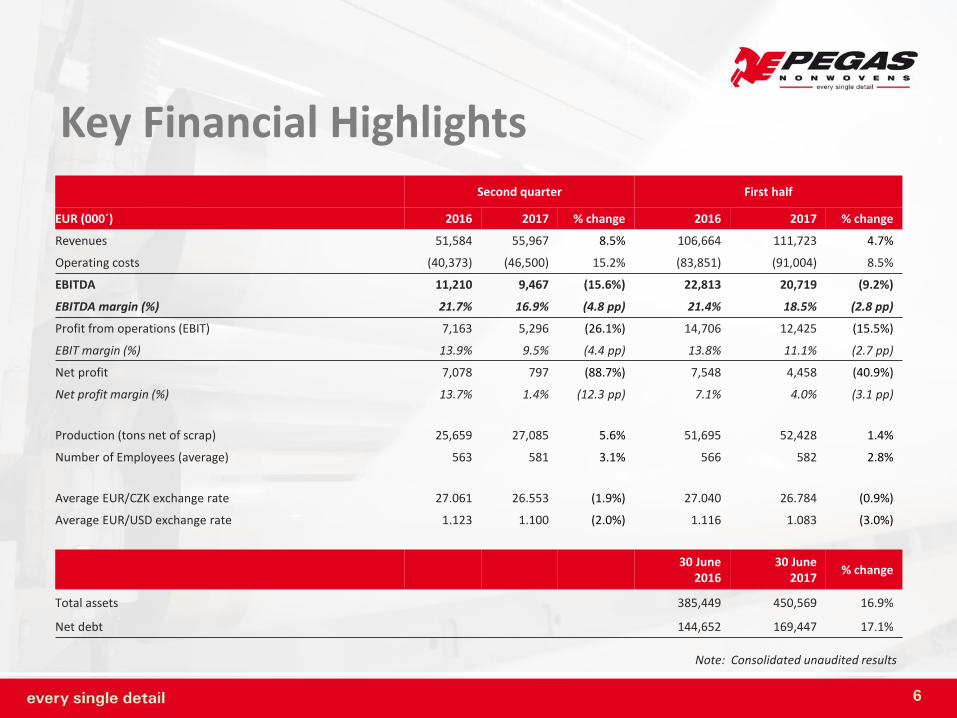
Note: Consolidated unaudited results
Second quarter First half
EUR (000´) 2016 2017 % change 2016 2017 % change
Revenues 51,584 55,967 8.5% 106,664 111,723 4.7%
Operating costs (40,373) (46,500) 15.2% (83,851) (91,004) 8.5%
EBITDA 11,210 9,467 (15.6%) 22,813 20,719 (9.2%)
EBITDA margin (%) 21.7% 16.9% (4.8 pp) 21.4% 18.5% (2.8 pp)
Profit from operations (EBIT) 7,163 5,296 (26.1%) 14,706 12,425 (15.5%)
EBIT margin (%) 13.9% 9.5% (4.4 pp) 13.8% 11.1% (2.7 pp)
Net profit 7,078 797 (88.7%) 7,548 4,458 (40.9%)
Net profit margin (%) 13.7% 1.4% (12.3 pp) 7.1% 4.0% (3.1 pp)
Production (tons net of scrap) 25,659 27,085 5.6% 51,695 52,428 1.4%
Number of Employees (average) 563 581 3.1% 566 582 2.8%
Average EUR/CZK exchange rate 27.061 26.553 (1.9%) 27.040 26.784 (0.9%)
Average EUR/USD exchange rate 1.123 1.100 (2.0%) 1.116 1.083 (3.0%)
30 June 2016
30 June 2017
% change
Total assets 385,449 450,569 16.9%
Net debt 144,652 169,447 17.1%

7
Statement of Comprehensive Income
Note: Consolidated unaudited results
Second quarter Full Year
EUR (000´) 2016 2017 % change 2016 2017 % change
Revenues 51,584 55,967 8.5% 106,664 111,723 4.7%
Raw materials and consumables (36,834) (42,414) 15.1% (76,847) (83,845) 9.1%
Staff costs (3,181) (3,596) 13.0% (6,154) (6,694) 8.8%
Of which FV revaluation of share options (368) (620) 68.5% (513) (845) 64.7%
Other net operating income/(expense) (358) (490) 36.9% (851) (465) (45.4%)
EBITDA 11,210 9,467 (15.6%) 22,813 20,719 (9.2%)
EBITDA margin (%) 21.7% 16.9% (4.8 pp) 21.4% 18.5% (2.8 pp)
Depreciation and amortization (4,047) (4,171) 3.1% (8,107) (8,295) 2.3%
Profit from operations (EBIT) 7,163 5,296 (26.1%) 14,706 12,425 (15.5%)
EBIT margin (%) 13.9% 9.5% (4.4 pp) 13.8% 11.1% (2.7 pp)
FX changes and other fin. income/(expense) (net) 1,748 (2,052) n/a (1,957) (3,137) 60.3%
Interest income/(expense) (net) (2,038) (1,912) (6.2%) (4,147) (3,707) (10.6%)
Income tax income/(expense) (net) 205 (535) n/a (1,054) (1,047) (0.6%)
Net profit 7,078 797 (88.7%) 7,548 4,458 (40.9%)
Net profit margin (%) 13.7% 1.4% (12.3 pp) 7.1% 4.0% (3.1 pp)
Other comprehensive income/(expense) (1,065) 5,024 n/a (6,145) 4,306 n/a
Total comprehensive income 6,014 5,821 (3.2%) 1,403 8,765 524.8%
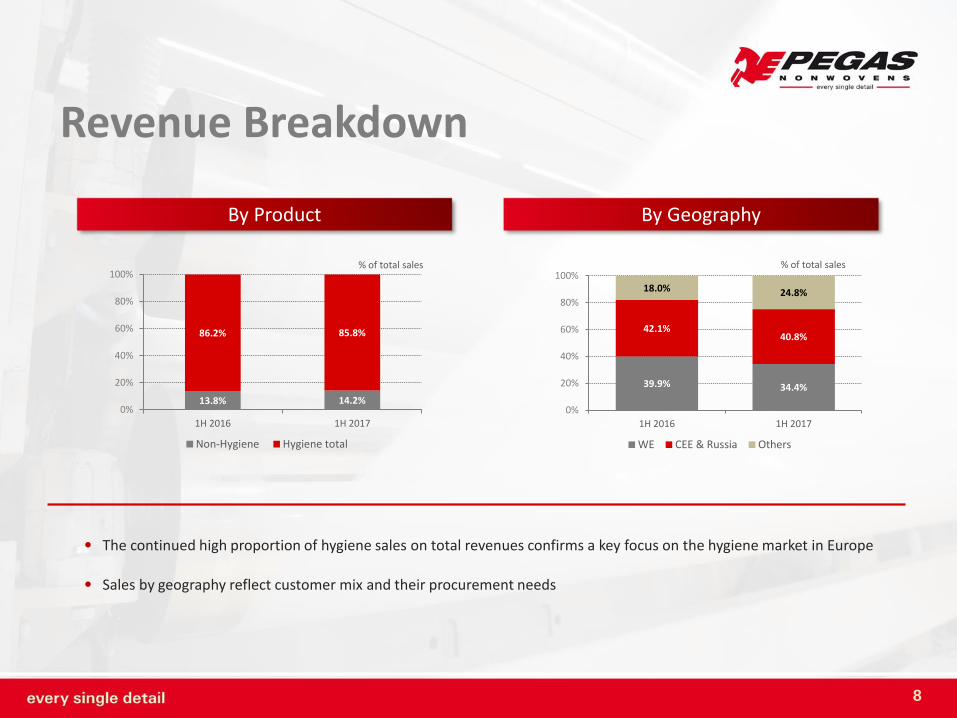
13.8% 14.2%
86.2% 85.8%
0%
20%
40%
60%
80%
100%
1H 2016 1H 2017
Non-Hygiene Hygiene total
39.9% 34.4%
42.1% 40.8%
18.0% 24.8%
0%
20%
40%
60%
80%
100%
1H 2016 1H 2017
WE CEE & Russia Others
% of total sales
• The continued high proportion of hygiene sales on total revenues confirms a key focus on the hygiene market in Europe
• Sales by geography reflect customer mix and their procurement needs
% of total sales
Revenue Breakdown
By Product By Geography
8
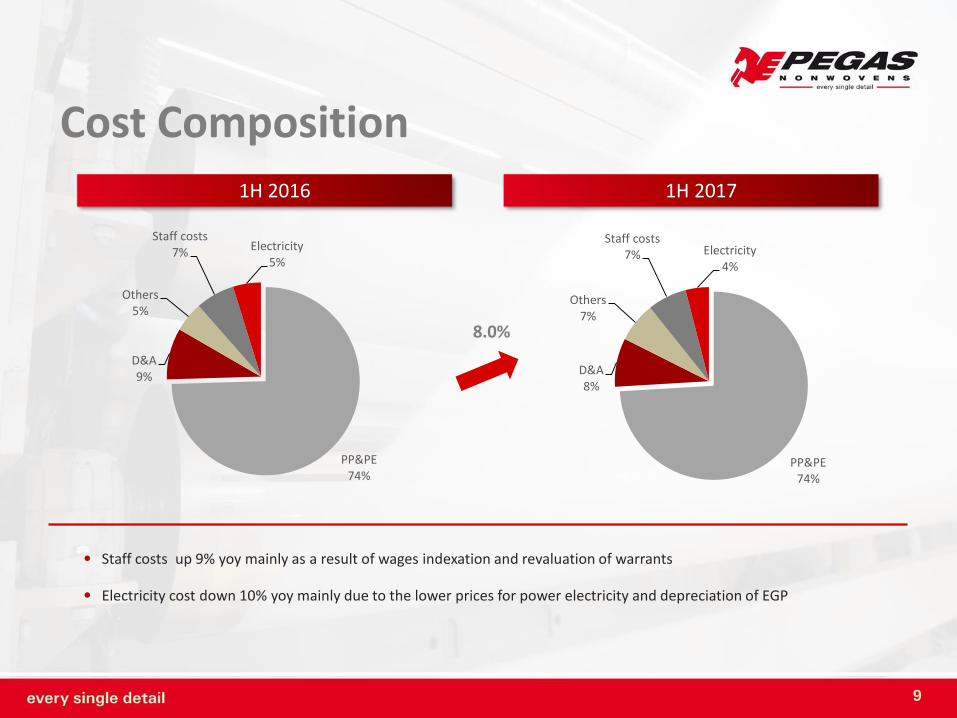
• Staff costs up 9% yoy mainly as a result of wages indexation and revaluation of warrants
• Electricity cost down 10% yoy mainly due to the lower prices for power electricity and depreciation of EGP
9
PP&PE 74%
D&A 8%
Others 7%
Staff costs 7% Electricity
4%
8.0%
1H 2016 1H 2017
Cost Composition
PP&PE 74%
D&A 9%
Others 5%
Staff costs 7% Electricity
5%
Statement of Financial Position
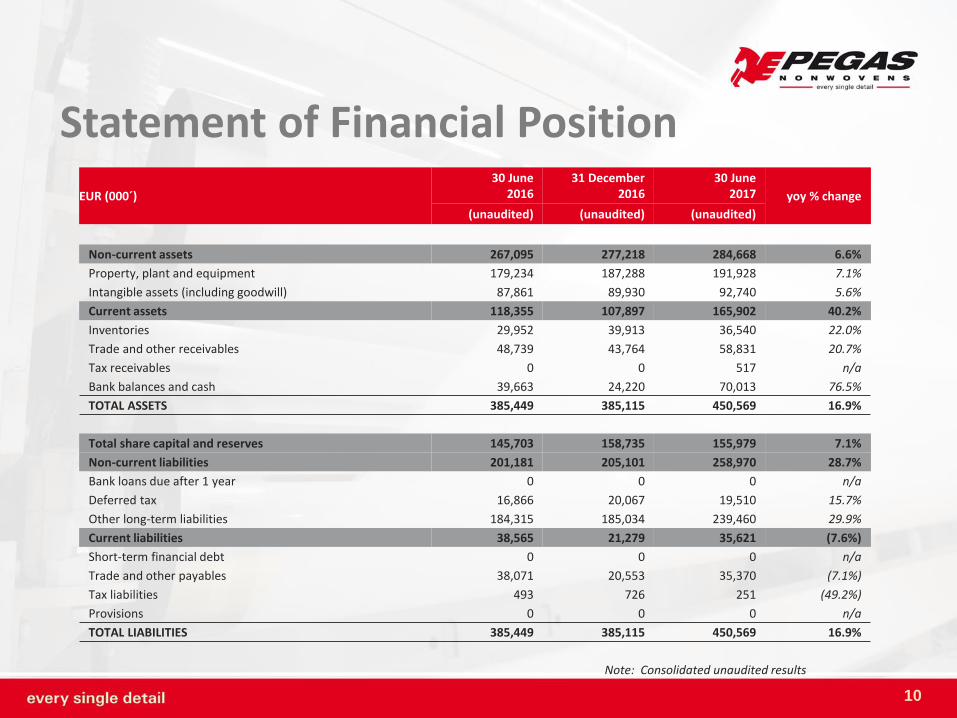
Note: Consolidated unaudited results
10
EUR (000´)
30 June 2016
31 December 2016
30 June 2017 yoy % change
(unaudited) (unaudited) (unaudited)
Non-current assets 267,095 277,218 284,668 6.6%
Property, plant and equipment 179,234 187,288 191,928 7.1%
Intangible assets (including goodwill) 87,861 89,930 92,740 5.6%
Current assets 118,355 107,897 165,902 40.2%
Inventories 29,952 39,913 36,540 22.0%
Trade and other receivables 48,739 43,764 58,831 20.7%
Tax receivables 0 0 517 n/a
Bank balances and cash 39,663 24,220 70,013 76.5%
TOTAL ASSETS 385,449 385,115 450,569 16.9%
Total share capital and reserves 145,703 158,735 155,979 7.1%
Non-current liabilities 201,181 205,101 258,970 28.7%
Bank loans due after 1 year 0 0 0 n/a
Deferred tax 16,866 20,067 19,510 15.7%
Other long-term liabilities 184,315 185,034 239,460 29.9%
Current liabilities 38,565 21,279 35,621 (7.6%)
Short-term financial debt 0 0 0 n/a
Trade and other payables 38,071 20,553 35,370 (7.1%)
Tax liabilities 493 726 251 (49.2%)
Provisions 0 0 0 n/a
TOTAL LIABILITIES 385,449 385,115 450,569 16.9%
11
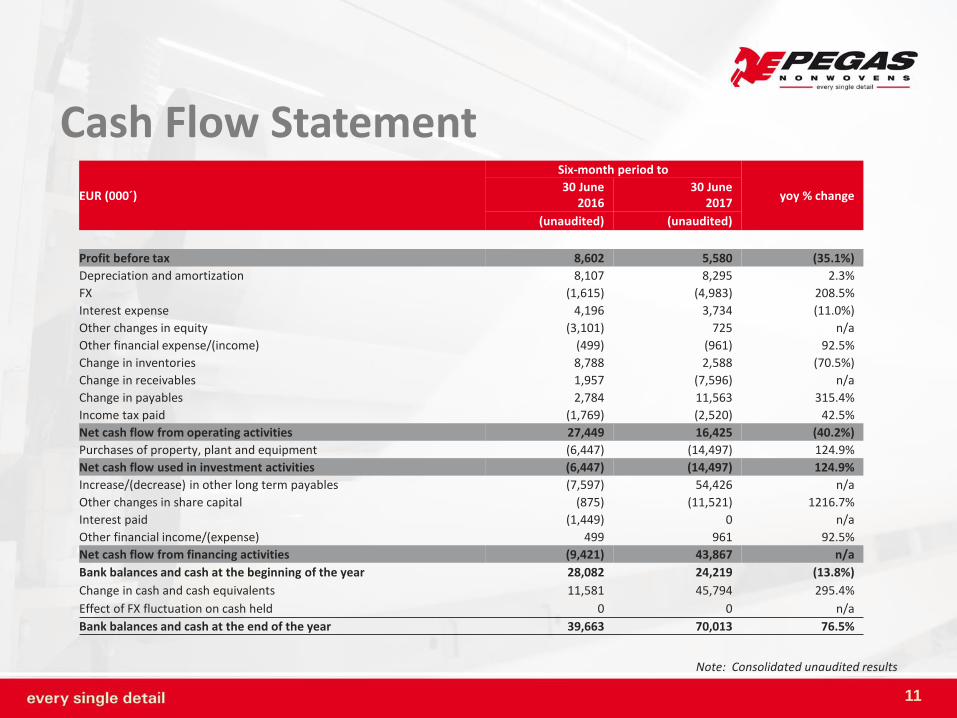
Cash Flow Statement
Note: Consolidated unaudited results
EUR (000´)
Six-month period to
yoy % change 30 June
2016 30 June
2017
(unaudited) (unaudited)
Profit before tax 8,602 5,580 (35.1%)
Depreciation and amortization 8,107 8,295 2.3%
FX (1,615) (4,983) 208.5%
Interest expense 4,196 3,734 (11.0%)
Other changes in equity (3,101) 725 n/a
Other financial expense/(income) (499) (961) 92.5%
Change in inventories 8,788 2,588 (70.5%)
Change in receivables 1,957 (7,596) n/a
Change in payables 2,784 11,563 315.4%
Income tax paid (1,769) (2,520) 42.5%
Net cash flow from operating activities 27,449 16,425 (40.2%)
Purchases of property, plant and equipment (6,447) (14,497) 124.9%
Net cash flow used in investment activities (6,447) (14,497) 124.9%
Increase/(decrease) in other long term payables (7,597) 54,426 n/a
Other changes in share capital (875) (11,521) 1216.7%
Interest paid (1,449) 0 n/a
Other financial income/(expense) 499 961 92.5%
Net cash flow from financing activities (9,421) 43,867 n/a
Bank balances and cash at the beginning of the year 28,082 24,219 (13.8%)
Change in cash and cash equivalents 11,581 45,794 295.4%
Effect of FX fluctuation on cash held 0 0 n/a
Bank balances and cash at the end of the year 39,663 70,013 76.5%
12
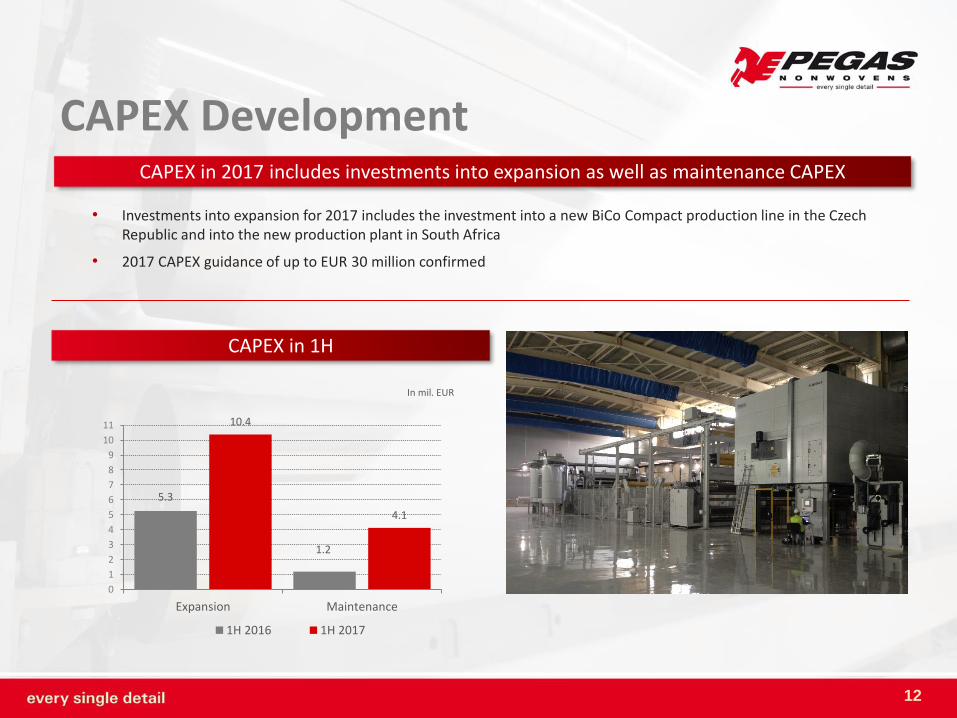
CAPEX Development
• Investments into expansion for 2017 includes the investment into a new BiCo Compact production line in the Czech Republic and into the new production plant in South Africa
• 2017 CAPEX guidance of up to EUR 30 million confirmed
CAPEX in 2017 includes investments into expansion as well as maintenance CAPEX
5.3
1.2
10.4
4.1
0
1
2
3
4
5
6
7
8
9
10
11
Expansion Maintenance
1H 2016 1H 2017
CAPEX in 1H
In mil. EUR
13
2017 Guidance Confirmation
• 1H 2017 is in line with management expectation and announced outlook for the entire year
• Based on the developments to date, the management confirms 2017 EBITDA guidance
2017 EBITDA is estimated in range of EUR 43.0 to 50.0 million
• 2017 CAPEX guidance of up to EUR 30 million confirmed
Overview
EBITDA Guidance
CAPEX Guidance

14
Dividend Declaration
• The AGM held in June approved a dividend payout of EUR 11,998,220, i.e. EUR 1.30 per share
• The source of the dividend is the 2016 profit
• The AGM approved the record date as 13 October 2017 and the payment date as 26 October 2017
• Subject to maintaining satisfactory financial performance and the absence of other attractive opportunities,
PEGAS will endeavour to continue with a progressive dividend policy in the future
• No specific payout ratio in terms of net profit or an anticipated dividend yield for future years has been set
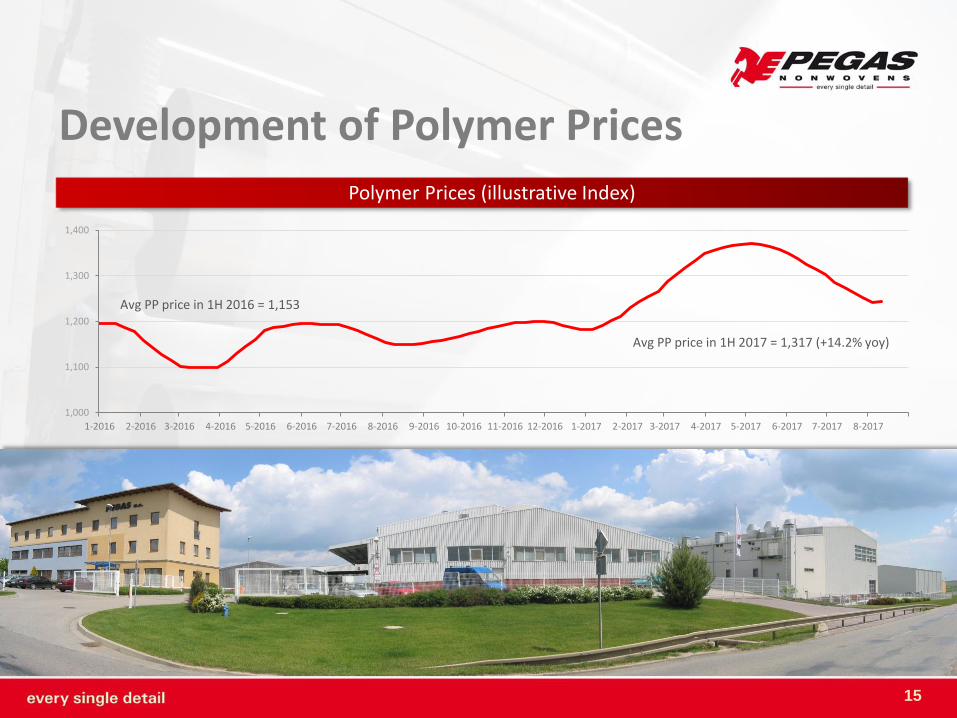
Development of Polymer Prices Polymer Prices (illustrative Index)
15
1,000
1,100
1,200
1,300
1,400
1-2016 2-2016 3-2016 4-2016 5-2016 6-2016 7-2016 8-2016 9-2016 10-2016 11-2016 12-2016 1-2017 2-2017 3-2017 4-2017 5-2017 6-2017 7-2017 8-2017
Avg PP price in 1H 2017 = 1,317 (+14.2% yoy)
Avg PP price in 1H 2016 = 1,153