Embed Size (px)
Citation preview
PEGAS NONWOVENS SA
HALF YEAR REPORT
2017
24 August 2017
2
Table of Contents Introduction ...................................................................................................................... 3
First Half 2017 Key Figures ................................................................................................. 4
Interim Management Report for the First Half of 2017 ....................................................... 6
Financial Results in the First Half of 2017 ............................................................................... 6
Business Overview for the First Half of 2017 .......................................................................... 9
Research and Development .................................................................................................... 9
Strategy ................................................................................................................................. 10
Risk Factors ............................................................................................................................ 11
Shares and Shareholder Structure .................................................................................... 14
Dividend Policy and Declaration of Dividend .................................................................... 18
Related party transactions ............................................................................................... 19
Corporate Governance ..................................................................................................... 22
Interim Unaudited Consolidated Financial Statements ..................................................... 25
Condensed Consolidated Statement of Comprehensive Income for the Six Month Period 26
Condensed Consolidated Statement of Comprehensive Income for the 3 Month Period ... 27
Condensed Consolidated Statement of Financial Position ................................................... 28
Condensed Consolidated Statement of Cash Flows.............................................................. 29
Condensed Consolidated Statement of Changes in Equity ................................................... 30
Selected explanatory notes to the interim consolidated financial statements .................... 31
Declaration ...................................................................................................................... 38
Contacts .......................................................................................................................... 39
Glossary ........................................................................................................................... 40
Alternative indicators of performance .................................................................................. 42
Other information ........................................................................................................... 44
3
Introduction
PEGAS NONWOVENS SA (hereinafter "PEGAS" or "Company" or "Group") is one of the leading producers of nonwoven textiles in the EMEA (Europe, Middle East and Africa) region for use primarily in the personal hygiene products market. PEGAS supplies its customers with spunbond and meltblown (together "spunmelt") polypropylene- and polypropylene/polyethylene- based ("PP" and "PP/PE") textiles principally for use in disposable hygiene products (such as baby diapers, adult incontinence and feminine hygiene products) and, to a lesser extent, in construction, agricultural and medical applications.
Founded in 1990, the Company has grown over the past twenty-five years to become one of the largest producers of spunmelt nonwovens in the EMEA region (based on 2016 annual production capacity). Presently, the Company operates nine production lines in the Czech Republic and one production line in Egypt. The total annual production capacity of the Company is presently up to 100 thousand tonnes of nonwoven textiles in the Czech Republic and up to 20 thousand tonnes in Egypt.
PEGAS consists of a parent holding company in Luxembourg and four operating companies, PEGAS NONWOVENS s.r.o., Pegas-NT a.s., Pegas - NW a.s. and PEGAS – NS a.s., all located in the Czech Republic. In 2010, PEGAS NONWOVENS International s.r.o. was established as a special purpose company for the execution of potential investment opportunities. It executes its investments in Egypt and South Africa through its subsidiaries PEGAS NONWOVENS EGYPT LLC and PEGAS NONWOVENS RSA (PTY) LTD. As at 30 June 2017, PEGAS employed 586 people.
Shares in PEGAS are listed on the Prague Stock Exchange and on the Warsaw Stock Exchange, following an Initial Public Offering in December 2006. 100% of the shares are free float, held by institutional and retail investors.
PEGAS is a member of the European Disposables and Nonwovens Association (EDANA).
4
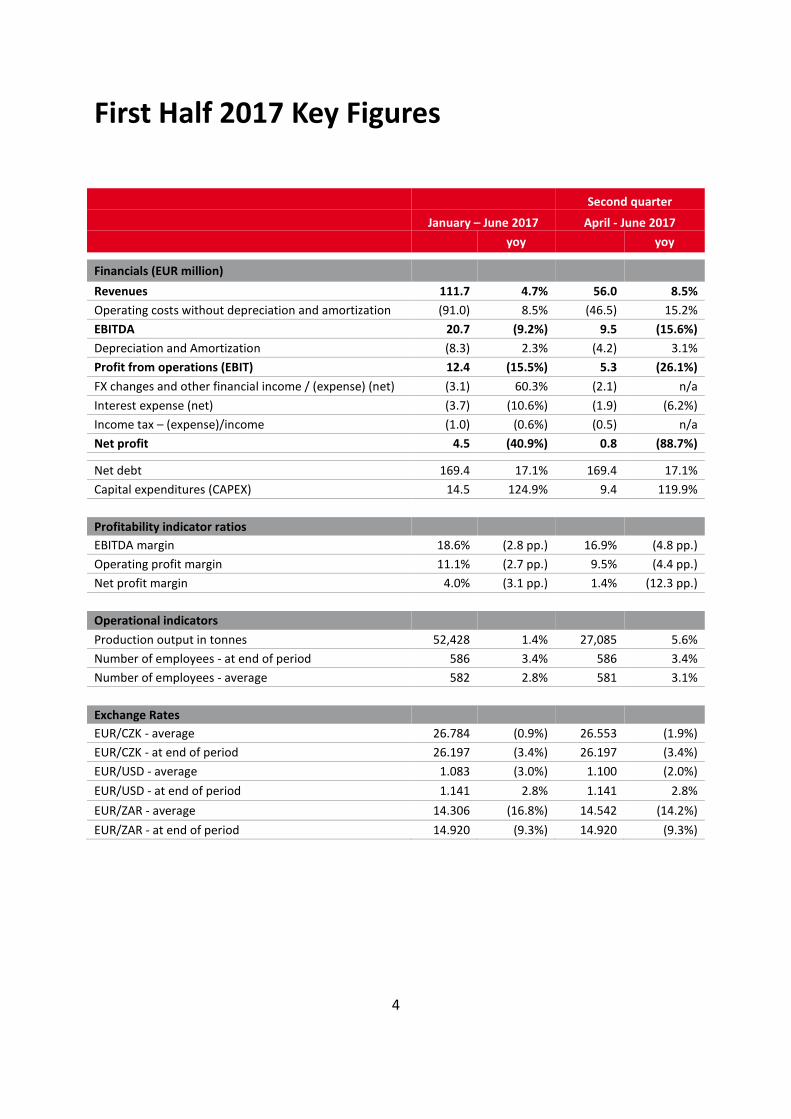
First Half 2017 Key Figures
Second quarter
January – June 2017 April - June 2017
yoy yoy
Financials (EUR million)
Revenues 111.7 4.7% 56.0 8.5%
Operating costs without depreciation and amortization (91.0) 8.5% (46.5) 15.2%
EBITDA 20.7 (9.2%) 9.5 (15.6%)
Depreciation and Amortization (8.3) 2.3% (4.2) 3.1%
Profit from operations (EBIT) 12.4 (15.5%) 5.3 (26.1%)
FX changes and other financial income / (expense) (net) (3.1) 60.3% (2.1) n/a
Interest expense (net) (3.7) (10.6%) (1.9) (6.2%)
Income tax – (expense)/income (1.0) (0.6%) (0.5) n/a
Net profit 4.5 (40.9%) 0.8 (88.7%)
Net debt 169.4 17.1% 169.4 17.1%
Capital expenditures (CAPEX) 14.5 124.9% 9.4 119.9%
Profitability indicator ratios
EBITDA margin 18.6% (2.8 pp.) 16.9% (4.8 pp.)
Operating profit margin 11.1% (2.7 pp.) 9.5% (4.4 pp.)
Net profit margin 4.0% (3.1 pp.) 1.4% (12.3 pp.)
Operational indicators
Production output in tonnes 52,428 1.4% 27,085 5.6%
Number of employees - at end of period 586 3.4% 586 3.4%
Number of employees - average 582 2.8% 581 3.1%
Exchange Rates
EUR/CZK - average 26.784 (0.9%) 26.553 (1.9%)
EUR/CZK - at end of period 26.197 (3.4%) 26.197 (3.4%)
EUR/USD - average 1.083 (3.0%) 1.100 (2.0%)
EUR/USD - at end of period 1.141 2.8% 1.141 2.8%
EUR/ZAR - average 14.306 (16.8%) 14.542 (14.2%)
EUR/ZAR - at end of period 14.920 (9.3%) 14.920 (9.3%)
5
Statement of Mr. František Řezáč, CEO and member of the Board of Directors of PEGAS NONWOVENS SA:
"The financial results for the second quarter were significantly impacted by the development in polymer prices. After a long period of stability, which lasted the whole of last year, we have been witness to a relatively significant growth in polymer prices since the beginning of this year. This fact, due to the delay in the polymer price pass-through mechanism, was also reflected in our result. The operational results indicator, EBITDA, reached EUR 9.5 million, resp. EUR 10.1 million when adjusted for the revaluation of the share option plan. Currently, it appears that polymer prices have reached their high and have weakened slightly, which should support our results in the coming quarter.
Since we are unable to influence the price of polymers, we have focused our efforts on areas where we can deliver improvement. In the second quarter, we have thus produced a record of more than 27 thousand tonnes. The new production line in Znojmo that we managed to launch sightly ahead of schedule also contributed to this result. This production line is currently running in full commercial mode and we expect that it will produce almost 5 thousand tonnes of finished products this year.
Also the project in South Africa is proceeding in line with our schedule. In July, we concluded a contract for the purchase of land for the construction of the new plant and at the beginning of August we ordered a new production line for this plant. We expect construction to begin in the last quarter of this year and that we will start delivering commercial
products to our customers at the beginning of 2019. We are very excited about this project and we are looking forward to entering a new fast growing market.
In concluding, I would also like to note that the annual general meeting approved the proposal of the board to pay out a dividend in the amount of EUR 1.30 per share. I firmly believe that our shareholders will appreciate this decision."
2017 Outlook Confirmed
In the first half of 2017, the Company achieved financial results that were in line with its expectations and with the announced outlook for the entire year 2017.
Based on the results achieved in the first half of 2017 and respecting the developments in the European nonwoven textile market, including the expected development in the polymer market, the Company confirms its previously announced guidance for 2017 and expects this year's EBITDA to be in the range from EUR 43.0 to 50.0 million.
The Company is planning for total CAPEX in 2017 not to exceed the EUR 30 million level.
6
Interim Management Report for the First Half of 2017
Financial Results in the First Half of 2017
Revenues, Costs and EBITDA
In the first half of 2017, consolidated revenues (revenues from sales of products) reached EUR 111.7 million, up by 4.7% yoy. In the second quarter of this year, the total consolidated revenues were EUR 56.0 million, an 8.5% increase compared with the same period last year. The year-on-year growth in sales was affected namely by an increase in polymer prices, which grew by more than 10% since the beginning of the year and are presently at levels that were registered more than two years ago.
Total consolidated operating costs without depreciation and amortization (net) went up by 8.5% yoy to EUR 91.0 million in the first half of 2017. In the second quarter of 2017, consolidated operating costs without depreciation and amortization (net) were EUR 46.5 million, representing an increase of 15.2% yoy. The reason for the increase in operating costs was the significant growth in polymer prices in the comparable periods.
In the first half of 2017, EBITDA amounted to EUR 20.7 million, down by 9.2% yoy. The year-on-year decline of EBITDA was to a significant degree caused by, in particular, the polymer price pass-through mechanism. Polymer prices have grown significantly since the beginning of the year, whilst remaining at maximum levels
for the entire second quarter. Due to the delay in the polymer price pass-through mechanism, they were not reflected into sales. The present development in polymer prices indicates that prices have culminated for the time being and that their slight decrease should be positively reflected in the third quarter results. The effect of the revaluation of the share option plan, in the first half of 2017 represented an expense in the amount of EUR 0.8 million compared with an expense of EUR 0.5 million in the first half of 2016. Thus, EBITDA, adjusted for the effect of the revaluation of the share option plan, declined by 7.6% yoy to EUR 21.6 million.
In the first half of 2017, the EBITDA margin was 18.6%, which is 2.8 percentage points lower than in the same period in 2016. In the first half of 2017, the EBITDA margin, adjusted for the effect of the revaluation of the share option plan, was 19.3%, which is 2.6 percentage points lower than in the same period in 2016.
EBITDA amounted to EUR 9.5 million in the second quarter of 2017, down by 15.6% yoy. The polymer price pass-through mechanism had the greatest impact on the year-on-year comparison. The revaluation of the share option plan represented an expense of EUR 0.6 million in the second quarter of 2017, compared with an expense of EUR 0.4 million in the comparable period of the preceding year. EBITDA adjusted for this effect declined by 12.9% yoy to EUR 10.1 million.
7
The EBITDA margin in the second quarter of 2017 amounted to 16.9%, which is 4.8 percentage points below the previous year. In the second quarter of 2017, the EBITDA margin, adjusted for the effect of the revaluation of the share option plan, was 18.0%, which is 4.4 percentage points less than in the same period in 2016.
The results in the first half are in line with the guidance range announced at the beginning of the year, when the Company indicated a year-on-year increase in EBITDA to EUR 43.0 to 50.0 million.
Operating Costs
Total raw materials and consumables used in the first half of this year amounted to EUR 83.8 million, a 9.1% yoy increase. In the second quarter of 2017, this item reached EUR 42.4 million, an increase of 15.1% compared with the same period in the previous year. The primary factor affecting the year-on-year increase were higher polymer purchase prices compared to the previous year.
In the first half of 2017, total staff costs amounted to EUR 6.7 million, an increase of 8.8%. The revaluation of the share option plan had the greatest effect on the year-on-year comparison of staff costs. In the first half of 2017, total staff costs adjusted for this effect amounted to EUR 5.8 million, an increase of 3.7% yoy. In the second quarter, primarily as a result of the revaluation of the share option plan, staff costs increased by 13.0% to EUR 3.6 million. In the second quarter of 2017, total staff costs adjusted for this effect amounted to EUR 3.0 million, an increase of 5.8%.
Other operating expenses (net) reached EUR 0.5 million in the first half of this year
compared to an expense of EUR 0.9 million in the same period in 2016. In the second quarter of 2017, other operating expenses (net) amounted to EUR 0.5 million.
Depreciation and Amortization
Consolidated depreciation and amortization amounted to EUR 8.3 million in the first half of 2017, up by 2.3% yoy. In the second quarter of this year, consolidated depreciation and amortization amounted to EUR 4.2 million, up by 3.1% yoy.
Profit from Operations
In the first half of 2017, profit from operations (EBIT) amounted to EUR 12.4 million, down by 15.5% over the same period in 2016.
In the second quarter of 2017, profit from operations (EBIT) when compared on a year-on-year basis fell to EUR 5.3 million, down by 26.1% yoy.
The polymer price pass-through mechanism had the greatest impact on the year-on-year profit from operations comparison.
Financial Income and Costs
In the first half of 2017, foreign exchange changes and other financial income/expense (net) amounted to an expense of EUR 3.1 million compared to an expense of EUR 2.0 million achieved in the same period last year. This item includes realized and unrealized FX gains/losses and other financial income and expenses. The year-on-year change was caused primarily by the development of the EUR/USD exchange rate, where the
8
dollar depreciated by more than 8% in the first half of this year. The depreciation, resp. appreciation of the US dollar against the Euro leads to unrealized exchange rate losses, resp. gains related to the revaluation of balance sheet items denominated in EUR, in particular due to the revaluation of the intra-company loan provided to the subsidiary in Egypt. In the second quarter of 2017, foreign exchange changes and other financial income/ (expense) (net) represented a cost of EUR 2.1 million, compared with a gain of EUR 1.7 in the comparable period in the previous year. Apart from the weakening US Dollar, in the second quarter, exchange rate changes were also affected by the appreciation of the CZK against Euro.
Interest expenses (net) related to debt servicing amounted to EUR 3.7 million in the first half, a 10.6% decrease compared with the same period in 2016. In the second quarter of 2017, interest expenses (net) related to debt servicing amounted to EUR 1.9 million, a 6.2% decrease compared with the same period last year. The reason for the decline in interest expenses was the expiration of interest rate swaps related to refinanced bank loans.
Income Tax
In the first half of 2017, income tax amounted to EUR 1.1 million, up by 6.5% yoy. Current tax payable amounted to EUR 1.5 million, changes in deferred tax represented a gain of EUR 0.4 million.
In the second quarter of 2017, income tax amounted to an expense of EUR 0.5 million. In the second quarter of 2017, current income tax payable amounted to EUR 0.6 million, while changes in deferred
tax represented a revenue of EUR 0.1 million.
Net profit
In the first half of 2017, Net profit reached EUR 4.5 million, down by 40.9% yoy primarily due to the reported unrealized foreign exchange changes in the compared periods. Predominantly due to these exchange rate losses, the Company had a net profit in the amount of EUR 0.8 million in the second quarter of 2017.
Investments
In the first half of 2017, consolidated capital expenditures represented EUR 14.5 million, compared to EUR 6.4 million over the same period last year. Of this amount, EUR 10.4 million was spent on investments into production and warehousing capacity expansion, with the remainder being maintenance CAPEX. In the second quarter of 2017, consolidated capital expenditures represented EUR 9.4 million, compared to EUR 4.3 million over the same period last year.
The Company is planning for total CAPEX in 2017 not to exceed the EUR 30 million level.
Cash and Indebtedness
The total amount of consolidated financial debt (both short-term and long-term) as at 30 June 2017 was EUR 239.8 million. Net debt as at 30 June 2017, reached EUR 169.4 million, up by 5.4% compared with 31 December 2016. As at 30 June 2017, the Net Debt/EBITDA ratio was 3.80x. The development in Net debt was to a certain extent negatively affected by the appreciation of CZK against EUR, which resulted in an increase in liabilities
9
expressed in the reporting currency of EUR on bonds denominated in CZK. These CZK-denominated bonds are, however, hedged by cross-currency swaps the value of which, as at 30 June 2017 represents a receivable of the Company in the amount of almost EUR 6.4 million and thus effectively reduces the value of net debt to EUR 163.0 million.
Business Overview for the First Half of 2017
In the first half of 2017, the total production output (net of scrap) reached 52,428 tonnes, up by 1.4% compared with the first half of 2016. In the second quarter of 2017, the Company produced 27,085 tonnes, i.e an increase of 5.6% over the same period last year.
In the first half of 2017, the share of revenues from sales of nonwoven textiles for the hygiene industry represented an 85.8% share of total revenues, indicating a minor year-on-year decline. The high share of products in this category confirms the important position that the Company has in this market. In the second quarter of 2017, the share of revenues from sales of nonwoven textiles for the hygiene industry on total revenues was 86.7%, up by 2.2 percentage points compared with the same period last year.
The share of sales of non-hygiene products on total revenues was 14.2% in the first half of 2017 and 13.3% in the second quarter.
The geographical distribution of its markets1, confirms the Company's steady
1 The geographical breakdown is based on the
location of delivery.
focus on sales to the broader European area. In the first half of 2017, revenues from sales to Western Europe amounted to EUR 38.4 million, which represented a 34.4% share of total revenues, compared with a 39.9% share in the same period in 2016. In this period, revenues from sales to Central and Eastern Europe and Russia amounted to EUR 45.6 million and represented a 40.8% share of total revenues. Revenues from sales to other territories amounted to EUR 27.7 million, and represented a 24.8% share of total revenues.
Research and Development
The development of new applications, products and the optimisation of technologies are some of the key components of the current and future strategy of the Company. This platform is supported by a team of engineers, who are dedicated to the development of this new product platform and the provision of customer and technical support to our partners.
Work teams are active in several different areas, which are principally divided into industrial and hygiene applications with the primary focus on the hygiene field. The majority of important projects of the Company are focused in this direction.
From a technological standpoint, the technical department has two primary objectives:
1) to improve the quality, performance and efficiency of production of standard products and
2) to develop products with added value through the use of current and new
10
technologies including bi-component spinning technology.
Both of these objectives are achieved in cooperation with the raw material suppliers, using standard and special new polymers, and/or with machinery suppliers, which allows the Company to offer value added products to its customers.
In the area of technology, in cooperation with its key equipment supplier, PEGAS has developed a new technology known as Compact. It should simplify and speed up the Company's entry into developing markets, which are characterised by a set of specific risks related, for example, to higher CAPEX, immediate sale of the entire capacity of a production line, or the complexity of commissioning large production lines. At the same time, this technology should make technologically advanced products accessible in developing markets. The production plant in Znojmo was selected for the first installation of this new technology, and the production line has been in full commercial production mode since the end of the second quarter. Its parameters are currently being verified under real operating conditions. Subsequently it should provide the Company potential for further expansion in new regions while at the same time strengthening and confirming PEGAS' leading position in the area of technology.
Apart from the development of new technologies, PEGAS is actively working on developing nonwoven textiles with excellent touch and feel properties, bulkiness and softness. These materials are already gradually being introduced into commercial production delivering a range of advantages to customers.
Development in this area is continuing and in the future it will be focused on the so-called 3D nonwoven textile structure with a potential visual effect. The development is based on the requirements of key customers and in several cases it is a product tailor-made for a specific partner.
Another key project is the commercialisation of Nano MB technology. Guarantee trials were successfully completed at the end of 2016, the new technology is validated and ready for qualification with selected customers. The main benefit of nonwoven textiles produced on the basis of MB nano-fibres is the significant improvement in their barrier properties, primarily for applications in the hygiene segment.
PEGAS cooperates with many institutions such as universities and R&D centres, primarily in the Czech Republic and Slovakia but also in Western Europe. These institutions provide the Company with special support in various specialised research areas including the opportunity to develop products on pilot equipment, as well as consulting in areas such as patent research, drawing up of patents, modelling nonwoven textile structures or testing of new technologies and input raw materials.
Strategy
The future strategic objective of the Company is to:
1) develop and take advantage of growth market opportunities to strengthen its market position,
2) maintain and extend its technological excellence in the European spunmelt nonwoven textile market for the
11
production of disposable hygiene products in the EMEA region and
3) deliver solid returns to its shareholders
PEGAS intends to fulfil its strategy principally by focusing on the following areas:
Continue investing into technologically advanced production capacity: PEGAS will continue to install state-of-the-art production capacities. The latest production line in Znojmo was put into operation in the second half of 2017. It is a COMPACT-type production line, which is based on a "flat-floor" concept. This new type of production line is, thanks to its lower overall investment cost, lower demands on infrastructure and lower capacity, considered to be an expansion platform suitable for penetration into new, especially developing markets. And precisely for these reasons, a similar production line was also selected for the production plant in South Africa.
Maintain close relationships with customers and suppliers: In order to continue to stay ahead of the competition, PEGAS will continue to work together with its clients, machinery manufacturers and raw material suppliers to research, develop and implement new products. PEGAS will endeavour to remain at the forefront of technical developments in the industry, supply its customers with the highest quality products and continually develop new materials.
Focus on technologically advanced products: PEGAS is the largest producer of bi-component spunmelt nonwovens in the EMEA region with extensive experience in the design and production of ultra-lightweight materials. In recent
years, the Company has successfully commercialised new materials with exceptional properties.
Maintain solid financial performance within the industry: The main objective of PEGAS is to grow with its main market, achieve sales levels in line with this growth and to achieve high operating margins relative to its competitors. PEGAS is effective at generating significant levels of cash, which is subsequently used to support expansion, reduce outstanding debt and pay out dividends.
Monitoring investment opportunities: The Company will continue to monitor investment opportunities outside the Czech Republic, whether acquisitions or the construction of new capacities in other territories.
Risk Factors
The Company’s business, results of operations and financial condition may be adversely affected by the following risks:
Marketing and Sales
PEGAS operates in a highly competitive market and the emergence of new competitors or introduction of new capacities by one of the existing competitors in the hygiene segment could adversely affect sales and margins.
A high concentration of customers accounts for a significant percentage of the total sales and the loss of one or more of them may significantly affect the Company’s revenues and profitability.
A change in the demand of end users of hygiene products and a shift of their preferences towards cheaper products
12
may lead to a change in the product mix at PEGAS and affect the Company’s revenues and profitability.
Production
Any disruption to PEGAS production facilities would have a materially adverse effect on the Company’s business. PEGAS is dependent on one manufacturer for the equipment and technical support for the production lines. PEGAS may not be able to reconfigure production lines in a timely manner in order to respond to changing demand for particular kinds of spunmelt nonwovens. Machinery from other producers may prove to be more efficient and develop at a faster rate than the machinery offered by PEGAS' supplier.
The Company’s competitors may have access to larger volumes of capital under better conditions, and thereby be able to modernise and expand their production more quickly, and thus attain a substantial competitive advantage over PEGAS.
The steady supply and transportation of products from PEGAS’s plants to the customers are subject to various uncertainties and risks.
PEGAS depends on external suppliers for key raw materials, therefore increases in the cost of raw materials, electricity and other consumables could have a material adverse impact on the Company’s financial condition and results of operations, although a polymer price increase is, by large, transferred to customer prices.
Research and Development
The Company’s competitors may develop new materials demanded by customers
and gain a competitive advantage, which could adversely affect the Company’s sales and margins.
Potential Expansion
PEGAS faces risks associated with potential acquisitions, investments, strategic partnerships, alliances, including opportunity identification, risk of the completion of the transaction and the integration of other parties into PEGAS’s business.
Legal and Intellectual Property
PEGAS’s operations are exposed to financial and operating uncertainty and are subject to government laws and regulations that may adversely affect the results of operations and financial performance.
PEGAS may be in breach of intellectual property rights of others.
Adverse outcomes in litigation to which PEGAS might be a party could harm the business and its prospects.
Finance
The indebtedness of PEGAS could adversely affect its financial condition and results of operations. There is a risk that interest rates on outstanding external debt could be reassessed by the banks and increased on the back of the financial sector crisis and therefore increased interest costs could affect the Company’s profitability.
The current level of indebtedness and conditions imposed on external debt (covenants) may potentially lead to a
13
modification of the current progressive dividend policy of the Company.
There is a risk that the fluctuations in the value of the Czech koruna against the Euro could adversely affect the Company’s profitability.
PEGAS’s operating subsidiaries avail themselves of tax benefits offered by the Czech government. Hence, the Company’s profitability could decrease owing to any adverse change in general tax policies or if the tax benefits were reduced or withdrawn.
The fluctuation in polymer prices, which are passed on to the customers with some delay may on a short term basis affect the Company’s revenues and profitability.
The insurance coverage may not adequately protect PEGAS against possible risk of loss.
Security, Environment and Workplace Safety
Compliance with, and changes in, safety, health and environmental laws and regulations may adversely affect the Company’s results of operations and financial conditions.
Key Personnel and Technical Expertise
The loss of the services of key management personnel could adversely affect the Company’s business.
PEGAS may not be able to hire and retain sufficient numbers of qualified professional personnel because these personnel are limited in number and are in high demand.
Ownership Changes
PEGAS is 100% free float and its ownership structure is fragmented and divided amongst many shareholders. A potential entry of a majority investor into the Company could result in a sudden change in the long term strategy and impact the value of the shares.
Risk factors related to the investment in Egypt
Investments in developing markets such as Egypt are usually accompanied by a higher level of risk than investments in more developed countries. These risks include, amongst others, changes in the political environment, transfer of profits, nationalisation or politically motivated damage. In the future, the Egyptian economy may be susceptible to negative impacts similar to those that occur in other developing countries. Egypt is located in a region, which particularly in the past few years is subject to constant political and security upheaval. Like other countries in this region, Egypt has been the target of random terrorist attacks. It cannot be guaranteed that extremists or terrorist groups will not incite or continue performing random acts of violence, or that the government will continue to be relatively capable of maintaining the current level of order and stability in the country. Despite the fact that PEGAS has concluded an insurance contract with EGAP for the coverage of risks connected to the investment in Egypt, which includes insurance against risks such as transfer of profits, nationalisation or politically motivated damage, there still exists a risk that the insurance coverage will not sufficiently protect PEGAS against all possible losses related to the investment in Egypt.
14
Shares and Shareholder Structure
Shareholder Structure as at 30 June 2017
Institutional and retail investors
100.0%
Of which Management of the Company
0.0%
As at 31 December 2016 and 30 June 2017, the management did not own any shares of the Company.
On 24 January 2017, the Company received a shareholder notification stating that as at 20 January 2017 the company PKO Towarzystwo Funduszy Inwestycyjnych SA with seat at ul. Chłodna 52, 00-872 Warsaw, Poland, held 466,526 shares in PEGAS NONWOVENS SA representing 5.05% of the share capital and voting rights of the Company. Prior to 20 January 2017, PKO Towarzystwo Funduszy Inwestycyjnych SA held 460,937 shares of the Company, representing 4.99% of the share capital and voting rights of the Company.
On 28 April 2017, the Company received a shareholder notification stating that as at 7 April 2017, R2G Wealth, s.r.o. held 489,232 shares of PEGAS NONWOVENS S.A., representing 5.30% of the share capital and voting rights of the Company.
On 16 May 2017, the Company received a shareholder notification stating that as at 16 May 2017, Wood Textiles Holding Limited held 2,332,740 shares of PEGAS NONWOVENS, representing 25.28% of the share capital and voting rights of the Company. The previous notification from the shareholder Wood Textiles Holding
Limited was received by the Company on 22 June 2015. According to this notification, as at 15 June 2015, Wood Textiles Holding Limited held 1,885,983 shares of the Company, representing 20.43% of the share capital and voting rights of the Company.
Apart from these notifications, during the first six months of 2017, the Company did not receive any other notifications from shareholders about an acquisition or a change of a major holding in the share capital and total voting rights attached to the shares issued by the Company.
Delisting of shares from trading on the Warsaw Stock Exchange
On 5 January 2017, the Company's Board of Directors approved the delisting of the Company's shares from trading on the Warsaw Stock Exchange. This decision was taken on the grounds of very low trading volume of the Company’s shares on the Warsaw Stock Exchange that do not justify the costs of the listing. Subsequently, on 23 January 2017, the Polish supervisory authority approved the share tender offer submitted by the Company in connection with this intention. In connection with this, the Company finally accepted the reqiests and in March 2017 reacquired 4,071 shares representing 0.04% of the share capital and voting rights of the Company. The delisting of the Company's shares from trading on the Warsaw Stock Exchange is now pending approval from the Polish supervisory authority. In accordance with the required procedure, once the approval is obtained, the
15
Company shall subsequently request the Warsaw Stock Exchange to also approve the delisting of shares from trading. It is expected that the Company's shares shall cease to be traded on the Warsaw Stock Exchange during the second half of 2017.
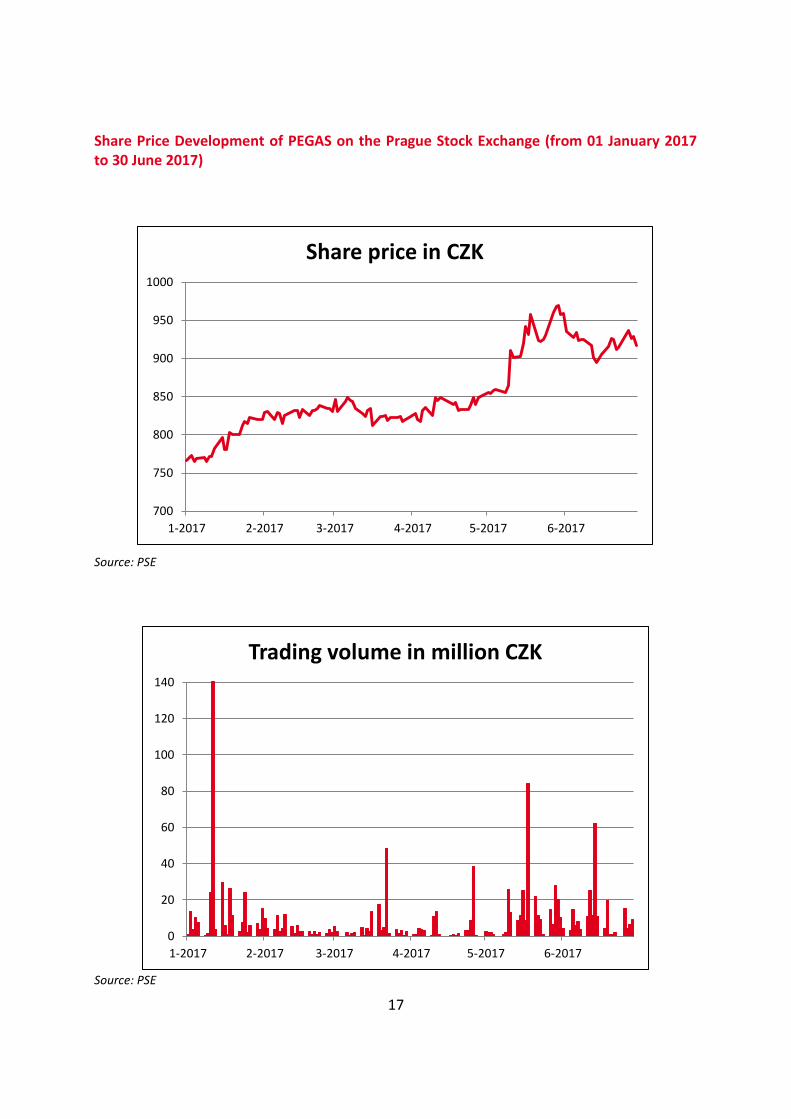
Share price and trading development in the first half of 2017
PEGAS shares are traded on the Prague Stock Exchange under ISIN LU0275164910 BAAPEGAS and on the Warsaw Stock Exchange under ticker PGS. The shares of PEGAS NONWOVENS SA are as of 19 March 2007 part of the PX index, which covers the shares of all major issuers on the Prague Stock Exchange.
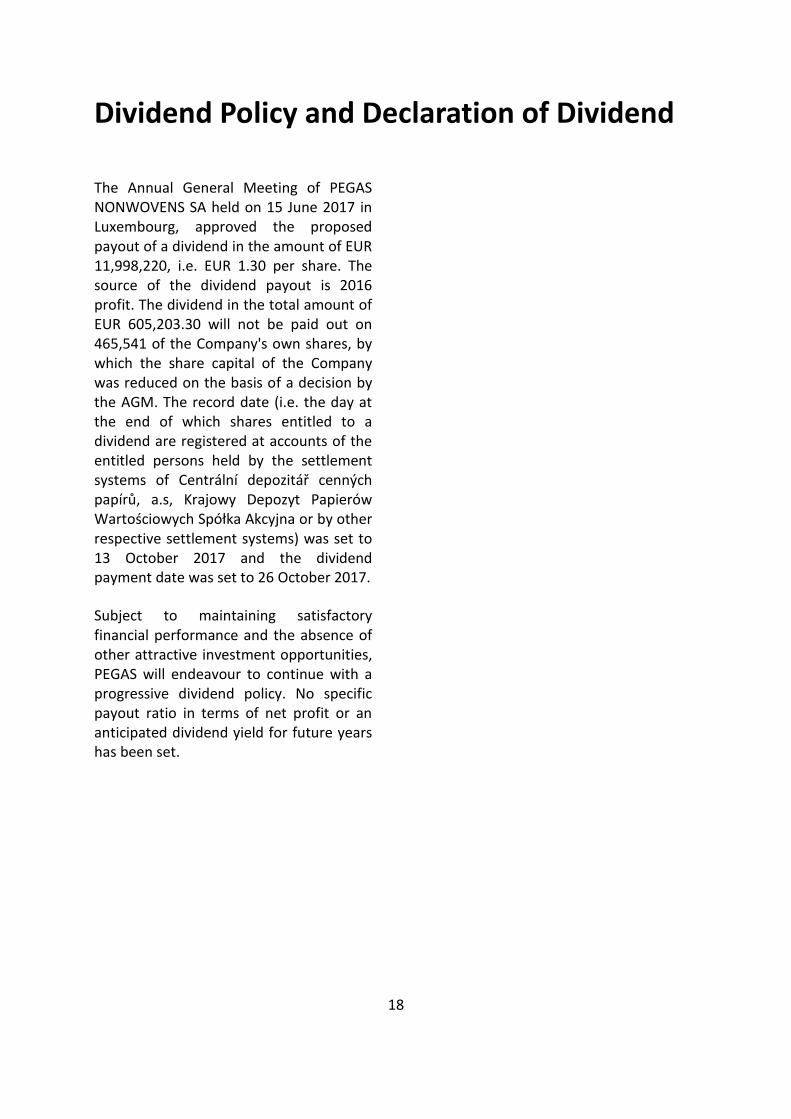
During the first half of 2017, PEGAS shares were traded for a total value of CZK 1,184 million on the Prague Stock Exchange and for a total value of PLN 6.2 million on the Warsaw Stock Exchange. The lowest trading price on the Prague Stock Exchange during the first 6 months of 2017 was CZK 759.10 and the highest trading price was CZK 970.00.
The closing price on the Prague Stock Exchange on 30 June 2017 was CZK 917.60 with market capitalization reaching CZK 8 billion.
Subsequent events
Shareholder notifications
On 17 July 2017, the Company received a notification that R2G Wealth s.r.o. was as of 11 July 2017 holding 81,387 shares in the Company, constituting 0.93% of the share capital and of the total voting rights attached to the shares issued by the Company. The previous notification from R2G Wealth s.r.o. was received on 2 May
2017. According to this notification, as of 7 April 2017, R2G Wealth s.r.o. had held 489,232 shares in the Company, constituting 5.30% of the share capital and of the total voting rights attached to the shares issued by the Company.
On 17 July 2017, the Company received a notification that R2G Foundation was as of 11 July 2017 directly holding 612,854 and indirectly, through R2G Wealth s.r.o., 81,387 shares in the Company, i.e. altogether 694,241 shares constituting 7.92% of the share capital and of the total voting rights attached to the shares issued by the Company.
On 17 July 2017, the Company received a notification that R2G Foundation was as of 13 July 2017 holding 0 shares in the Company constituting 0.0% of the share capital and of the total voting rights attached to the shares issued by the Company.
On 17 July 2017, the Company received a notification that R2G Rohan S.à r.l. was as of 13 July 2017 holding indirectly, through R2G Rohan Czech s.r.o., 694,241 shares in the Company constituting 7.92% of the share capital and of the total voting rights attached to the shares issued by the Company.
On 18 August 2017, the Company received a notification that R2G Rohan S.à r.l. was as of 18 August 2017 holding indirectly through R2G Rohan Czech s.r.o. 948,375 shares in the Company, constituting 10.82% of the share capital and of the total voting rights attached to the shares issued by the Company.
16
Capital reduction
At the date of the Annual General Meeting (15 June 2017), the share capital of the Company consisted of 9,229,400 shares. The Annual General Meeting of Shareholders resolved to reduce the share capital to EUR 10,867,185.16 by the cancellation of 465,541 own shares held by PEGAS (the aggregate nominal value of which is equal to EUR 577,270.84). After this reduction, the share capital consists of 8,763,859 shares at a nominal value of EUR 1.24.
The share capital reduction has been effectively registered by the Registre de Commerce et des Sociétés in Luxembourg, in accordance with applicable laws, and as of 27 July 2017 is also reflected in the common depositories.
Voluntary takeover bid
On 17 July 2017, R2G Rohan Czech s.r.o. announced the decision to offer, within the scope of a voluntary takeover bid, to all PEGAS shareholders the buyback of their shares at a price of CZK 1,010 per share.
On 14 August 2017, the Company announced, that it received from R2G Rohan Czech s.r.o. the voluntary takeover bid to acquire shares in the Company for CZK 1,010 per share.
On 21 August 2017, the Company announced that the board of directors of the Company prepared and subsequently delivered to the offerror and to the Czech National Bank its reasoned opinion with respect to the voluntary takeover bid.
17
Share Price Development of PEGAS on the Prague Stock Exchange (from 01 January 2017 to 30 June 2017)
Source: PSE
Source: PSE
700
750
800
850
900
950
1000
1-2017 2-2017 3-2017 4-2017 5-2017 6-2017
Share price in CZK
0
20
40
60
80
100
120
140
1-2017 2-2017 3-2017 4-2017 5-2017 6-2017
Trading volume in million CZK
18
Dividend Policy and Declaration of Dividend
The Annual General Meeting of PEGAS NONWOVENS SA held on 15 June 2017 in Luxembourg, approved the proposed payout of a dividend in the amount of EUR 11,998,220, i.e. EUR 1.30 per share. The source of the dividend payout is 2016 profit. The dividend in the total amount of EUR 605,203.30 will not be paid out on 465,541 of the Company's own shares, by which the share capital of the Company was reduced on the basis of a decision by the AGM. The record date (i.e. the day at the end of which shares entitled to a dividend are registered at accounts of the entitled persons held by the settlement systems of Centrální depozitář cenných papírů, a.s, Krajowy Depozyt Papierów Wartościowych Spółka Akcyjna or by other respective settlement systems) was set to 13 October 2017 and the dividend payment date was set to 26 October 2017.
Subject to maintaining satisfactory financial performance and the absence of other attractive investment opportunities, PEGAS will endeavour to continue with a progressive dividend policy. No specific payout ratio in terms of net profit or an anticipated dividend yield for future years has been set.
19
Related party transactions Remuneration of executive and non-executive directors
PEGAS NONWOVENS SA signed service agreements with its executive and non-executive directors. Executive directors receive remuneration from the Company's subsidiaries for their services.
Executive directors, i.e. board members and executive heads in the Czech Republic, may use the Company’s cars for private purposes. Executive directors do not receive any other benefits in addition to this.
Management Bonus Scheme
The principles of the bonus scheme for 2008 and for the following financial years targeted to the senior management of PEGAS Group were approved by the AGM in 2008.
The key elements of the bonus scheme are as follows:
The scheme was designed to ensure that senior management is focused on delivering the Company’s budgeted economic results represented by the Budgeted EBITDA. This bonus scheme is valid for the accounting year of 2008 and onwards.
The basis for the bonus calculation is EBITDA of the PEGAS Group calculated in accordance with International Financial Reporting Standards at the consolidated level, adjusted for certain extraordinary and one-off items.
If achieved EBITDA is equal to Budgeted EBITDA, the paid bonus will be the the Target bonus. If the achieved EBITDA is below or above the
Budgeted EBITDA, the amount of the target bonus will be decreased or increased up to the amount of a maximum bonus in accordance with criteria set for each year by the Board of Directors.
Cash-settled share-based payment
In 2007, the Company entered into a Share price bonus scheme for its Senior Management and Board Members. The scheme is realised through Phantom options.
The Annual General Meeting held on 15 June 2007 approved the grant of an aggregate amount of 230,735 phantom options to six senior executive managers and two non-executive directors, for no consideration. The Grant date of the phantom options was 24 May 2007. Each phantom option, when exercised, granted the manager the right to receive cash calculated as the closing price of one Company share on the Prague stock exchange (the PSE) (or other market if the PSE trading is discontinued) on the day preceding the day of exercise of the phantom option less CZK 749.20 representing the offer price at the time of the initial public offering of the shares of PEGAS NONWOVENS S.A. (the IPO price). 25% of the phantom options vested yearly, with the first options vesting from 18 December 2007 and the last options vesting from 18 December 2010. The given part of phantom options may be exercised on or after the vesting date. The participants shall provide services to the Group at the vesting date to be eligible for the given share of the phantom options.
20
On 15 June 2010 the AGM approved new principles of share price bonus plan for members of the Senior Management and the members of the Board of Directors. The goal of the new programme was to enhance its motivation function and to extend it to the new members of the Senior Management and the Board of Directors. Therefore, the AGM Meeting resolved to issue an aggregate amount of 230,735 phantom options (representing 2.5% of share capital of PEGAS) to the directors and senior management of PEGAS and/or its affiliates, against no consideration. Each phantom option, when exercised, will grant the director the right to receive a phantom share, i.e. the right to receive in cash an amount equal to the difference between CZK 473.00 representing the PEGAS’s share price on the Prague Stock Exchange ("PSE") as of December 15, 2009 increased by 10%, and the closing price of one PEGAS share on the day preceding the day of exercise of the phantom option on the PSE (or other market if the PSE trading is discontinued). 25% of phantom options (i.e. 57,684 options) will vest yearly, with the first options vesting on 18 December 2010 and the last options vesting on 18 December 2013, whereas the first options vesting on 18 December 2010 will fully replace the last options of current share price bonus plan, approved at the AGM in 2007, vesting at the same date. Rights arising from the remaining 34,008 options (that ceased on 18 December 2010) granted in 2007 and approved by the AGM on 15 June 2007 were cancelled.
The Extraordinary General Meeting held on 21 July 2014, resolved to convert 230,735 phantom options granted in 2010-2013 by PEGAS to the directors and senior management of PEGAS and/or its affiliates into 230,735 warrants. Each
warrant, when exercised, grants the holder the right to receive (i) one share in PEGAS for a strike price corresponding to CZK 473, representing PEGAS’s share price on the Prague Stock Exchange (the “PSE”) as of 15 December 2009 increased by 10%, or (ii) a payment in cash amounting to the final price of one share of PEGAS on the Prague Stock Exchange on the business day preceding the exercise date, less CZK 473 representing PEGAS’s share price on the PSE as of 15 December 2009 increased by 10%. All the warrants will vest immediately from their granting date and will have the same exercise period that was initially planned for the phantom options.
The Extraordinary General Meeting held on 21 July 2014 resolved to issue 230,735 new warrants (representing 2.5% of the PEGAS’s share capital) to the directors and senior management of PEGAS and/or its affiliates collectively, for a purchase price of CZK 5.89 per new warrant to be paid in cash by the purchasers, it being understood that the Board of Directors of PEGAS will decide how the new warrants will be divided among the directors and senior management of PEGAS and/or its affiliates. Each new warrant, when exercised, entitles the holder to either receive (i) one share in PEGAS for a strike price corresponding to CZK 588.16 (representing the average of PEGAS’s share price on the Prague Stock Exchange from 1 October 2013 to 31 December 2013) less all the dividends which have been validly declared by PEGAS, per PEGAS’s share, for the relevant financial year(s) (i.e. the financial year 2014 for the new warrants to be vested in 2014, the financial years 2014 and 2015 for the new warrants to be vested in 2015 and the financial years 2014, 2015 and 2016 for the new warrants to be vested in 2016), or
21
(ii) a payment in cash amounting to the final price of one share of PEGAS on the Prague Stock Exchange on the business day preceding the exercise date, plus all the dividends which have been validly declared by PEGAS, per PEGAS’s share, for the relevant financial year(s) (i.e. the financial year 2014 for the new warrants to be vested in 2014, the financial years 2014 and 2015 for the new warrants to be vested in 2015 and the financial years 2014, 2015 and 2016 for the new warrants to be vested in 2016), less the strike price of CZK 588.16 (representing the average of PEGAS’s share price on the Prague Stock Exchange from 1 October 2013 to 31 December 2013).
The Annual General Meeting held on 15 June 2017 resolved to issue a total of 230,735 new warrants to the directors and senior management of PEGAS and/or its affiliates collectively, for a purchase price of CZK 12.70 per new warrant to be paid in cash by the purchasers, it being understood that the Board of Directors of PEGAS will decide how the new warrants will be divided among the directors and senior management of PEGAS and/or its affiliates. Each new warrant, when exercised, entitles the holder to either receive (i) one share in PEGAS for a strike price corresponding to CZK 777 (representing the average of PEGAS’s share price on the Prague Stock Exchange from 01 October 2016 to 31 December 2016) less all the dividends which have been validly declared by PEGAS, per PEGAS’s share, for the relevant financial year(s) (i.e. the financial year 2017 for the new warrants to be vested in 2017, the financial years 2017 and 2018 for the new warrants to be vested in 2018 and the financial years 2017, 2018 and 2019 for the new warrants to be vested in 2019), or (ii) a payment in cash amounting to the
final price of one share of PEGAS on the Prague Stock Exchange on the business day preceding the exercise date, plus all the dividends which have been validly declared by PEGAS, per PEGAS’s share, for the relevant financial year(s) (i.e. the financial year 2017 for the new warrants to be vested in 2017, the financial years 2017 and 2018 for the new warrants to be vested in 2018 and the financial years 2017, 2018 and 2019 for the new warrants to be vested in 2019), less the strike price of CZK 777 (representing the average of PEGAS’s share price on the Prague Stock Exchange from 1 October 2016 to 31 December 2016).
On 23 May 2017, the Company received an announcement from persons discharging managerial responsibilities within the issuer about transactions with financial instruments, the value of which is derived from the share price of the Company. The subject of transaction was the exercise of 76,911 warrants purchased on the basis of a contract dated 22 September 2014 with a strike price of CZK 588.16. The closing price of the Company's shares on the record date was CZK 958.
As at 30 June 2017, the total number of issued phantom options and warrants was 69,304 (as at 31 December 2016 there were 146,215). As at 30 June 2016, the total number of phantom options and warrants comprised of 53,840 phantom options with a strike price of CZK 749.20, and 15,464 phantom options with a strike price of CZK 473.
The fair value of the phantom options and warrants as at 30 June 2017 was EUR 547 thousand.
22
Corporate Governance
Pursuant to the Warsaw Stock Exchange By-laws, and in connection with the listing of the Company’s shares on the Warsaw Stock Exchange, the Company is required to declare which of the Polish principles of corporate governance contained in the WSE Corporate Governance Rules it intends to comply with, as well as to enumerate the principles which it does not intend to comply with and to state the reasons for the non-compliance.
The Company has decided to observe the majority of the Warsaw Stock Exchange Corporate Governance Rules. Further information is available in the 2016 Annual Report.
Annual General Meeting held on 15 June 2017
At PEGAS’s AGM which was held in Luxembourg on 15 June 2017, resolutions from No.1 to No.9 and No. 10 part 1 were adopted. Resolutions No. 11 and 12. were rejected.
The agenda of the Annual General Meeting was as follows:
1. Election of the Bureau for the Annual General Meeting. 2. Presentation and discussion of the report of the auditors regarding the statutory
accounts and the consolidated accounts for the financial year ended 31 December 2016 and of the reports of the Board of Directors of PEGAS on the statutory accounts and the consolidated accounts for the financial year ended 31 December 2016.
3. Approval of the statutory accounts and the consolidated accounts for the financial year ended 31 December 2016.
4. Allocation of the net results of the financial year ended 31 December 2016 and the dividend payout in the amount of EUR 11,998,220, i.e. EUR 1.30 per share.
5. Discharge of the liability of the members of the Board of Directors and the auditors of PEGAS for, and in connection with, the financial year ended 31 December 2016.
6. Appointment of a Luxembourg independent auditor (“réviseur d'entreprises agréé”) to assess the statutory accounts and the consolidated accounts for the financial year ending 31 December 2017.
7. Approval of the remuneration policy for members of the Board of Directors without executive authority for the financial year 2017.
8. Approval of the remuneration policy for members of the Board of Directors with executive authority for the financial year 2017.
9. Approval of a new incentive scheme for the benefit of various members of senior management and the members of the Board of Directors of PEGAS consisting of new warrants to be issued by PEGAS and exclusion of shareholders’ pre-emptive subscription rights in connection therewith.
10. Cancellation of 465,541 pieces of own shares held by PEGAS (and corresponding amendment of article 5.1 of the Articles of Association) or, alternatively, approval of the use of the 465,541 own shares held by PEGAS (the aggregate nominal value of which is
23
equal to EUR 577,270.84) in treasury to hedge PEGAS' obligations pursuant to the 2014-2016 and 2017-2019 Incentive Schemes or to be sold by PEGAS to raise funds.
11. Cancellation of the authorisation given to the Board of Directors of PEGAS at Resolution 11 of the Annual General Meeting of PEGAS held on 15 June 2016 to acquire its own shares.
12. Increase of the current number of members of the Board of Directors of PEGAS from five (5) to six (6) by the appointment of Mr. Oldřich Šlemr to the Board of Directors of PEGAS.
13. Miscellaneous.
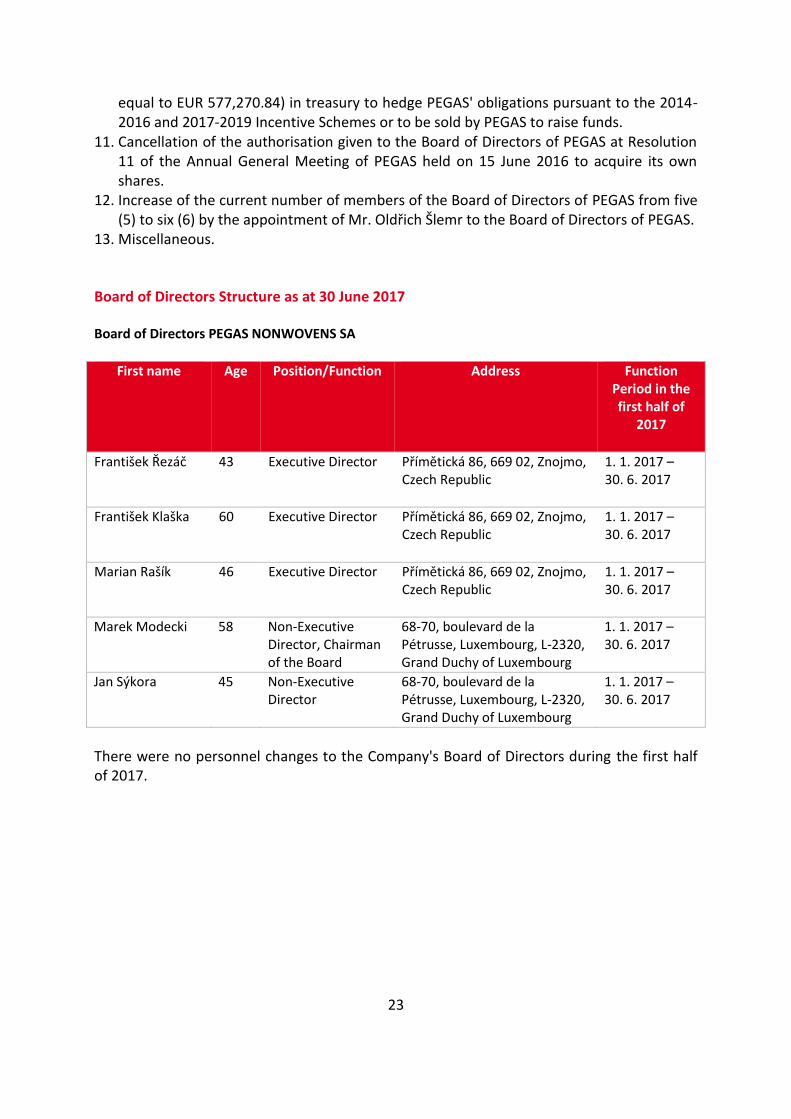
Board of Directors Structure as at 30 June 2017
Board of Directors PEGAS NONWOVENS SA
First name Age Position/Function Address Function Period in the first half of
2017
František Řezáč 43 Executive Director Přímětická 86, 669 02, Znojmo, Czech Republic
1. 1. 2017 – 30. 6. 2017
František Klaška 60 Executive Director Přímětická 86, 669 02, Znojmo, Czech Republic
1. 1. 2017 – 30. 6. 2017
Marian Rašík 46 Executive Director Přímětická 86, 669 02, Znojmo, Czech Republic
1. 1. 2017 – 30. 6. 2017
Marek Modecki 58 Non-Executive Director, Chairman of the Board
68-70, boulevard de la Pétrusse, Luxembourg, L-2320, Grand Duchy of Luxembourg
1. 1. 2017 – 30. 6. 2017
Jan Sýkora 45 Non-Executive Director
68-70, boulevard de la Pétrusse, Luxembourg, L-2320, Grand Duchy of Luxembourg
1. 1. 2017 – 30. 6. 2017
There were no personnel changes to the Company's Board of Directors during the first half of 2017.
24
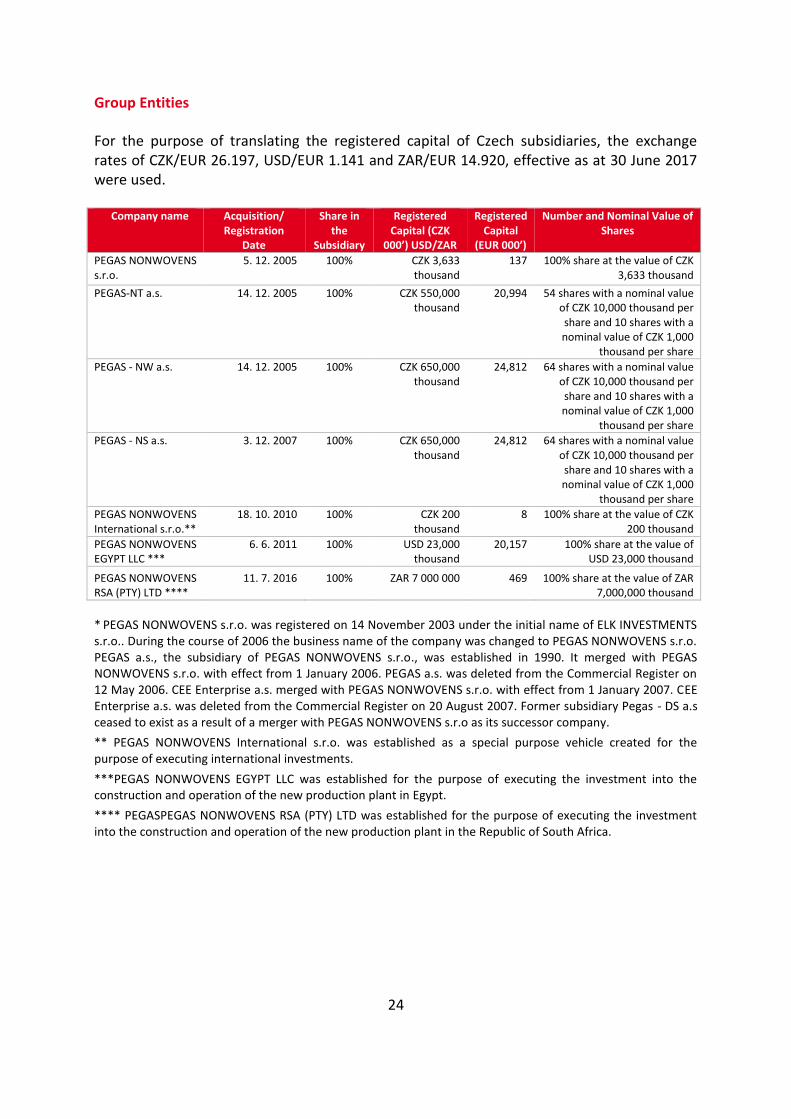
Group Entities
For the purpose of translating the registered capital of Czech subsidiaries, the exchange rates of CZK/EUR 26.197, USD/EUR 1.141 and ZAR/EUR 14.920, effective as at 30 June 2017 were used.
Company name Acquisition/ Registration
Date
Share in the
Subsidiary
Registered Capital (CZK
000’) USD/ZAR
Registered Capital
(EUR 000’)
Number and Nominal Value of Shares
PEGAS NONWOVENS s.r.o.
5. 12. 2005 100% CZK 3,633
thousand 137 100% share at the value of CZK
3,633 thousand
PEGAS-NT a.s. 14. 12. 2005 100% CZK 550,000 thousand
20,994 54 shares with a nominal value of CZK 10,000 thousand per share and 10 shares with a nominal value of CZK 1,000
thousand per share
PEGAS - NW a.s. 14. 12. 2005 100% CZK 650,000 thousand
24,812 64 shares with a nominal value of CZK 10,000 thousand per share and 10 shares with a nominal value of CZK 1,000
thousand per share
PEGAS - NS a.s.
3. 12. 2007 100% CZK 650,000 thousand
24,812 64 shares with a nominal value of CZK 10,000 thousand per share and 10 shares with a nominal value of CZK 1,000
thousand per share
PEGAS NONWOVENS International s.r.o.**
18. 10. 2010 100% CZK 200 thousand
8 100% share at the value of CZK 200 thousand
PEGAS NONWOVENS EGYPT LLC ***
6. 6. 2011 100% USD 23,000 thousand
20,157 100% share at the value of USD 23,000 thousand
PEGAS NONWOVENS RSA (PTY) LTD ****
11. 7. 2016 100% ZAR 7 000 000 469 100% share at the value of ZAR 7,000,000 thousand
* PEGAS NONWOVENS s.r.o. was registered on 14 November 2003 under the initial name of ELK INVESTMENTS
s.r.o.. During the course of 2006 the business name of the company was changed to PEGAS NONWOVENS s.r.o. PEGAS a.s., the subsidiary of PEGAS NONWOVENS s.r.o., was established in 1990. It merged with PEGAS NONWOVENS s.r.o. with effect from 1 January 2006. PEGAS a.s. was deleted from the Commercial Register on 12 May 2006. CEE Enterprise a.s. merged with PEGAS NONWOVENS s.r.o. with effect from 1 January 2007. CEE Enterprise a.s. was deleted from the Commercial Register on 20 August 2007. Former subsidiary Pegas - DS a.s ceased to exist as a result of a merger with PEGAS NONWOVENS s.r.o as its successor company.
** PEGAS NONWOVENS International s.r.o. was established as a special purpose vehicle created for the purpose of executing international investments.
***PEGAS NONWOVENS EGYPT LLC was established for the purpose of executing the investment into the construction and operation of the new production plant in Egypt.
**** PEGASPEGAS NONWOVENS RSA (PTY) LTD was established for the purpose of executing the investment into the construction and operation of the new production plant in the Republic of South Africa.
25
Interim Unaudited Consolidated Financial Statements
prepared in accordance with the International Financial Reporting Standards
for the six month period ending 30 June 2017
26
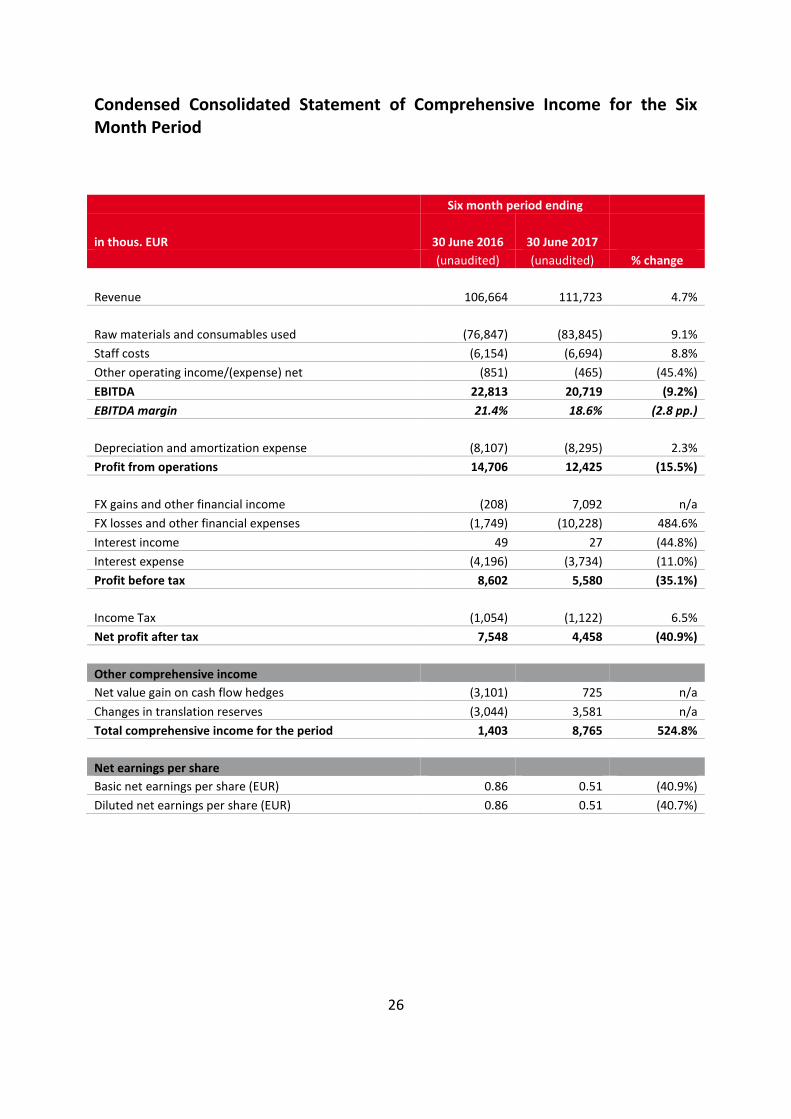
Condensed Consolidated Statement of Comprehensive Income for the Six Month Period
Six month period ending
in thous. EUR 30 June 2016 30 June 2017
(unaudited) (unaudited) % change
Revenue 106,664 111,723 4.7%
Raw materials and consumables used (76,847) (83,845) 9.1%
Staff costs (6,154) (6,694) 8.8%
Other operating income/(expense) net (851) (465) (45.4%)
EBITDA 22,813 20,719 (9.2%)
EBITDA margin 21.4% 18.6% (2.8 pp.)
Depreciation and amortization expense (8,107) (8,295) 2.3%
Profit from operations 14,706 12,425 (15.5%)
FX gains and other financial income (208) 7,092 n/a
FX losses and other financial expenses (1,749) (10,228) 484.6%
Interest income 49 27 (44.8%)
Interest expense (4,196) (3,734) (11.0%)
Profit before tax 8,602 5,580 (35.1%)
Income Tax (1,054) (1,122) 6.5%
Net profit after tax 7,548 4,458 (40.9%)
Other comprehensive income
Net value gain on cash flow hedges (3,101) 725 n/a
Changes in translation reserves (3,044) 3,581 n/a
Total comprehensive income for the period 1,403 8,765 524.8%
Net earnings per share
Basic net earnings per share (EUR) 0.86 0.51 (40.9%)
Diluted net earnings per share (EUR) 0.86 0.51 (40.7%)
27
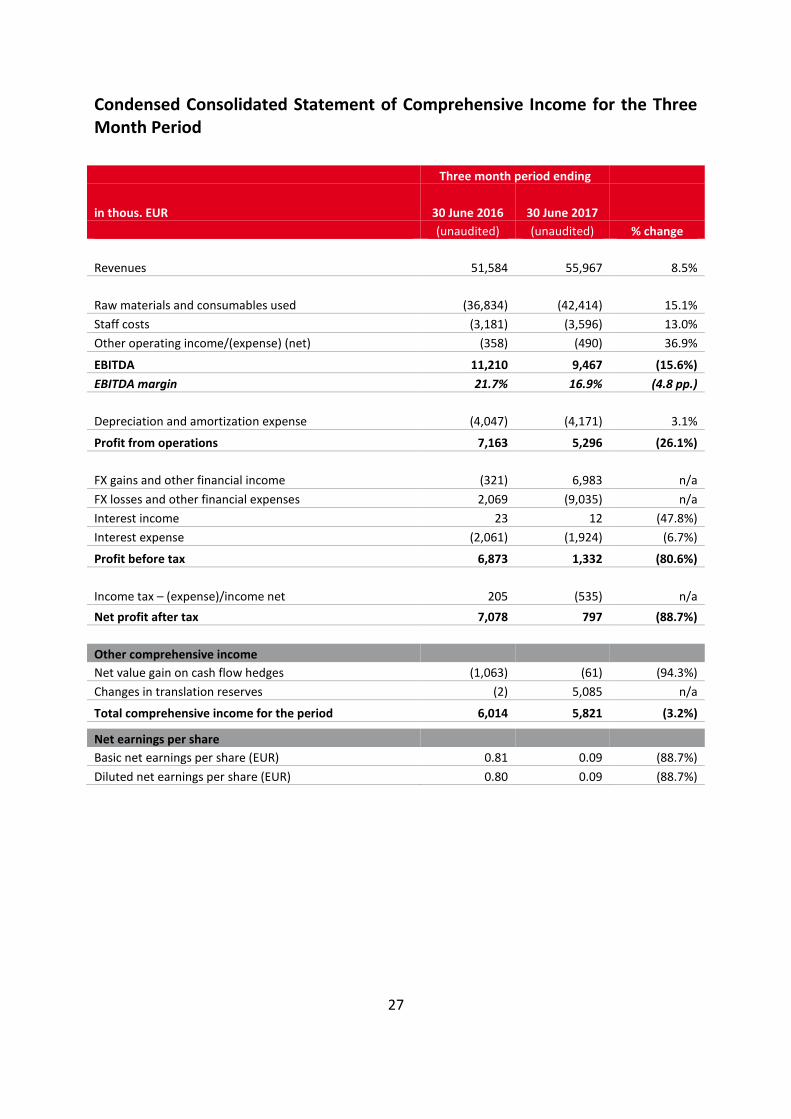
Condensed Consolidated Statement of Comprehensive Income for the Three Month Period
Three month period ending
in thous. EUR 30 June 2016 30 June 2017
(unaudited) (unaudited) % change
Revenues 51,584 55,967 8.5%
Raw materials and consumables used (36,834) (42,414) 15.1%
Staff costs (3,181) (3,596) 13.0%
Other operating income/(expense) (net) (358) (490) 36.9%
EBITDA 11,210 9,467 (15.6%)
EBITDA margin 21.7% 16.9% (4.8 pp.)
Depreciation and amortization expense (4,047) (4,171) 3.1%
Profit from operations 7,163 5,296 (26.1%)
FX gains and other financial income (321) 6,983 n/a
FX losses and other financial expenses 2,069 (9,035) n/a
Interest income 23 12 (47.8%)
Interest expense (2,061) (1,924) (6.7%)
Profit before tax 6,873 1,332 (80.6%)
Income tax – (expense)/income net 205 (535) n/a
Net profit after tax 7,078 797 (88.7%)
Other comprehensive income
Net value gain on cash flow hedges (1,063) (61) (94.3%)
Changes in translation reserves (2) 5,085 n/a
Total comprehensive income for the period 6,014 5,821 (3.2%)
Net earnings per share
Basic net earnings per share (EUR) 0.81 0.09 (88.7%)
Diluted net earnings per share (EUR) 0.80 0.09 (88.7%)
28
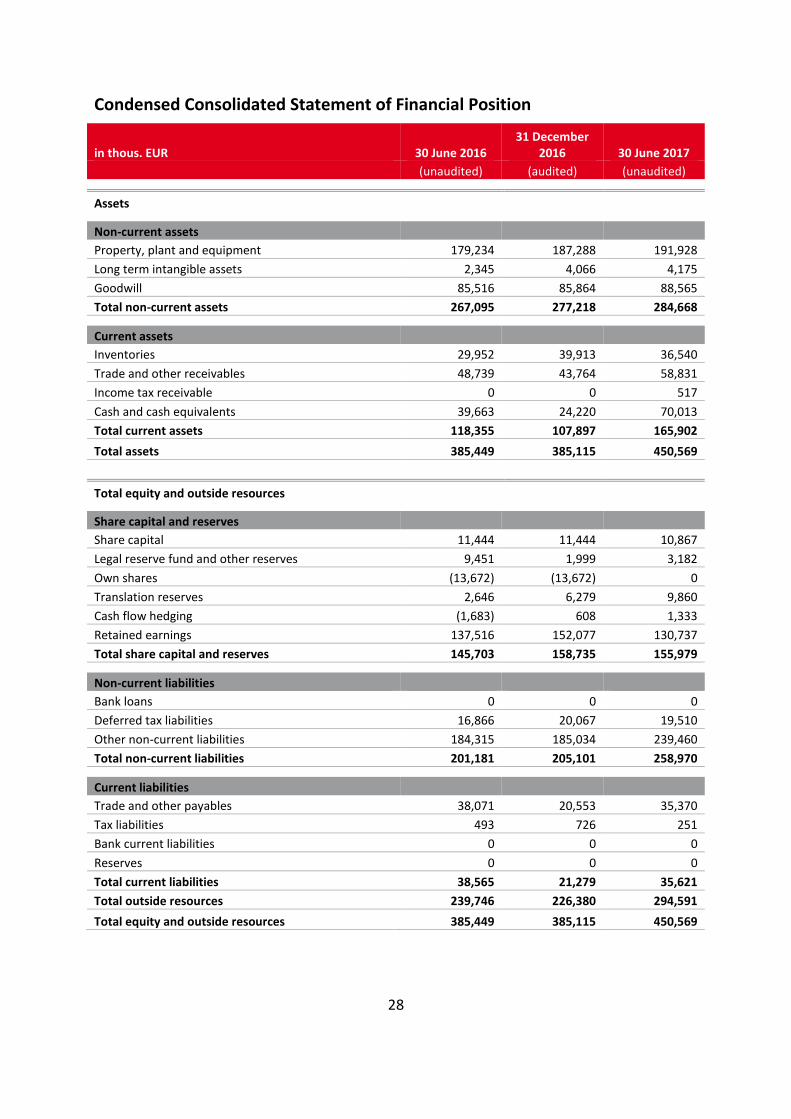
Condensed Consolidated Statement of Financial Position
in thous. EUR 30 June 2016 31 December
2016 30 June 2017
(unaudited) (audited) (unaudited)
Assets
Non-current assets
Property, plant and equipment 179,234 187,288 191,928
Long term intangible assets 2,345 4,066 4,175
Goodwill 85,516 85,864 88,565
Total non-current assets 267,095 277,218 284,668
Current assets
Inventories 29,952 39,913 36,540
Trade and other receivables 48,739 43,764 58,831
Income tax receivable 0 0 517
Cash and cash equivalents 39,663 24,220 70,013
Total current assets 118,355 107,897 165,902
Total assets 385,449 385,115 450,569
Total equity and outside resources
Share capital and reserves
Share capital 11,444 11,444 10,867
Legal reserve fund and other reserves 9,451 1,999 3,182
Own shares (13,672) (13,672) 0
Translation reserves 2,646 6,279 9,860
Cash flow hedging (1,683) 608 1,333
Retained earnings 137,516 152,077 130,737
Total share capital and reserves 145,703 158,735 155,979
Non-current liabilities
Bank loans 0 0 0
Deferred tax liabilities 16,866 20,067 19,510
Other non-current liabilities 184,315 185,034 239,460
Total non-current liabilities 201,181 205,101 258,970
Current liabilities
Trade and other payables 38,071 20,553 35,370
Tax liabilities 493 726 251
Bank current liabilities 0 0 0
Reserves 0 0 0
Total current liabilities 38,565 21,279 35,621
Total outside resources 239,746 226,380 294,591
Total equity and outside resources 385,449 385,115 450,569
29
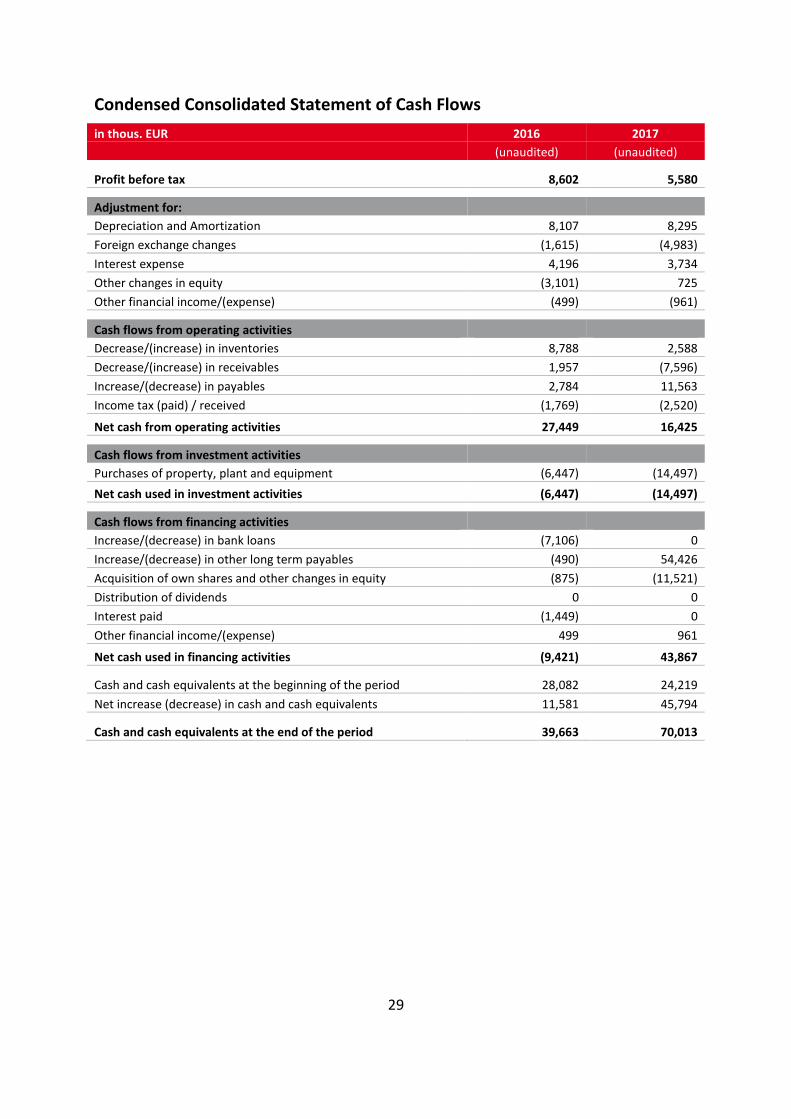
Condensed Consolidated Statement of Cash Flows
in thous. EUR 2016 2017
(unaudited) (unaudited)
Profit before tax 8,602 5,580
Adjustment for:
Depreciation and Amortization 8,107 8,295
Foreign exchange changes (1,615) (4,983)
Interest expense 4,196 3,734
Other changes in equity (3,101) 725
Other financial income/(expense) (499) (961)
Cash flows from operating activities
Decrease/(increase) in inventories 8,788 2,588
Decrease/(increase) in receivables 1,957 (7,596)
Increase/(decrease) in payables 2,784 11,563
Income tax (paid) / received (1,769) (2,520)
Net cash from operating activities 27,449 16,425
Cash flows from investment activities
Purchases of property, plant and equipment (6,447) (14,497)
Net cash used in investment activities (6,447) (14,497)
Cash flows from financing activities
Increase/(decrease) in bank loans (7,106) 0
Increase/(decrease) in other long term payables (490) 54,426
Acquisition of own shares and other changes in equity (875) (11,521)
Distribution of dividends 0 0
Interest paid (1,449) 0
Other financial income/(expense) 499 961
Net cash used in financing activities (9,421) 43,867
Cash and cash equivalents at the beginning of the period 28,082 24,219
Net increase (decrease) in cash and cash equivalents 11,581 45,794
Cash and cash equivalents at the end of the period 39,663 70,013
30
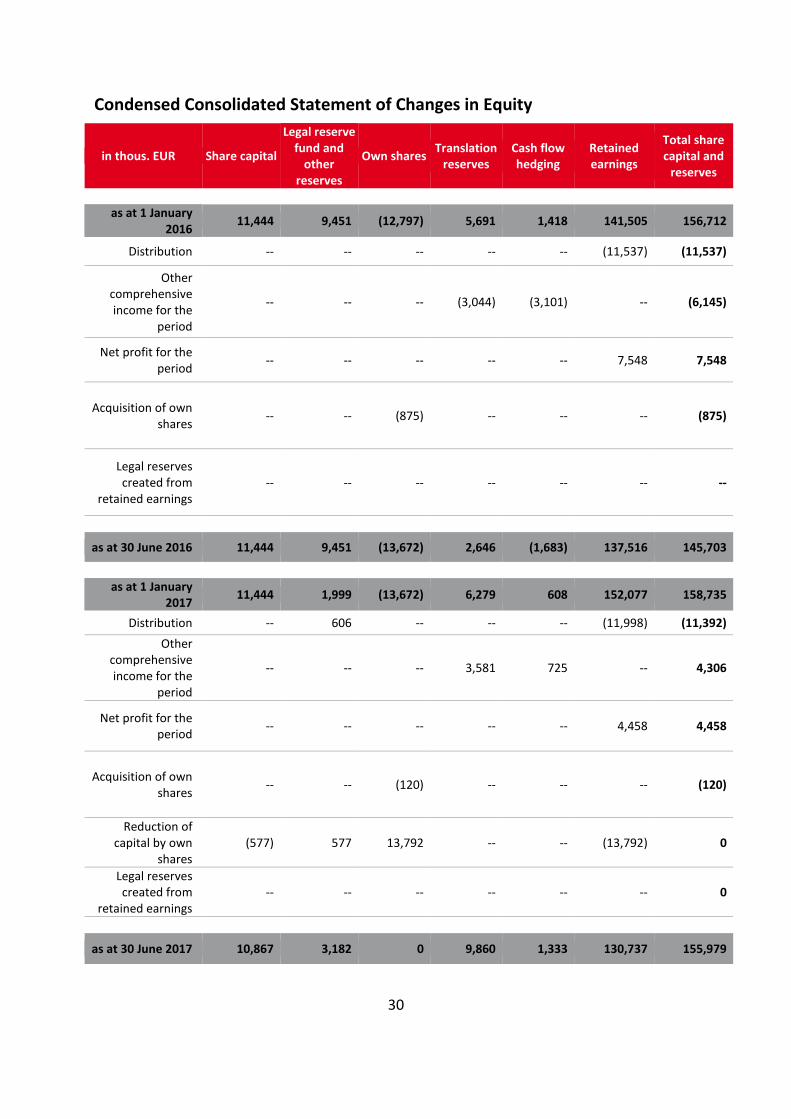
Condensed Consolidated Statement of Changes in Equity
in thous. EUR Share capital
Legal reserve fund and
other reserves
Own shares Translation
reserves Cash flow hedging
Retained earnings
Total share capital and
reserves
as at 1 January
2016 11,444 9,451 (12,797) 5,691 1,418 141,505 156,712
Distribution -- -- -- -- -- (11,537) (11,537)
Other comprehensive income for the
period
-- -- -- (3,044) (3,101) -- (6,145)
Net profit for the period
-- -- -- -- -- 7,548 7,548
Acquisition of own shares
-- -- (875) -- -- -- (875)
Legal reserves created from
retained earnings -- -- -- -- -- -- --
as at 30 June 2016 11,444 9,451 (13,672) 2,646 (1,683) 137,516 145,703
as at 1 January
2017 11,444 1,999 (13,672) 6,279 608 152,077 158,735
Distribution -- 606 -- -- -- (11,998) (11,392)
Other comprehensive income for the
period
-- -- -- 3,581 725 -- 4,306
Net profit for the period
-- -- -- -- -- 4,458 4,458
Acquisition of own shares
-- -- (120) -- -- -- (120)
Reduction of capital by own
shares (577) 577 13,792 -- -- (13,792) 0
Legal reserves created from
retained earnings -- -- -- -- -- -- 0
as at 30 June 2017 10,867 3,182 0 9,860 1,333 130,737 155,979
31
Selected explanatory notes to the interim consolidated financial statements
Basis of preparation
These financial statements were prepared under International Financial Reporting Standards (IFRS) and International Accounting Standards IAS 34 for interim financial reporting as adopted by the European Union. Condensed interim financial statements do not include all the information and disclosures required in the annual financial statements. This interim report was not audited by the Company´s external auditors.
Summary of Significant Accounting Policies
The same basis of preparation, accounting policies, presentation and methods of computation have been followed in these condensed financial statements as were applied in the preparation of the Group’s financial statements for the year ended 31 December 2016.
Adoption of new and revised standards
The possible impact of new standards, their amendments and interpretations on the future consolidated financial statements of the Group were described in the Company's consolidated financial statements for year ending 31 December 2016.
In relation to IFRS 15 – Revenue from Contracts with Customers - the Company intends to apply this new standard effective as of 1 January 2018. The Company is presently analysing the impacts of introducing standard IFRS 15 on revenues and expects that the results of this analysis shall be available by the end of 2017. Based on the preliminary results of this analysis, the most significant impact on the Company appears to be the timing of revenue recognition in the statement of profit and loss. The respective impact will depend on the specific contractual conditions with customers.
Disclosures on seasonal and economic influences
The business of PEGAS NONWOVENS SA is not typically subject to seasonal and economic influences other than the general economic cycle, although the hygiene market is to a large extent non-cyclical.
Important events and transactions
There were no important events or transactions in the first half of 2017 which would have a significant effect on the understanding of the changes in the statement of financial position and performance of the Company.
Estimates
The preparation of interim financial statements in compliance with IFRS requires management to make judgements, estimates and assumptions that affect the application of
32
accounting policies and the reported amounts of assets and liabilities, income and expenses. The estimates and associated assumptions are based on historical experience and various other factors. The objective of making estimates is to present a true and fair view of the financial position of the Company, namely for determining the values of assets and liabilities for which this value is not readily available from other sources. The actual results may differ from these estimates.
There were no material changes in the nature or size of the estimates since the issue of the previous financial reports.
Issue, repurchase and repayments of debt and equity securities
On 20 January 2017, the company PEGAS NONWOVENS s.r.o issued a private issue of senior unsecured bonds pursuant to Czech law in the nominal amount of EUR 50 million. The issue bears a fixed interest rate of 1.875% p.a. and matures on 20 January 2024. The proceeds from this bond issue will be used primarily for the refinancing of the public bond issue in November 2018.
The Company did not conclude any new bank facilities in the first half of 2017.
In the first half of 2017, the Company did not make any repurchases or repayments of debt securities.
In the first half of 2017, within the scope of the intention to delist the Company's shares from trading on the Warsaw Stock Exchange, the Company bought back 4,071 of its own shares at the acquisition value of EUR 120 thousand, equivalent to 0.04% of the Company's share capital at the time of the repurchase.
At the date of the Annual General Meeting (15 June 2017), the share capital of the Company consisted of 9,229,400 shares. The Annual General Meeting of Shareholders resolved to reduce the share capital to EUR 10,867,185.16 by the cancellation of 465,541 own shares held by PEGAS (the aggregate nominal value of which is equal to EUR 577,270.84). After this reduction, the share capital consists of 8,763,859 shares at a nominal value of EUR 1.24.
Dividend
The Annual General Meeting of the Company held on 15 June 2017 in Luxembourg, approved the payout of a dividend in the amount of EUR 11,998,220, i.e. EUR 1.30 per share. The dividend in the total amount of EUR 605,203.30 will not be paid out on 465,541 of the Company's own shares, by which the share capital of the Company was reduced on the basis of a decision by the AGM.
The source of the dividend payout is 2016 profit. The record date (i.e. the day at the end of which shares entitled to a dividend are registered at accounts of the entitled persons held by the settlement systems of Centrální depozitář cenných papírů, a.s, Krajowy Depozyt
33
Papierów Wartościowych Spółka Akcyjna or by other respective settlement systems) was set to 13 October 2017 and the dividend payment date was set to 26 October 2017.
Segment information
The IFRS 8 standard requires operating segments to be identified on the basis of internal reports about components of the Group that are regularly reviewed by the chief operating decision-maker in order to allocate resources to the segments and to assess their performance. In accordance with IFRS 8, the Group identified one operating segment, the production of nonwoven textiles.
Material events subsequent to the end of the interim period
On 15 July 2017, company PEGAS-NT a.s. ceased to exist as a result of a merger with company PEGAS NONWOVENS s.r.o. As the successor company, PEGAS NONWOVENS s.r.o. acquired as a result of the merger the assets of the ceasing company PEGAS-NT a.s. The record date of the merger was 1 January 2017. PEGAS-NT a.s. was deleted from the Commercial Register on 15 July 2017.
The management of the Group is not aware of any other events that occurred subsequent to the end of the interim period, which would have a significant effect on the consolidated financial statements as at 30 June 2017.
Disclosures on changes in the composition and consolidation of the entity
There were changes in the composition and consolidation of the entity during the reporting period ended relative to the compared period. In accordance with the decision of the Board of Directors, announced 16 June 2016, PEGAS has established a subsidiary in the Republic of South Africa under the business name PEGAS NONWOVENS RSA (PTY) LTD. The subsidiary was registered with validity to 11 July 2016 and is under 100% ownership of the PEGAS Group.
Information about the fair value of financial instruments
During the period of the first six months of this year no changes occurred in the valuation methodology for financial instruments.
Interest rate swaps
As at 30 June 2017, the Company held no open interest rate swaps.
Currency forward contracts
As at 30 June 2017, the Company held no open currency forward contracts.
34
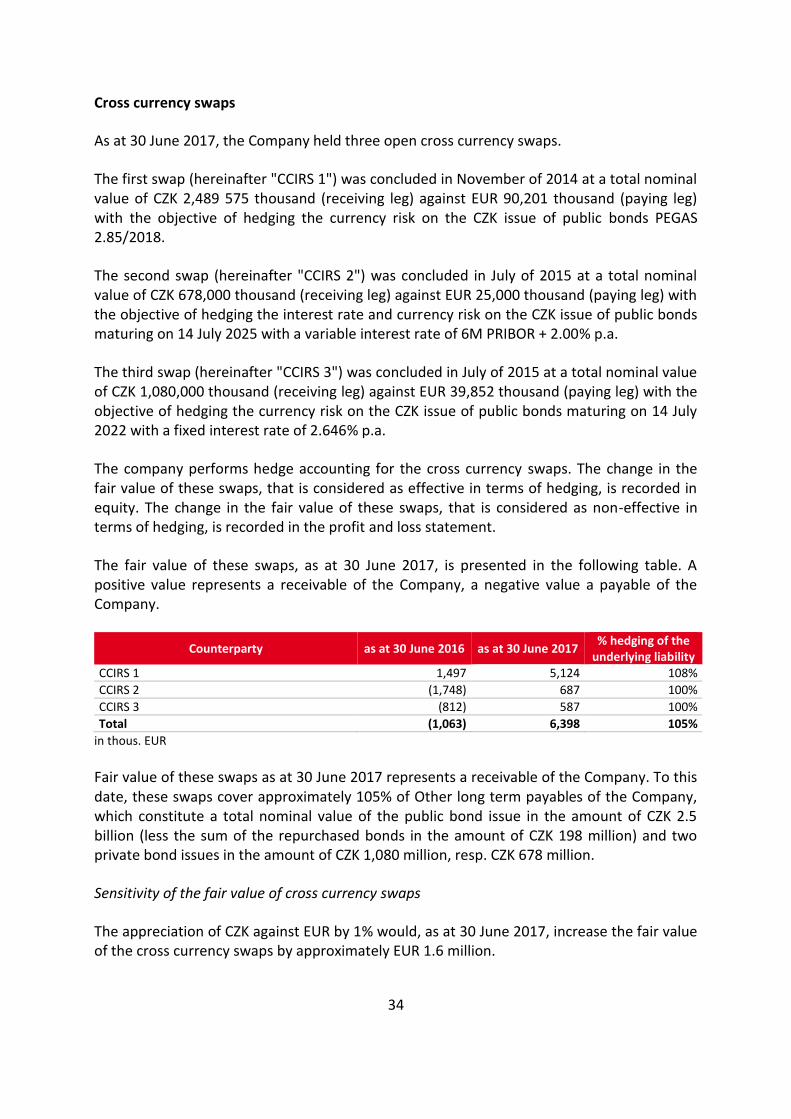
Cross currency swaps
As at 30 June 2017, the Company held three open cross currency swaps.
The first swap (hereinafter "CCIRS 1") was concluded in November of 2014 at a total nominal value of CZK 2,489 575 thousand (receiving leg) against EUR 90,201 thousand (paying leg) with the objective of hedging the currency risk on the CZK issue of public bonds PEGAS 2.85/2018.
The second swap (hereinafter "CCIRS 2") was concluded in July of 2015 at a total nominal value of CZK 678,000 thousand (receiving leg) against EUR 25,000 thousand (paying leg) with the objective of hedging the interest rate and currency risk on the CZK issue of public bonds maturing on 14 July 2025 with a variable interest rate of 6M PRIBOR + 2.00% p.a.
The third swap (hereinafter "CCIRS 3") was concluded in July of 2015 at a total nominal value of CZK 1,080,000 thousand (receiving leg) against EUR 39,852 thousand (paying leg) with the objective of hedging the currency risk on the CZK issue of public bonds maturing on 14 July 2022 with a fixed interest rate of 2.646% p.a.
The company performs hedge accounting for the cross currency swaps. The change in the fair value of these swaps, that is considered as effective in terms of hedging, is recorded in equity. The change in the fair value of these swaps, that is considered as non-effective in terms of hedging, is recorded in the profit and loss statement.
The fair value of these swaps, as at 30 June 2017, is presented in the following table. A positive value represents a receivable of the Company, a negative value a payable of the Company.
Counterparty as at 30 June 2016 as at 30 June 2017 % hedging of the
underlying liability CCIRS 1 1,497 5,124 108%
CCIRS 2 (1,748) 687 100%
CCIRS 3 (812) 587 100%
Total (1,063) 6,398 105%
in thous. EUR
Fair value of these swaps as at 30 June 2017 represents a receivable of the Company. To this date, these swaps cover approximately 105% of Other long term payables of the Company, which constitute a total nominal value of the public bond issue in the amount of CZK 2.5 billion (less the sum of the repurchased bonds in the amount of CZK 198 million) and two private bond issues in the amount of CZK 1,080 million, resp. CZK 678 million.
Sensitivity of the fair value of cross currency swaps
The appreciation of CZK against EUR by 1% would, as at 30 June 2017, increase the fair value of the cross currency swaps by approximately EUR 1.6 million.
35
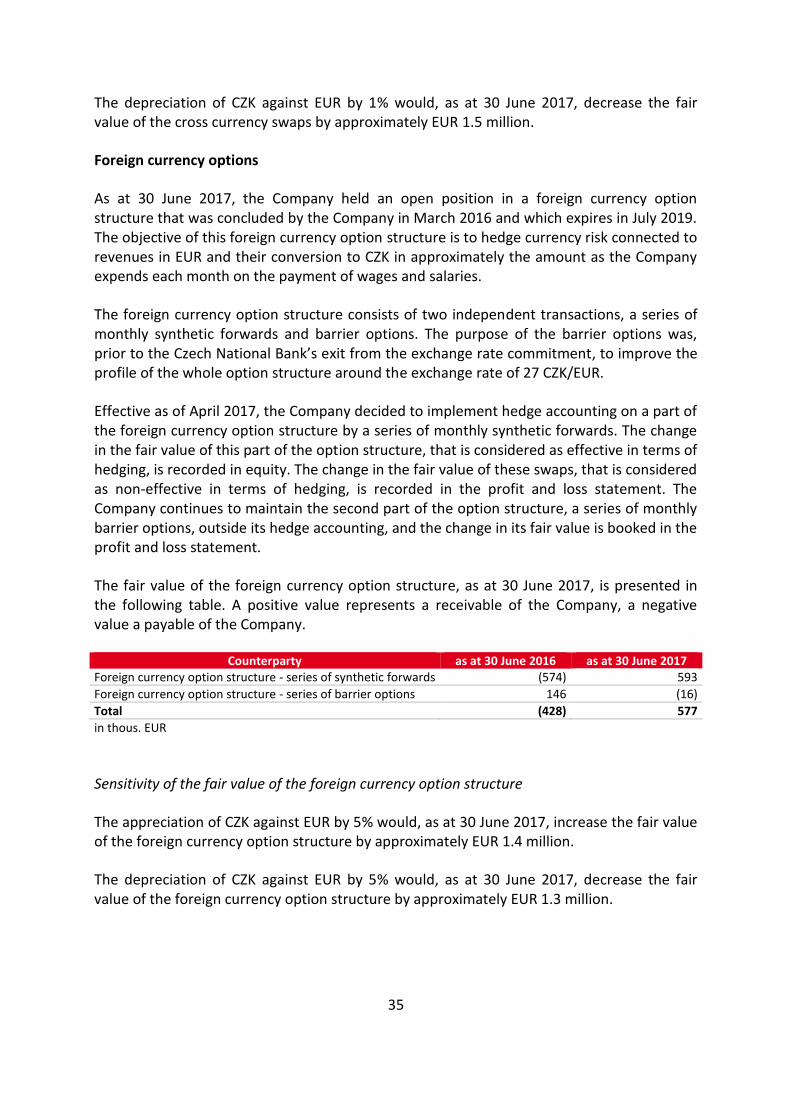
The depreciation of CZK against EUR by 1% would, as at 30 June 2017, decrease the fair value of the cross currency swaps by approximately EUR 1.5 million.
Foreign currency options
As at 30 June 2017, the Company held an open position in a foreign currency option structure that was concluded by the Company in March 2016 and which expires in July 2019. The objective of this foreign currency option structure is to hedge currency risk connected to revenues in EUR and their conversion to CZK in approximately the amount as the Company expends each month on the payment of wages and salaries.
The foreign currency option structure consists of two independent transactions, a series of monthly synthetic forwards and barrier options. The purpose of the barrier options was, prior to the Czech National Bank’s exit from the exchange rate commitment, to improve the profile of the whole option structure around the exchange rate of 27 CZK/EUR.
Effective as of April 2017, the Company decided to implement hedge accounting on a part of the foreign currency option structure by a series of monthly synthetic forwards. The change in the fair value of this part of the option structure, that is considered as effective in terms of hedging, is recorded in equity. The change in the fair value of these swaps, that is considered as non-effective in terms of hedging, is recorded in the profit and loss statement. The Company continues to maintain the second part of the option structure, a series of monthly barrier options, outside its hedge accounting, and the change in its fair value is booked in the profit and loss statement.
The fair value of the foreign currency option structure, as at 30 June 2017, is presented in the following table. A positive value represents a receivable of the Company, a negative value a payable of the Company.
Counterparty as at 30 June 2016 as at 30 June 2017 Foreign currency option structure - series of synthetic forwards (574) 593
Foreign currency option structure - series of barrier options 146 (16)
Total (428) 577
in thous. EUR
Sensitivity of the fair value of the foreign currency option structure
The appreciation of CZK against EUR by 5% would, as at 30 June 2017, increase the fair value of the foreign currency option structure by approximately EUR 1.4 million.
The depreciation of CZK against EUR by 5% would, as at 30 June 2017, decrease the fair value of the foreign currency option structure by approximately EUR 1.3 million.
36
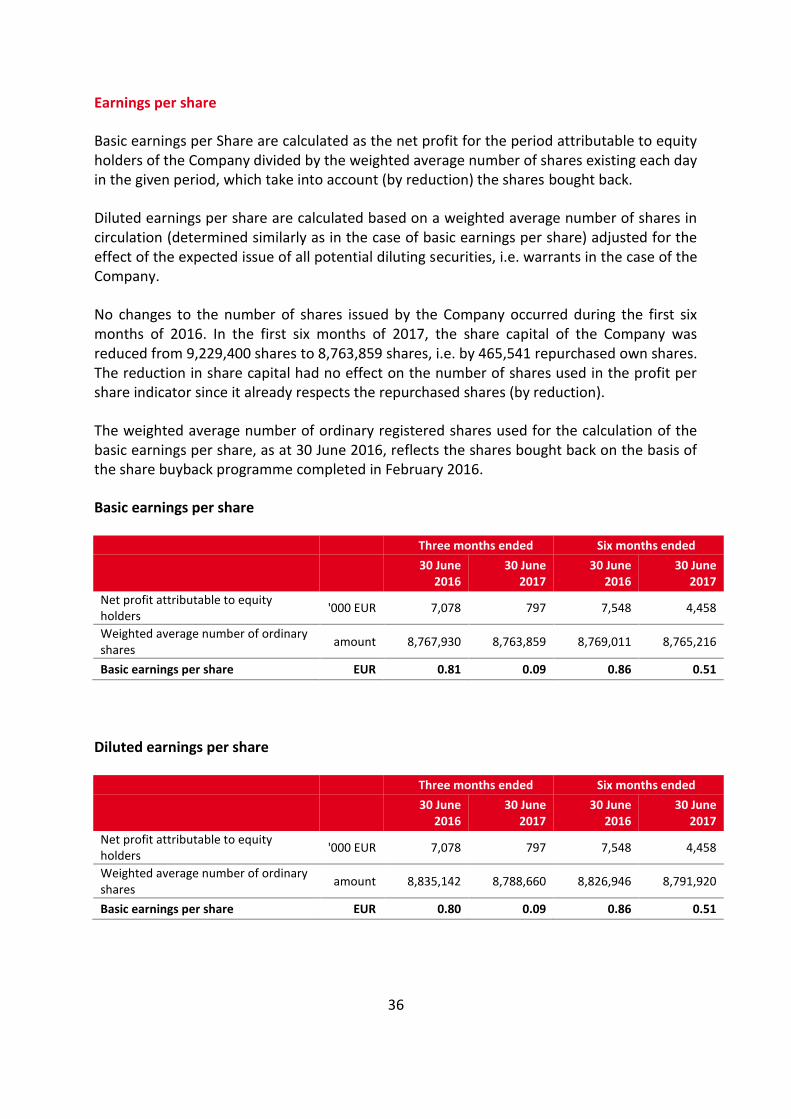
Earnings per share
Basic earnings per Share are calculated as the net profit for the period attributable to equity holders of the Company divided by the weighted average number of shares existing each day in the given period, which take into account (by reduction) the shares bought back.
Diluted earnings per share are calculated based on a weighted average number of shares in circulation (determined similarly as in the case of basic earnings per share) adjusted for the effect of the expected issue of all potential diluting securities, i.e. warrants in the case of the Company.
No changes to the number of shares issued by the Company occurred during the first six months of 2016. In the first six months of 2017, the share capital of the Company was reduced from 9,229,400 shares to 8,763,859 shares, i.e. by 465,541 repurchased own shares. The reduction in share capital had no effect on the number of shares used in the profit per share indicator since it already respects the repurchased shares (by reduction).
The weighted average number of ordinary registered shares used for the calculation of the basic earnings per share, as at 30 June 2016, reflects the shares bought back on the basis of the share buyback programme completed in February 2016.
Basic earnings per share
Three months ended Six months ended
30 June
2016 30 June
2017 30 June
2016 30 June
2017
Net profit attributable to equity holders
'000 EUR 7,078 797 7,548 4,458
Weighted average number of ordinary shares
amount 8,767,930 8,763,859 8,769,011 8,765,216
Basic earnings per share EUR 0.81 0.09 0.86 0.51
Diluted earnings per share
Three months ended Six months ended
30 June
2016 30 June
2017 30 June
2016 30 June
2017
Net profit attributable to equity holders
'000 EUR 7,078 797 7,548 4,458
Weighted average number of ordinary shares
amount 8,835,142 8,788,660 8,826,946 8,791,920
Basic earnings per share EUR 0.80 0.09 0.86 0.51
37
Related party transactions
Except for the information above there were no other new transactions between the Group and the executive managers or the non-executive directors concluded in the first six months of 2017.
Approval of the interim financial statements
The interim financial statements were approved by the Company's Board of Directors on 23 August 2017.
Marek Modecki Chairman of the Board of Directors
PEGAS NONWOVENS SA
František Řezáč Member of the Board of Directors
PEGAS NONWOVENS SA
38
Declaration
Marek Modecki, Chairman of the Board of Directors of PEGAS NONWOVENS SA
František Řezáč, Member of the Board of PEGAS NONWOVENS SA,
hereby declare that, to the best of their knowledge, the financial statements prepared in accordance with the applicable set of accounting standards give a true view of assets, liabilities, financial position and profit or loss of the Company and the undertakings included in the consolidation taken as a whole and that the interim management report includes a fair view of the development and performance of the business and the position of the Company and the undertakings included in the consolidation taken as a whole, together with a description of the principal risks and uncertainties they face.
23 August 2017
Marek Modecki Chairman of the Board of Directors
PEGAS NONWOVENS SA
František Řezáč Member of the Board of Directors
PEGAS NONWOVENS SA

39
Contacts
PR/IR Officer
Pegas Nonwovens Tel.: +420 515 262 408 GSM: +420 727 964 218 [email protected]
40
Glossary
6th October City – is a satellite city near Cairo, Egypt. The city has a population of approximately half a million people and many companies have their regional headquarters located there.
BCPP (PSE) – Prague Stock Exchange a regulated market for securities in the Czech Republic.
Bi-Component Fibre (Bi-Co) – synthetic textile fibre consisting of two or more basic components (polymers). The typical cross sections of fibres are, for example, side by side, core and sheath (produced by PEGAS), islands in the sea, etc.
Bučovice – a town in Moravia in the Vyškov District with a population of approximately 6,500 people. PEGAS operates three production lines here.
Clearstream Bank - Clearstream is a leading European supplier of post-trading services. It is a subsidiary of Deutsche Börse. Clearstream International was formed in January 2000 through the merger of Cedel International and Deutsche Börse Clearing.
EDANA – European Disposables and Nonwovens Association is the European Trade Association for the nonwovens and hygiene products converters industries, with around 200 member companies in 28 countries.
EGAP – Export Guarantee and Insurance Corporation. (EGAP) established in June 1992 as a national insurer of loans with a focus on insuring export loans against territorial and commercially uninsurable commercial risks connected with the export of goods and services from the Czech Republic. EGAP became a part of the government's export assistance system and provides insurance services to all exporters of Czech goods, services and investments.
EMEA – Europe, Middle East and Africa.
IFRS – International Financial Reporting Standards.
IPO – Initial Public Offering.
IRS – Interest Rate Swap. Financial instrument for hedging interest rate risk.
Meltblown Fabric – Textile produced using the meltblown process.
Nonwoven Textile – A manufactured sheet, web or bat of directionally or randomly oriented fibres, bonded by friction, and/or cohesion and/or adhesion, excluding papers and products which are woven, knitted, tufted or stitchbonded incorporating binding yarns or filaments, or felted by wet milling, whether or not additionally needled.
41
Polymer – Substance composed of molecules with large molecular mass composed of repeating structural units, or monomers, connected by covalent chemical bonds, i.e. a plastic.
Polypropylene/Polyethylene – Thermoplastic polymers consisting of long chains of monomers (propylene, ethylene). These polymers are naturally hydrophobic, resistant to many chemical solvents, bases and acids.
Přímětice – Formerly an independent municipality, currently a suburb of Znojmo. PEGAS operates six production lines here.
PX – Official index of blue chip stocks of the Prague Stock Exchange.
Reicofil – Leading nonwoven machinery manufacturer.
Regranulation – Method for recycling scrap textile into granulate, which can then be fully reused in the manufacturing process.
Spunbond Textile – Textile produced by spunbond/spunmelt process.
Spunmelt Process – Technological process of producing nonwovens. Hot molten polymer is forced through spinnerets to produce continuous filaments drawn by air to reach the required fibre diameter.
Meltblown Process – Technological process of producing nonwovens. Polymer is extruded into air gap nozzles and then blown in the form of very thin fibres (1-10 microns) on to a belt.
Warrants – securities that give the holder the right to purchase or sell a certain amount of securities at a certain price within a certain time frame.
WSE – Warsaw Stock Exchange, a regulated market for securities trading in Poland.
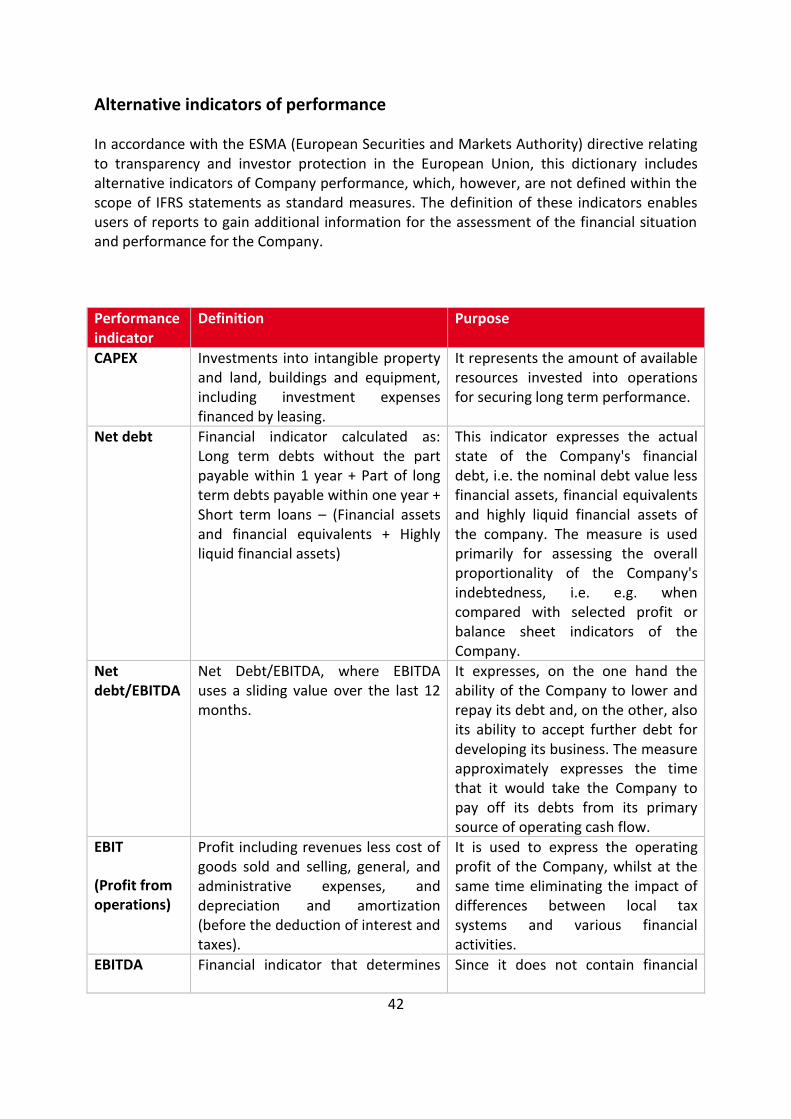
42
Alternative indicators of performance
In accordance with the ESMA (European Securities and Markets Authority) directive relating to transparency and investor protection in the European Union, this dictionary includes alternative indicators of Company performance, which, however, are not defined within the scope of IFRS statements as standard measures. The definition of these indicators enables users of reports to gain additional information for the assessment of the financial situation and performance for the Company.
Performance indicator
Definition Purpose
CAPEX Investments into intangible property and land, buildings and equipment, including investment expenses financed by leasing.
It represents the amount of available resources invested into operations for securing long term performance.
Net debt Financial indicator calculated as: Long term debts without the part payable within 1 year + Part of long term debts payable within one year + Short term loans – (Financial assets and financial equivalents + Highly liquid financial assets)
This indicator expresses the actual state of the Company's financial debt, i.e. the nominal debt value less financial assets, financial equivalents and highly liquid financial assets of the company. The measure is used primarily for assessing the overall proportionality of the Company's indebtedness, i.e. e.g. when compared with selected profit or balance sheet indicators of the Company.
Net debt/EBITDA
Net Debt/EBITDA, where EBITDA uses a sliding value over the last 12 months.
It expresses, on the one hand the ability of the Company to lower and repay its debt and, on the other, also its ability to accept further debt for developing its business. The measure approximately expresses the time that it would take the Company to pay off its debts from its primary source of operating cash flow.
EBIT
(Profit from operations)
Profit including revenues less cost of goods sold and selling, general, and administrative expenses, and depreciation and amortization (before the deduction of interest and taxes).
It is used to express the operating profit of the Company, whilst at the same time eliminating the impact of differences between local tax systems and various financial activities.
EBITDA Financial indicator that determines Since it does not contain financial
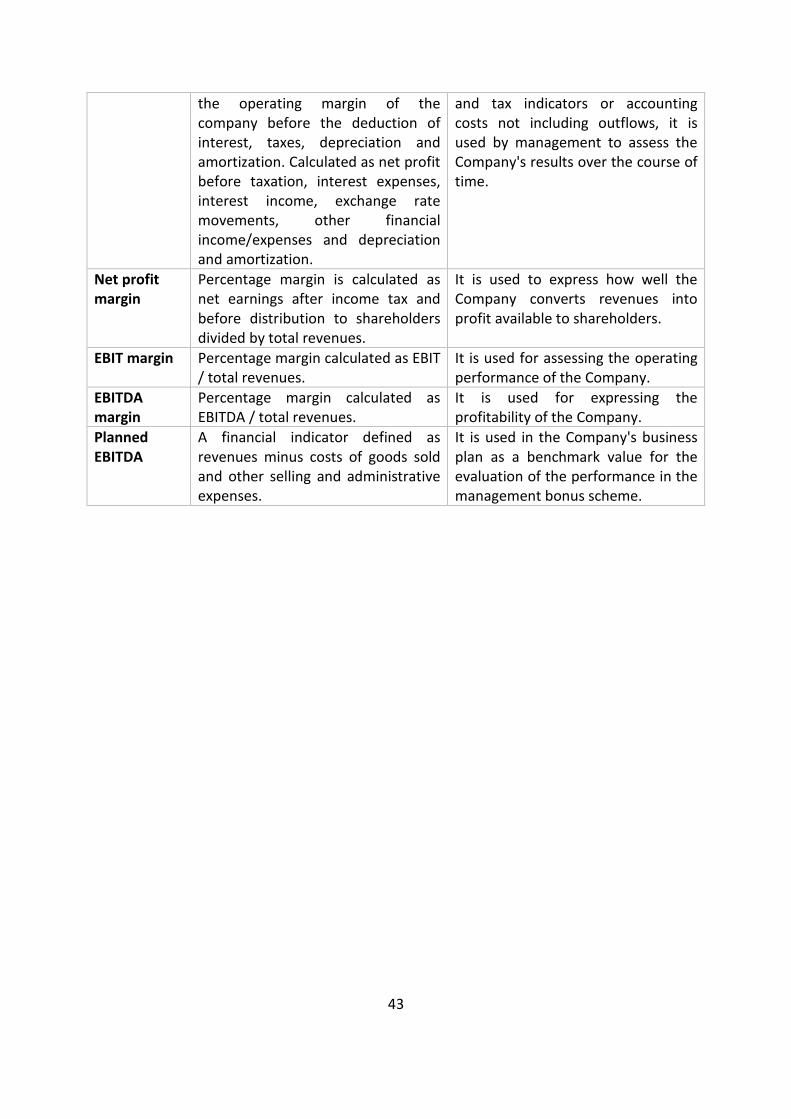
43
the operating margin of the company before the deduction of interest, taxes, depreciation and amortization. Calculated as net profit before taxation, interest expenses, interest income, exchange rate movements, other financial income/expenses and depreciation and amortization.
and tax indicators or accounting costs not including outflows, it is used by management to assess the Company's results over the course of time.
Net profit margin
Percentage margin is calculated as net earnings after income tax and before distribution to shareholders divided by total revenues.
It is used to express how well the Company converts revenues into profit available to shareholders.
EBIT margin Percentage margin calculated as EBIT / total revenues.
It is used for assessing the operating performance of the Company.
EBITDA margin
Percentage margin calculated as EBITDA / total revenues.
It is used for expressing the profitability of the Company.
Planned EBITDA
A financial indicator defined as revenues minus costs of goods sold and other selling and administrative expenses.
It is used in the Company's business plan as a benchmark value for the evaluation of the performance in the management bonus scheme.
44
Other information
Basic Information on the Company
Company Name PEGAS NONWOVENS SA Registered Office 68−70, boulevard de la Pétrusse L-2320 Luxembourg Luxembourg Tel: (+352) 26 12 31 44 Fax: (+352) 26 49 65 64 Registry and registration number Registered with the Luxembourg trade and companies register under number B 112.044 Incorporated 18 November 2005 under the name Pamplona PE Holdco 2 SA Jurisdiction Luxembourg
The holding company of PEGAS, PEGAS NONWOVENS SA, was incorporated in Luxembourg as a public limited liability company (société anonyme) for an unlimited duration on November 18, 2005 under the name Pamplona PE Holdco 2 SA and is registered with the Luxembourg trade and companies register under number B 112.044. The articles of incorporation of the Company have been published in the Mémorial, Recueil des Sociétés et Associations number C 440 of March 1, 2006. The seat of the Company is 68-70, boulevard de la Pétrusse, L-2320 Luxembourg, Luxembourg. The registered office and principal place of business of the main operating and trading company,
PEGAS NONWOVENS s.r.o., is at Přímětická 3623/86, 669 02 Znojmo, Czech Republic.
Company's scope of business (according to Article 3 of the Articles of Association of Company):
Company's scope of business:
a) to take participation and interests, in any form whatsoever, in any commercial, industrial, financial or other, Luxembourg or foreign entities;
b) acquire securities and rights through shares and participation, contribution, underwriting firm purchase or option, negotiation or in any other way and namely to acquire patents and licences, and other property, rights and interest in property as the Company shall deem fit, and generally to hold, manage, develop, sell or dispose of the same, in whole or in part;
c) to enter into, assist or participate in financial, commercial and other transactions, and to grant assistance of the holding Company, subsidiary, or fellow entity or any other form thereof associated in any way with the Company, or the said holding Company, subsidiary of follow subsidiary, in which the Company has a direct or indirect financial interest, any assistance as, for example, pledges, loans, advances or guarantees;
d) to borrow and raise money in any manner and to secure the repayment of any money borrowed;
e) to borrow funds and issue bonds and other securities;
f) to perform any operation which is directly or indirectly related to the aforementioned list.