Embed Size (px)
Citation preview

34 Pharmaceutical Technology Europe May 2018 PharmTech.com34 Pharmaceutical Technology May 2018 PharmTech .com
The working acceptance limits for acceptance values (AV) are determined using the critical values at, for example, 95% coverage over the corresponding AV distributions. However, validity of such limits needs to be elaborated.
Yada/s
hutterstock.c
om
Peer-Reviewed
Part one of this article introduced the concept of sam-pling distribution of acceptance value (AV) in uni-formity of dosage units (UDU) (1). With different sample sizes such as n = 10 and 30, their AV distri-
butions will be different, resulting in different critical AV values (i.e., the values at the locations covering 95% of the distributions that are equal to, for example, 12.5 and 9.1 for n = 10 and 30, respectively). Such critical values will be employed as AV working limits rather than using the single compendial limit of not more than (NMT) 15 (2).
Part two of this article described how to establish the corresponding acceptance limits for AV data for process validation batches as well as the typical characteristics of AV distributions. Such validation AV limits are, for example, 9.1, 8.2, 8.0, and 7.4 for n = 30, 60, 70, and 140, respectively. Finally, it discussed derivation of relevant constants for AV control charts used in, for example, annual product review (APR) and continued process verification (CPV) reports (3).
The applicability of such validation AV limits (Part two) will need to be elaborated because the author’s additional simulation study results reveal that there are some unfore-seen relationships amongst those quality attributes, such as probability of meeting content uniformity test (4, 5, 6) and acceptance value (AV) at various content uniformity (CU) means.
One of the criteria for determining the more proper limits is to take into account the percentage lot coverage (7) in ad-dition to such a 95% coverage. This is to guarantee that the high lot conforming rate is also achieved even at different CU means. In this part, those AV limits for routine batches (i.e., 12.5 and 9.1, n = 10 and 30, respectively) are demon-strated to be adequately justified at various CU means.
CU mean vs. CU probability vs. AV limit relationshipWhen analyzing the AV formula AV = M x +ks , AV value is a function of sample mean ( x ), sample standard deviation (s), and reference value (M). The most unpredictable out-
Establishing Acceptance Limits for Uniformity of Dosage Units: Part 3Pramote Cholayudth
Submitted: February 22, 2018Accepted: March 27, 2018 contin. on page 38
38 Pharmaceutical Technology Europe May 2018 PharmTech.com38 Pharmaceutical Technology May 2018 PharmTech .com
Peer-Reviewed
come of the formula is subject to the conditional deter-mination of the reference value associated with the case whether or not the target is more than 101.5% label claim (LC) and the subcase that the sample mean is below 98.5, above 101.5% LC, or in between.
In the simulation study using MS Excel program (.xlsm, not .xlsx) by the author, Figures 1–2 are two of the unforeseen examples that illustrate such an unpredict-ability where the CU probability results will sharply drop at means approximately 98.5 and 101.5% LC when the corresponding AV data are fixed at their working limits (e.g., 9.1, n = 30, and 8.2, n = 60).
For n = 60 or greater, it is fortunate that the mini-mum probability is much higher than 90% (98.27%). This implies that using such validation limits (introduced in Part two) needs to be careful because they are valid only when, for example n = 30, the means are between 99.5 and 100.5% LC, less than 97 and higher than 103% LC.
Such a validity is directly related to the probability results at not less than (NLT) 90%. The probability pit-falls at 98.5 and 101.5% LC locations in the two figures (and even in the others) will make the readers imagine how such a rigid formula (AV) affects the reliability of this particular parameter (i.e., AV). That is, the lower magnitude of AV data does not always correlate with the higher degree of meeting UDU as illustrated in Figures 3–6 where the CU mean is obviously the inf luencing factor.
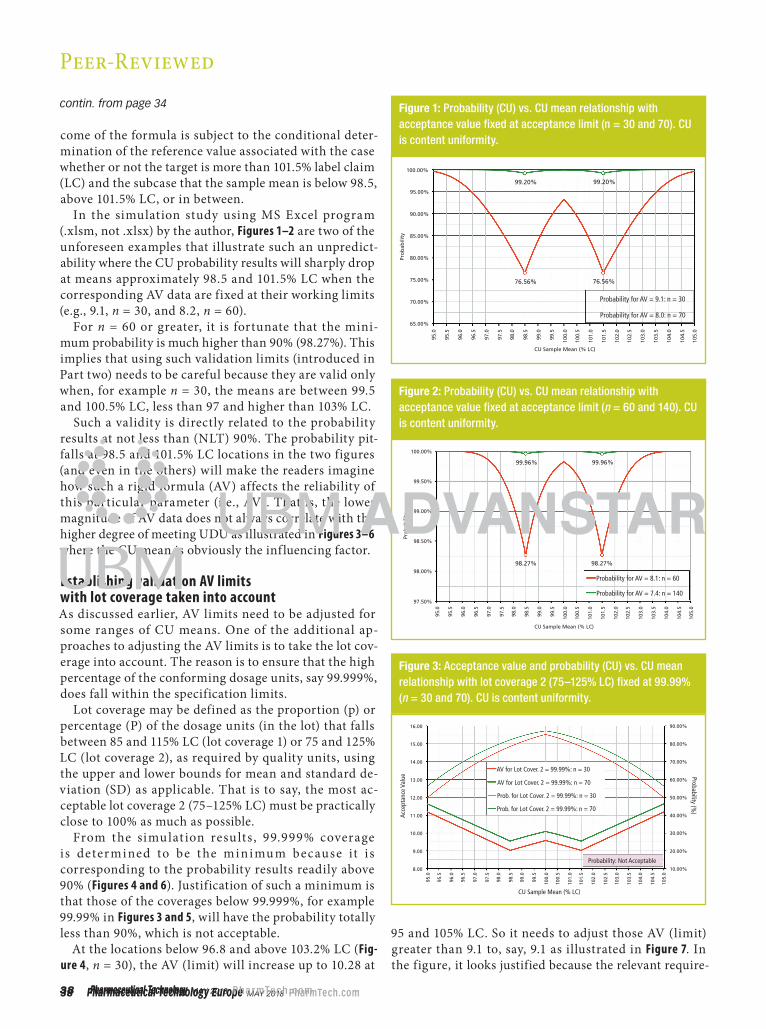
Establishing validation AV limits with lot coverage taken into accountAs discussed earlier, AV limits need to be adjusted for some ranges of CU means. One of the additional ap-proaches to adjusting the AV limits is to take the lot cov-erage into account. The reason is to ensure that the high percentage of the conforming dosage units, say 99.999%, does fall within the specification limits.
Lot coverage may be defined as the proportion (p) or percentage (P) of the dosage units (in the lot) that falls between 85 and 115% LC (lot coverage 1) or 75 and 125% LC (lot coverage 2), as required by quality units, using the upper and lower bounds for mean and standard de-viation (SD) as applicable. That is to say, the most ac-ceptable lot coverage 2 (75–125% LC) must be practically close to 100% as much as possible.
From the simulat ion results , 99.999% coverage is determined to be t he minimum because it i s corresponding to the probability results readily above 90% (Figures 4 and 6). Justification of such a minimum is that those of the coverages below 99.999%, for example 99.99% in Figures 3 and 5, will have the probability totally less than 90%, which is not acceptable.
At the locations below 96.8 and above 103.2% LC (Fig-ure 4, n = 30), the AV (limit) will increase up to 10.28 at
95 and 105% LC. So it needs to adjust those AV (limit) greater than 9.1 to, say, 9.1 as illustrated in Figure 7. In the figure, it looks justified because the relevant require-
Figure 1: Probability (CU) vs. CU mean relationship with acceptance value fixed at acceptance limit (n = 30 and 70). CU is content uniformity.
100.00%
99.20% 99.20%
76.56%
Probability for AV = 9.1: n = 30
Probability for AV = 8.0: n = 70
76.56%
95.00%
90.00%
85.00%
80.00%Pro
bab
ility
75.00%
70.00%
65.00%
CU Sample Mean (% LC)
95.0
95.5
96.0
96.5
97.0
97.5
98.0
98.5
99.0
99.5
100.
0
100.
5
101.
0
101.
5
102.
0
102.
5
103.
0
103.
5
104.
0
104.
5
105.
0
Figure 2: Probability (CU) vs. CU mean relationship with acceptance value fixed at acceptance limit (n = 60 and 140). CU is content uniformity.
100.00%
99.96% 99.96%
98.27%
Probability for AV = 8.1: n = 60
Probability for AV = 7.4: n = 140
98.27%
99.50%
99.00%
98.50%
Pro
bab
ility
98.00%
97.50%
CU Sample Mean (% LC)
95.0
95.5
96.0
96.5
97.0
97.5
98.0
98.5
99.0
99.5
100.
0
100.
5
101.
0
101.
5
102.
0
102.
5
103.
0
103.
5
104.
0
104.
5
105.
0
Figure 3: Acceptance value and probability (CU) vs. CU mean relationship with lot coverage 2 (75–125% LC) fixed at 99.99% (n = 30 and 70). CU is content uniformity.
90.00%
AV for Lot Cover. 2 = 99.99%: n = 30
AV for Lot Cover. 2 = 99.99%: n = 70
Prob. for Lot Cover. 2 = 99.99%: n = 30
Prob. for Lot Cover. 2 = 99.99%: n = 70
Probability: Not Acceptable
Probability (%)
80.00%
70.00%
60.00%
Acce
ptan
ce V
alue
50.00%
40.00%
30.00%
20.00%
10.00%
16.00
15.00
14.00
13.00
12.00
11.00
10.00
9.00
8.00
CU Sample Mean (% LC)
95.0
95.5
96.0
96.5
97.0
97.5
98.0
98.5
99.0
99.5
100.0
100.5
101.0
101.5
102.0
102.5
103.0
103.5
104.0
104.5
105.0
contin. from page 34

40 Pharmaceutical Technology Europe May 2018 PharmTech.com40 Pharmaceutical Technology May 2018 PharmTech .com
ments (for AV, lot coverage 2) are properly met. For larger sample sizes (n = 60, 70, and 140), the AV limits seem to be practically and already acceptable.
Because AV data do not always correlate in magnitude with degree of meeting the UDU, the additional criteria (i.e.,
lot coverage) are essentially required as follows: •AV limits introduced in Part two of this article can be
used directly (n = 30, 60, 70, and 140)•All the following additional criteria are to be met:
■ The probability results are NTL 90%
Peer-Reviewed
Figure 4: Acceptance value and probability (CU) vs. CU mean relationship with lot coverage 2 (75–125% LC) fixed at 99.999% (n = 30 and 70). CU is content uniformity.
Figure 7: Adjusted acceptance value and probability (CU) vs. CU mean relationship with lot coverage 2 (75–125% LC) fixed at NLT 99.999% (n = 30 and 70). CU is content uniformity.
Acce
ptan
ce V
alue
12.50
12.00
11.50
11.00
10.28
96.8, 9.09
7.96
8.46
7.96
103.2, 9.09
10.2810.50
10.00
9.50
9.00
8.50
8.00
7.50
95.0
95.5
96.0
96.5
97.0
97.5
98.0
98.5
99.0
99.5
100.
0
100.
5
101.
0
101.
5
102.
0
102.
5
103.
0
103.
5
104.
0
104.
5
105.
0
100.00%
Probability (%)
95.00%
90.00%
85.00%
80.00%
75.00%
70.00%
65.00%
60.00%
55.00%
50.00%
CU Sample Mean (% LC)
Probability: Acceptable
AV for Lot Cover. 2 = 99.999%: n = 30
AV for Lot Cover. 2 = 99.999%: n = 70
Prob. for Lot Cover. 2 = 99.999%: n = 70
Prob. for Lot Cover. 2 = 99.999%: n = 30
100.00%
AV for Lot Cover. 2 > 99.999%: n = 70
Prob. for Lot Cover. 2 99.999%: n = 30
Prob. for Lot Cover. 2 > 99.999%: n = 70
Probability (%)
95.00%
90.00%
85.00%
Acce
ptan
ce V
alue 80.00%
75.00%
70.00%
65.00%
60.00%
55.00%
50.00%
12.5099.20%
96.8, 92.96%
96.8, 9.09%
8.46
7.96 7.96
103.2, 9.09
103.2, 92.96%
99.20%
98.40%12.00
11.50
11.00
10.50
10.00
9.50
9.00
8.50
8.00
7.50
CU Sample Mean (% LC)
95.0
95.5
96.0
96.5
97.0
97.5
98.0
98.5
99.0
99.5
100.
0
100.
5
101.
0
101.
5
102.
0
102.
5
103.
0
103.
5
104.
0
104.
5
105.
0
Adjusted AV for Lot Cover. 2 99.999%: n = 30 >
>
Figure 5: Acceptance value and probability (CU) vs. CU mean relationship with lot coverage 2 (75–125% LC) fixed at 99.99% (n = 60 and 140). CU is content uniformity.
Figure 8: Another view of distributions for lot coverage 2 and probability.
90.00%
AV for Lot Cover. 2 = 99.99%: n = 60
AV for Lot Cover. 2 = 99.99%: n = 140
Prob. for Lot Cover. 2 = 99.99%: n = 60
Prob. for Lot Cover. 2 = 99.99%: n = 140
Probability: Not Acceptable
Probability (%)
80.00%
70.00%
60.00%
Acc
epta
nce
Valu
e
50.00%
40.00%
30.00%
20.00%
10.00%
16.00
15.00
14.00
13.00
12.00
11.00
10.00
9.00
8.00
CU Sample Mean (% LC)
95.0
95.5
96.0
96.5
97.0
97.5
98.0
98.5
99.0
99.5
100.0
100.5
101.0
101.5
102.0
102.5
103.0
103.5
104.0
104.5
105.0
100.00%
Lot Coverage 2 for Adjusted AV: n = 30
Lot Coverage 2 for AV = 8.0: n = 70
Prob. for Lot Cover. 2 99.999%: n = 30
Prob. for Lot Cover. 2 > 99.999%: n = 70
Probability (%)
95.00%
90.00%
85.00%
Lot C
over
age
2
80.00%
75.00%
70.00%
65.00%
60.00%
55.00%
50.00%
100.0010%
96.8, 99.999%
>99.999% >99.999%
103.2, 99.999%
99.20%
96.8, 92.96% 103.2, 92.96%
99.20%
98.40%
100.0005%
100.0000%
99.9995%
99.9990%
99.9985%
99.9980%
99.9975%
CU Sample Mean (% LC)
95.0
95.5
96.0
96.5
97.0
97.5
98.0
98.5
99.0
99.5
100.
0
100.
5
101.
0
101.
5
102.
0
102.
5
103.
0
103.
5
104.
0
104.
5
105.
0
>
Figure 6: Acceptance value and probability (CU) vs. CU mean relationship with lot coverage 2 (75–125% LC) fixed at 99.999% (n = 60 and 140). CU is content uniformity.
100.00%
AV for Lot Cover. 2 = 99.999%: n = 60
AV for Lot Cover. 2 = 99.999%: n = 140
Prob. for Lot Cover. 2 = 99.999%: n = 60
Prob. for Lot Cover. 2 = 99.999%: n = 140
Probability (%)
95.00%
90.00%
85.00%
Acce
ptan
ce V
alue
80.00%
75.00%
70.00%
65.00%
60.00%
55.00%
50.00%
12.50
12.00
11.50
11.00
10.50
10.00
9.50
9.00
8.50
7.50
8.00
CU Sample Mean (% LC)
Probability: Acceptable
95.0
95.5
96.0
96.5
97.0
97.5
98.0
98.5
99.0
99.5
100.0
100.5
101.0
101.5
102.0
102.5
103.0
103.5
104.0
104.5
105.0
Figure 9: Lot coverage 1 and 2 relationship (n = 30 and 70).
100.75%
Lot Coverage 2 for Adjusted AV: n = 30
Lot Coverage 2 for AV = 8.0: n = 70
Cov. 1 for Lot Cover. 2 99.999%: n = 30
Cov. 1 for Lot Cover. 2 > 99.999%: n = 70
Lot Coverage 1 (%)
100.25%
99.75%
99.25%
Lot C
over
age
2
98.75%
98.25%
97.75%
97.25%
96.75%
100.000%
>99.999% >99.999%
103.2, 99.999%96.8, 99.999%
99.32% 99.32%
96.8, 92.40% 103.2, 98.40%
99.999%
99.998%
99.997%
99.996%
99.995%
99.994%
99.993%
99.992%
CU Sample Mean (% LC)
95.0
95.5
96.0
96.5
97.0
97.5
98.0
98.5
99.0
99.5
100.
0
100.
5
101.
0
101.
5
102.
0
102.
5
103.
0
103.
5
104.
0
104.
5
105.
0
>

Pharmaceutical Technology Europe May 2018 41Pharmaceutical Technology May 2018 41
■ Lot coverage 2 (75–125% LC) is NTL 99.999%.It is found that those parameters only for sample n = 30
need to be adjusted as illustrated in Figures 7–9. In the fig-ures, those for n = 70 remain the same, i.e., no adjustment, 99.20% probability (green color), for example, is still exis-tent. Figure 10 illustrates the distributions of the lot cover-age 2 results where the minimum values (pitfalls) are still higher than 99.999% especially for n = 140.
Table I presents derivations of the working AV limits. In the table, all the AV results (reproduced from the figures) at mean locations throughout 95–105% LC need to meet the AV limits in the sky blue row, for example, 9.1 and 8.0 for n = 30 and 70, respectively. In the table, this par-ticular set of acceptance criteria is intended for processes with target not more than 101.5% LC (mostly 100% LC). However, it may be applied to those processes with target greater than 101.5% LC as far as the additional acceptance criteria are met.
Figures 11–12 illustrate the the relationship between critical AVs and CU “lot” means (note: not “sample” means). The representative acceptance limits are those AVs at 100% LC such as 12.5 (n = 10), 9.1 (n = 30), and 8.0 (n = 70) (assuming that sample mean results are about 100% LC most of the time if target is 100% LC) i.e., still confirming justification of those AV limits introduced in parts one [for routine batches] and two [for valida-tion batches].
The most unexpected features are those illustrated in Fig-ures 13–14 where the probability distributions will remark-ably drop at means 98.5 and 101.5% LC for both n = 30 and 70, respectively. Note that all the distributions in the four figures (Figures 11-14) are based on lot CpK 1.33.
Application summary on validation acceptance criteriaAcceptance criteria 1 (expanded), 2, and 3 may be summarized as in Table II. The objectives of acceptance criteria 2 and 3 are to demonstrate that lot CpK on average is NTL 1.33 (criterion 2, i.e., qualitatively) and estimate the true value of lot CpK on average (criterion 3, i.e., quantitatively) (2, 3, 8, 9).
Figure 10: Lot coverage 2 distributions (n = 60 and 140).
Lot Coverage 2 for AV = 8.2: n = 60
Lot Coverage 2 for AV = 7.4: n = 140
Lot C
over
age
2
>>99.999% >>99.999%
>99.999%>99.999%
100.0000%
99.9998%
99.9996%
99.9994%
99.9992%
99.9990%
99.9988%
CU Sample Mean (% LC)
95.0
95.5
96.0
96.5
97.0
97.5
98.0
98.5
99.0
99.5
100.0
100.5
101.0
101.5
102.0
102.5
103.0
103.5
104.0
104.5
105.0
Table I: Table for justification of AV acceptance limits for validation batches.
AV acceptance limits (based on lot coverage across 75–125% LC).
Mean ranges Mean ranges
AV ranges: validation batches (90% CI, 99.999% coverage)
Sampling plan N ≥ 70 Sampling plan N ≥ 140
n = 30 n = 70 n = 60 n = 140
100.0 → 98.6 100.0 → 101.4 8.46 → 8.00 8.89 → 8.43 8.84 → 8.37 9.02 → 8.59
98.5 101.5 7.96* 8.40* 8.34* 8.55*
98.4 → 95.0 101.6 → 105.0 8.03 → 10.28** 8.46 → 10.65** 8.40 → 10.60** 8.62 → 10.79**
Adjusted to (
→
)
→ → → →
Adjusted validation AV limits 9.1 8.0 8.2 7.4
Minimum CpK1 (85-115% LC) 0.99 (≈ 1.00) 1.05 1.04 1.09
Minimum CpK2 (75-125% LC) 1.72 1.83 1.81 1.89
Minimum probability (CU, %) 92.96 99.20 98.27 99.96
Min. lot cover. 1 (85-115%LC) (%) 98.40 99.32 99.13 99.72
Min. lot cover. 2 (75-125%LC) (%) 99.999 > 99.999 > 99.999 > 99.999
References Figures 1, 4, 7, 8, and 9 Figures 2, 6, and 10
* Minimum, ** Maximum CpK1 and CpK2 are intended for data analysis only.
Additional acceptance criteria (at minimum): 1) Probability is not less than (NLT) 90% and 2) Lot coverage 2 (75–125%LC) is NLT 99.999%. This demonstrates that meeting AV limits only is not enough. AV is acceptance value.CI is confidence interval.CU is content uniformity.LC is label claim.

42 Pharmaceutical Technology Europe May 2018 PharmTech.com42 Pharmaceutical Technology May 2018 PharmTech .com
Peer-Reviewed
Figure 13: Critical AV, probability and CU mean relationship (n = 30). AV is acceptance value. CU is content uniformity.
11.00
95.0
95.5
96.0
96.5
97.0
98.0
98.5
99.0
99.5
100.
0
100.
5
101.
0
101.
5
102.
0
102.
5
103.
0
103.
5
104.
0
104.
5
105.
0
97.5
10.50
10.00
9.50
9.00
CU Lot Mean - AV / CU Sample Mean at Lot Mean - Probability (% LC)
Critical AV for Lot CpK = 1.33 (95% Coverage): n = 30
Probability for Corresponding Critical AV: n = 30
Note: The actual (simulated) coverages for critical AVs ataround 95 or 105% LC may be 2 or 3% less than 95%.
70.00%
80.00%
75.00%
85.00%
90.00%
100.00%
9.1
95.00%
Cri
tica
l AV
8.50
8.00
7.50
Prob
ability
7.00
6.50
Figure 11: Critical AV (95% coverage) and CU lot means relationship (n = 10, 30, and 70). AV is acceptance value. CU is content uniformity.
14.0012.5
9.1
8.0
Critical AV for Lot CpK = 1.33 (95% Coverage): n = 10
Critical AV for Lot CpK = 1.33 (95% Coverage): n = 30
Critical AV for Lot CpK = 1.33 (95% Coverage): n = 70
12.00
10.00
8.00
6.00
4.00
2.00
95.0
Cri
tica
l AV
95.5
96.0
96.5
97.0
97.5
98.0
98.5
99.0
99.5
100.
0
100.
5
101.
0
101.
5
102.
0
102.
5
103.
0
103.
5
104.
0
104.
5
105.
0
0.00
CU Lot Mean (% LC)
Figure 14: Critical AV, probability and CU mean relationship (n = 70). AV is acceptance value. CU is content uniformity.
95.0
95.5
96.0
96.5
97.0
98.0
98.5
99.0
99.5
100.
0
100.
5
101.
0
101.
5
102.
0
102.
5
103.
0
103.
5
104.
0
104.
5
105.
0
97.5
10.00
9.00
CU Lot Mean - AV / CU Sample Mean at Lot Mean - Probability (% LC)
Critical AV for Lot CpK = 1.33 (95% Coverage): n = 70
Probability for Corresponding Critical AV: n = 7099.70%
99.65%
99.60%
99.80%
99.75%
99.85%
99.90%
100.00%
8.0
99.95%
Cri
tica
l AV
8.00
Prob
ability
7.00
6.00
5.00
4.00
Note: The actual (simulated) coverages for critical AVs ataround 95 or 105% LC may be 2 or 3% less than 95%.
Figure 12: Critical AV (95% coverage) and CU lot means relationship (n = 60 and 140). AV is acceptance value. CU is content uniformity.
10.00
8.2
7.4
Critical AV for Lot CpK = 1.33 (95% Coverage): n = 60
Critical AV for Lot CpK = 1.33 (95% Coverage): n = 140
9.00
8.00
7.00
6.00
5.00
CU Lot Mean (% LC)
Cri
tica
l AV
4.00
3.00
2.00
1.00
0.00
95.0
95.5
96.0
96.5
97.0
97.5
98.0
98.5
99.0
99.5
100.
0
100.
5
101.
0
101.
5
102.
0
102.
5
103.
0
103.
5
104.
0
104.
5
105.
0
Table II: Validation acceptance criteria 1 (expanded), 2, and 3.
Sample sizes (n)
Acceptance criteria 1 (expanded)* Acceptance criteria 2 Acceptance criteria 3
AV limits (95% coverage)
Probability (%) Lot coverage 2 (%) AV average** limits Lot CpK on average
Sampling plan n ≥ 70
30 9.1NLT 90% NLT 99.999%
7.5NLT 1.33
70 8.0 7.0
Sampling plan n ≥ 140
60 8.2NLT 90% NLT 99.999%
7.1NLT 1.33
140 7.4 6.7
Additional acceptance criteria. **From 3 or more PV batches
*For practical guidance, the sample mean ranges for n = 30, 70, 60, and 140 are expected to be 97–103, 98–102, 98–102 and 98.5–101.5% LC, respectively. More is described in the discussion section. AV is acceptance value.NLT is not less than.PV is process validation.

Pharmaceutical Technology Europe May 2018 43Pharmaceutical Technology May 2018 43
DiscussionOne characteristic of the statistics-based acceptance lim-its is that different numerical limits are established for different sample sizes.
The most obvious example is the relative standard de-viation (RSD) limits for Uniformity of Dosage Units in the past (10), i.e., RSD ≤ 6.0 and 7.8% for n = 10 and 30, respectively (Figure 15), so that the AV acceptance limits are in the same manner (i.e., different AV limits for different sample sizes). The differences are due to the fact that dif-ferent patterns apply to corresponding distributions for different sample sizes.
The definition of AV formula AV = M x +ks is not natural. If the reference value M is replaced by the target T, which is the single value, and equal to 100% LC in most cases, then the new (natural) AV formula is AV = T x +ks .
Figures 16–17 illustrate the simulated natural AV distribu-tions with critical AV values (i.e., 13.5 and 9.8 for n = 10 and 30, respectively).
Such values are slightly increased (i.e., from 12.5 to 13.5, n = 10, and 9.1 to 9.8, n = 30). The two figures, however, are intended for “For Information Only” as the detail is out of the scope of this part.
In the compendial AV formula, the value of CU sample means ( x ) is also important. One should need to know the natural ranges for mean data (i.e., know if the data are statistically acceptable). For n = 10, for example, the tolerance range should be 15∕√10 = 4.74 (i.e., the means should fall within 95.26–104.74% LC, assuming that the true mean is 100% LC).
The number 15 is commonly used as the tolerance range for individual data (i.e., derived from 115 - 100
Figure 15: RSD distributions with critical RSD values: n = 10 and 30. RSD is relative standard deviation.
Figure 16: Simulated natural acceptance value (AV) distribution (red color; n = 10).
Freq
uenc
y
5.0%
4.5%
4.0%
3.5%
3.0%
2.5%
2.0%
1.5%
1.0%
0.5%
0.0%
2.0 3.0 4.0 5.0 6.0 7.0 8.0 9.0 10.0
11.0
12.0
13.0
14.0
15.0
16.0
17.0
18.0
19.0
20.0
21.0
12.5 13.5USP Limit = 15
Acceptance Value (AV)
AV Distribution (n = 10): Mean = 8.87, Coverage forAV 12.5 = 95.08% (about 95%), Lot CpK = 1.33<
Simulated Natural AV Distribution (n = 10: Mean =9.7, Coverage for AV 13.5 = 95.12 % (about 95%),Lot CpK = 1.33
<
Figure 17: Simulated natural acceptance value (AV) distribution (red color; n = 30).
Freq
uenc
y
5.0%
5.5%
4.5%
4.0%
3.5%
3.0%
2.5%
2.0%
1.5%
1.0%
0.5%
0.0%
4.0 4.5 5.0 5.5 6.0 6.5 7.0 7.5 8.0 8.5 9.0 9.5 10.0
10.5
11.0
11.5
12.0
12.5
13.0
14.0
13.5
14.5
15.0
9.1 9.8USP Limit = 15
Acceptance Value (AV)
AV Distribution (n = 30): Mean = 7.44, Coverage forAV 9.1 = 95.05% (about 95%), Lot CpK = 1.33<
Simulated Natural AV Distribution (n = 30: Mean =7.98, Coverage for AV 9.8 = 95.16% (about 95%),Lot CpK = 1.33
<CV Distribution, n = 10, Lot CV = 10%
CV Distribution, n = 30, Lot CV = 10%
SL: Significance Level
Frequency
6.0%
5.0%
4.0%
3.0%
2.0%
1.0%
0.0%
0.20% 2.20% 4.20% 6.20% 10.20% 12.20%
% CV (RSD)
6.0%, 5% SL7.8%, 5% SL
14.20% 16.20% 18.20%8.20%

44 Pharmaceutical Technology Europe May 2018 PharmTech.com44 Pharmaceutical Technology May 2018 PharmTech .com
Peer-Reviewedor 100 - 85 [- is minus]). If divided by the square root of sample size, the result of 15√n will become the cor-responding range for the mean (average) data for sample size n. If n = 30, the range is 15√30 = 2.74 (i.e., the means should fall within 97.26–102.74% LC, under the same assumption).
For n = 60, 70, and 140, the tolerance ranges will be 1.94, 1.79, and 1.28, respectively. However, the justified working ranges covering, say, the unavoidable errors (e.g., lot mean error) are essentially required. Suppose the following justification criteria are given:•Unit (individual) content range: ±15% of the lot
mean•Content mean (average) range: ±15√n% of the lot
mean (this criterion is in the same manner as stan-dard error of the mean σ∕√n)
•Lot mean (average) range: ±10% error of unit con-tent range (15), i.e., ±1.5% of the target (note: ±10% is just a guidance value. For practical implementa-tion, the value needs to be determined on the basis of process by process.).
For calculation example, if n = 10, the lower and upper CU mean limits are (100 ± 1.5) ± 15∕√10 (i.e., 93.76 and 106.24, or rounded to 94 and 106% LC).
Using the same criteria, the CU sample means for sample sizes n = 30, 60, 70, and 140 will have the work-ing ranges as follows: 96–104%, 96.5–103.5%, 97–103%, and 97.5–102.5% LC, respectively.
ConclusionFrom the simulation study, meeting the AV acceptance limits alone is not effective enough for product release. Additional acceptance criteria to form the expanded criteria are essentially required to provide complete confidence on uniformity of dosage units of the products.
In validation batches, meeting expanded acceptance criteria 1 (AV, probability, and lot coverage 2 intro-duced in Part three of this paper) will guarantee that NLT 99.999%% of the dosage units in each batch will fall within 75–125% of label claim (LC) while the corre-sponding lot coverage 1 is 98.40% (n = 30) at minimum as illustrated in Figure 9. For larger samples, such cover-age results will be greater, e.g., 99.32% (n = 70, Figure 9).
In routine batches, meeting the compendial accep-tance limits will imply only that NLT 90% of the dosage units in each batch will fall within 85–115% of LC. By definition of the working acceptance limits introduced in this article, meeting the limits will also guarantee that batch release operation is successful at NLT 95% of the time (95% coverage).
AV data of the historical batches, or even continued process verification batches, may be evaluated using AV chart (trend analysis) and can also be used to determine if the true CpK on average at NLT 1.33 is achieved.
References 1. USP General Chapter <905> “Uniformity of Dosage Units” (US
Pharmacopeial Convention, Rockville, MD, 2014). 2. P. Cholayudth, “Establishing Acceptance Limits for Uniformity
of Dosage Units: Part 1,” Pharmaceutical Technology, 40 (12) 34-43 (2016).
3. P. Cholayudth, “Establishing Acceptance Limits for Uniformity of Dosage Units: Part 2,” Pharmaceutical Technology, 41 (8) 30-39 (2017).
4. J.S. Bergum and H. Li, “Acceptance Limits for the New ICH USP 29 Content Uniformity Test,” Pharmaceutical Technology, 31 (10) 90-100 (2007).
5. ASTM Standard Number E2810—11: Standard Practice for Demonstrating Capability to Comply with the Test for Uni-formity of Dosage Units, October 2011.
6. ASTM Standard Number E2709—09: Standard Practice for Demonstrating Capability to Comply with a Lot Acceptance Procedure, September 2009.
7. J. Bergum, “Tolerance Interval Alternative to ASTM E2709/2810 Methodology,” ISPE Pharmaceutical Engineering 35 (6) 2015.
8. P. Cholayudth, “CpK Distribution: The Fact Underlying Pro-cess Capability Indices—Part I: Theory,” Journal of Validation Technology 19 (4) 2013.
9. P. Cholayudth, “CpK Distribution: The Fact Underlying Process Capability Indices—Part II: Application,” Journal of Valida-tion Technology, 23 (4) 2017.
10. Author’s personal communication with USP, Email dated Aug. 21, 2001, Regarding “USP Content Uniformity (CU)’s RSD Limit”. PT
Pramote Cholayudth is validation consultant to Biolab Co., Ltd. in Thailand. Heis the founder and manager of PM Consult, [email protected].
Visit PharmTech.com to read the following:
• Establishing Acceptance Limits for Uniformity of Dosage Units: Part 1www.PharmTech.com/establishing-acceptance-limits-uniformity-dosage-units-part-1
• Establishing Acceptance Limits for Uniformity of Dosage Units: Part Twowww.PharmTech.com/establishing-acceptance-limits-uniformity-dosage-units-part-two
• Establishing Blend Uniformity Acceptance Criteria for Oral Solid-Dosage Formswww.PharmTech.com/establishing-blend-uniformity-acceptance-criteria-oral-solid-dosage-forms
• Analyzing Content Uniformitywww.PharmTech.com/analyzing-content-uniformity
Related articles