Embed Size (px)
Citation preview

PEBELS: Policy Exposure Based Excess Loss Smoothing
Marquis J. Moehring
Liberty Mutual Group

Liberty Mutual Insurance
Outline
1. Background
2. Goal
3. PEBELS Defined
4. PEBELS Derived (PPR Generalized)
5. Applications
6. Summary

Liberty Mutual Insurance
My Challenge
Strong Regional Focus• State/Program Large Loss Provisions• Low Credibility• High Heterogeneity

Liberty Mutual Insurance
This Should be Easier
No applicable method in literature• ILFs for Liability• ELFs for Workers Compensation• Nothing for Commercial Property or Homewners!
Liberty Mutual Insurance
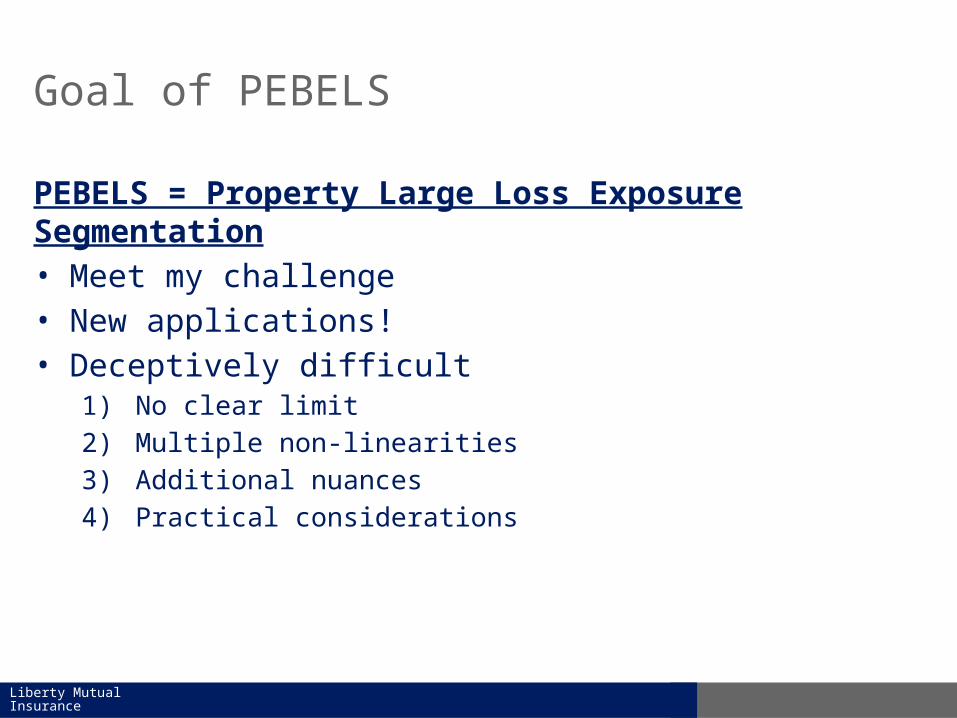
Goal of PEBELS
PEBELS = Property Large Loss Exposure Segmentation• Meet my challenge• New applications!• Deceptively difficult
1) No clear limit
2) Multiple non-linearities
3) Additional nuances
4) Practical considerations

Liberty Mutual Insurance
PEBELS Defined
Defined as
• = • )-

Liberty Mutual Insurance
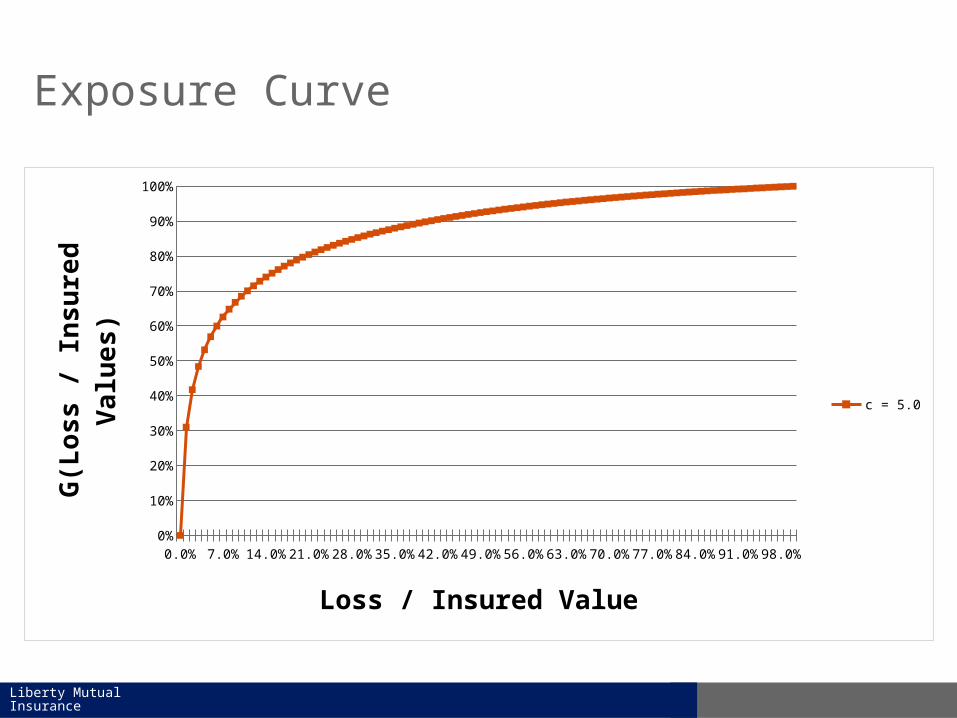
Exposure Curve
0.0% 6.0% 12.0% 18.0% 24.0% 30.0% 36.0% 42.0% 48.0% 54.0% 60.0% 66.0% 72.0% 78.0% 84.0% 90.0% 96.0%0%
10%
20%
30%
40%
50%
60%
70%
80%
90%
100%
c = 5.0
Loss / Insured Value
G(L
os
s /
In
su
red
Va
lue
s)

Liberty Mutual Insurance
PEBELS Derived
PEBELS Derived = PPR Generalized• Classic Reinsurance Per Risk Exposure Rating• Generalized to contemplate,
1) Policy level heterogeneity
2) Expected loss heterogeneity via
3) Loss process heterogeneity via
4) Historical vs. prospective exposure profiles
5) Credibility

Liberty Mutual Insurance
Reinsurance Per Risk Exposure Rating
Insured Value Range
($000s)
Midpoint ($000s)
Retention as a % of Insured value
Retention + Limit as a % of Insured
value
Exposure Factor
Subject Premium
Expected Loss Ratio
Expected Primary Losses
Expected Reinsurer
Losses
20-100 60 167% 833% 0% 682,000 65% 443,300 0
100-250 175 57% 286% 26% 161,000 65% 104,650 27,209
250-1,000 625 16% 80% 41% 285,000 65% 185,250 75,953
1,000-2,000 1,500 7% 33% 33% 1,156,000 65% 751,400 247,962
Grand Total 2,284,000 65% 1,484,600 351,124

Liberty Mutual Insurance
PEBELS Derived
PEBELS Derived = PPR Generalized• Classic Reinsurance Per Risk Exposure Rating• Generalized to contemplate,
1) Policy level heterogeneity
2) Expected loss heterogeneity via
3) Loss process heterogeneity via
4) Historical vs. prospective exposure profiles
5) Credibility

Liberty Mutual Insurance
Per Policy Generalization
Insured Value Range ($000s)
Midpoint ($000s)
Retention as a % of Insured value
Retention + Limit as a % of Insured
value
Exposure Factor
Subject Premium
Expected Loss Ratio
Expected Primary Losses
Expected Reinsurer
Losses
20-100 60 167% 833% 0% 682,000 65% 443,300 0
100-250 175 57% 286% 26% 161,000 65% 104,650 27,209
250-1,000
625 16% 80% 41% 285,000 65% 185,250 75,953
1,000-2,000
1,500 7% 33% 33% 1,156,000 65% 751,400 247,962
Grand Total 2,284,000 65% 1,484,600 351,124

Liberty Mutual Insurance
PEBELS Derived
PEBELS Derived = PPR Generalized• Classic Reinsurance Per Risk Exposure Rating• Generalized to contemplate,
1) Policy level heterogeneity
2) Expected loss heterogeneity via
3) Loss process heterogeneity via
4) Historical vs. prospective exposure profiles
5) Credibility

Liberty Mutual Insurance
Heterogeneity Generalization
Insured Value Range
($000s)
Midpoint ($000s)
Retention as a % of Insured value
Retention + Limit as a % of Insured
value
Exposure Factor
Subject Premium
Expected Loss Ratio
Expected Primary Losses
Expected Reinsurer
Losses
20-100 60 167% 833% 0% 682,000 65% 443,300 0
100-250 175 57% 286% 26% 161,000 65% 104,650 27,209
250-1,000 625 16% 80% 41% 285,000 65% 185,250 75,953
1,000-2,000 1,500 7% 33% 33% 1,156,000 65% 751,400 247,962
Grand Total 2,284,000 65% 1,484,600 351,124

Liberty Mutual Insurance
Heterogeneity Generalization
• Expected catastrophe loss• Risk loads• Rate adequacy State: House
X 65.0%
Y 65.0%
Z 40.0%

Liberty Mutual Insurance
PEBELS Derived
PEBELS Derived = PPR Generalized• Classic Reinsurance Per Risk Exposure Rating• Generalized to contemplate,
1) Policy level heterogeneity
2) Expected loss heterogeneity via
3) Loss process heterogeneity via
4) Historical vs. prospective exposure profiles
5) Credibility

Liberty Mutual Insurance
Heterogeneity Generalization
Insured Value Range
($000s)
Midpoint ($000s)
Retention as a % of Insured value
Retention + Limit as a % of Insured
value
Exposure Factor
Subject Premium
Expected Loss Ratio
Expected Primary Losses
Expected Reinsurer
Losses
20-100 60 167% 833% 0% 682,000 65% 443,300 0
100-250 175 57% 286% 26% 161,000 65% 104,650 27,209
250-1,000 625 16% 80% 41% 285,000 65% 185,250 75,953
1,000-2,000 1,500 7% 33% 33% 1,156,000 65% 751,400 247,962
Grand Total 2,284,000 65% 1,484,600 351,124
Liberty Mutual Insurance
Exposure Curve
0.0% 6.0% 12.0% 18.0% 24.0% 30.0% 36.0% 42.0% 48.0% 54.0% 60.0% 66.0% 72.0% 78.0% 84.0% 90.0% 96.0%0%
10%
20%
30%
40%
50%
60%
70%
80%
90%
100%
c = 5.0
Loss / Insured Value
G(L
os
s /
In
su
red
Va
lue
s)
Liberty Mutual Insurance
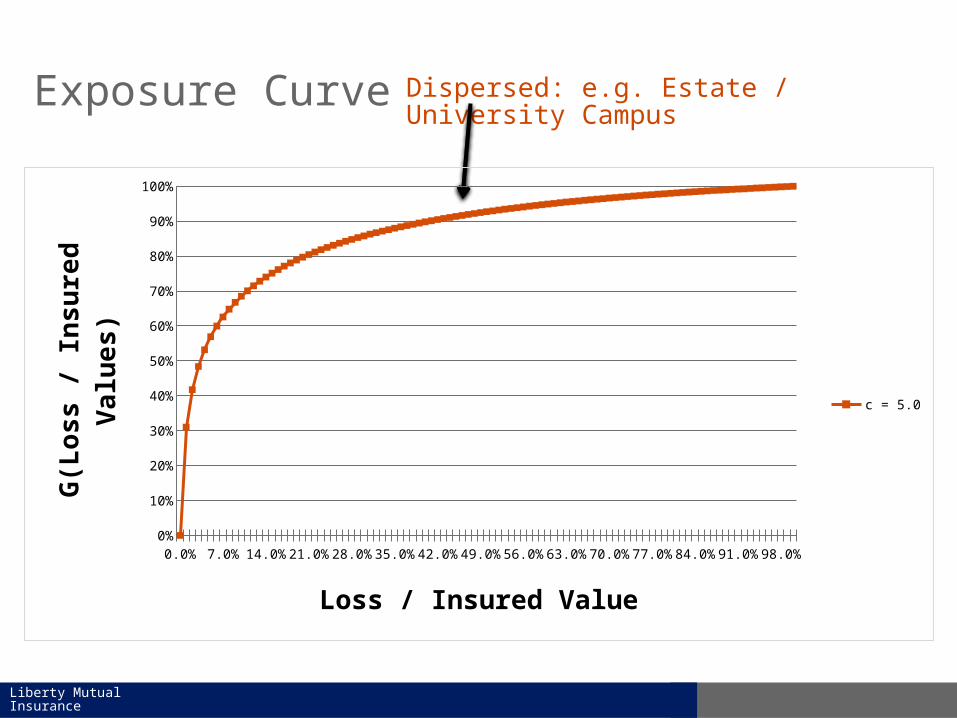
Exposure Curve Dispersed: e.g. Estate / University Campus
0.0% 6.0% 12.0% 18.0% 24.0% 30.0% 36.0% 42.0% 48.0% 54.0% 60.0% 66.0% 72.0% 78.0% 84.0% 90.0% 96.0%0%
10%
20%
30%
40%
50%
60%
70%
80%
90%
100%
c = 5.0
Loss / Insured Value
G(L
os
s /
In
su
red
Va
lue
s)

Liberty Mutual Insurance
Exposure Curve Dispersed: e.g. Estate / University Campus
0.0% 6.0% 12.0% 18.0% 24.0% 30.0% 36.0% 42.0% 48.0% 54.0% 60.0% 66.0% 72.0% 78.0% 84.0% 90.0% 96.0%0%
10%
20%
30%
40%
50%
60%
70%
80%
90%
100%
C = 1.5
c = 2.0
c = 3.0
c = 4.0
c = 5.0
Loss / Insured Value
G(L
os
s /
In
su
red
Va
lue
s)
Concentrated: e.g. Barn / Minimart

Liberty Mutual Insurance
PEBELS Derived
PEBELS Derived = PPR Generalized• Classic Reinsurance Per Risk Exposure Rating• Generalized to contemplate,
1) Policy level heterogeneity
2) Expected loss heterogeneity via
3) Loss process heterogeneity via
4) Historical vs. prospective exposure profiles
5) Credibility

Liberty Mutual Insurance
Applications
Indications• Motivated PEBELS• Allocate large losses to state and program
– Low credibility– High heterogeneity in underlying exposures

Liberty Mutual Insurance
Applications
Adjusted Modeled Catastrophe AALs• Traditionally assume AAL linear with IV• This contradicts
– Theory presented– Ludwig’s study of Hurricane Hugo
• Implies bias between Personal & Commercial• Can adjust AALs with PEBELS

Liberty Mutual Insurance
Applications
Predictive Models
Hypothesize that PEBELS• More predictive of large loss than IV• Most predictive for highly skewed perils• Most predictive in severity/excess models
Liberty Mutual Insurance
Applications
Revised Property Per Risk Reinsurance Exposure Rating
Current formulation:

Liberty Mutual Insurance
Applications
Revised Property Per Risk Reinsurance Exposure Rating
Proposed formulation:
*

Liberty Mutual Insurance
Summary
PEBELS = Property Large Loss Exposure Segmentation• Only game in town• Quantifies messy non-linearities• Multiple applications
– Indications– Catastrophe Modeling– Risk Segmentation


Liberty Mutual Insurance
Historical vs. Prospective
Selecting exposure profile for the application?
Prospective (current inforce)– Catastrophe modeling– Reinsurance quotes
Historical (“earned” over experience period)– Loss ratio ratemaking– Revised per risk reinsurance exposure rating

Liberty Mutual Insurance
Historical vs. Prospective
Loss ratio ratemaking examples
1) State in run-off scenario
2) State newly entered scenario
Both scenarios lead to skewed state indications
Even small shifts will distort indications

Liberty Mutual Insurance
Credibility
Indications example
Layer experience to maximize credibility
Complements

Liberty Mutual Insurance
Appendix
Misc. Topics• Exposure curve considerations• Data limitations and NLE• Methods in common usage