Embed Size (px)
Citation preview

AwExelon Generation,
November 22,2013
Mr. G. Edward Miller,: Project Manager..Projects Management Branch:Japan Lessons-Learned Project DirectorateOffice of Nuclear Reactor RegulationRockville, MD 20852
SUBJECT:
REFERENCES:"
Iler Mr Millar
Assistance in Obtaining Information on Dams:Peach Bottom Atomic Power Station - Units 2 and 3NRC Docket Nos. 50-277 and 50-278.Facility Operating Ucense Nos. DPR-44 and DPR-56
1. NRC Letter, "Request for Information Pursuant to Title 10 of the Codeof Federal Regulations 10 CFR 50.54(f) Regarding Recommendations:,.-2.1, 2.3, and 9.3, of the Near-Term Task Force Review of Insights fromthe Fukushima Dal-ichi Acciden", dated March 12,2012..2. JLD-ISG-2013-01, "Guidance For Assessment of Flooding. HazardsDue to Dam FailureP,, Interim Staff Guidance, Revision 0, July 29,2013.
Exelon Nuclear (Exelon) is re-evaluating flood hazards at its Peach Bottom Atomic PowerStation (PBAPS) for the purpose of responding to the March 2012 Request for Information (RAI)(Reference. 1).: As part of this effort, Exelon requests the assistance of the NRC to obtain theinformation needed to complete the Probable Maximum Flood and Dam Failure: HazardEvaluations. In particular, Exelon requests that the NRC acts as the interface between the U. S.Army Corps of Engineers (USACE) and Exelon, as outlined in section 1.5.3 of Reference 2....
This information is needed to support the flooding re-evaluation at PBAPS. The specificinformation needed is identified in the attachment to this letter. This information is requestedfrom the USACE by December 15, 2013. To coordinate data transfer, please contact Mr. JesseLucas at 717.456.4985.
This letter contajns no new regulatory commitments.
MichaelIJMassroSite Vice PresidentPeach Bottom Atomic Power Station . :
Attachments..
cc: U.S. NRC Document Control DeskNRC Resident Inspector, Peach BottomMr. Chris Cook, U.S. NRC, Rockville MD:
ccn 13-81 :..Au.W :

REQUEST FOR INFORMATIONARMY CORPS OF ENGINEERS OWNED DAMS IN SUSQUEHANNA
RIVER BASIN
Flooding Hazard Reevaluation of the Susquehanna River BasinPeach Bottom Atomic Energy Station I Conowingo Dam Power Station
EXELON
On behalf of EXELON, ENERCON and Gomez & Sullivan are performing hydrologic evaluationsto characterize the Probable Maximum Flood for the Peach Bottom Atomic Energy Station /Conowingo Dam Power Station.
There are a number of United States Army Corps of Engineers (USACE) flood storage projectsin the Susquehanna River Basin. These projects include:
• Almond Dam* Alvin R Bush Dam* Arkport Dam* Cowanesque Dam* Curwensville Dam" East Sidney Dam• George B Stevenson Dam* Hammond Dam* Joseph Foster Sayers Dam* Joseph Foster Sayers Dam Howard Levee* Raystown Dam" Raystown Dam Hesston Dike" Stillwater Dam* Tioga Dam• Whitney Point Dam
To accurately characterize the hydrologic effects of these USACE storage projects, informationis needed related to the storage capacities, discharge capacities, seasonal pool operatingcontrols, and flood control operations. We do not necessarily need detailed information relatedto the construction of the dams, which might otherwise be considered protected information byhomeland security. Rather, we need more schematic information, including:
1) General facility description and layout
2) Operations Manual, or portions of Operations Manual as available for release
3) Spillway information:
a) Gated Spillway(s): No. of gates, dimensions, inverts, discharge rating curves
b) Gate Timing: how long does it take to open one gate? All gates?
c) Auxiliary Spillway(s): No. of gates (if any), dimensions, inverts, discharge rating curves
d) Emergency spillway(s): dimensions inverts, discharge rating curves
4) Tailwater Rating Curve (if available, and if the tailwater influences the gate discharge at anystage)
5) Storage Capacity Curve:
a) Indicate Elevation vs. Storage Curve
b) Indicate Elevations of pool levels, such as Multipurpose Pool Level, Flood Pool,Surcharge Pool, Top of Dam (or other such designations, as appropriate for the project)
6) Seasonal Operational Guide Curves
7) Flood Operations Criteria:
a) Flood Storage / Release Criteria
b) Flood Operations Curve
8) Inflow Design Flood (IDF) information for each dam
9) Spillway Design Flood (SDF) information for each dam
10) Historical pool level information (daily maximum or time series pool level)
11) Historical discharge information (daily maximum or time series flow discharge)
To provide a better understanding of the information request, some EXAMPLE FIGURES fromother hydrologic evaluations are provided. Note that these figures are for differentdams/reservoirs; therefore, there is not a one-to-one correspondence to related elevations.
FIGURE 1 - EXAMPLE SPILLWAY RATING CURVE
Figure 1 depicts an example gated spillway rating curve for a multi-gate spillway at a major damproject.
FIGURE 2 - EXAMPLE OPERATING DISCHARGE CURVE
Figure 2 depicts how a gated spillway would be operated for the specific operating efficiency ofthe gates during a specific flood event. The gate opening levels are adjusted for specificupstream and downstream targets in the dam operations procedures. This figure is provided todemonstrate the importance of understanding dam operations so that accurate simulations canbe performed.
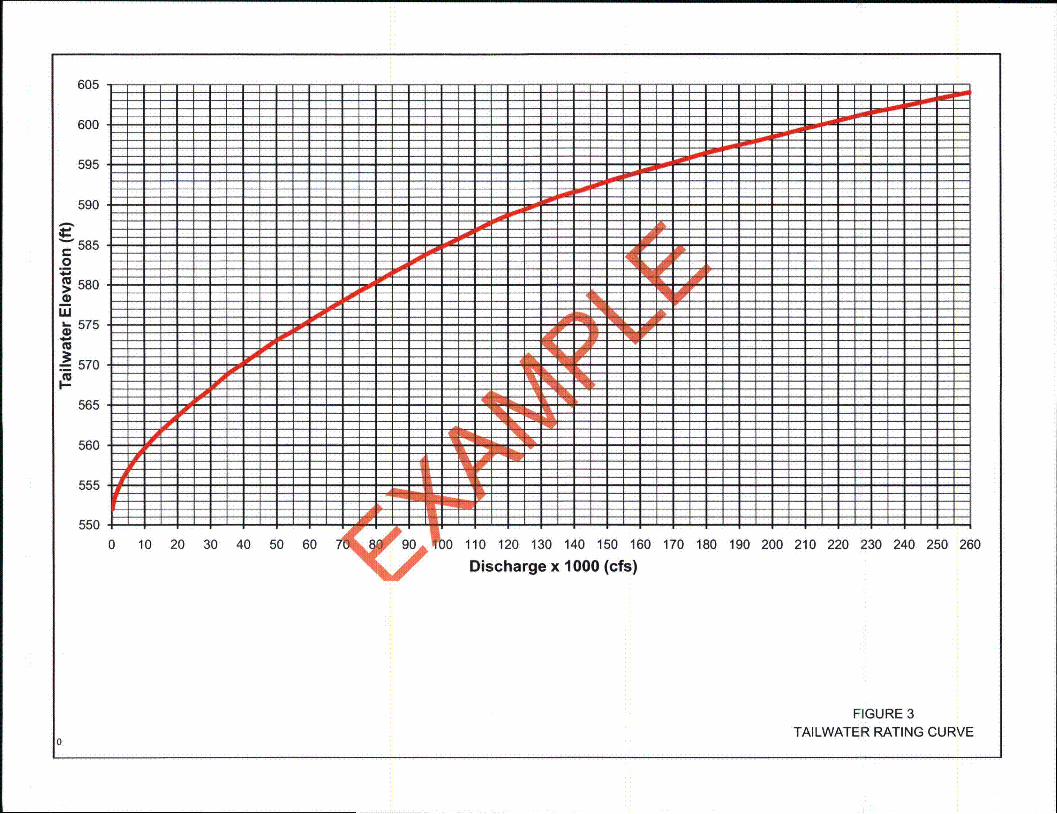
FIGURE 3 - EXAMPLE TAILWATER RATING CURVE
Figure 3 depicts a tailwater rating curve that would be used to evaluate potential downstreaminfluences on spillway capacities. For elevated spillways, tailwater may not influence spillwayreleases.
FIGURE 4 - EXAMPLE RESERVOIR STORAGE CURVE
Figure 4 depicts the elevation vs. storage capacity curve for an example reservoir. The graphincludes the pool elevations of the variously defined pool levels; in this case: the Multipurpose,

Flood, and Surcharge Pools. Note that other projects could use other definitions. Note that thisfigure also shows an assumed Initial Pool Level at the start of the PMF Event. In this case, theinitial pool level was selected based on an applied criteria related to historical maximumseasonal pool levels.
FIGURE 5 - EXAMPLE SEASONAL OPERATIONAL GUIDE CURVE
Figure 5 depicts the target curve for seasonal reservoir operations. A reservoir may be drawn
down in anticipation spring thaw inflows.
FIGURES 6 and 7 - EXAMPLE FLOOD OPERATING CURVE
Figure 6 depicts the operating curves for reservoir storage/discharge operations during an inflowflood. In this case, the reservoir release is prescribed based on the Pool Level Elevation andFlood Inflow Rate. Figures 6 & 7 depict two different flooding scenarios for the same dam. As
demonstrated in the figures, the spillway release rates can be significantly different for differentstarting pool levels and inflow floods. This demonstrates that is very important to know theFlood Operating Procedures to accurately simulate the reservoir discharge during a particularflood event. Not shown is potential operating criteria related to downstream flow/flooding
conditions. Some operation plans include release criteria based on downstream targets to helpmitigate downstream flooding.

FIGURES

Tainter Gate
VernierReadina:
---
675 - l 2'
670" -4'
, 665 ' 1 - - 111• A 9 w If I IfI
0 -8'i6 660 -9'f FI F 6
-10'
•"655 "-11"' ::
C A m A A -Ir1ME
M 1 1 , " -f ff I :r~ 2110 10 -12'w
L- 650 -v • 113'0 -2
.. 14'
-17'64 -018'
-19'
635 -20'0 50,000 100,000 150,000 200,000 250,000
Discharge (cfs)
FIGURE 1SPILLWAY RATING CURVE

675
E 670
r•0
0
• 665
S660
655
AIl I I IL 1 11 1/1 I/ A I1 / y Yrii m = 1 6 W-H
I I I i Il 1 /I /I1 /I /Il OLýýý MAX WSII I I i I ''I / I/l, v fYm I m
r ~ ~ ~ A .. .. .. .... ..r -=4 j cr ofr &,3;iu n, a
till 11 1 1 1 /1 1 r-Lrfll 'I i:4*lnrs
ruif if I I filbi W IL I? 1 2-11
Ell it It IIt 11
I/ X
-1.
-2*S3I
-45
- B.
-7.
-10.
...11'
12'
13'
14'
-15,
- 16'
-17'
-18'
o- 191
-20-
-Q Gate
-Q Out
II I 11 I f l/ i I IY I IX I ILI - L L * A ~ A ~ ... ~..... 4 ~ ~* U I ~ 4 J J J I - - - - - I - A A & A
0 50,000 10 0 1 , 00~D7 harge (cfs)
200,000 250,000 300,000
I
FIGURE 2TRAIL - CRITICAL STORM 1
OPERATING DISCHARGE CURVE
605
600
595
590
5850
580a,
Mu 575
40
570
565
560
555
550
0 10 20 30 40 50 60 AS&& 110 120 130 140 150 160 170 180 190 200 210 220
Discharge x 1000 (cfs)230 240 250 260
FIGURE 3TAILWATER RATING CURVE
0

0
m
4)
ri4)0)0,
1040
1030
1020
1010
1000
990
980
970
960
950
940
930
E4 10.31 Top ýf 13m
E4 102!5.4 To F), of Sui cha rge _.
10
-. 000
..... ý.ueffiilfoltr l
t Excess= 88,000 acre-ftA
Surcharge Storage255,000 acre-ft
Available Flood Storage88,000 acre-ft
Total Flood Storage- 176,000 acre-ft
00'U
CCCC,,-In
II
0I-.
-zMultipurpose
Storage64,000 acre-ft
-I-I
0 100 300 400
age (Thousand acre-ft)
500 600
FIGURE 4RESERVOIR STORAGE CURVE
02

665 I I ....
664 TOP OF 1-FOOT HIGH LEVEL
663 FLOOD POOL LIMIT
662
661
659 GUIDE/-
658 CURVE
" 657~-656
A655- -
S654 _mA mA
653 w
652 N
651
650
649
648 E-RG
647 L
646645
644
JAN FEB MAR A JUN JUL AUG SEP OCT NOV DEC
FIGURE 5OPERATIONAL GUIDE CURVE