Embed Size (px)
Citation preview
1
XVII Analyst & Investor Tour
New paths for mining
September 2017
2
Dis
clai
merThis presentation may include statements that
present Vale’s expectations about future events or results. All statements, when based upon expectations about the future, involve various risks and uncertainties. Vale cannot guarantee that such statements will prove correct. These risks and uncertainties include factors related to the following: (a) the countries where we operate, especially Brazil and Canada; (b) the global economy; (c) the capital markets; (d) the mining and metals prices and their dependence on global industrial production, which is cyclical by nature; and (e) global competition in the markets in which Vale operates. To obtain further information on factors that may lead to results different from those forecast by Vale, please consult the reports Vale files with the U.S. Securities and Exchange Commission (SEC), the Brazilian Comissão de Valores Mobiliários (CVM), and the French Autorité des Marchés Financiers (AMF), and in particular the factors discussed under “Forward-Looking Statements” and “Risk Factors” in Vale’s annual report on Form 20-F.
3
Agen
da1. Ferrous Minerals Update
2. S11D Operations Overview
3. Video
4. S11D Project Status
5. Closing Remarks
6. Q&A Session
4
Ferrous Minerals Update
5
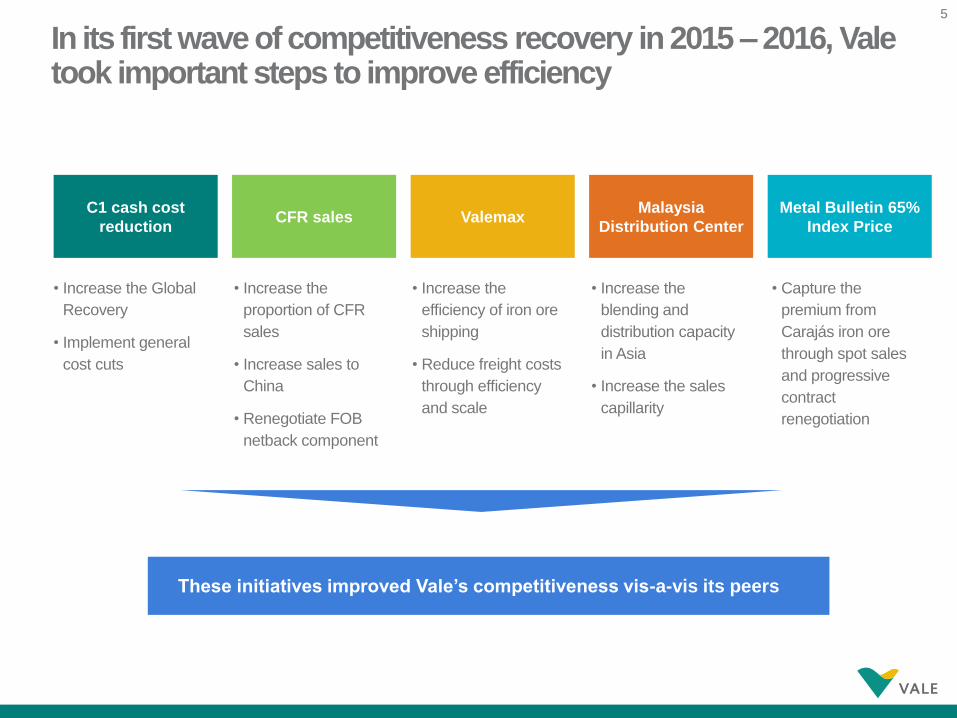
In its first wave of competitiveness recovery in 2015 – 2016, Vale took important steps to improve efficiency
5
These initiatives improved Vale’s competitiveness vis-a-vis its peers
C1 cash cost
reductionValemax
Malaysia
Distribution Center
Metal Bulletin 65%
Index Price
• Increase the Global
Recovery
• Implement general
cost cuts
• Increase the
efficiency of iron ore
shipping
• Reduce freight costs
through efficiency
and scale
• Increase the
blending and
distribution capacity
in Asia
• Increase the sales
capillarity
• Capture the
premium from
Carajás iron ore
through spot sales
and progressive
contract
renegotiation
CFR sales
• Increase the
proportion of CFR
sales
• Increase sales to
China
• Renegotiate FOB
netback component
6
-25
-20
-15
-10
-5
0
5
2014 2015 2016 1H17
25
30
35
40
45
50
55
2014 2015 2016 1H17
Peer2 Peer3Vale Peer1
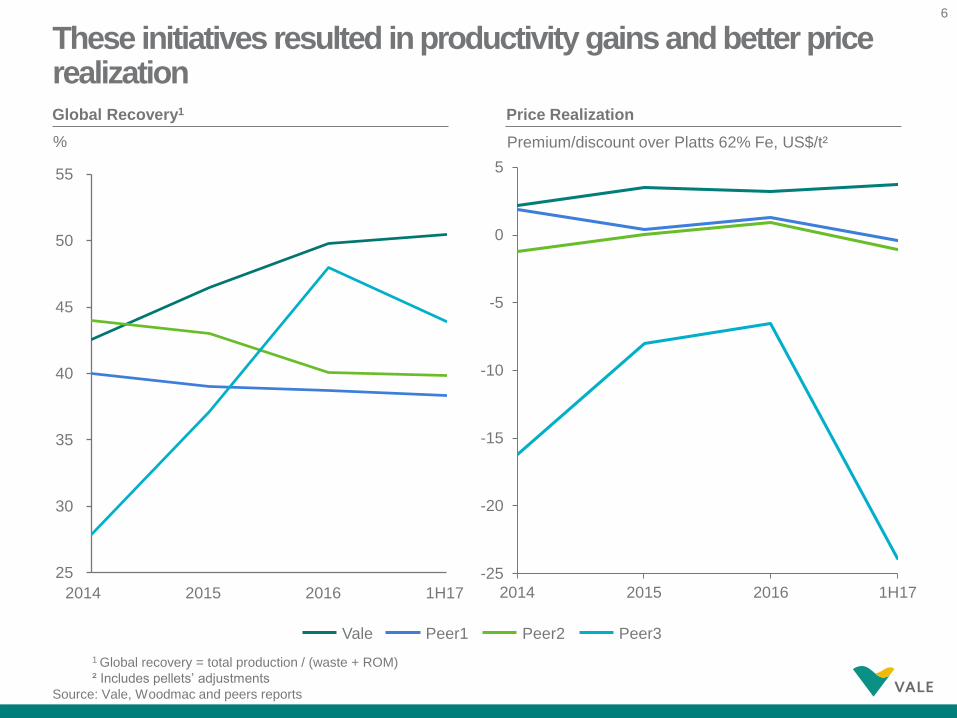
These initiatives resulted in productivity gains and better price realization
Price RealizationGlobal Recovery1
% Premium/discount over Platts 62% Fe, US$/t²
1 Global recovery = total production / (waste + ROM)
² Includes pellets’ adjustments
Source: Vale, Woodmac and peers reports
7
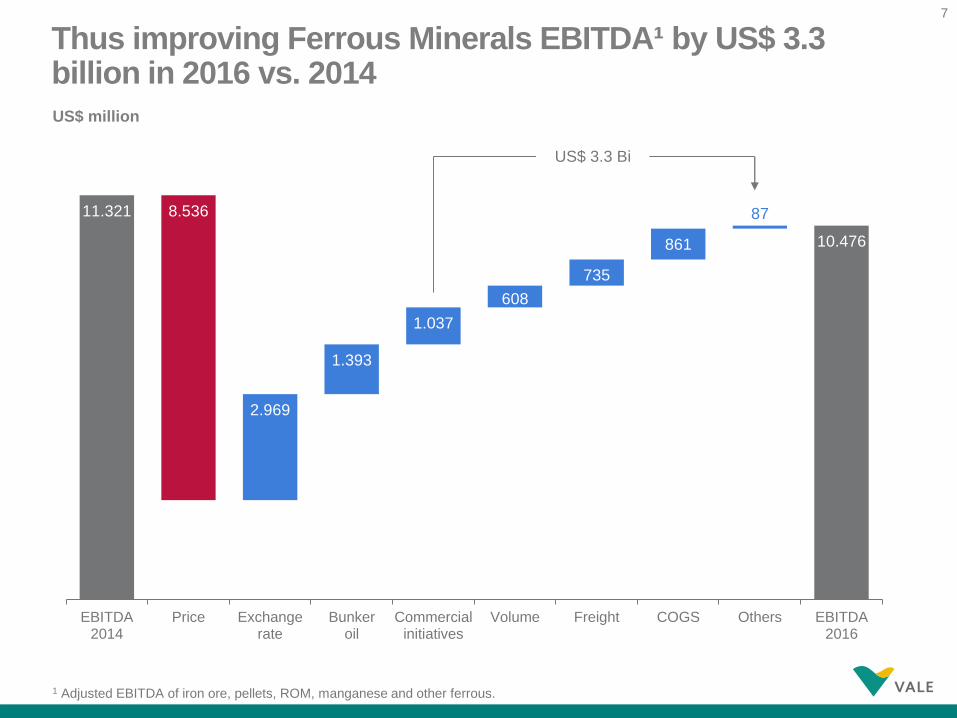
US$ million
1 Adjusted EBITDA of iron ore, pellets, ROM, manganese and other ferrous.
Thus improving Ferrous Minerals EBITDA¹ by US$ 3.3 billion in 2016 vs. 2014
11.321 8.536
2.969
1.393
1.037
608
735
861
87
10.476
EBITDA2014
Price Exchangerate
Bunkeroil
Commercialinitiatives
Volume Freight COGS Others EBITDA2016
US$ 3.3 Bi
8
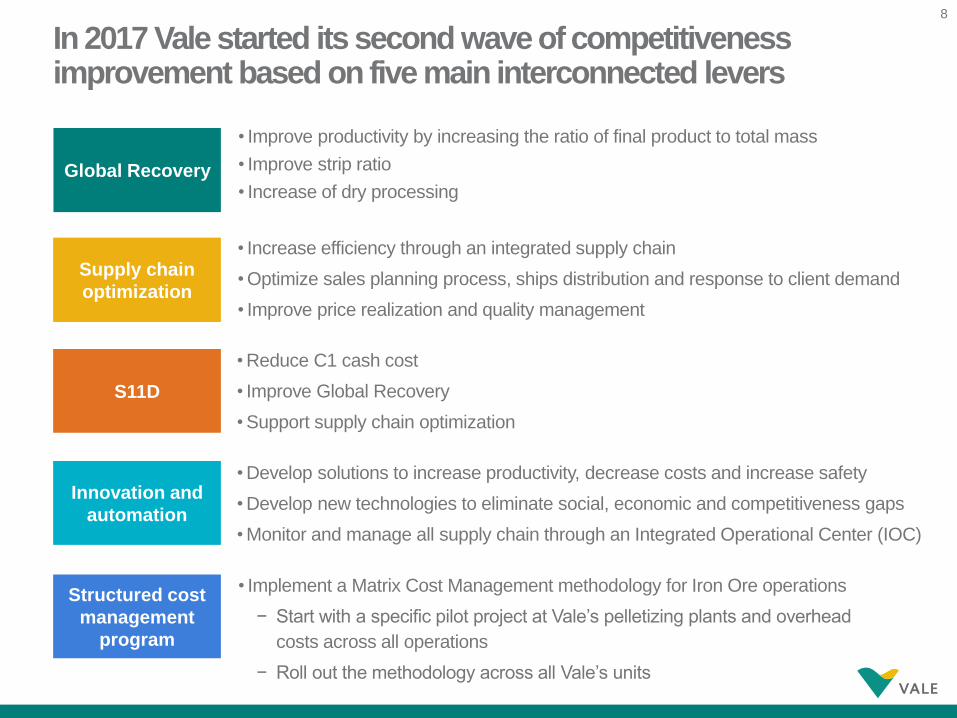
In 2017 Vale started its second wave of competitiveness improvement based on five main interconnected levers
8
Global Recovery
Supply chain
optimization
S11D
• Improve productivity by increasing the ratio of final product to total mass
• Improve strip ratio
• Increase of dry processing
• Increase efficiency through an integrated supply chain
• Optimize sales planning process, ships distribution and response to client demand
• Improve price realization and quality management
• Reduce C1 cash cost
• Improve Global Recovery
• Support supply chain optimization
Innovation and
automation
Structured cost
management
program
• Develop solutions to increase productivity, decrease costs and increase safety
• Develop new technologies to eliminate social, economic and competitiveness gaps
• Monitor and manage all supply chain through an Integrated Operational Center (IOC)
• Implement a Matrix Cost Management methodology for Iron Ore operations
− Start with a specific pilot project at Vale’s pelletizing plants and overhead
costs across all operations
− Roll out the methodology across all Vale’s units
99
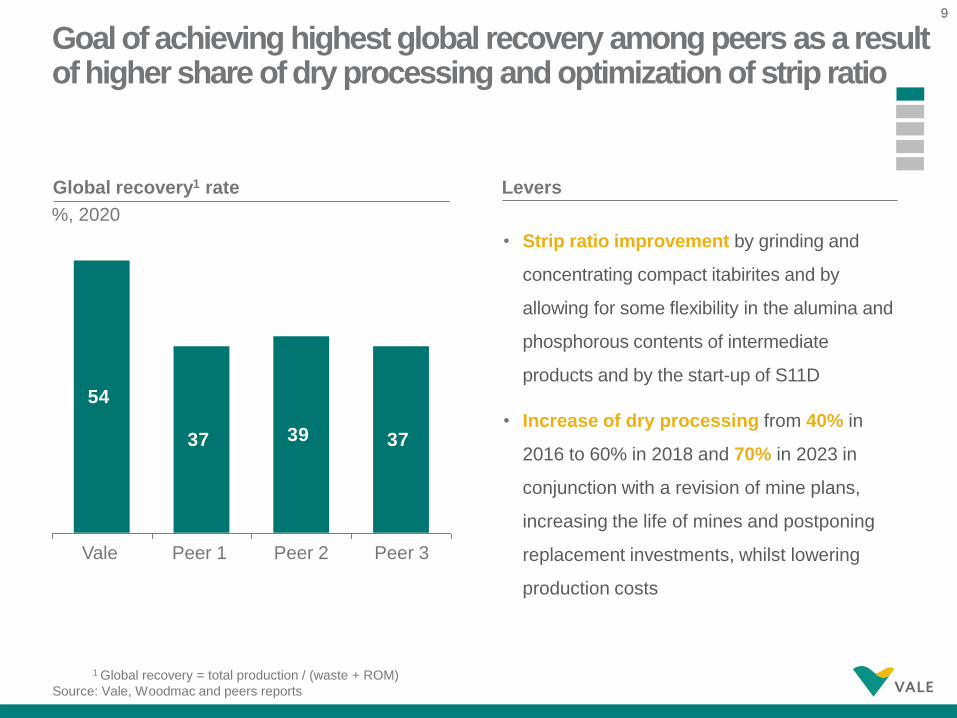
Goal of achieving highest global recovery among peers as a result of higher share of dry processing and optimization of strip ratio
LeversGlobal recovery1 rate
%, 2020
1 Global recovery = total production / (waste + ROM)
Source: Vale, Woodmac and peers reports
• Strip ratio improvement by grinding and
concentrating compact itabirites and by
allowing for some flexibility in the alumina and
phosphorous contents of intermediate
products and by the start-up of S11D
• Increase of dry processing from 40% in
2016 to 60% in 2018 and 70% in 2023 in
conjunction with a revision of mine plans,
increasing the life of mines and postponing
replacement investments, whilst lowering
production costs
54
37 39 37
Peer 3Peer 2Peer 1Vale
1010
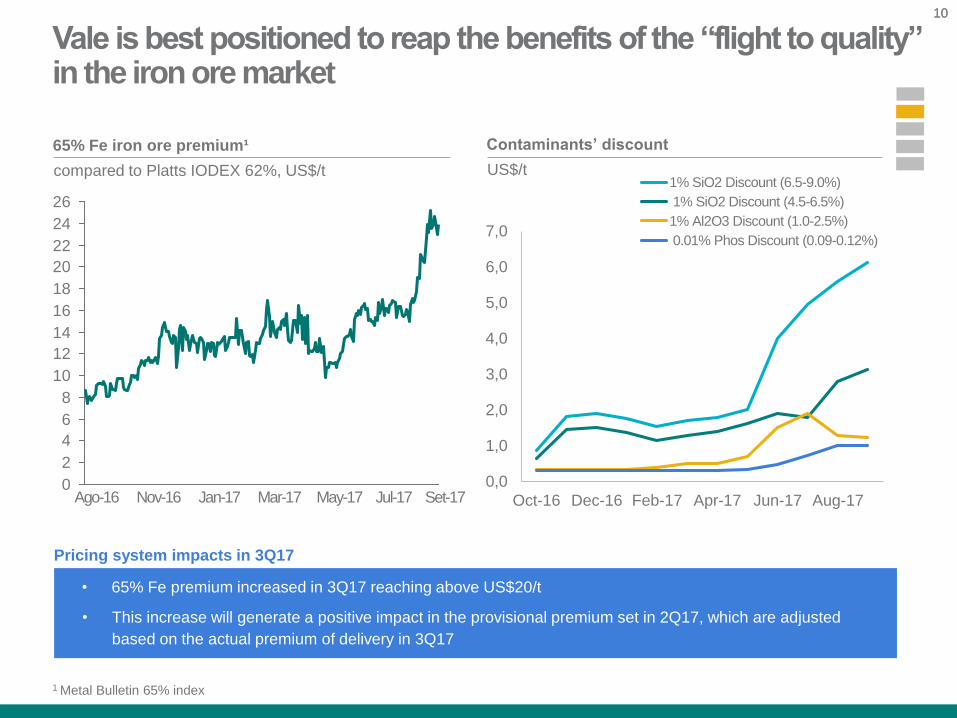
Vale is best positioned to reap the benefits of the “flight to quality” in the iron ore market
65% Fe iron ore premium¹
compared to Platts IODEX 62%, US$/t
0
2
4
6
8
10
12
14
16
18
20
22
24
26
Ago-16 Jan-17 Mar-17 May-17 Set-17Jul-17Nov-16
1 Metal Bulletin 65% index
• 65% Fe premium increased in 3Q17 reaching above US$20/t
• This increase will generate a positive impact in the provisional premium set in 2Q17, which are adjusted
based on the actual premium of delivery in 3Q17
Pricing system impacts in 3Q17
0,0
1,0
2,0
3,0
4,0
5,0
6,0
7,0
Oct-16 Dec-16 Feb-17 Apr-17 Jun-17 Aug-17
1% SiO2 Discount (6.5-9.0%)
1% SiO2 Discount (4.5-6.5%)
1% Al2O3 Discount (1.0-2.5%)
0.01% Phos Discount (0.09-0.12%)
Contaminants’ discount
US$/t
11
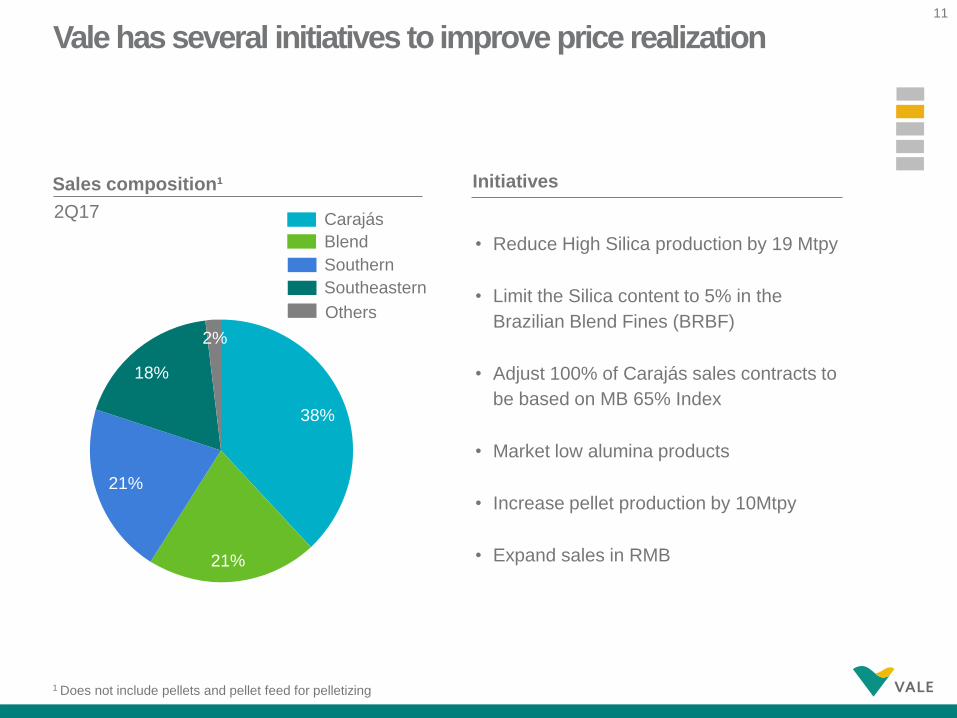
Vale has several initiatives to improve price realization
• Reduce High Silica production by 19 Mtpy
• Limit the Silica content to 5% in the
Brazilian Blend Fines (BRBF)
• Adjust 100% of Carajás sales contracts to
be based on MB 65% Index
• Market low alumina products
• Increase pellet production by 10Mtpy
• Expand sales in RMB
InitiativesSales composition¹
2Q17
21%
2%
18%
38%
21%
Others
Southeastern
Southern
Carajás
Blend
1 Does not include pellets and pellet feed for pelletizing
12
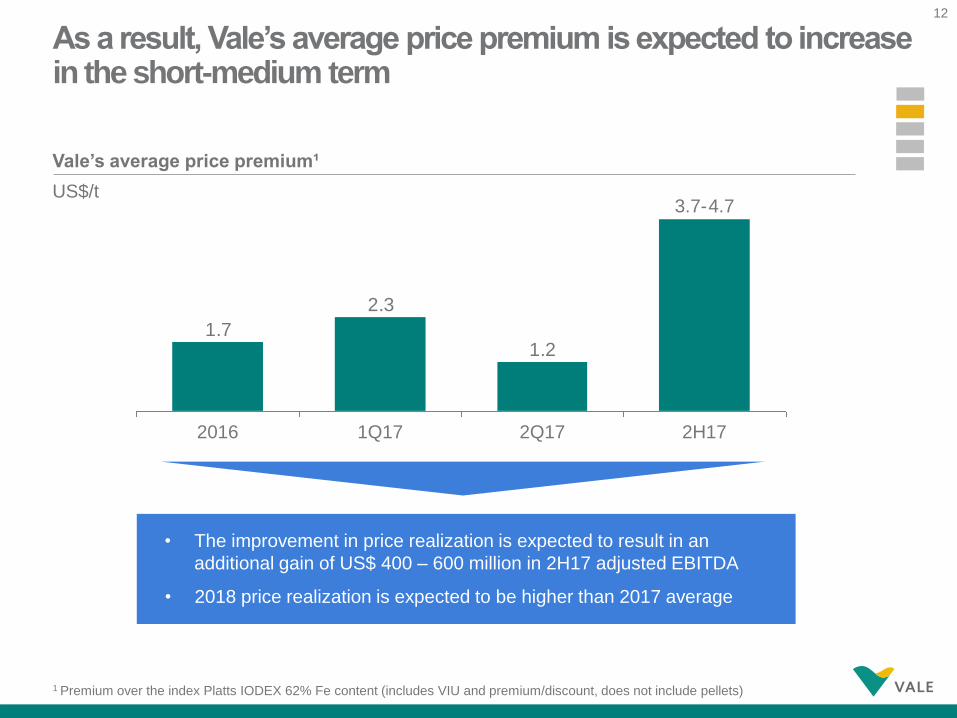
As a result, Vale’s average price premium is expected to increase in the short-medium term
Vale’s average price premium¹
US$/t
1 Premium over the index Platts IODEX 62% Fe content (includes VIU and premium/discount, does not include pellets)
• The improvement in price realization is expected to result in an
additional gain of US$ 400 – 600 million in 2H17 adjusted EBITDA
• 2018 price realization is expected to be higher than 2017 average
1.2
2.3
1.7
2Q17
3.7-4.7
1Q17 2H172016
13
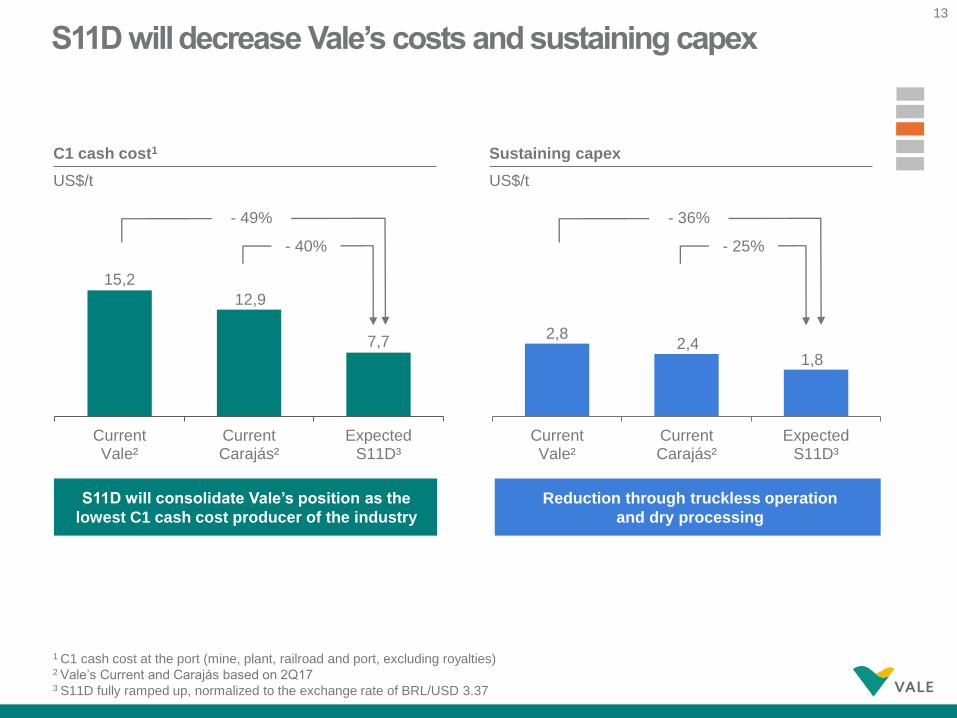
S11D will decrease Vale’s costs and sustaining capex
2,82,4
1,8
CurrentVale²
CurrentCarajás²
ExpectedS11D³
Sustaining capex
US$/t
1 C1 cash cost at the port (mine, plant, railroad and port, excluding royalties)2 Vale’s Current and Carajás based on 2Q173 S11D fully ramped up, normalized to the exchange rate of BRL/USD 3.37
- 25%
- 36%
15,2
12,9
7,7
CurrentVale²
CurrentCarajás²
ExpectedS11D³
C1 cash cost1
US$/t
- 40%
- 49%
Reduction through truckless operation
and dry processing
S11D will consolidate Vale’s position as the
lowest C1 cash cost producer of the industry
1414
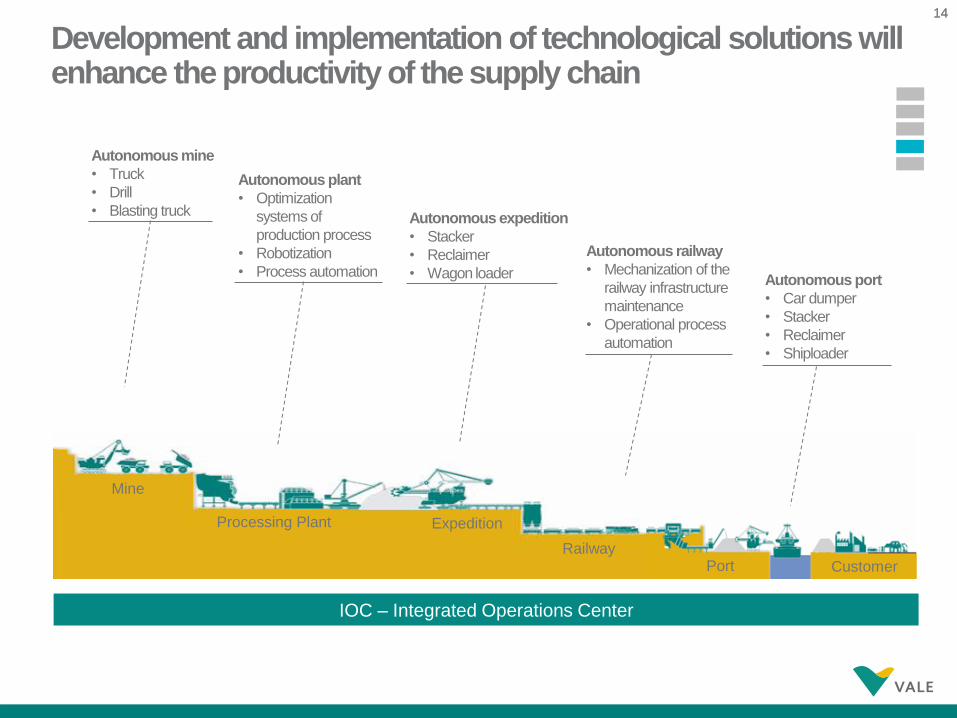
Development and implementation of technological solutions will enhance the productivity of the supply chain
Mine
Processing Plant Expedition
RailwayPort Customer
Autonomous mine
• Truck
• Drill
• Blasting truck
Autonomous plant
• Optimization
systems of
production process
• Robotization
• Process automation
Autonomous expedition
• Stacker
• Reclaimer
• Wagon loader
Autonomous railway
• Mechanization of the
railway infrastructure
maintenance
• Operational process
automation
Autonomous port
• Car dumper
• Stacker
• Reclaimer
• Shiploader
IOC – Integrated Operations Center
15
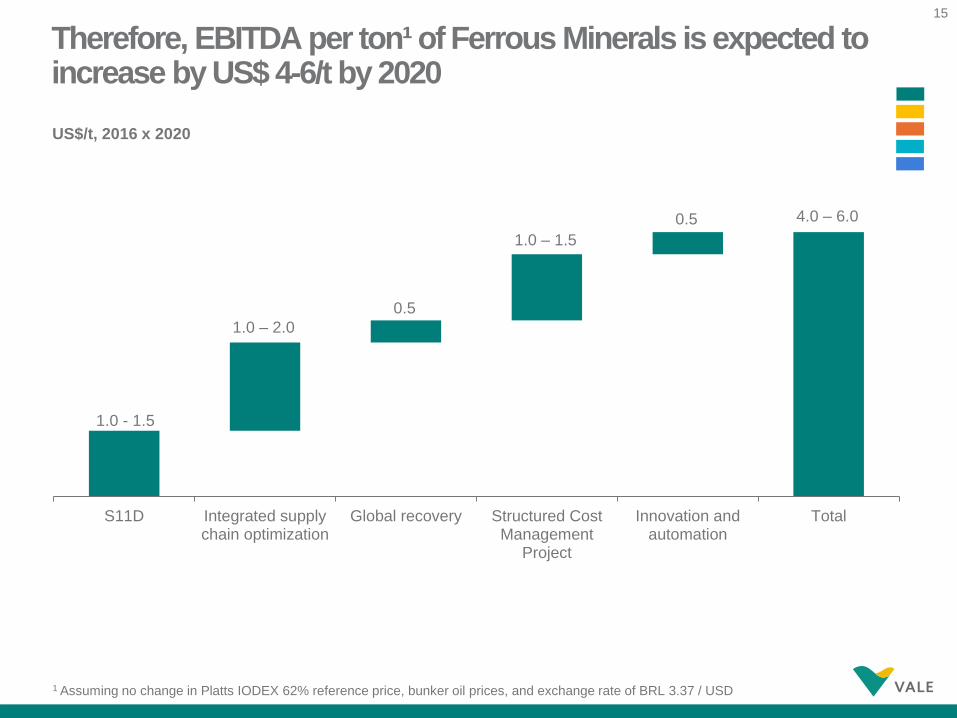
Therefore, EBITDA per ton¹ of Ferrous Minerals is expected to increase by US$ 4-6/t by 2020
US$/t, 2016 x 2020
1.0 - 1.5
1.0 – 2.0
0.5
1.0 – 1.5
0.5 4.0 – 6.0
S11D Integrated supplychain optimization
Global recovery Structured CostManagement
Project
Innovation andautomation
Total
1 Assuming no change in Platts IODEX 62% reference price, bunker oil prices, and exchange rate of BRL 3.37 / USD
16
S11D Operations Overview
17
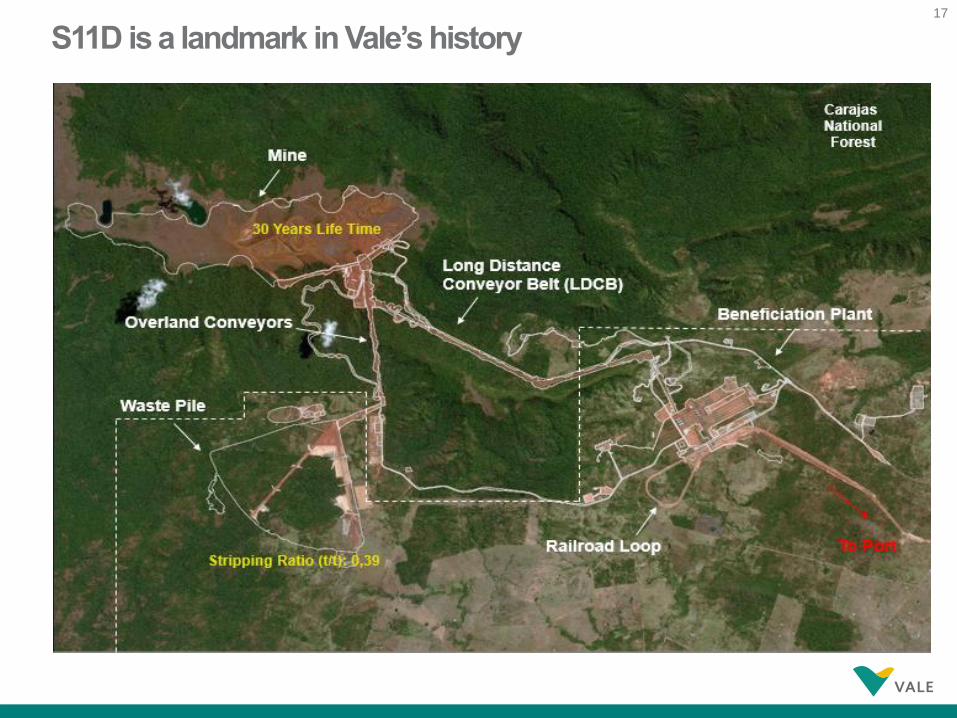
S11D is a landmark in Vale’s history
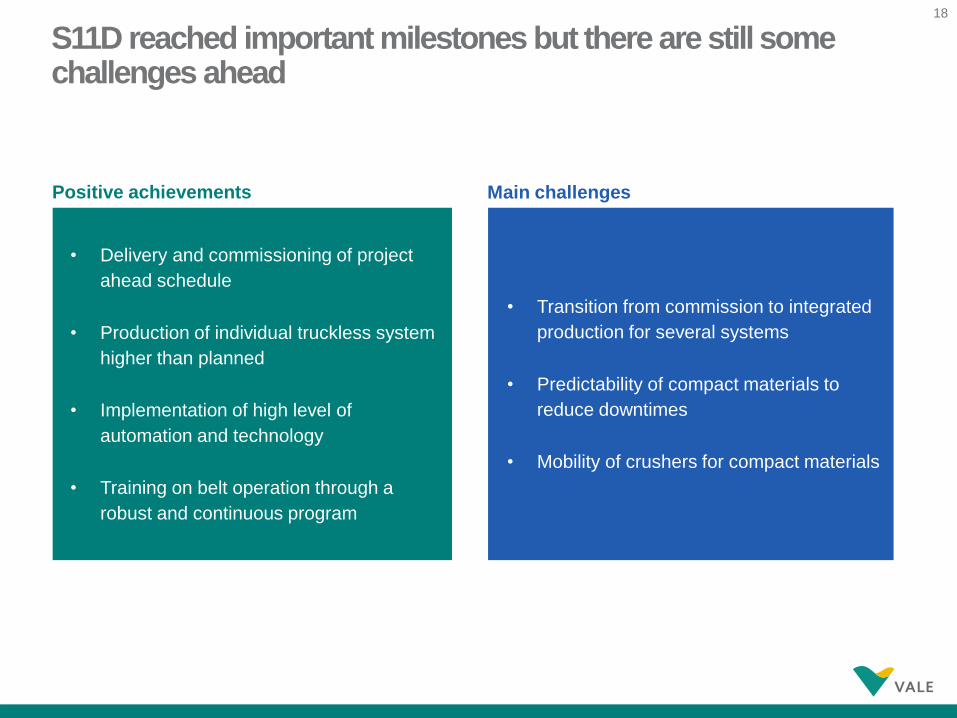
18
• Transition from commission to integrated
production for several systems
• Predictability of compact materials to
reduce downtimes
• Mobility of crushers for compact materials
S11D reached important milestones but there are still some challenges ahead
• Delivery and commissioning of project
ahead schedule
• Production of individual truckless system
higher than planned
• Implementation of high level of
automation and technology
• Training on belt operation through a
robust and continuous program
Positive achievements Main challenges
19
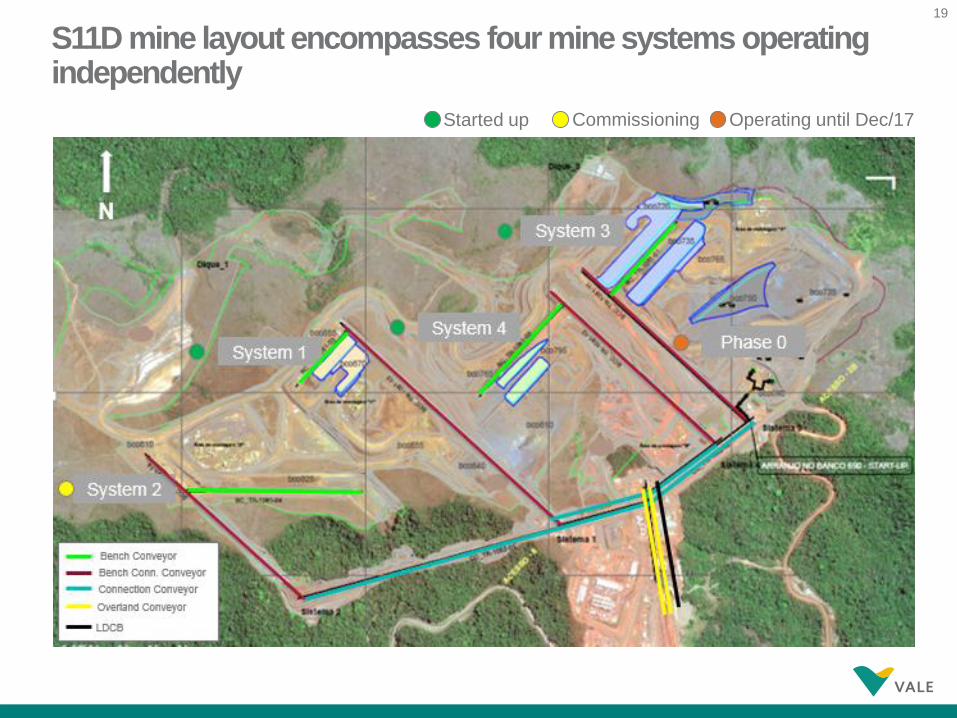
S11D mine layout encompasses four mine systems operating independently
Started up Commissioning Operating until Dec/17
20
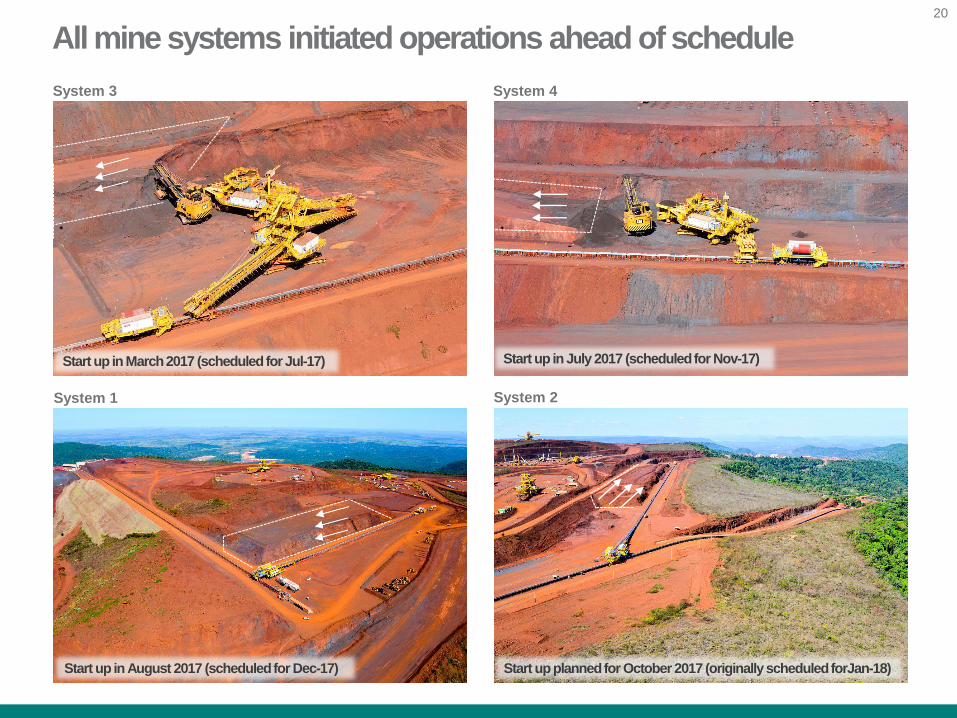
All mine systems initiated operations ahead of schedule
System 3 System 4
System 1 System 2
Start up in March 2017 (scheduled for Jul-17) Start up in July 2017 (scheduled for Nov-17)
Start up in August 2017 (scheduled for Dec-17) Start up planned for October 2017 (originally scheduled forJan-18)
21
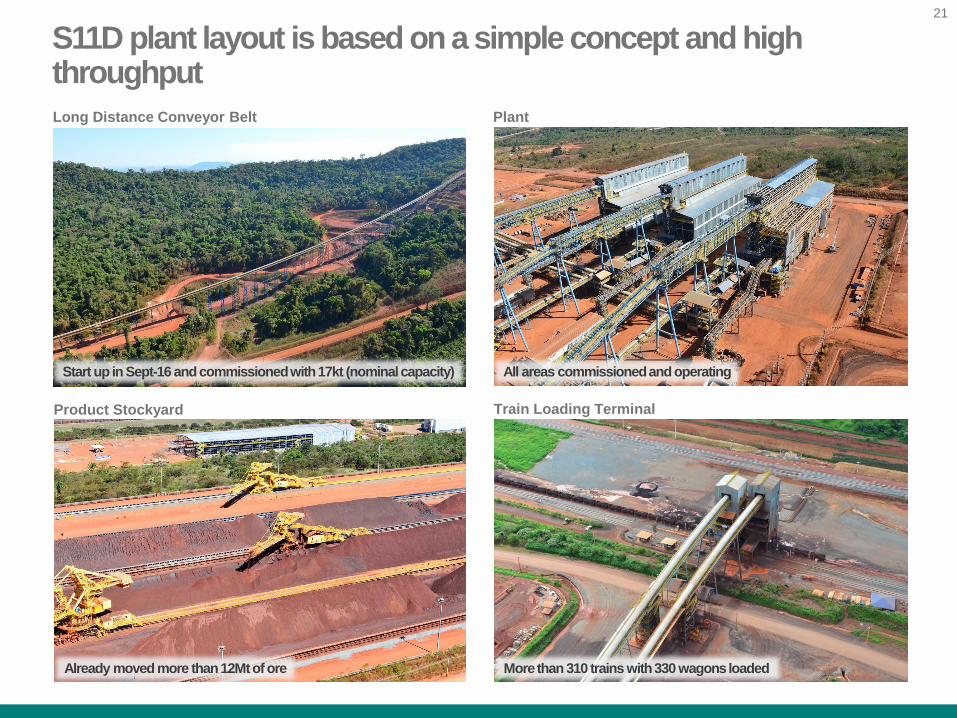
S11D plant layout is based on a simple concept and high throughput
Long Distance Conveyor Belt Plant
Product Stockyard Train Loading Terminal
Start up in Sept-16 and commissioned with 17kt (nominal capacity) All areas commissioned and operating
Already moved more than 12Mt of ore More than 310 trains with 330 wagons loaded
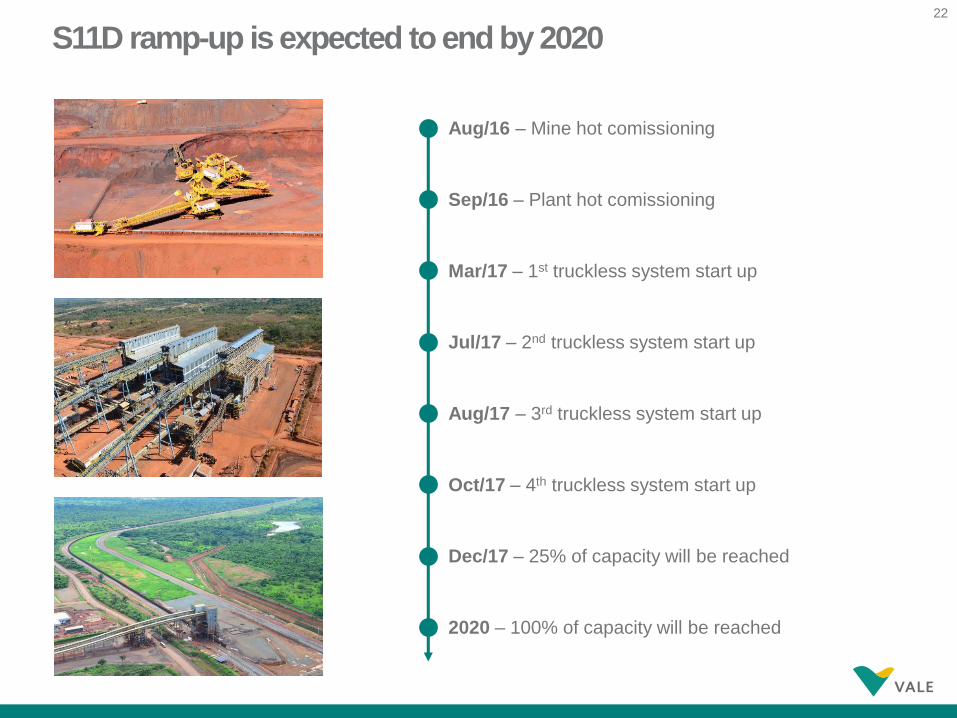
22
Aug/16 – Mine hot comissioning
Sep/16 – Plant hot comissioning
Mar/17 – 1st truckless system start up
Jul/17 – 2nd truckless system start up
Aug/17 – 3rd truckless system start up
Oct/17 – 4th truckless system start up
Dec/17 – 25% of capacity will be reached
2020 – 100% of capacity will be reached
S11D ramp-up is expected to end by 2020
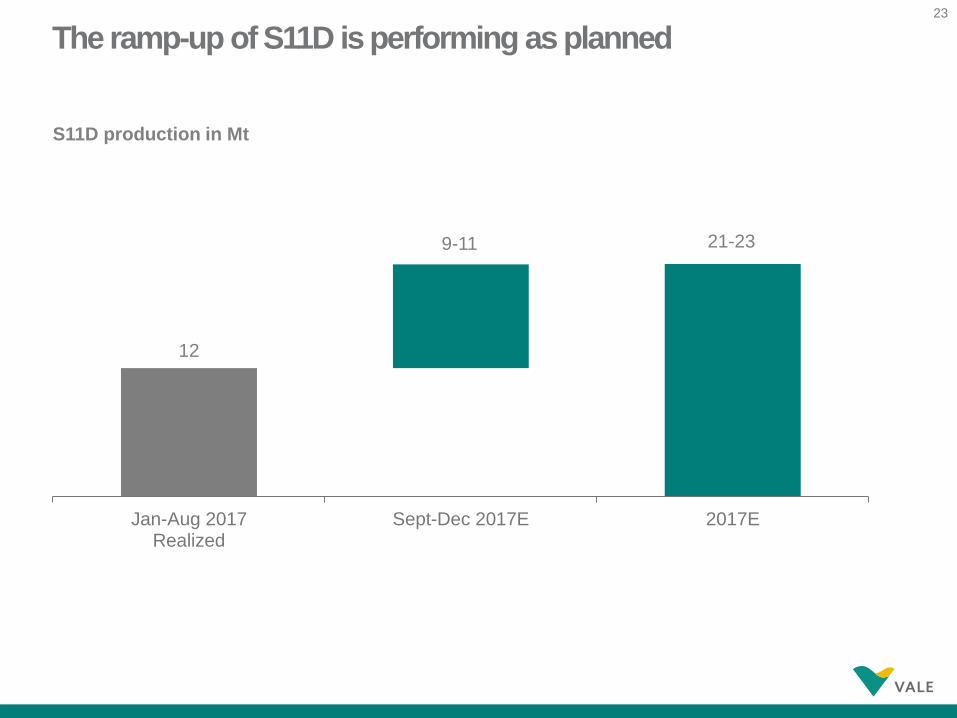
23
12
9-11 21-23
Jan-Aug 2017Realized
Sept-Dec 2017E 2017E
S11D production in Mt
The ramp-up of S11D is performing as planned
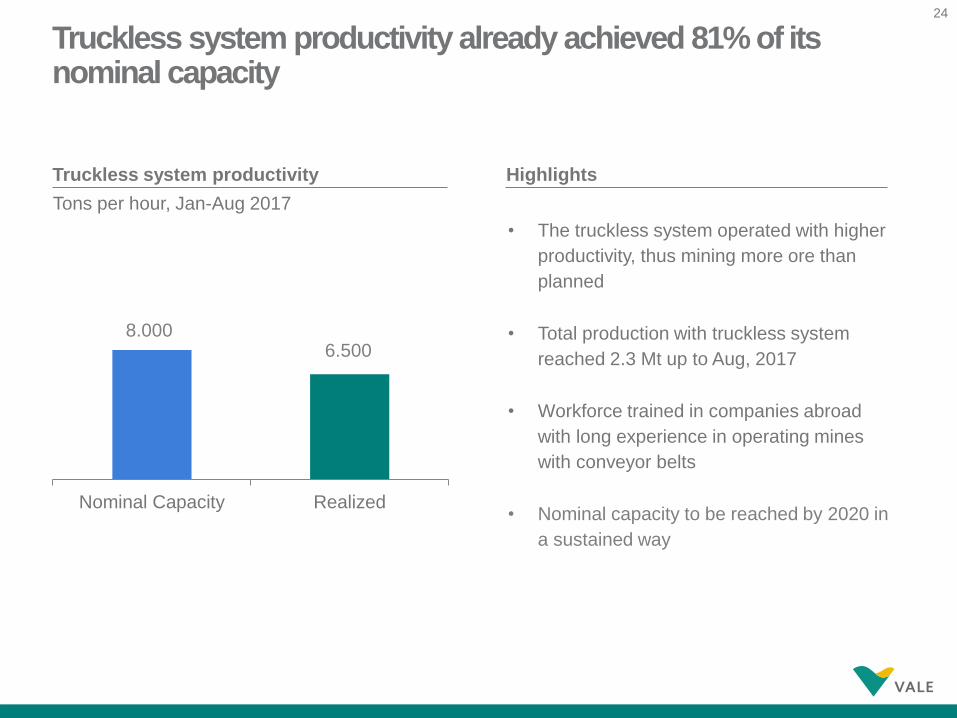
24
Truckless system productivity
8.0006.500
Nominal Capacity Realized
Tons per hour, Jan-Aug 2017
Highlights
• The truckless system operated with higher
productivity, thus mining more ore than
planned
• Total production with truckless system
reached 2.3 Mt up to Aug, 2017
• Workforce trained in companies abroad
with long experience in operating mines
with conveyor belts
• Nominal capacity to be reached by 2020 in
a sustained way
Truckless system productivity already achieved 81% of its nominal capacity
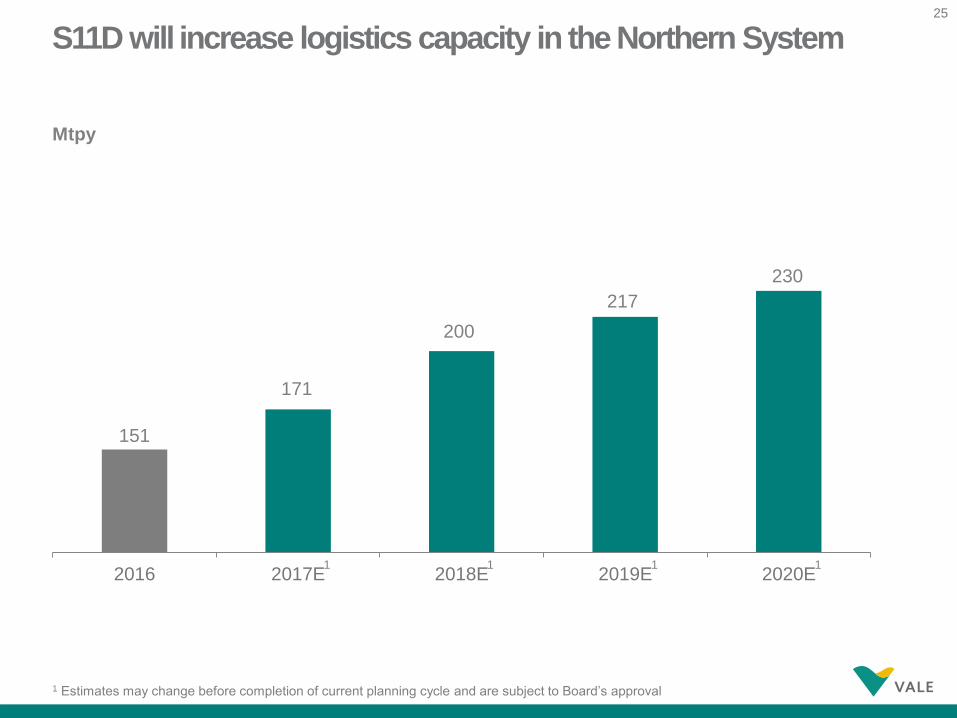
25
151
171
200
217
230
2016 2017E 2018E 2019E 2020E
Mtpy
1 1 1
1 Estimates may change before completion of current planning cycle and are subject to Board’s approval
1
S11D will increase logistics capacity in the Northern System

26
Video
27
S11D Project Status
28
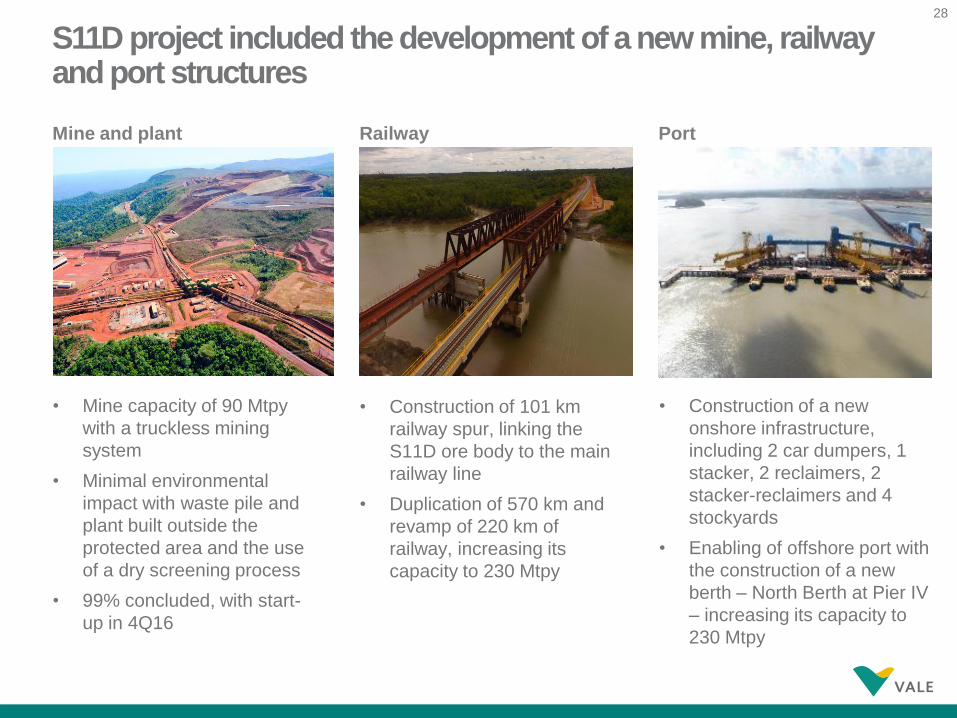
Mine and plant Railway Port
• Construction of 101 km
railway spur, linking the
S11D ore body to the main
railway line
• Duplication of 570 km and
revamp of 220 km of
railway, increasing its
capacity to 230 Mtpy
• Construction of a new
onshore infrastructure,
including 2 car dumpers, 1
stacker, 2 reclaimers, 2
stacker-reclaimers and 4
stockyards
• Enabling of offshore port with
the construction of a new
berth – North Berth at Pier IV
– increasing its capacity to
230 Mtpy
• Mine capacity of 90 Mtpy
with a truckless mining
system
• Minimal environmental
impact with waste pile and
plant built outside the
protected area and the use
of a dry screening process
• 99% concluded, with start-
up in 4Q16
S11D project included the development of a new mine, railway and port structures
29
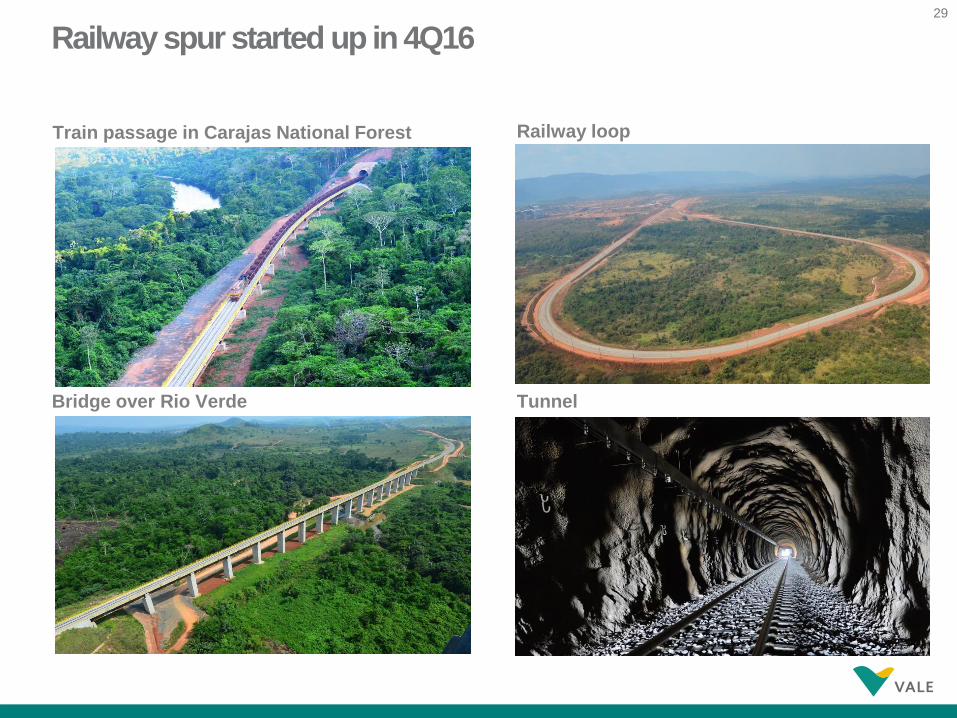
Train passage in Carajas National Forest Railway loop
Bridge over Rio Verde Tunnel
Railway spur started up in 4Q16
30
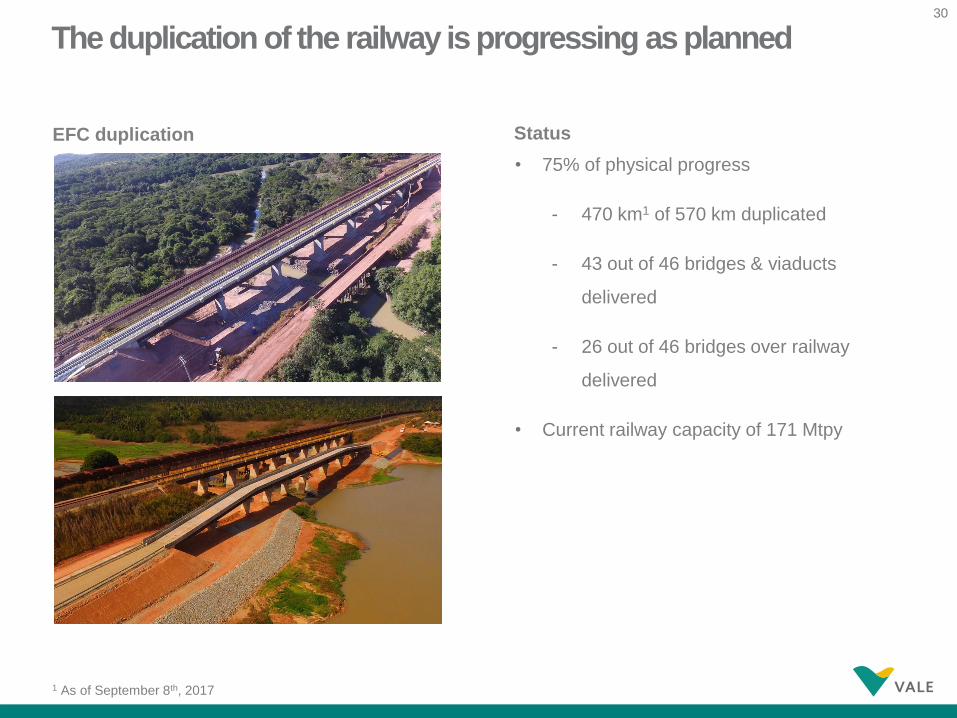
EFC duplication Status
• 75% of physical progress
- 470 km1 of 570 km duplicated
- 43 out of 46 bridges & viaducts
delivered
- 26 out of 46 bridges over railway
delivered
• Current railway capacity of 171 Mtpy
1 As of September 8th, 2017
The duplication of the railway is progressing as planned
31
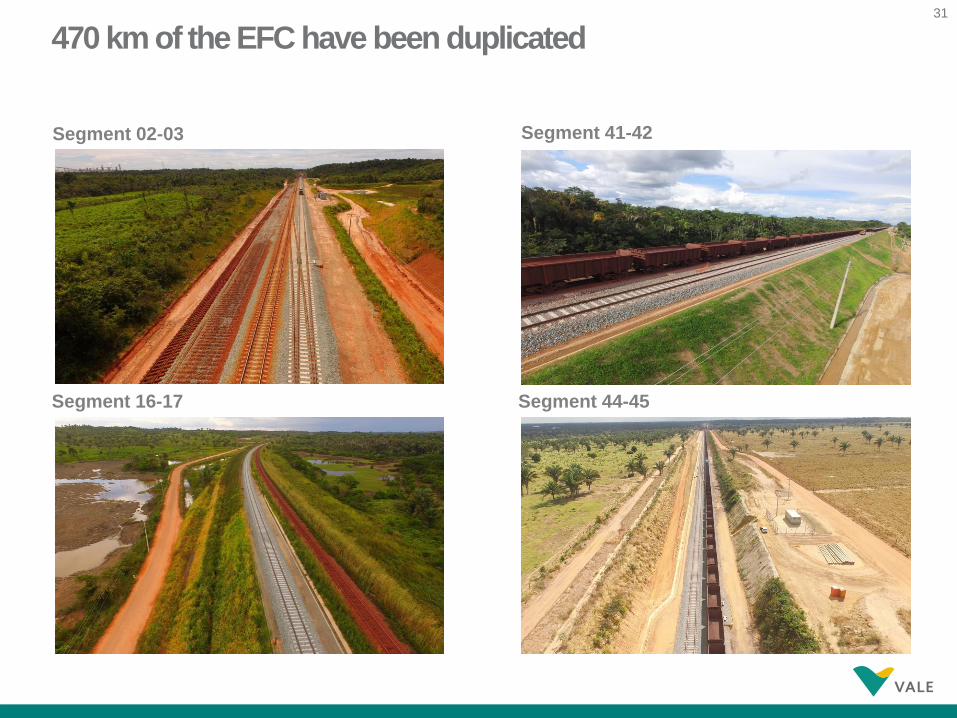
Segment 02-03 Segment 41-42
Segment 16-17 Segment 44-45
470 km of the EFC have been duplicated
32
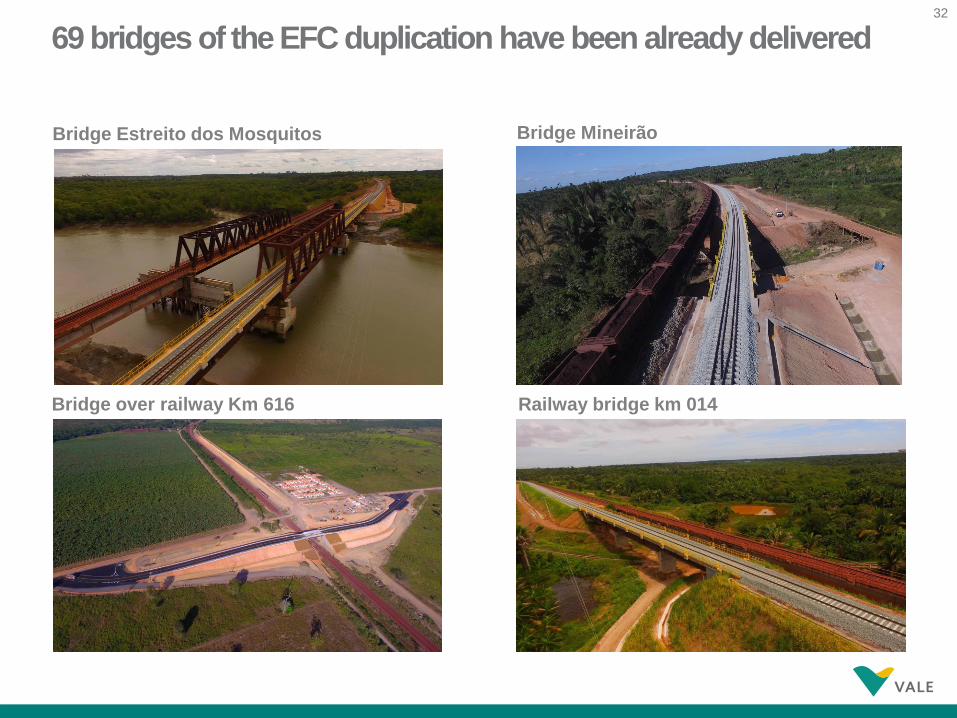
Bridge Estreito dos Mosquitos Bridge Mineirão
Bridge over railway Km 616 Railway bridge km 014
69 bridges of the EFC duplication have been already delivered
33
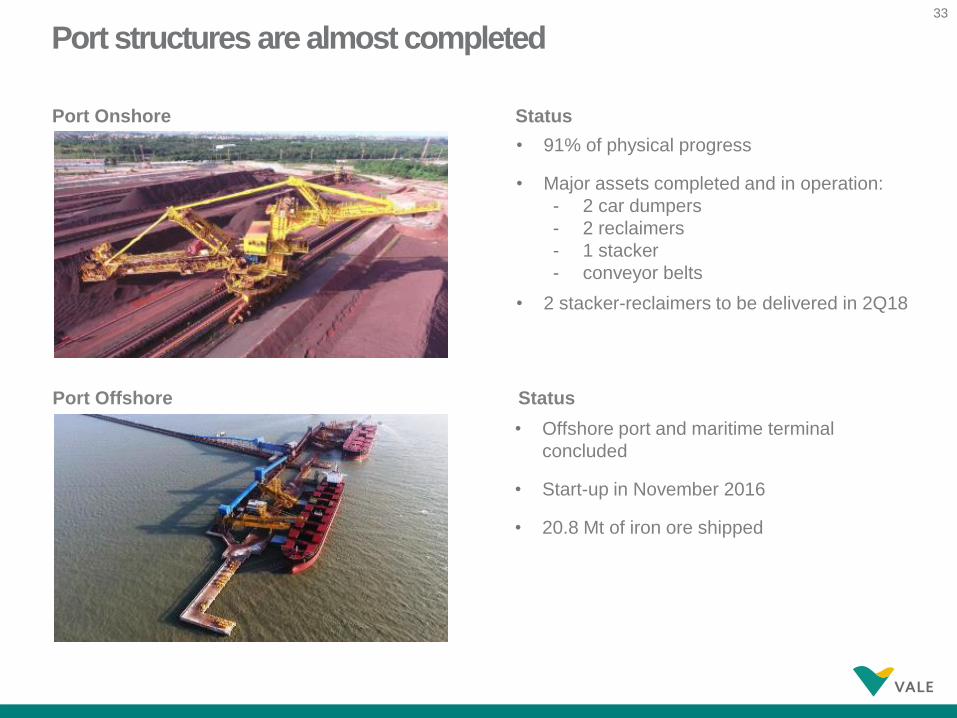
Port Onshore Status
• 91% of physical progress
• Major assets completed and in operation:
- 2 car dumpers
- 2 reclaimers
- 1 stacker
- conveyor belts
• 2 stacker-reclaimers to be delivered in 2Q18
Port Offshore Status
• Offshore port and maritime terminal
concluded
• Start-up in November 2016
• 20.8 Mt of iron ore shipped
Port structures are almost completed
34
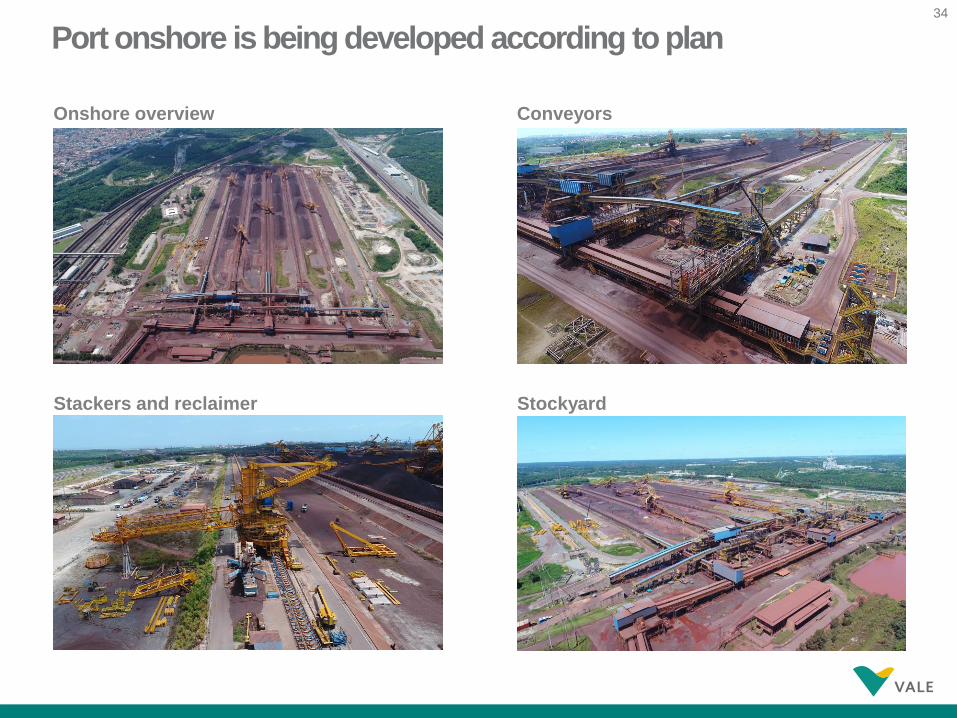
Onshore overview
Stackers and reclaimer
Port onshore is being developed according to plan
Conveyors
Stockyard
35
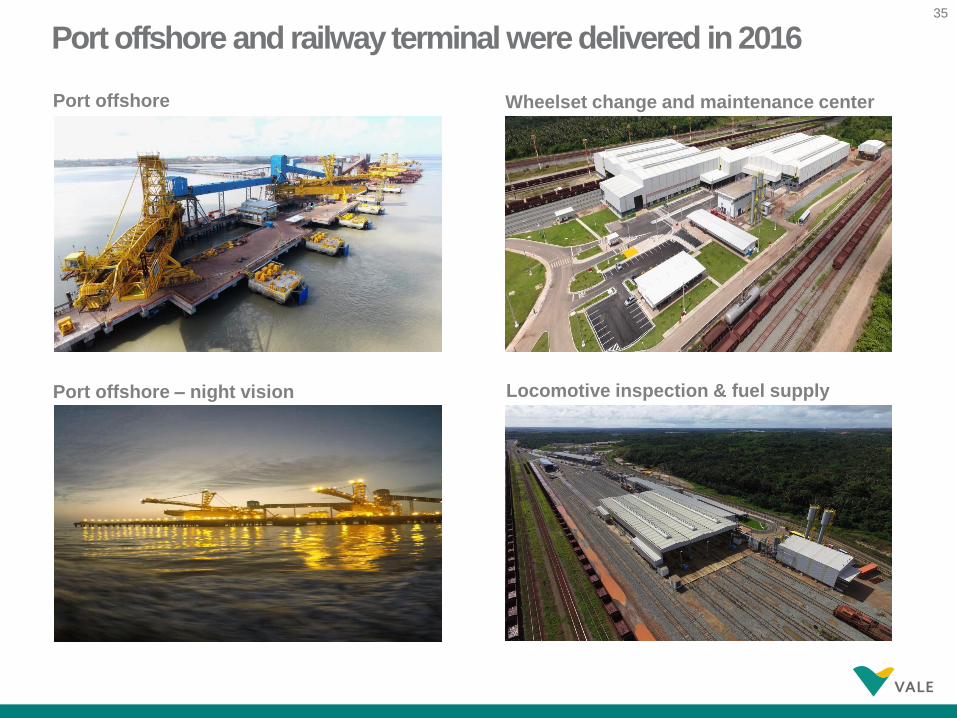
Wheelset change and maintenance center
Locomotive inspection & fuel supplyPort offshore – night vision
Port offshore
Port offshore and railway terminal were delivered in 2016
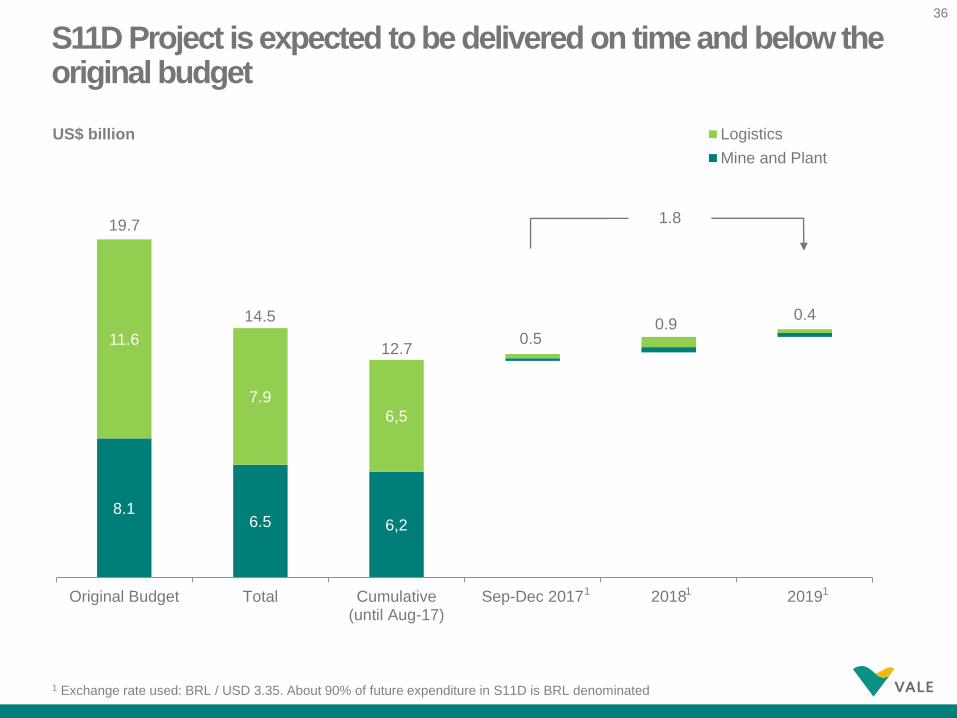
36
US$ billion
8.16.5 6,2
11.6
7.9
6,5
0.4
Original Budget Total Cumulative(until Aug-17)
Sep-Dec 2017 2018 2019
Logistics
Mine and Plant
0.512.7
14.5
19.7
0.9
1 Exchange rate used: BRL / USD 3.35. About 90% of future expenditure in S11D is BRL denominated
1 1 1
S11D Project is expected to be delivered on time and below the original budget
1.8
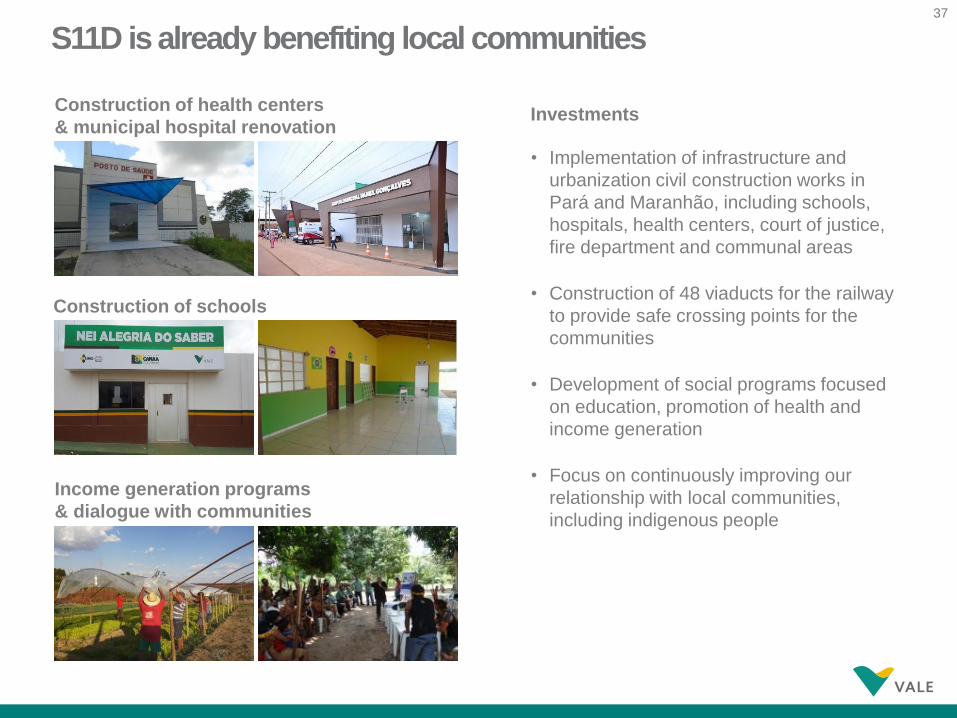
37
Construction of schools
Income generation programs
& dialogue with communities
• Implementation of infrastructure and
urbanization civil construction works in
Pará and Maranhão, including schools,
hospitals, health centers, court of justice,
fire department and communal areas
• Construction of 48 viaducts for the railway
to provide safe crossing points for the
communities
• Development of social programs focused
on education, promotion of health and
income generation
• Focus on continuously improving our
relationship with local communities,
including indigenous people
InvestmentsConstruction of health centers
& municipal hospital renovation
S11D is already benefiting local communities
38
38
Closing remarks
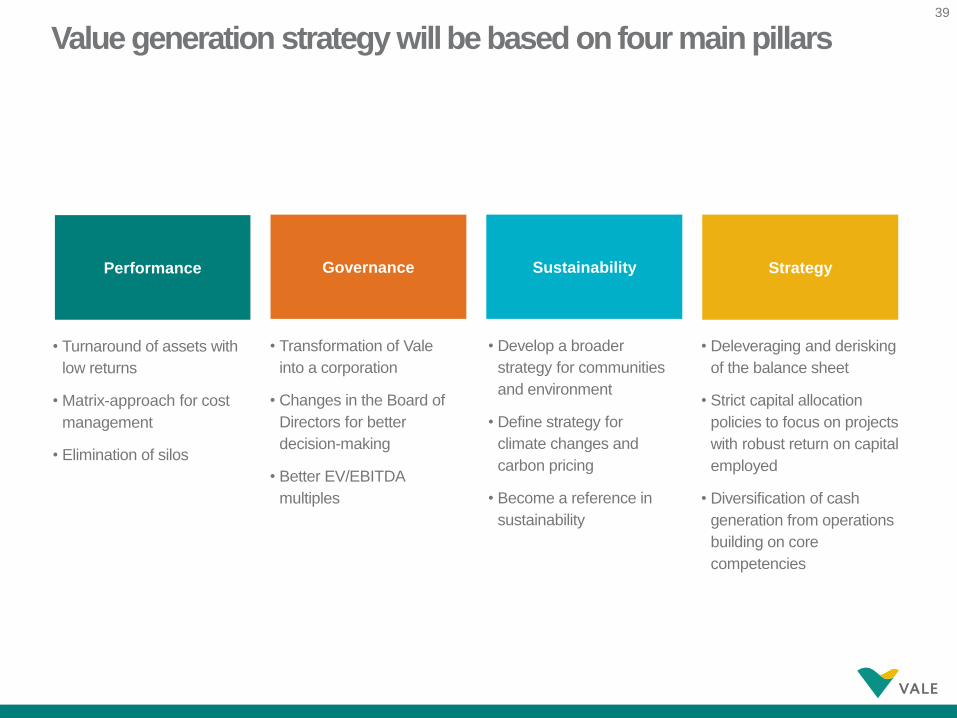
39
39
Performance StrategyGovernance Sustainability
• Turnaround of assets with
low returns
• Matrix-approach for cost
management
• Elimination of silos
• Deleveraging and derisking
of the balance sheet
• Strict capital allocation
policies to focus on projects
with robust return on capital
employed
• Diversification of cash
generation from operations
building on core
competencies
• Transformation of Vale
into a corporation
• Changes in the Board of
Directors for better
decision-making
• Better EV/EBITDA
multiples
• Develop a broader
strategy for communities
and environment
• Define strategy for
climate changes and
carbon pricing
• Become a reference in
sustainability
Value generation strategy will be based on four main pillars
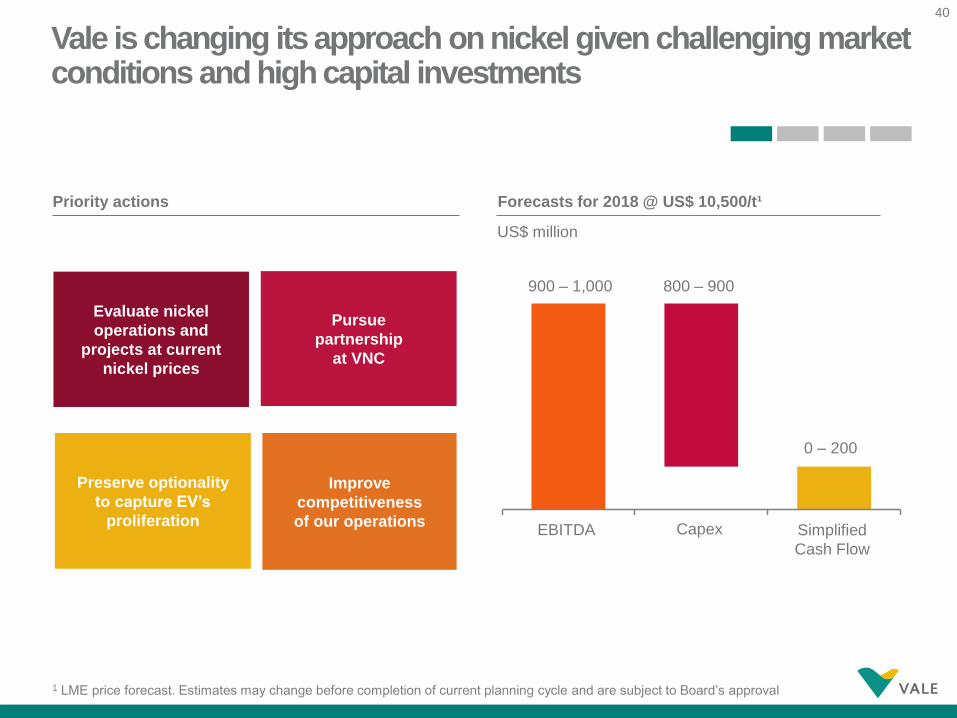
40
40
Evaluate nickel
operations and
projects at current
nickel prices
Improve
competitiveness
of our operations
Pursue
partnership
at VNC
Preserve optionality
to capture EV’s
proliferationCapexEBITDA Simplified
Cash Flow
900 – 1,000 800 – 900
0 – 200
1 LME price forecast. Estimates may change before completion of current planning cycle and are subject to Board’s approval
Vale is changing its approach on nickel given challenging market conditions and high capital investments
Priority actions Forecasts for 2018 @ US$ 10,500/t¹
US$ million
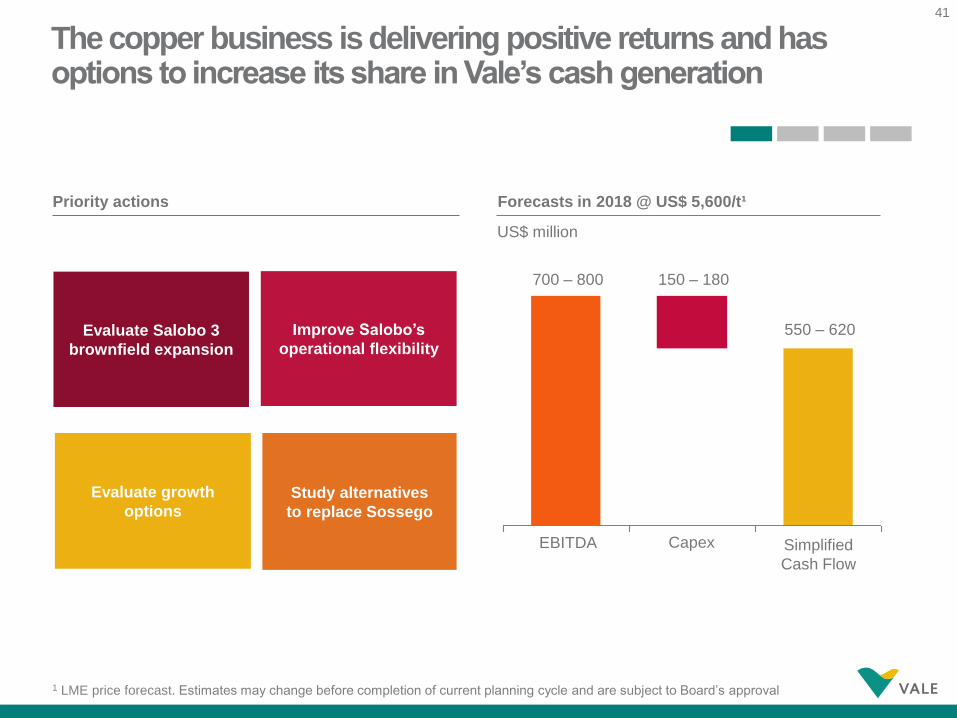
41
41
Evaluate Salobo 3
brownfield expansion
Study alternatives
to replace Sossego
Improve Salobo’s
operational flexibility
Evaluate growth
options
EBITDA Capex
700 – 800 150 – 180
550 – 620
1 LME price forecast. Estimates may change before completion of current planning cycle and are subject to Board’s approval
The copper business is delivering positive returns and has options to increase its share in Vale’s cash generation
Priority actions Forecasts in 2018 @ US$ 5,600/t¹
US$ million
Simplified
Cash Flow
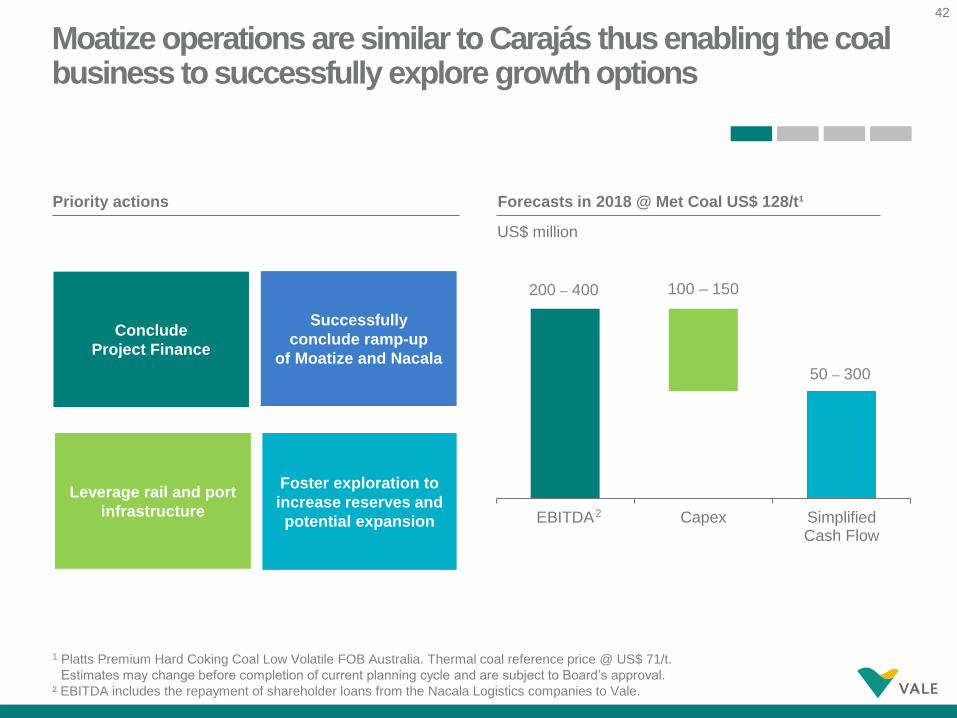
42
Moatize operations are similar to Carajás thus enabling the coal business to successfully explore growth options
42
Conclude
Project Finance
Foster exploration to
increase reserves and
potential expansion
Successfully
conclude ramp-up
of Moatize and Nacala
Leverage rail and port
infrastructure
200 – 400 100 – 150
50 – 300
EBITDA Capex SimplifiedCash Flow
1 Platts Premium Hard Coking Coal Low Volatile FOB Australia. Thermal coal reference price @ US$ 71/t.
Estimates may change before completion of current planning cycle and are subject to Board’s approval.
² EBITDA includes the repayment of shareholder loans from the Nacala Logistics companies to Vale.
Priority actions Forecasts in 2018 @ Met Coal US$ 128/t¹
US$ million
2
43
The new approved corporate structure will result in a Board of Directors empowered to make better decisions
43
• More active participation of the Board in the strategic planning process
• Empowerment of the Board in the decision process
• Focus on more relevant themes for Board discussions
• Implementation of a process to evaluate the Board’s performance
• Change in Committees structure, composition and roles to improve support
for Board decisions and focus on key themes
44
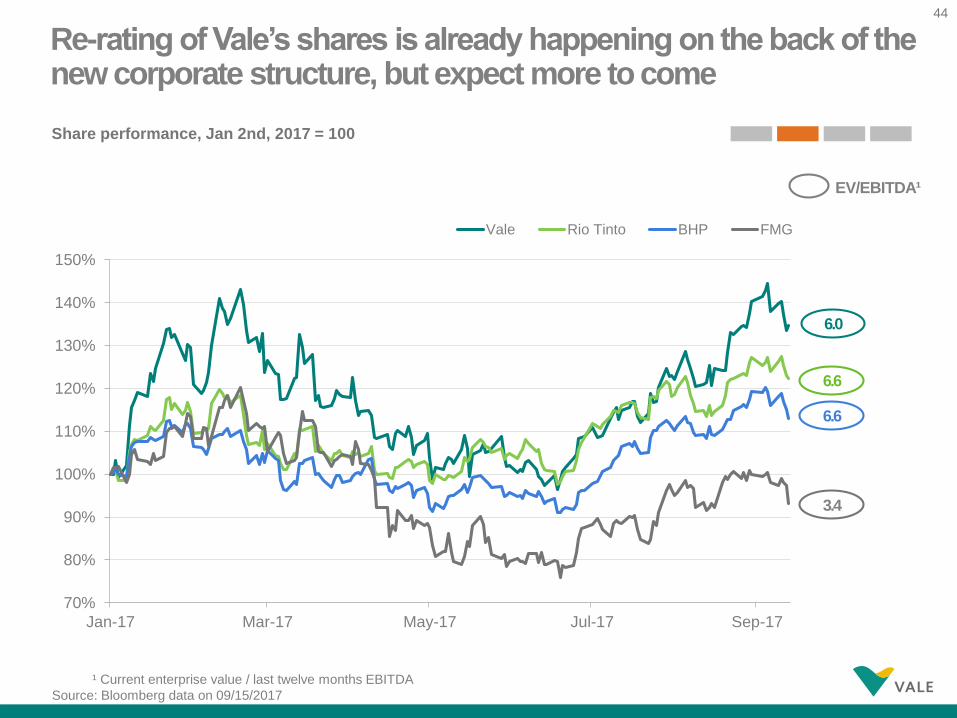
Re-rating of Vale’s shares is already happening on the back of the new corporate structure, but expect more to come
Share performance, Jan 2nd, 2017 = 100
6.0
EV/EBITDA¹
¹ Current enterprise value / last twelve months EBITDA
Source: Bloomberg data on 09/15/2017
6.6
6.6
3.4
70%
80%
90%
100%
110%
120%
130%
140%
150%
Jan-17 Mar-17 May-17 Jul-17 Sep-17
Vale Rio Tinto BHP FMG
45
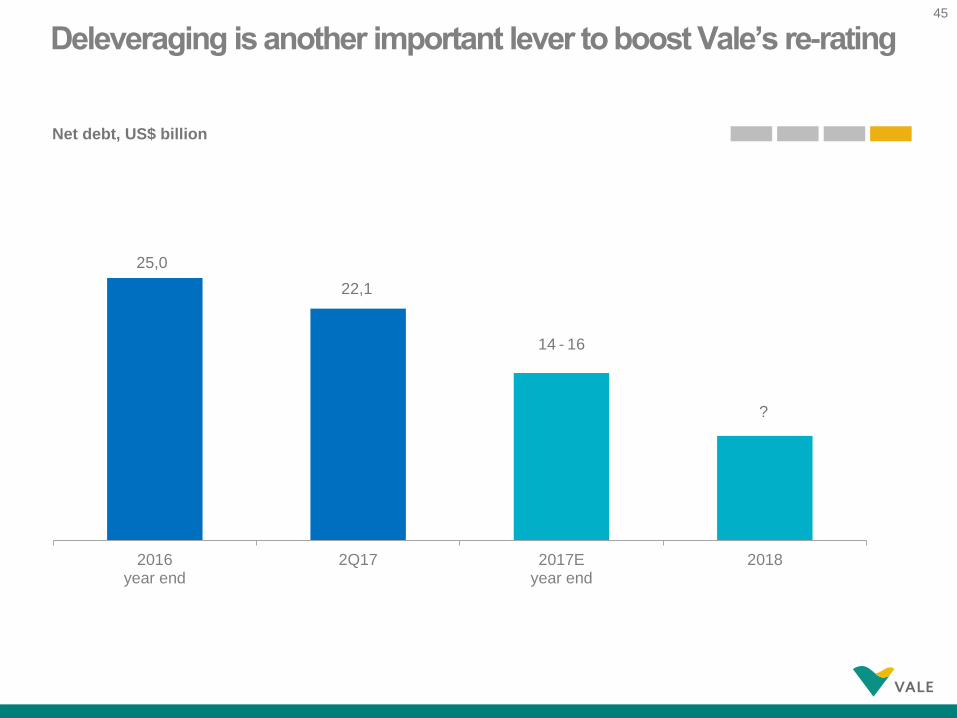
25,0
22,1
14 - 16
?
2016year end
2Q17 2017Eyear end
2018
Deleveraging is another important lever to boost Vale’s re-rating
Net debt, US$ billion
46
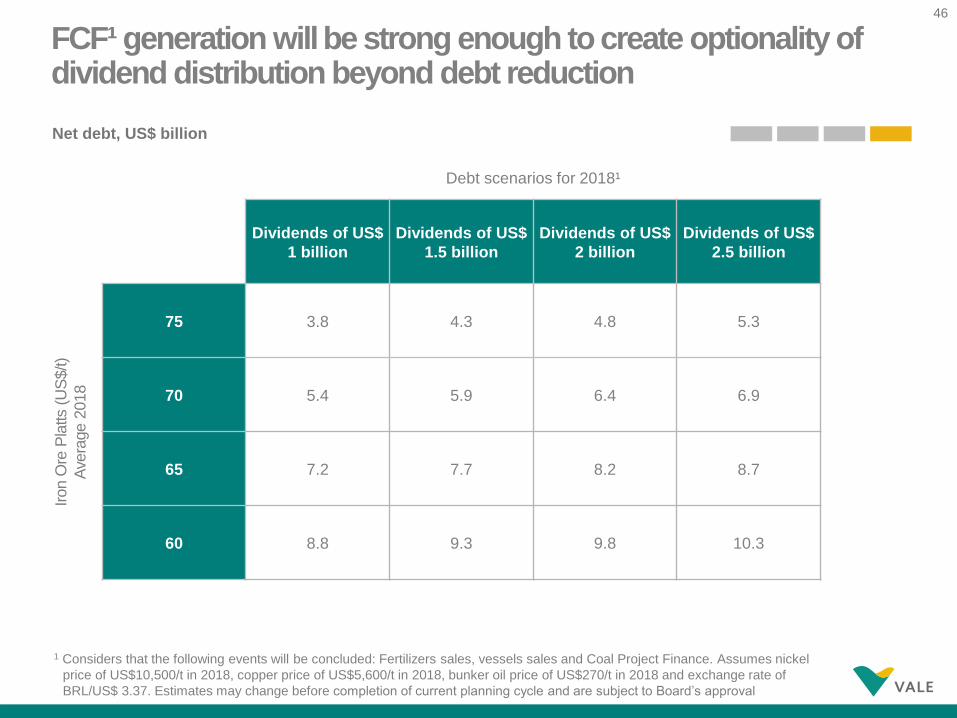
Debt scenarios for 2018¹
Dividends of US$
1 billion
Dividends of US$
1.5 billion
Dividends of US$
2 billion
Dividends of US$
2.5 billion
Iron O
re P
latts
(US
$/t)
Ave
rage
2018
75 3.8 4.3 4.8 5.3
70 5.4 5.9 6.4 6.9
65 7.2 7.7 8.2 8.7
60 8.8 9.3 9.8 10.3
FCF¹ generation will be strong enough to create optionality of dividend distribution beyond debt reduction
Net debt, US$ billion
1 Considers that the following events will be concluded: Fertilizers sales, vessels sales and Coal Project Finance. Assumes nickel
price of US$10,500/t in 2018, copper price of US$5,600/t in 2018, bunker oil price of US$270/t in 2018 and exchange rate of
BRL/US$ 3.37. Estimates may change before completion of current planning cycle and are subject to Board’s approval
47
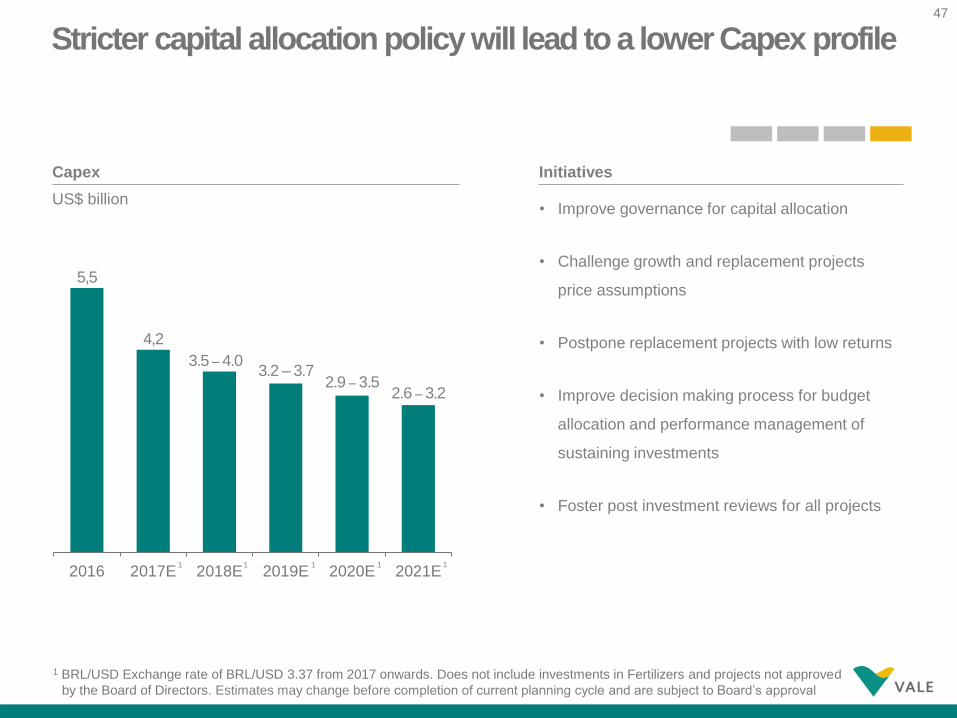
Stricter capital allocation policy will lead to a lower Capex profile
US$ billion
5,5
4,2
3.5 – 4.03.2 – 3.7
2.9 – 3.52.6 – 3.2
2016 2017E 2018E 2019E 2020E 2021E
1 BRL/USD Exchange rate of BRL/USD 3.37 from 2017 onwards. Does not include investments in Fertilizers and projects not approved
by the Board of Directors. Estimates may change before completion of current planning cycle and are subject to Board’s approval
1 1 1 1 1
• Improve governance for capital allocation
• Challenge growth and replacement projects
price assumptions
• Postpone replacement projects with low returns
• Improve decision making process for budget
allocation and performance management of
sustaining investments
• Foster post investment reviews for all projects
InitiativesCapex
48
Greater
competitiveness
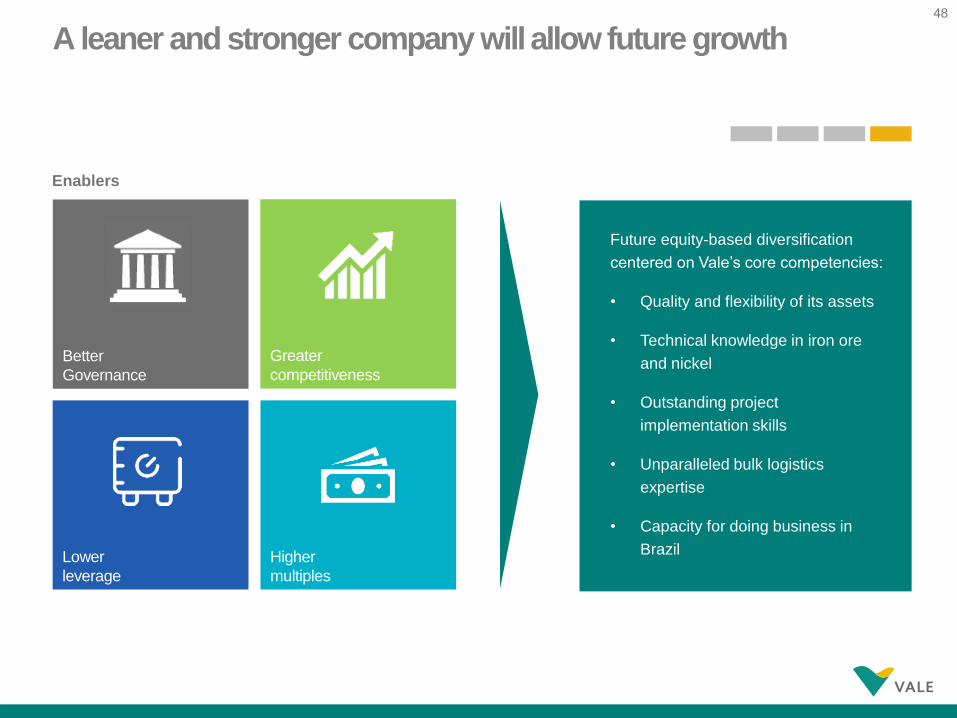
A leaner and stronger company will allow future growth
Enablers
Future equity-based diversification
centered on Vale’s core competencies:
• Quality and flexibility of its assets
• Technical knowledge in iron ore
and nickel
• Outstanding project
implementation skills
• Unparalleled bulk logistics
expertise
• Capacity for doing business in
Brazil
Better
Governance
Lower
leverage
Higher
multiples
4949