Embed Size (px)
Citation preview
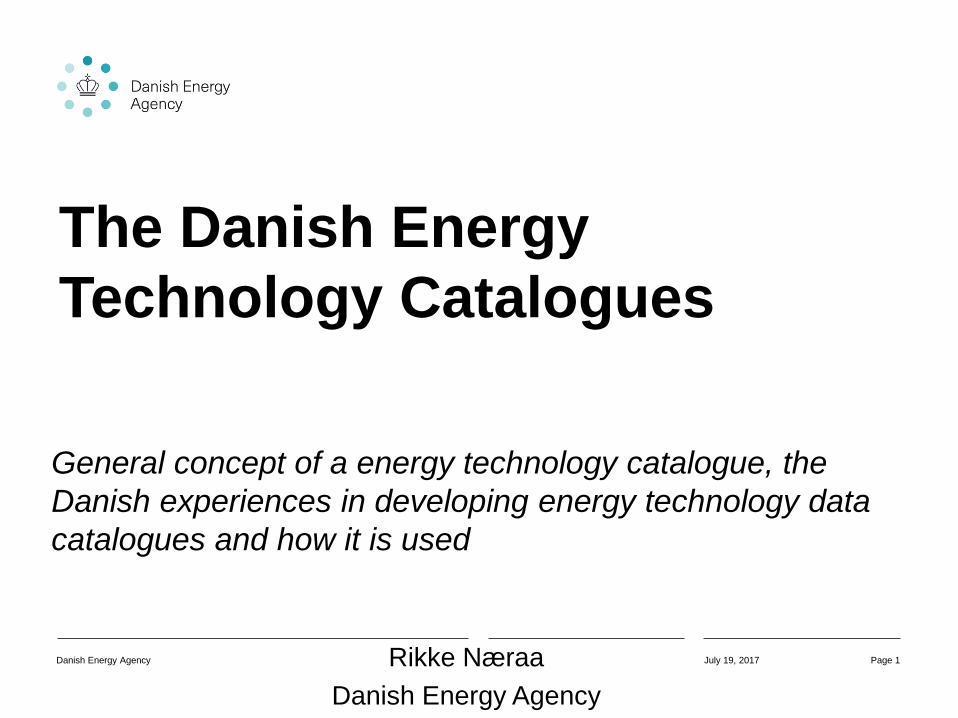
The Danish Energy
Technology Catalogues
General concept of a energy technology catalogue, the
Danish experiences in developing energy technology data
catalogues and how it is used
Rikke Næraa
Danish Energy Agency
July 19, 2017Danish Energy Agency Page 1
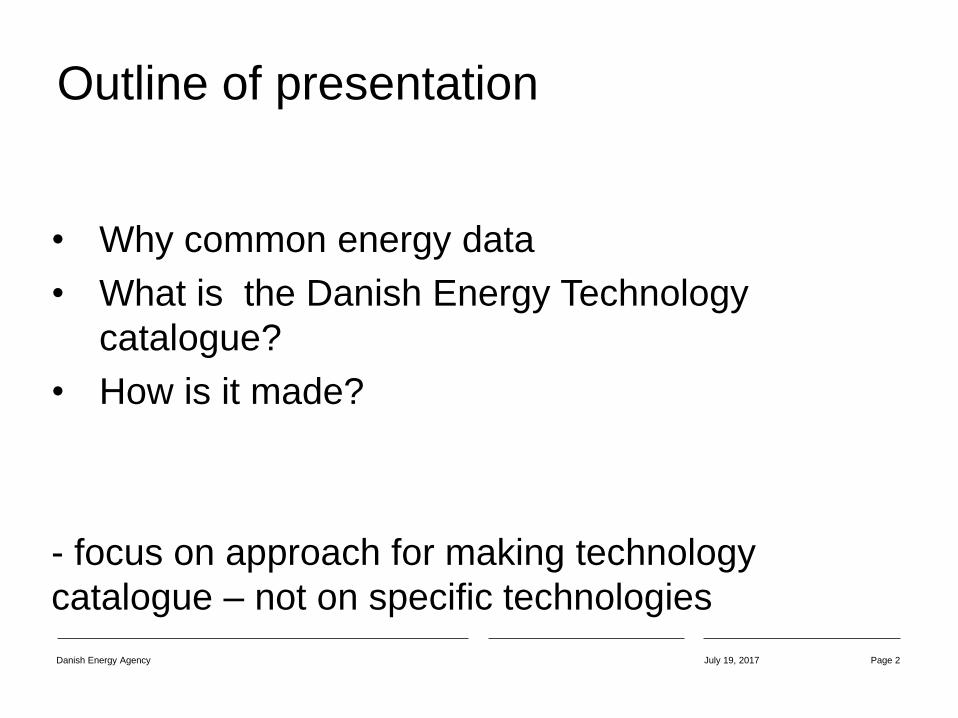
Outline of presentation
• Why common energy data
• What is the Danish Energy Technology
catalogue?
• How is it made?
- focus on approach for making technology
catalogue – not on specific technologies
July 19, 2017Danish Energy Agency Page 2
What is the Danish Energy Technology
catalogues?
• data sheets containing primarily structured,
quantitative data on status and projection of
development of costs and efficiencies and
other technology specific data.
• Data sets for e.g. 2015, 2020, 2030 and 2050
• Qualitative data descriptions
Public available
July 19, 2017Danish Energy Agency Page 3
What can TCs be used?
July 19, 2017Danish Energy Agency Page 4
• Analysis of energy systems, including economic
scenario models and total system energy planning.
• Simpler analysis of energy technologies, comparative
analysis
• Common reference point for calculations
-"Official" data on energy technologies that "all"
stakeholders can agree on. A kind of best estimate.
• Should not be used for projection and design of specific
energy installations /plants
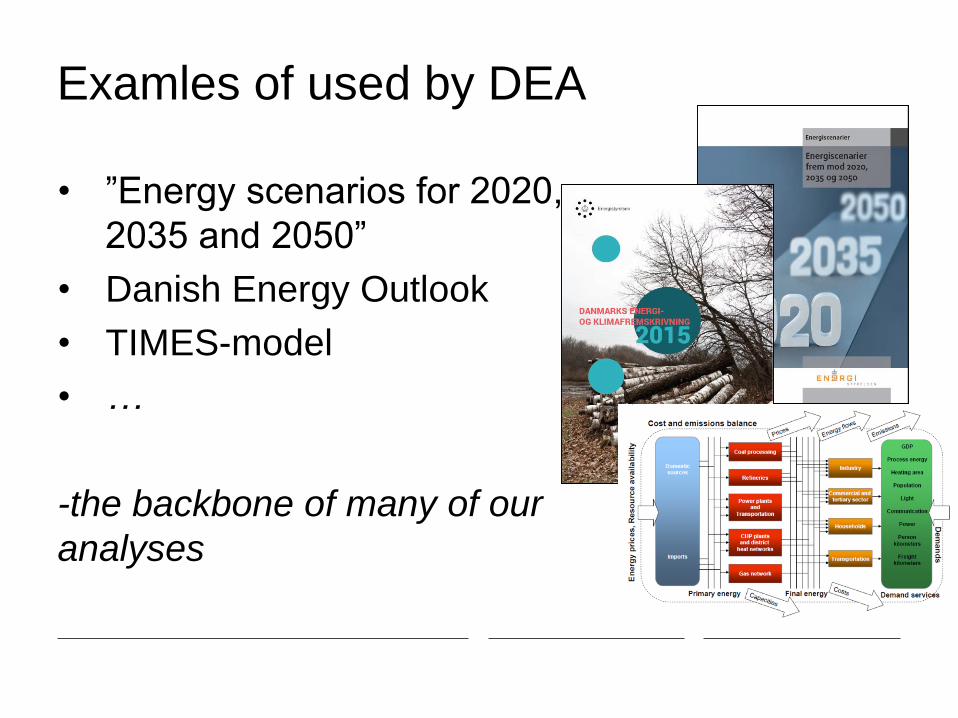
Examles of used by DEA
• ”Energy scenarios for 2020,
2035 and 2050”
• Danish Energy Outlook
• TIMES-model
• …
-the backbone of many of our
analyses
July 19, 2017Danish Energy Agency Page 6
0
20
40
60
80
100
120
140
On
sh
ore
win
d(l
arg
e)
Off
sho
re (
la
rge
)
Ph
oto
volta
tic
(larg
e)
CH
P (
Back
Pre
ssure
,m
ediu
m)
Wo
od
Ch
ips
CH
P (
Back
Pre
ssure
,m
ediu
m)
Str
aw
CH
P (
Back
Pre
ssure
,m
ediu
m)
NG
CH
P (
Extr
actio
n,
larg
e)
Woo
dP
elle
ts
CH
P (
Extr
actio
n,
larg
e)
Co
al
CH
P, re
bu
ild(E
xtr
actio
n,
larg
e)
Woo
d P
elle
ts
CH
P (
Extr
actio
n,
larg
e)
NG
A
€/M
Wh
(201
5 p
ric
es
)
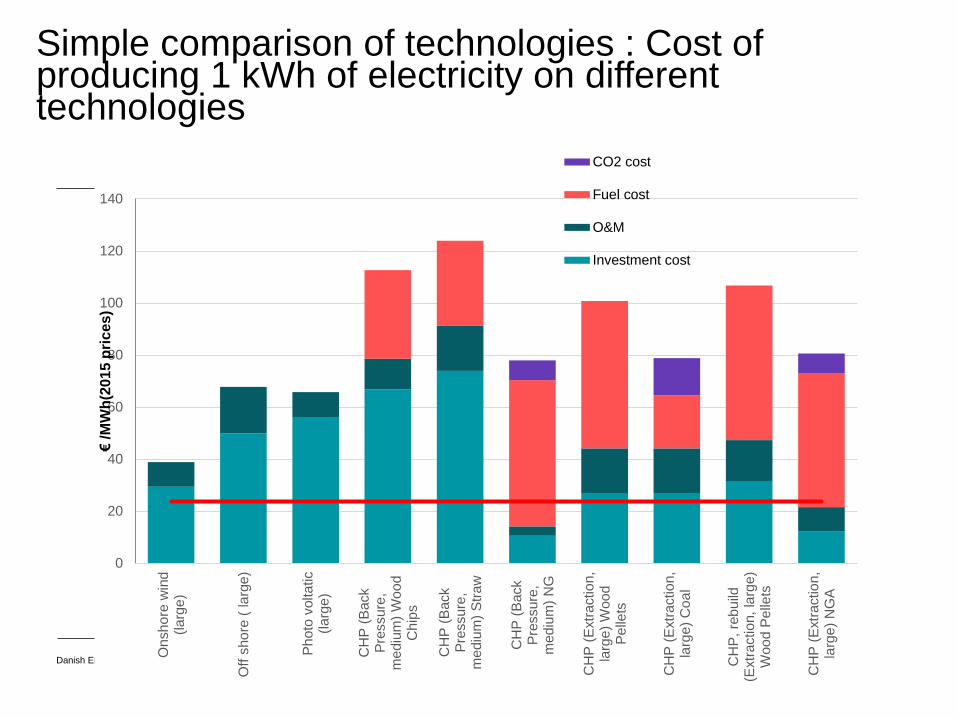
CO2 cost
Fuel cost
O&M
Investment cost
Simple comparison of technologies : Cost of producing 1 kWh of electricity on different technologies

Others
July 19, 2017Danish Energy Agency Page 7
The purpose of the TC method to
make energy technology data
Technology data that can be used for
comparisons of different energy technologies
that is general accepted of high quality and
made in a transparent process and
To ensure that the different groups working with
energy models in Denmark use the same
technology data July 19, 2017Danish Energy Agency Page 8

Purpose of Danish CT
To ensure fair competition between the
different technologies in analysis and
scenarios
to make it easier to compare results from
different energy models.
July 19, 2017Danish Energy Agency Page 9
Guidelines/Instructions
July 19, 2017Danish Energy Agency Page 10
To ensure consistency and comparability of data for
different technologies and the consistency of the
qualitative chapters and the transparency of the data .
- Detailed definitions of the parameters e.g. what is
included in the efficiency, in the investments cost, in
O&M cost, at what temperature is district heating
delivered and returned.
- How to write the qualitative sections
The relatively detailed guideline should also help the
model makers on how the data could be used in their
model
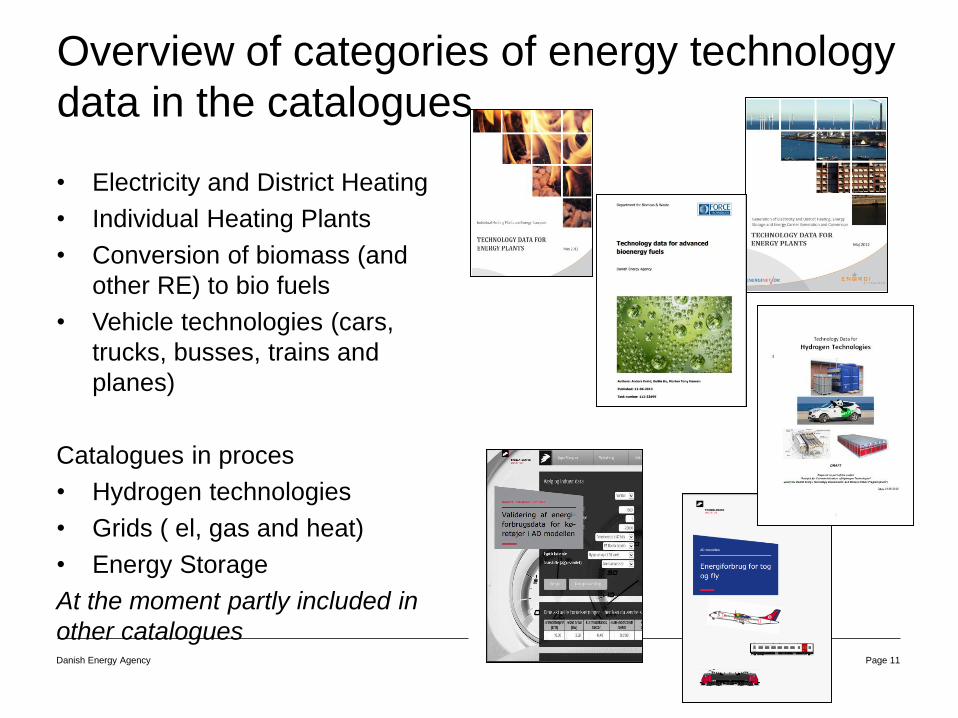
Overview of categories of energy technology
data in the catalogues
July 19, 2017Danish Energy Agency Page 11
• Electricity and District Heating
• Individual Heating Plants
• Conversion of biomass (and
other RE) to bio fuels
• Vehicle technologies (cars,
trucks, busses, trains and
planes)
Catalogues in proces
• Hydrogen technologies
• Grids ( el, gas and heat)
• Energy Storage
At the moment partly included in
other catalogues

The qualitative part of the technology
chapters
Qualitative description (should be short and not detailed)• Brief technology description
• Input
• Output
• Typical capacities
• Space requirement
• Regulation ability and other power system services
• Advantages/disadvantages
• Environment Examples of market standard technology
• Research and development perspectives
• Prediction of performance and costs
• Uncertainty
• Additional remarks
• References
What to cover in TCs?
Quantitative description
• Data Sheet
• Data for 2015, 2020, 2030 and 2050
• To be included direct in the databases for
the modelling / analyses
• Notes
• References
July 19, 2017Danish Energy Agency Page 14
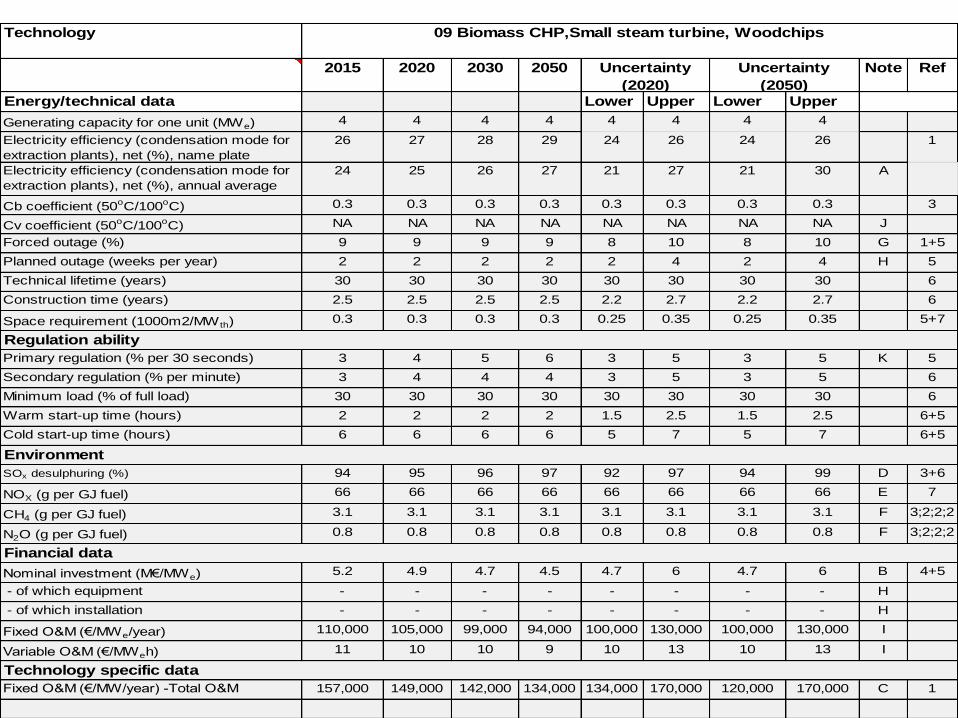
Technology
2015 2020 2030 2050 Note Ref
Energy/technical data Lower Upper Lower Upper
Generating capacity for one unit (MWe) 4 4 4 4 4 4 4 4
Electricity efficiency (condensation mode for
extraction plants), net (%), name plate
26 27 28 29 24 26 24 26 1
Electricity efficiency (condensation mode for
extraction plants), net (%), annual average
24 25 26 27 21 27 21 30 A
Cb coefficient (50oC/100oC) 0.3 0.3 0.3 0.3 0.3 0.3 0.3 0.3 3
Cv coefficient (50oC/100oC) NA NA NA NA NA NA NA NA J
Forced outage (%) 9 9 9 9 8 10 8 10 G 1+5
Planned outage (weeks per year) 2 2 2 2 2 4 2 4 H 5
Technical lifetime (years) 30 30 30 30 30 30 30 30 6
Construction time (years) 2.5 2.5 2.5 2.5 2.2 2.7 2.2 2.7 6
Space requirement (1000m2/MW th) 0.3 0.3 0.3 0.3 0.25 0.35 0.25 0.35 5+7
Primary regulation (% per 30 seconds) 3 4 5 6 3 5 3 5 K 5
Secondary regulation (% per minute) 3 4 4 4 3 5 3 5 6
Minimum load (% of full load) 30 30 30 30 30 30 30 30 6
Warm start-up time (hours) 2 2 2 2 1.5 2.5 1.5 2.5 6+5
Cold start-up time (hours) 6 6 6 6 5 7 5 7 6+5
SOx desulphuring (%) 94 95 96 97 92 97 94 99 D 3+6
NOX (g per GJ fuel) 66 66 66 66 66 66 66 66 E 7
CH4 (g per GJ fuel) 3.1 3.1 3.1 3.1 3.1 3.1 3.1 3.1 F 3;2;2;2
N2O (g per GJ fuel) 0.8 0.8 0.8 0.8 0.8 0.8 0.8 0.8 F 3;2;2;2
Nominal investment (M€/MWe) 5.2 4.9 4.7 4.5 4.7 6 4.7 6 B 4+5
- of which equipment - - - - - - - - H
- of which installation - - - - - - - - H
Fixed O&M (€/MWe/year) 110,000 105,000 99,000 94,000 100,000 130,000 100,000 130,000 I
Variable O&M (€/MWeh) 11 10 10 9 10 13 10 13 I
Fixed O&M (€/MW/year) -Total O&M 157,000 149,000 142,000 134,000 134,000 170,000 120,000 170,000 C 1
Regulation ability
Environment
Financial data
Technology specific data
09 Biomass CHP,Small steam turbine, Woodchips
Uncertainty
(2020)
Uncertainty
(2050)
How is the data in the TC provided;
2015 data
- From specific projects recently build
/contracted
- National register /statistics
- Expert assessments
- National studies /surveys
- International studies/ /surveys
July 19, 2017Danish Energy Agency Page 15
Marked standard not BAT
Market standards (if established):
- performance and cost data of recent installed
versions of the technology in Denmark or the
most similar countries in relation to the specific
technology in Northern Europe for the 2015
estimates.
July 19, 2017Danish Energy Agency Page 16
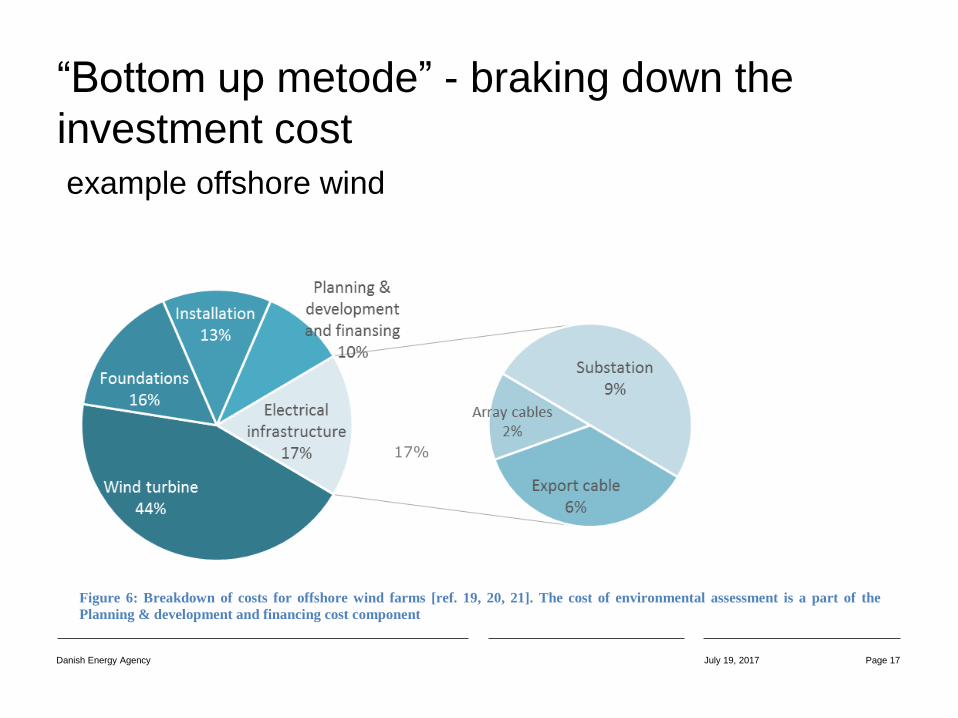
“Bottom up metode” - braking down the
investment cost
example offshore wind
July 19, 2017Danish Energy Agency Page 17
Figure 6: Breakdown of costs for offshore wind farms [ref. 19, 20, 21]. The cost of environmental assessment is a part of the
Planning & development and financing cost component
17%
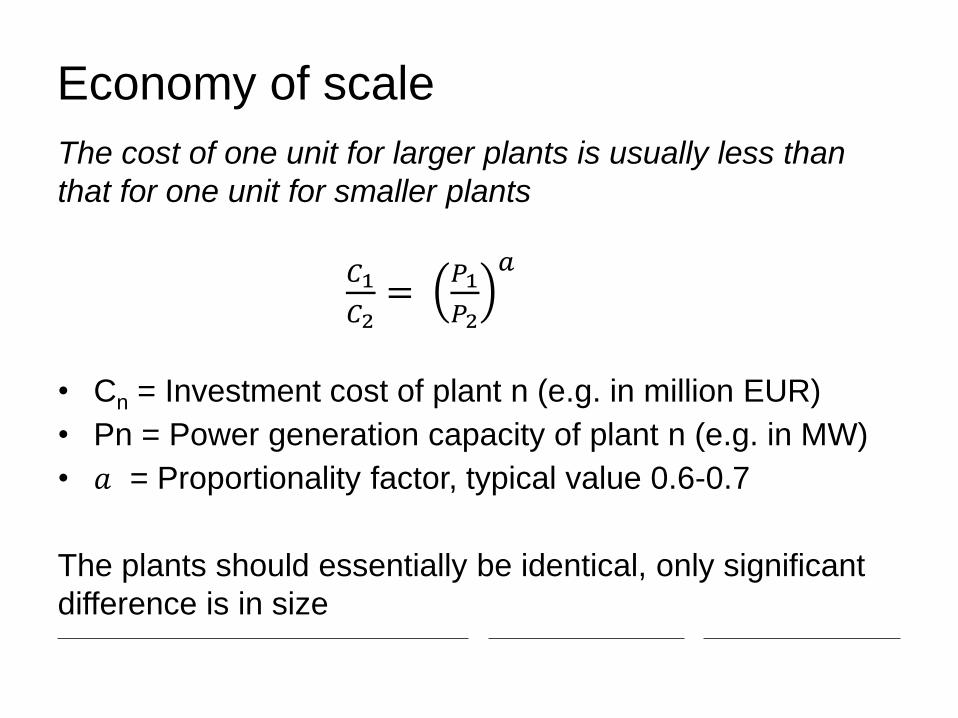
Economy of scale
The cost of one unit for larger plants is usually less than
that for one unit for smaller plants
𝐶1
𝐶2=
𝑃1
𝑃2
𝑎
• Cn = Investment cost of plant n (e.g. in million EUR)
• Pn = Power generation capacity of plant n (e.g. in MW)
• 𝑎 = Proportionality factor, typical value 0.6-0.7
The plants should essentially be identical, only significant
difference is in size
Energy efficiency
• Technical experts
• National register
• Data through international sources, e.g. IEA
• Evaluation in relation to national context.
July 19, 2017Danish Energy Agency Page 19

Notes
• Notes are made to add further detail to data
• Notes is important to ensure transparency –
especially if references not used directly
July 19, 2017Danish Energy Agency Page 20

Data for 2020, 2030 and 2050
Prediction of future data
Aiming at no empty cells, prefer the same ”wrong”
guess

Data for 2020, 2030 and 2050
Prediction of efficiencies, few and not well
established methods
Two approaches:
• Expert judgements – especially for identifying
barriers
• Reference technologies giving upper and lower
limits
Data for 2020, 2030 and 2050
Prediction of costs:
Examples of methodes
• Simple learning curve (with fixed yearly
improvement)
• bottom-up approaches
• expert judgements
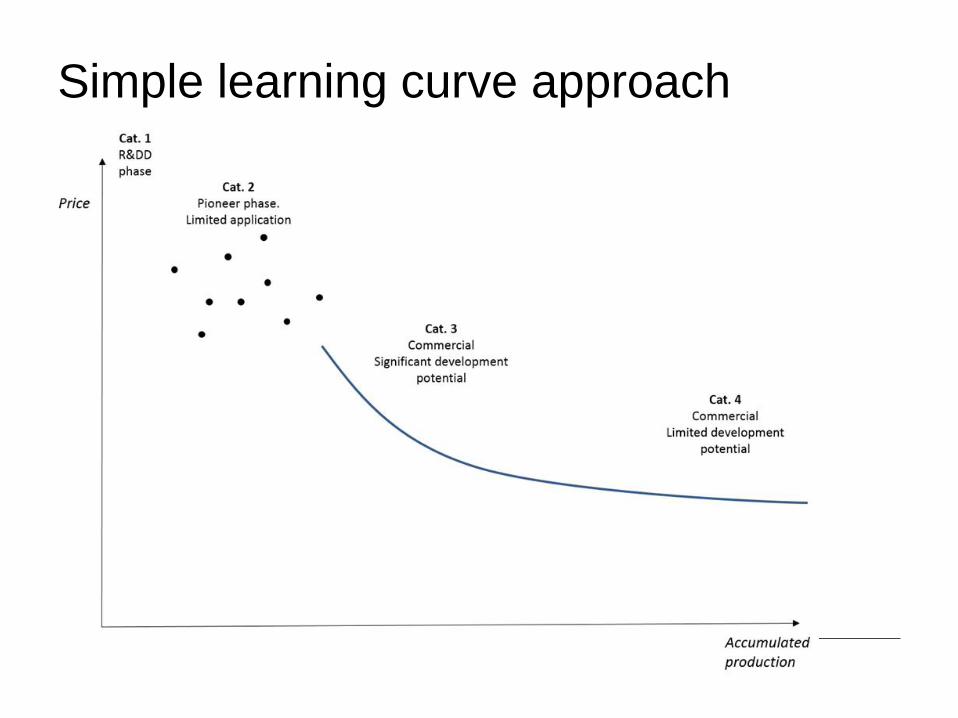
Simple learning curve approach

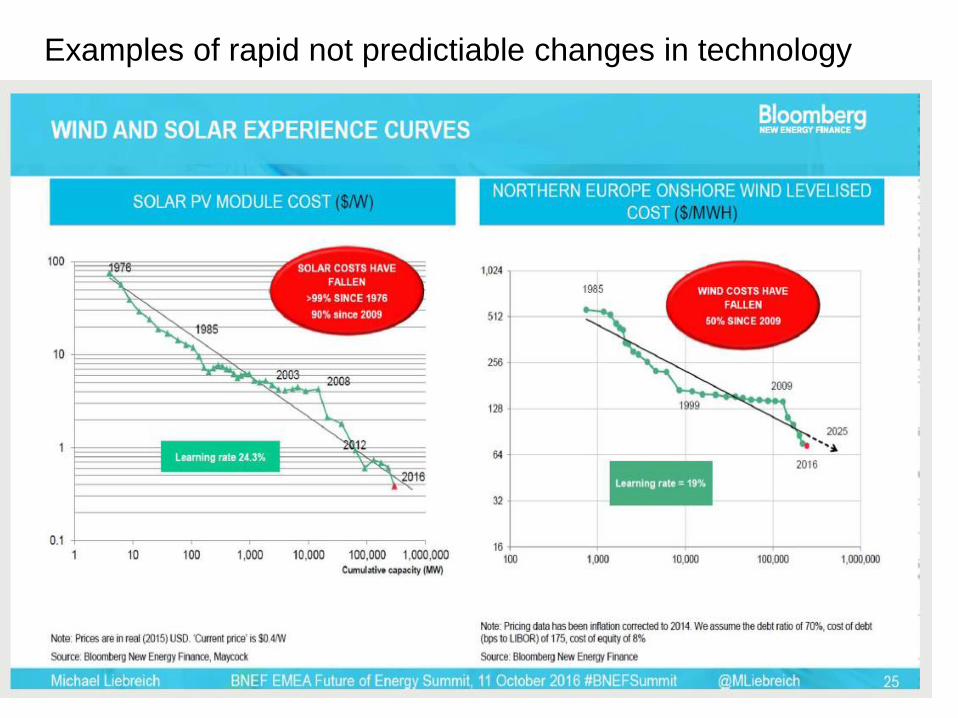
Examples of rapid not predictiable changes in technology
data
Hvornår skal vi reagere
- Vurdering er det enlig svale eller tendes
19. juli 2017 Side 26Energistyrelsen

Examples of rapid not predictiable changes in technology
data
Hvornår skal vi reagere
- Vurdering er det enlig svale eller tendes
19. juli 2017 Side 27Energistyrelsen
X Krigers Flak

Example of lack in the capacity of making
predictions PV Large ground mounted
July 19, 2017Danish Energy Agency Page 28
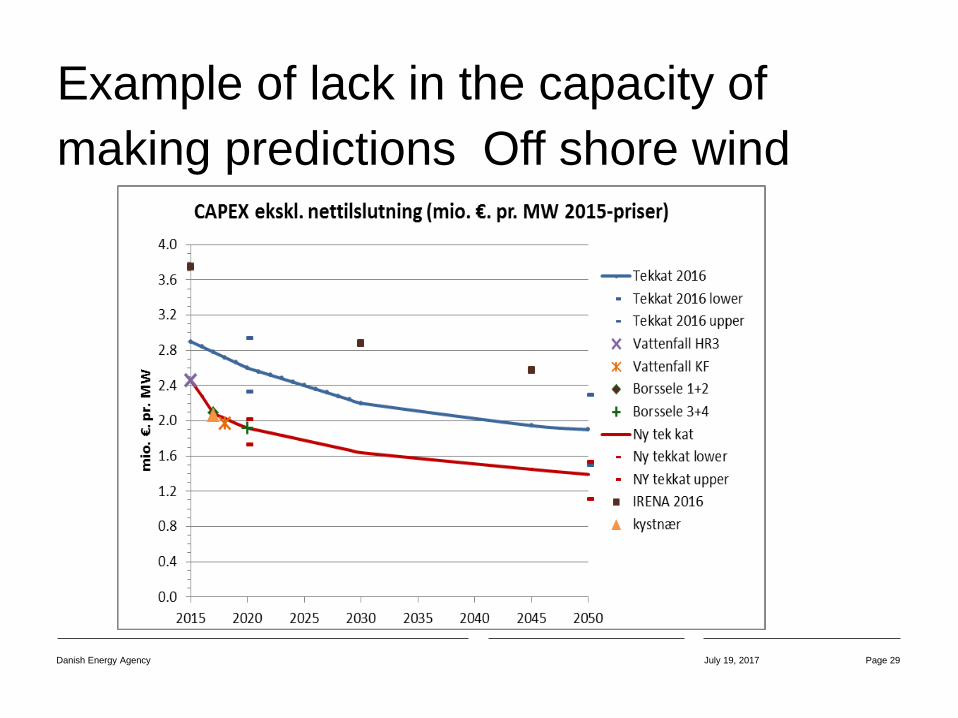
Example of lack in the capacity of
making predictions Off shore wind
July 19, 2017Danish Energy Agency Page 29
The steps in the process to develop
and maintain Energy Technology
Catalogue
• Identify relevant technology
• get valid data especially in terms of costs and
efficiencies for now and for the future
• Get acceptance of data
July 19, 2017Danish Energy Agency Page 30
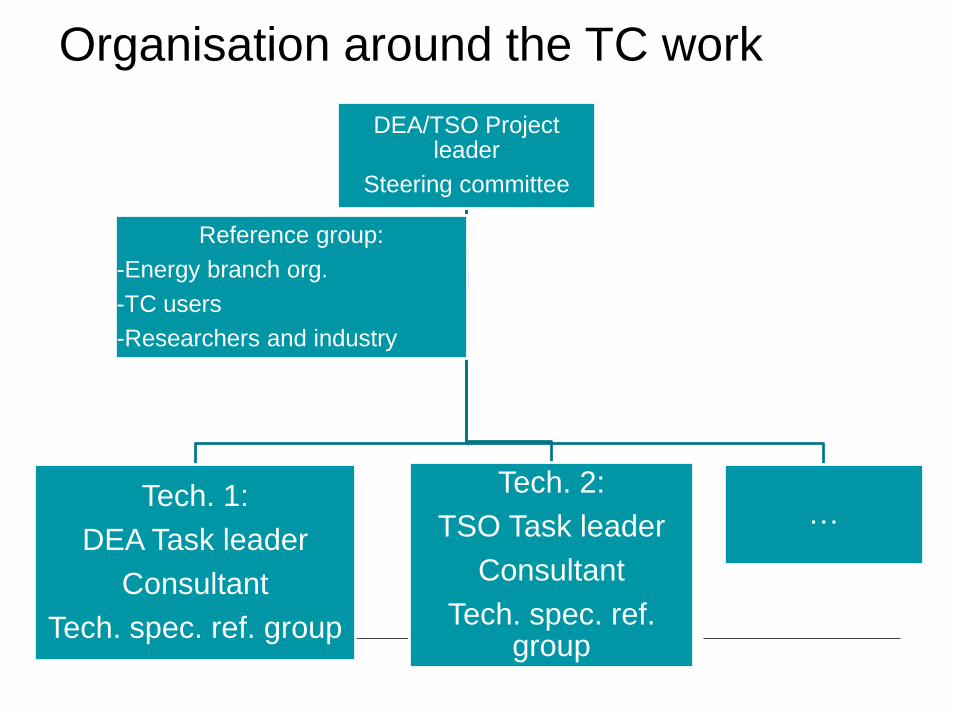
Organisation around the TC work
DEA/TSO Project leader
Steering committee
Tech. 1:
DEA Task leader
Consultant
Tech. spec. ref. group
Tech. 2:
TSO Task leader
Consultant
Tech. spec. ref. group
…
Reference group:
-Energy branch org.
-TC users
-Researchers and industry
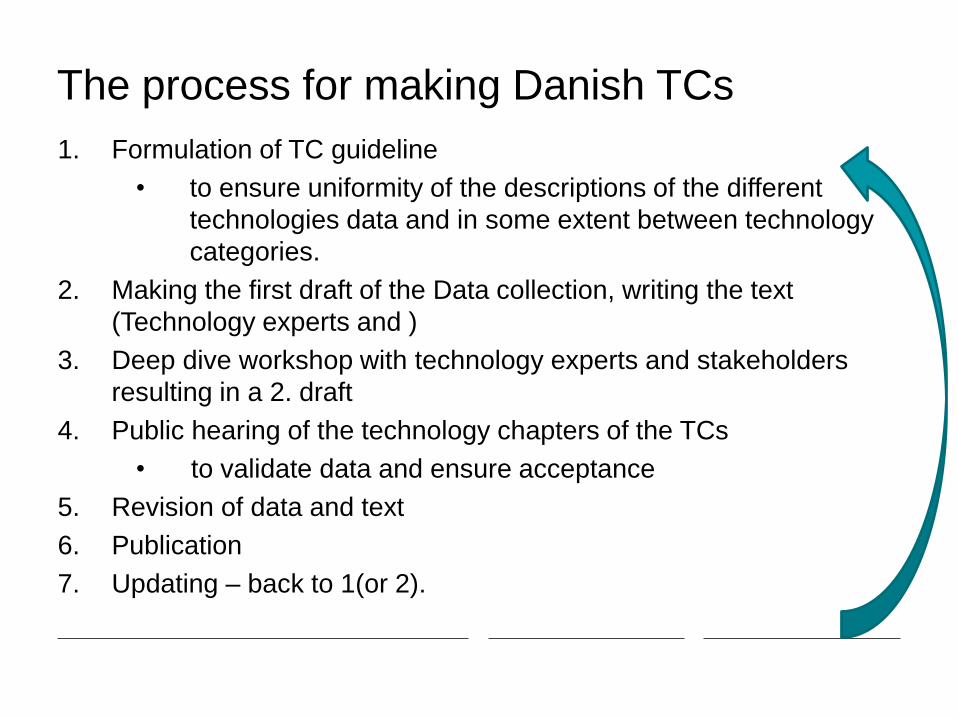
The process for making Danish TCs
1. Formulation of TC guideline
• to ensure uniformity of the descriptions of the different
technologies data and in some extent between technology
categories.
2. Making the first draft of the Data collection, writing the text
(Technology experts and )
3. Deep dive workshop with technology experts and stakeholders
resulting in a 2. draft
4. Public hearing of the technology chapters of the TCs
• to validate data and ensure acceptance
5. Revision of data and text
6. Publication
7. Updating – back to 1(or 2).
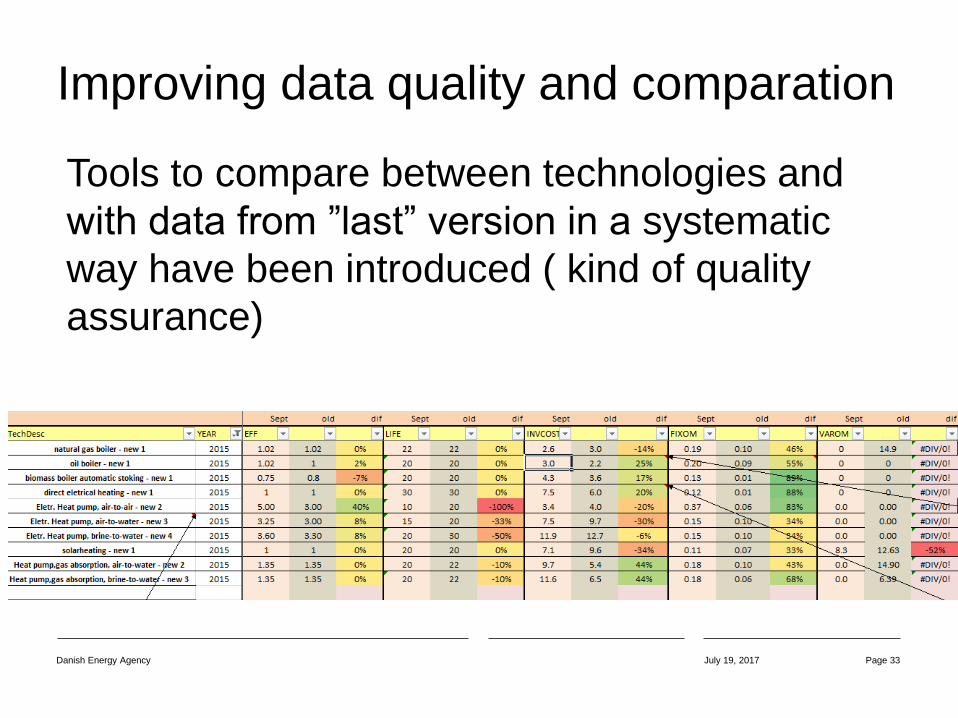
Improving data quality and comparation
Tools to compare between technologies and
with data from ”last” version in a systematic
way have been introduced ( kind of quality
assurance)
July 19, 2017Danish Energy Agency Page 33
Who is the best to make the TC
Energy technology experts (expert in the
specific technology)
Energy consultants(technical) using energy
models themselve
July 19, 2017Danish Energy Agency Page 34
The value of international foreign TCs
TCs can be used in other contexts, but:
• May not be accepted by stakeholders
• Costs of installations are likely to be
different
• Technology ‘preferences’ may differ
• May not include the relevant technologies
But a cooperation is seen as beneficial for all

Other Technologi catalogs?
- possible cooperation ?
IRENA
IEA-NEA
JRC
Ecofys
NVE (Norway)
ELFORSK Sweden
Frauenhofer
July 19, 2017Danish Energy Agency Page 36

Thank youwww.ens.dk
July 19, 2017Danish Energy Agency
Rikke Næraa ([email protected])
Page 37
The Danish Energy Technology catalogues is
public available and can be found:
https ://ens.dk/en/our-services/projections-and-
models/technology-data .
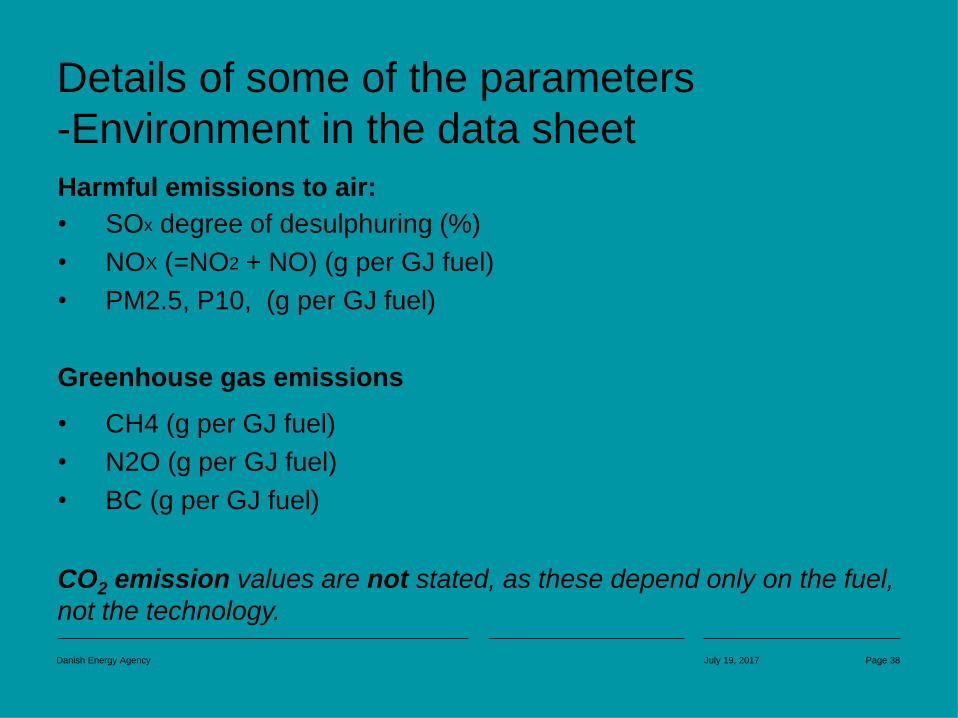
Details of some of the parameters
-Environment in the data sheet
Harmful emissions to air:
• SOx degree of desulphuring (%)
• NOX (=NO2 + NO) (g per GJ fuel)
• PM2.5, P10, (g per GJ fuel)
Greenhouse gas emissions
• CH4 (g per GJ fuel)
• N2O (g per GJ fuel)
• BC (g per GJ fuel)
CO2 emission values are not stated, as these depend only on the fuel,
not the technology.
July 19, 2017Danish Energy Agency Page 38
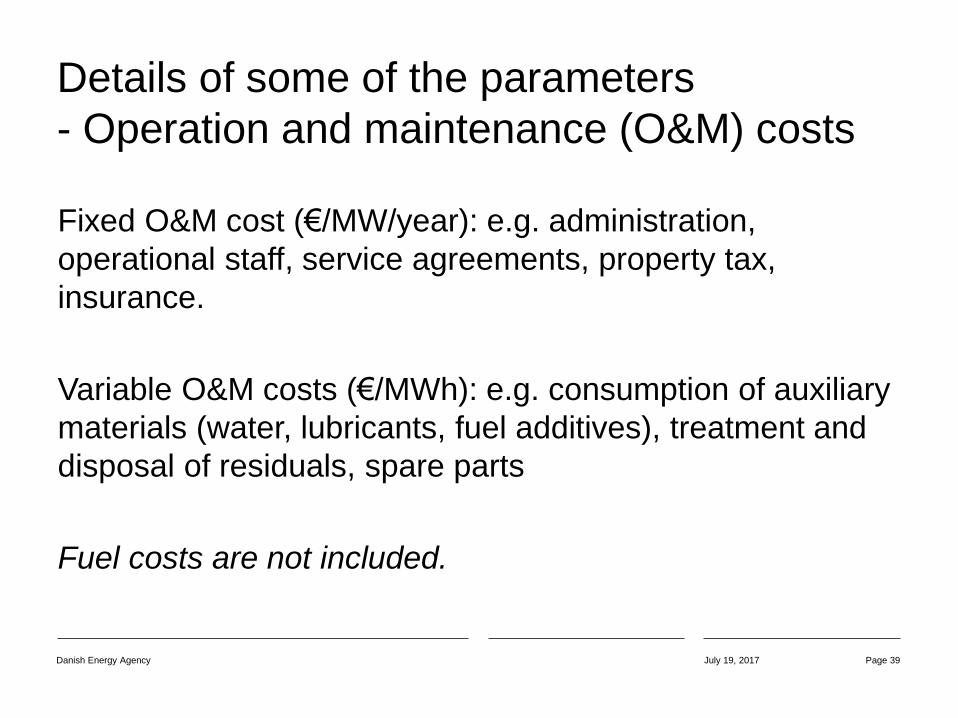
Details of some of the parameters
- Operation and maintenance (O&M) costs
Fixed O&M cost (€/MW/year): e.g. administration,
operational staff, service agreements, property tax,
insurance.
Variable O&M costs (€/MWh): e.g. consumption of auxiliary
materials (water, lubricants, fuel additives), treatment and
disposal of residuals, spare parts
Fuel costs are not included.
July 19, 2017Danish Energy Agency Page 39
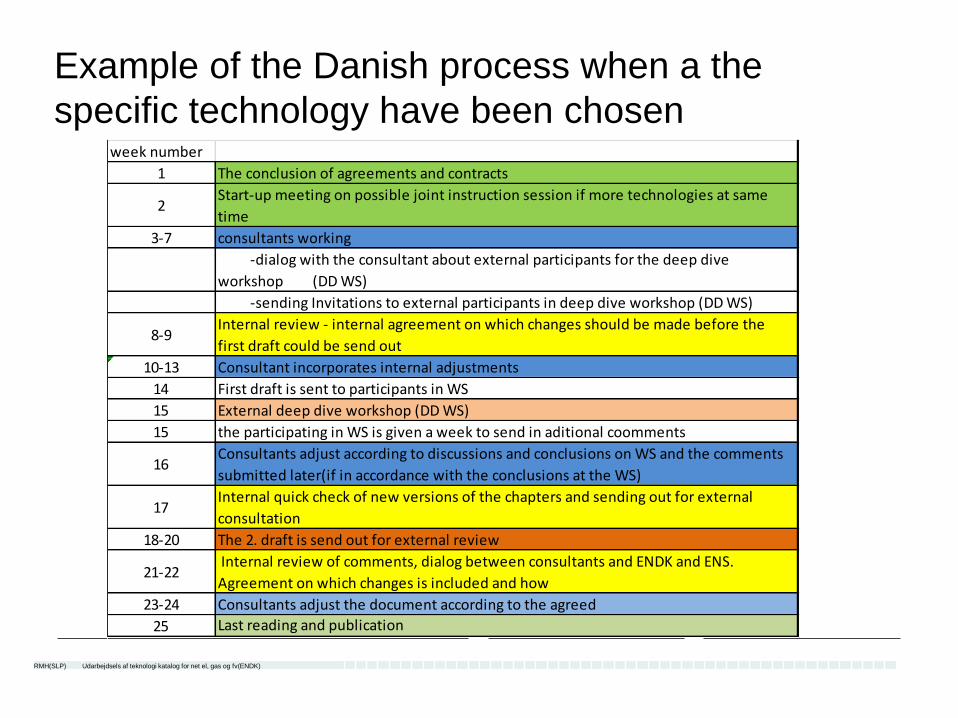
Detailed overview of the process
week number
1 The conclusion of agreements and contracts
2Start-up meeting on possible joint instruction session if more technologies at same
time
3-7 consultants working
-dialog with the consultant about external participants for the deep dive
workshop (DD WS)
-sending Invitations to external participants in deep dive workshop (DD WS)
8-9Internal review - internal agreement on which changes should be made before the
first draft could be send out
10-13 Consultant incorporates internal adjustments
14 First draft is sent to participants in WS
15 External deep dive workshop (DD WS)
15 the participating in WS is given a week to send in aditional coomments
16Consultants adjust according to discussions and conclusions on WS and the comments
submitted later(if in accordance with the conclusions at the WS)
17Internal quick check of new versions of the chapters and sending out for external
consultation
18-20 The 2. draft is send out for external review
21-22 Internal review of comments, dialog between consultants and ENDK and ENS.
Agreement on which changes is included and how
23-24 Consultants adjust the document according to the agreed
25 Last reading and publication
Example of the Danish process when a the
specific technology have been chosen
RMH(SLP) Udarbejdsels af teknologi katalog for net el, gas og fv(ENDK)

Choice of technologies
Two approaches
• Stakeholder approach
• ‘Analytical approach’
Choice of technologies
Stakeholder approach
• Which to include:
• Users of the TCs
• Researchers
• Industry
July 19, 2017Danish Energy Agency Page 42

Choice of technologies
‘Analytical approach’:
– Step 1: Identify technologies on the basis of
inputs and outputsEthanol Methanol Butanol HVO FAME
Syn/FT
diesel
Feedstocks
Sugar cane
Straw BK (2)
Residues
forrestBK (2) TK(2)
Algee TK(2) 5 TK(2)
Corn stover BK (2),5 TK(2) TK(2)
Bagasse BK (2) TK(2)
Cellucosic
residues(TK(2)) (TK(2)) (TK(2)) TK(2)
BK(3)
Miscanthus BK (2)
Paper waste

Choice of technologies
‘Analytical approach’:
– Step 2:Identify relevant technologies based
on needs
…
.
.

Choice of technologies
‘Analytical approach’:
– Step 3: Identify feedstocks
Choice of technologies
Other potential ‘filters’:
• Location of feedstocks, consumers and
infrastructure
• …
• Industrial branches to be prioritised
• Certain knowhow to be utilised/supported
Identify shortlist

Experience curves

Experience curves – cumulative
production
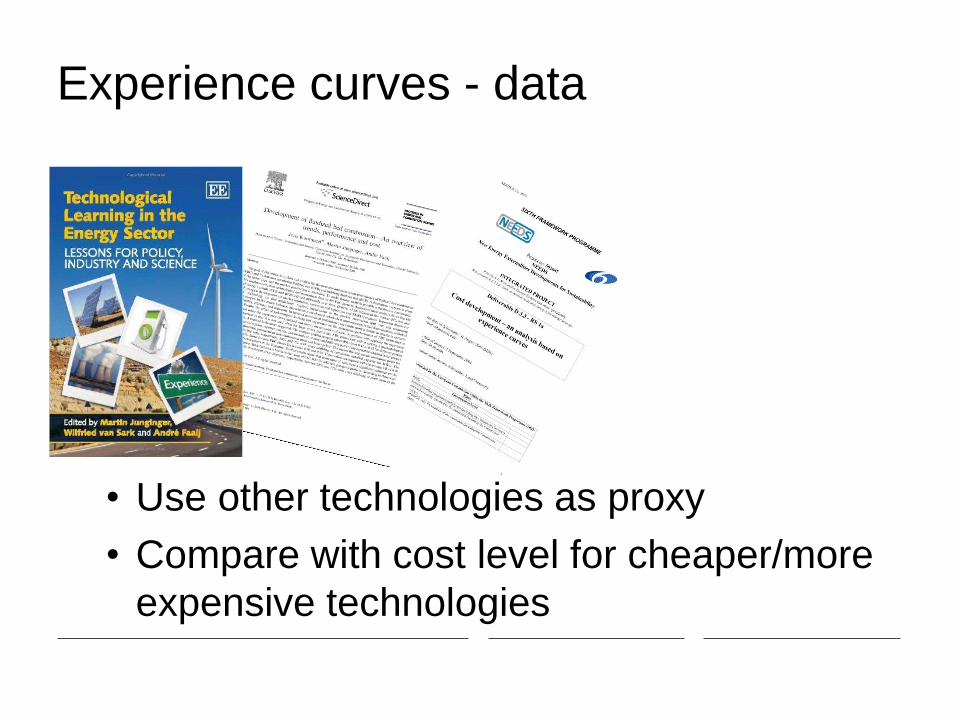
Experience curves - data
• Use other technologies as proxy
• Compare with cost level for cheaper/more
expensive technologies