Embed Size (px)
Citation preview

The Effect of Ownership Structure and Board Independence on Firm Value: Evidence from Controlled Companies
Dain C. Donelson
The University of Texas at Austin [email protected]
Jennifer L. Glenn
Texas A&M University [email protected]
Christopher G. Yust
Texas A&M University [email protected]
October 2018
Key words: Controlled Companies, Corporate Governance, Information Asymmetry, Earnings Management, Investment, Family Firms, Dual-Class Firms
JEL Codes: D82, G32, G34, G38, M41, M48
Abstract: Controlled companies are public firms in which an individual, group or company holds more than 50 percent of the voting power. These firms are an economically significant part of the economy but are not directly examined by prior research. Importantly, they may opt out of independence requirements for the board and certain committees mandated by the major stock exchanges. Despite concerns about whether controlled companies act in shareholders’ best interests, they exhibit a valuation premium. Exploring whether this premium is justified, controlled companies invest less efficiently, driven by firms with low board independence. Low board independence firms also engage in more earnings management, masked by higher levels of information asymmetry. Given these results, it is perhaps unsurprising that the valuation premium is concentrated in small firms with more individual investors. Overall, controlled companies are distinct ownership structures, and allowing them to opt out of independence requirements may have negative implications. We thank Anwer Ahmed, Brad Hepfer and Tara Vakil for helpful comments. We also thank Patrick Celsus, Marisa Galvan, Kendall Raisbeck and Rachel Taylor for data collection assistance. We gratefully acknowledge research support provided by the Red McCombs School of Business and the Mays Business School. All errors are our own.

1
1. Introduction
This study revisits how ownership structure and board independence affect firm value by
exploring controlled companies—a unique corporate ownership structure. Controlled companies
are public firms in which an individual, group or company holds over 50 percent of the voting
power. These firms may opt out of the independence requirements that apply to all other public
firms, as mandated by the major stock exchanges in Sarbanes-Oxley related reforms. Thus, they
are not required to have a majority independent board or fully independent governance,
nominating or compensation committees (NYSE 2013; NASDAQ 2015). Despite these major
exemptions, this is the first study to examine the relation between the controlled company
structure and firm value and how this relation varies with the board independence level.
Understanding the valuation implications of the controlled company structure is
important for academic and policy reasons. Controlled companies are a significant subset of the
economy, with a mean market capitalization of approximately $3 billion in 2012 (the final year
of our sample), and include many prominent firms, such as Time Warner and Facebook.
However, despite recent media attention about whether this structure is optimal for shareholders
(e.g., McKenna 2012; Murphy 2013; Seave 2016), these firms are virtually unstudied.1 While
these firms are related to, and partially overlap with, dual-class and family firms, many
controlled companies are distinct from both of these other ownership forms. Thus, it is important
to study controlled companies to increase our understanding of widely used ownership structures
in the capital markets and their implications for firm value. Moreover, because the independence
reforms were instituted to restore investor confidence after several accounting scandals, it is
important to examine the implications of exempting firms from these governance mandates.
1 In the rare instances where prior research has defined “controlled companies” using various definitions, it is generally only to exclude them from the sample (e.g., Armstrong et al. 2014; Krishnan et al. 2011).

2
Numerous studies examine whether formal (e.g., staggered boards) or informal (e.g.,
family firms) governance structures lead to agency costs that affect firm value. In the same way,
investor valuations and firm decisions for controlled companies may differ from those of other
firms. Although controlled companies share many characteristics with both family and dual-class
firms, it is unclear, ex ante, how controlled companies’ unique combination of concentrated
control and corporate governance exemptions will affect these firms. Because many controlled
companies are also majority owned by the party controlling the firm, this may align the owners’
economic incentives with those of shareholders, leading to fewer agency conflicts and greater
value maximization (Demsetz and Lehn 1985; Morck et al. 1988). However, this ownership
structure may also facilitate entrenchment and rent extraction at the expense of other
shareholders, leading to lower firm value (Morck et al. 1988).
Strong governance mechanisms can mitigate agency conflicts that arise from one party
controlling the majority of the voting power (Baran and Forst 2015), so higher levels of board
independence may improve firm value for controlled companies. However, because these firms
can opt out of the board reform rules or the controlling company could potentially reshape the
board to its liking at any point (see Murphy 2013), it is unclear whether board independence will
positively affect their firm value. Conversely, higher levels of board independence can harm firm
value by reducing the advisory role of the board and specialized knowledge of insiders (Faleye et
al. 2011). In fact, controlled company advocates argue their structure gives them “freedom from
addressing short-term market pressure… to make long-term investments in areas such as
research and development and capital projects” (IRRC Institute 2016, 24-25).
We hand-collect data on whether the firm is a controlled company and claims the
governance exemption from firm proxy statements from 2006 through 2012. To examine

3
whether controlled companies exhibit an incremental valuation premium, we first test the
relation between controlled companies and Tobin’s q for our full sample after controlling for
numerous firm characteristics, including whether the firm is also a family or dual-class firm. To
triangulate our tests, we also examine the relation between controlled companies and stock
returns. We then investigate potential mechanisms by which firm value may be affected by
examining the relation between controlled companies and firm investment, information
asymmetry and earnings management. To mitigate endogeneity concerns that controlled
companies are different from non-controlled companies and these differences drive results, we
use entropy balancing in our main tests to ensure that treatment and control firms are similar on
observable dimensions (Hainmueller 2012). While we control for board independence in our
initial tests, we then split our sample into high and low board independence subsamples to better
disentangle the effect of board independence from other ownership structure features.
We find a positive and significant relation between controlled companies and Tobin’s q,
suggesting that controlled companies carry a valuation premium relative to other companies.
This result is concentrated in the low board independence subsample. In contrast, we find no
evidence of a relation between controlled companies and Tobin’s q for the high board
independence sample, and the difference in the effect across the two subsamples is statistically
significant. Thus, inconsistent with concerns expressed by investors and the media (IRRC
Institute 2016; Seave 2016), controlled companies and, particularly those with lower board
independence, have higher firm value. To further examine and validate this result, we examine
portfolio returns for controlled companies and non-controlled companies using a four-factor
asset pricing model (Carhart 1997; Fama and French 1997). Consistent with the findings of our
Tobin’s q tests, we find that portfolios of controlled companies generate a positive and

4
significant alpha while we find no evidence of a similar result for non-controlled companies.
We then investigate whether controlled companies have different levels of investment
and investment efficiency to justify the higher valuations. However, we find controlled
companies make less efficient investments in R&D, capital and advertising for the full sample
and both less efficient investments and less total investment in the low board independence
sample. In contrast, we find no evidence that controlled companies are associated with either of
these measures in the high board independence sample, although the difference between the two
subsamples is not statistically significant. Thus, the higher valuation does not appear justified by
controlled companies engaging in better investments.
We next investigate whether the higher valuation may be due in part to a combination of
information asymmetry and earnings management, potentially artificially inflating firm value.
That is, at least some of the positive valuation may be due to controlled companies managing
earnings to maintain overvaluation (Jensen 2005). Higher levels of information asymmetry are
required for such a strategy to be effective or investors would unwind the earnings management
(Dye 1988; Richardson 2000; Cassell et al. 2015). We proxy for information asymmetry using
the bid-ask spread and stock return volatility (Ali et al. 2007; Bushee and Noe 2000), and we
proxy for earnings management using accrual quality and restatements.
In our full sample, controlled companies have greater bid-ask spreads but an insignificant
relation to stock return volatility. However, controlled companies in the low board independence
subsample have both greater bid-ask spreads and volatility, consistent with higher information
asymmetry between these controlled companies and their shareholders. However, we find no
evidence of greater bid-ask spreads or volatility in the high independence subsample, and the
difference between the two subsamples is statistically significant. We then examine earnings

5
management and fail to find a relation between controlled companies and accrual quality or
restatements in the full sample. However, consistent with information asymmetry facilitating
earnings management, controlled companies in the low board independence sample have lower
accrual quality and are more likely to restate. In contrast, we find no evidence of a higher
restatement rate for controlled companies in the high independence sample and find they have
higher accrual quality, consistent with greater monitoring mitigating earnings management
(Klein 2002). While the difference in the restatement rates in the two subsamples is not
statistically significant, the difference is significant for accrual quality.
Finally, given the prior results, we examine a potential behavioral-based reason for the
controlled company valuation premium. That is, we examine whether the firm value result is
driven by retail investors looking to get in on the ground floor of the next Facebook or Google,
perhaps due to investor overconfidence (Barber and Odean 2000), wishful thinking leading to
unjustified valuations in the market (Seybert and Bloomfield 2009) or because the attention-
grabbing nature of these firms lead investors to form overly optimistic valuations (Barber and
Odean 2007). Specifically, we first partition our sample based on a dependent sort by year of
firm size and institutional ownership. We find a positive and significant relation between
controlled companies and Tobin’s q for small controlled companies with high or low institutional
ownership. However, the effect is nearly twice as large for firms with more retail investors, and
the difference is statistically significant. We do not find a significant relation in either of the
partitions for large controlled companies. Thus, results indicate that the controlled company
valuation premium may also be driven at least in part by retail investors targeting small
controlled companies, as well as a small-firm effect (see Banz 1981).
Collectively, our findings suggest that controlled companies have higher valuations,

6
potentially due to controlled companies with lower board independence engaging in more
earnings management and retail investors targeting smaller controlled companies. Moreover, our
results for lower investment and higher earnings management in particular suggest that the
combination of the unique ownership structure of controlled companies and governance
exemptions exacerbates agency problems.
This study makes two primary contributions. First, this is the first large-scale study to our
knowledge to explore controlled companies, a related but distinct ownership structure from the
family firms or dual-class firms examined in prior accounting and finance research. Given that
these firms may opt out of many of the major governance reforms that all other publicly traded
firms are subject to, which were designed to protect investors, it is important to understand these
firms and whether they are using these exemptions in a way that harms shareholder value.
Second, we contribute to the literature on the ability of boards to mitigate agency
conflicts in firms with concentrated ownership or control (e.g., Li and Srinivasan 2011; Srinidhi
et al. 2014; Baran and Forst 2015). In particular, our findings that results are concentrated in
firms with low board independence suggest board independence constrains many types of
managerial misbehavior even in firms where one may question if effective oversight is possible.
2. Background, Related Literature and Hypothesis Development
2.1 What are Controlled Companies and Are They Distinct from Other Ownership Structures?
For the purposes of this study, we define controlled companies consistent with the NYSE
and NASDAQ as “a company in which any individual or group of shareholders control more
than 50% of the shares of the company” (Moloney 2005).2 We use this definition because our
2 These definitions can be found in NYSE Rule 303A.00 and NASD Rule 4350(c)(5). NASDAQ adopts a slight variation of the NYSE definition that considers voting power with respect to voting for directors (see SEC 2009).
7
focus is on the governance exemptions afforded to firms that meet these exchange criteria.3
These firms are not automatically granted exemptions from the independence requirements (that
is, to have a majority independent board or a fully independent governance, nominating or
compensation committees), but have the option to exempt themselves from any or all of these
requirements. However, pursuant to Item 407(a) of Regulation S-K, a controlled company that
takes any of these exemptions must disclose (1) that it is relying on the controlled company
exemption, (2) the basis for the exemption and (3) the corporate governance standards with
which the company does not comply (Teen 2017).
Given the lack of prior research on controlled companies, we first report on their
prevalence and provide more information on their unique ownership structure. Table 1 presents a
variety of descriptive information for the controlled companies in our entire sample before
sample restrictions. As shown in Panel A, controlled companies are widely dispersed across
industries, with 42 out of 48 Fama-French industry groups having some controlled company
presence. Controlled companies are most common within the printing/publishing and textiles
industries, accounting for approximately 45 and 37 percent, respectively, of all companies in
those industries. Of industries with controlled companies, the machinery, steel and utilities
industries have the smallest percentage of controlled companies, with each representing less than
four percent of all firm-year observations in those industries.
Panel B of Table 1 presents the number and percent of controlled company firm-year
3 Prior academic studies or industry publications that have defined the term “controlled company” generally use broader (or narrower) definitions than used here. For example, Armstrong et al. (2014, 389) define controlled companies as “those with dual class shares, or for which more than 50% of the company’s voting power in electing directors is held by an individual, a group, or another company.” The IRRC Institute (2016, 15) defines controlled companies for the purpose of their analysis as “1) multi-class capital structures with unequal voting rights… and 2) control through ownership of at least 30 percent of a class of single-vote stock by a person or group.” Even more narrowly, Krishnan et al. (2011, 2107) define controlled companies as “public companies for which 50 percent or more of voting power is controlled by another entity.”

8
observations by the type of controlling party. Founders or their relatives control approximately
52 percent of the controlled company observations in our sample. Executives or directors control
about 29 percent of controlled companies. Other parties, such as institutional investors, control
the remaining 19 percent of controlled companies.
Panels C and D of Table 1 provide the number and percent of firm-years within our
sample in which the firm claims the controlled company exemption. Approximately 59 percent
of all controlled companies in our sample claim the controlled company exemption for at least
one governance provision while 41 percent forgo this exemption. While firms are required to
disclose the reasons for taking the exemption, surprisingly nearly 58 percent of the controlled
company observations claiming the exemption fail to do so. On the other hand, 15 percent of the
controlled company exemption firm-years in our sample state they use the exemption at least in
part to avoid having an independent board while 38 (14) percent do so for the compensation
committee (nominating or governance committee) exceptions.
While many controlled companies are also family firms and/or dual-class firms, many
controlled companies are distinct from these two ownership forms. Similarly, many family firms
and dual-class firms are not controlled companies. Figure 1 presents a Venn diagram illustrating
the degree of overlap between controlled companies, family firms and dual-class firms in our
sample. As shown in this figure, there are 369 controlled companies, 1,507 family firms and 243
dual-class firms in our entire sample before sample restrictions. Within our 369 controlled
companies, 33 percent (122) are neither family firms nor dual-class firms, 24 percent (89) are
family firms but not dual-class firms, 13 percent (48) are dual-class but not family firms and 30
percent (110) are controlled companies, family firms and dual-class firms. In comparison, only
eight percent (20) of the 243 dual-class firms in our sample are neither family firms nor

9
controlled companies and 82 percent (1,243) of the 1,507 family firms in our sample are neither
controlled companies nor dual-class firms. Thus, while there is some overlap with family firms
and dual-class firms, controlled companies appear to be a largely distinct ownership form.
2.2 Prior Literature
Agency problems exist due to conflicts of interest between shareholders and managers
(Jensen and Meckling 1976). In Type I agency problems, which stem from the separation of
ownership from management, managers may make decisions that are not in the best interest of
shareholders. In contrast, Type II agency problems arise from conflicts between controlling and
non-controlling shareholders, as controlling shareholders may use their power to expropriate
rents from the firm at the expense of shareholders (Shleifer and Vishny 1997).
A long stream of research explores the relation between agency costs and governance
structures. In this area, a number of studies examine two governance mechanisms in particular—
ownership structures and boards of directors. While some studies explore broader ownership
issues such as majority ownership (e.g., Denis and Denis 1994), much of this area focuses
specifically on the effects of family (or founder) firm and dual-class ownership. In family firms,
the founder or his relatives maintain an active role in the firm, whether as an executive or a
director on the board or through equity ownership (Anderson and Reeb 2003; Chen et al. 2010).
Because of their vested interest in the survival of their firm, specialized knowledge and
reputational capital, family firms may make decisions that increase the long-term viability of the
firm (James 1999). Consistent with this notion, prior studies find that family firm ownership is
associated with greater firm value (Anderson and Reeb 2003), higher earnings quality (Ali et al.
2007; Wang 2006), a lower cost of debt (Anderson et al. 2003), less tax aggressiveness (Chen et
al. 2010) and greater disclosure about impending bad news (Chen et al. 2008).

10
In contrast to family firms, dual-class firms exhibit a divergence of insider voting rights
and cash flow rights. For example, Gompers et al. (2010) finds that the average dual-class firm
has a superior class of voting shares with 10 votes per share and an inferior class of shares with
only one vote per share. By providing insiders voting control without a pro-rata share in the cash
flow consequences of their decisions, dual-class structures may entrench managers, enabling
them to expropriate personal benefits from the firm at the expense of shareholders (Grossman
and Hart 1988). Supporting this view, prior literature finds evidence that as the separation
between control rights and cash-flow rights increases, dual-class firms experience lower firm
value (Claessens et al. 2002; Gompers et al. 2010), lower post-IPO performance (Smart and
Zutter 2003), more value-destroying acquisitions and lower values of cash holdings (Masulis et
al. 2009), lower earnings quality (Francis et al. 2005a), less tax avoidance (McGuire et al. 2014)
and a higher cost of debt financing (Lin et al. 2011).
Research on the effects of boards of directors on firm value, and board independence in
particular, is more nuanced. For instance, Agrawal and Knoeber (1996) find that the percentage
of outside directors on the board is negatively associated with Tobin’s q while others (e.g.,
Hermalin and Weisbach 1991) fail to find evidence of a relation. Coles et al. (2008) find mixed
evidence and show that board independence is positively associated with Tobin’s q for firms
where firm-specific knowledge of insiders is less important (e.g., those with lower R&D
intensity). Similarly, Duchin et al. (2010) find a positive relation between Tobin’s q and
independent directors only in firms with strong information environments, suggesting that the
effectiveness of outside directors is also function of the cost of acquiring information.4
4 Born (2015) examines the effect of the governance exemption within a sample of 173 controlled firms and finds a marginally significant negative effect on firm value. However, among other limitations, he does not directly examine board independence or control for the overlap with dual-class firms.

11
2.3 Hypothesis Development
Prior studies on dual-class and family firms suggest competing hypotheses for the
relation between firm value and ownership structure in controlled companies. On one hand,
similar to family firms, the concentrated ownership status of many controlled companies may
align managers’ interests with the firm because large owners have economic incentives to
maximize firm value and prolong the life of their business (Demsetz and Lehn 1985; Morck et al.
1988). For example, owners’ vested interest in the long-term survival of their family firms
incentivizes them to better monitor managers (Anderson and Reeb 2003). Thus, controlled
companies may exhibit a valuation premium relative to non-controlled companies.
On the other hand, similar to dual-class firms, the disproportionate level of voting power
versus cash flow rights in many controlled companies may lead to entrenchment, whereby
managers expropriate personal benefits from the firm at the shareholders’ expense, leading to
lower firm value (Morck et al. 1988). The fact that controlled companies may be exempt from
several key governance requirements compounds the potential entrenchment concerns. This
tradeoff is summarized by Moody’s Investor Service, who note that most institutional investors
carefully consider the controlled company status of a potential investment as a factor on whether
and how much to invest because they “present a unique analytical challenge. Controlling owners
can operate with a long-term view, in alignment with creditors’ interests. However, there can be
several risks from controlling ownership, including potential for conflicts of interest and abusive
related-party transactions” (NYSE 2016, 28). Thus, we state our first hypothesis in the null:
H1: Controlled company ownership is not associated with firm value. Independent boards are self-bonding devices used to mitigate agency conflicts within a
firm (Jensen and Meckling 1976). Given the agency conflicts inherent in the ownership structure

12
of controlled companies, less independent boards may further exacerbate these issues, resulting
in negative valuation effects (Duchin et al. 2010). However, it is also possible that allowing
controlled companies to have less independent directors may have beneficial effects on firm
value. For instance, to the extent that inside directors have specialized knowledge to better advise
the firm, having a less independent board may positively affect firm value (Fama and Jensen
1983; Faleye et al. 2011). Overall, whether and how board independence affects firm value is an
empirical issue. We therefore state our second hypothesis in the null as follows:
H2: Board independence does not affect the relation between controlled company ownership and firm value.
3. Research Design
3.1 Empirical Model for Primary Tests
To test whether controlled companies have differential firm value relative to non-
controlled companies, we use Tobin’s q (e.g., Anderson and Reeb 2003; Gompers et al. 2010;
Villalonga and Amit 2006). Specifically, we estimate the following model:
Tobinsqit = α0 + α1CCit + α2Familyit + α3DCit + α4Instownit + α5StdCFOit + α6Stdsalesit + α7CEOchairit + α8Bdindepit + α9Bdsizeit + α10Lnsegmentsit + α11Exgrowthit + α12Lossproportionit + α13Restructuringit + α14Sizeit + α15BigNit +
α16Levit + α17ROAit + α18Profitrankit + α19Salesrankit + α20DEit +
α21Pfirmsinregionit + α22Psalesinregionit + α23Localmktshareit + α24Lnturnoverit +
α25Equitycompit + α26MissingEquitycompit + Year FE + Industry FE + εit, (1)
where subscripts i and t represent firm and year, respectively. Tobin’s q (Tobinsq) is calculated
as the sum of the firm’s market value of equity and book value of assets less the book value of
equity, scaled by the book value of assets (Claessens et al. 2002; Lang and Maffett 2011). CC is
an indicator variable equal to one if the firm is a controlled company, and zero otherwise. We
cluster standard errors by firm.
As is common in corporate governance studies, the relation between firm value and

13
ownership structure is endogenous. We attempt to mitigate this issue in several ways. First, we
include a robust vector of control variables for firm characteristics that may be correlated with
both firm value and a firm’s choice of ownership and governance structures. In particular,
because of the partial overlap between controlled companies and family firms or dual-class firms
and because prior literature finds that both of these ownership structures are associated with firm
value (generally in different ways), we control for whether the firm is a family firm (Family) or
has a dual-class (DC) ownership structure (Claessens et al. 2002; Gompers et al. 2010;
Villalonga and Amit 2006). We classify a firm as a family firm if the founder or relative of the
founder, either by marriage or by blood, is in executive management, on the board of directors or
is a blockholder (Chen et al. 2010).5 We classify firms as dual-class if their proxy statements
indicate that they have more than one class of stock (Gompers et al. 2010; McGuire et al. 2014).
We also control for firms’ financial characteristics that can affect firm value (Anderson
and Reeb 2003; Fang et al. 2009; Mehran 1995; Yermack 1996). Specifically, we control for
return on assets (ROA), firm size (Size), leverage (Lev), cash flow volatility (StdCFO), extreme
growth (Exgrowth), the proportion of losses in the last five years (Lossproportion), restructuring
(Restructuring), sales volatility (Stdsales) and share turnover (Lnturnover). We also include the
log of the number of operating segments (Lnsegments) to control for business complexity.
Gompers et al. (2010) argue that the likelihood that a firm has a dual-class structure is a
function of managers’ private control benefits. As some controlled companies have dual-class
structures, we follow Gompers et al. (2010) and control for these factors. Specifically, we
include the percentile rankings of the firm’s sales and profits in its IPO year relative to other
5 Other studies define family firms as those in which the family’s equity holdings are at least five percent (Anderson et al. 2012; Chen et al. 2010) or where the founder or descendant of the founder is on the board or an executive at the firm (Anderson and Reeb 2003; Wang 2006). Results are similar using either alternative definition (untabulated).

14
firms in the same IPO year (Salesrank and Profitrank, respectively), the percentages of all
Compustat firms and all sales in the firm’s MSA (Pfirmsinregion and Psalesinregion,
respectively) the year before the firm’s IPO and the firm’s local market share (Localmktshare).
Additionally, we control for firms’ other governance mechanisms because monitoring
can affect both firm value and ownership structure (Anderson and Reeb 2003). Specifically, we
include the percentage of independent directors on the board of directors (Bdindep), the size of
the board of directors (Bdsize), an indicator variable for whether the CEO is also the chairman of
the board of directors (CEOchair), institutional ownership (Instown) and an indicator variable for
whether the firm’s auditor is a Big N audit firm (BigN). We control for whether the firm is
incorporated in Delaware (DE), which affects their corporate legal environment, and the CEO’s
percentage of equity compensation (Equitycomp), which affects managerial behavior, since both
may result in a valuation premium (Daines 2001; Mehran 1995). Because of the limited coverage
in Execucomp, we lack data to construct Equitycomp for a majority of our sample, so we follow
Cassell et al. (2013) and Hanlon et al. (2003) and set missing values to zero with a separate
indicator variable (MissingEquitycomp) set equal to one when data for Equitycomp is unavailable
and zero otherwise. Finally, we also include year and Fama-French 48 industry fixed effects to
mitigate the effect of trends within particular industries and cross-sectional economic factors
over time. All variables are defined in detail in Appendix A.
Second, given that controlled firms may significantly differ from other firms, we also use
entropy balancing when possible to mitigate the extent to which differences in observable
characteristics between controlled companies and non-controlled companies influence our
results.6 Entropy balancing reweights observations at the mean of their distributions for the
6 While entropy balancing is relatively new to accounting research, it has been used in a growing number of recent studies (e.g., Haislip et al. 2017; McMullin and Schonberger 2018; Wilde 2017; Baugh et al. 2018).

15
control variables such that treatment and control firms exhibit covariate balance jointly for all
variables (Hainmueller 2012). While other matching methods, such as propensity score
matching, also help control for endogeneity due to differences in observables, results obtained
using this method can be sensitive to numerous design choices, such as caliper width and the
number of matched control firms (Shipman et al. 2017; DeFond et al. 2016). In contrast, entropy
balancing mitigates design choices that affect the composition of the control firms and allows us
to retain all of our observations to ensure that we include as many controlled companies in our
analyses as possible. Because we estimate many of our analyses for both the full sample and in
subsamples, we re-balance each sample before running our analyses.
As discussed previously, the controlled company exemption may be claimed for reasons
relating to the total board or compensation, nominating or governance committees. Because the
majority of controlled companies do not disclose why they are claiming the exemption, we
directly test the effect of board independence on moderating the relation between controlled
companies and firm outcomes by estimating our tests separately for firm-years with board
independence percentages below and above the median board independence percentage for that
year. Thus, we also re-estimate Equation (1), excluding Bdindep, for each subsample.
3.2. Stock Returns
Following prior research (e.g., Bebchuk et al. 2008; Fahlenbrach 2009; Gompers et al.
2003), we triangulate our Tobin’s q analyses by also testing the relation between controlled
companies and stock returns. To the extent that the market perceives controlled company
ownership in a firm as a value-enhancing (value-destroying) characteristic, controlled companies
may earn a positive (negative) abnormal return relative to non-controlled companies,
respectively. Specifically, we regress the equal-weighted and value-weighted average return for

16
portfolios of controlled companies and non-controlled companies for each calendar month on the
four risk factors from Fama and French (1997) and Carhart (1997). We rebalance portfolios
every May and use the firm’s market capitalization at the end of the previous month to value
weight the portfolios. We then estimate the following model:
(Ri – Rf)t = α + ß1(Rm-Rf)t + ß2SMBt + ß3HMLt + ß4UMDt + εt, (2)
where subscript t represents calendar months. Rm is the monthly CRSP market return (either
value-weighted or equal-weighted), Rf is the risk-free rate, Ri – Rf represents the portfolio return
in excess of the risk-free rate, SMB is the difference in average returns for portfolios of small
firm stocks less the big firm stocks, HML is the difference in average returns for portfolios of
high and low book-to-market stocks and UMD is the difference in average returns for portfolios
of recent winners and recent losers. The intercept (α) represents the mean monthly abnormal
return from the calendar time portfolio. To the extent that controlled companies carry a valuation
premium (penalty), alpha should be positive (negative) and statistically significant, respectively.
3.3 Possible Mechanisms to Affect Firm Value
While the prior analysis is focused on firm value, it is unclear why controlled companies
may affect firm valuation. Thus, we modify Equation (1) to examine several additional
dependent variables that may be possible channels from prior literature.
3.3.1 Investments
We first examine the relation between controlled companies and investment. Controlled
companies have large, controlling shareholders, so they may be less likely to make myopic
investments, instead focusing on those that maximize long-term value (Shleifer and Vishny
1986). On the other hand, if the controlling party engages in rent extraction, they may do so in
part through underinvesting or inefficient investments. These results may also be expected to

17
differ based on board independence given the results in Faleye et al. (2011).
We examine two types of investment frequently studied in prior literature, total
investment – that is, the sum of R&D, capital and advertising expenditures (Totalinvest) – and
investment efficiency (Inveff) (Goodman et al. 2014). With regard to investment efficiency, we
follow prior research in using a benchmark investment model to examine whether the firm’s
investment levels deviate from expected levels. Specifically, following Goodman et al. (2014),
we obtain the residuals estimated by industry-year regressions of Totalinvest on prior year
Tobin’s q, asset growth and Totalinvest and contemporaneous cash flows from operations. We
require a minimum of 20 observations in each industry-year. Given that this proxy is prone to
measurement error (see Erickson and Whited 2006), we then create an indicator variable, Inveff,
set equal to one if the absolute value of the firm’s investment residual falls below the median
absolute value of the distribution of the residuals, and zero otherwise.7
3.3.2 Information Asymmetry and Earnings Management
We next examine first whether there is greater information asymmetry between investors
and these firms, which may allow controlled companies to mislead the market, or certain
investors. For example, controlling parties in firms may exercise greater control over
information, leading to greater information asymmetry about the value of these firms (Fan and
Wong 2002). Similarly, like family firms, controlled companies may prefer less disclosure due to
litigation and reputation concerns (Chen et al. 2008). This relation may also vary based on the
level of board independence given that greater board independence decreases information
asymmetry because independent directors demand greater transparency to effectively monitor
7 Greene (2004) shows the use of a linear estimation model with a dichotomous dependent variable does not result in bias or inconsistency on the coefficients or standard errors, so we use a linear probability when estimating Equation (1) for Inveff (and other binary variables) for consistency, as well as to reduce bias when including fixed effects in nonlinear models (see Wooldridge 2002), but inferences are similar using logistic regression (untabulated).

18
and advise management (Armstrong et al. 2014).
Examining information asymmetry is important because while controlled companies may
engage in earnings management to sustain overvaluation (Jensen 2005), such a strategy is
effectively predicated on higher levels of information asymmetry. As shown analytically in Dye
(1988), information asymmetry is a necessary condition to prevent the unraveling of earnings
management by the market, so it is not surprising that it has been shown empirically that
information asymmetry increases earnings management (Richardson 2000; Cassell et al. 2015).
However, even with information asymmetry, it remains an empirical question whether controlled
companies engage in more earnings manipulations. Controlled companies are related to both
dual-class firms, which have lower financial reporting quality (e.g., Francis et al. 2005a), and
family firms, which engage in less earnings management (e.g., Ali et al. 2007; Wang 2006).
Prior research also generally finds that board independence is positively associated with less
earnings management and fraud (e.g., Donelson et al. 2016; Klein 2002), but it is unclear
whether this effect would hold in controlled companies given the inherent agency conflicts.
To test whether there is greater information asymmetry between investors and controlled
companies, we examine the bid-ask spread (Ali et al. 2007) and daily stock return volatility
(Bushee and Noe 2000). Specifically, we compute the bid-ask spread (Baspread) as the average
of daily closing bid-ask spread as a percentage of daily closing price and stock return volatility
(Retvol) as the log of the standard deviation of average daily stock returns. To test whether
controlled companies engage in different levels of earnings management, we use accrual quality
(AQ) and restatements (Restate). Specifically, we measure AQ as the standard deviation of
residuals over the last five years from the Dechow and Dichev (2002) accrual quality measure as
adjusted by McNichols (2002) and Francis et al. (2005b). Larger values for AQ indicate worse

19
accruals quality.8 We use accrual quality to capture earnings management because Jones et al.
(2008) find that it is the best accounting-based proxy for fraud and restatement risk. We create an
indicator variable, Restate, set equal to one if the firm-year was restated, and zero otherwise.
3.4 Data and Sample Selection
We use controlled company data from MSCI (formerly GMI), data on controlled
companies, family firms, dual-class firms and boards of directors from firm proxy statements,
financial statement data from Compustat, headquarter location data from Bill McDonald’s
website, restatement data from AuditAnalytics, institutional ownership data from Thomson-
Reuters, merger and acquisition data from SDC Platinum, stock return data from CRSP,
executive compensation data from Execucomp, Fama French and momentum factors from
Kenneth French’s website and corporate governance data from Boardex for U.S. firms from
2006-2012. The sample begins in 2006 because this is the first year for which data on controlled
companies is consistently populated in MSCI. The sample ends in 2012 because data on
controlled companies is no longer regularly collected in MSCI after that year.
We begin with all U.S. firms in the MSCI database for 2006 through 2012. This sample
includes 18,564 firm-year observations representing 3,830 unique firms. Because the controlled
company information in MSCI appears to be incorrectly coded in some years, we hand-collect
data on whether the firm is a controlled company from proxy statements. We also hand-collect
data on whether the firm is a family firm or a dual-class firm from proxy statements and firm
websites, as needed.9 We eliminate observations lacking proxy statements on the SEC’s website
8 We use the standard two-stage regression model, rather than the single-stage regression advocated by Chen et al. (2018), to estimate accrual quality because we are unable to implement entropy balancing with a single-stage regression because it requires industry-year interactions with each independent variable from the first stage regression, resulting in over one thousand extra variables. However, Chen et al. (2018) also state that the same inferences can be found using a two-stage model when researchers include the independent variables from the first-stage regression in the second-stage. We find similar results when using such an approach (untabulated). 9 Because controlled companies are required to disclose their controlled company status and the basis for this

20
and missing data for control variables for our tests. We winsorize continuous variables at the 1st
and 99th percentiles to mitigate the risk of outliers. Our final sample with available data for all
our control variables includes 10,542 firm-year observations for 2,332 unique firms.
4. Empirical Results
4.1 Descriptive Statistics
Panel A of Table 2 presents descriptive statistics for our full sample. Approximately nine
percent of the sample firms are controlled companies. In comparison, 41 percent of the sample
firms are family firms and seven percent have dual-class structures, similar to prior research
(Anderson et al. 2012; Gompers et al. 2010; Wang 2006). Our average firm has a Tobin’s q of
1.9, an ROA of 0.02, approximately $1 billion in assets and a board independence percentage of
77 percent, suggesting that on average these firms are profitable, larger and well governed.
To provide more background on controlled companies (CC = 1) as compared to non-
controlled companies (CC = 0), Panel B of Table 2 presents descriptive statistics for all variables
separately in our analyses for each type of firm. Means for 24 out of 32 variables are statistically
different between the two groups (p < 0.10 or lower). For example, relative to non-controlled
companies, controlled companies are larger, have lower Tobin’s q, spend less on firm
investment, are more likely to invest efficiently and have higher bid-ask spreads and stock return
volatility. Consistent with the governance exemption for controlled companies, these firms also
have fewer independent directors on their boards.
The large number of significant differences between controlled companies and non-
controlled companies validates our decision to use entropy balancing in our analyses. Panels C
through E of Table 2 present descriptive statistics for our full sample, low board independence
determination in their proxy statements (see SEC 2009), we search proxy statements for the term “controlled company” or similar variations thereof. Appendix B provides examples of these disclosures.

21
sample and high board independence sample, after entropy balancing each sample. For each
panel, there is excellent covariate balance as there are no significant differences between
controlled companies and non-controlled companies for any of our control variables (p ≥ 0.99).
4.2 Correlation Matrix
Table 3 reports univariate Pearson correlations between our controlled company indicator
variable, our dependent variables of interest and the control variables used in our analyses.
Controlled companies are positively associated with both family firms and dual-class firms (0.15
and 0.58, respectively), further consistent with the notion that controlled companies are a largely
distinct ownership form from the other ownership structures. Controlled companies are
positively associated with bid-ask spreads, investment efficiency and return volatility, but
negatively associated with Tobin’s q and total investment. However, given the numerous
differences between controlled companies and non-controlled companies, it is necessary to
further evaluate these relations in a multiple variable regression setting.
4.3 Controlled Companies and Firm Value
4.3.1 Firm Value
Table 4 presents the results from regressing Tobin’s q on CC. Column 1 reports that CC
is positive and significant for the full sample (0.377, p < 0.01). Thus, controlled companies
exhibit a valuation premium incremental to family and dual-class firms. This effect is highly
economically significant, as it represents approximately 20 percent of the mean Tobin’s q for the
full sample. In comparison, the coefficient on Family is positive and significant (0.378, p < 0.05)
while it is negative and significant for DC (-0.547, p < 0.01), consistent with prior research in
earlier periods (Gompers et al. 2010; Villalonga and Amit 2006).
Columns 2 and 3 report results for firms with low board independence (Low Bdindep)

22
and high board independence (High Bdindep), respectively. The coefficient on CC is positive
and significant in the low sample (0.339, p < 0.01), but insignificant in the high sample (0.057, p
> 0.39). This difference is statistically significant (p < 0.01). Thus, the positive relation between
controlled company structure and firm valuation is concentrated in low independence firms.
4.3.2 Stock Returns
We next examine portfolio returns to further assess the valuation premium we observe for
controlled companies. Table 5 presents the results of estimating Equation (2) using equal-
weighted (Columns 1 and 2) and value-weighted portfolios (Columns 3 and 4). Consistent with
the results from our Tobin’s q analyses, we find a significant and positive abnormal alpha on
portfolios of controlled companies using equal-weighted returns (0.004, p < 0.05), but an
insignificant alpha on portfolios of non-controlled companies (0.002, p > 0.29).10 In terms of
economic significance, portfolios of controlled companies generate long-run abnormal returns in
excess of 40 basis points per month, or an annual rate of 4.91 percent. In contrast, we find no
evidence that portfolios of controlled companies and non-controlled companies generate a
statistically significant abnormal alpha using value-weighted portfolio returns. This evidence
suggests that controlled companies do command a persistent, higher value and that smaller firms
may be driving this valuation premium.11
While collectively these results suggest that controlled companies carry a valuation
premium relative to non-controlled companies, whether this relation is due to managerial myopia
(e.g., earnings management), better strategic decisions (e.g., more efficient investing) or an
10 When forming our portfolios of controlled and non-controlled companies, we use all controlled companies even if they are also family firms or have dual-class structures. However, in untabulated analysis, we also re-estimate our analyses after forming portfolios for “pure” controlled companies (i.e., those that are not also family or dual-class firms) and find similar results (untabulated). 11 We revisit the effect of firm size on the valuation premium in Section 4.5.

23
alternative explanation is unclear. As discussed in Section 3, we next explore some of the
potential mechanisms most likely to contribute to this effect to disentangle these stories.
4.4 Mechanisms Driving the Relation between Controlled Companies and Firm Value
Table 6 presents the results of estimating Equation (1) separately for Totalinvest and
Inveff. Regarding total investment in the full sample, the coefficient on CC is negative but
insignificant for Totalinvest (-0.008; p > 0.17). In subsample analysis, we find that the coefficient
on CC is negative and significant for the low board independence subsample (-0.009, p < 0.10),
but is insignificant in the high board independence subsample (-0.009, p > 0.34). However, the
magnitude of the effect is not statistically different between the low and high subsamples (p >
0.99). However, when we shift to investment efficiency, we find that the coefficient on CC is
negative and significant for the full sample for Inveff (-0.061, p < 0.05), suggesting that
controlled companies invest less efficiently in capital assets, R&D and advertising. We also find
that the coefficient is negative and significant for the low board independence subsample (-
0.044, p < 0.10) but is insignificant in the high board independence subsample (0.003, p > 0.93).
Similar to Totalinvest, this difference is not statistically significant (p > 0.17). Collectively, it
does not appear that the valuation premium we observe for controlled companies is justified by
their investment behavior nor that lower board independence is able to moderate these decisions
through superior investment advising (Faleye et al. 2011).
Table 7 presents the results of estimating equations (1) and (2) using either Baspread or
Retvol as the dependent variable for information asymmetry. With regard to the bid-ask spread,
we find that the coefficient on CC is positive and significant for the full sample (0.261, p < 0.01)
and the low board independence subsample (0.377, p < 0.01) but is insignificant in the high
board independence subsample (0.038, p > 0.84), and this difference is significant (p < 0.10).
24
This suggests that controlled companies have greater information asymmetry relative to non-
controlled companies, driven by firms in the low board independence sample. With respect to
return volatility, while the coefficient on CC is positive for the full sample for Retvol, it is not
statistically significant (0.025; p > 0.14). However, when we estimate equation (2) for the
subsamples, we find that the coefficient on CC is positive and significant for the low board
independence subsample (0.036, p < 0.05) but is insignificant in the high board independence
subsample (-0.048, p > 0.19), and the difference is statistically significant (p < 0.05). Overall, the
evidence suggests that controlled companies with low board independence appear to have higher
information asymmetry between the firm and its shareholders.
Table 8 presents the results of estimating equation (1) using either AQ or Restate as the
dependent variable for earnings management. Beginning first with AQ, we find that the
coefficient on CC is positive but insignificant for the full sample (0.003, p > 0.28). However,
when we estimate this regression separately for the low and high board independence sub-
samples, the coefficient on CC is positive and significant (0.005, p < 0.05) in the low
independence sample but is negative and significant in the high board independence sample (-
0.006, p < 0.05), and this difference is statistically significant (p < 0.01). This suggests that, in
controlled companies, low (high) board independence is associated with more (less) accruals-
based earnings management. Similar to the AQ results, the coefficient on CC for Restate for the
full sample is positive but insignificant (0.028, p > 0.10), while it is positive and marginally
significant coefficient in the low board independence subsample (0.036, p < 0.10) and
insignificant in the high board independence subsample (0.003, p > 0.92). The magnitude of this
difference is not statistically significant (p > 0.33). Collectively, these results suggest that
controlled companies are more likely to manipulate their financial reporting, driven by controlled

25
companies with low board independence. However, controlled companies with high board
independence engage in less accruals earnings management, consistent with greater board
independence serving as a monitoring mechanism for agency issues in these firms (Klein 2002).
Combining Tables 5 through 8, our results thus far document that controlled companies
exhibit higher firm valuations, relative to non-controlled companies. However, these results are
more consistent with managerial myopia, as evidenced by our tests on earnings management
combined with information asymmetry than managers using the controlled company status to
engage in long-term investment activities that enhance firm value.
4.5 Individual Investors and the Relation between Controlled Companies and Firm Value
Under a rational expectations framework, investors are rational agents who make
informed economic decisions. However, recent evidence provides instances of individual
investors systematically departing from this theory. For instance, Barber and Odean (2000) find
that individual investors who trade the most earn lower market returns relative to those who trade
less frequently, likely because of investor overconfidence. Similarly, behavioral biases of
individual investors may explain some of the valuation premium for controlled companies. For
example, retail investors desiring to invest on the ground floor of the next Facebook or Google
may invest in smaller controlled companies, potentially overvaluing these firms in the process,
either due to overconfidence (Barber and Odean 2000), engaging in wishful thinking that
ultimately leads them to form overly optimistic valuations about these firms (Seybert and
Bloomfield 2009) or because they are attention-grabbing firms (Barber and Odean 2007).12 This
would also be consistent with finding small controlled companies appear to drive the returns
analysis and may be related to the small-firm effect (Banz 1981).
12 In fact, the unique ability of controlled companies to opt out of board independence requirements may make them more attention-grabbing due to all the discussion on board independence in the media.

26
To test this possibility, we re-estimate Equation (1) using dependent sorts of market
capitalization and institutional ownership to isolate firms where results should be concentrated.
Specifically, we first partition our sample based on the median market capitalization by year and
then further partition each subsample based on the median institutional ownership percentage.13
To the extent that individual investors of small controlled companies drive the valuation
premium, the relation between controlled companies and Tobin’s q should be concentrated in
firms with the lowest market capitalization and institutional ownership. Table 9 presents the
results of this analysis. The coefficient on CC is positive and significant both for the smallest
firms with the lowest institutional ownership (0.671, p < 0.01) and the highest institutional
ownership (0.346, p < 0.01). However, the magnitude of the effect for firms with low levels of
both market capitalization and institutional ownership is nearly double that of the effect for firms
with low market capitalization and high institutional ownership, and this difference is significant
(p < 0.01). In contrast, we find no evidence of a relation between CC and Tobin’s q for firms
with high market capitalization in either subsample. Collectively, this suggests that retail
investors overvalue small, controlled companies, potentially due to behavioral biases, resulting in
some of the valuation premium observed for controlled companies.
4.6 Additional Analysis Using Propensity Score Matching
While we use entropy balancing to maximize our covariate balance and sample size, to
ensure that our results are robust to more commonly used matching methods, we re-estimate our
analyses using propensity score matching in untabulated analysis. Specifically, for each sample
(i.e., the full sample, low board independence subsample and the high board independence
subsample), we estimate our first stage logit model using Equation (1) with CC as the dependent
13 Results are similar if we use independent sorts (untabulated). We control for Size because it is used in our main regressions and is measured based on assets. However, results are similar if we exclude this variable.

27
variable. Using the predicted propensity score, we then use a one-to-many match of controlled
companies to non-controlled companies within the same industry-year. Following the
recommendation of Shipman et al. (2017), we match with replacement, and we use a caliper of
0.05 to maximize our sample size.14 We then re-estimate our analysis using this matched sample.
For our full sample, we find similar results for both our firm value and mechanism tests
with the only exception being Inveff. In subsample analysis, results are directionally consistent
with those obtained using entropy balancing but are sometimes insignificant. For example, for
the low (high) subsample Totalinvest and Restate (AQ) are insignificant (p > 0.64). However,
given that our sample sizes for these tests are reduced by approximately 82 percent in the full
sample, 75 percent in the low and 85 percent in the high subsamples, these differences are likely
due to a combination of reduced power and measurement error resulting from lower quality
matches between the treatment and control firms.
5. Conclusion
In this study, we examine the valuation effects of controlled companies, a type of firms
that are majority controlled by one party and afforded special exemptions from the major stock
exchanges’ board independence requirements. Despite the economic significance of these firms,
recent media attention highlighting their existence, potential agency issues inherent in this
structure and the fact that the major stock exchanges have carved out special independence
exemptions for these firms, surprisingly little is known about these firms and the implications of
this ownership structure and the governance exemptions.
14 This caliper size trades off sample size versus improving covariate balance. Even with this caliper, there are still several significant differences between controlled and non-controlled companies, particularly in the full sample (e.g., StdCFO, Stdsales, CEOchair, Bdsize, Restructuring and Lnturnover are significantly different at the p < 0.10 level or greater). We obtain a better covariate balance if we use a caliper of 0.0001 (i.e., only Lnturnover is significantly different between controlled and non-controlled companies), but this reduces our sample by over 99 percent. While we achieve better covariate balance within our low and high board independence subsamples, these matching limitations further emphasize the advantages of using entropy balancing in our setting.

28
Our findings suggest that controlled companies exhibit higher firm value, driven by a
combination of lower board independence firms maintaining greater information asymmetry and
engaging in earnings management, as well as retail investors for small firms assessing these
firms a valuation premium. A key implication of our findings is that investors and rating
agencies are correct to be cautious and concerned about dealing with controlled companies
(NYSE 2016; IRRC Institute 2016). That is, the major exchanges’ governance reform carve-out
for these firms may have unanticipated and negative consequences for the market.

29
Appendix A - Variable Definitions
Variable Definition AQ The standard deviation of the residuals from firm-specific estimates of changes in working
capital accruals on cash flow from operations for t-1, t, and t+1, change in revenue, and plant, property, and equipment expense for the past five years. A minimum of three years of data is required to calculate the standard deviation.
Baspread The average bid-ask spread, computed as the annual average of daily closing bid-ask spread as a percentage of daily closing price.
Bdindep The percentage of independent board members, computed as the number of outside directors divided by the total number of directors.
Bdsize The total number of directors on the board. BigN An indicator variable equal to 1 if the auditor (au) is a Big 4 audit firm, and 0 otherwise. CC An indicator variable equal to 1 if the firm is a controlled company as indicated in its proxy
statement, and 0 otherwise. CEOchair An indicator variable equal to 1 if the CEO is also the chairman of the board of directors,
and 0 otherwise. DC An indicator variable equal to 1 if the firm has more than one share of stock as indicated on
its proxy statement. DE An indicator variable equal to 1 if the firm is incorporated in Delaware, and 0 otherwise. Equitycomp Equity-based compensation, calculated as the annual value of option grants divided by total
CEO compensation. Exgrowth An indicator variable equal to 1 if firm’s sales growth from the prior year is in the highest
quintile of sales growth for the firm’s industry, and zero otherwise. Family An indicator variable equal to 1 if the firm is a family firm. Following Chen et al. (2010),
we define a family firm as one in the founder or relative of the founder is in executive management, on the board of directors, or a blockholder, as indicated in its proxy statement.
HML The difference in returns to portfolios of high and low book-to-market stocks, as provided by Kenneth French’s data library.
Instown The percentage of institutional ownership. Inveff An indicator variable equal to 1 if the absolute value of a firm’s investment residual from a
benchmark investment model falls below the median absolute value of the distribution of investment residuals, and zero otherwise. The benchmark investment model is estimated by industry-year by regressing total investment on lagged Tobin’s q, lagged asset growth, lagged total investment, and cash flows from operations (oancf). A minimum of 20 observations is required for each industry-year.
Lev Total debt (dltt + dlc) scaled by total assets (at). Localmktshare The ratio of the firm's sales (sale) relative to the sales of all other firms in the firm’s MSA. Lossproportion The number of years in the previous five years where income before extraordinary items
(ib) was negative. Each firm is required to have at least three years of data when calculating the loss proportion.
Lnsegments The natural logarithm of the number of business segments reported in the Compustat Segments database.
Lnturnover The natural logarithm of the annual median value of daily trading volume scaled by total shares outstanding (shrout).
MissingEquiycomp An indicator variable equal to 1 if the percentage of equity compensation (Equitycomp) is missing, and 0 otherwise.
Pfirmsinregion The percentage of Compustat firms located in the firm's MSA in the year prior to the firm's IPO. The date of the IPO is determined based on the year of firm’s first listing on Compustat.
Profitrank The firm's percentile rank of profitability in its IPO year (first year appearing in Compustat) in the distribution of all other new firms appearing in Compustat that year.
Psalesinregion The percentage of total sales (sale) on Compustat reported by firms located in the firm's MSA in the year prior to the firm's IPO. The date of the IPO is determined based on the year of firm’s first listing on Compustat.

30
Restate An indicator variable equal to 1 if the firm-year was restated and 0 otherwise, as indicated in AuditAnalytics. Restatements include both Form 8-K Item 4.02 non-reliance restatements and SAB Topic 108 restatements.
Restructuring An indicator variable equal to 1 for non-zero restructuring costs (rcp) in year t, and 0 otherwise
Retvol The log of the standard deviation of daily stock returns, averaged over the year. ROA Return on assets, defined as pretax income (pi) divided by lagged total assets (at). Ri-Rf The portfolio return in excess of the risk-free rate. Portfolios are rebalanced every May. For
value-weighted returns, portfolio weights are based on market capitalization at the end of the previous month.
Rm-Rf The monthly CRSP value-weighted (equal-weighted) market return in excess of the risk-free rate where value-weighted (equal-weighted) portfolio returns is the dependent variable.
Salesrank The firm's percentile rank of sales in its IPO year (first year appearing in Compustat) in the distribution of all other new firms appearing in Compustat that year.
Size The natural logarithm of assets (at) at the end of the fiscal year. SMB The difference between returns to portfolios of small and big firm stocks,as provided by
Kenneth French’s data library. StdCFO Standard deviation of cash flow from operations (oancf) scaled by total assets (at), where
the standard deviation is calculated using the prior five years. A minimum of three years of data is required to calculate the standard deviation.
Stdsales Standard deviation of sales (sale) scaled by total assets (at), where the standard deviation is calculated using the prior five years. A minimum of three years of data is required to calculate the standard deviation.
Tobinsq The firm's market value of equity (prcc_f*csho) plus the book value of assets (at) less the book value of equity (ceq), all scaled by the book value of assets.
Totalinvest Total investment, computed following Goodman et al. (2014) as the sum of R&D (xrd), capital (capx), and advertising expenditures (xad), scaled by lagged total assets (at).
UMD The difference in returns to portfolios of stocks with high past returns minus those with low past returns, as provided by Kenneth French’s data library.

31
Appendix B – Firm Disclosures of Controlled Company and Controlled Company Exemption Status
This appendix provides excerpts of disclosures from firm proxy statements of controlled company and controlled company exemption status. A. CBS Corporation15 “CBS Corporation's corporate governance practices are established and monitored by its Board of Directors. The Board, with assistance from its Nominating and Governance Committee, regularly assesses CBS Corporation's governance practices in light of legal requirements and governance best practices. In several areas, CBS Corporation's practices go beyond the requirements of the NYSE corporate governance listing standards (the "NYSE listing standards"). For example, despite being a "controlled company" (which is a company of which more than 50% of the voting power is held by an individual or another company), CBS Corporation has a majority of independent directors on its Board and has an independent Compensation Committee and an independent Nominating and Governance Committee, none of which is required for controlled companies under the NYSE listing standards.”
B. HCA Holdings Inc.16 “Hercules Holding II, LLC (“Hercules Holding”) controls a majority of our common stock. As a result, we are a “controlled company” within the meaning of NYSE corporate governance standards. Under the NYSE rules, a company of which more than 50% of the voting power is held by an individual, group or another company is a “controlled company” and may elect not to comply with certain NYSE corporate governance standards, including (1) the requirement that we have a majority of the Board of Directors that consist of independent directors and (2) the requirement that we have a compensation committee and a nominating/corporate governance committee that are composed entirely of independent directors. We are, however, subject to the NYSE and SEC rules that require full independence of our Audit and Compliance Committee. As a result, our Audit and Compliance Committee is entirely comprised of independent directors, but we do not have a majority of independent directors on our Board, and our Compensation Committee and Nominating and Corporate Governance Committee do not consist entirely of independent directors.”
C. The Estée Lauder Companies Inc.17 “The Company is a "controlled company" under the rules of the New York Stock Exchange because the Lauder family and their related entities hold more than 50% of the voting power of the outstanding voting stock. As such, the Company may avail itself of exemptions relating to the independence of the Board and certain Board committees. Despite the availability of such exemptions, the Board of Directors has determined that it will have a majority of independent directors and that both the Nominating and Board Affairs Committee and the Compensation
15 See https://www.sec.gov/Archives/edgar/data/813828/000104746906005152/a2169392zdef14a.htm. 16 See https://www.sec.gov/Archives/edgar/data/860730/000119312512119885/d313045ddef14a.htm. 17 See https://www.sec.gov/Archives/edgar/data/1001250/000104746909008621/a2194640zdef14a.htm.

32
Committee will have otherwise required provisions in their charters. The Board of Directors currently has also determined to use the two remaining exemptions, and thus will not require that the Nominating and Board Affairs Committee and Compensation Committee be comprised solely of independent directors.” D. TransDigm Group Incorporated18 “TD Group Holdings, LLC, an entity controlled by Warburg Pincus, owns more than 50% of the voting power of TD Group, and TD Group is therefore considered to be a “controlled company” for the purposes of the NYSE listing requirements. As such, TD Group is permitted, and has elected, to opt out of the NYSE listing requirements that would otherwise require its Board of Directors to be comprised of a majority of independent directors.”
18 See https://www.sec.gov/Archives/edgar/data/1260221/000119312518033306/d445576ddef14a.htm.

33
References
Agrawal, A., and C. R. Knoeber. 1996. Firm performance and mechanisms to control agency problems between managers and shareholders. Journal of Financial and Quantitative Analysis 31 (3): 377–397.
Ali, A., T. Chen, and S. Radhakrishnan. 2007. Corporate disclosures by family firms. Journal of Accounting and Economics 44 (1): 238–286.
Anderson, R. C., A. Duru, and D. M. Reeb. 2012. Investment policy in family controlled firms. Journal of Banking & Finance 36 (6): 1744–1758.
Anderson, R. C., S. A. Mansi, and D. M. Reeb. 2003. Founding family ownership and the agency cost of debt. Journal of Financial Economics 68 (2): 263–285.
Anderson, R. C., and D. M. Reeb. 2003. Founding-family ownership and firm performance: Evidence from the S&P 500. Journal of Finance 58 (3): 1301–1328.
Armstrong, C. S., J. E. Core, and W. R. Guay. 2014. Do independent directors cause improvements in firm transparency? Journal of Financial Economics 113 (3): 383–403.
Banz, R. 1981. The relationship between return and market value of common stocks. Journal of Financial Economics 9 (1): 3–18.
Baran, L., and A. Forst. 2015. Disproportionate insider control and board of director characteristics. Journal of Corporate Finance 35: 62–80.
Barber, B. M., and T. Odean. 2000. Trading is hazardous to your wealth: The common stock investment performance of individual investors. Journal of Finance 55 (2): 773–806.
Barber, B. M., and T. Odean. 2007. All that glitters: The effect of attention and news on the buying behavior of individual and institutional investors. Review of Financial Studies 21 (2): 785–818.
Baugh, M, M. Ege, and C. G. Yust. 2018. Internal control quality and bank performance during the financial crisis. Working Paper.
Bebchuk, L., A. Cohen, and A. Ferrell. 2008. What matters in corporate governance? Review of Financial Studies 22 (2): 783–827.
Born, J. A. 2015. Opting for a controlled-firm majority independent directors exemption to NYSE or NASDAQ listing requirements: Much ado about nothing? International Journal of Financial Research 7 (1): 195–206.
Bushee, B. J., and C. F. Noe. 2000. Corporate disclosure practices, institutional investors, and stock return volatility. Journal of Accounting Research 38: 171–202.
Carhart, M. M. 1997. On persistence in mutual fund performance. Journal of Finance 52 (1): 57–82.
Cassell, C. A., L. A. Myers, T. A. Seidel. 2015. Disclosure transparency about activity in valuation allowance and reserve accounts and accruals-based earnings management. Accounting, Organizations and Society 46: 23–38.
Cassell, C. A., L. M. Dreher, and L. A. Myers. 2013. Reviewing the SEC’s review process: 10–K comment letters and the cost of remediation. The Accounting Review 88 (6): 1875–1908.
Chen, W., P. Hribar, and S. Melessa. 2018. Incorrect inferences when using residuals as dependent variables. Journal of Accounting Research 56 (3): 751–796.
Chen, S., X. Chen, and Q. Cheng. 2008. Do family firms provide more or less voluntary disclosure? Journal of Accounting Research 46 (3): 499–536.
Chen, S., X. Chen, Q. Cheng, and T. Shevlin. 2010. Are family firms more tax aggressive than non-family firms? Journal of Financial Economics 95 (1): 41–61.

34
Claessens, S., S. Djankov, J. Fan, and L. Lang. 2002. Disentangling the incentive and entrenchment effects of large shareholdings. Journal of Finance 57 (6): 2741–2771.
Coles, J. L., N. D. Daniel, and L. Naveen. 2008. Boards: Does one size fit all? Journal of Financial Economics 87 (2): 329–356.
Daines, R. 2001. Does Delaware law improve firm value? Journal of Financial Economics 62 (3): 525–558.
Dechow, P., and I. Dichev. 2002. The quality of accruals and earnings. The Accounting Review 77 (S-1): 35–59.
DeFond, M., D. H. Erkens, and J. Zhang. 2016. Do client characteristics really drive the Big N audit quality effect? New evidence from propensity score matching. Management Science 63 (11): 3628–3649.
Demsetz, H., and K. Lehn. 1985. The structure of corporate ownership: Causes and consequences. Journal of Political Economy 93 (6): 1155–1177.
Denis, D. J., and D. K. Denis. 1994. Majority owner-managers and organizational efficiency. Journal of Corporate Finance 1 (1): 91–118.
Donelson, D. C., J. M. McInnis, and R. D. Mergenthaler. 2016. The effect of governance reforms on financial reporting fraud. Journal of Law, Finance, and Accounting 1 (2): 235–274.
Duchin, R., J. G. Matsusaka, and O. Ozbas. 2010. When are outside directors effective? Journal of Financial Economics 96 (2): 195–214.
Dye, R. A. 1988. Earnings management in an overlapping generations model. Journal of Accounting Research 26 (2): 195–235.
Erickson, T., and T. M. Whited. 2006. On the accuracy of different measures of q. Financial Management 35 (3): 5–33.
Fahlenbrach, R. 2009. Founder-CEOs, investment decisions, and stock market performance. Journal of Financial and Quantitative Analysis 44 (2): 439–466.
Faleye, O., R. Hoitash, and U. Hoitash. 2011. The costs of intense board monitoring. Journal of Financial Economics 101: 160–181.
Fan, J. P. H., and T. J. Wong. 2002. Corporate ownership structure and the informativeness of accounting earnings in East Asia. Journal of Accounting and Economics 33 (3): 401–425.
Fang, V. W., T. H. Noe, and S. Tice. 2009. Stock market liquidity and firm value. Journal of Financial Economics 94 (1): 150–169.
Fama, E. F., and K. R. French. 1997. Industry costs of equity. Journal of Financial Economics 43 (2): 153–193.
Fama, E. F., and M. C. Jensen. 1983. Separation of ownership and control. Journal of Law and Economics 26 (2): 301–325.
Francis, J., K. Schipper, and L. Vincent. 2005a. Earnings and dividend informativeness when cash flow rights are separated from voting rights. Journal of Accounting and Economics 39 (2): 329–360.
Francis, J., R. LaFond, P. Olsson, and K. Schipper. 2005b. The market pricing of accruals quality. Journal of Accounting and Economics 39 (2): 295–327.
Gompers, P. A., J. Ishii, and A. Metrick. 2003. Corporate governance and equity prices. Quarterly Journal of Economics 118 (1): 107–156.
Gompers, P. A., J. Ishii, and A. Metrick. 2010. Extreme governance: An analysis of dual–class firms in the United States. Review of Financial Studies 23 (3): 1051–1088.
Goodman, T. H., M. Neamtiu, N. Shroff, and H. D. White. 2014. Management forecast quality and capital investment decisions. The Accounting Review 89 (1): 331–365.
35
Greene, W. 2004. The behaviour of the maximum likelihood estimator of limited dependent variable models in the presence of fixed effects. Econometrics Journal 7: 98–119.
Grossman, S. J., and O.D. Hart. 1988. One share–one vote and the market for corporate control. Journal of Financial Economics 20: 175–202.
Hainmueller, J. 2012. Entropy balancing for causal effects: A multivariate reweighting method to produce balanced samples in observational studies. Political Analysis 20 (1): 25–46.
Haislip, J. Z., L. A. Myers, S. Scholz, and T. A. Seidel. 2017. The consequences of audit-related earnings revisions. Contemporary Accounting Research 34 (4): 1880–1914.
Hanlon, M., S. Rajgopal, and T. Shevlin. 2003. Are executive stock options associated with future earnings? Journal of Accounting and Economics 36 (1-3): 3–43.
Hermalin, B. E., and M. S. Weisbach. 1991. The effects of board composition and direct incentives on firm performance. Financial Management 20 (4): 101–112.
IRRC Institute. 2016. Controlled Companies in the Standard & Poor’s 1500: A Follow-up Review of Performance & Risk. Available at https://irrcinstitute.org/wp-content/uploads/2016/03/Controlled-Companies-IRRCI-2015-FINAL-3-16-16.pdf.
James, H. S. 1999. Owner as manager, extended horizons and the family firm. International Journal of the Economics of Business 6 (1): 41–55.
Jensen, M. C. 2005. Agency costs of overvalued equity. Financial Management 34 (1): 5–19. Jensen, M. C., and W. Meckling. 1976. Theory of the firm: Managerial behavior, agency costs
and ownership structure. Journal of Financial Economics 3 (4): 305–360. Jones, K. J., G. V. Krishnan, and K. D. Melendrez. 2008. Do models of discretionary accruals
detect actual cases of fraudulent and restated earnings? An empirical analysis. Contemporary Accounting Research 25 (2): 499–531.
Klein, A. 2002. Audit committee, board of director characteristics, and earnings management. Journal of Accounting and Economics 33 (3): 375–400.
Krishnan, J., Y. Wen., and W. Zhao. 2011. Legal expertise on corporate audit committees and financial reporting quality. The Accounting Review 86 (6): 2099–2130.
Lang, M., and M. Maffett. 2011. Transparency and liquidity uncertainty in crisis periods. Journal of Accounting and Economics 52 (2-3): 101–125.
Li, F., and S. Srinivasan. 2011. Corporate governance when founders are directors. Journal of Financial Economics 102 (2): 454–469.
Lin, C., Y. Ma, P. Malatesta, and Y. Xuan. 2011. Ownership structure and the cost of corporate borrowing. Journal of Financial Economics 100 (1): 1–23.
Masulis, R. W., C. Wang, and F. Xie. 2009. Agency problems at dual class companies. Journal of Finance 64 (4): 1697–1727.
McGuire, S. T., D. Wang, and R. J. Wilson. 2014. Dual class ownership and tax avoidance. The Accounting Review 89 (4): 1487–1516.
McMullin, J. L., and B. Schonberger. 2018. Entropy-balanced discretionary accruals. Working Paper.
McNichols, M. F. 2002. Discussion of the quality of accruals and earnings: The role of accrual estimation errors. The Accounting Review 77 (S-1): 61–69.
Mehran, H. 1995. Executive compensation structure, ownership, and firm performance. Journal of Financial Economics 38 (2): 163–184.
McKenna, F. 2012. Facebook Instagram Play: S-1 Said There’d Be Days Like This. Forbes. 18 April. Available at: https://www.forbes.com/sites/francinemckenna/2012/04/18/face books-instagram-play-s-1-told-you-thered-be-days-like-this/#666ab4bf7993.
36
Moloney, J. 2005. Are You Really a “Controlled Company?” DealLawyers.com. 18 February. Available at: https://www.deallawyers.com/blog/2005/02/are-you-really-a-controlled-company.html.
Morck, R., A. Shleifer, and R. W. Vishny. 1988. Management ownership and market valuation: An empirical analysis. Journal of Financial Economics 20: 293–315.
Murphy, M. 2013. Bausch & Lomb Says It Won’t Use Controlled–Company Exemption. Wall Street Journal. 26 May. Available at: https://blogs.wsj.com/cfo/2013/03/26/bausch-lomb-says-it-wont-use-controlled-company-exemption/.
NASDAQ. 2015. NASDAQ Equity Rules. Available at: http://nasdaq.cchwallstreet.com/NASDAQTools/PlatformViewer.asp?selectednode=chp%5F1%5F1%5F4%5F3%5F8&manual=%2Fnasdaq%2Fmain%2Fnasdaq%2Dequityrules%2F.
NYSE. 2013. NYSE Listed Company Manual. Available at: http://wallstreet.cch.com/LCM/. NYSE. 2016. NYSE: Corporate Governance Guide. Available at:
https://www.nyse.com/cgguide. Richardson, V. J. 2000. Information asymmetry and earnings management: Some evidence.
Review of Quantitative Finance and Accounting 15: 325–347. Seave, A. 2016. Controlled Media Companies: Built for Comfort, Not Performance. Forbes. 23
May. Available at: https://www.forbes.com/sites/avaseave/2016/05/23/controlled-media-companies-built-for-comfort-not-performance/#5b9568934b33.
SEC. 2009. Release No. 34–59424: The NASDAQ Stock Market LLC; Notice of Filing and Immediate Effectiveness of Proposed Rule Change to Clarify Nasdaq’s Definition of “Controlled Company.” Available at: https://www.sec.gov/rules/sro/nasdaq/2009/34-59424.pdf.
Seybert, N., and R. Bloomfield. 2009. Contagion of wishful thinking in markets. Management Science 55 (5): 738–751.
Shipman, J. E., Q. T. Swanquist, and R. L. Whited. 2017. Propensity score matching in accounting research. The Accounting Review 92 (1): 213–244.
Shleifer, A., and R. W. Vishny. 1986. Large shareholders and corporate control. Journal of Political Economy 94 (3, P1): 461–488.
Shleifer, A., and R. W. Vishny. 1997. A survey of corporate governance. Journal of Finance 52 (2): 737–783.
Smart, S. B., and C. J. Zutter. 2003. Control as a motivation for underpricing: A comparison of dual and single-class IPOs. Journal of Financial Economics 69 (1): 85–110.
Srinidhi, B. N., S. He, and M. Firth. 2014. The effect of governance on specialist auditor choice and audit fees in US family firms. The Accounting Review 89 (6): 2297–2329.
Teen, M. Y. 2017. The Risks of Having Minority Controlling Shareholders in Firms. Governance for Stakeholders. 28 December. Available at: http://governanceforstakeholders.com/2017/12/28/the-risks-of-having-minority-controlling-shareholders-in-firms/.
Villalonga, B., and R. Amit. 2006. How do family ownership, control and management affect firm value? Journal of Financial Economics 80 (2): 385–417.
Wang, D. 2006. Founding family ownership and earnings quality. Journal of Accounting Research 44 (3): 619–656.

37
Wilde, J. H. 2017. The deterrent effect of employee whistleblowing on firms’ financial misreporting and tax aggressiveness. The Accounting Review 92 (5): 247–280.
Wooldridge, J. M. 2002. Econometric Analysis of Cross Section and Panel Data. Cambridge, MA: MIT Press.
Yermack, D. 1996. Higher market valuation of companies with a small board of directors. Journal of Financial Economics 40 (2): 185–211.

38
Figure 1
Number of Unique Firms in Sample by Type of Firm
This figure reports the degree of overlap between family firms, dual-class firms and controlled companies in our sample.

39
Table 1 Descriptive Information for Controlled Companies
Panel A: Number and Percent of Controlled Company Firm-Years by Industry FF48 Industry Industry Description
# Firm-Years
# CC Firm-Years
Non-CC Firm-Years
% CCs in Industry
% of CCs
1 Agriculture 48 12 36 25 1 2 Food Products 283 44 239 16 3 3 Candy & Soda 45 14 31 31 1 4 Beer & Liquor 50 14 36 28 1 5 Tobacco Products 21 0 21 0 0 6 Recreation 77 18 59 23 1 7 Entertainment 195 62 133 32 4 8 Printing and Publishing 127 57 70 45 3 9 Consumer Goods 242 36 206 15 2 10 Apparel 231 54 177 23 3 11 Healthcare 277 15 262 5 1 12 Medical Equipment 502 1 501 0 0 13 Pharmaceutical Products 1,074 43 1,031 4 3 14 Chemicals 369 27 342 7 2 15 Rubber and Plastic Products 82 0 82 0 0 16 Textiles 41 15 26 37 1 17 Construction Materials 316 35 281 11 2 18 Construction 242 16 226 7 1 19 Steel Works 198 5 193 3 0 20 Fabricated Products 32 6 26 19 0 21 Machinery 605 20 585 3 1 22 Electrical Equipment 226 17 209 8 1 23 Automobiles and Trucks 265 16 249 6 1 24 Aircraft 110 8 102 7 0 25 Shipbuilding, Railroad Equipment 60 13 47 22 1 26 Defense 55 0 55 0 0 27 Precious Metals 31 0 31 0 0 28 Non-Metallic and Industrial Metal Mining 66 13 53 20 1 29 Coal 63 0 63 0 0 30 Petroleum and Natural Gas 762 64 698 8 4 31 Utilities 618 9 609 1 1 32 Communication 556 176 380 32 11 33 Personal Services 226 40 186 18 2 34 Business Services 1,817 167 1,650 9 10 35 Computers 568 27 541 5 2 36 Electronic Equipment 1,012 49 963 5 3 37 Measuring and Control Equipment 322 18 304 6 1 38 Business Supplies 198 16 182 8 1 39 Shipping Containers 61 9 52 15 1 40 Transportation 497 41 456 8 2 41 Wholesale 490 32 458 7 2 42 Retail 977 128 849 13 8 43 Restaurants, Hotels, Motels 278 15 263 5 1 44 Banking 1,696 82 1,614 5 5 45 Insurance 703 130 573 18 8 46 Real Estate 104 11 93 11 1 47 Trading 1,389 78 1,311 6 5 48 Other 357 19 338 5 1 Total 18,564 1,672 16,892 9 100

40
Table 1, Continued Panel B: Number and Percent of Controlled Company Firm-Years by Controlling Party Party Controlling Voting Power # of CCs % of CCs Executives or Directors 480 29 Founding Family 877 52 Other Parties (e.g., institutional investors) 315 19 Total Controlled Company Firm-Years 1,672 100
Panel C: Number and Percent of Controlled Company Firm-Years by Exemption Type # of CCs % of CCs Claiming exemption 992 59 Not claiming exemption 680 41 Total Controlled Company Firm-Years 1,672 100
Panel D: Reasons Disclosed in Proxy Statement for Claiming Controlled Company Exemption Reason # of CCs % of CCs Board of directors 148 15 Compensation committee 135 14 Nominating or governance committee 381 38 No reason given 571 58 This table presents descriptive information about controlled companies in our full sample without imposing data restrictions due to control variable data availability. Panel A provides the number and percent of controlled company firm-years in each industry and overall using Fama-French 48 industries. Panel B presents the number and percent of controlled company firm-years by the party controlling the voting power of the firm. Panel C presents the number and percent of controlled company firm-years based on whether they claim the exemption and Panel D provides the reasons disclosed in firm proxy statements for why the firm claims the controlled company exemption. With the exception of cases where no reason is provided, all other categories of reasons in Panel D are not mutually exclusive.
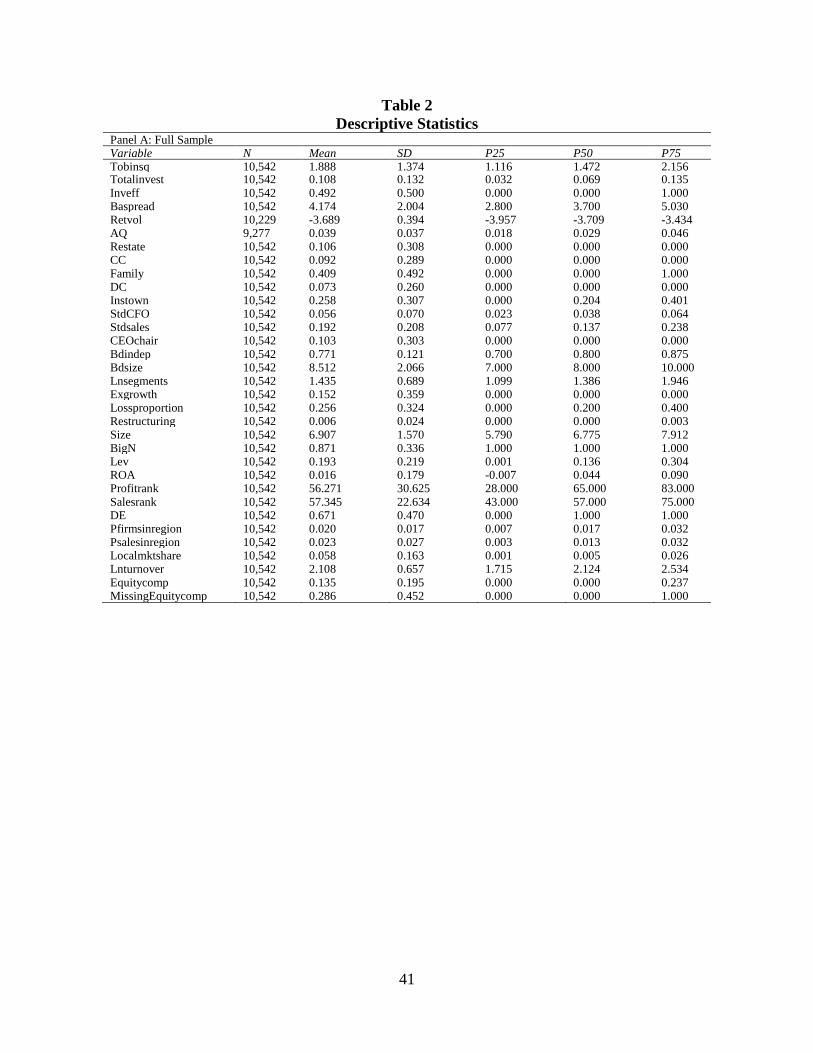
41
Table 2 Descriptive Statistics
Panel A: Full Sample Variable N Mean SD P25 P50 P75 Tobinsq 10,542 1.888 1.374 1.116 1.472 2.156 Totalinvest 10,542 0.108 0.132 0.032 0.069 0.135 Inveff 10,542 0.492 0.500 0.000 0.000 1.000 Baspread 10,542 4.174 2.004 2.800 3.700 5.030 Retvol 10,229 -3.689 0.394 -3.957 -3.709 -3.434 AQ 9,277 0.039 0.037 0.018 0.029 0.046 Restate 10,542 0.106 0.308 0.000 0.000 0.000 CC 10,542 0.092 0.289 0.000 0.000 0.000 Family 10,542 0.409 0.492 0.000 0.000 1.000 DC 10,542 0.073 0.260 0.000 0.000 0.000 Instown 10,542 0.258 0.307 0.000 0.204 0.401 StdCFO 10,542 0.056 0.070 0.023 0.038 0.064 Stdsales 10,542 0.192 0.208 0.077 0.137 0.238 CEOchair 10,542 0.103 0.303 0.000 0.000 0.000 Bdindep 10,542 0.771 0.121 0.700 0.800 0.875 Bdsize 10,542 8.512 2.066 7.000 8.000 10.000 Lnsegments 10,542 1.435 0.689 1.099 1.386 1.946 Exgrowth 10,542 0.152 0.359 0.000 0.000 0.000 Lossproportion 10,542 0.256 0.324 0.000 0.200 0.400 Restructuring 10,542 0.006 0.024 0.000 0.000 0.003 Size 10,542 6.907 1.570 5.790 6.775 7.912 BigN 10,542 0.871 0.336 1.000 1.000 1.000 Lev 10,542 0.193 0.219 0.001 0.136 0.304 ROA 10,542 0.016 0.179 -0.007 0.044 0.090 Profitrank 10,542 56.271 30.625 28.000 65.000 83.000 Salesrank 10,542 57.345 22.634 43.000 57.000 75.000 DE 10,542 0.671 0.470 0.000 1.000 1.000 Pfirmsinregion 10,542 0.020 0.017 0.007 0.017 0.032 Psalesinregion 10,542 0.023 0.027 0.003 0.013 0.032 Localmktshare 10,542 0.058 0.163 0.001 0.005 0.026 Lnturnover 10,542 2.108 0.657 1.715 2.124 2.534 Equitycomp 10,542 0.135 0.195 0.000 0.000 0.237 MissingEquitycomp 10,542 0.286 0.452 0.000 0.000 1.000

42
Table 2, Continued Panel B: Sample Split on CC
CC=0 CC=1 Diff in Means Variable N Mean SD N Mean SD T-Stat P-Value Tobinsq 9,575 1.900 1.364 967 1.768 1.468 2.85 0.00 Totalinvest 9,575 0.112 0.136 967 0.069 0.087 9.50 0.00 Inveff 9,575 0.487 0.500 967 0.540 0.499 3.14 0.00 Baspread 9,575 4.142 1.962 967 4.484 2.359 -5.05 0.00 Retvol 9,293 -3.693 0.390 936 -3.640 0.429 -3.99 0.00 AQ 8,408 0.039 0.036 869 0.039 0.041 0.17 0.86 Restate 9,575 0.104 0.306 967 0.120 0.325 -1.51 0.13 Family 9,575 0.385 0.487 967 0.640 0.480 -15.52 0.00 DC 9,575 0.025 0.156 967 0.544 0.498 -72.52 0.00 Instown 9,575 0.245 0.278 967 0.385 0.492 -13.58 0.00 StdCFO 9,575 0.057 0.072 967 0.054 0.055 1.34 0.18 Stdsales 9,575 0.190 0.203 967 0.210 0.253 -2.80 0.01 CEOchair 9,575 0.107 0.309 967 0.060 0.238 4.58 0.00 Bdindep 9,575 0.787 0.103 967 0.614 0.164 46.49 0.00 Bdsize 9,575 8.494 2.047 967 8.697 2.241 -2.92 0.00 Lnsegments 9,575 1.432 0.689 967 1.468 0.687 -1.55 0.12 Exgrowth 9,575 0.150 0.358 967 0.169 0.375 -1.49 0.14 Lossproportion 9,575 0.256 0.326 967 0.248 0.303 0.76 0.44 Restructuring 9,575 0.006 0.023 967 0.008 0.031 -2.70 0.01 Size 9,575 6.893 1.587 967 7.039 1.388 -2.75 0.01 BigN 9,575 0.870 0.336 967 0.874 0.332 -0.31 0.75 Lev 9,575 0.187 0.210 967 0.246 0.284 -7.91 0.00 ROA 9,575 0.016 0.182 967 0.019 0.148 -0.51 0.61 Profitrank 9,575 55.414 30.449 967 64.755 31.077 -9.07 0.00 Salesrank 9,575 56.592 22.733 967 64.800 20.182 -10.81 0.00 DE 9,575 0.669 0.471 967 0.695 0.461 -1.66 0.10 Pfirmsinregion 9,575 0.020 0.017 967 0.021 0.019 -2.18 0.03 Psalesinregion 9,575 0.023 0.026 967 0.027 0.031 -4.78 0.00 Localmktshare 9,575 0.057 0.159 967 0.071 0.196 -2.59 0.01 Lnturnover 9,575 2.149 0.621 967 1.700 0.840 20.67 0.00 Equitycomp 9,575 0.142 0.198 967 0.068 0.152 11.23 0.00 MissingEquitycomp 9,575 0.262 0.440 967 0.531 0.499 -17.88 0.00

43
Table 2, Continued
Panel C: Entropy Balanced Full Sample Split on CC CC=0 CC=1 Diff in Means
Variable N Mean SD N Mean SD T-Stat P-Value Family 9.575 0.640 0.480 967 0.640 0.480 0.00 1.00 DC 9.575 0.544 0.498 967 0.544 0.498 0.00 1.00 Instown 9.575 0.385 0.515 967 0.385 0.492 0.00 1.00 StdCFO 9.575 0.054 0.068 967 0.054 0.055 0.00 1.00 Stdsales 9.575 0.210 0.256 967 0.210 0.253 0.00 1.00 CEOchair 9.575 0.060 0.237 967 0.060 0.238 0.00 1.00 Bdindep 9.575 8.697 2.739 967 8.697 2.241 0.00 1.00 Bdsize 9.575 0.614 0.113 967 0.614 0.164 0.00 1.00 Lnsegments 9.575 1.468 0.732 967 1.468 0.687 0.00 1.00 Exgrowth 9.575 0.169 0.374 967 0.169 0.375 0.00 1.00 Lossproportion 9.575 0.248 0.292 967 0.248 0.303 0.00 1.00 Restructuring 9.575 0.008 0.030 967 0.008 0.031 0.00 1.00 Size 9.575 7.039 1.662 967 7.039 1.388 0.00 1.00 BigN 9.575 0.874 0.332 967 0.874 0.332 0.00 1.00 Lev 9.575 0.246 0.243 967 0.246 0.284 0.00 1.00 ROA 9.575 0.019 0.132 967 0.019 0.148 0.00 1.00 Profitrank 9.575 64.750 27.599 967 64.750 31.077 0.00 1.00 Salesrank 9.575 64.800 20.785 967 64.800 20.182 0.00 1.00 DE 9.575 0.695 0.460 967 0.695 0.461 0.00 1.00 Pfirmsinregion 9.575 0.021 0.021 967 0.021 0.019 0.00 1.00 Psalesinregion 9.575 0.027 0.032 967 0.027 0.031 0.00 1.00 Localmktshare 9.575 0.071 0.192 967 0.071 0.196 0.00 1.00 Lnturnover 9.575 1.700 0.757 967 1.700 0.840 0.00 1.00 Equitycomp 9.575 0.068 0.143 967 0.068 0.152 0.00 1.00 MissingEquitycomp
9.575 0.531 0.499 967 0.531 0.499 0.00 1.00
Panel D: Entropy Balanced Sample Split on CC for Low Bdindep Firm-Years CC=0 CC=1 Diff in Means
Variable N Mean SD N Mean SD T-Stat P-Value Family 3,932 0.632 0.482 802 0.632 0.482 0.00 1.00 DC 3,932 0.541 0.498 802 0.541 0.499 0.00 1.00 Instown 3,932 0.368 0.490 802 0.368 0.469 0.00 1.00 StdCFO 3,932 0.054 0.074 802 0.054 0.055 0.00 1.00 Stdsales 3,932 0.215 0.228 802 0.215 0.260 0.00 1.00 CEOchair 3,932 0.064 0.244 802 0.064 0.244 0.00 1.00 Bdsize 3,932 8.666 2.529 802 8.666 2.253 0.00 1.00 Lnsegments 3,932 1.472 0.716 802 1.472 0.648 0.00 1.00 Exgrowth 3,932 0.155 0.362 802 0.155 0.362 0.00 1.00 Lossproportion 3,932 0.250 0.303 802 0.250 0.307 0.00 1.00 Restructuring 3,932 0.007 0.024 802 0.007 0.030 0.00 1.00 Size 3,932 6.997 1.608 802 6.997 1.392 0.00 1.00 BigN 3,932 0.869 0.337 802 0.869 0.337 0.00 1.00 Lev 3,932 0.244 0.262 802 0.244 0.285 0.00 1.00 ROA 3,932 0.023 0.137 802 0.023 0.152 0.00 1.00 Profitrank 3,932 63.560 27.727 802 63.570 31.340 0.00 1.00 Salesrank 3,932 64.720 19.506 802 64.730 20.782 0.00 1.00 DE 3,932 0.716 0.451 802 0.716 0.451 0.00 1.00 Pfirmsinregion 3,932 0.022 0.022 802 0.022 0.019 0.00 1.00 Psalesinregion 3,932 0.028 0.033 802 0.028 0.032 0.00 1.00 Localmktshare 3,932 0.066 0.178 802 0.066 0.195 0.00 1.00 Lnturnover 3,932 1.705 0.773 802 1.705 0.841 0.00 1.00 Equitycomp 3,932 0.069 0.139 802 0.069 0.154 0.00 1.00 MissingEquitycomp
3,932 0.522 0.500 802 0.522 0.500 0.00 1.00

44
Table 2, Continued Panel E: Entropy Balanced Sample Split on CC for High Bdindep Firm-Years
CC=0 CC=1 Diff in Means Variable N Mean SD N Mean SD T-Stat P-Value Family 5,643 0.678 0.467 165 0.679 0.468 0.00 1.00 DC 5,643 0.557 0.497 165 0.558 0.498 0.01 0.99 Instown 5,643 0.464 0.547 165 0.464 0.590 0.00 1.00 StdCFO 5,643 0.054 0.137 165 0.054 0.053 0.00 1.00 Stdsales 5,643 0.185 0.209 165 0.185 0.212 0.00 1.00 CEOchair 5,643 0.042 0.202 165 0.042 0.202 0.00 1.00 Bdsize 5,643 8.849 2.396 165 8.848 2.185 0.00 1.00 Lnsegments 5,643 1.449 0.738 165 1.449 0.852 0.00 1.00 Exgrowth 5,643 0.236 0.425 165 0.236 0.426 0.00 1.00 Lossproportion 5,643 0.237 0.283 165 0.237 0.279 0.00 1.00 Restructuring 5,643 0.014 0.040 165 0.014 0.038 0.00 1.00 Size 5,643 7.240 1.627 165 7.240 1.350 0.00 1.00 BigN 5,643 0.897 0.304 165 0.897 0.305 0.00 1.00 Lev 5,643 0.255 0.221 165 0.255 0.284 0.00 1.00 ROA 5,643 -0.001 0.156 165 -0.001 0.126 0.00 1.00 Profitrank 5,643 70.510 24.304 165 70.520 29.177 0.00 1.00 Salesrank 5,643 65.160 18.022 165 65.160 17.015 0.00 1.00 DE 5,643 0.594 0.491 165 0.594 0.493 0.00 1.00 Pfirmsinregion 5,643 0.016 0.016 165 0.016 0.016 0.00 1.00 Psalesinregion 5,643 0.020 0.026 165 0.020 0.026 0.00 1.00 Localmktshare 5,643 0.095 0.193 165 0.095 0.204 0.00 1.00 Lnturnover 5,643 1.678 0.869 165 1.678 0.840 0.00 1.00 Equitycomp 5,643 0.066 0.140 165 0.066 0.138 0.00 1.00 MissingEquitycomp
5,643 0.569 0.495 165 0.570 0.497 0.00 1.00 This table presents descriptive statistics. Panel A presents descriptive statistics for the main variables in our analyses for the full sample of firm-year observations. Panel B presents descriptive statistics for the main variables in our analyses split on whether the firm was a controlled company in that year. Panel C presents descriptive statistics for control variables split on whether the firm was a controlled company in that year after reweighting observations using entropy balancing. Panel D presents descriptive statistics for control variables split on whether the firm was a controlled company in that year for all firm-years where the firm’s board independence is below the mean board independence of all firms in that year. Panel E presents descriptive statistics for control variables split on whether the firm was a controlled company in that year for all firm-years where the firm’s board independence is above the mean board independence of all firms in that year. We reweight all observations in Panels D and E separately using entropy balancing. All variables are defined in Appendix B.

45
Table 3 Correlations
Variable (1) (2) (3) (4) (5) (6) (7) (8) CC (1) Tobinsq (2) -0.03 Totalinvest (3) -0.09 0.33 Inveff (4) 0.03 -0.16 -0.08 Baspread (5) 0.05 -0.09 0.06 -0.20 Retvol (6) 0.04 -0.09 0.06 -0.18 0.87 AQ (7) 0.00 0.27 -0.08 -0.12 0.24 0.22 Restate (8) 0.01 -0.04 -0.01 0.00 0.01 0.01 0.01 Family (9) 0.15 0.08 0.05 0.01 0.00 0.02 0.05 0.00 DC (10) 0.58 -0.06 -0.05 0.00 -0.01 -0.01 -0.05 0.02 Instown (11) 0.13 -0.04 -0.06 0.07 -0.13 -0.07 -0.06 -0.02 StdCFO (12) -0.01 0.26 -0.02 -0.16 0.32 0.26 0.58 -0.02 Stdsales (13) 0.03 0.04 -0.02 -0.07 0.21 0.19 0.21 0.01 CEOchair (14) -0.04 -0.01 0.03 0.04 -0.04 -0.10 -0.05 -0.03 Bdindep (15) -0.41 0.00 -0.05 0.06 -0.08 -0.09 -0.03 -0.02 Bdsize (16) 0.03 -0.11 -0.06 0.08 -0.23 -0.26 -0.17 0.00 Lnsegments (17) 0.02 -0.04 -0.01 0.09 -0.12 -0.12 -0.06 0.02 Exgrowth (18) 0.01 -0.07 -0.04 -0.10 0.19 0.16 0.16 0.01 Lossproportion (19) -0.01 0.09 -0.04 -0.18 0.44 0.39 0.34 0.02 Restructuring (20) 0.03 -0.13 -0.05 -0.04 0.31 0.20 0.02 0.02 Size (21) 0.03 -0.26 0.03 0.19 -0.36 -0.37 -0.37 0.01 BigN (22) 0.00 -0.06 -0.02 0.07 -0.14 -0.14 -0.13 0.04 Lev (23) 0.08 -0.08 0.08 -0.03 0.09 0.05 -0.10 0.03 ROA (24) 0.00 -0.06 0.01 0.12 -0.39 -0.30 -0.25 -0.01 Profitrank (25) 0.09 -0.16 -0.01 0.04 -0.17 -0.17 -0.22 -0.02 Salesrank (26) 0.10 -0.15 -0.06 0.05 -0.12 -0.12 -0.17 0.01 DE (27) 0.02 0.05 0.00 0.02 0.05 0.05 0.04 -0.01 Pfirmsinregion (28) 0.02 0.00 -0.03 0.01 0.02 0.02 0.06 -0.01 Psalesinregion (29) 0.05 -0.04 -0.01 0.01 0.00 0.00 0.01 -0.01 Localmktshare (30) 0.03 -0.06 0.03 -0.01 -0.08 -0.09 -0.11 0.02 Lnturnover (31) -0.20 0.07 0.15 0.03 0.07 0.07 -0.01 0.01 Equitycomp (32) -0.11 0.08 -0.04 0.09 -0.12 -0.13 -0.07 -0.03 MissingEquitycomp (33) 0.17 0.05 0.04 -0.13 0.27 0.26 0.21 0.01 This table reports Pearson correlation coefficients for our variables of interest and all control variables. Correlations reported in bold indicate significance at the 0.05 level (two-tailed) or better. All variables are defined in Appendix B.

46
Table 4 Controlled Companies and Firm Value
Variables
DV: Tobinsq (1) (2) (3) Full Sample Low Bdindep High Bdindep
CC 0.377*** 0.339*** 0.057 (3.578) (3.354) (0.843)
Family 0.378** 0.377*** -0.059 (2.519) (2.599) (-0.891)
DC -0.547*** -0.600*** -0.100 (-4.181) (-4.297) (-1.396)
Instown 0.041 0.032 -0.110 (0.471) (0.358) (-1.277)
StdCFO 4.485*** 5.338*** 1.904*** (2.622) (3.467) (3.829)
Stdsales -0.331 -0.359* 0.081 (-1.582) (-1.707) (0.278)
CEOchair 0.146 0.149 0.158* (1.096) (1.019) (1.949)
Bdindep 0.728** (2.512)
Bdsize 0.023 0.019 0.014 (1.124) (0.813) (0.826)
Lnsegments -0.001 0.021 -0.016 (-0.021) (0.287) (-0.483)
Exgrowth -0.301*** -0.308*** -0.194*** (-2.706) (-2.713) (-2.882)
Lossproportion -0.511* -0.401* -0.353*** (-1.863) (-1.800) (-2.695)
Restructuring -2.154* -2.671** -1.420** (-1.849) (-2.107) (-2.089)
Size -0.242*** -0.253*** -0.088*** (-3.877) (-3.700) (-2.840)
BigN -0.112 0.027 0.036 (-0.614) (0.166) (0.341)
Lev 0.962** 0.775** 1.014*** (2.388) (2.217) (6.048)
ROA 0.427 0.393 0.289 (0.435) (0.434) (0.798)
Profitrank -0.002 -0.004** 0.001 (-1.526) (-2.064) (0.611)
Salesrank -0.002 -0.001 -0.000 (-0.564) (-0.346) (-0.137)
DE -0.172 -0.158 -0.107 (-1.633) (-1.477) (-1.461)
Pfirmsinregion 14.442** 7.693 15.515*** (2.141) (1.192) (3.179) Psalesinregion -2.873 -0.306 -9.825*** (-0.763) (-0.083) (-3.284) Localmktshare 0.086 0.121 0.312* (0.284) (0.322) (1.739) Lnturnover 0.203*** 0.176** 0.088 (2.904) (2.559) (1.463) Equitycomp 0.548* 0.739** 0.698** (1.899) (2.376) (2.093) Test of CC for (2) vs. (3) 0.282*** χ² (17.35)
MissingEquitycomp Yes Yes Yes Year & Industry FE Yes Yes Yes Observations 10,542 4,734 5,808 Adjusted R2 0.326
0.350 0.573
This table presents results of weighted least squares regressions of TobinsQ on an indicator variable for whether the firm is a controlled company and control variables. Column 1 reports results for the main sample while Columns 2 and 3 report results for the low and high board independence samples, respectively. t-statistics and χ²-statistics are shown in parentheses. To test coefficient equality for CC across columns, we estimate the regressions simultaneously. Standard errors are clustered by firm. ***, **, and * indicate statistical significance at p < 0.01, p < 0.05, and p < 0.10, respectively. All variables are defined in Appendix A.

47
Table 5 Controlled Companies and Stock Returns
Equal-Weighted Returns Value-Weighted Returns (1) (2) (3) (4)
Variables CCs Non-CCs CCs Non-CCs Alpha 0.004** 0.002 0.000 0.000 (3.316) (1.149) (0.969) (0.470) MKTRF 1.051*** 1.034*** 1.102*** 0.958*** (41.638) (33.197) (30.362) (71.082) SMB 0.402** 0.360*** 0.375*** -0.010 (3.504) (8.849) (4.068) (-0.373) HML 0.450*** 0.266** -0.080* 0.072** (9.716) (2.535) (-1.977) (2.664) UMD 0.040 0.013 -0.026 0.022** (0.975) (0.474) (-1.177) (2.862)
Observations 84 84 84 84 Adjusted R2 0.960 0.977 0.943 0.992 This table presents results of regressions of monthly portfolio returns on MKTRF, SMB, HML and UMD using equally-weighted returns (Columns 1 and 2) and value-weighted returns (Columns 3 and 4). Columns 1 and 3 report results for portfolios of controlled companies and Columns 2 and 4 report results for portfolios of non-controlled companies. Portfolios are rebalanced each year every calendar year May. t-statistics are shown in parentheses. Standard errors are clustered by year. ***, **, and * indicate statistical significance at p < 0.01, p < 0.05, and p < 0.10, respectively. All variables are defined in Appendix A.

48
Table 6 Controlled Companies and Firm Investment
Variables
DV: Totalinvest DV: Inveff (1) (2) (3) (4) (5) (6) Full Sample Low Bdindep High Bdindep Full Sample Low Bdindep High Bdindep
CC -0.008 -0.009* -0.009 -0.061** -0.044* 0.003 (-1.358) (-1.706) (-0.947) (-2.399) (-1.708) (0.077)
Family 0.021*** 0.014** 0.002 -0.019 0.011 0.048 (3.259) (2.070) (0.231) (-0.828) (0.499) (1.281)
DC -0.010 -0.013* -0.019** 0.061** 0.057* 0.017 (-1.625) (-1.867) (-1.965) (2.021) (1.813) (0.419)
Instown 0.008 0.014** 0.025** -0.074** -0.029 -0.096** (1.389) (2.193) (2.523) (-2.528) (-1.241) (-1.968)
StdCFO 0.139** 0.155** 0.192*** 0.660* 0.592*** 0.526*** (2.358) (2.480) (3.718) (1.870) (2.599) (3.758)
Stdsales -0.031*** -0.031*** -0.070*** -0.028 -0.110* 0.148* (-2.790) (-2.624) (-3.277) (-0.570) (-1.952) (1.931)
CEOchair 0.013* 0.004 0.016** -0.134* -0.130** 0.066 (1.773) (0.553) (2.015) (-1.928) (-2.071) (0.891)
Bdindep 0.021 0.087 (1.043) (1.074)
Bdsize -0.001 -0.001 -0.007*** 0.012* 0.010 0.002 (-1.079) (-0.381) (-3.035) (1.699) (1.303) (0.217)
Lnsegments -0.002 -0.001 -0.000 -0.009 -0.002 -0.024 (-0.736) (-0.344) (-0.020) (-0.473) (-0.126) (-1.058)
Exgrowth -0.018*** -0.019** -0.024*** -0.074* 0.002 -0.121*** (-2.594) (-2.204) (-3.186) (-1.823) (0.054) (-2.613)
Lossproportion 0.006 0.005 0.048* 0.015 -0.000 -0.263*** (0.553) (0.398) (1.960) (0.275) (-0.001) (-2.653)
Restructuring -0.192*** -0.196*** -0.095 0.183 0.223 -0.201 (-3.845) (-2.912) (-1.456) (0.490) (0.565) (-0.535)
Size -0.004 -0.004 0.005 0.029** 0.034*** 0.002 (-1.345) (-1.587) (1.063) (2.553) (3.143) (0.118)
BigN -0.013 -0.011 0.023** 0.065 0.017 0.083 (-1.118) (-0.870) (1.992) (1.336) (0.341) (1.306)
Lev -0.022* -0.032** 0.004 -0.125** -0.091* 0.073 (-1.785) (-2.516) (0.167) (-2.438) (-1.808) (0.874)
ROA -0.060** -0.049* -0.091** -0.126 0.050 -0.086 (-2.312) (-1.727) (-2.520) (-0.792) (0.400) (-0.436)
Profitrank 0.000 -0.000 0.000** 0.000 0.000 -0.001 (0.406) (-0.141) (2.333) (0.583) (0.576) (-1.521)
Salesrank -0.000*** -0.000*** -0.001*** 0.000 -0.000 0.001 (-2.834) (-2.746) (-2.697) (0.086) (-0.483) (0.865)
DE -0.014** -0.008 -0.033*** 0.042* 0.022 0.090** (-2.028) (-1.330) (-3.092) (1.665) (0.853) (2.565)
Pfirmsinregion 0.302 0.142 1.444** -0.167 -0.165 1.070 (0.832) (0.389) (2.065) (-0.120) (-0.127) (0.411)
Psalesinregion -0.096 -0.076 -0.806* -0.245 -0.304 0.016 (-0.531) (-0.430) (-1.817) (-0.302) (-0.405) (0.012) Localmktshare 0.013 0.019 -0.004 -0.010 -0.024 -0.075
(0.871) (1.159) (-0.184) (-0.132) (-0.253) (-0.788) Lnturnover 0.025*** 0.026*** 0.018*** -0.090*** -0.060*** -0.089*** (5.329) (5.627) (2.600) (-3.698) (-3.157) (-2.690) Equitycomp 0.049*** 0.040*** 0.043* -0.025 -0.045 0.327** (3.587) (3.437) (1.648) (-0.359) (-0.632) (2.095) Test of CC for (2) vs. (3) & (5) vs. (6) 0.00 -0.047 χ² (0.00) (1.82) MissingEquitycomp Yes Yes Yes Yes Yes Yes Year & Industry FE Yes Yes Yes Yes Yes Yes Observations 10,542 4,734 5,808 10,542 4,734 5,808 Adjusted R2 0.416 0.357 0.719 0.412 0.416 0.560 This table presents results of weighted least squares regressions of Totalinvest and Inveff on an indicator variable for whether the firm is a controlled company and control variables. Columns 1 and 4 report results for the main sample, Columns 2 and 5 report results for the low board independence sample and Columns 3 and 6 report results for the high board independence sample. t-statistics and χ²-statistics are shown in parentheses. To test coefficient equality for CC across columns, we estimate the regressions simultaneously. Standard errors are clustered by firm. ***, **, and * indicate statistical significance at p < 0.01, p < 0.05, and p < 0.10, respectively. All variables are defined in Appendix A

49
Table 7 Controlled Companies and Information Asymmetry
Variables
DV: Baspread DV: Retvol (1) (2) (3) (4) (5) (6) Full Sample Low Bdindep High Bdindep Full Sample Low Bdindep High Bdindep
CC 0.261*** 0.377*** 0.038 0.025 0.036** -0.048 (2.610) (3.855) (0.191) (1.439) (2.411) (-1.307)
Family 0.122 -0.019 0.440** 0.021 0.018 0.086** (1.015) (-0.183) (2.022) (1.011) (0.987) (2.258)
DC -0.226** -0.198* -0.590** -0.027 -0.034* -0.018 (-1.976) (-1.731) (-2.372) (-1.355) (-1.758) (-0.413)
Instown -0.440*** -0.579*** -0.138 0.042* 0.026 0.046 (-2.581) (-2.852) (-0.493) (1.697) (1.071) (1.059)
StdCFO -1.864* -1.147 -1.028 -0.692** -0.394*** -0.077 (-1.663) (-1.082) (-1.324) (-2.568) (-2.993) (-0.593)
Stdsales 1.091*** 0.895*** 0.460 0.117*** 0.101*** -0.041 (3.003) (4.210) (0.953) (2.892) (3.167) (-0.439)
CEOchair 0.351** 0.317* 0.208 0.072** 0.074** -0.020 (2.019) (1.722) (0.723) (2.408) (2.376) (-0.315)
Bdindep -0.869** -0.110 (-2.314) (-1.588)
Bdsize -0.028 -0.038 -0.059 -0.001 -0.005 -0.015* (-0.974) (-1.237) (-1.442) (-0.228) (-1.038) (-1.949)
Lnsegments -0.100 -0.067 -0.091 -0.007 -0.009 -0.017 (-1.345) (-0.960) (-0.694) (-0.505) (-0.631) (-0.725)
Exgrowth 0.328** 0.225* 0.199 0.045* 0.030 0.024 (2.561) (1.808) (0.831) (1.888) (1.446) (0.644)
Lossproportion 1.451*** 1.421*** 1.415*** 0.276*** 0.279*** 0.306*** (6.796) (6.443) (3.264) (8.065) (8.825) (4.244)
Restructuring 10.591*** 13.351*** 7.010** 0.264 0.503** 0.512 (5.409) (6.571) (2.184) (0.988) (2.221) (1.308)
Size -0.263*** -0.279*** -0.218** -0.071*** -0.072*** -0.044*** (-4.182) (-4.136) (-2.504) (-7.185) (-7.327) (-2.932)
BigN -0.180 -0.259* -0.402 -0.019 -0.014 0.017 (-1.124) (-1.701) (-1.335) (-0.660) (-0.648) (0.323)
Lev 0.849*** 0.651*** 0.446 0.157*** 0.116*** 0.078 (4.108) (3.000) (1.085) (4.093) (3.129) (1.057)
ROA -1.870*** -1.994*** -2.841*** -0.127* -0.177** -0.086 (-4.082) (-4.499) (-2.661) (-1.777) (-2.548) (-0.504)
Profitrank 0.002 0.002 -0.002 0.000 0.001** -0.002*** (1.348) (1.362) (-0.565) (1.471) (2.280) (-2.828)
Salesrank -0.003 -0.004 -0.012** -0.000 -0.000 -0.001 (-1.079) (-1.582) (-1.969) (-0.364) (-0.523) (-0.768)
DE -0.105 -0.238** -0.078 -0.047** -0.061*** -0.027 (-0.900) (-2.080) (-0.458) (-2.282) (-3.271) (-0.807)
Pfirmsinregion -1.885 -1.268 4.318 0.012 0.334 0.543 (-0.321) (-0.238) (0.384) (0.012) (0.342) (0.246)
Psalesinregion 0.252 -0.977 -2.857 -0.159 -0.296 -0.765 (0.081) (-0.332) (-0.505) (-0.283) (-0.528) (-0.690) Localmktshare -0.104 -0.127 -0.274 -0.052 -0.054 -0.102
(-0.295) (-0.379) (-0.780) (-0.821) (-0.897) (-1.145) Lnturnover 0.496*** 0.467*** 0.607*** 0.075*** 0.074*** 0.056* (5.137) (4.353) (3.603) (4.270) (4.955) (1.792) Equitycomp -0.084 -0.107 -0.780 -0.060 -0.084 0.024 (-0.265) (-0.326) (-1.468) (-0.989) (-1.606) (0.173) Test of CC for (2) vs. (3) & (4) vs. (6) 0.339* 0.084** χ² (2.90) (5.30) MissingEquitycomp Yes Yes Yes Yes Yes Yes Year & Industry FE Yes Yes Yes Yes Yes Yes Observations 10,542 4,734 5,808 10,229 4,548 5,681 Adjusted R2 0.657
0.659 0.756 0.690 0.694 0.761
This table presents results of weighted least squares regressions of Baspread and Retvol on an indicator variable for whether the firm is a controlled company and control variables. Columns 1 and 4 report results for the main sample, Columns 2 and 5 report results for the low board independence sample and Columns 3 and 6 report results for the high board independence sample. t-statistics and χ²-statistics are shown in parentheses. To test coefficient equality for CC across columns, we estimate the regressions simultaneously. Standard errors are clustered by firm. ***, **, and * indicate statistical significance at p < 0.01, p < 0.05, and p < 0.10, respectively. All variables are defined in Appendix A.

50
Table 8 Controlled Companies and Earnings Management
Variables
DV: AQ DV: Restate (1) (2) (3) (4) (5) (6) Full Sample Low Bdindep High Bdindep Full Sample Low Bdindep High Bdindep
CC 0.003 0.005** -0.006** 0.028 0.036* 0.003 (1.061) (2.323) (-2.036) (1.636) (1.667) (0.099)
Family 0.004 0.007** -0.003 0.001 0.005 -0.004 (1.412) (2.335) (-0.986) (0.054) (0.218) (-0.136)
DC -0.006** -0.010*** -0.002 -0.000 -0.006 -0.070* (-2.007) (-3.151) (-0.484) (-0.022) (-0.275) (-1.849)
Instown 0.001 0.002 0.001 -0.011 -0.019 -0.003 (0.375) (0.578) (0.285) (-0.477) (-0.676) (-0.074)
StdCFO 0.317*** 0.249*** 0.214*** -0.177 -0.293* 0.120 (5.750) (3.164) (7.492) (-1.152) (-1.902) (0.917)
Stdsales -0.002 0.000 -0.029*** -0.021 0.034 -0.234*** (-0.422) (0.040) (-3.314) (-0.727) (1.009) (-2.811)
CEOchair 0.005 0.004 -0.001 0.021 0.018 0.033 (1.158) (0.918) (-0.324) (0.542) (0.423) (0.518)
Bdindep -0.002 -0.039 (-0.257) (-0.615)
Bdsize 0.000 0.001 0.001** -0.002 0.001 0.006 (0.139) (0.905) (2.050) (-0.495) (0.120) (0.624)
Lnsegments 0.001 0.003* 0.003** 0.018 0.026 -0.003 (0.934) (1.672) (2.117) (1.212) (1.277) (-0.122)
Exgrowth 0.000 0.004 0.010*** 0.005 0.011 0.035 (0.162) (1.501) (5.161) (0.289) (0.499) (1.015)
Lossproportion 0.001 0.005 0.015** -0.068* -0.061 -0.006 (0.245) (0.964) (2.266) (-1.855) (-1.408) (-0.068)
Restructuring -0.081*** -0.058** -0.050** 0.205 -0.012 0.328 (-3.438) (-2.056) (-2.399) (0.653) (-0.039) (0.551)
Size -0.002 -0.004** -0.006*** -0.010 -0.015 -0.025* (-1.397) (-2.289) (-4.538) (-0.905) (-0.964) (-1.647)
BigN 0.000 -0.001 -0.007* 0.033 0.063** -0.122** (0.120) (-0.382) (-1.872) (1.221) (2.002) (-2.170)
Lev -0.009 -0.012* 0.002 0.035 0.026 -0.095 (-1.267) (-1.741) (0.359) (1.013) (0.621) (-1.453)
ROA -0.022* -0.023* 0.002 -0.050 -0.112 -0.018 (-1.869) (-1.839) (0.175) (-0.793) (-1.567) (-0.086)
Profitrank -0.000 -0.000 0.000 -0.001* -0.000 -0.000 (-1.630) (-1.048) (0.670) (-1.749) (-0.900) (-0.325)
Salesrank 0.000 0.000 0.000 -0.001 -0.002** -0.000 (0.400) (0.613) (1.612) (-1.361) (-2.294) (-0.190)
DE -0.002 -0.006* 0.001 -0.006 -0.046 -0.068* (-0.765) (-1.797) (0.249) (-0.243) (-1.510) (-1.955)
Pfirmsinregion 0.342* 0.275 0.000 -0.491 -0.251 -0.830 (1.896) (1.437) (0.001) (-0.433) (-0.197) (-0.483)
Psalesinregion -0.130 -0.078 0.071 0.591 0.823 -0.044 (-1.211) (-0.622) (0.511) (0.847) (1.019) (-0.049) Localmktshare -0.002 -0.004 0.006 0.059 -0.021 0.261***
(-0.521) (-0.847) (0.703) (1.117) (-0.395) (2.900) Lnturnover 0.005** 0.005** 0.010*** 0.035* 0.037 0.079* (2.204) (2.124) (4.214) (1.894) (1.537) (1.890) Equitycomp -0.007 -0.011* 0.010 -0.006 0.031 -0.262* (-1.217) (-1.882) (0.943) (-0.095) (0.444) (-1.688) Test of CC for (2) vs. (3) & (5) vs. (6) 0.011*** 0.033 χ² (16.30) (0.90) MissingEquitycomp Yes Yes Yes Yes Yes Yes Year & Industry FE Yes Yes Yes Yes Yes Yes Observations 9,277 4,164 5,113 10,542 4,734 5,808 Adjusted R2 0.457
0.462 0.635 0.096 0.097 0.329
This table presents results of weighted least squares regressions of AQ and Restate on an indicator variable for whether the firm is a controlled company and control variables. Columns 1 and 4 report results for the main sample, Columns 2 and 5 report results for the low board independence sample and Columns 3 and 6 report results for the high board independence sample. t-statistics and χ²-statistics are shown in parentheses. To test coefficient equality for CC across columns, we estimate the regressions simultaneously. Standard errors are clustered by firm. ***, **, and * indicate statistical significance at p < 0.01, p < 0.05, and p < 0.10, respectively. All variables are defined in Appendix A.
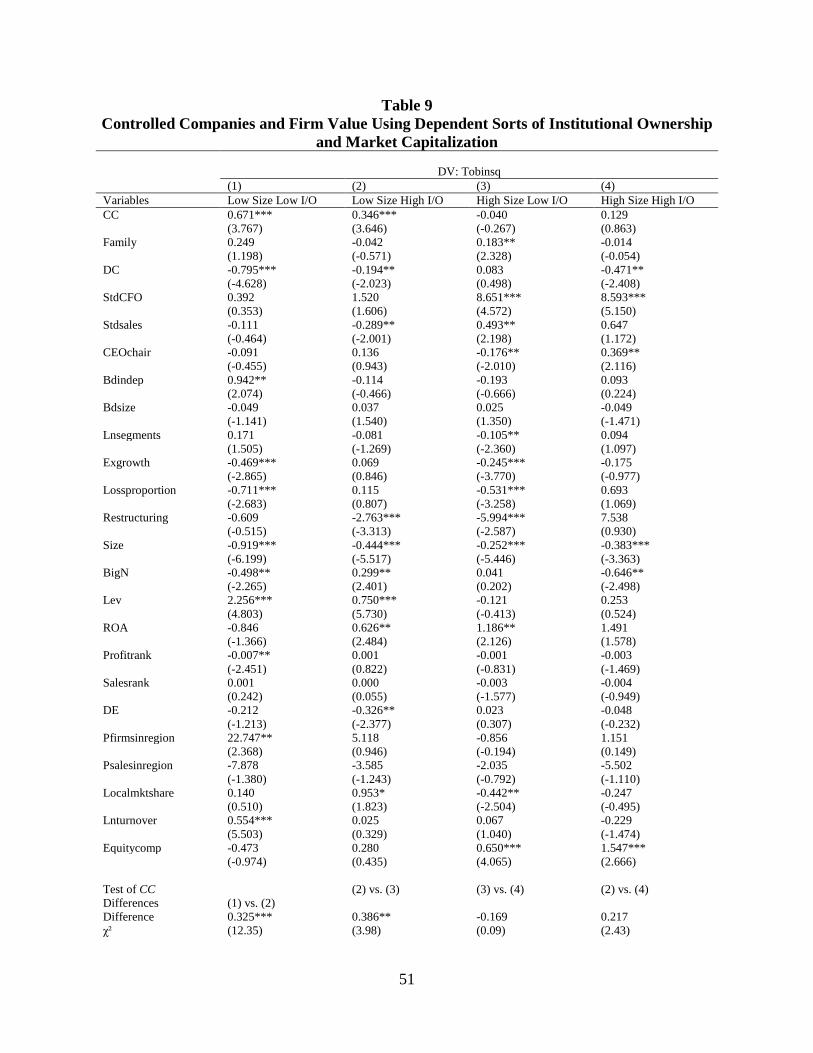
51
Table 9 Controlled Companies and Firm Value Using Dependent Sorts of Institutional Ownership
and Market Capitalization
DV: Tobinsq (1) (2) (3) (4) Variables Low Size Low I/O Low Size High I/O High Size Low I/O High Size High I/O CC 0.671*** 0.346*** -0.040 0.129 (3.767) (3.646) (-0.267) (0.863) Family 0.249 -0.042 0.183** -0.014 (1.198) (-0.571) (2.328) (-0.054) DC -0.795*** -0.194** 0.083 -0.471** (-4.628) (-2.023) (0.498) (-2.408) StdCFO 0.392 1.520 8.651*** 8.593*** (0.353) (1.606) (4.572) (5.150) Stdsales -0.111 -0.289** 0.493** 0.647 (-0.464) (-2.001) (2.198) (1.172) CEOchair -0.091 0.136 -0.176** 0.369** (-0.455) (0.943) (-2.010) (2.116) Bdindep 0.942** -0.114 -0.193 0.093 (2.074) (-0.466) (-0.666) (0.224) Bdsize -0.049 0.037 0.025 -0.049 (-1.141) (1.540) (1.350) (-1.471) Lnsegments 0.171 -0.081 -0.105** 0.094 (1.505) (-1.269) (-2.360) (1.097) Exgrowth -0.469*** 0.069 -0.245*** -0.175 (-2.865) (0.846) (-3.770) (-0.977) Lossproportion -0.711*** 0.115 -0.531*** 0.693 (-2.683) (0.807) (-3.258) (1.069) Restructuring -0.609 -2.763*** -5.994*** 7.538 (-0.515) (-3.313) (-2.587) (0.930) Size -0.919*** -0.444*** -0.252*** -0.383*** (-6.199) (-5.517) (-5.446) (-3.363) BigN -0.498** 0.299** 0.041 -0.646** (-2.265) (2.401) (0.202) (-2.498) Lev 2.256*** 0.750*** -0.121 0.253 (4.803) (5.730) (-0.413) (0.524) ROA -0.846 0.626** 1.186** 1.491 (-1.366) (2.484) (2.126) (1.578) Profitrank -0.007** 0.001 -0.001 -0.003 (-2.451) (0.822) (-0.831) (-1.469) Salesrank 0.001 0.000 -0.003 -0.004 (0.242) (0.055) (-1.577) (-0.949) DE -0.212 -0.326** 0.023 -0.048 (-1.213) (-2.377) (0.307) (-0.232) Pfirmsinregion 22.747** 5.118 -0.856 1.151 (2.368) (0.946) (-0.194) (0.149) Psalesinregion -7.878 -3.585 -2.035 -5.502 (-1.380) (-1.243) (-0.792) (-1.110) Localmktshare 0.140 0.953* -0.442** -0.247 (0.510) (1.823) (-2.504) (-0.495) Lnturnover 0.554*** 0.025 0.067 -0.229 (5.503) (0.329) (1.040) (-1.474) Equitycomp -0.473 0.280 0.650*** 1.547*** (-0.974) (0.435) (4.065) (2.666) Test of CC Differences (1) vs. (2)
(2) vs. (3) (3) vs. (4) (2) vs. (4)
Difference 0.325*** 0.386** -0.169 0.217 χ² (12.35) (3.98) (0.09) (2.43)

52
Table 9, Continued MissingEquitycomp Yes Yes Yes Yes Year & Industry FE Yes Yes Yes Yes Observations 2,636 2,634 2,635 2,637 Adjusted R2 0.627 0.568 0.400 0.660 This table presents results of weighted least squares regressions of TobinsQ on an indicator variable for whether the firm is a controlled company and control variables in separate subsamples based on dependent sorts of market capitalization and institutional ownership. Column 1 reports results for firms with below median market capitalization and institutional ownership. Columns 2 report results for firms with below median market capitalization and above median institutional ownership and Column 3 reports results for firms with above median market capitalization and below median institutional ownership. Column 4 reports results for firms with above median market capitalization and institutional ownership. t-statistics and χ²-statistics are shown in parentheses. To test coefficient equality for CC across columns, we estimate the regressions simultaneously. Standard errors are clustered by firm. ***, **, and * indicate statistical significance at p < 0.01, p < 0.05, and p < 0.10, respectively. All variables are defined in Appendix A.