Embed Size (px)
Citation preview
1
07S-30
Stapp Car Crash Journal, Vol. 51 (October 2007), pp. Copyright © 2007 The Stapp Association
Region-Specific Tolerance Criteria for the Living Brain
Benjamin S. Elkin and Barclay Morrison III Department of Biomedical Engineering, Columbia University, New York
__________________________________
ABSTRACT – Computational models of traumatic brain injury (TBI) can predict injury-induced brain deformation. However, predicting the biological consequences (i.e. cell death or dysfunction) of induced brain deformation requires tolerance criteria. Here, we present a tolerance criterion for the cortex which exhibits important differences from that of the hippocampus. Organotypic slice cultures of the rat cortex, which maintain tissue architecture and cell content consistent with that in vivo, were mechanically injured with an in vitro model described previously. Cultures were stretched equibiaxially up to 0.35 Lagrangian strain at strain rates up to 50 s-1. Cell death was quantified at 1, 2, 3, and 4 days following injury. Statistical analysis (repeated measures ANOVA) showed that all three factors (Strain, Strain Rate, and Time post-injury) significantly affected cell death. An equation describing cell death as a function of the significant parameters was then fit to the data. Compared to the hippocampus, the cortex was less vulnerable to stretch-induced injury and demonstrated a strain threshold below 0.20. Strain rate was also a significant factor for cortical but not hippocampal cell death. Cortical cell death began at an earlier time point than in the hippocampus, with cell death evident at 1 day post-injury versus 3 days in the hippocampus. In conclusion, different regions of the brain respond differently to identical mechanical stimuli, and this difference should be incorporated into finite element models of TBI if they are to more accurately predict in vivo consequences of TBI. KEYWORDS – Traumatic brain injury (TBI), tolerance criteria, in vitro injury, organotypic slice culture, cortex, rat
__________________________________
INTRODUCTION
Traumatic brain injury (TBI) remains one of the leading causes of death and disability worldwide (Murray et al., 1996). Of the 1.4 million people who sustain a TBI each year in the United States, 50,000 die and 235,000 are hospitalized (Langlois et al., 2006). Despite the development of superior safety systems and improved vehicular crash worthiness, motor vehicle accidents remain one of the major causes of TBI in the United States, second only to falls (Rutland-Brown et al., 2006). This motivates our study of the biomechanics of brain injury to reduce the societal cost of TBI through a better understanding of the mechanical events that lead to injury.
Finite element (FE) models of injury continue to represent a viable tool for improving our understanding of the mechanical events occurring within the traumatically injured brain during the injury event (Kleiven et al., 2002; Levchakov et al., 2006; Mao et al., 2006; Takhounts et al., 2003; Zhang
et al., 2001b; Zhang et al., 2001a). The utility of these models in predicting physiologic outcomes of simulations relies on tolerance criteria capable of describing the response of each part of the brain to the mechanical parameters reported from the simulation.
One method to develop tissue-level tolerance criteria is to correlate FE model outputs to patterns of injury produced in experimental animal models of TBI, cadaver impact studies, or post-mortem material from human cases (Bain et al., 2000; Doorly et al., 2006; Franklyn et al., 2005; Hardy et al., 1994; Mao et al., 2006; Miller et al., 1999; Shreiber et al., 1999a; Willinger et al., 1999; Zhang et al., 2004). The outcomes predicted by these tolerance criteria include diffuse axonal injury (DAI), electrophysiologic dysfunction, neurite and axonal retraction, and cell death. The studies suggested that different variables, such as maximum principal strain, maximum shear strain, shear stress, and pressure, were capable of predicting injurious outcomes. Further studies of CNS injury have focused on maximum principal strain as a strong indicator of injury, predicting thresholds at or below 0.20 Lagrangian strain (Bain et al., 2000; Margulies et al., 1990; Margulies et al., 1992; Singh et al., 2006). Tolerance criteria have
Address correspondence to Barclay Morrison III 351 Engineering Terrace, 1210 Amsterdam Ave., New York, NY. Electronic mail: [email protected]
2 Elkin and Morrison III / Stapp Car Crash Journal 51 (October 2007)
also been defined with the viscous criterion, the product of the magnitude and rate of tissue deformation, for tissues such as the spinal cord (Kearney et al., 1988; Viano and Lau, 1988). In a previous study we found that stretch injury to the hippocampus was not rate dependent (Cater et al., 2006). Because brain is a viscoelastic tissue however (Brands et al., 2000; Nicolle et al., 2005; Prange et al., 2002), tolerance criteria for the cortex may depend on the rate of deformation, or strain rate, in addition to strain.
In the present study, our well-characterized, in vitro model of TBI (Cater et al., 2006; Cater et al., 2007; Morrison, III et al., 2003; Morrison, III et al., 2006) was used to directly evaluate the temporal development of cell death following stretch injury in the cortex. Our model is advantageous because it allows unfettered access to living tissues for repeated measurements in the same specimen over time while maintaining in vivo like tissue architecture. Slices are reproducibly injured with precisely defined mechanical stimuli (strain and strain rate) within ranges relevant to TBI. Using this model, cell death tolerance criteria for the most vulnerable brain region, the hippocampus, have been developed (Cater et al., 2006; Morrison, III et al., 2003). Herein, a tolerance criterion for the cortex is determined and compared to the hippocampus criteria. We hypothesize that different brain regions respond differently to mechanical stimuli and thus require a different tolerance criterion to describe their response to stretch injury. To test this hypothesis, we subjected organotypic slice cultures of the rat cerebral cortex to a wide range of mechanical stimuli (combinations of strain and strain rates) relevant to TBI and correlated the induced cell death to the mechanical injury parameters.
METHODS
Organotypic Slice Cultures
In brief, 8-10 day old Sprague-Dawley rats were decapitated and their brains removed†. Each cerebral hemisphere was removed maintaining the hippocampus in place. With the hippocampus face up, a strip of the cerebral cortex directly above the hippocampus was excised. The cortex was sectioned using a McIlwain tissue chopper (400 µm thickness, Harvard Apparatus, Holliston, MA). Slices were separated in ice-cold Geys salt solution supplemented
† All animal welfare guidelines were strictly adhered to and all procedures were approved by the Columbia University Institutional Animal Care and Use Committee (IACUC)
with 4.5 mg/mL D-glucose (Sigma, St. Louis, MO) using sterile blunt plastic spatulas. Slices were then plated on silicone membranes (Specialty Manufacturing, Saginaw, MI) coated with laminin and poly-D-lysine, bathed in Neurobasal medium (Invitrogen; supplemented with 1 mM L-glutamine, B27, and 4.5 mg/mL D-glucose), and placed on a rocker in an incubator at 37°C. After four days, Neurobasal medium was replaced with full serum medium (Sigma; 50% MEM, 25% HBSS, 25% Heat Inactivated horse serum, 2 µM L-glutamine, 4.5mg/mL D-glucose). Slices were cultured for 10-14 days prior to injury with media replenishment every 2-3 days.
Nissl Staining
Acute and two week old tissue slices were rinsed in ice cold PBS and fixed for 1 h in 4% formaldehyde. Slices were then dehydrated in a series of increasing concentrations of ethanol to 100% and then xylene. Slices were mounted on slides, rehydrated, stained in 0.02% thionin, dehydrated, and coverslipped with permount (Sigma).
Excitotoxic Injury
After two weeks in vitro, media was removed from the slices and replaced with full serum medium containing 10 mM glutamate (Sigma). After 3 h incubation, media was replaced with full serum medium and slices were returned to the incubator. At 24 h following glutamate exposure, slices were analyzed for cell death.
Mechanical Injury Model
The injury device and loading mechanism have been described previously and characterized in detail (Cater et al., 2006; Morrison, III et al., 2003; Morrison, III et al., 2006). Briefly, after removing medium from the culture well, the cultured tissue was stretched equibiaxially by displacing the well and silicone substrate over a hollow cylindrical indenter. By controlling the speed and distance of the excursion, strain and strain rate were precisely controlled (Cater et al., 2006; Morrison, III et al., 2006). Strain histories followed a trapezoidal function: constant strain rate to a maximum strain followed by a return at a constant relaxation rate. Tissue deformation was verified with high speed video, and cultures that did not adhere to the substrate were removed from the analysis (Fig. 2). A minimum of 16 cultures were injured at each combination of strain and strain rate (total n = 320). While on the injury device, cultures were kept at 37ºC. Control cultures were clamped on the device which was not activated (n = 70).
Elkin and Morrison III / Stapp Car Crash Journal 51 (October 2007) 3
Quantification of Cell Death
The fluorescent dye propidium iodide (PI, Invitrogen), was used to measure cell death prior to and at 1, 2, 3, and 4 days following injury. Images were acquired at all time points using an Olympus IX71 microscope with rhodamine optics. All images were analyzed identically in MetaMorph (Molecular Devices, Downingtown, PA). Images were first corrected for non-specific background staining by applying a “gradient” filter followed by an “open” filter. The same threshold was then applied to all images, and cell death was quantified as the percent area of staining above the threshold within the slice (Fig. 3). Pre-injury staining was subtracted from subsequent cell death measures.
Statistical Analysis
Cell death was logarithmically transformed to preserve a normal distribution and homoscedasticity for statistical analysis. A two-way repeated measures ANOVA was then performed on the complete set of data with cell death as the repeated measure (SPSS Inc. IL, v. 14.0). Significance (p < 0.05) of individual factors was determined by Bonferroni post-hoc tests. A function capable of predicting cell death following injury was then fit to the cell death data using the fminunc.m function in MATLAB (MathWorks, Natick, MA). Based on the repeated measures ANOVA, both strain and strain rate were significant factors, and they were subsequently included in the functional form of the fit to the entire set of data along with time post injury.
kjiCortex TimeStrainRateStraincCellDeath •••= (1)
An equation was also fit to the cell death data at four days post-injury only.
jiCortex StrainRateStraincCellDeath ••= (2)
In equations (1) and (2), CellDeath is percent area staining for dead cells, Strain is dimensionless Lagrangian strain, StrainRate is in s-1, and Time is in days. c, i, j, and k are parameters to be fit to the data.
RESULTS
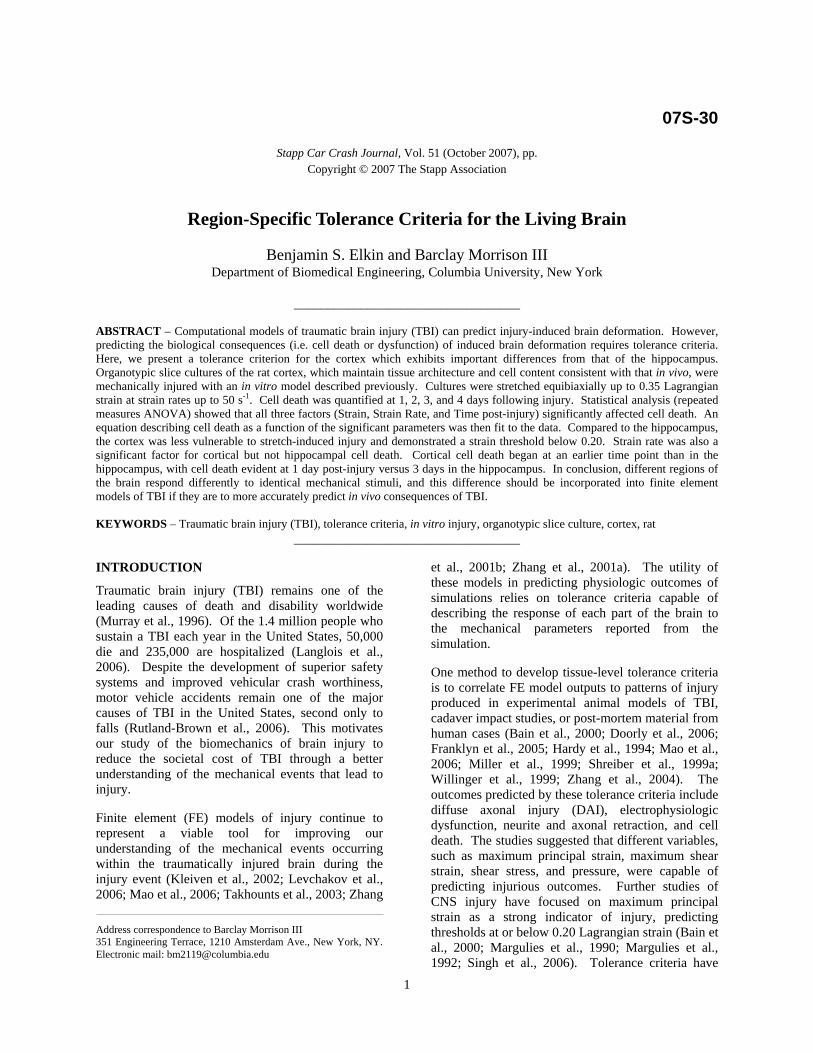
After two weeks in culture, slices remained viable and maintained in vivo-like morphology. Nissl staining revealed a neuronal organization similar to that of acutely dissected slices (Fig. 1). Cultured slices underwent some degree of spreading and thinning with a noticeable border of non-neuronal cells surrounding the slice. The bottom strip of tissue that poorly stained for Nissl in the acute slice is
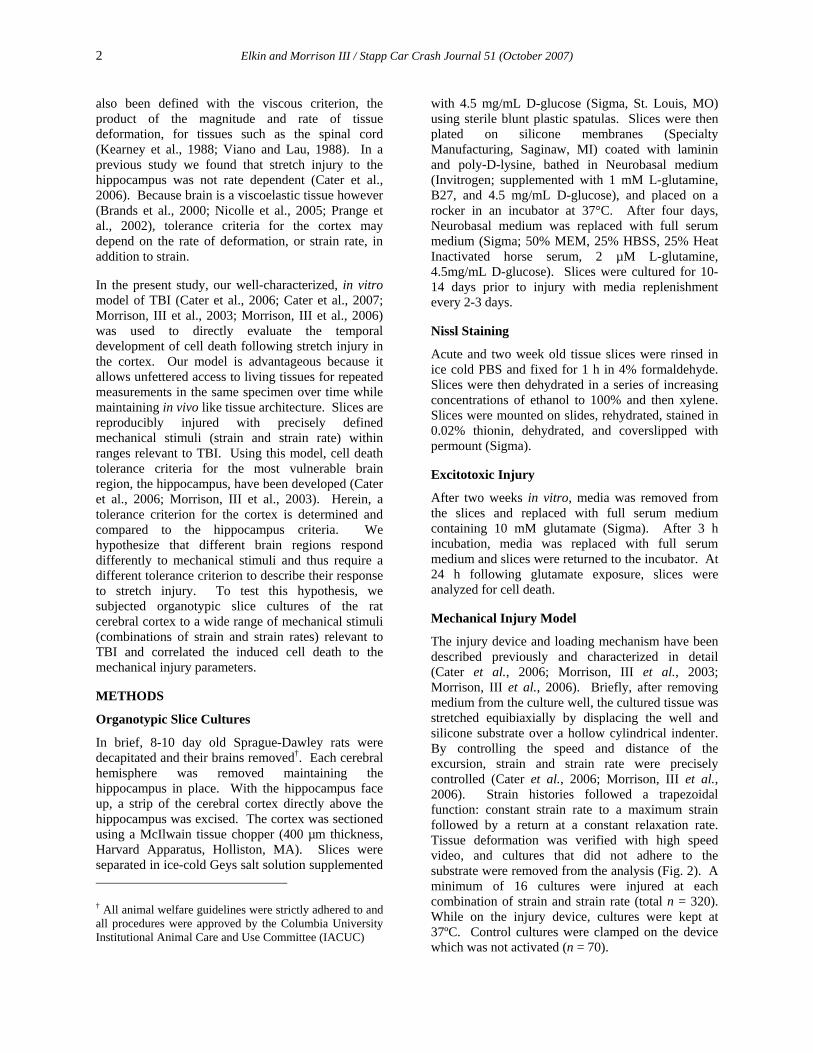
present in the cultured slice as well but is less apparent due to spreading of the tissue (more apparent in brightfield transmission images; Fig. 4). This region was excluded during identification of the slice border because of its lack of neuronal cell bodies as well as its irregular and difficult to identify shape. A 3 h incubation with 10 mM glutamate produced intense staining for dead cells at 24 h following exposure (Fig. 2). Cell death at 24 h (n = 10) was 67 ± 16% (mean ± SD).
Adhered cultures were mechanically stimulated by imposing an equibiaxial deformation on the underlying substrate at all combinations of Lagrangian strain (0.10, 0.20, 0.35) and strain rate
FIGURE 1. Brightfield transmission images of acute (A) and cultured (B) slices of the cortex Nissl stained for visualization of neuronal cell bodies. Slice cultures were cut at a thickness of 400 µm and maintained an in vivo-like neuronal organization that was still evident after 14 days in vitro.
FIGURE 2. Organotypic slice culture of rat cortex 24 h after exposure to 10 mM glutamate. (A) Fluorescent image of slice stained with PI and (B) binary image after analysis in MetaMorph.
4 Elkin and Morrison III / Stapp Car Crash Journal 51 (October 2007)
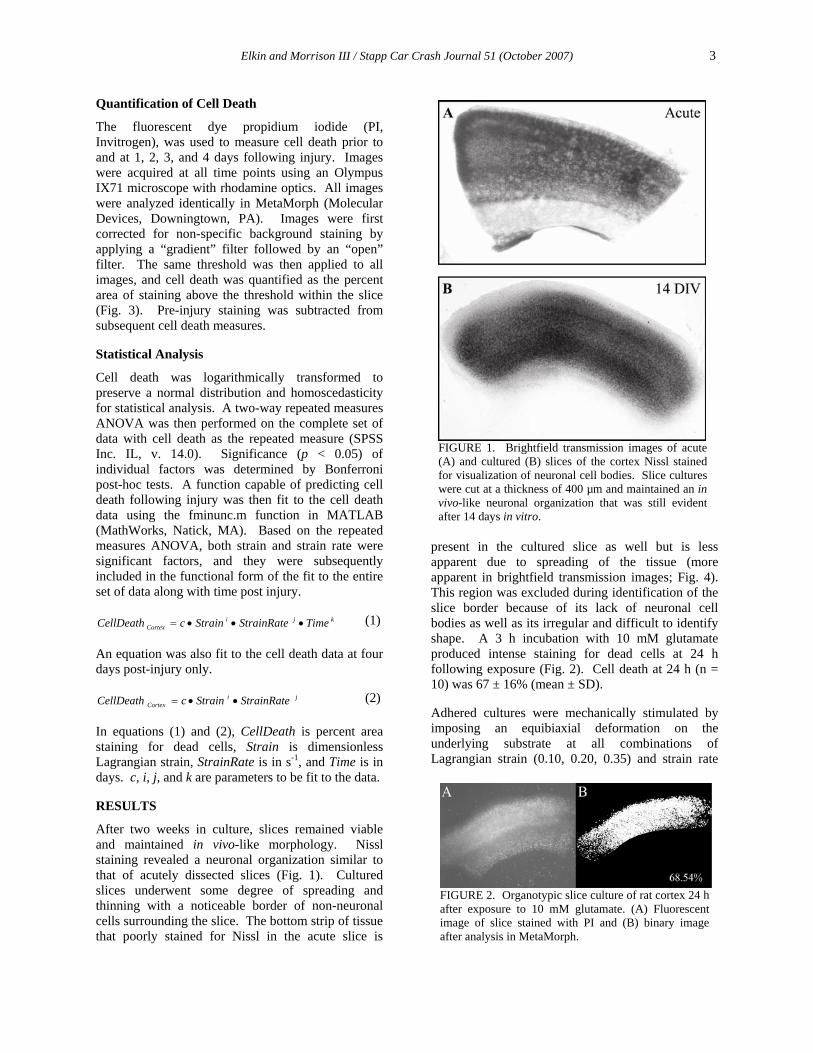
(0.1, 1, 10, 20, 50 s-1). Culture deformation was verified by comparing images captured from high speed video of the injury at maximum stretch with an image of the culture at rest. Fig. 3A and B illustrate the 0.20 Lagrangian strain equibiaxial deformation of a culture. The area of the culture increased by ~44%, consistent with the desired applied strain. A random sample of videos (n = 5) was analyzed for each strain group and showed good correlation with the desired strain (Fig. 3B).
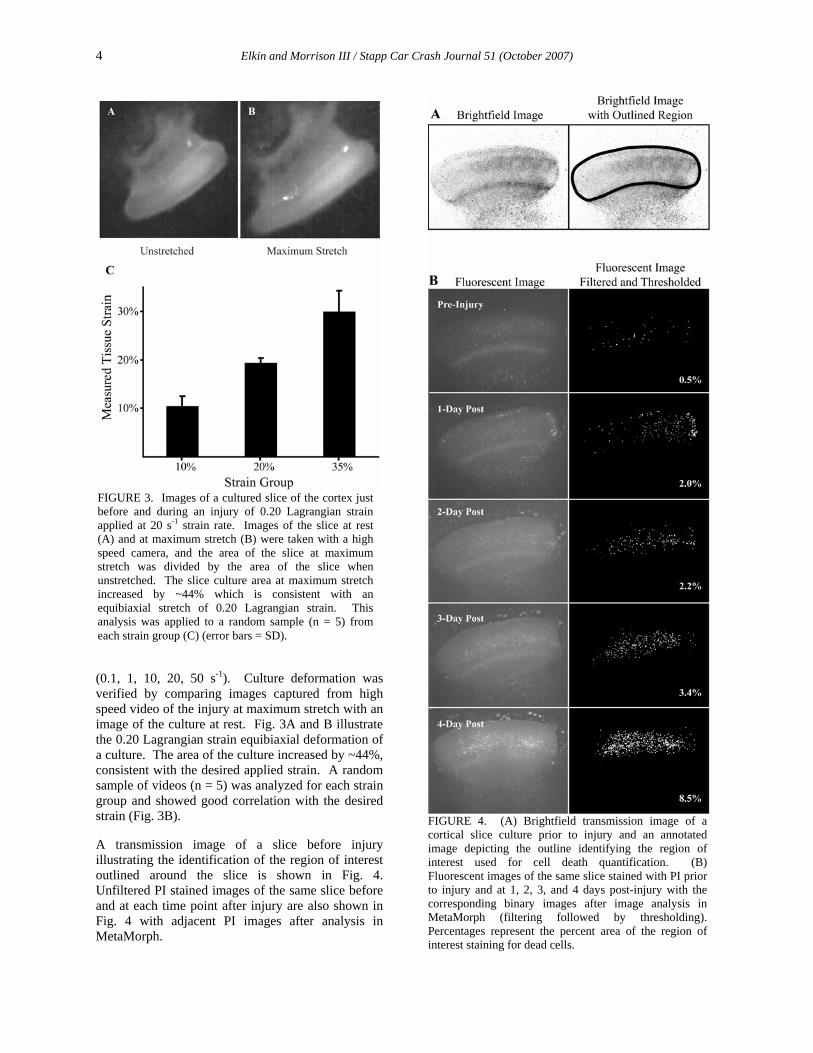
A transmission image of a slice before injury illustrating the identification of the region of interest outlined around the slice is shown in Fig. 4. Unfiltered PI stained images of the same slice before and at each time point after injury are also shown in Fig. 4 with adjacent PI images after analysis in MetaMorph.
FIGURE 4. (A) Brightfield transmission image of a cortical slice culture prior to injury and an annotated image depicting the outline identifying the region of interest used for cell death quantification. (B) Fluorescent images of the same slice stained with PI prior to injury and at 1, 2, 3, and 4 days post-injury with the corresponding binary images after image analysis in MetaMorph (filtering followed by thresholding). Percentages represent the percent area of the region of interest staining for dead cells.
FIGURE 3. Images of a cultured slice of the cortex just before and during an injury of 0.20 Lagrangian strain applied at 20 s-1 strain rate. Images of the slice at rest (A) and at maximum stretch (B) were taken with a high speed camera, and the area of the slice at maximum stretch was divided by the area of the slice when unstretched. The slice culture area at maximum stretch increased by ~44% which is consistent with an equibiaxial stretch of 0.20 Lagrangian strain. This analysis was applied to a random sample (n = 5) from each strain group (C) (error bars = SD).
Elkin and Morrison III / Stapp Car Crash Journal 51 (October 2007) 5
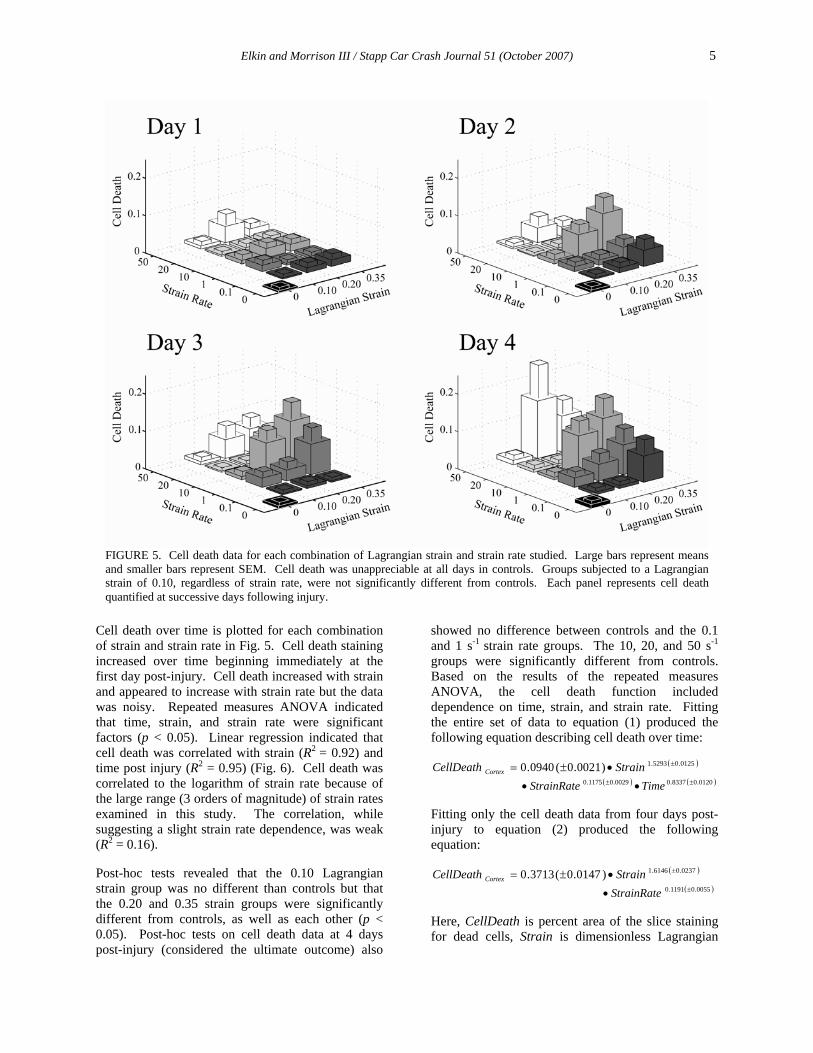
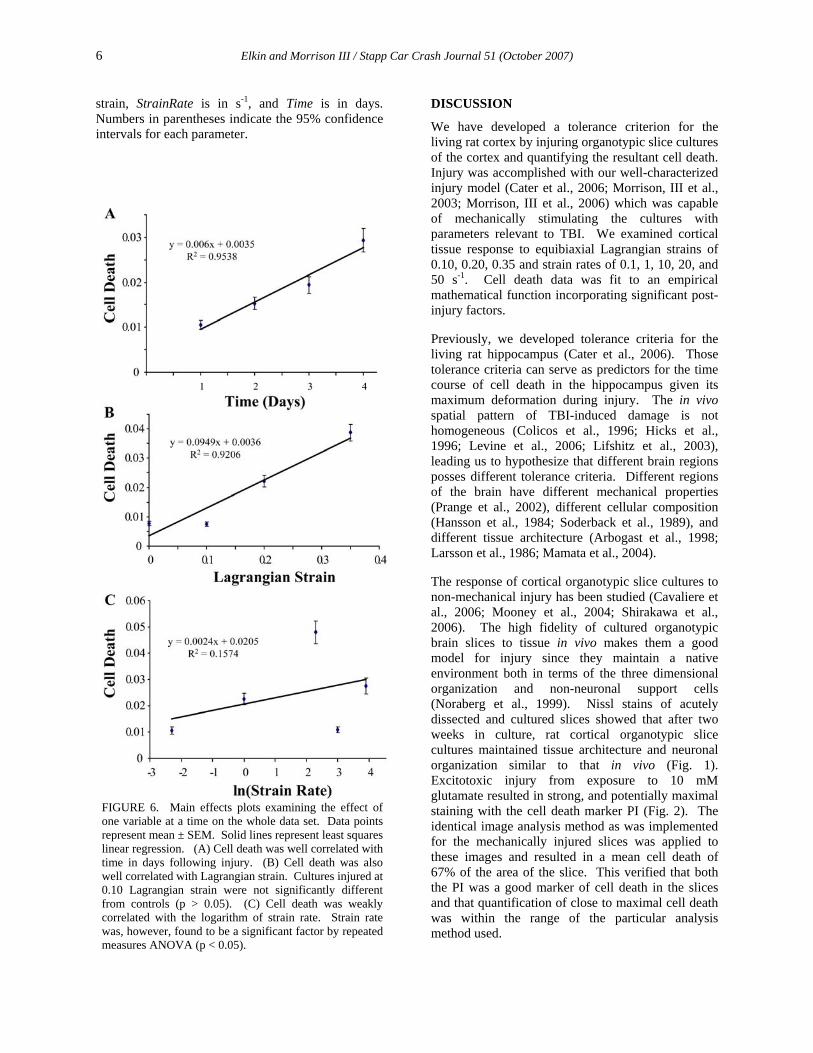
Cell death over time is plotted for each combination of strain and strain rate in Fig. 5. Cell death staining increased over time beginning immediately at the first day post-injury. Cell death increased with strain and appeared to increase with strain rate but the data was noisy. Repeated measures ANOVA indicated that time, strain, and strain rate were significant factors (p < 0.05). Linear regression indicated that cell death was correlated with strain (R2 = 0.92) and time post injury (R2 = 0.95) (Fig. 6). Cell death was correlated to the logarithm of strain rate because of the large range (3 orders of magnitude) of strain rates examined in this study. The correlation, while suggesting a slight strain rate dependence, was weak (R2 = 0.16).
Post-hoc tests revealed that the 0.10 Lagrangian strain group was no different than controls but that the 0.20 and 0.35 strain groups were significantly different from controls, as well as each other (p < 0.05). Post-hoc tests on cell death data at 4 days post-injury (considered the ultimate outcome) also
showed no difference between controls and the 0.1 and 1 s-1 strain rate groups. The 10, 20, and 50 s-1 groups were significantly different from controls. Based on the results of the repeated measures ANOVA, the cell death function included dependence on time, strain, and strain rate. Fitting the entire set of data to equation (1) produced the following equation describing cell death over time:
( )0125.05293.1)0021.0(0940.0 ±•±= StrainCellDeath Cortex
( ) ( )0120.08337.00029.01175.0 ±± •• TimeStrainRate
Fitting only the cell death data from four days post-injury to equation (2) produced the following equation:
( )0237.06146.1)0147.0(3713.0 ±•±= StrainCellDeath Cortex
( )0055.01191.0 ±• StrainRate
Here, CellDeath is percent area of the slice staining for dead cells, Strain is dimensionless Lagrangian
FIGURE 5. Cell death data for each combination of Lagrangian strain and strain rate studied. Large bars represent means and smaller bars represent SEM. Cell death was unappreciable at all days in controls. Groups subjected to a Lagrangian strain of 0.10, regardless of strain rate, were not significantly different from controls. Each panel represents cell death quantified at successive days following injury.
6 Elkin and Morrison III / Stapp Car Crash Journal 51 (October 2007)
strain, StrainRate is in s-1, and Time is in days. Numbers in parentheses indicate the 95% confidence intervals for each parameter.
DISCUSSION
We have developed a tolerance criterion for the living rat cortex by injuring organotypic slice cultures of the cortex and quantifying the resultant cell death. Injury was accomplished with our well-characterized injury model (Cater et al., 2006; Morrison, III et al., 2003; Morrison, III et al., 2006) which was capable of mechanically stimulating the cultures with parameters relevant to TBI. We examined cortical tissue response to equibiaxial Lagrangian strains of 0.10, 0.20, 0.35 and strain rates of 0.1, 1, 10, 20, and 50 s-1. Cell death data was fit to an empirical mathematical function incorporating significant post-injury factors.
Previously, we developed tolerance criteria for the living rat hippocampus (Cater et al., 2006). Those tolerance criteria can serve as predictors for the time course of cell death in the hippocampus given its maximum deformation during injury. The in vivo spatial pattern of TBI-induced damage is not homogeneous (Colicos et al., 1996; Hicks et al., 1996; Levine et al., 2006; Lifshitz et al., 2003), leading us to hypothesize that different brain regions posses different tolerance criteria. Different regions of the brain have different mechanical properties (Prange et al., 2002), different cellular composition (Hansson et al., 1984; Soderback et al., 1989), and different tissue architecture (Arbogast et al., 1998; Larsson et al., 1986; Mamata et al., 2004).
The response of cortical organotypic slice cultures to non-mechanical injury has been studied (Cavaliere et al., 2006; Mooney et al., 2004; Shirakawa et al., 2006). The high fidelity of cultured organotypic brain slices to tissue in vivo makes them a good model for injury since they maintain a native environment both in terms of the three dimensional organization and non-neuronal support cells (Noraberg et al., 1999). Nissl stains of acutely dissected and cultured slices showed that after two weeks in culture, rat cortical organotypic slice cultures maintained tissue architecture and neuronal organization similar to that in vivo (Fig. 1). Excitotoxic injury from exposure to 10 mM glutamate resulted in strong, and potentially maximal staining with the cell death marker PI (Fig. 2). The identical image analysis method as was implemented for the mechanically injured slices was applied to these images and resulted in a mean cell death of 67% of the area of the slice. This verified that both the PI was a good marker of cell death in the slices and that quantification of close to maximal cell death was within the range of the particular analysis method used.
FIGURE 6. Main effects plots examining the effect of one variable at a time on the whole data set. Data points represent mean ± SEM. Solid lines represent least squares linear regression. (A) Cell death was well correlated with time in days following injury. (B) Cell death was also well correlated with Lagrangian strain. Cultures injured at 0.10 Lagrangian strain were not significantly different from controls (p > 0.05). (C) Cell death was weakly correlated with the logarithm of strain rate. Strain rate was, however, found to be a significant factor by repeated measures ANOVA (p < 0.05).
Elkin and Morrison III / Stapp Car Crash Journal 51 (October 2007) 7
In the present study, cultures were injured by equibiaxial stretch of the underlying substrate to which they were adhered. This paradigm has been shown to result in a uniform biaxial strain field in the plane of the membrane irrespective of location or orientation on the membrane (Morrison, III et al., 2006). It has been previously estimated that ~70% of the tissue slice volume will experience >90% of the
applied substrate strain (Morrison, III et al., 2003). The injury device is capable of precisely controlling the strain history, specifically the maximum Lagrangian strain and strain rate. Both can be controlled over large ranges relevant to TBI (0.01 < strain < 1.00 and 0.1 < strain rate < 150 s-1). A potential limitation is if the tissue is not well adhered to the substrate, but high-speed video was analyzed to
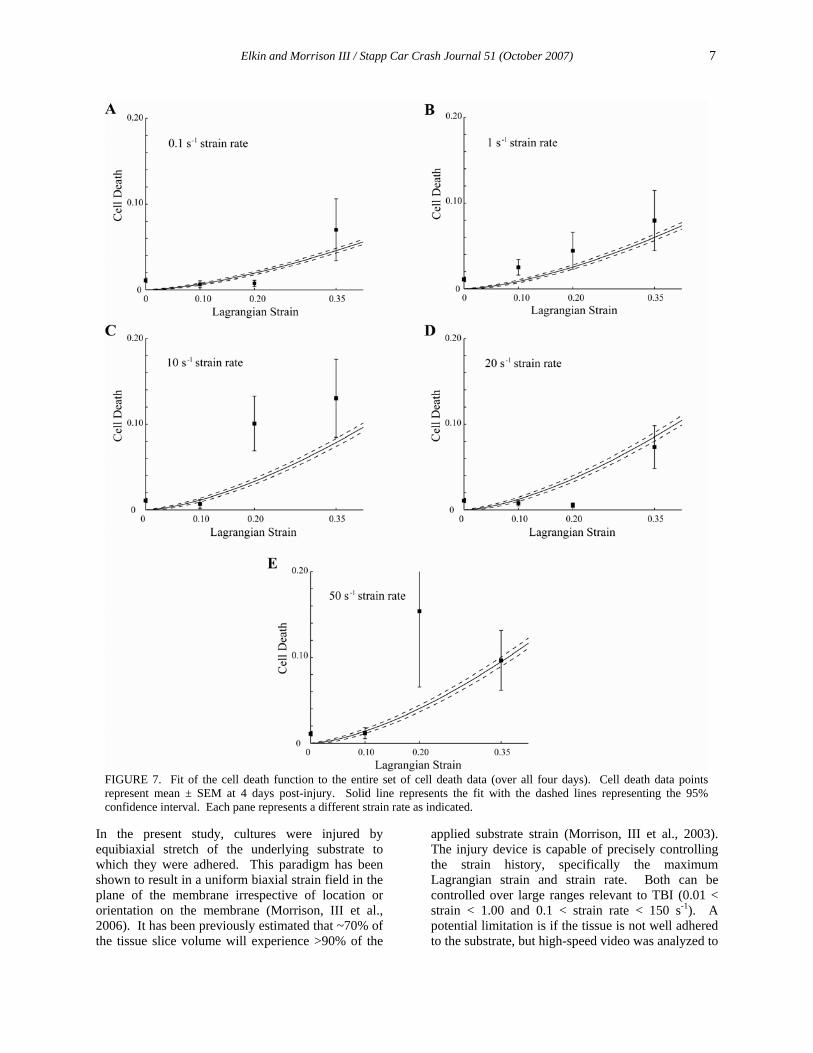
FIGURE 7. Fit of the cell death function to the entire set of cell death data (over all four days). Cell death data points represent mean ± SEM at 4 days post-injury. Solid line represents the fit with the dashed lines representing the 95% confidence interval. Each pane represents a different strain rate as indicated.
8 Elkin and Morrison III / Stapp Car Crash Journal 51 (October 2007)
verify the applied strain (Fig. 3), and samples that slipped were removed from the study.
Average cell death remained below 20% for all groups of injured slices which suggests that the cortical slices are quite robust to mechanical injury for strains at or below 0.35. The complete set of cell death data over time plotted in Fig. 5 revealed some apparent trends in the data which were further investigated.
Analysis of the main effects illustrated that cell death begins to increase at 1 day following injury with an almost linear increase over time post-injury (Fig. 6A). Cell death also correlated well with strain, but interestingly, a threshold existed between strains of 0.10 and 0.20 (Fig. 6B). Post-hoc tests showed that groups injured at 0.10 were not significantly different from controls suggesting that 0.10 Lagrangian strain is not sufficient to injure the cortex. In contrast, the groups injured at 0.20 and 0.35 Lagrangian strain were significantly different from controls and the 0.10 group. The last trend observed was the weak but significant correlation of cell death with the logarithm of strain rate (Fig. 6C). Post-hoc tests confirmed a statistically significant difference between groups injured at 10 and 50 s-1 as compared to the 0.1, 1, and 20 s-1 groups (p < 0.05).
As a result of this analysis, the cell death function (1) incorporated all variables (time, strain, and strain rate) and reasonably fit the data over all experimental strain rates (Fig. 7). Fitting four-day cell death data to equation (2) showed good agreement with equation (1) which also described the temporal progression of cell death over all days. For those less-interested in the temporal progression of cortical cell death, equation (2) is sufficient for predicting outcome at four days. The functional form of the cell death equations were arbitrarily chosen and make no assumptions about the tissue response. While the cell death equations reasonably fit the data, extrapolation to strains above 0.35 should only be done with caution. Additional functional forms, perhaps those that take into account the threshold at 0.10 strain, could more accurately fit the data and are worth exploring in the future.
The resulting cell death function for the cortex differs in several aspects from those we developed for the hippocampus (Cater et al., 2006). Most striking is the magnitude of cell death. Cortical cell death was rarely above 15% at 4 days post-injury whereas the hippocampal cell death could reach up to 50% at strains of 0.35 and 0.50. Our results indicate that the cortex is much less vulnerable to stretch injury than
the hippocampus which is supported by the heterogeneous pattern of cell death observed in vivo (Colicos et al., 1996; Lifshitz et al., 2003; Shreiber et al., 1999; Tran et al., 2006).
Cortical cell death, while much less pronounced than hippocampal cell death, is initiated immediately following injury and progresses linearly with time thereafter (Fig. 6A). The hippocampus, on the other hand, did not demonstrate significant cell death until day 3 following injury. This suggests that different biological mechanisms of injury may be responsible for the resultant cell death in cortical vs. hippocampal regions (DeRidder et al., 2006; Pike et al., 2000).
Induced cortical cell death was dependent on strain rate whereas hippocampal cell death was independent of strain rate. It was surprising that hippocampal cell death was not strain rate dependent since brain is a viscoelastic tissue (Brands et al., 2000; Nicolle et al., 2005; Prange et al., 2002) and the induced stress is affected by the applied strain rate. Previous studies have identified a correlation of functional and short term injury with strain rate (Geddes et al., 2003a; LaPlaca et al., 1997; Singh et al., 2006a) but none have measured long-term cell death. In the hippocampus study, it was suggested that the long-term response may have been independent of strain rate, but in the present study, we show that even long-term outcomes can be affected by the applied strain rate. One possible explanation could be the increased stiffness of the cortex as compared to the hippocampus (Coats et al., 2005; Elkin et al., 2007) especially during high rate deformations (Lu et al., 2006). The increased stiffness of the cortex at higher deformation rates may induce higher tissue stresses resulting in direct injury of cortical cells or activation of different cell death pathways compared to the hippocampus.
Examination of the dependence on strain magnitude (Fig. 6B) indicates that a threshold for injury exists between 0.10 and 0.20 strains. Below this threshold (i.e. at 0.10 strain), the cortex is not significantly injured. Previous studies have identified thresholds of injury but have not performed systematic analysis at different strain rates (Bain et al., 2000; Margulies et al., 1990; Margulies et al., 1992; Shreiber et al., 1999). Here, even at strain rates of 20 and 50 s-1, the cortex was unaffected by a strain of 0.10. The hippocampus, however, did not produce a definitive threshold below which cell death was not significantly different than controls. Even at 0.05 strain, the hippocampus appeared vulnerable to stretch injury, further substantiating that the
Elkin and Morrison III / Stapp Car Crash Journal 51 (October 2007) 9
hippocampus is much more vulnerable to stretch injury than the cortex.
The differences observed may have a number of explanations. One could be that different cells of the cortex and hippocampus have different intrinsic tolerance criteria. Different types of neurons respond differently to specific, non-mechanical, injury mechanisms (Haas et al., 2004; Zhao et al., 2000). These differences may extend to mechanical injury as shown in dissociated neuronal cultures (Geddes et al., 2003b) where the authors suggested that an explanation for the increased susceptibility of hippocampal vs. cortical neurons could be the increased density of NMDA receptors in the hippocampus as compared to the cortex (Monaghan et al., 1985). The tissue architecture also differs between the cortex and the hippocampus. The laminar organization of neurons in the hippocampus is quite different from the columnar organization in the cortex and could result in different loading conditions at the single-cell level that may, in part, explain the strain rate dependence of the cortex. LaPlaca et al. have shown that cell death in a construct may be correlated with fiber strain which is dictated by the local orientation of neurites with respect to the global strain field (Cullen et al., 2006; LaPlaca et al., 2005). Finally the presence of different support cells between the two regions may leave the hippocampus more vulnerable to injury than the cortex. In the hippocampus, pyramidal neurons are likely to be the principle cells that die following stretch injury given the concentration of PI staining within the pyramidal cell layers (Cater et al., 2006; Morrison, III et al., 2003; Morrison, III et al., 2006). It is less clear however which cells are dying and when they are dying in the cortex following injury. This is a topic that will require further examination and may shed light on tissue-specific mechanisms of injury.
One limitation of this study is whether these results can be applied to human FE models or if they are specific to the rat. A direct comparison of cultured human tissue to our results would directly answer this question. Another limitation is that our model of injury employs an equibiaxial stretch while some investigators have postulated that shear strain is a better indicator of cell death and more representative of in vivo tissue behavior during an injury event. Our model however does recapitulate the complex in vivo 3-D state of stretch, compression, and shear strain if one assumes that brain is incompressible (Darvish et al., 2001; Lippert et al., 2004). The in-plane equibiaxial stretch is prescribed, but the 3-D tissue culture experiences compression in the third direction
and shear along other axes. In addition, cell death has not yet been examined with this injury model at any time point after 4 days post-injury. Future studies will focus on whether measures at 4 days post-injury represent ultimate cell death. Finally, our model does not incorporate systemic factors which may contribute to the cellular response to injury. Our simplified system however allows us to measure the tissue’s intrinsic injury response while providing unfettered access for repeated measures, as well as the option to incorporate systemic factors in a controlled manner to assess their individual effect.
CONCLUSION
We have quantitatively assessed the cortical cellular response to precisely defined mechanical injury parameters using our well-characterized in vitro injury model. The cortex response differs significantly from the hippocampus response substantiating our hypothesis that different brain regions respond differently to identical mechanical stimuli. These region-specific tolerance criteria will serve to better predict physiologic outcomes from computational FE simulations of TBI. Specifically, we have found that the cortex is overall much less vulnerable to injury than the hippocampus with a threshold for injury above 10% and below 20% Lagrangian strain. We also found that strain rate is a significant factor for predicting cortical cell death. Our findings have been incorporated into a cortex cell death function which may be capable of predicting injury severity based on biomechanical output from injury FE models.
ACKNOWLEDGMENTS
The authors would like to thank Shamik Chaudhuri for help with preparing figures and Chris Wiggins for help with fitting the tolerance criterion. Funding for this research was provided by the Southern Consortium for Injury Biomechanics (SCIB).
REFERENCES
Arbogast,K.B. and Margulies,S.S. (1998) Material characterization of the brainstem from oscillatory shear tests. Journal of Biomechanics 31(9): 801-807.
Bain,A.C. and Meaney,D.F. (2000) Tissue-level thresholds for axonal damage in an experimental model of central nervous system white matter injury. Journal of Biomechanical Engineering-Transactions of the Asme 122(6): 615-622.
10 Elkin and Morrison III / Stapp Car Crash Journal 51 (October 2007)
Brands,D.W.A., Bovendeerd,P.H.M., Peters,G.W.M., and Wismans,J.S.H.M. (2000) The large strain dynamic behaviour of in-vitro porcine brain tissue and a silicone gel model material. Stapp Car Crash J. 44: 249-260.
Cater,H.L., Gitterman,D., Davis,S.M., Benham,C.D., Morrison,B., III, and Sundstrom,L.E. (2007) Stretch-induced injury in organotypic hippocampal slice cultures reproduces in vivo post-traumatic neurodegeneration: role of glutamate receptors and voltage-dependent calcium channels. J.Neurochem. 101(2): 434-447.
Cater,H.L., Sundstrom,L.E., and Morrison,B., III (2006) Temporal development of hippocampal cell death is dependent on tissue strain but not strain rate. J.Biomech. 39(15): 2810-2818.
Cavaliere,F., Dinkel,K., and Reymann,K. (2006) The subventricular zone releases factors which can be protective in oxygen/glucose deprivation-induced cortical damage: an organotypic study. Exp.Neurol. 201(1): 66-74.
Coats,B. and Margulies,S.S. (2005) Material properties of porcine parietal cortex. J.Biomech. 23(8): 1222-1232.
Colicos,M.A., Dixon,C.E., and Dash,P.K. (1996) Delayed, selective neuronal death following experimental cortical impact injury in rats: Possible role in memory deficits. Brain Research 739(1-2): 111-119.
Cullen,D.K. and LaPlaca,M.C. (2006) Neuronal response to high rate shear deformation depends on heterogeneity of the local strain field. J.Neurotrauma 23(9): 1304-1319.
Darvish,K.K. and Crandall,J.R. (2001) Nonlinear viscoelastic effects in oscillatory shear deformation of brain tissue. Med.Eng Phys. 23(9): 633-645.
DeRidder,M.N., Simon,M.J., Siman,R., Auberson,Y.P., Raghupathi,R., and Meaney,D.F. (2006) Traumatic mechanical injury to the hippocampus in vitro causes regional caspase-3 and calpain activation that is influenced by NMDA receptor subunit composition. Neurobiol.Dis. 22(1): 165-176.
Doorly,M.C. and Gilchrist,M.D. (2006) The use of accident reconstruction for the analysis of traumatic brain injury due to head impacts arising
from falls. Comput.Methods Biomech.Biomed.Engin. 9(6): 371-377.
Elkin,B.S., Azeloglu,E.U., Costa,K.D., and Morrison,I.B. (2007) Mechanical heterogeneity of the rat hippocampus measured by atomic force microscope indentation. J.Neurotrauma 24(5): 812-822.
Franklyn,M., Fildes,B., Zhang,L., Yang,K., and Sparke,L. (2005) Analysis of finite element models for head injury investigation: reconstruction of four real-world impacts. Stapp Car Crash J. 49 1-32.
Geddes,D.M., Cargill,R.S., and LaPlaca,M.C. (2003a) Mechanical stretch to neurons results in a strain rate and magnitude-dependent increase in plasma membrane permeability. J.Neurotrauma 20(10): 1039-1049.
Geddes,D.M., LaPlaca,M.C., and Cargill,R.S. (2003b) Susceptibility of hippocampal neurons to mechanically induced injury. Exp.Neurol. 184(1): 420-427.
Haas,M.A., Vickers,J.C., and Dickson,T.C. (2004) Binding partners L1 cell adhesion molecule and the ezrin-radixin-moesin (ERM) proteins are involved in development and the regenerative response to injury of hippocampal and cortical neurons. Eur.J.Neurosci. 20(6): 1436-1444.
Hansson,E., Ronnback,L., Persson,L.I., Lowenthal,A., Noppe,M., Alling,C., and Karlsson,B. (1984) Cellular composition of primary cultures from cerebral cortex, striatum, hippocampus, brainstem and cerebellum. Brain Res. 300(1): 9-18.
Hardy,W.N., Khalil,T.B., and King,A.I. (1994) Literature-Review of Head-Injury Biomechanics. International Journal of Impact Engineering 15(4): 561-586.
Hicks,R., Soares,H., Smith,D., and McIntosh,T. (1996) Temporal and spatial characterization of neuronal injury following lateral fluid-percussion brain injury in the rat. Acta Neuropathol.(Berl) 91(3): 236-246.
Kleiven,S. and Hardy,W.N. (2002) Correlation of an FE Model of the Human Head with Local Brain Motion--Consequences for Injury Prediction. Stapp Car Crash J. 46: 123-144.
Elkin and Morrison III / Stapp Car Crash Journal 51 (October 2007) 11
Langlois,J.A., Rutland-Brown,W., and Wald,M.M. (2006) The epidemiology and impact of traumatic brain injury: a brief overview. J.Head Trauma Rehabil. 21(5): 375-378.
LaPlaca,M.C., Cullen,D.K., McLoughlin,J.J., and Cargill,R.S. (2005) High rate shear strain of three-dimensional neural cell cultures: a new in vitro traumatic brain injury model. Journal of Biomechanics 38(5): 1093-1105.
LaPlaca,M.C., Lee,V.M., and Thibault,L.E. (1997) An in vitro model of traumatic neuronal injury: loading rate-dependent changes in acute cytosolic calcium and lactate dehydrogenase release. J.Neurotrauma 14(6): 355-368.
Larsson,E.M., Englund,E., Gyorffy-Wagner,Z., Brun,A., Cronqvist,S., and Persson,B. (1986) Regional differences in the proton magnetic resonance relaxation times T1 and T2 within the normal human brain. Acta Radiol.Diagn.(Stockh) 27(2): 231-234.
Levchakov,A., Linder-Ganz,E., Raghupathi,R., Margulies,S.S., and Gefen,A. (2006) Computational studies of strain exposures in neonate and mature rat brains during closed head impact. J.Neurotrauma 23(10): 1570-1580.
Levine,B., Fujiwara,E., O'Connor,C., Richard,N., Kovacevic,N., Mandic,M., Restagno,A., Easdon,C., Robertson,I.H., Graham,S.J., Cheung,G., Gao,F., Schwartz,M.L., and Black,S.E. (2006) In vivo characterization of traumatic brain injury neuropathology with structural and functional neuroimaging. J.Neurotrauma 23(10): 1396-1411.
Lifshitz,J., Friberg,H., Neumar,R.W., Raghupathi,R., Welsh,F.A., Janmey,P., Saatman,K.E., Wieloch,T., Grady,M.S., and McIntosh,T.K. (2003) Structural and functional damage sustained by mitochondria after traumatic brain injury in the rat: evidence for differentially sensitive populations in the cortex and hippocampus. J.Cereb.Blood Flow Metab 23(2): 219-231.
Lippert,S.A., Rang,E.M., and Grimm,M.J. (2004) The high frequency properties of brain tissue. Biorheology 41(6): 681-691.
Lu,Y.B., Franze,K., Seifert,G., Steinhauser,C., Kirchhoff,F., Wolburg,H., Guck,J., Janmey,P., Wei,E.Q., Kas,J., and Reichenbach,A. (2006)
Viscoelastic properties of individual glial cells and neurons in the CNS. Proc.Natl.Acad.Sci.U.S.A 103(47): 17759-17764.
Mamata,H., Jolesz,F.A., and Maier,S.E. (2004) Characterization of central nervous system structures by magnetic resonance diffusion anisotropy. Neurochem.Int. 45(4): 553-560.
Mao,H., Zhang,L., Yang,K.H., and King,A.I. (2006) Application of a finite element model of the brain to study traumatic brain injury mechanisms in the rat. Stapp Car Crash J. 50 583-600.
Margulies,S.S. and Thibault,L.E. (1992) A proposed tolerance criterion for diffuse axonal injury in man. J.Biomech. 25(8): 917-923.
Margulies,S.S., Thibault,L.E., and Gennarelli,T.A. (1990) Physical model simulations of brain injury in the primate. J.Biomech. 23(8): 823-836.
Miller,R.T., Smith,D.H., Chen,X., Xu,B.N., Leoni,M., Nonaka,M., and Meaney,D.F. (1999) Comparing exerimental data to traumatic brain injury finite element modes. Stapp Car Crash J. 43: 350-358.
Monaghan,D.T. and Cotman,C.W. (1985) Distribution of N-methyl-D-aspartate-sensitive L-[3H]glutamate-binding sites in rat brain. J.Neurosci. 5(11): 2909-2919.
Mooney,S.M., Siegenthaler,J.A., and Miller,M.W. (2004) Ethanol induces heterotopias in organotypic cultures of rat cerebral cortex. Cereb.Cortex 14(10): 1071-1080.
Morrison,B., III, Cater,H.L., Benham,C.D., and Sundstrom,L.E. (2006) An in vitro model of traumatic brain injury utilising two-dimensional stretch of organotypic hippocampal slice cultures. J.Neurosci.Methods 150(2): 192-201.
Morrison,B., III, Cater,H.L., Wang,C.C., Thomas,F.C., Hung,C.T., Ateshian,G.A., and Sundstrom,L.E. (2003) A tissue level tolerance criterion for living brain developed with an in vitro model of traumatic mechanical loading. Stapp Car Crash J. 47 93-105.
Murray,C.J. and Lopez,A.D. (1996) Evidence-based health policy--lessons from the Global Burden of Disease Study. Science 274(5288): 740-743.
12 Elkin and Morrison III / Stapp Car Crash Journal 51 (October 2007)
Nicolle,S., Lounis,M., Willinger,R., and Palierne,J.F. (2005) Shear linear behavior of brain tissue over a large frequency range. Biorheology 42(3): 209-223.
Noraberg,J., Kristensen,B.W., and Zimmer,J. (1999) Markers for neuronal degeneration in organotypic slice cultures. Brain Res.Brain Res.Protoc. 3(3): 278-290.
Pike,B.R., Zhao,X., Newcomb,J.K., Glenn,C.C., Anderson,D.K., and Hayes,R.L. (2000) Stretch injury causes calpain and caspase-3 activation and necrotic and apoptotic cell death in septo-hippocampal cell cultures. J.Neurotrauma 17(4): 283-298.
Prange,M.T. and Margulies,S.S. (2002) Regional, directional, and age-dependent properties of the brain undergoing large deformation. J.Biomech.Eng 124(2): 244-252.
Rutland-Brown,W., Langlois,J.A., Thomas,K.E., and Xi,Y.L. (2006) Incidence of traumatic brain injury in the United States, 2003. J.Head Trauma Rehabil. 21(6): 544-548.
Shirakawa,H., Katsuki,H., Kume,T., Kaneko,S., and Akaike,A. (2006) Aminoglutethimide prevents excitotoxic and ischemic injuries in cortical neurons. Br.J.Pharmacol. 147(7): 729-736.
Shreiber,D.I., Bain,A.C., Ross,D.T., Smith,D.H., Gennarelli,T.A., McIntosh,T.K., and Meaney,D.F. (1999a) Experimental investigation of cerebral contusion: histopathological and immunohistochemical evaluation of dynamic cortical deformation. J.Neuropathol.Exp.Neurol. 58(2): 153-164.
Singh,A., Lu,Y., Chen,C., Kallakuri,S., and Cavanaugh,J.M. (2006) A new model of traumatic axonal injury to determine the effects of strain and displacement rates. Stapp Car Crash J. 50: 601-623.
Soderback,M., Hansson,E., Tottmar,O., and Ronnback,L. (1989) Neurons in primary cultures from five defined rat brain regions--cellular composition and morphological appearance. Cell Mol.Biol. 35(1): 1-16.
Takhounts,E.G., Eppinger,R.H., Campbell,J.Q., Tannous,R.E., Power,E.D., and Shook,L.S. (2003)
On the Development of the SIMon Finite Element Head Model. Stapp Car Crash J. 47: 107-133.
Tran,L.D., Lifshitz,J., Witgen,B.M., Schwarzbach,E., Cohen,A.S., and Grady,M.S. (2006) Response of the contralateral hippocampus to lateral fluid percussion brain injury. J.Neurotrauma 23(9): 1330-1342.
Willinger,R., Kang,H.S., and Diaw,B. (1999) Three-dimensional human head finite-element model validation against two experimental impacts. Ann.Biomed.Eng 27(3): 403-410.
Zhang,L., Yang,K.H., Dwarampudi,R., Omori,K., Li,T., Chang,K., Hardy,W.N., Khalil,T.B., and King,A.I. (2001a) Recent advances in brain injury research: a new human head model development and validation. Stapp Car Crash J. 45: 369-394.
Zhang,L., Yang,K.H., and King,A.I. (2001b) Comparison of brain responses between frontal and lateral impacts by finite element modeling. J.Neurotrauma 18(1): 21-30.
Zhang,L., Yang,K.H., and King,A.I. (2004) A proposed injury threshold for mild traumatic brain injury. J.Biomech.Eng 126(2): 226-236.
Zhao,G. and Flavin,M.P. (2000) Differential sensitivity of rat hippocampal and cortical astrocytes to oxygen-glucose deprivation injury. Neurosci.Lett. 285(3): 177-180.