Embed Size (px)
Citation preview
Guillaume Vial,1,2 Marie-Agnès Chauvin,1 Nadia Bendridi,1 Annie Durand,1
Emmanuelle Meugnier,1 Anne-Marie Madec,1 Nathalie Bernoud-Hubac,1
Jean-Paul Pais de Barros,3 Éric Fontaine,4,5,6 Cécile Acquaviva,7
Sophie Hallakou-Bozec,8 Sébastien Bolze,8 Hubert Vidal,1,2,9 and Jennifer Rieusset1,2,9
Imeglimin Normalizes Glucose Toleranceand Insulin Sensitivity and ImprovesMitochondrial Function in Liverof a High-Fat, High-SucroseDiet Mice ModelDiabetes 2015;64:2254–2264 | DOI: 10.2337/db14-1220
Imeglimin is the first in a new class of oral glucose-lowering agents currently in phase 2b development. Al-though imeglimin improves insulin sensitivity in humans,the molecular mechanisms are unknown. This study useda model of 16-week high-fat, high-sucrose diet (HFHSD)mice to characterize its antidiabetic effects. Six-weekimeglimin treatment significantly decreased glycemia,restored normal glucose tolerance, and improved in-sulin sensitivity without modifying organs, body weights,and food intake. This was associated with an increasein insulin-stimulated protein kinase B phosphorylationin the liver and muscle. In liver mitochondria, imegliminredirects substrate flows in favor of complex II, as il-lustrated by increased respiration with succinate andby the restoration of respiration with glutamate/malateback to control levels. In addition, imeglimin inhibitscomplex I and restores complex III activities, suggestingan increase in fatty acid oxidation, which is supportedby an increase in hepatic 3-hydroxyacetyl-CoA dehydro-genase activity and acylcarnitine profile and the reduc-tion of liver steatosis. Imeglimin also reduces reactiveoxygen species production and increases mitochondrialDNA. Finally, imeglimin effects on mitochondrial phos-pholipid composition could participate in the benefit of
imeglimin on mitochondrial function. In conclusion, ime-glimin normalizes glucose tolerance and insulin sensi-tivity by preserving mitochondrial function from oxidativestress and favoring lipid oxidation in liver of HFHSD mice.
Type 2 diabetes is a worldwide threat that has been labeledas a great challenge to human health in the 21st century.The total number of people with diabetes is estimated torise from 382 million today to 582 million by 2035 (1), andthe prevalence of type 2 diabetes is expected to rise inchildren and adolescents around the world in all ethnicities(2). In 2013, 5.1 million deaths were attributed to diabetes(1). These alarming statistics highlight that only a few ef-fective treatment strategies exist to fight this multifactorialdisease. Currently, pharmacological management of the dis-ease consists of combination therapy to achieve glycemiccontrol. Therefore, development of antidiabetic agentswith improved safety and effectiveness is urgently needed.Imeglimin is the first in a new tetrahydrotriazine-containingclass of oral glucose-lowering agents—the glimins—and iscurrently in phase 2b clinical development (U.S./EuropeanUnion EudraCT 2012-004045-33). Several clinical trialshave shown imeglimin to be well tolerated and exhibit
1INSERM U1060, Faculté de Médecine Lyon-Sud, Oullins, France2Center for European Nutrition and Health, Centre Hospitalier Lyon-Sud, Pierre-Bénite, France3Plateforme de lipidomique, Université de Bourgogne, Centre Hospitalier Universi-taire le Bocage, Dijon, France4INSERM U1055, Laboratoire de Bioénergétique Fondamentale et Appliquée (LBFA)et SFR Biologie Environnementale et Systémique (BEeSy), Grenoble, France5Joseph Fourier University, Grenoble, France6Grenoble University Hospital, Grenoble, France7Service Maladies Héréditaires du Métabolisme, Centre de Biologie et PathologieEst, Centre Hospitalier Universitaire de Lyon et UMR, Bron, France8Poxel SA, Lyon, France
9Endocrinology, Diabetology, and Nutrition Service, Lyon-Sud Hospital, HospicesCivils de Lyon, Pierre-Bénite, France
Corresponding author: Guillaume Vial, [email protected].
Received 6 August 2014 and accepted 20 December 2014.
This article contains Supplementary Data online at http://diabetes.diabetesjournals.org/lookup/suppl/doi:10.2337/db14-1220/-/DC1.
© 2015 by the American Diabetes Association. Readers may use this article aslong as the work is properly cited, the use is educational and not for profit, andthe work is not altered.
2254 Diabetes Volume 64, June 2015
PHARMACOLOGYAND
THERAPEUTIC
S
benefits on HbA1c as monotherapy and add-on therapy(3–5). Imeglimin acts on the liver, muscle, and the pancreas(6), three key organs involved in the pathophysiology oftype 2 diabetes through suspected mechanisms targetingthe mitochondria and reduced oxidative stress. Imeglimindecreases hepatic glucose production and increases mus-cle glucose uptake (6). Recently, imeglimin demonstratedincreased insulin secretion in response to glucose in di-abetic patients during a hyperglycemic clamp study (7). Tofurther elucidate the mechanism of action of imegliminand its capacity to improve insulin sensitivity, we treateddiabetic mice fed a high-fat, high-sucrose diet (HFHSD).This model, characterized by insulin resistance, glucose in-tolerance, liver steatosis, and mitochondrial dysfunction,is commonly used to study the mechanisms of insulinresistance and the effects of drugs.
RESEARCH DESIGN AND METHODS
HFHSD-Induced Diabetic MiceMale C57BL/6JOlaHsd mice purchased from Harlan (Gannat,France) at 4 weeks old were housed at 22°C with a 12-h light/dark cycle. Procedures were conducted in accordance with theinstitutional guidelines for the care and use of laboratoryanimals and were approved by a regional ethics committee.After 1 week of acclimatization, 5–6-week-old mice were di-vided into two groups: one with free access to a standardchow diet (SD) (Harlan) and the other with free access to apelleted HFHSD diet (TD99249; Harlan) for 16 weeks as pre-viously described (8). Animals received imeglimin 200 mg/kgb.i.d. by oral gavage during the last 6 weeks of HFHSD feed-ing. Control SD and HFHSD mice were treated by oral gavagewith methylcellulose 0.5% as a vehicle for drug treatment(5 mL/kg). Food intake was measured every day during thefirst week and twice a week until the end of the experiment.Results are expressed as grams per day per mouse.
Blood Sample Collection and Biochemical AnalysisBlood glucose was taken weekly from tails in a fed stateuntil week 11. From weeks 11 to 16, blood glucose wastaken each week from tails in a fed state 2 h postgavage.Blood glucose levels were measured with a glucometer(Roche Diagnostics). Blood samples were collected by retro-orbital sampling (fed state and 2 h postgavage) at 65 and112 days after starting the HFHSD and at study end.
Intraperitoneal Glucose Tolerance Test andIntraperitoneal Insulin Tolerance TestGlucose and insulin tolerance tests were performed on 6-h–fasted mice and 2 h postgavage. Glucose 2 mg/g body weightor insulin 0.75 mU/g body weight were injected intraperito-neally; blood glucose levels were monitored with a glucometerat the indicated time points. During the intraperitoneal glu-cose tolerance test (ipGTT), plasma insulin and C-peptide werequantified before and 15 min after glucose injection. C-peptideand insulin levels were measured by ELISA methodology(80-INSMSU-E10 and 80-CPTMS-E01, respectively; ALPCO).Relative insulin clearance was estimated 15 min after glucoseinjection as the ratio (C-peptide 2 insulin)/C-peptide.
Analysis of Insulin Signaling in TissuesA subgroup of mice (SD, HFHSD, and HFHSD + imeglimin,n = 10) were fasted for 6 h. NaCl (0.9%) or insulin (10mU/micein NaCl 0.9%) were injected intraperitoneally, and animalswere killed 15 min later by cervical dislocation. Liver andgastrocnemius muscle were rapidly removed and frozenuntil use for Western blot analysis of phosphokinase B(PKB) phosphorylation.
Lipid Content in Liver (Diacylglycerol, Cholesterol,Triglycerides, Acylcarnitine Profiles)Total lipids were extracted from tissue with ethanol/chloroform(1:2 volume for volume [v/v]). Before extraction, internalstandards (1,2-diheptadecanoyl-sn-gycero-3-phosphocholine;1,2-diheptadecanoyl-sn-gycero-3-phosphoethanolamine;cholesterol ester 17:0; di-17:0 diglyceride; tri-17:0 triglyceride;and stigmasterol) were added. The organic phases wereevaporated under N2, and the different lipid classes sep-arated by thin layer chromatography using the solventhexane-diethylether-acetic acid (80:20:1 v/v/v) as eluent.Total phospholipids, diglycerides, triglycerides, and cho-lesterol esters were treated with 14% boron trifluoride inmethanol (BF3/methanol). The resulting fatty acid methylesters were analyzed by gas chromatography using a DELSIchromatograph model DI 200 equipped with an SP-2380capillary column (60 m 3 0.22 mm). Cholesterol was deri-vatized with bis(trimethylsilyl)trifluoroacetamine and ana-lyzed by gas chromatography–mass spectrometry operatedin positive chemical ionization mode. Acylcarnitine anal-ysis was performed by flow injection tandem mass spec-trometry (API 4500; AB SCIEX) as previously describedexcept that butyl derivatives were used (9).
Mitochondrial Oxygen Consumption and ReactiveOxygen Species ProductionMouse liver mitochondria were isolated using a standarddifferential centrifugation procedure in 250 mmol/L sucrose,20 mmol/L Tris-HCl, and 1 mmol/L EGTA, pH 7.4 (10).Mitochondrial oxygen consumption rate was measured onfreshly prepared mitochondria at 30°C using a Clark-type O2 electrode (S1; Hansatech Instruments, Norfolk,U.K.) in a 1-mL chamber filled with respiration buffer(125 mmol $ L21 KCl, 10 mmol $ L21 Pi-Tris, 20 mmol $ L21
Tris-HCl, and 0.1 mmol $ L21 EGTA, pH 7.2) and using 1 mgmitochondrial proteins $ mL21. Measurements were con-ducted in the presence of either glutamate (5 mmol $ L21)/malate (2.5 mmol $ L21) (GM) or succinate (5 mmol $ L21)as substrates after the addition of 1 mmol $ L21 ADP (state 3)followed by 1.5 mg $ mL21 oligomycin (state 4) (Supple-mentary Fig. 3). Reactive oxygen species (ROS) productionwas estimated by measuring H2O2 release in a stirred 1-mLchamber containing 0.2 mg mitochondria and filled witha respiration buffer containing 6 IU horseradish peroxidaseand 1 mmol $ L21 Amplex Red (excitation 560 nm, emis-sion 584 nm) and the same substrates as for respirationand using a fluorescence spectrophotometer (F-7000 FL;Hitachi U.S.A.). Measurements were conducted in basalconditions and after sequential additions of various
diabetes.diabetesjournals.org Vial and Associates 2255
substrates and 2 mmol $ L21 rotenone (SupplementaryFig. 3). Results are expressed in pmol H2O2 $ min21 $mg $ protein21 using H2O2 standard solutions.
Western Blot AnalysisLiver and gastrocnemius muscle samples were lysed inPBS containing 1% NP-40, 0.5% sodium deoxycholate,0.1% SDS supplemented with EDTA (5 mmol/L), Na3VO4
(1 mmol/L), NaF (20 mmol/L), dithiothreitol (1 mmol/L),and protease inhibitor cocktail (P2714; Sigma). Proteinswere separated by SDS-10% PAGE, transferred to polyvi-nylidene difluoride membrane, and incubated overnightwith primary antibodies. Primary antibodies used weretotal Akt/PKB (9272; Cell Signaling), phospho-Akt/PKBSer473 (9271; Cell Signaling), OXPHOS (ab110413;Abcam), PGC1a (516557; Calbiochem), OPA1 (612606;BD Biosciences), DLP1 (611112; BD Biosciences), PARKIN(ab77924; Abcam), PINK1 (ab23707; Abcam), ANT2 (SC-9299; Santa Cruz), UCP2 (615902; BioLegend), FAT/CD36 (SC-9154; Santa Cruz), and CPT1A (ab128568;Abcam). The signal was detected with a horseradishperoxidase–conjugated secondary antibody (172-10-19;Bio-Rad) and revealed with an enhanced chemilumines-cence system (Pierce). Each protein was normalized bytubulin expression in each sample, with an internal con-trol on each gel to normalize the intergel variability.Results are expressed versus the SD group.
Real-Time Quantitative RT-PCR AnalysisTotal RNA was extracted with TRI Reagent Solution(Sigma). Target mRNA levels were measured by reversetranscription followed by real-time PCR using a Rotor-Gene 6000 (Corbett Research). A standard curve wassystematically generated with six different amounts ofpurified target cDNA, and each assay was performed induplicate. We measured TATA-binding protein (TBP)mRNA as a reference gene; results are expressed as a ratiothat refers to TBP expression and is normalized to the SDgroup.
Mitochondrial DNA AnalysisTotal DNA from liver was extracted using phenol/chloroform/isoamyl alcohol (25:24:1) followed by ethanol precipitation.The difference in mitochondrial DNA (mtDNA) was estimatedby measuring the level of a mitochondrial-encoded gene(Cox1) versus a nuclear-encoded gene (cyclophilin A [Ppia])using real-time quantitative PCR as previously described (8).
Transmission Electron MicroscopyLiver was dissected and fixed in 2% glutaraldehyde for 2 hat 4°C, postfixed in 1% osmium tetroxide for 1 h at 4°C,dehydrated, and embedded in epon. The tissue was slicedusing an RMC/MTX ultramicrotome (Elexience), and ul-trathin sections (60–80 nm) were mounted on coppergrids, contrasted with 8% uranyl acetate and lead citrate,and observed with a JEOL 1200 EX transmission electronmicroscope (JEOL Ltd.) equipped with a MegaView IIhigh-resolution TEM camera. Analysis was performedwith the Soft Imaging System (ELOÏSE s.a.r.l.).
Histology and Oil Red O StainingLiver was frozen in Tissue-Tek, and 10-mm sections were cutwith a microtome (CMT950A; MICROM GmbH). Oil Red Oand hematoxylin-eosin staining were performed, and sec-tions were observed with an optical microscope (Axioskop2; Zeiss) linked to a camera (Axiocam ERc 5s; Zeiss).
Mitochondrial Lipids Analysis by LiquidChromatography–Tandem Mass SpectrometryLipids were extracted from mitochondrial preparations(1–2 mg protein) according to the method of Folch et al.(11). Samples were solubilized in 100 mL chloroform/methanol/water (60/30/4.5). Extracted lipids were fur-ther analyzed using a ZORBAX Eclipse Plus C18 columnplugged on an LC 1200-MS2 6460 QqQ system equippedwith an ESI source (Agilent Technologies).
Cardiolipins (2–4 mL) were separated at a flow rate of0.4 mL/min at 30°C with a linear gradient of acetonitrile/water/ammonium hydroxide/acetic acid (90/10/0.2/0.5 v/v/v/v)(A) and of isopropanol/water/ammonium hydroxide/aceticacid (90/10/0.2/0.5 v/v/v/v) (B) as follows: 50% B for 5 min,up to 80% B in 10 min, up to 100% in 15 min, and 100% for5 min. Acquisition was performed in negative selected re-action monitoring ion mode (source temperature 325°C,nebulizer gas flow rate 10 L/min, sheath gas flow 12 L/min,temperature 350°C, capillary 3,500 V, nozzle 1,000 V, frag-mentor 280 V, collision energy 76 V). Transitions frommolecular ion [M 2 1] to linoleic acid (charge/mass ratio279.2) or oleic acid (charge/mass ratio 281.2) were used forcardiolipin quantitation.
Phospholipids (2–4 mL) were separated at a flow rate of0.25 mL/min at 50 °C with a linear gradient of water/methanol (60/40 v/v), 10 mmol/L ammonium acetate,1 mmol/L acetic acid (A) and of isopropanol/methanol(90/10 v/v), 10 mmol/L ammonium acetate, 1 mmol/L aceticacid (B) as follows: 40% B for 1 min, up to 95% B in 15 min,and maintained at 100% for 1 min. Acquisition was per-formed in selected reaction monitoring ion mode (sourcetemperature 325°C, nebulizer gas flow rate 10 L/min, sheathgas flow 10 L/min, temperature 400°C, capillary 3,500 V,nozzle 1,000 V). The transitions used were as follows:[M + 1] + → 184.1 (fragmentor 160 V, collision energy20 V), [M + 1] + → [M 2 140] (fragmentor 120 V, collisionenergy 17 V), and [M 2 1] 2 → [M 2 87] (fragmentor 150V, collision energy 19 V) for phosphatidylcholines (PCs),phosphatidylethanolamines (PEs), and phosphatidylserines(PSs), respectively.
Mitochondrial Enzymatic ActivitiesRotenone-sensitive NADH-ubiquinone oxidoreductase(EC 1.6.5.3, complex I [CI]) was assayed using 100 mmol $ L21
decylubiquinone as an electron acceptor and 200 mmol $ L21
NADH as a donor in a 10 mmol $ L21 KH2PO4/K2HPO4
buffer, pH 7.5, containing 3.75 mg $mL21 BSA, 2 mmol $ L21
KCN, and 7.5 mmol $ L21 antimycin A. NADH oxidationwas measured at 340 nm before and after the addition of 4mmol $ L21 rotenone to allow the calculation of the rote-none-sensitive–specific activity, which is characteristic of CI.
2256 Insulin-Sensitizing Effects of Imeglimin Diabetes Volume 64, June 2015
Succinate-ubiquinone reductase (EC 1.3.5.1, complex II[CII]) activity was quantified by measuring the decrease inabsorbance resulting from the reduction of 100 mmol $ L21
dichlorophenolindophenol at 600 nm. The measurementwas performed in 50 mmol $ L21 KH2PO4/K2HPO4
buffer, pH 7.5, in the presence of 30 mmol $ L21 succi-nate, 100 mmol $ L21 decylubiquinone, 2 mmol $ L21
rotenone, and 2 mmol $ L21 KCN.Coenzyme Q-cytochrome c-oxidoreductase activity (EC
1.10.2.2, complex III [CIII], sometimes called the cytochromebc1 complex), was quantified by measuring the increase inabsorbance resulting from the reduction of 100 mmol $ L21
cytochrome c at 550 nm. The measurement was performed in50 mmol $ L21 KH2PO4/K2HPO4 buffer, pH 7.5, in the pres-ence of 100 mmol $ L21 decylubiquinone previously reducedby dithionite, 50 mmol $ L21 EDTA, and 1 mmol $ L21 KCN.The specific activity was calculated by subtracting the activityobtained before and after addition of 5 mg/mL antimycin A.
3-Hydroxyacyl-CoA dehydrogenase (HAD) (EC 1.1.1.35)activity was quantified by measuring the decrease in absor-bance at 340 nm resulting from the oxidation of NADH
(200 mmol $ L21) and the reduction of S-acetoacetyl-CoA(50 mmol $ L21). The measurement was performed in imid-azole (40 mmol $ L21) and EDTA (60 mmol $ L21), pH 7.
Statistical AnalysisAll data are presented as mean 6 SEM. One-way ANOVAwas used to determine the global effects of treatment. Whenappropriate, differences between groups were tested witha protected least significant difference Fisher post hoc test.Statistical significance was accepted at P, 0.05 (*significantlydifferent between SD and HFHSD, #significantly differentbetween HFHSD and HFHSD + imeglimin). Mann-Whitneytests were applied when values were not normally distributed.
RESULTS
Imeglimin Normalizes Glucose Tolerance and InsulinSensitivity in HFHSD MiceHFHSD-fed mice were used as a model of altered glucosehomeostasis in rodents (8,12). Despite a decrease in foodintake (g/day) (Supplementary Fig. 1A), HFHSD inducedan increase in daily caloric intake compared with SD (SD =11.45 kcal/day vs. HFHSD = 13.04 kcal/day). As expected,
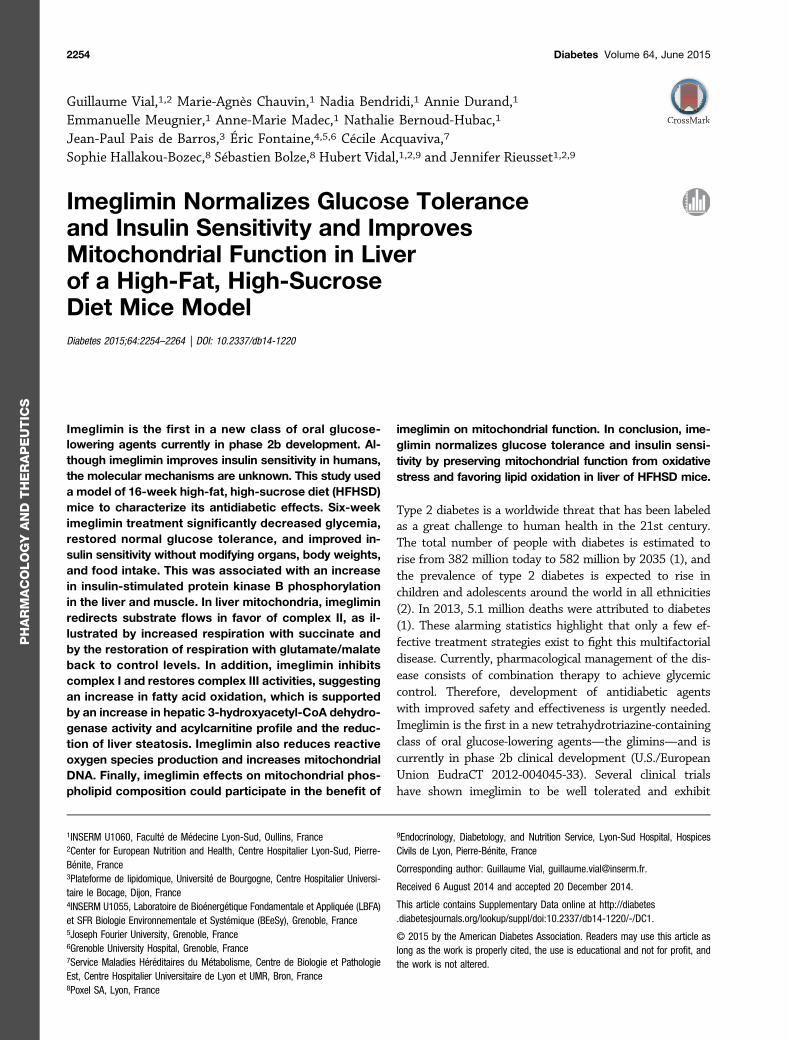
Figure 1—Effects of imeglimin treatment on body mass (A), glucose tolerance (B), insulin sensitivity (C), and insulin secretion (D). Bodymass (A) was measured in the morning twice a week and every day during the first treatment phase of the experiment. ipGTTs (B) wereperformed after a 5-week treatment (week 15 of the diet) in a 6-h fasted state and 2 h postdose. Blood glucose concentrations weremeasured before and 15, 30, 45, 60, and 90 min after glucose 2 g/kg i.p. Intraperitoneal insulin tolerance tests (C) were performed after 6weeks of treatment (week 16 of diet) in a 6-h fasted state and 2 h postdose. Blood glucose concentrations were measured before and 15,30, 45, and 60 min after insulin 0.75 units/kg i.p. During ipGTT, blood samples were collected before and 15 min after glucose 2 g/kg i.p. fordetermination of insulin and C-peptide plasmatic concentrations (D). Data are mean 6 SEM (n = 20). *P < 0.01 vs. SD; #P < 0.05 vs.HFHSD. IMEG, imeglimin; T0, time 0; T15, time 15 min.
diabetes.diabetesjournals.org Vial and Associates 2257
HFHSD mice were obese, hyperglycemic, glucose intoler-ant, and insulin resistant compared with SD mice (Fig.1A–C and Supplementary Fig. 1B–C). The mass of liver,gastrocnemius, and epididymal fat is increased in HFHSDmice (Supplementary Fig. 1D–G). HFHSD mice alsoshowed higher levels of both insulin and C-peptide levels(Fig. 1D) than SD mice, indicating a modification of in-sulin secretion and/or clearance. Whereas C-peptide con-centration was fivefold higher than insulin in SD mice, itwas only twofold higher in HFHSD mice (Fig. 1D), indi-cating a large decrease in insulin clearance with this diet.
Imeglimin was administered orally at 200 mg/kg b.i.d.during the last 6 weeks of the HFHSD feeding protocol.A slight decrease in body weight and food intake associatedwith some diarrhea was observed but only during the firstfew days of treatment (Fig. 1A and Supplementary Fig.1A). These effects were transient and disappeared aftera few days, remaining comparable to control HFHSD miceuntil the end of treatment. Furthermore, no effect wasmeasured on fat pad weight or on liver and skeletal musclesmass with imeglimin (Supplementary Fig. 1D–G). However,imeglimin significantly decreased hyperglycemia (Fig. 1B), re-stored normal glucose tolerance (Fig. 1B and SupplementaryFig. 1B), and improved insulin sensitivity (Fig. 1C and Sup-plementary Fig. 1C). Imeglimin restored insulin secretion dur-ing ipGTT (+98% vs. HFHSD mice, P , 0.01) and improvedC-peptide secretion during ipGTT (Fig. 1D) but did not mod-ify insulin clearance under HFHSD (Fig. 1D). In fact, relativeinsulin clearance [(C-peptide 2 insulin)/C-peptide] was de-creased by HFHSD (82% in SD group vs. 50% in HFHSDgroup, P , 0.001) but was not modified by imeglimin (41%in HFHSD + imeglimin group). Together, these data suggestthat imeglimin improves glucose homeostasis in HFHSDmiceindependent of an effect on whole-body composition.
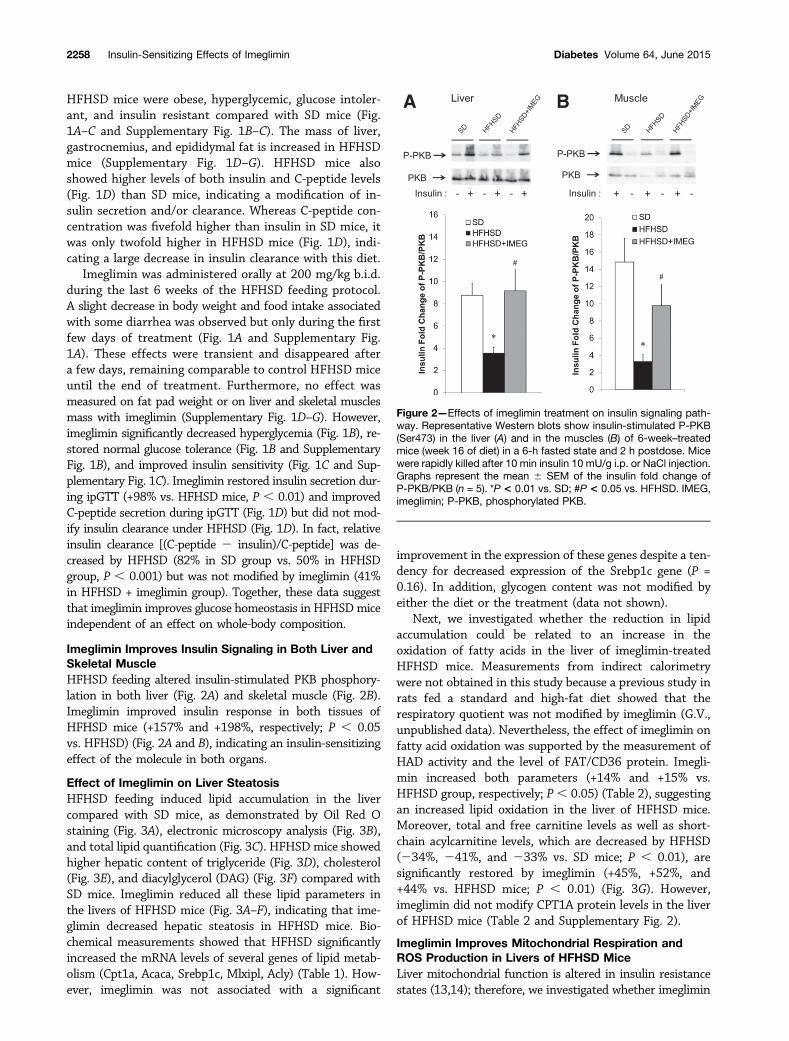
Imeglimin Improves Insulin Signaling in Both Liver andSkeletal MuscleHFHSD feeding altered insulin-stimulated PKB phosphory-lation in both liver (Fig. 2A) and skeletal muscle (Fig. 2B).Imeglimin improved insulin response in both tissues ofHFHSD mice (+157% and +198%, respectively; P , 0.05vs. HFHSD) (Fig. 2A and B), indicating an insulin-sensitizingeffect of the molecule in both organs.
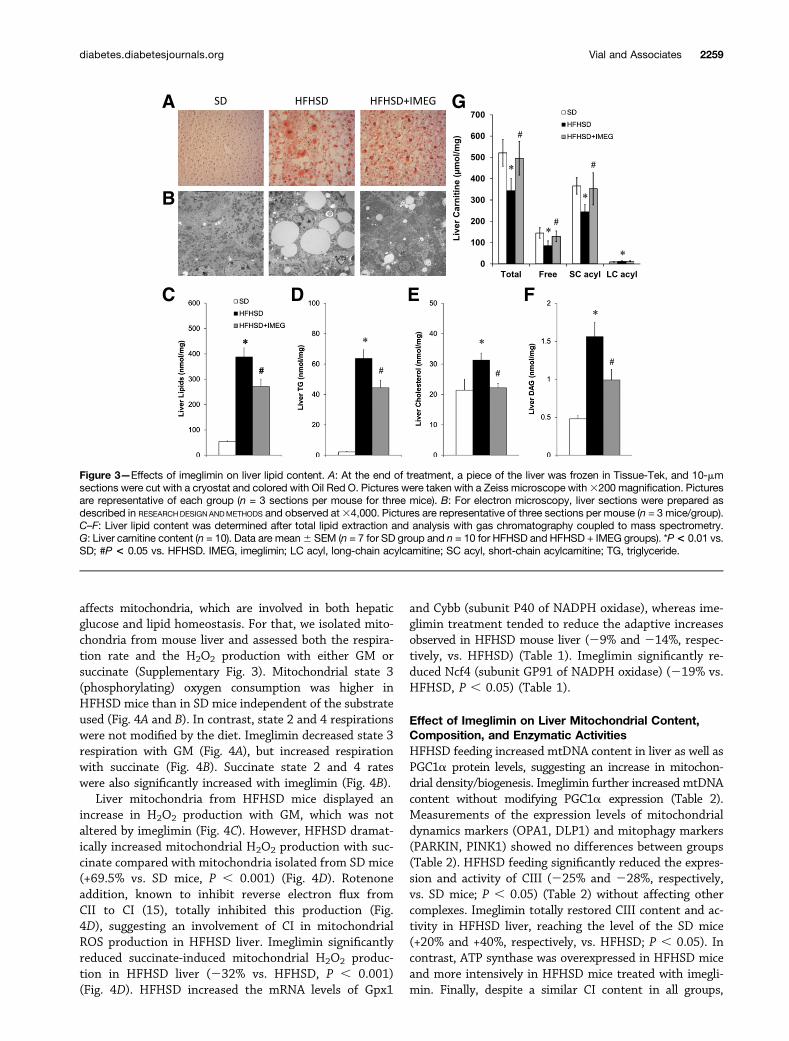
Effect of Imeglimin on Liver SteatosisHFHSD feeding induced lipid accumulation in the livercompared with SD mice, as demonstrated by Oil Red Ostaining (Fig. 3A), electronic microscopy analysis (Fig. 3B),and total lipid quantification (Fig. 3C). HFHSD mice showedhigher hepatic content of triglyceride (Fig. 3D), cholesterol(Fig. 3E), and diacylglycerol (DAG) (Fig. 3F) compared withSD mice. Imeglimin reduced all these lipid parameters inthe livers of HFHSD mice (Fig. 3A–F), indicating that ime-glimin decreased hepatic steatosis in HFHSD mice. Bio-chemical measurements showed that HFHSD significantlyincreased the mRNA levels of several genes of lipid metab-olism (Cpt1a, Acaca, Srebp1c, Mlxipl, Acly) (Table 1). How-ever, imeglimin was not associated with a significant
improvement in the expression of these genes despite a ten-dency for decreased expression of the Srebp1c gene (P =0.16). In addition, glycogen content was not modified byeither the diet or the treatment (data not shown).
Next, we investigated whether the reduction in lipidaccumulation could be related to an increase in theoxidation of fatty acids in the liver of imeglimin-treatedHFHSD mice. Measurements from indirect calorimetrywere not obtained in this study because a previous study inrats fed a standard and high-fat diet showed that therespiratory quotient was not modified by imeglimin (G.V.,unpublished data). Nevertheless, the effect of imeglimin onfatty acid oxidation was supported by the measurement ofHAD activity and the level of FAT/CD36 protein. Imegli-min increased both parameters (+14% and +15% vs.HFHSD group, respectively; P, 0.05) (Table 2), suggestingan increased lipid oxidation in the liver of HFHSD mice.Moreover, total and free carnitine levels as well as short-chain acylcarnitine levels, which are decreased by HFHSD(234%, 241%, and 233% vs. SD mice; P , 0.01), aresignificantly restored by imeglimin (+45%, +52%, and+44% vs. HFHSD mice; P , 0.01) (Fig. 3G). However,imeglimin did not modify CPT1A protein levels in the liverof HFHSD mice (Table 2 and Supplementary Fig. 2).
Imeglimin Improves Mitochondrial Respiration andROS Production in Livers of HFHSD MiceLiver mitochondrial function is altered in insulin resistancestates (13,14); therefore, we investigated whether imeglimin
Figure 2—Effects of imeglimin treatment on insulin signaling path-way. Representative Western blots show insulin-stimulated P-PKB(Ser473) in the liver (A) and in the muscles (B) of 6-week–treatedmice (week 16 of diet) in a 6-h fasted state and 2 h postdose. Micewere rapidly killed after 10 min insulin 10 mU/g i.p. or NaCl injection.Graphs represent the mean 6 SEM of the insulin fold change ofP-PKB/PKB (n = 5). *P < 0.01 vs. SD; #P < 0.05 vs. HFHSD. IMEG,imeglimin; P-PKB, phosphorylated PKB.
2258 Insulin-Sensitizing Effects of Imeglimin Diabetes Volume 64, June 2015
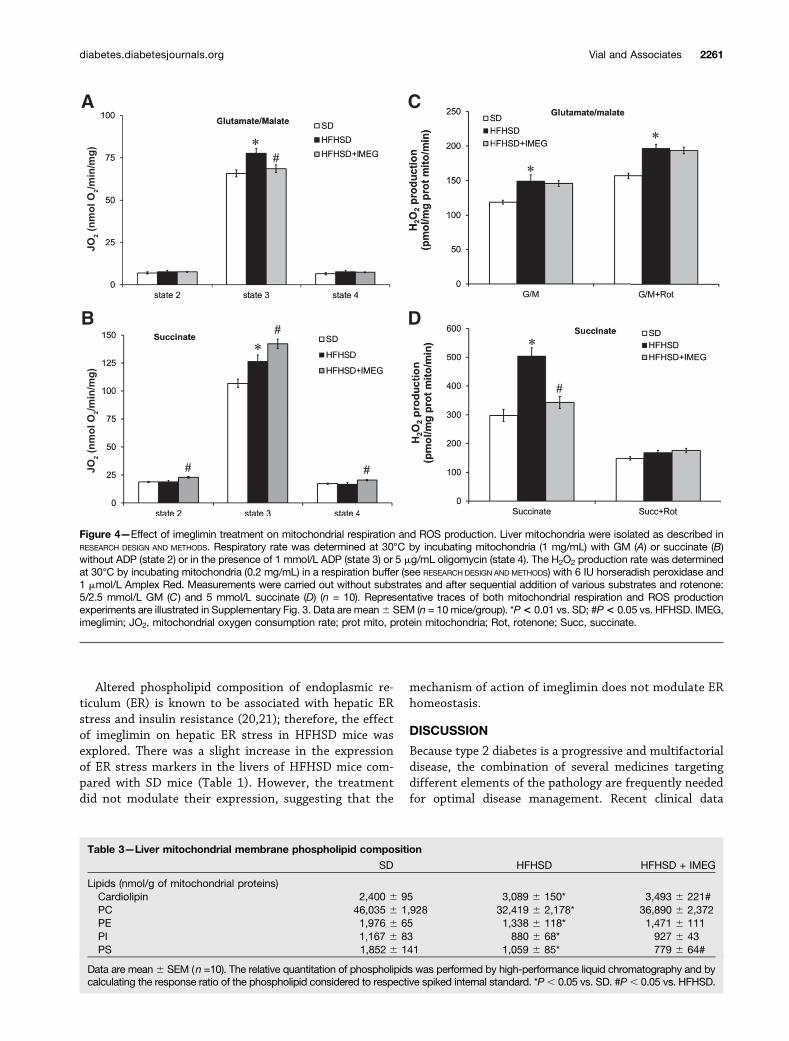
affects mitochondria, which are involved in both hepaticglucose and lipid homeostasis. For that, we isolated mito-chondria from mouse liver and assessed both the respira-tion rate and the H2O2 production with either GM orsuccinate (Supplementary Fig. 3). Mitochondrial state 3(phosphorylating) oxygen consumption was higher inHFHSD mice than in SD mice independent of the substrateused (Fig. 4A and B). In contrast, state 2 and 4 respirationswere not modified by the diet. Imeglimin decreased state 3respiration with GM (Fig. 4A), but increased respirationwith succinate (Fig. 4B). Succinate state 2 and 4 rateswere also significantly increased with imeglimin (Fig. 4B).
Liver mitochondria from HFHSD mice displayed anincrease in H2O2 production with GM, which was notaltered by imeglimin (Fig. 4C). However, HFHSD dramat-ically increased mitochondrial H2O2 production with suc-cinate compared with mitochondria isolated from SD mice(+69.5% vs. SD mice, P , 0.001) (Fig. 4D). Rotenoneaddition, known to inhibit reverse electron flux fromCII to CI (15), totally inhibited this production (Fig.4D), suggesting an involvement of CI in mitochondrialROS production in HFHSD liver. Imeglimin significantlyreduced succinate-induced mitochondrial H2O2 produc-tion in HFHSD liver (232% vs. HFHSD, P , 0.001)(Fig. 4D). HFHSD increased the mRNA levels of Gpx1
and Cybb (subunit P40 of NADPH oxidase), whereas ime-glimin treatment tended to reduce the adaptive increasesobserved in HFHSD mouse liver (29% and 214%, respec-tively, vs. HFHSD) (Table 1). Imeglimin significantly re-duced Ncf4 (subunit GP91 of NADPH oxidase) (219% vs.HFHSD, P , 0.05) (Table 1).
Effect of Imeglimin on Liver Mitochondrial Content,Composition, and Enzymatic ActivitiesHFHSD feeding increased mtDNA content in liver as well asPGC1a protein levels, suggesting an increase in mitochon-drial density/biogenesis. Imeglimin further increased mtDNAcontent without modifying PGC1a expression (Table 2).Measurements of the expression levels of mitochondrialdynamics markers (OPA1, DLP1) and mitophagy markers(PARKIN, PINK1) showed no differences between groups(Table 2). HFHSD feeding significantly reduced the expres-sion and activity of CIII (225% and 228%, respectively,vs. SD mice; P , 0.05) (Table 2) without affecting othercomplexes. Imeglimin totally restored CIII content and ac-tivity in HFHSD liver, reaching the level of the SD mice(+20% and +40%, respectively, vs. HFHSD; P , 0.05). Incontrast, ATP synthase was overexpressed in HFHSD miceand more intensively in HFHSD mice treated with imegli-min. Finally, despite a similar CI content in all groups,
Figure 3—Effects of imeglimin on liver lipid content. A: At the end of treatment, a piece of the liver was frozen in Tissue-Tek, and 10-mmsections were cut with a cryostat and colored with Oil Red O. Pictures were taken with a Zeiss microscope with3200 magnification. Picturesare representative of each group (n = 3 sections per mouse for three mice). B: For electron microscopy, liver sections were prepared asdescribed in RESEARCHDESIGNANDMETHODS and observed at34,000. Pictures are representative of three sections per mouse (n = 3 mice/group).C–F: Liver lipid content was determined after total lipid extraction and analysis with gas chromatography coupled to mass spectrometry.G: Liver carnitine content (n = 10). Data are mean6 SEM (n = 7 for SD group and n = 10 for HFHSD and HFHSD + IMEG groups). *P< 0.01 vs.SD; #P < 0.05 vs. HFHSD. IMEG, imeglimin; LC acyl, long-chain acylcarnitine; SC acyl, short-chain acylcarnitine; TG, triglyceride.
diabetes.diabetesjournals.org Vial and Associates 2259
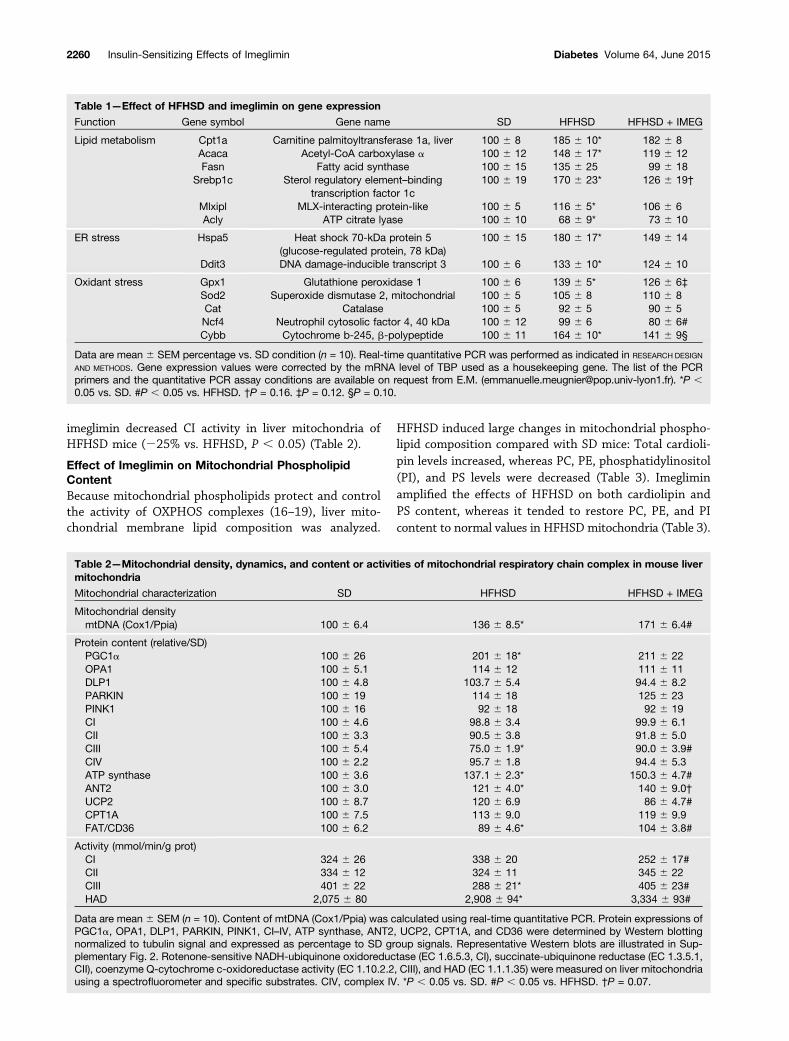
imeglimin decreased CI activity in liver mitochondria ofHFHSD mice (225% vs. HFHSD, P , 0.05) (Table 2).
Effect of Imeglimin on Mitochondrial PhospholipidContentBecause mitochondrial phospholipids protect and controlthe activity of OXPHOS complexes (16–19), liver mito-chondrial membrane lipid composition was analyzed.
HFHSD induced large changes in mitochondrial phospho-lipid composition compared with SD mice: Total cardioli-pin levels increased, whereas PC, PE, phosphatidylinositol(PI), and PS levels were decreased (Table 3). Imegliminamplified the effects of HFHSD on both cardiolipin andPS content, whereas it tended to restore PC, PE, and PIcontent to normal values in HFHSD mitochondria (Table 3).
Table 1—Effect of HFHSD and imeglimin on gene expression
Function Gene symbol Gene name SD HFHSD HFHSD + IMEG
Lipid metabolism Cpt1a Carnitine palmitoyltransferase 1a, liver 100 6 8 185 6 10* 182 6 8Acaca Acetyl-CoA carboxylase a 100 6 12 148 6 17* 119 6 12Fasn Fatty acid synthase 100 6 15 135 6 25 99 6 18
Srebp1c Sterol regulatory element–bindingtranscription factor 1c
100 6 19 170 6 23* 126 6 19†
Mlxipl MLX-interacting protein-like 100 6 5 116 6 5* 106 6 6Acly ATP citrate lyase 100 6 10 68 6 9* 73 6 10
ER stress Hspa5 Heat shock 70-kDa protein 5(glucose-regulated protein, 78 kDa)
100 6 15 180 6 17* 149 6 14
Ddit3 DNA damage-inducible transcript 3 100 6 6 133 6 10* 124 6 10
Oxidant stress Gpx1 Glutathione peroxidase 1 100 6 6 139 6 5* 126 6 6‡Sod2 Superoxide dismutase 2, mitochondrial 100 6 5 105 6 8 110 6 8Cat Catalase 100 6 5 92 6 5 90 6 5Ncf4 Neutrophil cytosolic factor 4, 40 kDa 100 6 12 99 6 6 80 6 6#Cybb Cytochrome b-245, b-polypeptide 100 6 11 164 6 10* 141 6 9§
Data are mean 6 SEM percentage vs. SD condition (n = 10). Real-time quantitative PCR was performed as indicated in RESEARCH DESIGN
AND METHODS. Gene expression values were corrected by the mRNA level of TBP used as a housekeeping gene. The list of the PCRprimers and the quantitative PCR assay conditions are available on request from E.M. ([email protected]). *P ,0.05 vs. SD. #P , 0.05 vs. HFHSD. †P = 0.16. ‡P = 0.12. §P = 0.10.
Table 2—Mitochondrial density, dynamics, and content or activities of mitochondrial respiratory chain complex in mouse livermitochondria
Mitochondrial characterization SD HFHSD HFHSD + IMEG
Mitochondrial densitymtDNA (Cox1/Ppia) 100 6 6.4 136 6 8.5* 171 6 6.4#
Protein content (relative/SD)PGC1a 100 6 26 201 6 18* 211 6 22OPA1 100 6 5.1 114 6 12 111 6 11DLP1 100 6 4.8 103.7 6 5.4 94.4 6 8.2PARKIN 100 6 19 114 6 18 125 6 23PINK1 100 6 16 92 6 18 92 6 19CI 100 6 4.6 98.8 6 3.4 99.9 6 6.1CII 100 6 3.3 90.5 6 3.8 91.8 6 5.0CIII 100 6 5.4 75.0 6 1.9* 90.0 6 3.9#CIV 100 6 2.2 95.7 6 1.8 94.4 6 5.3ATP synthase 100 6 3.6 137.1 6 2.3* 150.3 6 4.7#ANT2 100 6 3.0 121 6 4.0* 140 6 9.0†UCP2 100 6 8.7 120 6 6.9 86 6 4.7#CPT1A 100 6 7.5 113 6 9.0 119 6 9.9FAT/CD36 100 6 6.2 89 6 4.6* 104 6 3.8#
Activity (mmol/min/g prot)CI 324 6 26 338 6 20 252 6 17#CII 334 6 12 324 6 11 345 6 22CIII 401 6 22 288 6 21* 405 6 23#HAD 2,075 6 80 2,908 6 94* 3,334 6 93#
Data are mean 6 SEM (n = 10). Content of mtDNA (Cox1/Ppia) was calculated using real-time quantitative PCR. Protein expressions ofPGC1a, OPA1, DLP1, PARKIN, PINK1, CI–IV, ATP synthase, ANT2, UCP2, CPT1A, and CD36 were determined by Western blottingnormalized to tubulin signal and expressed as percentage to SD group signals. Representative Western blots are illustrated in Sup-plementary Fig. 2. Rotenone-sensitive NADH-ubiquinone oxidoreductase (EC 1.6.5.3, CI), succinate-ubiquinone reductase (EC 1.3.5.1,CII), coenzyme Q-cytochrome c-oxidoreductase activity (EC 1.10.2.2, CIII), and HAD (EC 1.1.1.35) were measured on liver mitochondriausing a spectrofluorometer and specific substrates. CIV, complex IV. *P , 0.05 vs. SD. #P , 0.05 vs. HFHSD. †P = 0.07.
2260 Insulin-Sensitizing Effects of Imeglimin Diabetes Volume 64, June 2015
Altered phospholipid composition of endoplasmic re-ticulum (ER) is known to be associated with hepatic ERstress and insulin resistance (20,21); therefore, the effectof imeglimin on hepatic ER stress in HFHSD mice wasexplored. There was a slight increase in the expressionof ER stress markers in the livers of HFHSD mice com-pared with SD mice (Table 1). However, the treatmentdid not modulate their expression, suggesting that the
mechanism of action of imeglimin does not modulate ERhomeostasis.
DISCUSSION
Because type 2 diabetes is a progressive and multifactorialdisease, the combination of several medicines targetingdifferent elements of the pathology are frequently neededfor optimal disease management. Recent clinical data
Figure 4—Effect of imeglimin treatment on mitochondrial respiration and ROS production. Liver mitochondria were isolated as described inRESEARCH DESIGN AND METHODS. Respiratory rate was determined at 30°C by incubating mitochondria (1 mg/mL) with GM (A) or succinate (B)without ADP (state 2) or in the presence of 1 mmol/L ADP (state 3) or 5 mg/mL oligomycin (state 4). The H2O2 production rate was determinedat 30°C by incubating mitochondria (0.2 mg/mL) in a respiration buffer (see RESEARCH DESIGN AND METHODS) with 6 IU horseradish peroxidase and1 mmol/L Amplex Red. Measurements were carried out without substrates and after sequential addition of various substrates and rotenone:5/2.5 mmol/L GM (C) and 5 mmol/L succinate (D) (n = 10). Representative traces of both mitochondrial respiration and ROS productionexperiments are illustrated in Supplementary Fig. 3. Data are mean6 SEM (n = 10mice/group). *P< 0.01 vs. SD; #P< 0.05 vs. HFHSD. IMEG,imeglimin; JO2, mitochondrial oxygen consumption rate; prot mito, protein mitochondria; Rot, rotenone; Succ, succinate.
Table 3—Liver mitochondrial membrane phospholipid composition
SD HFHSD HFHSD + IMEG
Lipids (nmol/g of mitochondrial proteins)Cardiolipin 2,400 6 95 3,089 6 150* 3,493 6 221#PC 46,035 6 1,928 32,419 6 2,178* 36,890 6 2,372PE 1,976 6 65 1,338 6 118* 1,471 6 111PI 1,167 6 83 880 6 68* 927 6 43PS 1,852 6 141 1,059 6 85* 779 6 64#
Data are mean6 SEM (n =10). The relative quantitation of phospholipids was performed by high-performance liquid chromatography and bycalculating the response ratio of the phospholipid considered to respective spiked internal standard. *P, 0.05 vs. SD. #P, 0.05 vs. HFHSD.
diabetes.diabetesjournals.org Vial and Associates 2261
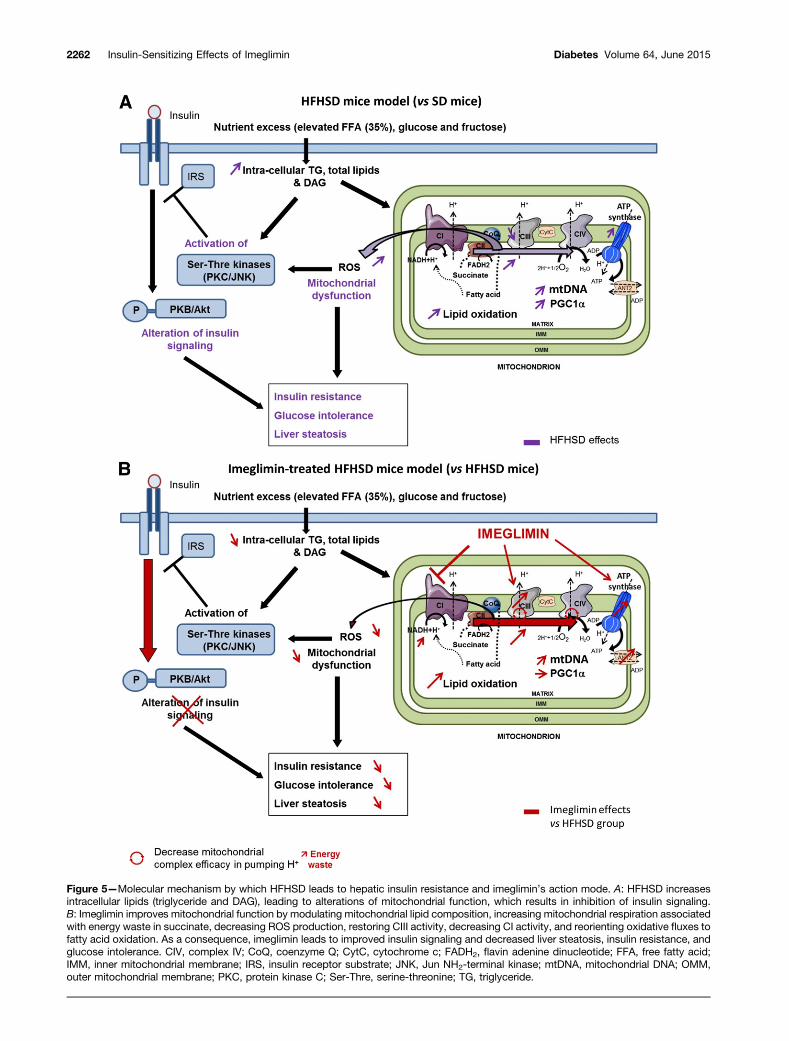
Figure 5—Molecular mechanism by which HFHSD leads to hepatic insulin resistance and imeglimin’s action mode. A: HFHSD increasesintracellular lipids (triglyceride and DAG), leading to alterations of mitochondrial function, which results in inhibition of insulin signaling.B: Imeglimin improves mitochondrial function by modulating mitochondrial lipid composition, increasing mitochondrial respiration associatedwith energy waste in succinate, decreasing ROS production, restoring CIII activity, decreasing CI activity, and reorienting oxidative fluxes tofatty acid oxidation. As a consequence, imeglimin leads to improved insulin signaling and decreased liver steatosis, insulin resistance, andglucose intolerance. CIV, complex IV; CoQ, coenzyme Q; CytC, cytochrome c; FADH2, flavin adenine dinucleotide; FFA, free fatty acid;IMM, inner mitochondrial membrane; IRS, insulin receptor substrate; JNK, Jun NH2-terminal kinase; mtDNA, mitochondrial DNA; OMM,outer mitochondrial membrane; PKC, protein kinase C; Ser-Thre, serine-threonine; TG, triglyceride.
2262 Insulin-Sensitizing Effects of Imeglimin Diabetes Volume 64, June 2015
demonstrated that in addition to its efficacy as mo-notherapy, imeglimin could complement the actions ofmetformin or sitagliptin by significantly improvingHbA1c and fasting plasma glucose in type 2 diabeticpatients (3,4). In this study, we investigated the mecha-nism of action of imeglimin on glucose homeostasis inHFHSD-induced diabetic mice and demonstrated theefficacy of imeglimin on glucose homeostasis after 6weeks of treatment in this model. Imeglimin demon-strated benefits on insulin sensitivity with an improve-ment in insulin signaling in both muscle and liver. Wepropose that the beneficial effects of imeglimin on liverare mediated at least in part through an action on mi-tochondria (Fig. 5). Indeed, imeglimin reduced lipid ac-cumulation in the liver by improving mitochondrialdensity and function and increased mitochondrial den-sity by an action independent of PGC1a protein levelsand probably without modifying mitochondrial dynamicsand mitophagy. Imeglimin also modulated the OXPHOSchain activity; it reduced CI activity and ROS producedfrom this complex when mitochondria oxidize succinate.Furthermore, imeglimin restored the expression of a sub-unit of CIII and totally restored CIII activity in HFHSDmice. Therefore, this dual effect of imeglimin (CI inhibi-tion and CIII restoration) allows mitochondria to oxidizemore CII substrates and, thus, potentially more lipids.This assumption is confirmed by the increase in bothHAD activity and FAT/CD36 protein levels in additionto the restoration of total and free carnitine contentand the elevated short-chain acylcarnitine in the liversof imeglimin-treated HFHSD mice. Moreover, imegliminincreased the oxidation capacity of liver mitochondriafor succinate (or FADH2) independently of the mito-chondrial working state, suggesting an energy waste.The observed energy waste is unconventional becauseit is not a classical uncoupling. In fact, imegliminincreases mitochondrial respiration in state 2 and 4with succinate but not with GM; a classical uncouplingagent or protein (DNP, CCCP, or UCP) acts on bothsubstrates. Furthermore, uncoupling is not supportedby the reduction in UCP2 protein levels by imeglimin.This energy waste is closer to a slipping of the mitochon-drial pump resulting from the change in efficiency of thecomplex in pumping electrons when mitochondria usedsuccinate rather than a change in membrane permeabil-ity. This subtle energy waste following imeglimin treat-ment could participate in the decrease in fatty acidaccumulation in the liver. In agreement, liver-targetedmitochondrial uncoupler was recently shown to improvehepatic steatosis and insulin resistance in mice (22).Furthermore, reduction in both liver triglyceride andDAG levels and oxidative stress may contribute toimprovements in hepatic insulin sensitivity induced byimeglimin. DAG-mediated activation of PKC and ROS-mediated activation of Jun NH2-terminal kinase arewell-described contributors to hepatic insulin resistance(22–27). In addition, we cannot exclude a role of imeglimin
preventing other deleterious effects of oxidative stress, aspreviously reported (28,29).
Cardiolipin content increases in mitochondrial mem-branes could contribute to the increase in the respirationrate during overfeeding because cardiolipins are known toinduce nonphosphorylating energy wasting in mitochon-dria (16,30). Increases in ATP synthase and ANT contentcould also amplify mitochondrial respiration. Althoughthese mitochondrial adaptations in response to overfeed-ing should lead to increased OXPHOS capacity, this prob-ably failed in HFHSD mice mitochondria because CIIIcontent and activity decreased. Imeglimin reinforcedHFHSD-induced adaptations by overincreasing cardioli-pin, ATP synthase, and ANT mitochondrial content andrestored CIII content and activity. These effects can ex-plain imeglimin’s capacity to further increase succinate-drivenrespiration because it is associated with CI inhibition.Specific, tightly bound phospholipids, such as cardioli-pins, are essential for the activity of the cytochrome bc1complex (CIII), an integral membrane protein of the respi-ratory chain (31); therefore, the modulation of phospho-lipid composition by imeglimin through increasing cardiolipincontent could contribute to improved mitochondrial func-tion. Moreover, because cardiolipins modulate the inter-actions and activities of mitochondrial complexes (32,33),regulate OXPHOS chain efficacy, and reduce ROS pro-duction (34), we propose that the imeglimin-induced in-crease in cardiolipins could participate in inducing CIIIactivity and reducing ROS production by liver mitochon-dria. We demonstrate for the first time in our knowl-edge that an efficient antidiabetic treatment positivelyaffects the liver mitochondrial phospholipid compositionof HFHSD mice.
This study demonstrates important positive effects of6 weeks of imeglimin on glycemia, glucose tolerance, andinsulin sensitivity in HFHSD-induced diabetic mice. Wepropose that the beneficial effect of imeglimin on glucosehomeostasis, particularly insulin sensitivity, involvesimprovements in hepatic mitochondrial function, leadingto increased lipid oxidation and reduced ROS production.Imeglimin is the first antidiabetic compound that inducesan increase in mitochondrial phospholipid composition,contributing to improvements in hepatic mitochondrialfunction. The mitochondrial effects of imeglimin, there-fore, could participate in the imeglimin-mediated im-provement of glucose homeostasis in patients with type 2diabetes. Future studies are required to determinewhether improvements in insulin sensitivity in skeletalmuscle of HFHSD mice are related to the hepatic effectsof imeglimin or whether a similar mechanism could occurdirectly in skeletal muscle.
Acknowledgments. The authors thank the PBES (Plateau de BiologieExpérimentale de la Souris, Lyon, France) for animal facilities; Elisabeth Errazuriz(CeCILE Imaging Center, Lyon, France) for technical help; Emily Tubbs (INSERMU1060, Faculté de Médecine Lyon-Sud) for technical help and English correction;Emmanuelle Loizon, Amelie Bravard, Pierre Theurey, and Abdallah Gharib (INSERM
diabetes.diabetesjournals.org Vial and Associates 2263
U1060, Faculté de Médecine Lyon-Sud) for technical help; and Christine Saban(Service Maladies Héréditaires du Métabolisme, Centre de Biologie et PathologieEst, Centre Hospitalier Universitaire de Lyon et UMR) for fruitful contribution to thediscussions.Funding. This work was supported by INSERM.Duality of Interest. This work was supported by Poxel SA. No otherpotential conflicts of interest relevant to this article were reported.Author Contributions. G.V. and J.R. contributed to the experimentaldesign, researched data, contributed to the discussion, and wrote the manu-script. M.-A.C., N.B., A.D., E.M., A.-M.M., N.B.-H., J.-P.P.d.B., and C.A.researched data. É.F. and H.V. contributed to the discussion and review of themanuscript. S.H.-B. and S.B. contributed to the experimental design, discussion,and review of the manuscript. G.V. is the guarantor of this work and, as such,had full access to all the data in the study and takes responsibility for the integrityof the data and the accuracy of the data analysis.Prior Presentation. Parts of this study were presented as an oral pre-sentation at the 74th Scientific Sessions of the American Diabetes Association,San Francisco, CA, 13–17 June 2014.
References1. Guariguata L, Nolan T, Beagley J, Linnenkamp U, Jacqmain O (Eds). IDFDiabetes Atlas. 6th ed. Brussels, International Diabetes Federation, 20132. Reinehr T. Type 2 diabetes mellitus in children and adolescents. WorldJ Diabetes 2013;4:270–2813. Fouqueray P, Pirags V, Diamant M, et al. The efficacy and safety of im-eglimin as add-on therapy in patients with type 2 diabetes inadequately con-trolled with sitagliptin monotherapy. Diabetes Care 2014;37:1924–19304. Fouqueray P, Pirags V, Inzucchi SE, et al. The efficacy and safety of im-eglimin as add-on therapy in patients with type 2 diabetes inadequately con-trolled with metformin monotherapy. Diabetes Care 2013;36:565–5685. Pirags V, Lebovitz H, Fouqueray P. Imeglimin, a novel glimin oral antidia-betic, exhibits a good efficacy and safety profile in type 2 diabetic patients.Diabetes Obes Metab 2012;14:852–8586. Fouqueray P, Leverve X, Fontaine E, et al. Imeglimin - a new oral anti-diabetic that targets the three key defects of type 2 diabetes. J Diabetes Metab2011;2:1267. Pacini G, Mari A, Brazzale A, Fouqueray F, Bolze S, Roden M. Imegliminincreases glucose-dependent insulin secretion and improves beta-cell function inpatients with type 2 diabetes (120-OR). Diabetes 2014;63(Suppl. 1):A328. Bonnard C, Durand A, Peyrol S, et al. Mitochondrial dysfunction results fromoxidative stress in the skeletal muscle of diet-induced insulin-resistant mice.J Clin Invest 2008;118:789–8009. Vianey-Saban C, Guffon N, Delolne F, Guibaud P, Mathieu M, Divry P.Diagnosis of inborn errors of metabolism by acylcarnitine profiling in blood usingtandem mass spectrometry. J Inherit Metab Dis 1997;20:411–41410. Klingenberg M, Slenczka W. Pyridine nucleotide in liver mitochondria. Ananalysis of their redox relationships. Biochem Z 1959;331:486–517 [in German]11. Folch J, Lees M, Sloane Stanley GH. A simple method for the isolation andpurification of total lipides from animal tissues. J Biol Chem 1957;226:497–50912. Tubbs E, Theurey P, Vial G, et al. Mitochondria-associated endoplasmicreticulum membrane (MAM) integrity is required for insulin signaling and isimplicated in hepatic insulin resistance. Diabetes 2014;63:3279–329413. Vial G, Dubouchaud H, Couturier K, et al. Effects of a high-fat diet on energymetabolism and ROS production in rat liver. J Hepatol 2011;54:348–356
14. Vial G, Dubouchaud H, Leverve XM. Liver mitochondria and insulin re-sistance. Acta Biochim Pol 2010;57:389–39215. Batandier C, Guigas B, Detaille D, et al. The ROS production induced bya reverse-electron flux at respiratory-chain complex 1 is hampered by metformin.J Bioenerg Biomembr 2006;38:33–4216. Julienne CM, Tardieu M, Chevalier S, et al. Cardiolipin content is involved inliver mitochondrial energy wasting associated with cancer-induced cachexiawithout the involvement of adenine nucleotide translocase. Biochim Biophys Acta2014;1842:726–73317. Ren M, Phoon CK, Schlame M. Metabolism and function of mitochondrialcardiolipin. Prog Lipid Res 2014;55:1–1618. Paradies G, Paradies V, De Benedictis V, Ruggiero FM, Petrosillo G. Functionalrole of cardiolipin in mitochondrial bioenergetics. Biochim Biophys Acta 2014;1837:408–41719. Drahota Z, Palenickova E, Endlicher R, et al. Biguanides inhibit complex I, IIand IV of rat liver mitochondria and modify their functional properties. Physiol Res2014;63:1–1120. Lagace TA, Ridgway ND. The role of phospholipids in the biological activity andstructure of the endoplasmic reticulum. Biochim Biophys Acta 2013;1833:2499–251021. Borradaile NM, Han X, Harp JD, Gale SE, Ory DS, Schaffer JE. Disruption ofendoplasmic reticulum structure and integrity in lipotoxic cell death. J Lipid Res2006;47:2726–273722. Perry RJ, Kim T, Zhang XM, et al. Reversal of hypertriglyceridemia, fattyliver disease, and insulin resistance by a liver-targeted mitochondrial uncoupler.Cell Metab 2013;18:740–74823. Erion DM, Shulman GI. Diacylglycerol-mediated insulin resistance. Nat Med2010;16:400–40224. Perry RJ, Samuel VT, Petersen KF, Shulman GI. The role of hepatic lipids inhepatic insulin resistance and type 2 diabetes. Nature 2014;510:84–9125. Kumashiro N, Erion DM, Zhang D, et al. Cellular mechanism of insulin resistancein nonalcoholic fatty liver disease. Proc Natl Acad Sci U S A 2011;108:16381–1638526. Magkos F, Su X, Bradley D, et al. Intrahepatic diacylglycerol content isassociated with hepatic insulin resistance in obese subjects. Gastroenterology2012;142:1444–144627. Petersen KF, Shulman GI. Etiology of insulin resistance. Am J Med 2006;119(Suppl. 1):S10–S1628. Imoto K, Kukidome D, Nishikawa T, et al. Impact of mitochondrial reactiveoxygen species and apoptosis signal-regulating kinase 1 on insulin signaling.Diabetes 2006;55:1197–120429. Nishikawa T, Edelstein D, Du XL, et al. Normalizing mitochondrial super-oxide production blocks three pathways of hyperglycaemic damage. Nature2000;404:787–79030. Bobyleva V, Bellei M, Pazienza TL, Muscatello U. Effect of cardiolipin on functionalproperties of isolated rat liver mitochondria. Biochem Mol Biol Int 1997;41:469–48031. Lange C, Nett JH, Trumpower BL, Hunte C. Specific roles of protein-phospholipid interactions in the yeast cytochrome bc1 complex structure. EMBOJ 2001;20:6591–660032. Bazán S, Mileykovskaya E, Mallampalli VK, Heacock P, Sparagna GC, DowhanW. Cardiolipin-dependent reconstitution of respiratory supercomplexes from purifiedSaccharomyces cerevisiae complexes III and IV. J Biol Chem 2013;288:401–41133. Mileykovskaya E, Dowhan W. Cardiolipin-dependent formation of mito-chondrial respiratory supercomplexes. Chem Phys Lipids 2014;179:42–4834. Genova ML, Lenaz G. Functional role of mitochondrial respiratory super-complexes. Biochim Biophys Acta 2014;1837:427–443
2264 Insulin-Sensitizing Effects of Imeglimin Diabetes Volume 64, June 2015


![Pituitary Lesions, Obesity, and Mesenteric Lipomas in ... · insulin sensitivity via the insulin-modified, frequently-sampled intravenous glucose tolerance test (FSIGTT) [5].](https://img.pdfslide.us/doc/110x75/602099004fee671578648e12/pituitary-lesions-obesity-and-mesenteric-lipomas-in-insulin-sensitivity-via.jpg)