Embed Size (px)
Citation preview

MARCH 2016NIELSEN JOURNAL OF BUY TECHNOLOGY
A biannual look at recent developments
PERSPECTIVES on RETAIL TECHNOLOGY
VOLUME 1 • ISSUE 2 • OCTOBER 2016PERSPECTIVES ON RETAIL TECHNOLOGY
2
About PoRTNielsen Perspectives on Retail Technology (PoRT) is a biannual publication that tracks technology trends significant to retail. It has a rotating editorship of Nielsen experts who use each edition to showcase a major trend, such as big data, in a series of in depth articles. These are accompanied by a more diverse set of snapshots on trending or interesting topics.
Executive SponsorsKalyan Raman, Buy Chief Technology OfficerJeff Henry, SVP Technology Services
Commissioning EditorSaul Rosenberg, Chief Content Officer
Editor-in-ChiefIan Dudley
Guest EditorNeil Preddy
Managing EditorMichelle Kennedy
Associate EditorEve Gregg
ContributorsCesar Arocho, Principle Architect, Data IntegrationKarthik Ashokan, Emerging TechnologistSimon Douglas, Enterprise Architect, Technology ResearchJohn Naduvathusseril, VP TechnologyNeil Preddy, SVP Product LeadershipKen Rabolt, Solutions Leader, Data IntegrationKaren Worton, SVP Reference DataAlessandro Zolla, Retail Solutions Leader, Machine Learning
PERSPECTIVES ON RETAIL TECHNOLOGY
3
The digital revolution is changing shopping, transforming marketing and creating a vast array of new data sources. All that data gives us the opportunity to get to know consumers and shoppers like never before; we can know in great detail what they bought, get more clarity on why they bought it, and better understand how we can improve our products and marketing.
The sheer volume and variety of the data can seem overwhelming and our industry is wrestling with how to harness it all to find insights and drive action. So how do we do that?
This edition of Perspectives features articles on three closely connected enablers that will help us answer that question.
“Product Reference Data for Digital Business” outlines the key to understanding what the data is about and how to link different data sets together. Reference data is changing, and richer, standardized reference data can be a tremendous analytic resource.
“Wrangling Data in a Big Data World” discusses how data integration has advanced beyond the standardized, repeatable integration of a few key sources. It’s increasingly about meeting the needs of the citizen data scientist, who uses varied data to solve business problems.
“Humans in the Smart Machine Age” takes a closer look at machine learning and provides examples of how technology can give us the productivity we need, whether that’s scaling the capture of vast quantities of information or automating much of the data wrangling work so the data scientist can focus on finding meaning in the numbers.
At Nielsen we are investing in each of these areas. Enriched, normalized product reference data will help us unlock untapped analytic potential, for example in giving a deeper understanding of how innovation affects growth. Making data integration easier and more systematic is the key goal of Enrichment Studio, a critical utility in our Connected System. And machine learning is helping us to get all that product coding done quicker and more economically.
We are excited to share what we have learned on our journey. I hope you enjoy the articles and find them stimulating and helpful as you work through these questions in your own business.
Neil Preddy
FROM THE EDITOR
The sheer volume and variety of the data can seem overwhelming and our industry is wrestling with how to harness it all
to find insights and drive action.

4
HUB APPS & THE ART OF CONVERSATION
A year after Google and Apple first opened the doors of their app stores, they stocked 65,000 apps; less than a decade later, there are over 1.5 million apps to choose from. This explosive growth reflects a shift from software houses to citizen developers, and from large multi-functional programs to apps that do one thing supremely well. These days, whatever the problem, “there’s an app for that.”
The great strength of the app approach is also its weakness. An app store offers 30 times more apps than the largest supermarket has products. It’s no surprise that “app fatigue” has set in. Even if a user can find the app they need, they still have to download it, configure it and (most importantly of all) remember to use it before it gets lost in the mass of other apps already on their device.
The most frequently and universally used mobile apps are messaging and social media. It is no coincidence that these “destination” apps aspire to become fulfillment hubs for
all of a user’s needs: social interaction, news, shopping, transport and more. The hub provides a single interface to the back-end services for a myriad of companies (taxi firms, retailers, takeout restaurants, hotels, transport authorities and so on), eliminating the need to have hundreds of “apps for that” on a mobile device.
How will fulfillment hubs do their magic? The dominant user interface of the last two decades, the graphical user interface (GUI), works well for programs and apps; but a GUI is a closed system, and isn’t flexible enough to support the broad and constantly evolving range of interactions required of a hub. Fortunately there’s already an app for that: language. Companies such as Google, Facebook, Amazon and Apple are making big bets that the future of human-computer interaction is the conversational interface.
Conversational interfaces let a user perform tasks by chatting with their device using speech or text. They use a combination of natural language processing, artificial intelligence and machine learning to work out what the user wants to do and to learn from experience. Contextual
SNAPSHOTS
5
information such as the user’s location and contacts is also key, so requests like “send Mom some flowers” can be fulfilled without a long dialogue about who Mom is, where she lives, her taste in flowers and which florist to use.Conversational interfaces are already capable of carrying out simple commands (“turn on the TV”), though they can be less impressive when attempting more complex tasks. Ordering a pizza through a conversational interface can be more like sitting through a multiple choice exam than chatting with an artificial intelligence.
Nevertheless, things are bound to improve. The CPG industry is just coming to terms with e-commerce and the need for search engine optimization. If conversational commerce takes off, companies will need to prioritize conversation optimization instead, so they can ensure their brand is the one chosen when the user makes a generic request for a “taxi” or a “pizza.”
GEOLOCATION: VIRTUAL GETS (MORE) REAL
Jorge Luis Borges’ short story “On Exactitude in Science” describes a guild of cartographers so obsessed with representing every detail of geography that they create a map of their empire that is, by necessity, exactly the same size as the empire itself.
Philosophers have long insisted that “the map is not the territory”—in other words, we should not confuse models of reality with reality itself. The irony of Borges’ story is that the life-size map becomes reality and is lived in by animals and people, just like the real world.
The Internet of Things has created a rapidly growing army of devices capable of participating in location-based services. At the same time, locatable personal devices such as smartphones have become ubiquitous amongst many consumer groups. The Global Positioning System (GPS) used
by satellite navigation systems has been supplemented by technologies that are easier to customize and localize, such as Wi-Fi nodes and Bluetooth beacons, and these have been installed in areas of interest such as retail stores. In short, geolocation has become cheap, personal and pervasive. We are accelerating towards a point where, at least for location information, our virtual model of the world is as detailed and complex as the physical world itself.
It seems certain that the ability to superimpose the real and virtual worlds will drive innovation in the retail space. Even today it is relatively easy for a smartphone to remind you to pick up your prescription when you pass close to the pharmacy, or to turn down the thermostat when you drive away from your house.
One of the simplest uses of geolocation in retail is to send promotions to a customer’s smartphone when they enter a neighborhood, mall, store or even a particular aisle in a store. And because a consumer’s phone is individual, the offer can be personalized as well as hyper-local. That’s impressive, but the greatest value of geolocation is not in “Where’s Wally” apps, but in bringing the sort of advanced analytics that are easy to do in e-commerce to brick-and-mortar stores.
Geolocation makes it possible to record the number, frequency and length of customer visits to a store. This can be combined with exposure to online, print and billboard advertising to measure ad effectiveness. Metadata about shoppers can be used to segment them, and the retailer can analyze whether an offer brings people into the store, if the footfall results in more sales, and so on.
When geolocation comes of age, it will offer an unrivaled means of analyzing and influencing consumers on their path to purchase; the rewards—for both the seller and the consumer—are potentially huge. The only problem that will remain is ensuring salespeople don’t cross the line between helpful and creepy.
6
MEET WATSON, RESEARCH ANALYST A.I.
Bob Dylan likes to sing about machines: references in his songs range from the “doom machine” to the “heart attack machine” to how he “doesn’t want to turn into some machine.” But in a recent commercial featuring Dylan, a disembodied voice dissects his body of work, informing him that his lyrics focus on how time passes and love fades and how it would like to work with him on his next song. That voice belongs to the IBM artificial intelligence Watson, which is one of the best examples among many attempts to attain a utopian state of artificial intelligence: a machine that can think and learn over time, a technological version of enlightenment.
Watson might not be at the level of artificial intelligence that we see in science fiction or film, but it understands natural language, is able to learn from experience (after initial training) and can organize what it learns into a conceptual framework. In other words, it has the traits that in theory would allow it to interact intuitively with a human. Nielsen and IBM are working together to try to bring Watson’s capabilities into a solution that could combine structured and unstructured data, answering not just the “what” questions but also the “why.” To do this, Watson will need to ingest large volumes of structured Nielsen data, train itself on the data, and define ontologies and user “intents” (the type of questions that would be asked by the user) along the way. Unstructured and semi-structured data, such as Twitter, econometrics and weather, could be combined with Nielsen’s structured data to allow Watson to learn the influences on the distribution and consumption of consumer goods.
Imagine a world where the market research analyst either types or speaks a question in their own vernacular and starts a dialogue with Watson. To better understand how a specific brand is performing, for example, the analyst might ask which stores are still showing good results despite a decline in overall performance across the country. Watson could then provide an overlay of how social media correlates with the brand performance, citing negative sentiments on Twitter as
examples. All of this happens in a seamless dialogue with various supporting visualizations ranging from graphs to geographical maps to simple tabular data, as appropriate.
Occasionally Watson might ask questions to clear up any ambiguity in how the question was phrased or because there was an intent it had not learned. Most importantly, it would catalog that new intent for future reference, growing its intelligence. With an ever-expanding knowledge base, it will eventually find bits of information that the human user did not think to ask about or even knew existed—and come another step closer to that elusive utopian state of artificial intelligence.
THE DEATH OF THE PASSWORD?
When public clouds first emerged, there was a lot of skepticism about the security of these environments. In response, cloud providers enabled their customers to configure sophisticated security policies and access controls, and to create virtual private clouds. After the initial misgivings, these state-of-the-art capabilities forged a consensus that the best cloud environments are at least as secure as on-premise data centers, if not more so.
But the cloud has not eliminated security problems entirely. Any system is only as secure as its weakest link. Cloud platforms, just like on-premise systems, need to be accessed and controlled by users, who are typically armed with only a username and password.
It is remarkable, given recent advances in technology, that usernames and passwords are still our primary authentication mechanism. Most users have an estimated 100 or more password-protected accounts, and that number continues to climb. Some users will make sure they choose a unique password for each of their accounts and use a password manager, which they carefully secure, to keep track of them. But faced with a multiplicity of log-ins, many users endlessly recycle passwords and use sticky notes as their database.
7
a confidence level. If the confidence level is too low for the importance of the task the user wants to undertake, the Trust API can ask for further authentication through biometrics or a password.
BRINGING BACK OF PACK TO FRONT & CENTER
Market research has traditionally concentrated on analyzing sales: identifying trends and diagnosing their root causes. With the advent of advanced analytics and big data there’s an increasing interest in predicting and prescribing sales behavior; it is ultimately still all about product sales.But our current culture begs the question: Why aren’t we more concerned about analyzing the products themselves?
Products and their packaging have come under increased public and government scrutiny recently. The most obvious example is cigarettes: legislation in several countries has evolved from cigarette packs with warnings on them to packs with horrific pictures of smoking-related illnesses, and culminated in plain packaging with no branding at all.
Legislation mandating that nutrition facts must be on labels, as well as prominent on-pack indicators for major health markers such as salt, sugar and fat, is even more common. There have been calls for labels to show how much exercise would be needed to burn off the calorie content of the food inside. In order to “create and promote healthier food choices,” the global food manufacturer Mars is updating the information on its website to distinguish between everyday products and products that are only for “occasional” consumption because of their salt, sugar or fat content.1
Product information is ripe for analysis, and many in the consumer packaged goods industry are aware of this potential. Some retailers are looking to analyze their inventory to understand, for example, the split between everyday and occasional products so they can tailor inventory to their shoppers’ needs and their corporate values. And with an increasing proportion of millennial shoppers who are
Multi-factor authentication has been around for a while and provides a partial solution to this problem: in order to login, a user needs to enter both their password and a one-time-use code generated by an application on their mobile device or delivered by SMS.
This type of multi-factor authentication is only a partial solution to the problem, however. The value of IT is its ability to make life easier for users, whereas many of the currently popular security practices seem to make life harder: frequently changed and hard-to-remember unique passwords, multi-step log-in processes and separate security devices or apps. All of these seem designed to infuriate users rather than empower them—a clear sign that the technology is heading in the wrong direction.
There is growing evidence that companies are learning this lesson; the increasing use of fingerprint and facial recognition as a means of authentication on mobile devices is one indication. Google has already rolled out their reCAPTCHA technology, which analyzes the way a user interacts with a checkbox to reliably determine whether that user is a human or a bot. Other vendors want to use patterns of user interaction, such as speed and rhythm of typing, as personal identifiers. Looking further ahead, companies are investigating combining multiple unobtrusive authentication mechanisms, including biometrics such as face shape and voice recognition, with the way you interact with your device by typing and swiping. Taken individually these factors are not a reliable means of identification; the facial recognition software built in to many Android phones is significantly less accurate than a fingerprint scanner. However many believe that combining multiple weak identity indicators could provide considerably more accurate authentication than a single strong indicator, such as a fingerprint.
Google is investigating this approach with its Trust API, which it is testing with several financial institutions—an indication of the potential of the approach. The API is interesting because rather than giving a yes or no response to whether the user is the person they claim to be, it provides
1 http://www.bbc.co.uk/news/uk-36051333

8
health-conscious, environmentally responsible, and want to understand what they are eating, “back of pack” information is becoming increasingly important. The same information can also fuel innovation, helping manufacturers spot trends or gaps in the market based on ingredients, packaging, health claims, flavors and more.
Product information is also the foundation of B2C shopping personalization platforms like Chuze and Mobify. These platforms let users keep a shopping list that they can easily maintain, for example by snapping a picture of an empty carton. The experience is enriched by connecting product information to sales and directing the consumer to the nearest store selling the item they want.
Sales data will remain the foundational measure of market research, but digital commerce will continue to broaden the variety of data needed to give a 360-degree, past, present and future view of a brand. Historically underrated product information will be an important part of that picture.
COMING SOON TO A CITY NEAR YOU
In a few years, it’s likely that every streetlight in a major city will have its own IP address. Technology companies see Internet-enabling streetlights as a first step to integrating cities into the digital world: streetlights are ubiquitous, are connected to the power grid, and have a bird’s-eye view of the street below. Equipping them with sensors both helps save energy (by ensuring they only light up when a person or vehicle approaches) and allows them to monitor traffic flow and parking spaces. A city management system that had access to this data would be able to optimize rush hour traffic.
But smart cities are about much more than streetlights—the game plan is to connect and measure every aspect of city life from utilities and buildings to streets and citizens. There are experimental investments in smart cities across the globe, and the reason is obvious: combining real-time data from omnipresent sensors with machine learning and advanced analytics has the potential to revolutionize the way cities
operate—by improving asset utilization, reducing waste, controlling pollution, responding to the weather, dynamically pricing assets such as parking spaces, and much, much more.
For the consumer, it’s likely that the smart city will further blur the distinction between their online and offline worlds. Connected personal devices, such as mobile phones, will have an infinite number of touchpoints with the city, generating a vast amount of data about the consumer’s behavior and preferences. The smart city could be another factor in driving the move away from consumers buying products to buying services. This move can be seen in the home, where a trip to the store to buy laundry detergent is being replaced by technologies such as the Amazon Dash button, which automate replenishment for the consumer. In an equivalent out-of-home experience, the smart city would alert a retailer that a customer’s parking ticket was about to expire, allowing the retailer to warn the customer or even pay to extend their parking so they could complete their purchase.
Smart cities have the potential to affect many areas of life; within the retail space alone, there is huge potential for revolutionary changes that would benefit the consumer, retailer and manufacturer alike. In the short-term, however, the stumbling block is the Internet of Things, which is not yet mature and consists of a set of walled gardens belonging to different manufacturers. Industry standards and protocols are needed to connect walled gardens into a single, logical ecosystem. At the same time, the issues of data security, privacy and ownership need to be addressed to the full satisfaction of consumers. Once this is achieved, it will be possible to create an Internet-of-Things data marketplace. Of course the full potential of the data will be driven by the analytics running on top of it, but it will be a start.
This Internet-of-Things data marketplace would make it possible to extend customer service: spotting potential failure early, initiating a product recall, offering new products or services, replenishing stock and more. Smart cities are yet another aspect of the Internet of Things that is inexorably shifting the focus away from selling products to selling services and experiences.
9
PRODUCT REFERENCE DATA FOR DIGITAL BUSINESSThe world used to be simple: stores were buildings made of
bricks and mortar that sold an inventory of a few thousand
products during regular business hours. The software needed
to run the store wasn’t quite so simple: it comprised multiple
independent systems (for warehousing, distribution, electronic
point of sale and so on), each with its own view of a product
determined by the task it performed. Harmonizing and
reconciling these different views wasn’t trivial, but it wasn’t
rocket science. Innovations, such as the universal product code,
machine readable barcodes and RFID1 tags, combined with
enterprise resource planning and master data management
software helped enormously. By the end of the 20th century, the
operations of many retailers were so streamlined that they were
able thrive on razor-thin margins. It was difficult to imagine how
retailing could be made more efficient.
The digital revolution changed all that. E-commerce retailers
created Web shops that were open 24 hours a day, seven
days a week. Consumers quickly embraced the convenience
of e-commerce—in 2015 over 15% of discretionary spend in
the U.S. was through online shopping,2 and the proportion
continues to grow. Traditional retailers had no option but to
open e-commerce Web sites and provide e-commerce apps.
These operations were often in a business unit separate from
the brick-and-mortar stores, and consequently had their own
product master data with a new set of product information
to be reconciled. In the past, a lack of harmonization
was only a frustration for the retailer; in the digital world,
inconsistencies in product information are immediately
visible to the customer. Shoppers quickly came to expect a
seamless omnichannel experience, in which products are
1 Radio frequency identification. 2 “US E-Commerce Holiday Spend Will Reach $70B, Mobile Booms As ...” 2015. 22 Sep. 2016
IN FOCUS
10
so on) are constantly being introduced. The fast-moving
consumer goods category alone adds over 300,000 new
products a month worldwide, with 2.5 million more products
showing some form of evolution.5 These changes all need to
be reflected in updated product information.
Product coding has to be carefully curated to ensure that
product information is standardized, complete, of high
quality and useful to the business. This has traditionally been
a resource-intensive clerical activity that can only be done by
subject matter experts.
Because clerical product coding depends on scarce expertise,
slow-moving goods are often coded to a limited degree of
detail; for example, a golf club might be identified as simply
“sporting goods”. This was acceptable when advertisements
could only be targeted by age and gender demographics:
demographics and “sporting goods” are at a broadly similar
level of granularity. Now, personal mobile devices make it
possible to tailor advertisements to the individual consumer.
It’s no longer good enough to know that a consumer
purchases “sporting goods”—it’s critical to know that he
buys golfing equipment and shows no interest whatsoever in
football. In short, the bar for the amount of detail required to
code a product just got raised across the store.
The product coding problem in an e-commerce environment is
multiple orders of magnitude larger than in brick-and-mortar retail.
described and identified identically in-store, online, in a
mobile app and in proximity-driven promotions delivered
direct to their smartphone.
Retailers are working hard to ensure the issue of duplicate
master data management is a controlled and diminishing
one. Unfortunately that’s the smallest and most tractable
problem faced by the technologists responsible for managing
product reference data in the retail space.
PRODUCT INFORMATION IN AN E-COMMERCE WORLD
The biggest problem reference data management faces in a
digital economy is the sheer number of products that need to
be curated.
As well as providing 24x7 shopping, e-commerce retailers
are able to offer a huge inventory of products in endless
aisles. They aren’t limited by their capacity to build and
stock physical stores in multiple locations; they fulfill orders
from a small number of warehouses or even direct from the
manufacturer. A small brick-and-mortar consumer goods
retailer has an inventory of about 5,000 products; a Walmart
supercenter tops out at about 142,000 products.3 In contrast,
Amazon’s inventory in the U.S. exceeds 480 million products.4
The product coding problem in an e-commerce environment
is multiple orders of magnitude larger than in brick-and-
mortar retail.
Not only is the number of products to be coded huge, they
don’t stand still. Products are evolving faster than ever
before (“new and improved”, “best recipe ever”), and new
product characteristics (low salt, organic, low fat, no artificial
ingredients, sustainable, low environmental impact and
3 “Our Retail Divisions - Walmart.” 2015. 3 Oct. 2016. 4 “(2015) How Many Products Does Amazon Sell? | ExportX.” 2015. 15 Aug. 2016 5 According to Nielsen metrics
11
The volume and rate of change of products that need to be
coded, along with the level of granularity at which they must
be coded, means that the clerical methods of maintaining
product reference data that worked well for traditional retail
cannot scale to e-commerce; they are too costly and too slow.
RICH PRODUCT INFORMATION
The product master data challenge in the digital world is not
only a matter of the volume and rate of change of product
information, but also its richness. The barcodes, textual
descriptions and characteristics that served the industry well
for the last 25 years are still necessary, but no longer sufficient.
Consumers buying online want a 360-degree view of the
product they are purchasing. Who is going to buy a $500 TV
with a detailed text description of its specifications, if they
can get an equally trusted brand for the same price that they
can view from four angles, study the inputs and outputs
visually, and watch a video offering additional information
about the model? We also know that consumers today are
interested in the nature and provenance of their food as never
before, looking for descriptors like “organic,” “sustainable,”
and “vegetarian.” Depending on the type of product, they
may also expect to find FAQs, instructions, technical
specifications, awards, recipes, reviews and more. To be fit for
purpose, product reference data needs to encompass all of
this information.
For international companies, product descriptions need to
be in multiple languages and recognize differences in culture
and laws. In addition to geographic differences, the defining
characteristics of a product vary depending on whether you are
manufacturing, warehousing, distributing, marketing, retailing
or purchasing it. These different views need to be reconciled
and integrated. Attempting to apply a single view across the
product lifecycle—most frequently the one used by the finance
department—does not work. Not only does product data have
to be richer, but to be universally applicable it has to support
many different views of the same thing.
SILOED AND INCOMPLETE PRODUCT INFORMATION
This is enough of a headache already. But product information
is not simply developed and maintained to support sales; it
is crucial for analyzing how the product is performing, most
especially in comparison to its competitors.
Manufacturers maintain the master data for the products
they create, and can do this better than anyone else. Similarly,
retailers maintain master data for the products they stock,
though they need help from manufacturers to ensure that the
data is accurate, complete and up-to-date.
The problem is that product information is siloed between
organizations that need to interoperate to be successful. For
the purposes of analysis, it also needs to be complete. But,
for obvious reasons, most retailers and manufacturers focus
only on the products they sell or make. This means that they
have product data that is great for monitoring their internal
processes, but cannot be used to compare their performance
against other brands or external benchmarks, or for product
innovation.
The barcodes, textual descriptions and characteristics that served
the industry well for the last 25 years are still necessary, but
no longer sufficient.
12
BIG DATA SOLUTIONS TO BIG PRODUCT REFERENCE DATA
It’s clear that product reference information has the same
volume, variety and velocity problems that big data has. The
good news is that a lot of effort has gone into solving big data
problems, and it’s possible to repurpose these solutions for
product reference data. Big data has taught us that we need
to use techniques that don’t rely on subject matter experts
and, wherever possible, don’t rely on humans at all—or at
least only for exception processing.
Web scraping—downloading the public content of Web
sites—can be used to collect unstructured or semi-structured
product information from e-commerce and other sites.
Machine learning algorithms can parse the scrapes and create
an inventory of structured product descriptions. Although it is
often incomplete or inconsistent, e-commerce Web site data
is generally accurate because poor data compromises sales.
Information provided by small-time resellers on marketplace
sites can be low-quality and, in exceptional circumstances,
intentionally misleading (though the marketplace owners try
hard to ensure this does not happen). Choosing appropriate
targets and maintaining quality control are therefore critical.
But, if used correctly, Web scraping is a good way to gather a
large amount of product information quickly and cheaply.
Another source of product information is the crowd. While
this approach goes against the “don’t use humans” mantra,
it removes the subject-matter-expert bottleneck and delivers
a Web-scale process. A number of marketplaces allow
businesses to harness the crowd to perform tasks that
computers are currently unable to do; the most well known
example is Amazon Mechanical Turk (AMT) Members of
the crowd are not product marketing experts, but they are
experienced consumers who provide a cost-effective way of
recording the product information on a packet. This raw data
is not usable as is, except for data discovery; it needs to be
curated and enriched. For example, subject matter experts
place a product in a manufacturer’s own view of a market,
or match an on-pack claim of “healthy” against a definitive
ingredients list and appropriate guidelines, such as those
from the U.S. Food and Drug Administration (FDA). Despite
its limitations, crowdsourcing can go where machines cannot
(yet) reach, and can do so at Web-scale and reasonable cost.
In circumstances where they are effective, smart machines
should be used. E-commerce listing processes require images
of a product (often multiple ones)that are subsequently
published online. There are a lot of product images
available from a variety of sources, and the opportunities
for automated image matching (“have we seen this product
before?”) and recognition (extracting product logos, barcodes
and branding from a picture) are obvious. The simple next
step is to perform optical character recognition on the image
components, then cross-reference the extracted text against
existing product master data to generate a new product
coding or suggest an amendment to an existing product.
Another thing we’ve learned from big data is to ensure
that data is fit for purpose, but no more—even a small,
incremental effort can be very costly on big data sets.
Traditionally, product reference data has been coded to a gold
standard of completeness and quality. In the digital world, it
makes sense for product coding to be more pragmatic and
concentrate on providing content that is fit for use in the
current context at just the right time. For their part, analysts
should match the data’s level of curation to their analysis,
optimizing speed, quality and completeness depending on
their need; raw, uncurated product data might be appropriate
for data discovery and product innovation purposes, whereas
fully curated data would be needed to create a sales report for
Wall Street.
Finally, big data experience tells us that things change quickly
and unpredictably. Until machine intelligence advances
to the point that capturing and coding additional product
information is essentially cost-free, it makes sense to curate
only the product information of interest and relevance.
13
However it also makes sense to save the raw categorized
product information, captured from Web scrapes, the crowd,
product images or elsewhere, so that it can be mined for
additional information should priorities change. This would
avoid triggering a potentially expensive data collection event,
along with the latency involved.
PRODUCT INFORMATION GOVERNANCE
Walmart has a visionary program to create its own product
catalog that will include not only the products that they
sell, but products they do not sell as well as products from
manufacturers they do not currently work with.6 If fully
populated, such a catalog might provide a Rosetta Stone
capable of integrating a broad spectrum of omnichannel data
on the product dimension. It’s not clear if this approach will
be generally adopted by retailers.
For organizations that do not want to do everything for
themselves, there are a number of bodies that curate
comprehensive standards for the classification of products.
Most notable are GS1, which maintains standards for
supply-and-demand chains across several sectors, and
the United Nations Standard Products and Services Code
(UNSPSC), a taxonomy of products and services for use
in e-commerce. In the case of GS1, product coding is the
responsibility of the company that adopts their standards,
which is often a consumer packaged goods manufacturer.
GS1 has a data quality program to ensure the correct
application of the standards, but their operating model does
not prevent different manufacturers from applying standards
inconsistently. The increasing adoption of e-commerce
(which will make inconsistency visible to consumers) seems
likely to drive standards adherence and reinforce data quality
initiatives.
Another possible source of product information that crosses
organizational silos are the product listing brokers, such as
Brandbank (a subsidiary of Nielsen), Gladson and Salsify.
Manufacturers that want to list products with retailers need
to provide the retailer with master data for these products.
As discussed previously, in an e-commerce world this
includes standardized media, such as photographs and 3D
views, as well as textual information. Individual retailers
need consistent information across all of their products
(for example, photos of the same size and resolution),
but different retailers have different requirements. The
brokers came into existence to help solve this problem of
managing diverse product information requirements across
different retailers. Brokers also help reconcile the many-to-
many relationships between retailers and manufacturers: a
manufacturer will list its products with many retailers and a
retailer will list products from many different manufacturers.
Brokers have product information spanning multiple retailers
and manufacturers, but only for their own client base;
their business model does not support sourcing product
information from companies that are not signed up. These
brokers are undoubtedly a vital component of the product
reference solution, but they are not a complete answer.
THE FUTURE OF PRODUCT INFORMATION MAINTENANCE
Product reference information exists not just for consumer
marketing purposes, but so that the behavior of products can
be analyzed. To do that in a digital environment, being able to
connect myriad big data sets containing product information
is vital. With endless aisles, rapid product evolution and
a multiplicity of different views of the same products, it’s
impossible for a single retailer or manufacturer to gather and
6 “The Walmart Wakeup Call: “High Quality Product Data is a Must ...” 2015. 15 Aug. 2016
14
maintain a comprehensive set of product reference data—
they have no incentive to do this outside of their area of
interest.
Nor is there a revenue driver that would encourage any of the
current third-party providers of product information to step
up and provide a comprehensive product registry for digital
business.
One possible solution to this impasse would be a standards-
based collaboration to create foundational reference data for a
broad span of products. Broadening the pool of contributors,
and allowing them to contribute in their areas of product
expertise, should greatly increase the reach, completeness and
accuracy of the data gathered. The curated data would be open
source and could be used freely to connect big data sets at
no cost. The basic product attributes available would support
simple, generic analysis of integrated data.
However, an open-source approach could not deliver the
rich, customized, high quality product reference data that
is available in the fast-moving consumer goods space, for
example—the cost of creating this data would be prohibitive,
with no obvious compensating revenue opportunities in
an open-source environment. A more likely scenario is that
enriched product information designed to support analytics,
for example, and customized to the requirements of a
particular business would be provided by third parties as a
paid-for snap-on to the foundational, open-source product
reference data.
The retail industry has known for some time it must come
to terms with the volume, variety and velocity of big data in
the digital world. Now it must also come to terms with the
volume, variety and velocity of product reference data. It will
be interesting to see if the model of proprietary enhancement
atop an open-source foundation that has been successful in
big data software works for product reference information, or
if some wholly new solution arises.
15
WRANGLING DATA IN A BIG DATA WORLDprofitability. After several iterations he has a plan that should
recover the brand share, which he sends to Luke for approval.
Luke approves the plan, and his digital assistant makes a note to
monitor the situation and report progress.
Digital assistants and smart machines are amazing
technologies, but it’s the ability to integrate data (sales,
shipments, weather, promotions, financials and so on) that
allows a scenario such as this to play out.
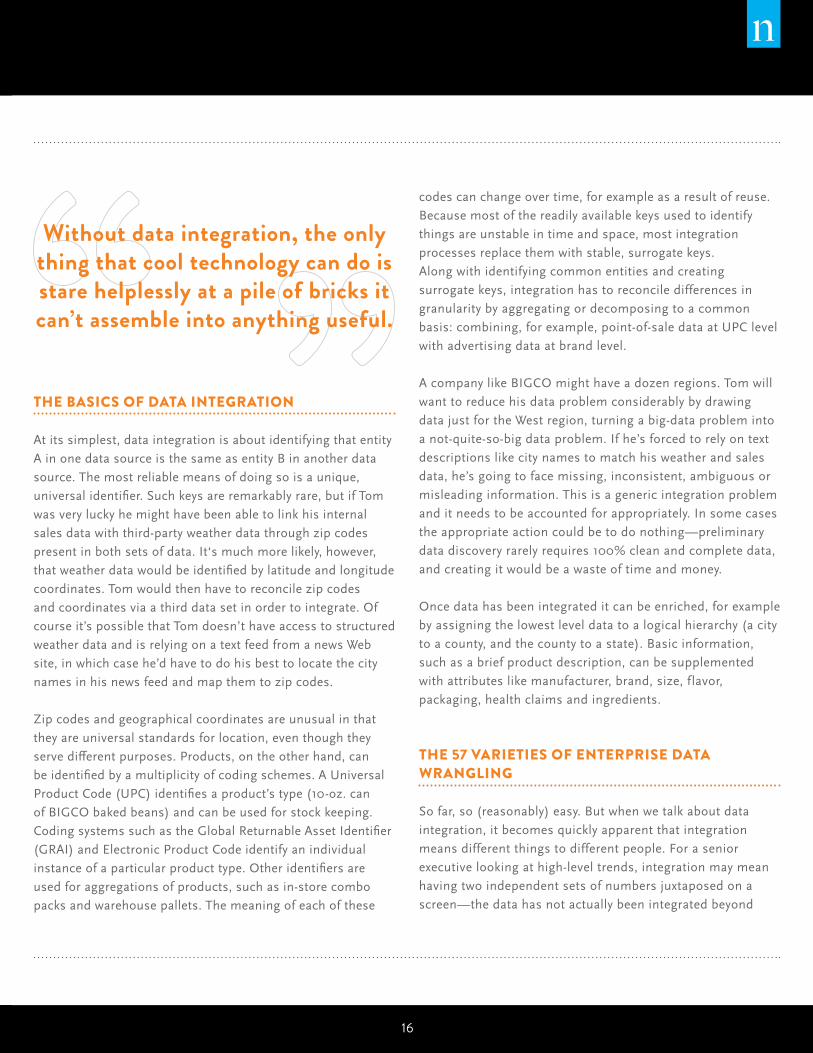
Without data integration, the only thing that cool technology
can do is stare helplessly at a pile of bricks it can’t assemble
into anything useful.
And increasingly, business insights come from combining
internal data with a multiplicity of external data sources, such
as census and econometric data, market research, social
media and more.1 Data integration is the critical, foundational
capability for digital business in a big data world.
It’s Monday morning and Luke, the BIGCO Brand Manager,
walks into his office. While waiting for his laptop to power up,
he asks the digital assistant device on his desk how BIGCO’s
Acme brand performed over the weekend. After a second, the
digital assistant replies that Acme’s share of sales has fallen
by 0.5% compared to the same period last year. Luke asks
what’s driving the decrease, and is told that it’s due to pricing
and promotion issues in the BIGCO West region. His digital
assistant offers to email Tom, the Sales Manager for the West
region, with a summary of their findings.
Two hours later in California, Tom uses the link to the analysis
to drill down into the root cause of the problem, combining
competitors’ sales data with BIGCO’s shipment data. After he
blends in third-party data, such as weather and econometrics,
it looks as if failure to promote Acme during prolonged periods
of good weather is a contributing factor. Tom has Acme’s net
revenue and gross margin data at his fingertips, and he’s able
to simulate the effect of various promotions on brand share and
1 “The Unstoppable Rise Of Enterprise Data Clouds - Forbes.” 2015. 15 Aug. 2016
16
WRANGLING DATA IN A BIG DATA WORLD
THE BASICS OF DATA INTEGRATION
At its simplest, data integration is about identifying that entity
A in one data source is the same as entity B in another data
source. The most reliable means of doing so is a unique,
universal identifier. Such keys are remarkably rare, but if Tom
was very lucky he might have been able to link his internal
sales data with third-party weather data through zip codes
present in both sets of data. It‘s much more likely, however,
that weather data would be identified by latitude and longitude
coordinates. Tom would then have to reconcile zip codes
and coordinates via a third data set in order to integrate. Of
course it’s possible that Tom doesn’t have access to structured
weather data and is relying on a text feed from a news Web
site, in which case he’d have to do his best to locate the city
names in his news feed and map them to zip codes.
Zip codes and geographical coordinates are unusual in that
they are universal standards for location, even though they
serve different purposes. Products, on the other hand, can
be identified by a multiplicity of coding schemes. A Universal
Product Code (UPC) identifies a product’s type (10-oz. can
of BIGCO baked beans) and can be used for stock keeping.
Coding systems such as the Global Returnable Asset Identifier
(GRAI) and Electronic Product Code identify an individual
instance of a particular product type. Other identifiers are
used for aggregations of products, such as in-store combo
packs and warehouse pallets. The meaning of each of these
codes can change over time, for example as a result of reuse.
Because most of the readily available keys used to identify
things are unstable in time and space, most integration
processes replace them with stable, surrogate keys.
Along with identifying common entities and creating
surrogate keys, integration has to reconcile differences in
granularity by aggregating or decomposing to a common
basis: combining, for example, point-of-sale data at UPC level
with advertising data at brand level.
A company like BIGCO might have a dozen regions. Tom will
want to reduce his data problem considerably by drawing
data just for the West region, turning a big-data problem into
a not-quite-so-big data problem. If he’s forced to rely on text
descriptions like city names to match his weather and sales
data, he’s going to face missing, inconsistent, ambiguous or
misleading information. This is a generic integration problem
and it needs to be accounted for appropriately. In some cases
the appropriate action could be to do nothing—preliminary
data discovery rarely requires 100% clean and complete data,
and creating it would be a waste of time and money.
Once data has been integrated it can be enriched, for example
by assigning the lowest level data to a logical hierarchy (a city
to a county, and the county to a state). Basic information,
such as a brief product description, can be supplemented
with attributes like manufacturer, brand, size, flavor,
packaging, health claims and ingredients.
THE 57 VARIETIES OF ENTERPRISE DATA WRANGLING
So far, so (reasonably) easy. But when we talk about data
integration, it becomes quickly apparent that integration
means different things to different people. For a senior
executive looking at high-level trends, integration may mean
having two independent sets of numbers juxtaposed on a
screen—the data has not actually been integrated beyond
Without data integration, the only thing that cool technology can do is stare helplessly at a pile of bricks it can’t assemble into anything useful.
17
being placed in a side-by-side view. An analyst responsible for
modeling promotions, by contrast, may well be working with
quite a few independent data sets that she has integrated
completely and accurately, and supplemented the basic
data about items with additional attributes. This distinction
between levels of precision is very important. Tom, who is
trying to figure out why Acme’s share fell, can do effective
work with broad-brush, “good enough” data integration that
would never work for detailed modeling.
It’s not only the final deliverable that’s important, it’s how
you get there. Is a user willing or able to wait for data to
be integrated? An automated trading program requires
instantaneous data integration, but an annual report to Wall
Street needs accuracy far more than speed. Is it important
for the user to be able to do self-service data integration, or
can they wait until the data warehouse team has prepared the
data for them? The different meanings of “integration” are
seemingly endless.
DATA WRANGLING FOR DIGITAL BUSINESS
The traditional gold standard for data integration is the
extract, transform and load (ETL) process associated
with relational databases. ETL provides a repeatable,
automated, high-quality process with precisely defined
outcomes. Although its inability to handle big data has
made it unfashionable, ETL is often the best way to curate
long-lived, high-value data assets such as those held in
traditional enterprise data warehouses. These assets are used
in routine business processes that require standardization,
accuracy, and consistency over time: dashboards and KPIs
seen by the C-suite, and the top-line reports used by the
heads of Marketing and Sales to run their departments.
Standardization is critical, as it allows everyone in the
enterprise to speak the same language. The fact that a broad
span of data has been pre-integrated means that it is easy
and quick to drill down into the detail when exceptions and
anomalies inevitably arise.
ETL has a long set-up phase during which the integration
process is defined, and requires software development
support for implementation. It puts into effect repeatable,
operationally robust processes and enterprise-class data
governance. However, there is a significant ongoing
maintenance cost to incorporating new and changed data in
the ETL process, and it takes time to do it.
Yet another reason traditional data warehouses running a
standard ETL process are not sufficient is digital business’
critical need for discovery—finding out what you don’t know
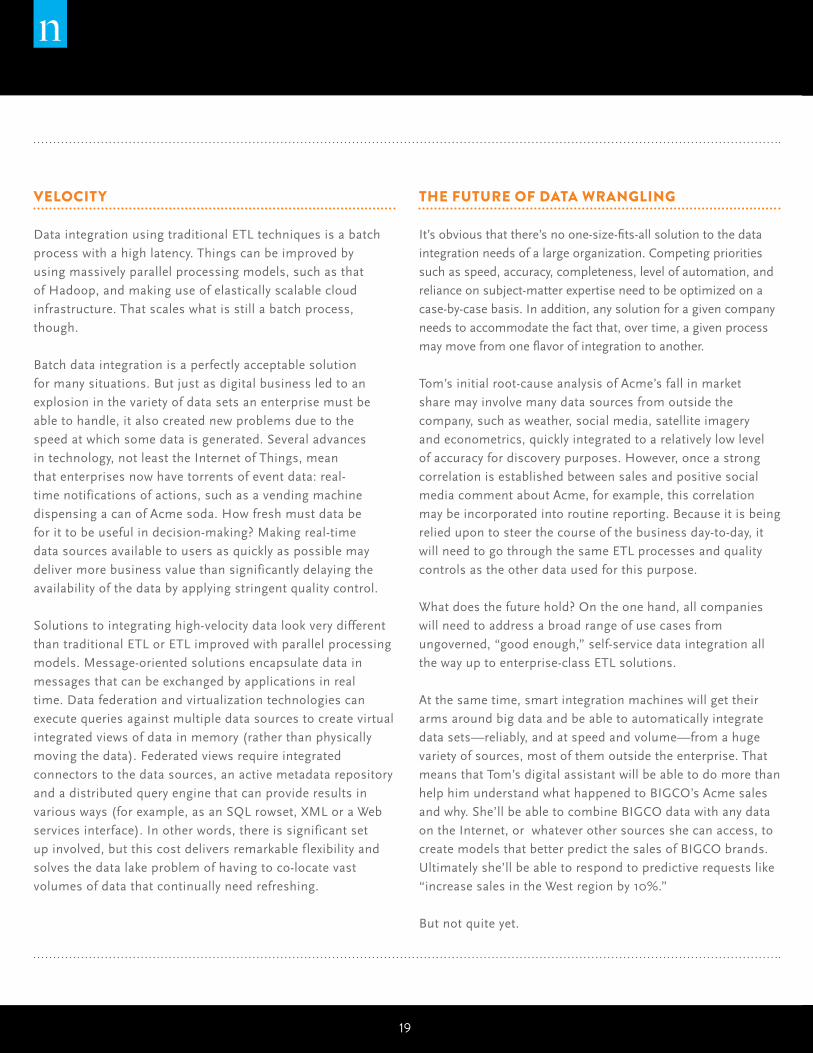
you don’t know is key to success in today’s world. There are
a huge number of data sources available for discovery, most
of which come from outside the enterprise. It’s impossible to
know in advance which of them will be relevant to a particular
exploratory analysis. There’s a need for lightweight, “good
enough” data integration that allows the data scientist to
experiment.
To best understand today’s data wrangling needs, it’s useful
to discuss it within the framework of the three definitional
components of big data: volume, variety and velocity.
There are a huge number of data sources available for discovery,
most of which come from outside the enterprise. It’s impossible to know in advance which of them will be relevant to a particular
exploratory analysis.
18
VOLUME
Traditional ETL tools require subject matter experts and
programmers trained in their use. Because of these bottlenecks,
MIT estimates that ETL can scale effectively to integrate a few
dozen data sources at best.2
Big data is named for its volume, and it simply isn’t possible
to wrangle this volume using expert-intensive processes. Data
visualization tools have partially addressed the problem by
putting self-service tools in the hands of general business users.
These allow users to quickly sculpt data sets into a usable
format, but they often sacrifice rigor (repeatability, data lineage,
etc.) for simplicity and usability. And they are clerical tools that
are limited to human scale.
It’s generally accepted that the solution to the volume problem is
to invert the ETL architecture: instead of providing a human with
the tools to craft an integration process, provide an automated
data integration system that asks a human if it can’t figure
out what to do. A machine learning program, with basic data
integration heuristics and some training data, can be given two
data sets to integrate. It won’t do a very good job, but it will learn.
As it’s given more and more data sets to integrate, it will identify
synonyms in the data and develop its own formal classification
in terms of types, properties and relationships. Smart machines
use a combination of machine learning and statistical best-
fit mapping to align and harmonize data sets, outputting
exceptional data to be reviewed and investigated by humans.
This approach removes the bottleneck caused by the availability
of human expertise. The technical problem of scaling (for
example, the availability of servers) is solved by the elastic
computing power of the cloud and by integration platform as a
service (iPaaS) products.
VARIETY
Traditional ETL is strongly oriented towards integrating
data in relational databases, and to a lesser extent text files
and Excel. Big data has unleashed a huge variety of data
formats including Hadoop, NoSQL, Graph databases, key
value stores, messages, logs and documents in a variety of
formats, including XML and JSON. There is also a multiplicity
of standard formats for data and message interchange like
AVRO and EDI. Data is also available through interfaces such
as services, APIs and RESTful interfaces.
Modern integration tools cater to all of the most common big
data sources, but the overwhelming diversity of data sources
means that individual tools have gaps.3
In addition to these predominantly (but not exclusively)
text and number stores, map-related information, images,
videos and sound recordings are increasingly important. For
example, Tom may want to use satellite images to incorporate
traffic volumes by daypart into his analysis, or to look for a
correlation between sales and the number of vehicles parked
near beaches or parks. Publicly available data, such as park
visitor counts and concession sales, could be co-analyzed
with internal data about sales by area.
The tools to integrate these rich data types with numeric
information (for example watermarking video and audio to
make it identifiable), as well as to extract information from
video and satellite imagery, already exist. But these tools
don’t yet function at the scale and speed needed for big data
integration.
2 “MIT Professional Education Tackling the Challenges of Big Data ...” 2015. 17 Aug. 2016
3 “CIO Call to Action: Shake Up Your Integration Strategy to ... - Gartner.” 2015. 26 Aug. 2016
19
VELOCITY
Data integration using traditional ETL techniques is a batch
process with a high latency. Things can be improved by
using massively parallel processing models, such as that
of Hadoop, and making use of elastically scalable cloud
infrastructure. That scales what is still a batch process,
though.
Batch data integration is a perfectly acceptable solution
for many situations. But just as digital business led to an
explosion in the variety of data sets an enterprise must be
able to handle, it also created new problems due to the
speed at which some data is generated. Several advances
in technology, not least the Internet of Things, mean
that enterprises now have torrents of event data: real-
time notifications of actions, such as a vending machine
dispensing a can of Acme soda. How fresh must data be
for it to be useful in decision-making? Making real-time
data sources available to users as quickly as possible may
deliver more business value than significantly delaying the
availability of the data by applying stringent quality control.
Solutions to integrating high-velocity data look very different
than traditional ETL or ETL improved with parallel processing
models. Message-oriented solutions encapsulate data in
messages that can be exchanged by applications in real
time. Data federation and virtualization technologies can
execute queries against multiple data sources to create virtual
integrated views of data in memory (rather than physically
moving the data). Federated views require integrated
connectors to the data sources, an active metadata repository
and a distributed query engine that can provide results in
various ways (for example, as an SQL rowset, XML or a Web
services interface). In other words, there is significant set
up involved, but this cost delivers remarkable flexibility and
solves the data lake problem of having to co-locate vast
volumes of data that continually need refreshing.
THE FUTURE OF DATA WRANGLING
It’s obvious that there’s no one-size-fits-all solution to the data
integration needs of a large organization. Competing priorities
such as speed, accuracy, completeness, level of automation, and
reliance on subject-matter expertise need to be optimized on a
case-by-case basis. In addition, any solution for a given company
needs to accommodate the fact that, over time, a given process
may move from one flavor of integration to another.
Tom’s initial root-cause analysis of Acme’s fall in market
share may involve many data sources from outside the
company, such as weather, social media, satellite imagery
and econometrics, quickly integrated to a relatively low level
of accuracy for discovery purposes. However, once a strong
correlation is established between sales and positive social
media comment about Acme, for example, this correlation
may be incorporated into routine reporting. Because it is being
relied upon to steer the course of the business day-to-day, it
will need to go through the same ETL processes and quality
controls as the other data used for this purpose.
What does the future hold? On the one hand, all companies
will need to address a broad range of use cases from
ungoverned, “good enough,” self-service data integration all
the way up to enterprise-class ETL solutions.
At the same time, smart integration machines will get their
arms around big data and be able to automatically integrate
data sets—reliably, and at speed and volume—from a huge
variety of sources, most of them outside the enterprise. That
means that Tom’s digital assistant will be able to do more than
help him understand what happened to BIGCO’s Acme sales
and why. She’ll be able to combine BIGCO data with any data
on the Internet, or whatever other sources she can access, to
create models that better predict the sales of BIGCO brands.
Ultimately she’ll be able to respond to predictive requests like
“increase sales in the West region by 10%.”
But not quite yet.
20
HUMANS IN THE SMART MACHINE AGEBetween the mid-18th and mid-19th centuries, the Industrial
Revolution replaced manual labor with mechanical devices,
and the factory was born.
Early in the 20th century, Henry Ford implemented the first
moving assembly line and the Age of Mass Production began.
At the end of the 20th century, usage of the World Wide Web
moved out of academia and grew at a breathtaking rate.
By 2015 over a third of the world’s population had logged
on to the Internet at some point in the previous year; the
Connected Revolution had arrived.
Now pundits say that we are on the verge of a 4th revolution:
the Age of Smart Machines. And there are good grounds
for believing they are right—machine learning is no longer
confined to advanced research laboratories, but is becoming
part of everyday life. Intelligent e-mail spam detection, face
recognition, keyboards that anticipate words before they are
typed, washing machines that reorder their own detergent,
e-commerce recommendation systems, automatic stock
market negotiation robots, and many other smart machines
are commonplace.
Several trends have aligned to bring us to the tipping point
of this 4th revolution: the development of better machine
learning algorithms; the availability of huge processing
power at reasonable cost, allowing complex algorithms to
run economically on large data sets; and the easy availability
of huge amounts of digital data as the basis for learning, for
example the Internet of Things, enterprise data lakes, Internet
image repositories and so on.
In the next decades, machine learning will transform work
as we know it. And unlike previous revolutions, which
primarily affected blue-collar workers, the smart machine
21
revolution has white-collar workers in its sights. A 2013
academic analysis predicts the smart machine revolution
will put an estimated 47% of total U.S. employment at risk;1
telemarketers, credit analysts and administrative assistants
are among the most likely to be affected, while sales and
marketing managers are relatively safe. Previous revolutions
succeeded because, in the long run, they had a positive effect
on people’s lives: removing the need for debilitating physical
work, increasing connectedness, and making the world more
responsive to their needs and desires. Will the same be true
this time around?
Office work has already been changed by tools like fax
machines, computers, email, business productivity software,
the Internet, the paperless office, voice over IP and others.
These tools automated clerical work and eliminated some
less skilled jobs, such as the typing pool. Smart machines
will automate knowledge work: the work of those who think,
rather than do, for a living. This will be the first time that
something like that has happened at scale. Smart machines
will do autonomous work both for and alongside humans—
they will be our colleagues, not our tools.
HOW MACHINES WILL HELP US
A lot of effort has gone into working out how to get
machines to recognize and match things, whether images
or text. Recognition and matching are critical capabilities
to help us make sense of big data. The volume, variety and
velocity of big data is too great for humans to be able to
match the common elements in different data sets quickly,
cheaply and at high quality. Big data overwhelms traditional
data warehouse techniques, such as extract, transform
and load, which have long setup times and rely on scarce
resources such as data experts and software engineers. A
smart machine capable of automatically matching entities
based on their keys, textual descriptions, images, attributes,
relationships and more, is the only scalable solution to
integrating big data.2
Another area in which machine learning is of great value
is product identification. Most critical business analytics
revolve around products: their invention, manufacturing,
sales, promotion, profitability and so on. The bedrock of this
analysis is the ability to reliably identify products and isolate
their important characteristics, such as brand, size and flavor.
With e-commerce making a huge number of products readily
available for purchase, and with product innovation cycles
becoming shorter, automating product identification through
machine learning is the only way to keep up. Smart machines
can match and characterize products using textual descriptions,
ingredients lists, product images and packaging designs.3
We pick these examples—the ability to recognize and match
things, and the ability to identify products—because they are
fundamental to the way Nielsen itself is exploiting machine
learning and automation. Extending and standardizing
Nielsen’s product reference data across the entire store, in
more than 90 countries, was an almost unassailable objective
using primarily human labor. Machine learning has done more
than just smooth the way; without it the effort would have
taken too long and been too costly to be economically viable.
Smart machines will do autonomous work both for and
alongside humans—they will be our colleagues, not our tools.
1 Frey, CB. “The future of employment: how susceptible are jobs to computerisation.” 2013. 2 This topic is discussed in more detail in the “Data Wrangling” article in this edition.3 How these capabilities can be used in practice is discussed in the “Product Reference” article in this edition.
22
MACHINES AND TURKS COMING TOGETHER
Is there a non-machine solution? Some “smart machine”
cloud services, such as Amazon Mechanical Turk (AMT),
don’t use software at all, but farm tasks out to a crowd of
paid human volunteers.4 Although AMT is not actually a
smart machine, when viewed as a black box it has many of
the characteristics of one: crowds can quickly scale up and
down, depending on workload, and as a result can be more
responsive and cost-effective than a permanent in-house
roster of subject matter experts. If, for example, you want to
identify the retailer and itemize the purchases from a paper
till receipt, you could provide a photograph of the receipt to
AMT and contract to have the Turk convert the image into
electronic text. Bulk conversion of receipts would allow you to
analyze purchases by retailer.
Eventually, however, no Mechanical Turk will be as cost-
effective and swift as an intelligent machine, assuming the
machine is intelligent enough. For instance, the receipt
recognition problem could in principle be solved by Optical
Character Recognition (OCR) or similar machine learning
software. But—as is often the case—while smart machines
are remarkably accurate (>80%), incorrect results are still so
common that the human supervisory effort needed to ensure
an acceptable level of quality outweighs their utility. AMT can
provide a solution in such circumstances.
AMT can also advance the accuracy of smart machines. The
sets of high quality results it provides can be used to train
machines, thereby reducing the amount of quality control
needed; ultimately the process can be fully automated,
although that is currently years away.
AMT and other solutions like it provide a vital adjunct to
smart machines as the machines get smarter. Additionally,
many machine learning solutions are highly specific to a
single problem, especially in the business world; identifying
products is a prime example of this. Humans are general-
purpose problem solvers: until smart software overruns all
our problems, solutions like AMT are helpful in areas that
machine learning hasn’t reached yet.
THE PERSISTENT NEED FOR HUMANS
Machine intelligence will never be 100% reliable—there are
always edge cases, exceptions and incomplete data, where
the smart machine is not able to carry out a task to a high
degree of accuracy. For these cases, humans are a vital part
of any solution as the guardians of quality control and the
intelligence of last resort; humans have the ability to make
good decisions based on limited information and possess
that elusive quality, common sense.
Recognition and matching are critical cognitive capabilities
that can deliver huge benefits when implemented in smart
machines, but they won’t revolutionize the way we work; the
article about IBM’s Watson in this edition explores a much
more ambitious use of machine learning. A smart machine
should be able to do most of a category manager’s descriptive
and diagnostic data analysis. Longer term, the machine’s
cognitive capabilities should allow them to offer predictions
(do X and Y will happen) and ultimately to be prescriptive (if
you want W to happen, you should do Z).
Of course a great deal depends on how accurate and reliable
the machine is. High-confidence recommendations, where
the chances of making the wrong decision are low and
the advantages of acting are significant, can be actioned
automatically. Low-confidence recommendations, with the
opposite characteristics, require human intervention and
decision-making.
4 “Mechanical Turk - Wikipedia, the free encyclopedia.” 2011. 26 Aug. 2016. The Mechanical Turk was a fake chess-playing machine operated by a human chess master hiding inside.

23
If there is one common thread running through all of
these scenarios, it’s the need for humans and machines to
collaborate to achieve the best outcome.
Humans are not capable of processing vast amounts of low-
level data at a consistent level of quality. But they are good at
abstracting knowledge from their experience and transferring
this knowledge across domains. To be effective, machines
must learn from people. Today, most learning happens in an
explicit training cycle involving feedback from human quality
control. In the future, the process will be much less intrusive,
with machines observing human behavior, learning from it
and putting these heuristics into practice. Humans won’t be
looking over the shoulder of machines to check their work,
but instead machines will be looking over the shoulder of
humans to learn how to help them.

24
ABOUT NIELSEN
Nielsen Holdings plc (NYSE: NLSN) is a global performance management company that provides a comprehensive
understanding of what consumers watch and buy. Nielsen’s Watch segment provides media and advertising clients
with Total Audience measurement services for all devices on which content—video, audio and text—is consumed.
The Buy segment offers consumer packaged goods manufacturers and retailers the industry’s only global view
of retail performance measurement. By integrating information from its Watch and Buy segments and other data
sources, Nielsen also provides its clients with analytics that help improve performance. Nielsen, an S&P 500
company, has operations in over 100 countries, covering more than 90% of the world’s population.
For more information, visit www.nielsen.com.
Copyright © 2016 The Nielsen Company. All rights reserved. Nielsen and the Nielsen logo are trademarks or
registered trademarks of CZT/ACN Trademarks, L.L.C. Other product and service names are trademarks or
registered trademarks of their respective companies.