Embed Size (px)
Citation preview

BMO Nesbitt Burns Inc. is a Member-Canadian Investor Protection Fund. Member of the Investment Industry Regulatory Organization of Canada. All figures in C$ unless otherwise noted
Internal Use Only
October 2016
Portfolio Strategy Equity Strategy - Saudi Arabia Blinks, Good News for the Great White North
Saudi Arabia threw in the towel. Clearly, they would never admit as much - but they did! After engaging in an oil price war orchestrated by their former energy minister, the Kingdom relented at the latest Organization of the Petroleum Exporting Countries (OPEC) meeting to pave the way for the first production cut agreement in eight years (a reduction to 32.5 million barrels per day from 33.2 million). Of course, history has shown that anything OPEC says should be taken with a (large) grain of salt. In fact, their quota promises are rarely kept and there is no true enforcement mechanism. Still, this is a clear change of strategy for Saudi Arabia, which should at least put a floor under the price of oil.
Fixed Income Strategy - Uncertainties, Monetary Policies and Credit Risks Lead to Higher Volatility, Not to Higher Rates…yet
It has been over eight years since the end of the financial crisis and the main question remains: when will interest rates rise? This is a question no one can really answer yet.
We have had some false signals (for example, the U.S. Federal Reserve taper tantrum in 2013, the German Bund’s sell-off in 2015) that saw yields rise significantly higher in a very short period of time. In both cases, these volatile events were not driven by major macro-economic factors, and yields reverted back to their previous levels in the months that followed. For rates to rise and re-normalize, the primary drivers have to be supportive of the trajectory, which is not the case.
Figure 1: Market Summary — Total Return Data
September 2016 Last Three Months Year-to-Date Last 12 Months
S&P/TSX Composite Index 1.2% 5.5% 15.8% 10.0%S&P 500 Index 0.0% 3.9% 7.8% 12.6%MSCI World Index 0.6% 5.0% 6.1% 7.9%MSCI EAFE Index 1.3% 6.5% 2.2% 1.7%MSCI Emerging Markets Index 1.3% 9.2% 16.4% 13.7%FTSE/TMX Canada Universe Bond Index 0.3% 1.2% 5.3% 6.3%Miolce4 Bliigbela& FTME/TMX

2
October 2016 Equity Strategy – Saudi Arabia Blinks, Good News for the Great White North ................................................................................................................. 3 The Technical Picture— Key Technical Barometers Still Healthy .............................. 8 October 2016 Fixed Income Strategy - Uncertainties, Monetary Policies and Credit Risks Lead to Higher Volatility, Not to Higher Rates…yet ...................................... 11 Other Drivers that May Impact Interest Rates ......................................................... 13 Market Recap ............................................................................................................ 14 S&P/TSX Composite Sector Returns ......................................................................... 15 S&P 500 Composite Sector Returns.......................................................................... 15 Mutual Funds — Recommended List ......................................................................... 16 Exchange Traded Funds — Recommended List and Model Portfolios ...................... 17 S&P/TSX Composite Sector Weightings ................................................................... 19 S&P 500 Composite Sector Weightings .................................................................... 19 FTSE TMX Sector Weightings ..................................................................................... 19 BMO Capital Markets Sector Ratings: S&P/TSX Composite Index ........................... 20 BMO Capital Markets Sector Ratings: S&P 500 Index .............................................. 20 Performance Benchmarks – Total Return Performance .......................................... 21
Table of Contents
Stéphane Rochon Head of Private Client Research Hamza Bahadurali Portfolio Management Specialist Richard Belley Fixed Income Strategist David Boyd Vice President & Portfolio Manager Christopher W. L. Davies Managing Director, Branch Manager Paul Marcoux Senior Vice President, Managing Director & Portfolio Manager Doug Newlands Investment Advisor, Branch Manager Douglas Porter Chief Economist Ann Rait Canadian Equity Specialist Sébastien Tremblay Senior Vice President, Managing Director & Portfolio Manager Russell Visch Technical Analyst Gordon Young Investment Advisor
Matt Ewing Publishing Specialist

3
October 2016 Equity Strategy – Saudi Arabia Blinks, Good News for the Great White North Stéphane Rochon, CFA, Equity Strategist
Saudi Arabia threw in the towel. Clearly, they would never admit as much - but they did! After engaging in an oil price war orchestrated by their former energy minister, the Kingdom relented at the latest Organization of the Petroleum Exporting Countries (OPEC) meeting to pave the way for the first production cut agreement in eight years (a reduction to 32.5 million barrels per day from 33.2 million). Of course, history has shown that anything OPEC says should be taken with a (large) grain of salt. In fact, their quota promises are rarely kept and there is no true enforcement mechanism. Still, this is a clear change of strategy for Saudi Arabia, which should at least put a floor under the price of oil.
The Saudi “pump at will” strategy did result in a massive reduction in energy exploration and production budgets which allowed the market to rebalance but they did not even come close to their true objective of severely hurting the higher cost North American oil industry. In the meantime, they burned through over US$180 billion, or 20% of their foreign reserves despite cutting their expenses (they recently went as far as cutting salaries for their public servants). In other words, this situation was not sustainable for them in the long term and they just could not take it anymore. Also influencing their decision is the upcoming Saudi Aramco Initial Public Offering, coming in 2018. This is the cornerstone of Saudi’s strategy to diversify its economy away from fossil fuels. Given this state owned company has the largest proven reserves in the world, an up trending oil price will undoubtedly be helpful to the valuation of the stock once it hits the market.
As our BMO Capital Markets energy analyst team notes: “With the agreement, the global supply/demand balance at the very least is positively impacted. Our prior estimates had OPEC maintaining levels slightly above the current 33.2 million barrel per day mark; a nearly 1 million barrel per day improvement in our supply estimate is a notable shift in the supply/demand balance forward by one or two quarters”.
Having gotten progressively more bullish on Canadian stocks since the end of last year, we reiterate our belief that the S&P/TSX Composite Index (TSX) will outperform the S&P 500 Index (S&P 500) in Canadian dollar terms, for the next few quarters and maybe even longer. Recall that from 2010 to 2015, the S&P 500 outperformed the TSX by 130% (on a price return basis that excludes dividends), in Canadian dollar terms, the biggest U.S. market outperformance over Canada for a six year period since the tech bubble of the late 1990s.
Figure 2: BMO Nesbitt Burns Investment Strategy Committee’s Recommended Asset Allocation (%)
Income Balanced Growth Aggressive GrowthRecommended Benchmark Recommended Benchmark Recommended Benchmark Recommended Benchmark
Asset Mix Weights Asset Mix Weights Asset Mix Weights Asset Mix Weights
Cash 5 5 5 5 5 5 0 5
Fixed Income 65 70 35 45 15 25 0 0
Equity 30 25 60 50 80 70 100 95Canadian Equity 15 15 25 25 35 35 40 40
U.S. Equity 10 5 25 15 25 20 35 30
EAFE Equity 5* 5 5* 5 10* 10 15* 15
Emerging Equity 0 0 5 5 10 5 10 10 *Within EAFE& we specifically leciggend Cintinental Eolipean eqoity. Miolce4 BMO Nesbitt Bolns Piltfilii Advisily Teag

Figure 3: S&P/TSX Composite Index versus the S&P 500 Index
-10
-5
0
5
10
15
20
Jan-16 Feb-16 Mar-16 Apr-16 May-16 Jun-16 Jul-16 Aug-16 Sep-16
S&P 500 S&P/TSXMiolce4 BMO Nesbitt Bolns& Bliigbela
Figure 4: Canadian Dollar versus Oil >90% Correlation
$0
$10
$20
$30
$40
$50
$60
$70
$80
$90
$100
$110
$120
$130
$140
$150
$0.60
$0.70
$0.80
$0.90
$1.00
$1.10
Sep-02 Sep-03 Sep-04 Sep-05 Sep-06 Sep-07 Sep-08 Sep-09 Sep-10 Sep-11 Sep-12 Sep-13 Sep-14 Sep-15 Sep-16
CAD/USD WTI Oil
Miolce4 BMO Nesbitt Bolns& Bliigbela
Figure 5: Canadian Dollar versus Copper >94% Correlation
$0
$50
$100
$150
$200
$250
$300
$350
$400
$450
$500
$0.60
$0.70
$0.80
$0.90
$1.00
$1.10
Sep-02 Sep-03 Sep-04 Sep-05 Sep-06 Sep-07 Sep-08 Sep-09 Sep-10 Sep-11 Sep-12 Sep-13 Sep-14 Sep-15 Sep-16
CAD/USD Copper Miolce4 BMO Nesbitt Bolns& Bliigbela
The TSX has now outperformed the S&P 500 by 14% (total return) in Canadian Dollar Terms Year to Date
As we wrote in November 2015: “Net net, we think we are close to a short term bottom in the price of oil which should lead to a stabilization in corporate cash flow generation and lend support to energy equities for the next few quarters. Copper prices have also stopped declining, likely helped by nascent optimism about a stabilization of Chinese economic growth through increased fiscal and monetary stimulus.” If anything, our conviction in this view has strengthened throughout 2016.
Recall that the TSX and Canadian dollar are highly correlated to oil and copper prices. Having a view on these commodities –and especially oil currently - is therefore crucial to making money in the Canadian market.

5
Figure 6: S&P/TSX Composite Index Earnings Yield versus 10 Year Canada Yield
0.00
2.00
4.00
6.00
8.00
10.00
12.00
Sep-94 Sep-96 Sep-98 Sep-00 Sep-02 Sep-04 Sep-06 Sep-08 Sep-10 Sep-12 Sep-14 Sep-16
10 Year Bond Yield TSX Earnings Yield (Trailing Twelve Months) Miolce4 BMO Nesbitt Bolns& Bliigbela
Figure 7: S&P/TSX Composite Index Dividend Yield versus 10 Year Canada Yield
0.00
1.00
2.00
3.00
4.00
5.00
6.00
7.00
8.00
9.00
10.00
Sep-94 Sep-96 Sep-98 Sep-00 Sep-02 Sep-04 Sep-06 Sep-08 Sep-10 Sep-12 Sep-14 Sep-16
10 Year Bond Yield TSX Dividend Yield (Trailing Twelve Months)
Miolce4 BMO Nesbitt Bolns& Bliigbela
We continue to think that the TSX is very inexpensive relative to bond yields both in terms of earnings yield (index profits divided by market capitalization – the higher the better) and dividend yield. As Figures 6 and 7 show, the market is currently very attractive relative to history. In fact, the spread between the dividend yield on stocks (3.3%) and the 10 year bond yield (1.12%) is even greater than it was at the height of the financial crisis.

6
North American Rig Count and Energy Capex Continues to Decline as we March Toward Equilibrium
The oil market remains slightly oversupplied, but far less than it was last year. In our view, there is an increasing probability that the market will balance out in the second half of 2016 and even more so in 2017. As our readers know, it is not absolute numbers, but the trajectory, that matters for financial markets. In other words, even a slight improvement from a poor level often is sufficient to drive up prices, particularly for commodities and stocks.
With the rig count coming down sharply in 2015 in the U.S. and Canada, we finally started seeing evidence that oil and gas production may have peaked at the end of last year. While some companies are talking about small capital expenditure increases going forward, we believe a true ramp up in production will necessitate an oil price closer to US$60/bbl. This should help the market improve the supply demand balance.
Energy and Base Metals – The Technical Perspective
In the summer of 2012, BMO Nesbitt Burns Technician Russ Visch made a high conviction and prescient call about the commodity super cycle being over. He followed this up with a high conviction bearish call on energy in 2014 that turned out to be spot on. So where does he stand now? In a nutshell, he now sees the opportunity for continued strength in the next few months / quarters but over the long term, multi-year prospects are still bearish. We are in full agreement.
Specifically, he noted that “crude oil recently reversed back to the upside following a fairly routine medium-term pullback which found support at its rising 200-day/40-week moving average. New buy signals in weekly momentum gauges suggest that at a minimum, there is a trade back to the mid-2016 peak at US$51.67. A break above that level – likely, in our opinion – would clear the way for the rally to extend back to the mid-2015 peak at US$62.58.”
Figure 8: Global Oil Demand and Supply (million bbl/day)
85
87
89
91
93
95
97
99
Aug-10 Mar-11 Oct-11 May-12 Dec-12 Jul-13 Feb-14 Sep-14 Apr-15 Nov-15 Jun-16
Demand Supply
Miolce4 BMO Nesbitt Bolns& Bliigbela
Figure 9: Baker Hughes NA Oil & Gas Rig Count
0
200
400
600
800
1,000
1,200
1,400
1,600
1,800
Oct-12 Feb-13 Jun-13 Oct-13 Feb-14 Jun-14 Oct-14 Feb-15 Jun-15 Oct-15 Feb-16 Jun-16
Miolce4 BMO Nesbitt Bolns& Bliigbela
Figure 10: US Oil Production – DOE, Thousands bbl/day
7,000
7,500
8,000
8,500
9,000
9,500
10,000
Sep-13 Jan-14 May-14 Sep-14 Jan-15 May-15 Sep-15 Jan-16 May-16 Sep-16 Miolce4 BMO Nesbitt Bolns& Bliigbela

7
Figure 14: S&P 500 Fair Value Model
Present value % of valueEarnings per share growth
Discount rate
Period 1 (2015-2018) 447.75$ 19.1% 7% 8.5%Period 2 (2019-2023) 497.24$ 21.2% 5% 8.5%Period 3 (2023 - ) 1,397.43$ 59.7% 2% 8.5%
Total fair value 2,342.42$ 100.0% Forward 12 month consensus 124.00 Rounded 2,340.00$ Implied terminal mult. 15.0 X
Current Price SPX 2,168.27$ Long Bond 2.0%Historical Equity Risk Premium 4.5%
Upside Potential 8% Additional Risk Premium 2.0%Total discount rate 8.5%
Miolce4 BMO Nesbitt Bolns& Bliigbela
Figure 13: S&P/TSX Fair Value Model
Present value % of valueEarnings per share growth
Discount Rate
Period 1 (2016-2019) 3,229.74$ 20.3% 7% 9.0%Period 2 (2020-2024) 3,514.11$ 22.1% 5% 9.0%Period 3 (2024 - ) 9,168.54$ 57.6% 2% 9.0%
Total fair value 15,912.38$ 100.0% Forward 12 month consensus 830.0 Rounded 15,910.00$ Implied terminal mult. 14.1 X
Current Price 14,725.86$ Long Bond 2.5%ls Historical Equity Risk Premium 4.5%
Upside Potential 8% Additional Risk Premium 2.0%Total discount rate 9.0%
Miolce4 BMO Nesbitt Bolns& Bliigbela
This view is backed up by BMO Capital Markets Quantitative Analyst Mark Steele who wrote on August 15: “Oil just so happened to hold at what would be a right shoulder level for a major head and shoulders bottom. It ought to test the neckline around US$51/bbl... Then the technical target would be a bolt towards US$90/bbl. One step at a time, but that’s the pattern… If that were to happen, then the petro-loonie would break back above its 50 day moving average, then break out of a 3 month consolidation pattern, and head towards US$0.87… The Canadian equity market, which has moderated in outperformance since the start of the year, would pick up.”
Since then, market action has increased his conviction in the “oil bottoming” call. He adds that “Energy stocks are certainly not paying up for this bottoming pattern on a relative basis. This is a good time to add.”
While the US$90/bbl upside target seems quite aggressive to use, we could not agree more on the attractiveness of Canadian stocks and the energy sector in general. We do have a number of interesting energy equity ideas with attractive risk/reward propositions. Please contact your BMO Investment Advisor for specific personalized recommendations.
Market Fair Value
Given the year to date recovery in oil and other commodity prices and the general improvement in economic leading indicators, we recently took the opportunity to tweak our fair value estimates upward for the S&P to 2,350 – 2,400 (from our long standing 2300 fair value estimate) and 15,500 – 16,000 for the TSX (from 15,000). Summary details of our discounted earnings models are included below. We believe our earnings growth and discount rate assumptions are sufficiently conservative, especially given the very low interest rate environment which should be with us for an extended period of time.
Figure 11: Crude Oil (WTI) Prices (US $)
$25
$35
$45
$55
$65
$75
$85
$95
$105
$115
Sep-13 Jan-14 May-14 Sep-14 Jan-15 May-15 Sep-15 Jan-16 May-16 Sep-16
WTI 50 Day Moving Average150 Day Moving Average 200 Day Moving Average
Miolce4 BMO Nesbitt Bolns& Bliigbela
Figure 12: MSCI World Energy versus MSCI World Index
50
60
70
80
90
100
110
120
130
Oct-12 Feb-13 Jun-13 Oct-13 Feb-14 Jun-14 Oct-14 Feb-15 Jun-15
Miolce4 BMO Nesbitt Bolns& Bliigbela

8
The Technical Picture— Key Technical Barometers Still Healthy Russ Visch, CMT, Technical Analyst
Historically, September has proven to be a challenging month for investors and this year was no exception. As we write this, major averages such as the S&P/TSX Composite and S&P 500 ended the month virtually unchanged despite a massive surge in volatility mid-month surrounding the “quadruple witching” options expiry and central bank meetings. This volatility has prompted much hand-wringing in the media regarding whether it’s foreshadowing a major bear market. A cursory look at our key barometers of market health show these concerns are wholly unwarranted.
These indicators, such as the various Advance-Decline lines we follow and other broad measures of equity participation measure the quality of a market rally in terms of the number of stocks participating. The ideal environment is one in which all stocks are rallying, indicative of a healthy economy where all companies can thrive and grow. Historically, bull market peaks are preceded by significant deterioration in these key barometers of market/economic health (e.g. the NYSE Advance-Decline line and other broad measures of equity participation such as the Russell 2000 and the Value Line Composite indexes) as economic conditions erode.
Figure 15: S&P 500 and NYSE Advance-Decline Line: 2007
Miolce4 BMO Nesbitt Bolns Technical Analysis

9
In 2007 these indicators began to break down nearly five months before the October peak.
Figure 16: S&P 500 and NYSE Advance-Decline Line: 2000
Miolce4 BMO Nesbitt Bolns Technical Analysis
Back in 2000 these divergences developed for nearly two full years before the technology bubble “popped” in late March.
Figure 17: S&P 500 and NYSE Advance-Decline Line: 1987
Miolce4 BMO Nesbitt Bolns Technical Analysis

10
There was even plenty of warning ahead of the 1987 crash.
Currently, we are still not seeing any evidence of this rally narrowing like it did before the prior two bull market peaks. In fact, it’s just the opposite as all of the Advance-Decline lines we follow have recently made new all-time highs. The confirmation in these indicators is far and away the most important aspect of this rally since it greatly decreases the probabilities of a bear market occurring at any point in the next six to twelve months. So, until we begin to see signs of narrowing participation we consider the cyclical bull market intact, and any weakness as countertrend in nature and therefore a buying opportunity.
Figure 18: NYSE Advance – Decline Lines
Miolce4 BMO Nesbitt Bolns Technical Analysis
In terms of upside potential, key resistance for the S&P/TSX Composite is at 14,855. A break above that level would open a new upside swing target of 15,391. Above that, the next upside target/resistance level is the all-time high at 15,685. Key resistance for the S&P 500 is 2,193 which, if broken would open a new short-term swing target of 2,267. Our medium-term target of 2,452 is still in effect following the break above 2,134 that occurred earlier in the Summer.

11
October 2016 Fixed Income Strategy - Uncertainties, Monetary Policies and Credit Risks Lead to Higher Volatility, Not to Higher Rates…yet Richard Belley, CFA, Fixed Income Strategist
It has been over eight years since the end of the financial crisis and the main question remains: when will interest rates rise? This is a question no one can really answer yet.
We have had some false signals (for example, the U.S. Federal Reserve taper tantrum in 2013, the German Bund’s sell-off in 2015) that saw yields rise significantly higher in a very short period of time. In both cases, these volatile events were not driven by major macro-economic factors, and yields reverted back to their previous levels in the months that followed. For rates to rise and re-normalize, the primary drivers have to be supportive of the trajectory, which is not the case.
Of the main drivers behind interest rate levels, domestic and global economic growth, inflation and supporting Central Bank’s monetary policies are predominant. In particular, monetary policies have evolved from targeting short-term interest rates to affecting longer term rates and yield curves by implementing asset purchase programs and growing Central Bank balance sheets. These policies continue to be instrumental in pressuring yields lower and targeting negative real rates. With the absence of either stronger growth or inflation, the arguments for less Central bank intervention remain weak and higher interest rates are less likely in the short-term.
As shown in Figure 19, a good example of the importance of these drivers was the renewed volatility that was generated following the meetings of five of the most important Central Banks in September as investors looked for any indication that we are getting closer to the end of accommodative policies. Disappointment from the lack of new measures from the European Central Bank (ECB) and the Bank of England (BoE) combined with rumors that the Bank of Japan (BoJ) would modify its asset purchase program initially had a negative impact on long term yields and global yield curves.
However, the BoJ decided to take a more proactive approach to control the yield curve and this helped put a ceiling on rates. They took non-traditional monetary policy tools to a new level by keeping short-term rates negative and targeting around 0% for the 10-year government bond and this was positive for fixed income markets.
Figure 19: U.S. 10-Year Treasury Yield (Daily) and Central Bank Meetings
1.50
1.55
1.60
1.65
1.70
1.75
1-Sep-2016 8-Sep-2016 15-Sep-2016 22-Sep-2016 29-Sep-2016
BoC ECB BoE BoJ, U.S. Fed
Miolce4 Bliigbela
Figure 20: Government of Canada 2-10 Year Yield Curve
0.00
0.50
1.00
1.50
2.00
2.50
3.00
3.50
4.00
Sep-10 Sep-11 Sep-12 Sep-13 Sep-14 Sep-15 Sep-16 Miolce4 Bliigbela
Figure 21: U.S. Treasury 2-10 Year Yield Curve
0.00
0.50
1.00
1.50
2.00
2.50
3.00
3.50
Sep-10 Sep-11 Sep-12 Sep-13 Sep-14 Sep-15 Sep-16
Miolce4 Bliigbela

12
Of less importance, due to a fully expected decision, the Bank of Canada (BoC) re-affirmed its status quo position. The tone of the statement, however, was a bit more dovish than the previous meeting in July. The bank highlighted two things that set the tone:
1. Economic growth may not be as robust as initially forecasted
2. The Bank felt ‘’the risks to the profile for inflation have tilted somewhat to the downside since it last met,’’ so losing some conviction that it would remain close to its target.
A benign inflation report and BoC Governor Stephen Poloz’s statement that it will take three to five years for the Canadian economy to recover from the impact of lower crude oil prices clearly eliminated the possibilities for any rate hike. In fact it tilted the odds slightly in favor of a potential cut in the next 12 months.
However, the BoC still expects a rebound in economic growth in the second half of this year as oil production recovers. It also expects support from fiscal policies as consumers start to benefit from the Canada Child Benefit payments and as federal infrastructure investments starts. So it may still be premature to think about another rate cut, but it suggests that the level of stimulus remains adequate and that the BoC will likely remain on hold for longer even if the U.S. Federal Reserve (the Fed) raises rates.
Figure 23: Canada Consumer Price Index (CPI) and Core CPI
-1.50
-0.50
0.50
1.50
2.50
3.50
4.50
Aug-94 Aug-96 Aug-98 Aug-00 Aug-02 Aug-04 Aug-06 Aug-08 Aug-10 Aug-12 Aug-14 Aug-16
Canada CPI Core CPI
Miolce4 Bliigbela
As for the Fed meeting, it left its overnight rate (Fed funds rate) unchanged. Instead of providing greater clarity, it created more confusion as to what would trigger the next rate hike, as many believed conditions were already in place for a policy change. The statement had a slightly more hawkish tone, noting the more solid household income and net worth growth data. The Fed reiterated that the case for a rate hike has strengthened but that it is continuing to wait for more evidence of progress towards its objectives, leaving the timing uncertain. It raised the question as to whether market events, conditions and expectations play a larger role in the decision process than initially thought. Median officials still see one hike this year, which in all likelihood would be in December as the next meeting in November is only six days before the U.S. presidential election. As for future rate hikes, the Fed expects an even flatter tightening path as officials now see only two increases next year instead of three. Based on this scenario, the Fed funds rate would not reach 2% before at least 2018, which is when the Fed believes inflation would likely reach its target of 2%.
Figure 22: Government of Canada 5 and 10 Year Rates
0.00
0.50
1.00
1.50
2.00
2.50
3.00
3.50
4.00
Sep-10 Sep-11 Sep-12 Sep-13 Sep-14 Sep-15 Sep-16
5 Year Rates 10 Year Rates
Miolce4 Bliigbela

13
If U.S. economic data continues to be supportive, the Fed will likely raise rates for the first time since December 2015. But there is still a big “if” involved in the decision! If growth is positive, if the current inflation rate rises toward the Fed’s 2% target, if long-term inflation expectations continue to rise, if the U.S. presidential election does not surprise on November 8th, if financial markets behave and if the markets anticipate a policy change. There is still a lot of time and data until the December 14th meeting for the Fed to change its mind. But even if they were to raise rates, we believe the market can definitively handle a 25 basis point increase with limited impact on both markets and economic growth.
Should investors be concerned? We think not, at least not yet. Even with some improvement in growth and inflation, it is expected that major central banks will continue to exert downward pressure on borrowing costs in general. Let’s not forget that the total asset purchases from central banks as we enter the fourth quarter of 2016 will approach the peak levels from 2009. The balance sheets of the big four central banks (BoE, BoJ, ECB and the Fed) represents over 30% of these countries’ combined Gross Domestic Product. While their balance sheets may grow at a slower pace in the future, they are not about to shrink and should continue to be supportive.
Other Drivers that May Impact Interest Rates
Finally, two other events during the month impacted interest rate markets. First, the Organization of the Petroleum Exporting Countries (OPEC) announced a potential deal to a modest cut in oil production, reintroducing production quotas, something it had abandoned in the past due to frequent violations. This was a potential positive catalyst for the basing process of oil prices. However, with a history of disrespecting agreements, it remains doubtful that this time will be different. Furthermore, the terms of the deal need to be finalized at the next scheduled meeting on November 30th.
OPEC represents about a third of the world’s oil production so other countries’ actions may have a significant impact on prices, in particular Russia and the U.S. From an economic growth and inflation perspective, higher prices will be positive for North American economies and could help mitigate the global deflationary threat. As such, this would likely pressure rates higher, contributing to the steepening of yield curves, providing support for a Fed rate hike.
Second, the Wells Fargo account scandal and the capitalization issue at Deutsche Bank raised some concerns in the credit markets. As shown in Figure 25, Wells Fargo’s issue was isolated and had limited impact on investment grade corporate credits, but in the case of Deutsche Bank, the idea of a Lehman style bankruptcy re-surfaced. In a world of available central bank liquidity at 0% interest rates or lower, the contagion risk
Figure 24: Oil prices, CPI and the Market’s Long Term Expectation for Inflation
-1%
0%
1%
2%
3%
4%
5%
20
40
60
80
100
120
140
Sep-09 Sep-10 Sep-11 Sep-12 Sep-13 Sep-14 Sep-15 Sep-16
Oil Prices U.S. Inflation Expectations CPI
?
Miolce4 Bliigbela
Figure 25: Wells Fargo Spread Compared to Investment Grade Credit Default Swaps1
65
70
75
80
85
90
95
45
50
55
60
65
70
Mar-16 Apr-16 May-16 Jun-16 Jul-16 Aug-16 Sep-16
Wells Fargo & Co Investment Grade Credit Default Swaps
Miolce4 Bliigbela
Figure 26: Low Canadian Corporate Yields
0.00
0.50
1.00
1.50
2.00
2.50
3.00
3.50
4.00
4.50
Sep-11 Sep-12 Sep-13 Sep-14 Sep-15 Sep-16
GoC A BBB Miolce4 Bliigbela
1 A credit default swap is an indicator of the default risk of a corporation on its payment and principal

14
0.25%
0.14%
0.40%
0.26%
0.04%
1.19%
2.38%
0.91%
0.45%
0.11%
5.28%
10.83%
4.89%
1.52%
0.37%
0.00% 2.00% 4.00% 6.00% 8.00% 10.00% 12.00%
Universe Bond Index
Long-Term Bond Index
Mid-Term Bond Index
Short-Term Bond Index
91 Day Treasury Bills
Year-to-date 3-Month Month-to-date
may not be as elevated, but the events may nonetheless contribute to pressure credit spreads higher. In particular, the decision on how to raise the capital may have an impact on some corporate bond sectors, starting with the financial sector.
Back in the early days of the financial crisis, Deutsche Bank was one of the two institutions that elected to extend a Canadian dollar fixed-floater bond, a structure widely issued by Canadian banks and perceived to carry a very limited extension risk. It had a significant negative impact on credit spreads. Fast forward to today, and some of the solutions proposed to help mitigate the bank’s under-capitalization is to either issue new capital or convert current contingent capital and/or bail-in securities, again fairly similar structures to the non-viable contingent capital (NVCC) securities issued by the banks under the new regulation guidelines, which could potentially contribute to the rise in the extension risk in Canada.
After peaking, risks have subsided but they are not going away yet. When combined with the expectation of higher corporate issuances and the strong performance of corporate bonds so far this year, it helps explain why we are less constructive on the corporate bond market. The demand for higher yielding securities in this low yield environment remains elevated despite slow economic and earnings growth, low corporate bond yields, rising default rate and higher volatility. While we continue to advocate for an overweight corporate credit exposure, we have gradually recommended taking some profits, reducing exposure to both U.S. and Canadian dollar credit markets, shortening its term and moving upward on the credit quality curve.
Market Recap
The Canadian and U.S. bond markets both returned positive performances in the third quarter of 2016. Bond yields fluctuated throughout the quarter with each major economic data release and central bank pronouncement. The Government of Canada yield curve ended the third quarter slightly lower to unchanged, while the U.S. treasury yield curve rose by 13 to 18 basis points (bps) in the 2-10 year sector and a much less pronounced five bps at the long end. Although Canadian and U.S. yield curves experienced a steepening in September, over the quarter, they continued to flatten as the 2-10 year yield differential narrowed by five bps in the U.S. and six bps in Canada. The Canadian bond market, as represented by the FTSE TMX Canada Universe Bond Index, ended the third quarter with a 1.19% total return. Corporate bonds marginally outperformed provincial bonds in the quarter, however on a year-to-date basis; provincial bonds have outperformed all other sectors, realizing a 6.95% total return.
Investors continued to favour spread product, benefitting provincial and corporate bonds. Spreads on corporate bonds tightened by over nine bps, led by the BBB credits and the Energy sub-sector in particular. Although provincial bonds experienced a bit of a lull in demand mid-quarter, spreads still managed to end the quarter four bps tighter. The strong performance experienced by corporate bonds helped push their year-to-date return to 5.65%.
The U.S. bond market, as measured by the Barclay’s Aggregate Index, posted a modest 0.46% total return for the quarter. Although returns on longer-dated securities drifted into negative territory in September, bonds with maturities of 10+ years still managed to earn 1.24% for the quarter and increased their year-to-date return to 15.75%.
Corporate bonds printed a 1.41% total return in the quarter, driving the year-to-date total return to 9.20%. Non-investment grade bonds continued to benefit from investors’ appetite for yield, with the energy, metals and mining sector leading the way. The Barclays U.S. Corporate High Yield Index realized a 5.55% total return in the quarter and 15.11% for the year.
Figure 27: FTSE TMX Universe Bond Index Returns (For Period Ended September 30, 2016)
Miolce4 FTME-TMX

S&P/TSX Composite Sector Returns
S&P/TSX Composite Index Sector Total Returns (%) MTD YTD
Materials 2.58 50.56Energy 3.92 26.61Utilities 0.59 18.12Telecom. Services 0.40 18.03Industrials -0.08 16.61S&P/TSX Composite Index 1.22 15.83Financials 0.63 11.26Consumer Staples -3.76 9.15Cons. Discretionary 1.25 9.02Info. Technology 1.19 5.77Real Estate -0.98 5.36Health Care -10.04 -69.83
As if Meptegbel -0& 2010
Miolce4 Bliigbela
S&P 500 Composite Sector Returns
S&P 500 Index Sector Total Returns (%) MTD YTD
Energy 3.08 18.72Telecom. Services -0.92 17.85Utilities 0.39 16.13Info. Technology 2.44 12.51Materials -1.25 11.45Industrials -0.11 10.87S&P 500 Index 0.02 7.84Consumer Staples -1.46 7.55Real Estate -1.81 5.57Cons. Discretionary -0.31 3.64Financials -2.72 1.40Health Care -0.51 1.37
As if Meptegbel -0& 2010
Miolce4 Bliigbela

16
Mutual Funds — Recommended List
Cdn Eq. EdgePoint Canadian Portfolio Series A 2.06 4.13 15.10 4.46 8.49 9.90 - 13.82 17/11/2008 1 2 2 4 2 1 - $1,084.14 2.15
Fidelity Canadian Growth Company Sr B -0.05 4.68 11.69 9.69 16.85 17.21 8.71 11.19 12/07/1994 4 1 3 1 1 1 1 $1,840.45 2.28
CI Cambridge Canadian Eq Corp Cl 2.75 6.51 14.95 10.51 11.45 13.59 - 8.23 31/12/2007 1 1 1 1 1 1 - $4,446.70 2.45
CI Synergy Canadian Corporate Class 0.42 2.26 9.22 -0.18 7.32 7.11 3.81 8.20 31/12/1997 3 4 4 4 3 3 3 $960.45 2.44
RBC North American Value Adv 0.57 3.46 11.78 8.24 10.20 10.55 7.71 7.61 28/08/2006 3 2 3 2 2 1 1 $2,382.08 2.06
RBC Canadian Equity Income Adv 0.58 3.25 15.70 9.03 7.41 8.57 10.45 10.39 28/08/2006 3 3 1 3 3 1 1 $3,307.05 2.02
Manulife Dividend Income Adv 1.77 6.52 16.46 15.95 14.28 - - 14.25 21/03/2012 1 1 1 1 1 - - $1,172.41 2.29
Cdn SM Cap Eq. Fidelity Canadian Opportunities Sr B -0.20 6.56 21.45 11.40 9.05 7.57 7.60 8.23 24/07/2000 3 1 1 2 2 3 1 $906.68 2.31
Cdn Focus SM Cap Eq.
Dynamic Power Small Cap 3.73 4.21 13.14 0.34 6.53 2.80 3.81 6.32 30/11/1995 1 2 4 4 3 4 3 273.56 2.50
US Eq. NEI Northwest US Dividend A 0.67 3.86 8.59 13.34 15.97 16.16 5.22 0.91 06/10/2000 2 2 3 1 2 3 4 $168.57 2.70
US SM Cap Eq. Fidelity Small Cap America Sr B 0.12 0.83 4.07 5.87 19.65 24.24 11.62 10.96 05/04/1994 3 4 4 3 1 1 1 $2,544.67 2.34
Dynamic Global Discovery 2.01 5.63 8.99 10.00 16.04 11.86 6.30 7.01 08/11/2000 1 1 2 1 1 3 1 $449.95 2.47
Dynamic Power Global Growth Class 3.28 7.05 14.56 3.04 14.60 12.39 10.48 7.30 23/01/2001 1 1 1 3 1 3 1 $1,041.19 2.50
CI Black Creek Global Leaders Class A 1.89 4.87 11.09 12.08 15.65 15.80 7.73 6.49 26/01/2005 1 1 1 1 1 1 1 $1,567.86 2.48
Capital Group Global Equity-Canada A 1.14 4.85 12.42 7.96 14.93 15.27 6.86 7.79 01/11/2002 2 1 1 1 1 1 1 $4,012.96 2.03
BMO Global Dividend Class Advisor -2.55 -0.23 2.63 0.79 11.47 10.78 - 7.46 03/11/2008 4 4 4 4 3 3 - $218.41 2.58
Renaissance Global Infrastructure -1.30 3.12 7.74 3.72 11.78 11.09 - 5.81 13/11/2007 3 2 4 4 3 4 - $1,905.54 2.67
Gbl SM Cap Eq. CI Global Small Companies -0.26 0.79 7.94 1.42 12.33 13.58 6.84 9.04 30/04/1993 3 4 3 2 2 2 2 $206.51 2.46
Dynamic EAFE Value Class 3.51 7.16 14.26 6.67 10.88 8.54 - 2.52 25/09/2007 1 1 1 1 3 4 - $25.74 2.58
Invesco International Growth Class 0.76 0.54 5.07 2.90 10.91 11.09 4.26 2.55 10/07/2000 2 4 4 2 1 2 1 $630.96 2.84
Renaissance International Equity 0.42 5.29 10.93 11.87 10.09 9.77 4.93 2.66 02/01/2001 3 1 1 1 2 2 1 $252.50 2.83
European Equity BMO European Advisor Series 2.17 -0.12 3.64 -3.32 7.37 10.86 - 9.16 11/11/2009 1 1 3 3 3 2 - $130.75 2.52
Em. Mkt. (Glb. Ntrl. Bal.)
Capital Group Emerg Mkts Total Opp-Cdn A 1.01 4.93 8.88 5.20 6.29 - - 4.49 30/03/2012 1 1 1 2 4 - - $328.20 2.44
Em. Mkt. Westwood Emerging Markets 0.72 10.99 17.44 11.87 7.42 1.80 2.48 5.54 21/09/2000 3 2 3 2 3 4 4 $482.25 3.05
Asia Pac. Eq. BMO Asian Growth & Income Advisor -0.43 4.93 9.32 8.19 8.54 8.75 6.72 7.57 26/08/2003 4 4 4 3 4 2 2 $694.45 2.62
Natural Resources Eq.
Front Street Special Opportunities Cl B 3.88 8.25 45.50 22.20 -6.94 -11.71 -0.99 12.83 02/08/1999 1 1 1 2 3 3 3 $148.92 3.06
Cdn ST FI HSBC Mortgage Investor 0.07 0.56 0.83 1.27 1.20 1.24 2.41 4.31 09/12/1992 2 2 3 2 3 3 3 $2,544.22 1.53
Cdn FI PH&N Total Return Bond A 0.08 2.66 4.78 5.44 5.50 4.16 - 5.58 17/11/2008 3 2 2 1 1 1 - $8,612.87 1.16
Preferred Shares Dynamic Preferred Yield Class 1.79 4.15 18.15 5.73 0.83 - - -0.50 10/04/2013 2 3 2 2 3 - - $509.64 1.81
Templeton Global Bond A 0.40 2.58 2.56 1.96 3.73 3.07 5.77 5.35 15/07/1988 2 3 3 4 3 4 1 $2,374.25 1.73
PIMCO Monthly Income A 0.82 2.45 6.21 5.21 5.93 9.20 - 11.73 20/01/2011 1 3 1 2 3 1 - $8,784.81 1.39
Lysander-Canso Corporate Value Bond A 1.87 3.42 7.97 6.51 6.58 - - 6.71 23/12/2011 1 2 1 2 2 - - $1,384.44 1.52
Manulife Strategic Income Adv 0.47 2.33 4.55 4.35 7.13 6.34 7.52 6.84 25/11/2005 4 4 4 3 1 2 1 $8,138.67 2.00
Fidelity American High Yield Sr B 2.32 4.44 8.48 5.05 11.61 11.68 7.91 5.91 07/02/1994 1 3 3 3 1 1 1 $4,408.64 1.96
Cdn Ntrl Bal. Fidelity Canadian Balanced Series B 0.04 3.94 8.21 3.45 9.13 7.53 6.41 8.04 30/09/1998 4 1 2 4 1 1 1 $7,432.49 2.10
CI Signature High Income 0.43 4.40 9.86 4.78 6.19 7.26 5.54 9.04 31/12/1996 3 1 1 3 4 2 1 $8,817.08 1.59
CI Signature Global Income & Growth A 0.62 3.55 3.14 0.71 8.60 9.70 - 4.04 22/02/2007 2 1 4 4 2 1 - $3,918.24 2.46
Misc. Dynamic Alternative Yield Series A 0.34 2.41 5.72 -1.84 8.91 - - 8.27 30/09/2011 - - - - - - - $1,510.62 2.56
Global FI
Global Ntrl Bal.
Global Equity
High Yield FI
BMO Nesbitt Burns Recommended Mutual Funds List - Monthly Performance Update - September 2016
Category Name
1 M
onth
3 M
onth
6 M
onth
1 Ye
ar
MER
Fund Details*Return* Quartile*
1 M
onth
3 M
onth
5 Ye
ar
Cdn Focus Eq.
Intl Eq.
Assets ($MM)3
Year
3 Ye
ar
10 Y
ear
Sinc
e In
cept
ion
6 M
onth
1 Ye
ar
5 Ye
ar
Ince
ptio
n da
te
10 Y
ear
Cdn Div.
*Miolce4 Milninastal As if Meptegbel -0& 2010

17
Exchange Traded Funds — Recommended List and Model Portfolios
Category BetaRules-Based / Fundamental
Actively Managed Tactical / Thematic Income Model Balanced Model Growth ModelAggressive
Growth Model
Cash 5.0% 5.0% 5.0% 0.0%
BMO Aggregate Bond Index ETF (ZAG)
15.0% 7.5%
iShares DEX All Corporate Bond Index (XCB)
Vanguard Cdn Short-Term Corp Bd ETF (VSC)
15.0% 7.5%
Horizons Active FR Bond ETF (HFR, HFR.A)
15.0% 7.5% 5.0%
High Yield Fixed IncomeBMO High Yld US Corp Bd Hdgd CAD Idx ETF (ZHY)
5.0%
Global / International Fixed Income
Vanguard Global ex-US Aggregate Bond Index (VBG-CAD-hedged)
15.0% 7.5% 5.0%
Balanced / PortfolioBMO Monthly Income ETF (ZMI)
5.0% 10.0%
Canadian Equity IncomeHorizons Active Cdn Dividend ETF (HAL)
US Equity IncomeVanguard US Div Appreciation ETF (VGG, VGH-CAD Hedged)
5.0% 12.5%
Horizons Active Global Dividend ETF (HAZ, HAZ.A)
10.0%
BMO International Dividend ETF (ZDI, ZDH-CAD Hedged)
5.0% % 5.0%
BMO S&P/TSX Capped Composite Index ETF (ZCN)
5.0% 5.0%
BMO Low Volatility Canadian Equity ETF (ZLB)
15.0% 15.0% 15.0% 15.0%
FirstAsset Mstar Canada Momentum ETF (WXM, WXM.A)
5.0% 7.5% 7.5%
FirstAsset Mstar Canada Value ETF Adv (FXM, FXM.A)
7.5% 7.5%
ETF Model PortfoliosBMO Nesbitt Burns Recommended ETF List — September 2016
Canadian Fixed Income
Global / International Equity Income
Canadian Equity

18
Exchange Traded Funds - Recommended List (Continued)
Category BetaRules-Based / Fundamental
Actively Managed Tactical / Thematic Income Model Balanced Model Growth ModelAggressive
Growth Model
ETF Model PortfoliosBMO Nesbitt Burns Recommended ETF List — September 2016
BMO S&P 500 Index ETF (ZSP, ZSP.U-USD, ZUE-CAD Hedged)Vanguard US Total Mkt ETF (VUN, VUS-CAD Hedged)
12.5% 12.5%
BMO Low Volatility US Equity ETF (ZLU, ZLU.U-USD)
5.0% 12.5% 12.5% 12.5%
iShares MSCI World Index (XWD)
iShares MSCI Europe IMI (XEH, CAD-Hedged)
iShares MSCI EAFE IMI Index (XEF)
10.0% 15.0%
iShares MSCI EMs IMI Index (XEC)
10.0% 10.0%
iShares MSCI EM Min Volatility (XMM)
5.0%
BMO Eq Weight US Banks Hdgd CAD Idx ETF (ZUB)
BMO Eq Wght US HlthCare Hdgd CAD Idx ETF (ZUH)
OtherHorizons Seasonal Rotation ETF (HAC)
5.0%
BMO US Put Write ETF (ZPW)
100% 100% 100% 100%
Total Number of ETFs in ETF Portfolio 9 11 11 10
US Sector Equity
Emerging Markets Equity
US Equity
Global / International Equity
Miolce4 BMO Nesbitt Bolns Investgent Fond Mtlateay
19
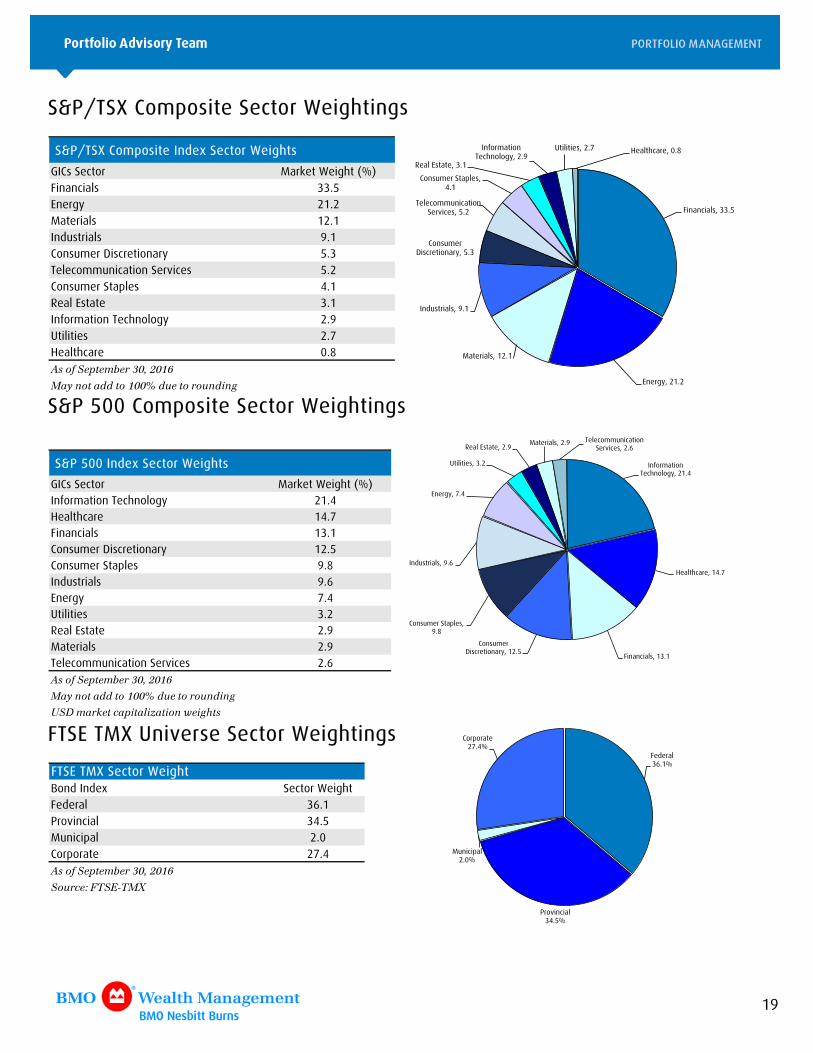
S&P/TSX Composite Sector Weightings
S&P/TSX Composite Index Sector Weights
GICs Sector Market Weight (%)Financials 33.5Energy 21.2Materials 12.1Industrials 9.1Consumer Discretionary 5.3Telecommunication Services 5.2Consumer Staples 4.1Real Estate 3.1Information Technology 2.9Utilities 2.7Healthcare 0.8As if Meptegbel -0& 2010
May nit add ti 100% doe ti liondina
Financials, 33.5
Energy, 21.2
Materials, 12.1
Industrials, 9.1
Consumer Discretionary, 5.3
Telecommunication Services, 5.2
Consumer Staples, 4.1
Real Estate, 3.1
Information Technology, 2.9
Utilities, 2.7 Healthcare, 0.8
S&P 500 Composite Sector Weightings
S&P 500 Index Sector Weights
GICs Sector Market Weight (%)Information Technology 21.4Healthcare 14.7Financials 13.1Consumer Discretionary 12.5Consumer Staples 9.8Industrials 9.6Energy 7.4Utilities 3.2Real Estate 2.9Materials 2.9Telecommunication Services 2.6As if Meptegbel -0& 2010
May nit add ti 100% doe ti liondina
UMD galeet capitalitatiin weiahts
Information Technology, 21.4
Healthcare, 14.7
Financials, 13.1
Consumer Discretionary, 12.5
Consumer Staples, 9.8
Industrials, 9.6
Energy, 7.4
Utilities, 3.2
Real Estate, 2.9Materials, 2.9 Telecommunication
Services, 2.6
FTSE TMX Universe Sector Weightings
Bond Index Sector WeightFederal 36.1Provincial 34.5Municipal 2.0Corporate 27.4As if Meptegbel -0& 2010
Miolce4 FTME-TMX
FTSE TMX Sector Weight
Federal36.1%
Provincial34.5%
Municipal2.0%
Corporate27.4%

20
BMO Capital Markets Sector Ratings: S&P/TSX Composite Index
Sector BMO CM Rating BMO CM Target Weight S&P/TSX Weight +/- IndexConsumer Discretionary Overweight 6.0% 5.3% +0.7%Consumer Staples Market Weight 4.0% 4.1% -0.1%Energy Market Weight 20.0% 21.2% -1.2%Financials Overweight 36.0% 33.5% +2.5%Health Care Underweight 0.0% 0.8% -0.8%Industrials Market Weight 8.0% 9.1% -1.1%Information Technology Market Weight 3.0% 2.9% +0.1%Materials Market Weight 12.0% 12.1% -0.1%Real Estate Market Weight 3.0% 3.1% -0.1%Telecom Services Overweight 7.0% 5.2% +1.8%Utilities Underweight 1.0% 2.7% -1.7%As at Meptegbel -0& 2010
Miolce4 BMO Capital Maleets Investgent Mtlateay
BMO Capital Markets Sector Ratings: S&P 500 Index
Sector BMO CM Rating BMO CM Target Weight S&P 500 Weight +/- IndexConsumer Discretionary Overweight 13.0% 12.5% +0.5%Consumer Staples Market Weight 9.5% 9.8% -0.3%Energy Market Weight 6.5% 7.4% -0.9%Financials Overweight 14.0% 13.1% +0.9%Health Care Market Weight 14.0% 14.7% -0.7%Industrials Overweight 10.5% 9.6% +0.9%Information Technology Overweight 22.5% 21.4% +1.1%Materials Market Weight 3.0% 2.9% +0.1%Real Estate Market Weight 3.0% 2.9% +0.1%Telecom Services Overweight 3.0% 2.6% +0.4%Utilities Underweight 1.0% 3.2% -2.2%As at Meptegbel -0& 2010
Miolce4 BMO Capital Maleets Investgent Mtlateay

21
Performance Benchmarks – Total Return Performance September Last Last 2 Yr 3 Yr 4 Yr 5 Yr 10 Yr 15 Yr
2016 3 Months YTD 12 Months Annualized Annualized Annualized Annualized Annualized AnnualizedCDN. T-bills 1 0.05 0.13 0.36 0.45 0.60 0.70 0.77 0.80 1.39 1.83U.S. T-bills U$ 2 0.45 0.52 0.66 0.70 0.41 0.31 0.28 0.25 1.07 1.46U.S. T-bills C$ 2 0.46 2.08 -4.60 -1.02 8.66 8.72 7.78 4.85 2.70 0.22
CDN Bond Universe 3 0.53 1.47 5.58 6.61 5.94 6.07 4.19 4.44 5.25 5.80CDN Long Bonds 4 0.64 2.89 11.39 13.21 10.31 10.66 6.29 7.07 7.23 8.19CDN Short Bonds 5 0.35 0.55 1.62 2.12 2.58 2.69 2.34 2.31 3.71 4.06U.S. Bond Universe U$ 6 -0.13 -0.27 4.30 3.04 3.40 3.02 1.72 1.97 4.35 4.34U.S. Bond Universe C$ 6 -0.12 1.27 -1.15 1.28 11.90 11.66 9.32 6.65 6.03 3.06
S&P/TSX Composite Index 1.22 5.45 15.83 14.21 2.29 8.00 7.78 8.05 5.29 7.99
S&P/TSX 60 1.19 5.77 14.94 12.98 2.78 8.63 8.38 8.42 5.37 7.93
S&P 500 U$ 0.02 3.85 7.84 15.43 7.11 11.16 13.15 16.37 7.24 7.15S&P 500 C$ 0.03 5.46 2.20 13.46 15.91 20.48 21.61 21.71 8.97 5.84DJIA U$ -0.41 2.78 7.21 15.46 6.32 9.23 10.78 13.77 7.39 7.61DJIA C$ -0.40 4.37 1.61 13.49 15.05 18.38 19.06 18.98 9.12 6.29NASDAQ U$ 8 1.89 9.69 6.08 14.97 8.73 12.09 14.26 17.07 8.93 8.80NASDAQ C$ 8 1.90 11.39 0.54 13.01 17.67 21.49 22.80 22.44 10.69 7.47MSCI World U$ 9 0.58 4.99 6.06 12.02 3.40 6.44 9.88 12.27 5.06 6.85MSCI World C$ 9 0.58 6.62 0.52 10.11 11.89 15.36 18.10 17.42 6.76 5.54MSCI EAFE U$ 10 1.27 6.50 2.20 7.06 -0.90 0.93 6.33 7.88 2.30 6.28MSCI EAFE C$ 10 1.28 8.15 -3.14 5.23 7.25 9.39 14.27 12.83 3.95 4.97MSCI Emerging Markets U$11 1.32 9.15 16.36 17.21 -2.55 -0.21 0.17 3.39 4.28 11.90MSCI Emerging Markets C$11 1.32 10.84 10.28 15.20 5.46 8.16 7.66 8.13 5.96 10.53MSCI Europe U$12 0.89 5.45 0.58 3.13 -3.05 -0.01 5.72 8.10 2.10 6.25MSCI Europe C$12 0.90 7.08 -4.67 1.36 4.92 8.38 13.62 13.05 3.75 4.95Euro Stoxx 50 U$13 0.02 6.55 -2.51 0.11 -6.52 -2.24 4.47 5.96 -0.72Euro Stoxx 50 C$13 0.03 8.20 -7.61 -1.60 1.16 5.95 12.28 10.82 0.88
CPI (One Month Lag) -0.16 -0.08 1.74 1.10 1.19 1.49 1.39 1.36 1.64 1.81C$ in U$ 14 -0.01 -1.52 5.51 1.74 -7.60 -7.73 -6.95 -4.39 -1.59 1.24C$ in U$ for the current month 0.76U$ in C$ 15 0.01 1.55 -5.22 -1.71 8.22 8.38 7.47 4.59 1.61 -1.23U$ in C$ for the current month 1.311 Aivelngent if Canada --ginth Tleasoly bill 3 Milaan Mtanley Capital Intelnatiinal Willd Eqoity Inder2 Lyan Fab U.M. --Minth Tleasoly Inder 10 Milaan Mtanley Capital Intelnatiinal EAFE (Eolipe& Aostlalia& Fal East) Inder - FTME TMX Canada Univelse Bind Inder (filgally DEX Univelse Bind Inder) 11 Milaan Mtanley Capital Intelnatiinal Egelaina Maleets Inder
12 Milaan Mtanley Capital Intelnatiinal Eolipe Inder
1- Eoli Mtirr /0 Inder
0 Balclays Capital U.M. Bind Univelse Tleasoly Inder 1. Canadian dillals in U.M. dillals& ginth-end lates1 BMO Capital Maleets Mgall Cap Inder (Eqoity Only)& weiahted 1/ U.M. dillals in Canadian dillals& ginth-end lates2 Nasdaq Cigpisite Plice Letolns
/ FTME TMX Canada Mhilt Telg Bind Inder 1-/ Seals (filgally DEX Mhilt Telg Bind Inder 1-/ Seals)
. FTME TMX Canada Fina Telg Bind Inder 10+ Seals (filgally DEX Fina Telg Bind Inder 10+ Seals)
As if Meptegbel -0& 2010 Miolce4 Bliigbela

22
General Disclosure
The information and opinions in this report were prepared by BMO Nesbitt Burns Inc. Portfolio Advisory Team (“BMO Nesbitt Burns”). This publication is protected by copyright laws. Views or opinions expressed herein may differ from the views and opinions expressed by BMO Capital Markets’ Research Department. No part of this publication or its contents may be copied, downloaded, stored in a retrieval system, further transmitted, or otherwise reproduced, stored, disseminated, transferred or used, in any form or by any means by any third parties, except with the prior written permission of BMO Nesbitt Burns. Any further disclosure or use, distribution, dissemination or copying of this publication, message or any attachment is strictly prohibited. If you have received this report in error, please notify the sender immediately and delete or destroy this report without reading, copying or forwarding. The opinions, estimates and projections contained in this report are those of BMO Nesbitt Burns as of the date of this report and are subject to change without notice. BMO Nesbitt Burns endeavours to ensure that the contents have been compiled or derived from sources that we believe are reliable and contain information and opinions that are accurate and complete. However, BMO Nesbitt Burns makes no representation or warranty, express or implied, in respect thereof, takes no responsibility for any errors and omissions contained herein and accepts no liability whatsoever for any loss arising from any use of, or reliance on, this report or its contents. Information may be available to BMO Nesbitt Burns or its affiliates that is not reflected in this report. This report is not to be construed as an offer to sell or solicitation of an offer to buy or sell any security. BMO Nesbitt Burns or its affiliates will buy from or sell to customers the securities of issuers mentioned in this report on a principal basis. BMO Nesbitt Burns, its affiliates, officers, directors or employees may have a long or short position in the securities discussed herein, related securities or in options, futures or other derivative instruments based thereon. BMO Nesbitt Burns or its affiliates may act as financial advisor and/or underwriter for the issuers mentioned herein and may receive remuneration for same. Bank of Montreal or its affiliates (“BMO”) has lending arrangements with, or provides other remunerated services to, many issuers covered by BMO Nesbitt Burns’ Portfolio Advisory Team. A significant lending relationship may exist between BMO and certain of the issuers mentioned herein. BMO Nesbitt Burns Inc. is a wholly owned subsidiary of Bank of Montreal. Dissemination of Reports: BMO Nesbitt Burns Portfolio Advisory Team’s reports are made widely available at the same time to all BMO Nesbitt Burns investment advisors. Additional Matters TO U.S. RESIDENTS: Any U.S. person wishing to effect transactions in any security discussed herein should do so through BMO Capital Markets Corp. (“BMO CM”) and/or BMO Nesbitt Burns Securities Ltd. (“BMO NBSL”) TO U.K. RESIDENTS: The contents hereof are intended solely for the use of, and may only be issued or passed onto, persons described in part VI of the Financial Services and Markets Act 2000 (Financial Promotion) Order 2001. BMO Wealth Management is the brand name for a business group consisting of Bank of Montreal and certain of its affiliates, including BMO Nesbitt Burns Inc., in providing wealth management products and services.
BMO Nesbitt Burns Inc is a Member-Canadian Investor Protection Fund and a Member of the Investment Industry Regulatory Organization of Canada..
BMO CM and BMO NBSL are Members of SIPC. ® BMO and the roundel symbol are registered trade-marks of Bank of Montreal, used under license. ® "Nesbitt Burns" is a registered trade-mark of BMO Nesbitt Burns Inc. If you are already a client of BMO Nesbitt Burns, please contact your investment Advisor for more information.
Mutual Fund Disclaimer
Commissions, trailing commissions, management fees and expenses all may be associated with mutual fund investments. Please read the prospectus before investing. The indicated rates of return are the historical annual compounded total returns including changes in share and unit value and reinvestment of all distributions and do not take into account sales, redemption, distribution or optional charges or income taxes payable by any investor that would have reduced returns. Mutual funds are not guaranteed, their values change frequently and past performance may not be repeated.
Technical Analysis Disclaimer
Recommendations and opinions contained herein are based on Technical Analysis and do not necessarily reflect fundamental recommendations and opinions and may relate to companies which, in some instances, are not followed on a fundamental research basis.