Embed Size (px)
Citation preview
OPEC Oil Market Outlook
Prepared by OPEC Secretariat
University of Vienna, Austria, 21st March 2018

© 2018 Organization of the Petroleum Exporting Countries
Disclaimer
2
“The data, analysis and any other information ('Content') contained in this presentation is for informational purposes and is intended solely for the useof the person(s) to whom it is addressed and may be legally privileged and/or confidential. Any unauthorized use, disclosure or copying of thisPresentation or any parts of it or its attachment(s) by any unintended recipient is strictly prohibited. If you have received this Presentation in error,please immediately return or destroy it. The Content of this Presentation is not intended as a substitute for advice from your business, finance,investment consultant or other professional. Whilst reasonable efforts have been made to ensure the accuracy of the Content of this Presentation, theOPEC Secretariat makes no warranties or representations as to its accuracy, currency or comprehensiveness and assumes no liability orresponsibility for any error or omission and/or for any loss arising in connection with or attributable to any action or decision taken as a result of usingor relying on the Content of this Presentation. Nothing in this Presentation shall be construed as interpreting or modifying any legal obligations underany agreement, treaty, law or other texts; or expressing any legal opinions or having probative legal value in any proceedings. This Presentation maycontain references to material(s) from third parties whose copyright must be acknowledged by obtaining necessary authorization from the copyrightowner(s). The OPEC Secretariat will not be liable or responsible for any unauthorized use of third party material(s). The views expressed in thisPresentation are those of the OPEC Secretariat and do not necessarily reflect the views of individual OPEC Member Countries.
The material contained in this Presentation may not be used and/or reproduced for any purposes without prior written permission from the OPECSecretariat”.

© 2018 Organization of the Petroleum Exporting Countries
Outline
● Introduction to OPEC
● Short-term market outlook
– Review of the oil market 2014-2016
– Declaration of Cooperation
– Supply/demand balances in the short-term
● Medium- and long-term market outlook
– Key assumptions
– Energy outlook
– Oil outlook
– Key takeaways
3

© 2018 Organization of the Petroleum Exporting Countries
What is OPEC?
OPEC is a permanent, intergovernmental organization established in Baghdad, Iraq,
10–14 September 1960. The Organization has its headquarters in Vienna, Austria.
The Organization comprises 14 Member Countries:
4
© 2018 Organization of the Petroleum Exporting Countries
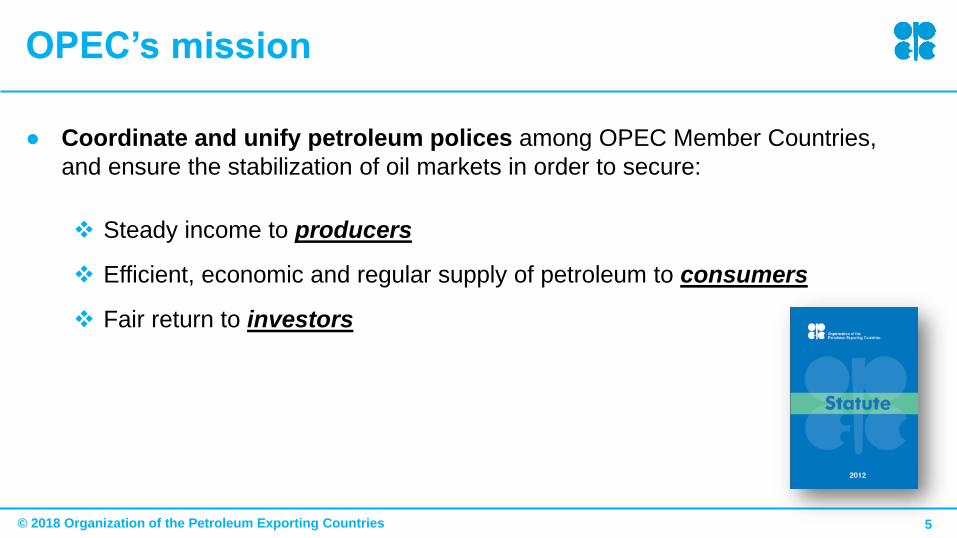
OPEC’s mission
● Coordinate and unify petroleum polices among OPEC Member Countries,
and ensure the stabilization of oil markets in order to secure:
Steady income to producers
Efficient, economic and regular supply of petroleum to consumers
Fair return to investors
5

© 2018 Organization of the Petroleum Exporting Countries
Short-term outlook
6
● Introduction to OPEC
● Short-term market outlook
– Review of the oil market 2014-2016
– Declaration of Cooperation
– Supply/demand balances in the short-term
● Medium- and long-term market outlook
– Key assumptions
– Energy outlook
– Oil outlook
– Key takeaways
© 2018 Organization of the Petroleum Exporting Countries
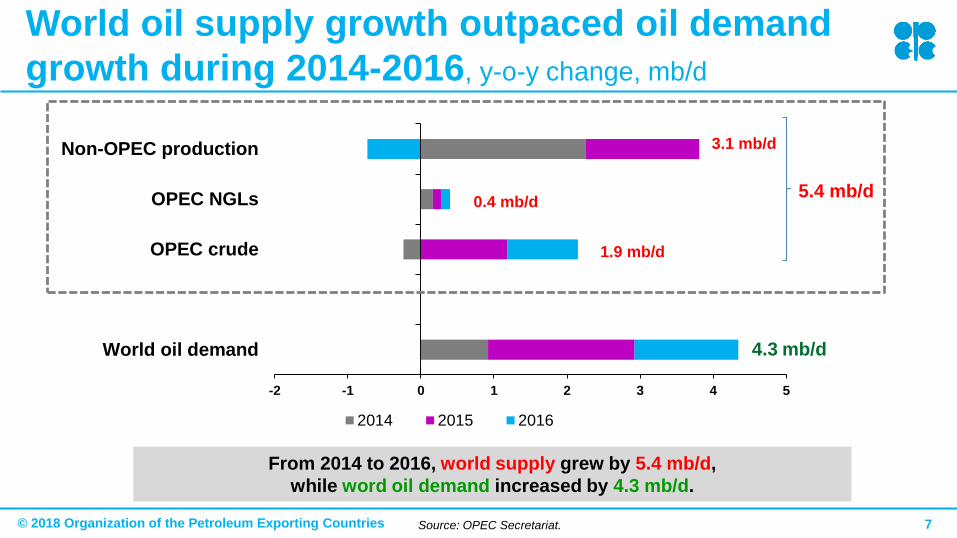
World oil supply growth outpaced oil demand
growth during 2014-2016, y-o-y change, mb/d
7
From 2014 to 2016, world supply grew by 5.4 mb/d,
while word oil demand increased by 4.3 mb/d.
-2 -1 0 1 2 3 4 5
World oil demand
OPEC crude
OPEC NGLs
Non-OPEC production 3.1 mb/d
2014 2015 2016
1.9 mb/d
0.4 mb/d
4.3 mb/d
5.4 mb/d
Source: OPEC Secretariat.
© 2018 Organization of the Petroleum Exporting Countries
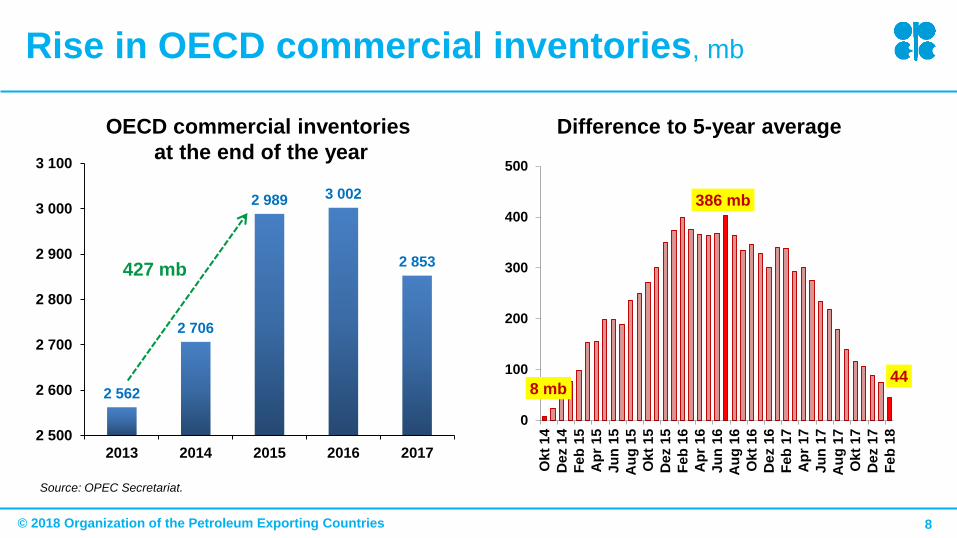
Rise in OECD commercial inventories, mb
8
2 562
2 706
2 989 3 002
2 853
2 500
2 600
2 700
2 800
2 900
3 000
3 100
2013 2014 2015 2016 2017
427 mb
OECD commercial inventories
at the end of the year
8 mb
386 mb
44
0
100
200
300
400
500
Ok
t 1
4
De
z 1
4
Fe
b 1
5
Ap
r 1
5
Ju
n 1
5
Au
g 1
5
Ok
t 1
5
De
z 1
5
Fe
b 1
6
Ap
r 16
Ju
n 1
6
Au
g 1
6
Okt
16
Dez 1
6
Fe
b 1
7
Ap
r 1
7
Ju
n 1
7
Au
g 1
7
Ok
t 1
7
De
z 1
7
Fe
b 1
8
Difference to 5-year average
Source: OPEC Secretariat.
© 2018 Organization of the Petroleum Exporting Countries
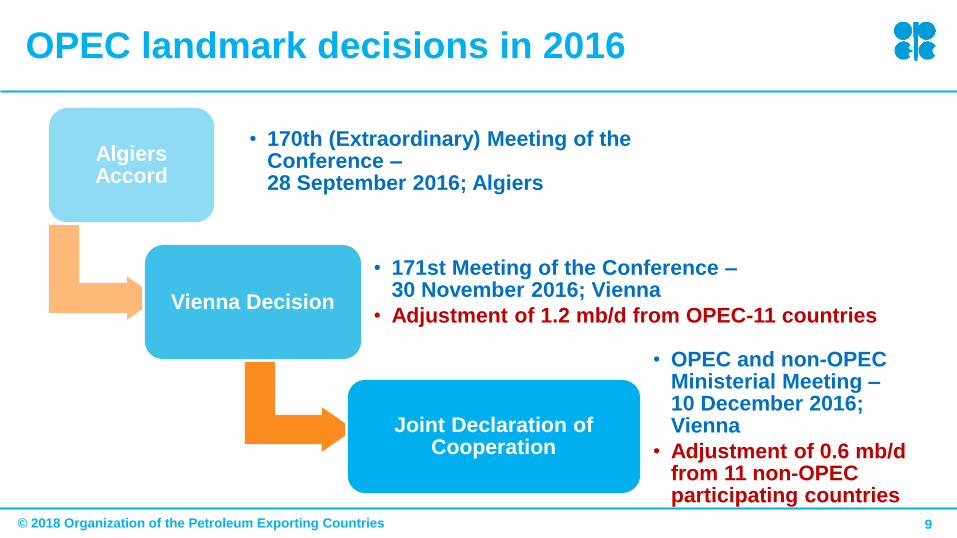
OPEC landmark decisions in 2016
9
Algiers Accord
• 170th (Extraordinary) Meeting of the Conference –28 September 2016; Algiers
Vienna Decision
• 171st Meeting of the Conference –30 November 2016; Vienna
• Adjustment of 1.2 mb/d from OPEC-11 countries
Joint Declaration of Cooperation
• OPEC and non-OPEC Ministerial Meeting –10 December 2016; Vienna
• Adjustment of 0.6 mb/d from 11 non-OPEC participating countries

© 2018 Organization of the Petroleum Exporting Countries
Drop in OECD commercial oil stock since
Declaration of Cooperation by component and region
10Sources: Euroilstock, IEA, METI, OPEC Secretariat and US EIA.
21852
119
-7
337
44
-1000
100200300400
Jan 17 Feb 18
Crude Products Total
By component
-293 mb
235
40
17
-8
85
12
337
44
-1000
100200300400
Jan 17 Jan 18
Americas Asia Pacific Europe OECD Total
By region
-293 mb
138%
111%
0%
20%
40%
60%
80%
100%
120%
140%
160%
Jän
.17
Fe
b.1
7
Mä
r.1
7
Ap
r.1
7
Ma
i.1
7
Ju
n.1
7
Ju
l.17
Au
g.1
7
Se
p.1
7
Ok
t.1
7
No
v.1
7
De
z.1
7
Jän
.18
Fe
b.1
8
Average
Conformity by OPEC and
non-OPEC participants, %

© 2018 Organization of the Petroleum Exporting Countries Sources: CFTC, CME Group, Intercontinental Exchange and OPEC Secretariat.
Crude oil prices improvedDriven by a sizeable stocks draw as well as signs of bullish market sentiment
11
4045505560657075
1 FM 6 FM 11 FM 16 FM
US$/b ICE Brent forward curve
Current
A year ago
6 months ago
25
35
45
55
65
75
Jän
.16
Mä
r.1
6
Ma
i.1
6
Ju
l.1
6
Se
p.1
6
No
v.1
6
Jä
n.1
7
Mä
r.1
7
Ma
i.1
7
Ju
l.1
7
Se
p.1
7
No
v.1
7
Jä
n.1
8
Mä
r.1
8
US$/b ICE Brent
921966
-600
0
600
1 200
1 800
Jän
.16
Mä
r.1
6
Ma
i.1
6
Ju
l.1
6
Se
p.1
6
No
v.1
6
Jän
.17
Mä
r.1
7
Ma
i.1
7
Ju
l.1
7
Se
p.1
7
No
v.1
7
Jän
.18
Mä
r.1
8
‘000 contracts Combined net long positions(ICE Brent & NYMEX WTI)
Long
Short
Net
0
5
10
15
20
Jän
.16
Mä
r.1
6
Ma
i.1
6
Ju
l.1
6
Sep
.16
No
v.1
6
Jän
.17
Mä
r.1
7
Ma
i.1
7
Ju
l.1
7
Se
p.1
7
No
v.1
7
Jän
.18
Mä
r.1
8
Ratio Ratio total long/short
© 2018 Organization of the Petroleum Exporting Countries
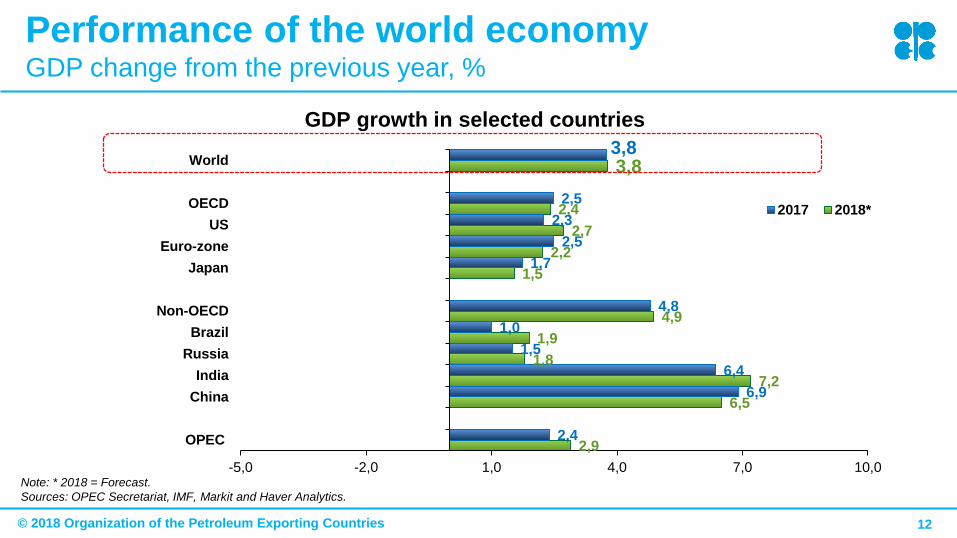
Performance of the world economyGDP change from the previous year, %
12
Note: * 2018 = Forecast.
Sources: OPEC Secretariat, IMF, Markit and Haver Analytics.
2,9
6,5
7,2
1,8
1,9
4,9
1,5
2,2
2,7
2,4
3,8
2,4
6,9
6,4
1,5
1,0
4,8
1,7
2,5
2,3
2,5
3,8
-5,0 -2,0 1,0 4,0 7,0 10,0
OPEC
China
India
Russia
Brazil
Non-OECD
Japan
Euro-zone
US
OECD
World
2017 2018*
GDP growth in selected countries
© 2018 Organization of the Petroleum Exporting Countries
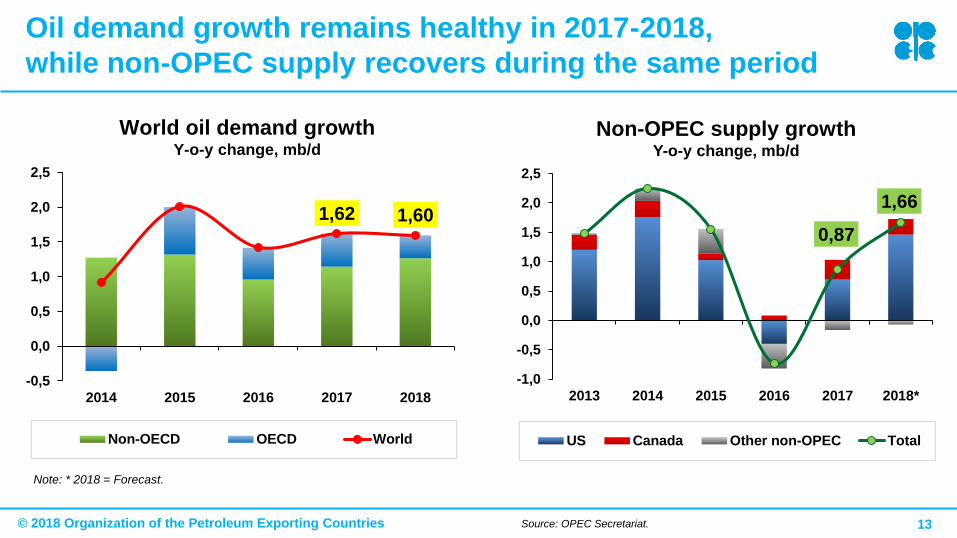
Oil demand growth remains healthy in 2017-2018,
while non-OPEC supply recovers during the same period
13
1,62 1,60
-0,5
0,0
0,5
1,0
1,5
2,0
2,5
2014 2015 2016 2017 2018
Non-OECD OECD World
World oil demand growthY-o-y change, mb/d
Note: * 2018 = Forecast.
Source: OPEC Secretariat.
0,87
1,66
-1,0
-0,5
0,0
0,5
1,0
1,5
2,0
2,5
2013 2014 2015 2016 2017 2018*
US Canada Other non-OPEC Total
Non-OPEC supply growthY-o-y change, mb/d

© 2018 Organization of the Petroleum Exporting Countries
Medium- and long-term outlook
14
● Introduction to OPEC
● Short-term market outlook
– Review of the oil market 2014-2016
– Declaration of Cooperation
– Supply/demand balances in the short-term
● Medium- and long-term market outlook
– Key assumptions
– Energy outlook
– Oil outlook
– Key takeaways

© 2018 Organization of the Petroleum Exporting Countries
The world is experiencing an era of demographic
change
15
• Global population to increase by
1.8 billion, reaching almost
9.2 billion in 2040
• India to become the most populated
country in the early 2020s and
population in China peaks in 2028
• Population growth in OECD
supported by migration
• Population growth will decelerate
Population by region (millions)
0,0
0,4
0,8
1,2
1,6
2,0
0
2 000
4 000
6 000
8 000
10 000
2015 2020 2025 2030 2035 2040
%million Non-OECDOECDOECD annual growthNon-OECD annual growth

© 2018 Organization of the Petroleum Exporting Countries
Economic growth in the long-term
16
• Long-term global GDP growth estimated
at an average rate of 3.5% p.a.
• Long-term economic growth will be
driven by Developing Countries, with
growth in the OECD constrained by
weaker demographics
• The size of the global economy in 2040
is estimated to be 126% that of 2016
• The Reference Case assumes an
evolutionary development of technology
and energy policy in the long-term
Long-term real GDP growth rates (%, 2011 PPP)
© 2018 Organization of the Petroleum Exporting Countries
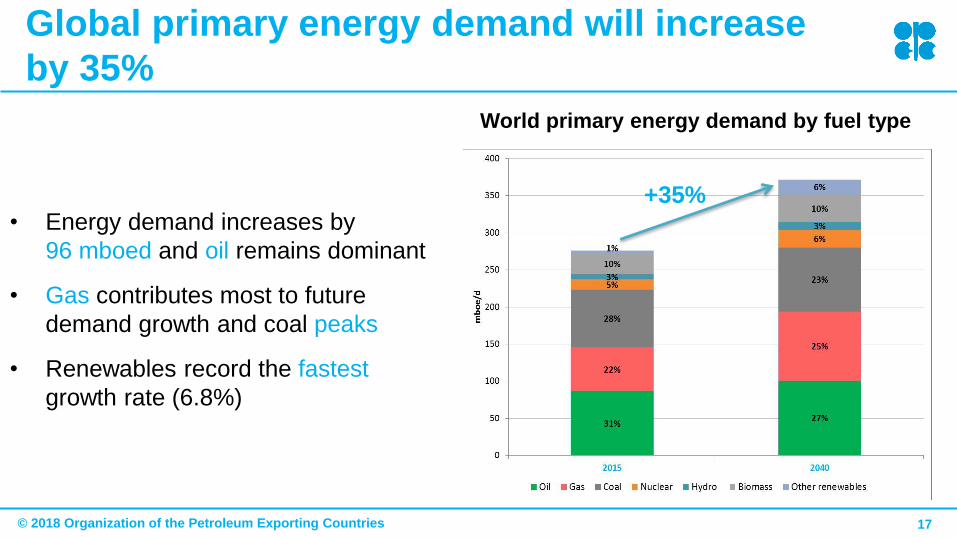
Global primary energy demand will increase
by 35%
17
• Energy demand increases by
96 mboed and oil remains dominant
• Gas contributes most to future
demand growth and coal peaks
• Renewables record the fastest
growth rate (6.8%)
World primary energy demand by fuel type
+35%
© 2018 Organization of the Petroleum Exporting Countries
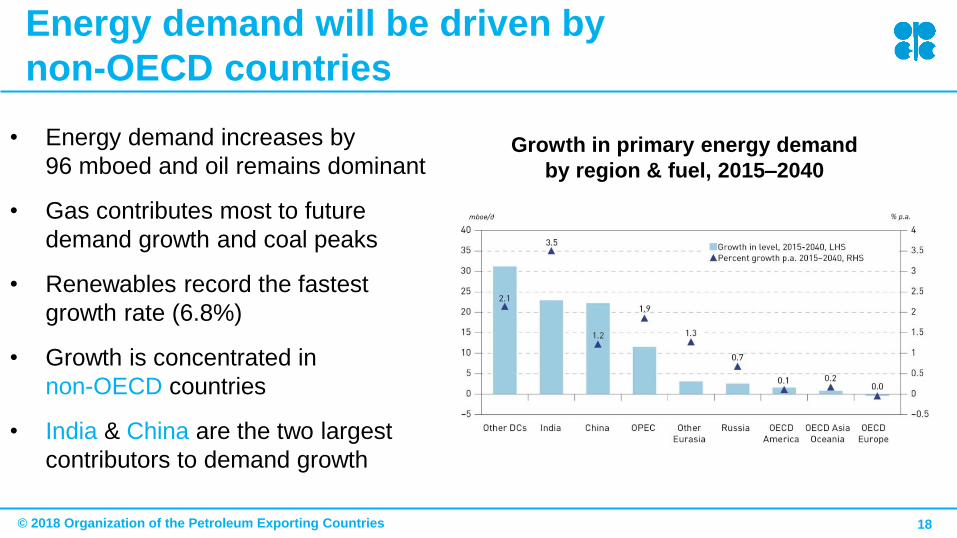
Energy demand will be driven by
non-OECD countries
18
• Energy demand increases by
96 mboed and oil remains dominant
• Gas contributes most to future
demand growth and coal peaks
• Renewables record the fastest
growth rate (6.8%)
• Growth is concentrated in
non-OECD countries
• India & China are the two largest
contributors to demand growth
Growth in primary energy demand
by region & fuel, 2015–2040

© 2018 Organization of the Petroleum Exporting Countries
Oil demand in the long-term
19
• In long term, global oil demand
will increase by 15.8 mb/d,
reaching 111.1 mb/d by 2040
• The transportation sector will
remain the main consumer of
oil
• Strong growth is also foreseen
in the petrochemicals sector
• Demand growth decelerates
over the long-term
World oil demand by sector
© 2018 Organization of the Petroleum Exporting Countries
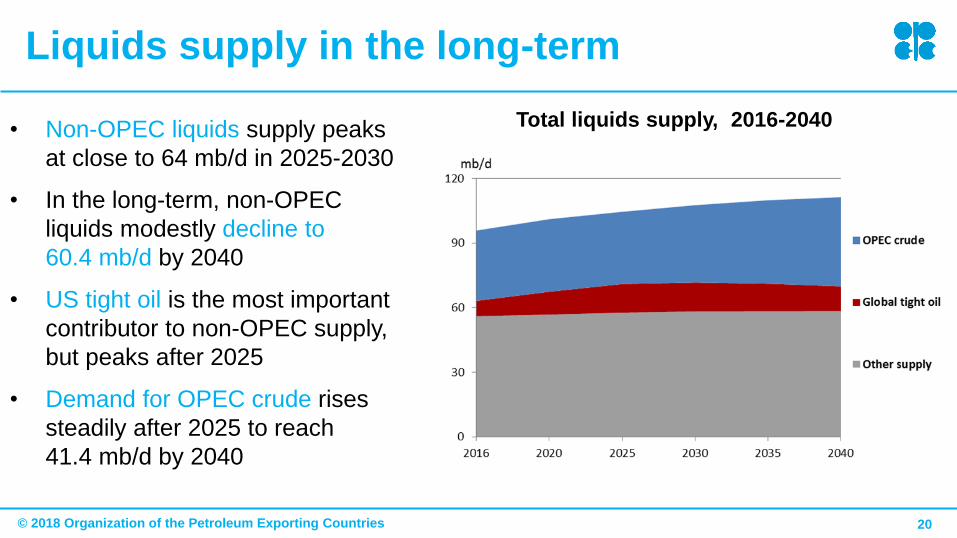
Total liquids supply, 2016-2040
Liquids supply in the long-term
20
• Non-OPEC liquids supply peaks
at close to 64 mb/d in 2025-2030
• In the long-term, non-OPEC
liquids modestly decline to
60.4 mb/d by 2040
• US tight oil is the most important
contributor to non-OPEC supply,
but peaks after 2025
• Demand for OPEC crude rises
steadily after 2025 to reach
41.4 mb/d by 2040

© 2018 Organization of the Petroleum Exporting Countries
Oil demand in the Economic Growth sensitivities
21
• Two alternative sensitivities: Higher
GDP growth (HG) and Lower GDP
growth (LG)
• Demand in 2040:
– Reference Case: 111.1 mb/d
– HG: 113.8 mb/d
– LG: 107.5 mb/d
• Overall uncertainty from GDP
growth is in the range of 6 mb/d in
2040
Long-term oil demand (mb/d)

© 2018 Organization of the Petroleum Exporting Countries
Oil demand in the penetration of EVs Sensitivity
Case
22
• Sensitivity Case: Penetration of
EVs is higher than in the
reference case
• Annual EV sales reach
80 million by 2040
• Oil demand in 2040 is reduced
by 2.5 mb/d compared to the
Reference Case, to
total 108.6 mb/d
• Global oil demand plateaus
around this level in the second
half of the 2030s
Long-term oil demand (mb/d) in the Reference Case and the Sensitivity Case

© 2018 Organization of the Petroleum Exporting Countries
Oil demand in the efficiency improvements
Sensitivity Case
23
• Accelerated Efficiency (AE)
Case assumes more
aggressive efficiency
improvements
• Overall demand reduction in
the AE case is 3.2 mb/d by
2040, reaching 107.9 mb/d
• Two-thirds of the demand
reduction takes place in DCs
Long-term oil demand (mb/d)
© 2018 Organization of the Petroleum Exporting Countries
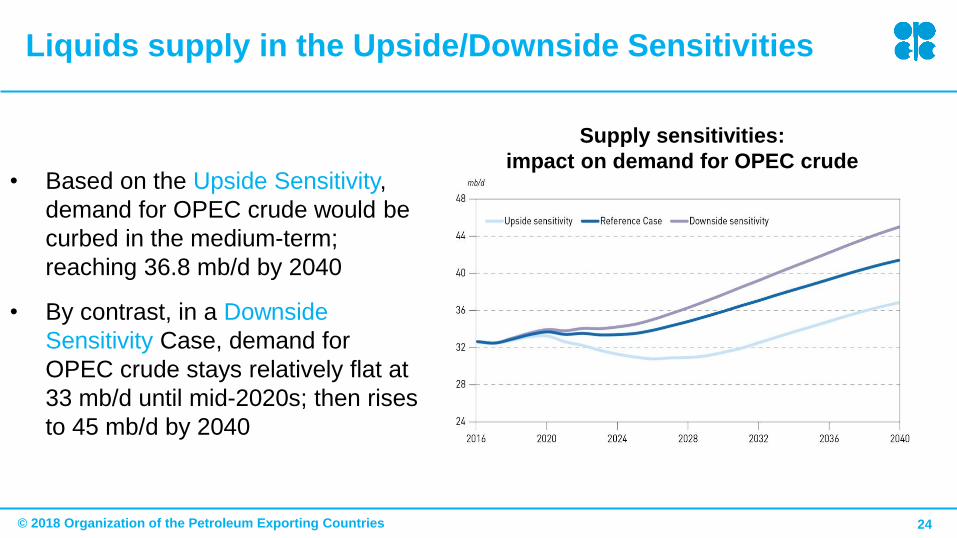
Liquids supply in the Upside/Downside Sensitivities
24
• Based on the Upside Sensitivity,
demand for OPEC crude would be
curbed in the medium-term;
reaching 36.8 mb/d by 2040
• By contrast, in a Downside
Sensitivity Case, demand for
OPEC crude stays relatively flat at
33 mb/d until mid-2020s; then rises
to 45 mb/d by 2040
Supply sensitivities:
impact on demand for OPEC crude

© 2018 Organization of the Petroleum Exporting Countries
Key takeaways
25
• During 2014 – 2016 global oil supply outpaced world oil demand growth, leading to excess supply
in the market and a strong deterioration in oil prices.
• The Declaration of Cooperation was a necessary response to the growing market imbalance.
• Assuming OPEC and non-OPEC continue at full conformity in the coming months, the market
rebalancing is expected by the end of the year.
• In the long-term, energy demand increases by 35% between 2015 and 2040.
• Global oil demand will increase by 15.8 mb/d, reaching 111.1 mb/d by 2040.
• US tight oil is the most important contributor to non-OPEC supply, but peaks after 2025, raising the
need for more OPEC crude.
• Economic developments, penetration of EVs and energy efficiency improvements constitute
critical uncertainties for future oil demand growth.

www.opec.org
Thank you
A comprehensive interactive version of the
WOO is available at www.opec.org
University of Vienna, Austria, 21st March 2018
26