Embed Size (px)
Citation preview
Long-Term Trash Load Reduction Plan
and Assessment Strategy
Submitted by:
City of Redwood City
1017 Middlefield Road,
Redwood City, CA 94063
In compliance with Provisions C.10.c of Order R2-2009-0074
January 30, 2014
ii
Page Intentionally Left Blank

City of Redwood City
iv
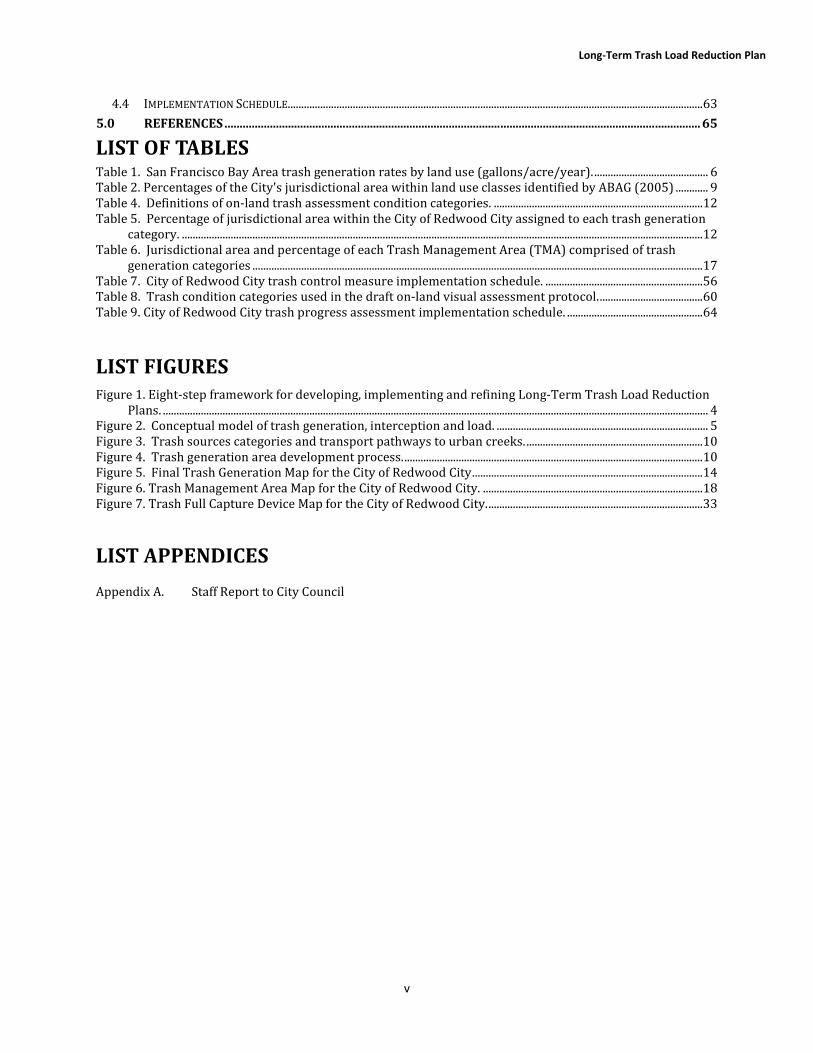
TABLEOFCONTENTS
CERTIFICATION STATEMENT .............................................................................................................................................. III
TABLE OF CONTENTS ............................................................................................................................................................. IV
LIST OF TABLES ......................................................................................................................................................................... V
LIST FIGURES ............................................................................................................................................................................. V
LIST APPENDICES ..................................................................................................................................................................... V
ABBREVIATIONS ...................................................................................................................................................................... VI
PREFACE ....................................................................................................................................................................................... 2
1.0 INTRODUCTION .......................................................................................................................................................... 3
1.1 PURPOSE OF LONG-TERM TRASH REDUCTION PLAN ................................................................................................................... 3
1.2 BACKGROUND ...................................................................................................................................................................................... 4
1.2.1 Long-Term Trash Load Reduction Plan Framework ......................................................................................... 4
1.2.2 BASMAA Generation Rates Project ............................................................................................................................ 5
1.2.3 Short-Term Trash Load Reduction Plan .................................................................................................................. 6
1.3 ORGANIZATION OF LONG-TERM PLAN ............................................................................................................................................ 8
2.0 SCOPE OF THE TRASH PROBLEM ......................................................................................................................... 9
2.1 PERMITTEE CHARACTERISTICS ......................................................................................................................................................... 9
2.2 TRASH SOURCES AND PATHWAYS .................................................................................................................................................... 9
2.3 TRASH GENERATING AREAS ............................................................................................................................................................ 10
2.3.1 Generation Categories and Designation of Areas .............................................................................................. 10
2.3.2 Summary of Trash Generating Areas and Sources ............................................................................................ 12
3.0 TRASH MANAGEMENT AREAS AND CONTROL MEASURES ...................................................................... 16
3.1 MANAGEMENT AREA DELINEATION AND PRIORITIZATION ....................................................................................................... 16
3.2 CURRENT AND PLANNED TRASH CONTROL MEASURES ............................................................................................................. 20
3.2.1 Jurisdiction-wide Control Measures ........................................................................................................................ 20
3.2.2 Trash Management Area #1 ........................................................................................................................................ 27
3.2.3 Trash Management Area #2 ........................................................................................................................................ 35
3.2.4 Trash Management Area #3 ........................................................................................................................................ 38
3.2.5 Trash Management Area #4 ........................................................................................................................................ 42
3.2.6 Trash Management Area #5 ........................................................................................................................................ 45
3.2.7 Trash Management Area #6 ........................................................................................................................................ 48
3.2.8 Creek and Shoreline Hot Spot Cleanups ................................................................................................................ 51
3.2.9 Summary of Trash Control Measures ..................................................................................................................... 52
3.3 CONTROL MEASURE IMPLEMENTATION SCHEDULE.................................................................................................................... 55
4.0 PROGRESS ASSESSMENT STRATEGY ................................................................................................................ 58
4.1 SMCWPPP PILOT ASSESSMENT STRATEGY................................................................................................................................ 58
4.1.1 Management Questions ................................................................................................................................................. 58
4.1.2 Indicators of Progress and Success .......................................................................................................................... 58
4.1.3 Pilot Assessment Methods ........................................................................................................................................... 59
4.2 BASMAA “TRACKING CALIFORNIA’S TRASH” PROJECT ............................................................................................................ 62
4.2.1 Testing of Trash Monitoring Methods .................................................................................................................... 62
4.2.2 Full Capture Equivalent Studies ................................................................................................................................ 63
4.3 LONG-TERM ASSESSMENT STRATEGY ........................................................................................................................................... 63
Long-Term Trash Load Reduction Plan
v
4.4 IMPLEMENTATION SCHEDULE......................................................................................................................................................... 63
5.0 REFERENCES ............................................................................................................................................................. 65
LISTOFTABLES Table 1. San Francisco Bay Area trash generation rates by land use (gallons/acre/year). .......................................... 6
Table 2. Percentages of the City's jurisdictional area within land use classes identified by ABAG (2005) ............ 9
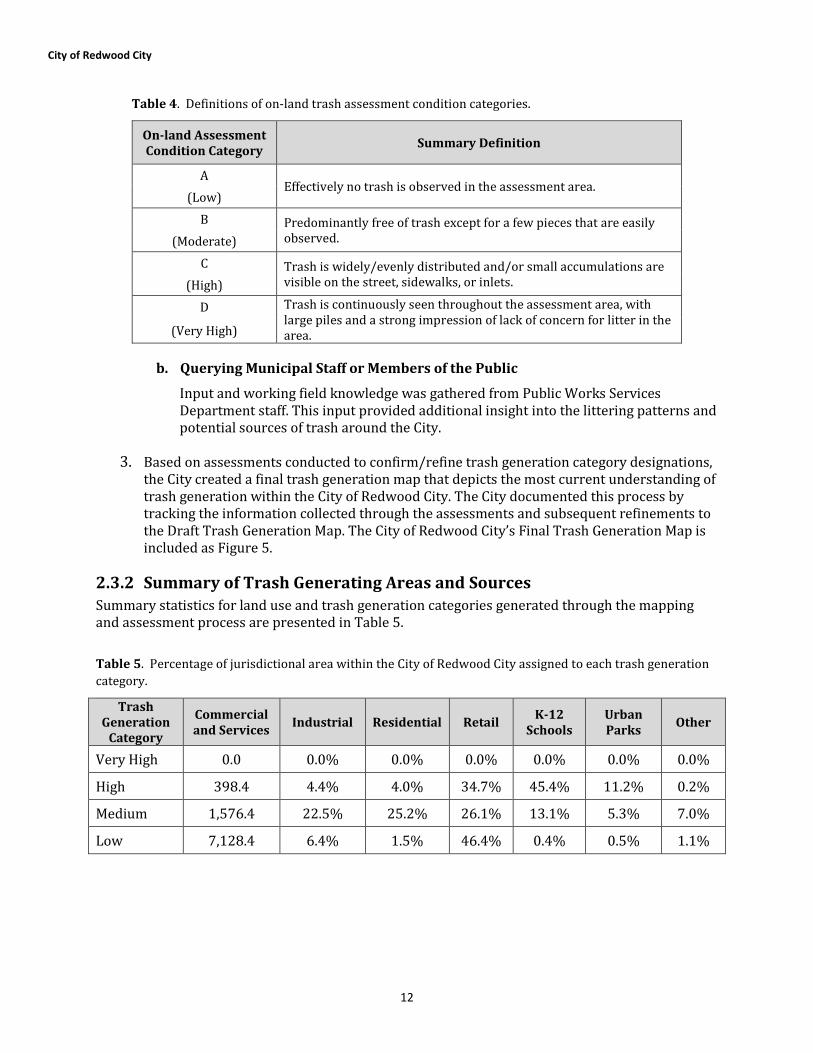
Table 4. Definitions of on-land trash assessment condition categories. ............................................................................. 12
Table 5. Percentage of jurisdictional area within the City of Redwood City assigned to each trash generation
category. ................................................................................................................................................................................................ 12
Table 6. Jurisdictional area and percentage of each Trash Management Area (TMA) comprised of trash
generation categories ...................................................................................................................................................................... 17
Table 7. City of Redwood City trash control measure implementation schedule. .......................................................... 56
Table 8. Trash condition categories used in the draft on-land visual assessment protocol. ...................................... 60
Table 9. City of Redwood City trash progress assessment implementation schedule. .................................................. 64
LISTFIGURES
Figure 1. Eight-step framework for developing, implementing and refining Long-Term Trash Load Reduction
Plans. ......................................................................................................................................................................................................... 4 Figure 2. Conceptual model of trash generation, interception and load. .............................................................................. 5 Figure 3. Trash sources categories and transport pathways to urban creeks. ................................................................. 10 Figure 4. Trash generation area development process. .............................................................................................................. 10 Figure 5. Final Trash Generation Map for the City of Redwood City ..................................................................................... 14 Figure 6. Trash Management Area Map for the City of Redwood City. ................................................................................. 18 Figure 7. Trash Full Capture Device Map for the City of Redwood City. ............................................................................... 33
LISTAPPENDICES
Appendix A. Staff Report to City Council
City of Redwood City
vi
ABBREVIATIONS
ABAG Association of Bay Area Governments BASMAA Bay Area Stormwater Management Agencies Association BID Business Improvement District CalRecycle California Department of Resources Recycling and Recovery Caltrans California Department of Transportation CASQA California Stormwater Quality Association CDS Continuous Deflection Separator CEQA California Environmental Quality Act CY Cubic Yards EIR Environmental Impact Report EPA Environmental Protection Agency FY Fiscal Year GIS Geographic Information System MRP Municipal Regional Stormwater NPDES Permit MS4 Municipal Separate Storm Sewer System NGO Non-Governmental Organization NPDES National Pollutant Discharge Elimination System PIP Public Information and Outreach PSA Public Service Announcement Q Flow SFRWQCB San Francisco Regional Water Quality Control Board SMCWPPP San Mateo County Water Pollution Prevention Program SWRCB State Water Resource Control Board TMA Trash Management Area TMDL Total Maximum Daily Load USEPA United States Environmental Protection Agency Water Board San Francisco Regional Water Quality Control Board WDR Waste Discharge Requirements
City of Redwood City
2
PREFACE
This Long-Term Trash Load Reduction Plan and Assessment Strategy (Long-Term Plan) is submitted in compliance with provision C.10.c of the Municipal Regional Stormwater NPDES Permit (MRP) for Phase I communities in the San Francisco Bay (Order R2-2009-0074). The Long-Term Plan was developed using a regionally consistent outline and guidance developed by the Bay Area Stormwater Management Agencies Association (BASMAA) and reviewed by San Francisco Bay Regional Water Quality Control Board staff. The Long-Term Plan is consistent with the Long-Term Trash Load Reduction Framework developed in collaboration with Water Board staff. Its content is based on the City of Redwood City’s current understanding of trash problems within its jurisdiction and the effectiveness of control measures designed to reduce trash impacts associated with Municipal Separate Storm Sewer (MS4) discharges. This Long-Term Plan is intended to be iterative and may be modified in the future based on information gained through the implementation of trash control measures. The City of Redwood City therefore reserves the right to revise or amend this Long-Term Plan at its discretion. If significant revisions or amendments are made by the City, a revised Long-Term Plan will be submitted to the Water Board through the City’s annual reporting process.


Long-Term Trash Load Reduction Plan
3
1.0 INTRODUCTION
1.1 Purpose of Long-Term Trash Reduction Plan
The Municipal Regional Stormwater National Pollutant Discharge Elimination System (NPDES) Permit for Phase I communities in the San Francisco Bay (Order R2-2009-0074), also known as the Municipal Regional Permit (MRP), became effective on December 1, 2009. The MRP applies to 76 large, medium and small municipalities (cities, towns and counties) and flood control agencies in the San Francisco Bay Region, collectively referred to as Permittees. Provision C.10.c of the MRP requires Permittees to submit a Long-Term Trash Load Reduction Plan (Long-Term Plan) by February 1, 2014. Long-Term Plans must describe control measures that are currently being implemented, including the level of implementation, and additional control measures that will be implemented and/or increased level of implementation designed to attain a 70% trash load reduction by July 1, 2017, and 100% (i.e., “No Adverse Impact”) by July 1, 2022. This Long-Term Plan is submitted by the City of Redwood City in compliance with MRP provision C.10.c. Consistent with provision C.10 requirements, the goal of the Long-Term Plan is to solve trash problems in receiving waters by reducing the impacts associated with trash in discharges from the City’s municipal separate storm sewer system (MS4) that are regulated by NPDES Permit requirements. The Long-Term Plan includes:
1. Descriptions of the current level of implementation of trash control measures, and the type and extent to which new or enhanced control measures will be implemented to achieve a target of 100% (i.e. full) trash reduction from MS4s by July 1, 2022, with an interim milestone of 70% reduction by July 1, 2017;
2. A description of the Trash Assessment Strategy that will be used assess progress towards trash reduction targets achieved as a result of control measure implementation; and,
3. Time schedules for implementing control measures and the assessment strategy. The Long-Term Plan was developed using a regionally consistent outline and guidance developed by the Bay Area Stormwater Management Agencies Association (BASMAA) and reviewed by the San Francisco Bay Regional Water Quality Control Board (Water Board) staff. The Long-Term Plan is consistent with the Long-Term Trash Load Reduction Framework (see section 1.2.1) developed in collaboration with Water Board staff. Its content is based on the City’s current understanding of trash problems within its jurisdiction and the effectiveness of control measures designed to reduce trash impacts associated with Municipal Separate Storm Sewer (MS4) discharges. The Long-Term Plan builds upon trash control measures implemented by the City prior to the adoption of the MRP and during the implementation of the Short-Term Trash Load Reduction Plan submitted to the Water Board on February 1, 2012. On February 24, 2014, this Long-Term Plan will be provided to the City of Redwood City’s Council as an informational item. The City's Staff Report is attached as Appendix A.
City of Redwood City
4
1.2 Background
1.2.1 Long-Term Trash Load Reduction Plan Framework
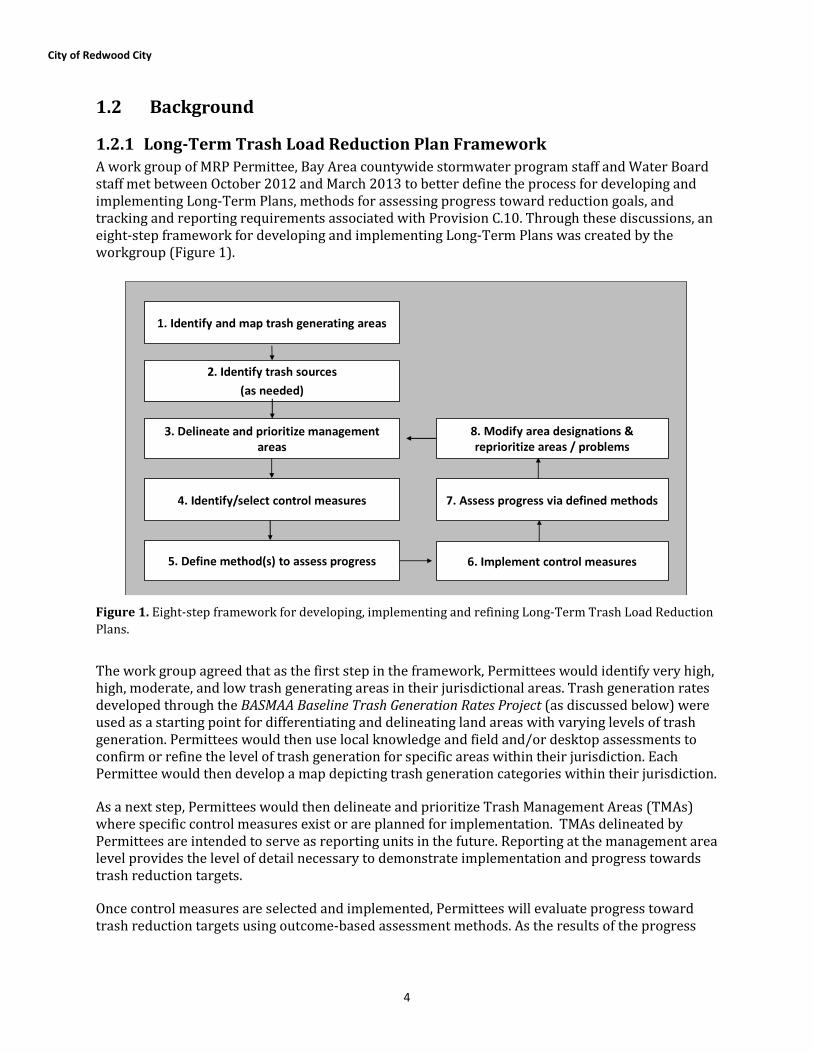
A work group of MRP Permittee, Bay Area countywide stormwater program staff and Water Board staff met between October 2012 and March 2013 to better define the process for developing and implementing Long-Term Plans, methods for assessing progress toward reduction goals, and tracking and reporting requirements associated with Provision C.10. Through these discussions, an eight-step framework for developing and implementing Long-Term Plans was created by the workgroup (Figure 1).
Figure 1. Eight-step framework for developing, implementing and refining Long-Term Trash Load Reduction
Plans.
The work group agreed that as the first step in the framework, Permittees would identify very high, high, moderate, and low trash generating areas in their jurisdictional areas. Trash generation rates developed through the BASMAA Baseline Trash Generation Rates Project (as discussed below) were used as a starting point for differentiating and delineating land areas with varying levels of trash generation. Permittees would then use local knowledge and field and/or desktop assessments to confirm or refine the level of trash generation for specific areas within their jurisdiction. Each Permittee would then develop a map depicting trash generation categories within their jurisdiction.
As a next step, Permittees would then delineate and prioritize Trash Management Areas (TMAs) where specific control measures exist or are planned for implementation. TMAs delineated by Permittees are intended to serve as reporting units in the future. Reporting at the management area level provides the level of detail necessary to demonstrate implementation and progress towards trash reduction targets.
Once control measures are selected and implemented, Permittees will evaluate progress toward trash reduction targets using outcome-based assessment methods. As the results of the progress
5. Define method(s) to assess progress
4. Identify/select control measures
3. Delineate and prioritize management
areas
2. Identify trash sources
(as needed)
8. Modify area designations &
reprioritize areas / problems
7. Assess progress via defined methods
6. Implement control measures
1. Identify and map trash generating areas

Long-Term Trash Load Reduction Plan
5
assessments are available, Permittees may choose to reprioritize trash management areas and associated control measures designed to improve trash reduction within their jurisdictions.
1.2.2 BASMAA Generation Rates Project
Through approval of a BASMAA regional project in 2010, Permittees agreed to work collaboratively to develop a regionally consistent method to establish trash generation rates within their jurisdictions. The project, also known as the BASMAA Trash Generation Rates Project (Generation Rates Project) assisted Permittees in establishing the rates of trash generation and identifying very high, high, moderate and low trash generating areas. The term “trash generation” refers to the rate at which trash is produced or generated onto the surface of the watershed and is potentially available for transport via MS4s to receiving waters. Generation rates do not explicitly take into account existing control measures that intercept trash prior to transport. Generation rates are expressed as trash volume/acre/year and were established via the Generation Rates Project. In contrast to trash generation, the term “trash loading” refers to the rate at which trash from MS4s enters receiving waters. Trash loading rates are also expressed as trash volume/acre/year and are equal to or less than trash generation rates because they account for the effects of control measures that intercept trash generated in an area before it is discharged to a receiving water. Trash loading rates are specific to particular areas because they are dependent upon the effectiveness of control measures implemented within an area. Figure 2 illustrates the difference between trash generation and loading.
Figure 2. Conceptual model of trash generation, interception and load.
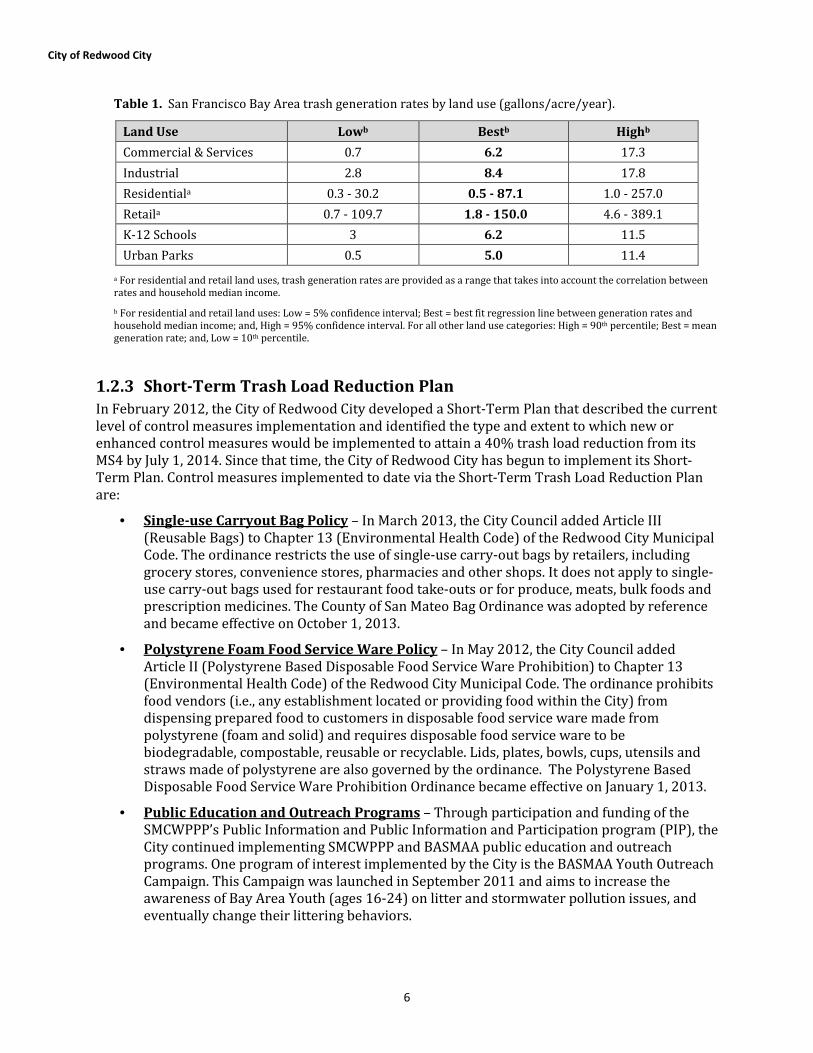
Trash generation rates were estimated based on factors that significantly affect trash generation (i.e., land use and income). The method used to the establish trash generation rates for each Permittee builds off “lessons learned” from previous trash loading studies conducted in urban areas (Allison and Chiew 1995; Allison et al. 1998; Armitage et al. 1998; Armitage and Rooseboom 2000; Lippner et al. 2001; Armitage 2003; Kim et al. 2004; County of Los Angeles 2002, 2004a, 2004b; Armitage 2007). The method is based on a conceptual model developed as an outgrowth of these studies (BASMAA 2011b). Trash generation rates were developed through the quantification and characterization of trash captured in Water Board-recognized full-capture treatment devices installed in the San Francisco Bay area. Trash generation rates estimated from this study are listed for each land use type in Table 1. Methods used to develop trash generation rates are more fully described in BASMAA (2011b, 2011c, and 2012).
City of Redwood City
6
Table 1. San Francisco Bay Area trash generation rates by land use (gallons/acre/year).
Land Use Lowb Bestb Highb
Commercial & Services 0.7 6.2 17.3
Industrial 2.8 8.4 17.8
Residentiala 0.3 - 30.2 0.5 - 87.1 1.0 - 257.0
Retaila 0.7 - 109.7 1.8 - 150.0 4.6 - 389.1
K-12 Schools 3 6.2 11.5
Urban Parks 0.5 5.0 11.4
a For residential and retail land uses, trash generation rates are provided as a range that takes into account the correlation between
rates and household median income.
b For residential and retail land uses: Low = 5% confidence interval; Best = best fit regression line between generation rates and
household median income; and, High = 95% confidence interval. For all other land use categories: High = 90th percentile; Best = mean
generation rate; and, Low = 10th percentile.
1.2.3 Short-Term Trash Load Reduction Plan
In February 2012, the City of Redwood City developed a Short-Term Plan that described the current level of control measures implementation and identified the type and extent to which new or enhanced control measures would be implemented to attain a 40% trash load reduction from its MS4 by July 1, 2014. Since that time, the City of Redwood City has begun to implement its Short-Term Plan. Control measures implemented to date via the Short-Term Trash Load Reduction Plan are:
• Single-use Carryout Bag Policy – In March 2013, the City Council added Article III (Reusable Bags) to Chapter 13 (Environmental Health Code) of the Redwood City Municipal Code. The ordinance restricts the use of single-use carry-out bags by retailers, including grocery stores, convenience stores, pharmacies and other shops. It does not apply to single-use carry-out bags used for restaurant food take-outs or for produce, meats, bulk foods and prescription medicines. The County of San Mateo Bag Ordinance was adopted by reference and became effective on October 1, 2013.
• Polystyrene Foam Food Service Ware Policy – In May 2012, the City Council added Article II (Polystyrene Based Disposable Food Service Ware Prohibition) to Chapter 13 (Environmental Health Code) of the Redwood City Municipal Code. The ordinance prohibits food vendors (i.e., any establishment located or providing food within the City) from dispensing prepared food to customers in disposable food service ware made from polystyrene (foam and solid) and requires disposable food service ware to be biodegradable, compostable, reusable or recyclable. Lids, plates, bowls, cups, utensils and straws made of polystyrene are also governed by the ordinance. The Polystyrene Based Disposable Food Service Ware Prohibition Ordinance became effective on January 1, 2013.
• Public Education and Outreach Programs – Through participation and funding of the SMCWPPP’s Public Information and Public Information and Participation program (PIP), the City continued implementing SMCWPPP and BASMAA public education and outreach programs. One program of interest implemented by the City is the BASMAA Youth Outreach Campaign. This Campaign was launched in September 2011 and aims to increase the awareness of Bay Area Youth (ages 16-24) on litter and stormwater pollution issues, and eventually change their littering behaviors.
Long-Term Trash Load Reduction Plan
7
• On-land Cleanups – One part-time employee patrols and removes trash (i.e., large items) from trash hot spots and known illegal dumping areas five days a week throughout the City. The City’s Public Works Services Department manages individuals provided by the County’s Sheriffs Work Program. Work conducted may include removing trash and debris from public rights-of-way and streets, and providing landscape maintenance. In addition, the City-supported Pride & Beautification Committee sponsors two annual on-land cleanups in the spring and fall each year. Volunteers remove litter and illegally dumped trash from school sites, the waterfront, parks, streets and other areas. Each event has been a great success at bringing volunteers together in beautifying the City. Lastly, the City conducts on-land cleanups within the downtown area five days/week to improve overall aesthetics and reduce trash loads to the MS4.
• Improved Trash Bin/Container Management – The City is managing the volume of trash generated by pedestrians within the downtown area by providing an adequate number of bins. The City also reaches out to businesses with inadequate trash containers to help them obtain the appropriate level of service to handle their respective trash loads.
• Street Sweeping – The City’s street sweeping includes sweeping certain streets within the immediate downtown area four times/week, sweeping streets in residential, commercial and industrial areas once/month, and sweeping large arterial roads (e.g., El Camino Real and Woodside Road (between El Camino Real and Alameda de las Pulgas) once/week with the exception of Woodside Road (between Broadway and El Camino Real) once/month. “No Parking- Street Cleaning” signs are posted for street sweeping on Douglas Avenue (between Spring Street and Middlefield Road) and Marshall Street (between Chestnut Street and Maple Street). As a result, sweeping practices on both streets are effective since the sweeper is reaching the curb. In August 2013, the City purchased a Madvac LR50 ride-on vacuum to complement existing street sweeping and further reduce trash loads within the downtown area.
• Full-Capture Treatment Devices –In 2012 and 2013, the City installed 148 small full-capture devices (i.e., connector pipe screens) within an eastern portion of the City. A total of 131 small full-capture devices were installed within the downtown area. The area treated by the 148 small full capture devices is approximately 200 acres of land. This equates to approximately 2.2 % of the City’s jurisdictional area. These installations fulfill Permit Provision C.10.a.ii Minimum Full Trash Capture requirement of 93 acres. These devices are inspected and maintained a minimum of four times/year. Additional inspection and maintenance is conducted, as necessary after large storms.
• Creek Hot Spot Cleanups –The City has three creek hot spots. Each hot spot is cleaned annually in compliance with Permit Provision C.10.b. iii of the MRP. The volume of debris collected at each hot spot will continue to be tracked and reported annually. Cleanups have been occurring since 2010.
Control measures described in this Long-Term Plan build upon actions taken to-date via the City’s Short-Term Plan. A full description of control measures implemented via Short and Long-Term Plans is included in Section 3.2. Outcomes associated with Short-Term Plan implementation will be reported in the City’s FY 2013-2014 Annual Report, scheduled for submittal to the Water Board by September 15, 2014.

City of Redwood City
8
1.3 Organization of Long-Term Plan
This Long-Term Plan is organized into the following sections:
1.0 Introduction;
2.0 Scope of the Trash Problem;
3.0 Trash Management Areas and Control Measures;
4.0 Progress Assessment Strategies; and
5.0 References Section 2.0 is intended to provide a description of the extent and magnitude of the trash problem in the City of Redwood City. Control measures that will be implemented by the City as a result of this Long-Term Plan are described in Section 3.0. Section 4.0 describes the methods that will be used to assess progress toward trash reduction targets.
Long-Term Trash Load Reduction Plan
9
2.0 SCOPEOFTHETRASHPROBLEM
2.1 Permittee Characteristics
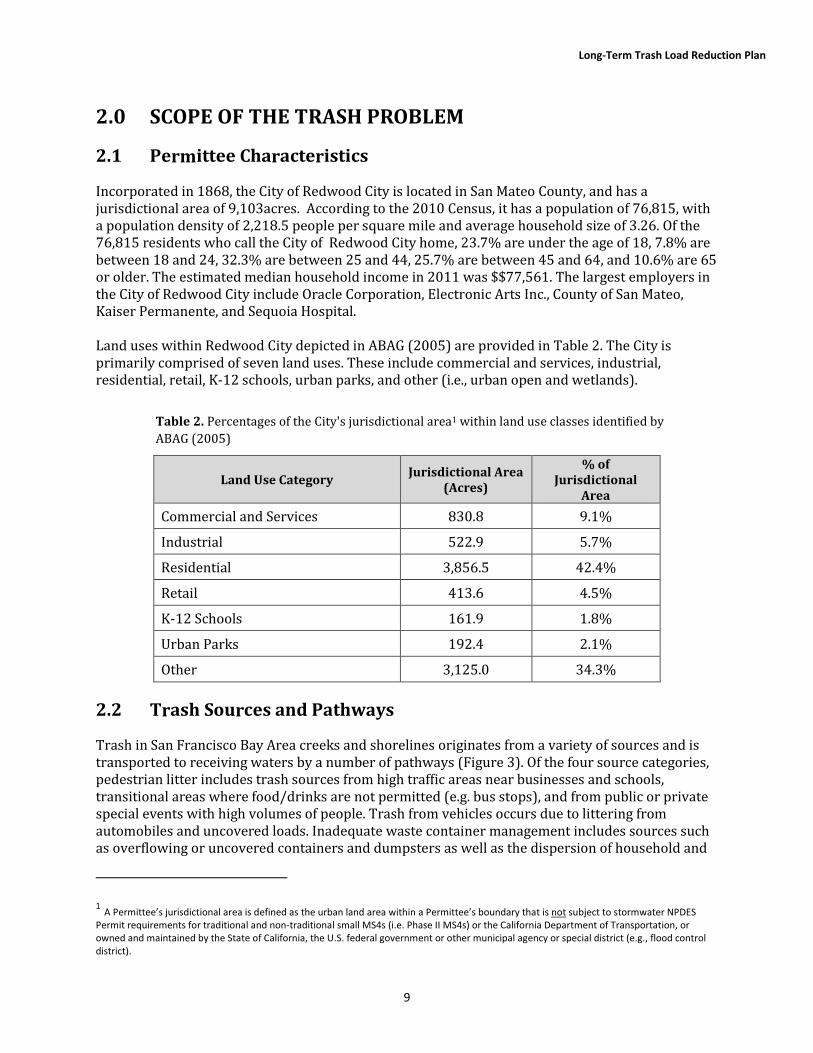
Incorporated in 1868, the City of Redwood City is located in San Mateo County, and has a jurisdictional area of 9,103acres. According to the 2010 Census, it has a population of 76,815, with a population density of 2,218.5 people per square mile and average household size of 3.26. Of the 76,815 residents who call the City of Redwood City home, 23.7% are under the age of 18, 7.8% are between 18 and 24, 32.3% are between 25 and 44, 25.7% are between 45 and 64, and 10.6% are 65 or older. The estimated median household income in 2011 was $$77,561. The largest employers in the City of Redwood City include Oracle Corporation, Electronic Arts Inc., County of San Mateo, Kaiser Permanente, and Sequoia Hospital. Land uses within Redwood City depicted in ABAG (2005) are provided in Table 2. The City is primarily comprised of seven land uses. These include commercial and services, industrial, residential, retail, K-12 schools, urban parks, and other (i.e., urban open and wetlands).
Table 2. Percentages of the City's jurisdictional area1 within land use classes identified by
ABAG (2005)
Land Use Category Jurisdictional Area
(Acres)
% of
Jurisdictional
Area
Commercial and Services 830.8 9.1%
Industrial 522.9 5.7%
Residential 3,856.5 42.4%
Retail 413.6 4.5%
K-12 Schools 161.9 1.8%
Urban Parks 192.4 2.1%
Other 3,125.0 34.3%
2.2 Trash Sources and Pathways
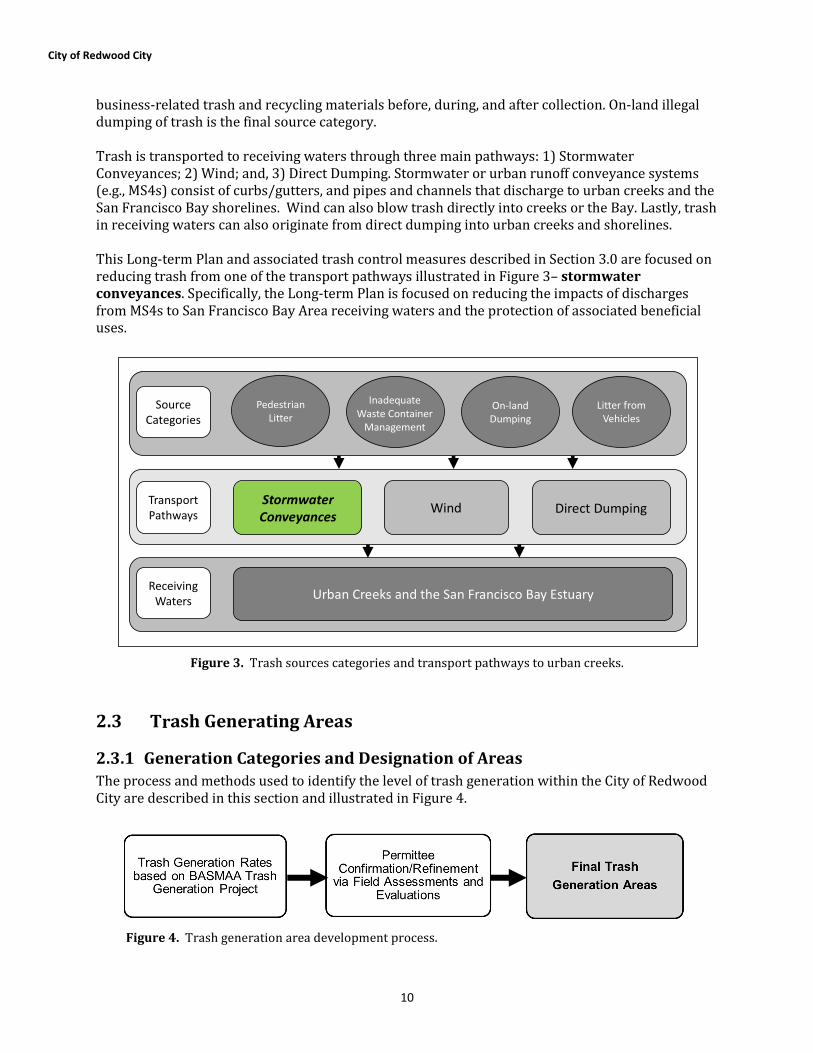
Trash in San Francisco Bay Area creeks and shorelines originates from a variety of sources and is transported to receiving waters by a number of pathways (Figure 3). Of the four source categories, pedestrian litter includes trash sources from high traffic areas near businesses and schools, transitional areas where food/drinks are not permitted (e.g. bus stops), and from public or private special events with high volumes of people. Trash from vehicles occurs due to littering from automobiles and uncovered loads. Inadequate waste container management includes sources such as overflowing or uncovered containers and dumpsters as well as the dispersion of household and
1 A Permittee’s jurisdictional area is defined as the urban land area within a Permittee’s boundary that is not subject to stormwater NPDES
Permit requirements for traditional and non-traditional small MS4s (i.e. Phase II MS4s) or the California Department of Transportation, or
owned and maintained by the State of California, the U.S. federal government or other municipal agency or special district (e.g., flood control
district).
City of Redwood City
10
business-related trash and recycling materials before, during, and after collection. On-land illegal dumping of trash is the final source category. Trash is transported to receiving waters through three main pathways: 1) Stormwater Conveyances; 2) Wind; and, 3) Direct Dumping. Stormwater or urban runoff conveyance systems (e.g., MS4s) consist of curbs/gutters, and pipes and channels that discharge to urban creeks and the San Francisco Bay shorelines. Wind can also blow trash directly into creeks or the Bay. Lastly, trash in receiving waters can also originate from direct dumping into urban creeks and shorelines. This Long-term Plan and associated trash control measures described in Section 3.0 are focused on reducing trash from one of the transport pathways illustrated in Figure 3– stormwater
conveyances. Specifically, the Long-term Plan is focused on reducing the impacts of discharges from MS4s to San Francisco Bay Area receiving waters and the protection of associated beneficial uses.
Figure 3. Trash sources categories and transport pathways to urban creeks.
2.3 Trash Generating Areas
2.3.1 Generation Categories and Designation of Areas
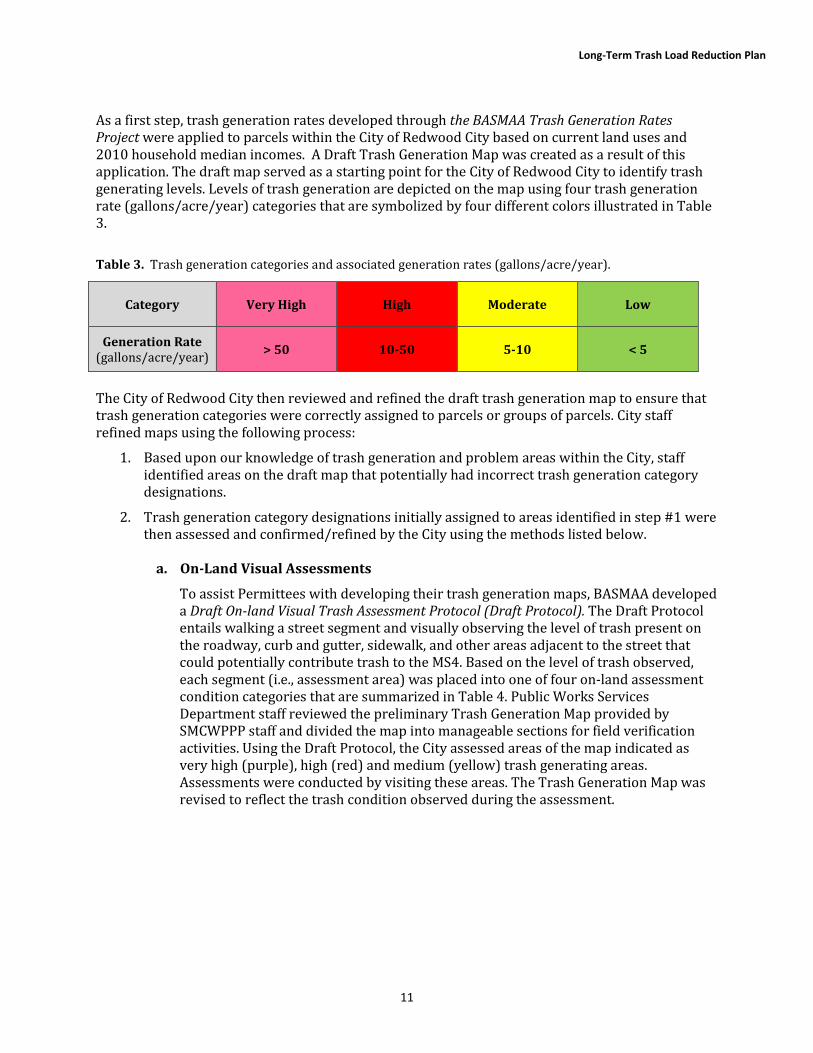
The process and methods used to identify the level of trash generation within the City of Redwood City are described in this section and illustrated in Figure 4.
Figure 4. Trash generation area development process.
Pedestrian
Litter
Litter from
Vehicles
On-land
Dumping
Source
Categories
Wind Direct Dumping
Urban Creeks and the San Francisco Bay Estuary
Transport
Pathways
Receiving
Waters
Stormwater
Conveyances
Inadequate
Waste Container
Management
Long-Term Trash Load Reduction Plan
11
As a first step, trash generation rates developed through the BASMAA Trash Generation Rates
Project were applied to parcels within the City of Redwood City based on current land uses and 2010 household median incomes. A Draft Trash Generation Map was created as a result of this application. The draft map served as a starting point for the City of Redwood City to identify trash generating levels. Levels of trash generation are depicted on the map using four trash generation rate (gallons/acre/year) categories that are symbolized by four different colors illustrated in Table 3.
Table 3. Trash generation categories and associated generation rates (gallons/acre/year).
Category Very High High Moderate Low
Generation Rate
(gallons/acre/year) > 50 10-50 5-10 < 5
The City of Redwood City then reviewed and refined the draft trash generation map to ensure that trash generation categories were correctly assigned to parcels or groups of parcels. City staff refined maps using the following process:
1. Based upon our knowledge of trash generation and problem areas within the City, staff identified areas on the draft map that potentially had incorrect trash generation category designations.
2. Trash generation category designations initially assigned to areas identified in step #1 were then assessed and confirmed/refined by the City using the methods listed below.
a. On-Land Visual Assessments
To assist Permittees with developing their trash generation maps, BASMAA developed a Draft On-land Visual Trash Assessment Protocol (Draft Protocol). The Draft Protocol entails walking a street segment and visually observing the level of trash present on the roadway, curb and gutter, sidewalk, and other areas adjacent to the street that could potentially contribute trash to the MS4. Based on the level of trash observed, each segment (i.e., assessment area) was placed into one of four on-land assessment condition categories that are summarized in Table 4. Public Works Services Department staff reviewed the preliminary Trash Generation Map provided by SMCWPPP staff and divided the map into manageable sections for field verification activities. Using the Draft Protocol, the City assessed areas of the map indicated as very high (purple), high (red) and medium (yellow) trash generating areas. Assessments were conducted by visiting these areas. The Trash Generation Map was revised to reflect the trash condition observed during the assessment.
City of Redwood City
12
Table 4. Definitions of on-land trash assessment condition categories.
On-land Assessment
Condition Category Summary Definition
A Effectively no trash is observed in the assessment area.
(Low)
B Predominantly free of trash except for a few pieces that are easily
observed. (Moderate)
C Trash is widely/evenly distributed and/or small accumulations are
visible on the street, sidewalks, or inlets. (High)
D Trash is continuously seen throughout the assessment area, with
large piles and a strong impression of lack of concern for litter in the
area. (Very High)
b. Querying Municipal Staff or Members of the Public
Input and working field knowledge was gathered from Public Works Services Department staff. This input provided additional insight into the littering patterns and potential sources of trash around the City.
3. Based on assessments conducted to confirm/refine trash generation category designations, the City created a final trash generation map that depicts the most current understanding of trash generation within the City of Redwood City. The City documented this process by tracking the information collected through the assessments and subsequent refinements to the Draft Trash Generation Map. The City of Redwood City’s Final Trash Generation Map is included as Figure 5.
2.3.2 Summary of Trash Generating Areas and Sources
Summary statistics for land use and trash generation categories generated through the mapping and assessment process are presented in Table 5.
Table 5. Percentage of jurisdictional area within the City of Redwood City assigned to each trash generation
category.
Trash
Generation
Category
Commercial
and Services Industrial Residential Retail
K-12
Schools
Urban
Parks Other
Very High 0.0 0.0% 0.0% 0.0% 0.0% 0.0% 0.0%
High 398.4 4.4% 4.0% 34.7% 45.4% 11.2% 0.2%
Medium 1,576.4 22.5% 25.2% 26.1% 13.1% 5.3% 7.0%
Low 7,128.4 6.4% 1.5% 46.4% 0.4% 0.5% 1.1%
Long-Term Trash Load Reduction Plan
13
Page Intentionally Left Blank

City of Redwood City
14
Figure 5. Final Trash Generation Map for the City of Redwood City
Long-Term Trash Load Reduction Plan
15
Page Intentionally Left Blank
City of Redwood City
16
3.0 TRASHMANAGEMENTAREASANDCONTROLMEASURES
This section describes the control measures that the City of Redwood City has or plans to
implement to solve trash problems and achieve a target of 100% (i.e. full) trash reduction from
their MS4 by July 1, 2022. The selection of control measures described in this section is based on
the City of Redwood City’s current understanding of trash problems within its jurisdiction and the
effectiveness of control measures designed to reduce trash impacts associated with MS4 discharges.
Information on the effectiveness of some trash control measures is currently lacking. In the absence
of this information, the City based its selection of control measures on existing effectiveness
information, experience with implementing control measures, knowledge of trash problems, and
current and future implementation costs. As knowledge is gained through the implementation of
trash control measures, the City may choose to refine their trash control strategy described in this
section. If significant revisions or amendments are made, a revised Long-Term Plan will be
submitted to the Water Board through the City’s annual reporting process.
3.1 Management Area Delineation and Prioritization
Consistent with the Long-Term Plan framework, the City of Redwood City delineated and
prioritized trash management areas (TMAs) based on the geographical distribution of trash
generating areas, types of trash sources, and current or planned control measure locations. TMAs
are intended to form the management units by which trash control measure implementation can be
tracked and assessed for progress towards trash reduction targets. Once delineated, TMAs were
also prioritized for control measure implementation. The City of Redwood City’s primary
management areas were selected based on the spatial distribution of trash generating areas and the
location of specific existing or planned management actions within the City’s jurisdiction. City staff
used the following procedure to designate TMAs:
Public Works Services Department staff delineated six (6) Trash Management Areas (TMAs) based
on a combination of land usage, geographic boundaries, trash generation rates and the installation
of full-capture devices. The “downtown area” and surrounding areas served by full capture devices,
commercial and industrial areas south of Woodside Road between US Highway 101 and Bay Road,
residential areas west of El Camino Real with high and medium trash generation rates, and a small
residential neighborhood north of Whipple Road between El Camino Real and US Highway 101
were delineated as separate TMAs. A TMA consisting of all land uses with a medium trash
generation rate east of US Highway 101 was also created. The remaining area, consisting of almost
entirely “low trash generating” areas was delineated as the final TMA. In addition, Public Works
Services Department staff prioritized the five (5) trash generation areas that contain high and
medium trash generating areas based on factors that include trash generation rate, land usage,
population density, traffic density, public presence and trash sources within each TMA. The City has
identified high trash generating areas as their highest priority over medium trash generating areas.
Areas which have a higher population density, traffic density and public presence were assigned a
higher priority. The City’s priority is based on the desire to avoid any further negative effects of
trash accumulation and to address the current trash condition within visible areas of the City.
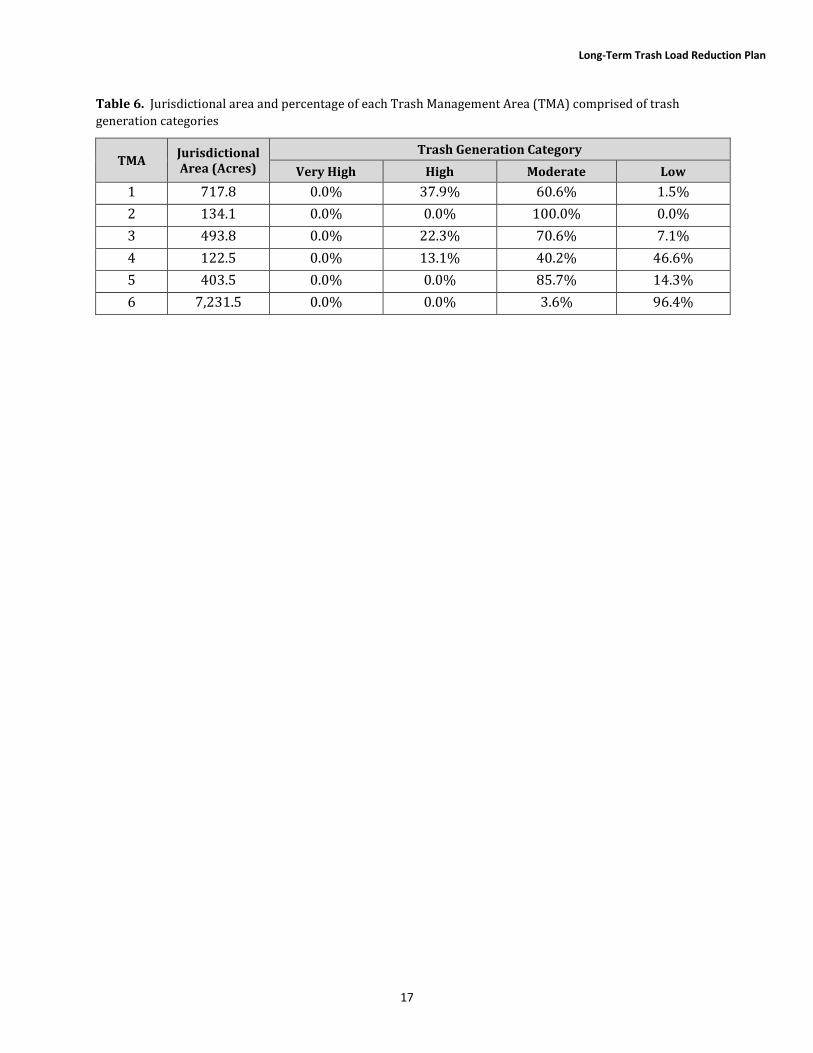
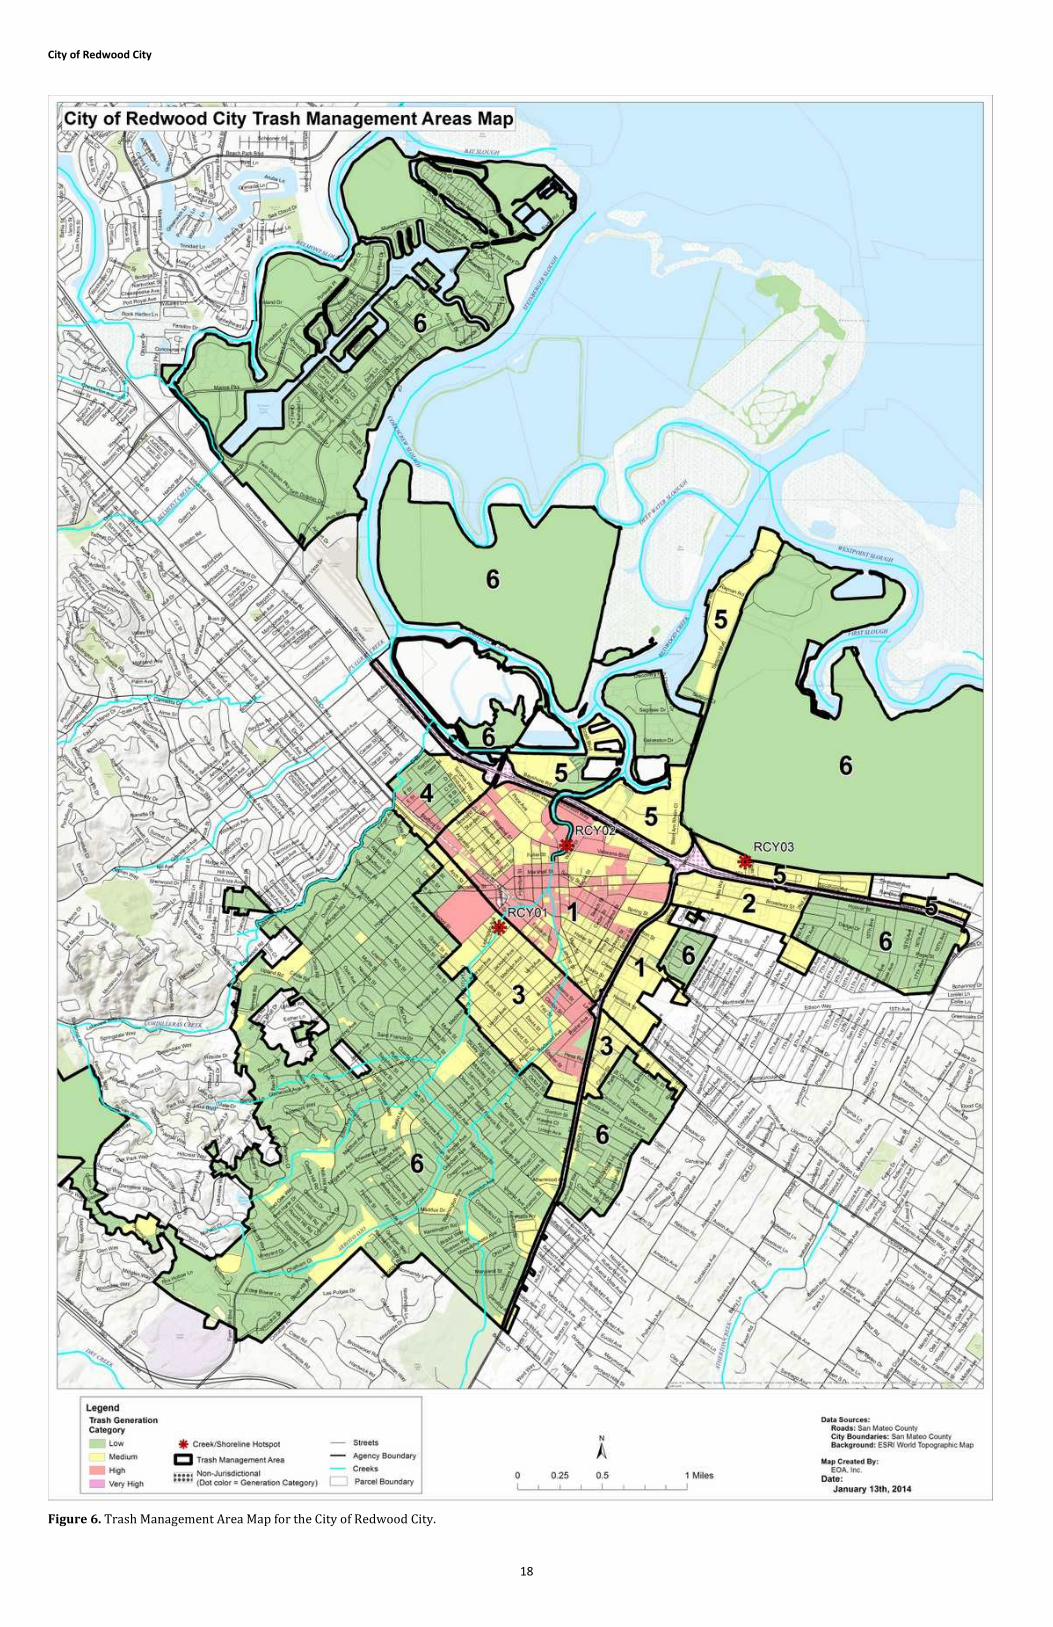
A map depicting the City’s TMAs is included as Figure 6. All jurisdictional areas within the City are
included within a TMA. The amount of jurisdictional land area and associated trash condition
categories for each TMA are included in Table 6.
Long-Term Trash Load Reduction Plan
17
Table 6. Jurisdictional area and percentage of each Trash Management Area (TMA) comprised of trash
generation categories
TMA Jurisdictional
Area (Acres)
Trash Generation Category
Very High High Moderate Low
1 717.8 0.0% 37.9% 60.6% 1.5%
2 134.1 0.0% 0.0% 100.0% 0.0%
3 493.8 0.0% 22.3% 70.6% 7.1%
4 122.5 0.0% 13.1% 40.2% 46.6%
5 403.5 0.0% 0.0% 85.7% 14.3%
6 7,231.5 0.0% 0.0% 3.6% 96.4%
City of Redwood City
18
Figure 6. Trash Management Area Map for the City of Redwood City.
Long-Term Trash Load Reduction Plan
19
Page Intentionally Left Blank
City of Redwood City
20
3.2 Current and Planned Trash Control Measures
The City of Redwood City has taken an aggressive approach to trash reduction and has implemented a variety of trash control measures to reduce trash loads throughout the City. As illustrated in Figure 6, there are six (6) trash management areas (TMA) within the City limits. The
discussion of each TMA and associated current and planned control measures are described in
more detail in this section.
3.2.1 Jurisdiction-wide Control Measures
To reduce trash loads within the City, the following control measures are being implemented or are planned to be implemented at the jurisdiction-wide level:
►SINGLE-USE CARRYOUT BAG POLICIES
Implemented Prior to and Continued After MRP Effective Date:
• Prior to the effective date of the MRP, the City did not have single-use carryout bag policies restricting the use of single-use carry-out bags by retailers.
Implemented after MRP Effective Date and Prior to July 1, 2014:
• In March 2013, the City Council added Article III (Reusable Bags) to Chapter 13 (Environmental Health Code) of the Redwood City Municipal Code. The ordinance restricts the use of single-use carry-out bags by retailers, including grocery stores, convenience stores, pharmacies and other shops. It does not apply to single-use carry-out bags used for restaurant food take-outs or for produce, meats, bulk foods and prescription medicines. If retail customers do not bring a reusable bag, the retailer will charge a fee of 10 cents/paper bag until January 1, 2015. After this date, a fee of 25 cents/per paper bag may apply. Consumers using reusable bags are encouraged to practice “healthy bag habits” that include washing reusable bags regularly to remove bacteria and other potential food contaminants. Prior to the adoption of the Reusable Bag Ordinance by the City Council, the City held informational meetings with businesses and residents and received generally positive feedback. The County of San Mateo Bag Ordinance was adopted by reference and became effective on October 1, 2013.
• The County of San Mateo Environmental Health Division enforces the Reusable Bag Ordinance within the jurisdiction of the City. To date, San Mateo County Environmental Health Division staff has not provided a status result of any enforcement activities. The City will work with the County Environmental Health Division to obtain enforcement information. Additional information about the Countywide Bag Ban is available on the San Mateo County website at www.smchealth.org/ban. Article III to Chapter 13 of the Redwood City Municipal Code is available on-line at http://library.municode.com/index.aspx?clientId=16574.
Planned for Future Implementation between July 2014 and July 2022:
• The City will continue supporting Article III (Reusable Bags) to Chapter 13 of the Redwood City Municipal Code.
Long-Term Trash Load Reduction Plan
21
►POLYSTYRENE FOAM FOOD SERVICE WARE POLICIES
Implemented Prior to and Continued After MRP Effective Date:
• Prior to the effective date of the MRP, the City did not have polystyrene foam food service ware policies restricting the use of polystyrene by food vendors,
Implemented after MRP Effective Date and Prior to July 1, 2014:
• In May 2012, the City Council added Article II (Polystyrene Based Disposable Food Service Ware Prohibition) to Chapter 13 (Environmental Health Code) of the Redwood City Municipal Code. The ordinance prohibits food vendors (i.e., any establishment located or providing food within the City) from dispensing prepared food to customers in disposable food service ware made from polystyrene (foam and solid) and requires disposable food service ware to be biodegradable, compostable, reusable or recyclable. Lids, plates, bowls, cups, utensils and straws made of polystyrene are also governed by the ordinance. The Polystyrene Based Disposable Food Service Ware Prohibition became effective on January 1, 2013.
• The San Mateo County Environmental Health Division is responsible for enforcing the Polystyrene Based Disposable Food Service Ware Prohibition within the jurisdiction of the City. Food vendors determined to be out of compliance may be fined up to $500 for the third and subsequent violation of the chapter. The City will work with the County Environmental Health Division to obtain enforcement information. Article II to Chapter 13 of the Redwood City Municipal Code is available on-line at http://library.municode.com/index.aspx?clientId=16574.
Planned for Future Implementation between July 2014 and July 2022:
• The City will continue enforcing Article II (Polystyrene Based Disposable Food Service Ware Prohibition) to Chapter 13 (Environmental Health Code) of the Redwood City Municipal Code.
►PUBLIC EDUCATION AND OUTREACH PROGRAMS
Implemented Prior to and Continued After MRP Effective Date:
The City of Redwood City implemented the following public education and outreach programs prior to the effective date of the MRP and has continued to implement these programs since MRP adoption.
SMCWPPP Public Information and Participation Program (Countywide)
Through participation and funding of the San Mateo Countywide Water Pollution Prevention
Program’s (SMCWPPP) Public Information and Participation program (PIP), the City of Redwood City plans to continue implementing litter reduction outreach to school-age children and youth. SMCWPPP currently oversees a contract to provide direct outreach to grades K-5 in a school setting on behalf of all Permittees. The contract is currently held by the Banana Slug String Band, which performs a presentation called “We All Live Downstream.” Through songs and interactive exercises, the message of not putting anything in the stormdrains (including trash) is delivered, along with basic concepts of the water cycle and the impact of pollution on aquatic life. In addition, SMCWPPP has developed a presentation entitled “Water Pollution Prevention: Problems and Solutions” that is delivered to high school students. This presentation is dedicated to watershed and storm drain education, and the impact of litter on local creeks and waterways.
City of Redwood City
22
Both efforts are managed to ensure that schools in each community in the County are reached. For communities without High Schools, the feeder schools in neighboring communities are specifically targeted for presentations. In addition to outreach at the school sites, a number of student activity guides and coloring books related to watershed health and littering are provided to children who attend outreach events. Schools are also directly targeted in promotion of Coastal Cleanup Day.
PIP also participates in a regional anti-littering campaign developed by BASMAA targeted at youth ages 14 to 24. As acting chair of the BASMAA PIP committee, SMCWPPP PIP has participated in the development and dissemination of campaign materials, and has conducted local events on behalf of all jurisdictions to promote the campaign. The campaign, entitled “Be The Street You Want to See”, will soon transition from building a community of youth dedicated to not littering to engaging that community in action.
SMCWPPP, through its PIP program, plans to continue to conduct community outreach events on behalf of Permittees who request support. Outreach materials related to litter that are distributed include, in addition to the children’s materials listed above under Outreach to School-age Children or Youth, a promotional sign for cigarette smokers to discourage cigarette litter, and pocket ashtrays are given out. A general stormwater pollution prevention flyer in English and Spanish that includes litter reduction in its messaging is distributed.
In addition to table outreach events conducted for specific Permittees, PIP also conducts a Countywide Event aimed to reach residents from throughout the County. PIP manages an online calendar which promotes clean-up events by non-profit organizations throughout the County. In FY 2012, PIP completed its 7th year acting as the county coordinator for Coastal Cleanup Day, increasing volunteer participation by 400% in that time, and trash removal increased by 300%.
During the term of the MRP, new outreach materials have been disseminated to the public, including reusable shopping bags to encourage reduction in use of carryout plastic bags; PIP has supported a countywide ban on carryout bags that began implementation on April 22, 2013. In addition, spring cleanups taking place in individual jurisdictions are promoted under one theme by PIP, entitled Spring Cleaning SMC. PIP assists in directing volunteers to cleanup events in their communities. SMCWPPP conducted a total of 11 outreach events on behalf of various jurisdictions within the County in the FY 2012-2013. SMCWPPP will also continue maintaining an online calendar of cleanups on a monthly basis. In addition to using the SMCWPPP website, flowstobay.org, to promote cleanups, PIP is actively involved in social media platforms such as Facebook, Twitter, You Tube, and Instagram to deliver anti-littering and cleanup messages.
Coastal Cleanup Day Promotion (Countywide)
On the countywide level, SMCWPPP also conducts annual press releases for Coastal Cleanup Day, and uses Twitter to promote cleanup events. These releases are intended to gain support and assistance for cleanup events conducted each September in local water bodies.
BASMAA Regional Media Relations Project (Regional)
Through participation and funding of the Regional Media Relations Project, the City is continuing to implement a media relations project partially designed to reduce littering from target audiences in the Bay Area. The goal of the BASMAA Media Relations Project is to generate media coverage that encourages individuals to adopt behavior changes to prevent water pollution, including littering. At least two press releases or PSAs focus on litter issues each year (e.g., creek clean-up activities, preventing litter by using reusable containers, etc.). In FY 2012-2013, the Media Relations project developed a press release new and recent bag bans in cities

Long-Term Trash Load Reduction Plan
23
around the region. The pitch included information on the litter caused by plastic bags. Information ran on KBAY, KCBS and on eight Bay Area Patch.com sites.
Implemented after MRP Effective Date and Prior to July 1, 2014:
In addition to the public education and outreach programs implemented after the adoption of the MRP, the City is currently implementing or planning to implement the following public education and outreach control measures that were initiated after the MRP was adopted.
BASMAA Youth Outreach Campaign (Regional)
Through participation and funding of the regional BASMAA Youth Outreach Campaign, the City is implementing an outreach campaign designed to reduce littering from the target audience in the Bay Area. The Youth Outreach Campaign was launched in September 2011 and aims to increase the awareness of Bay Area Youth (ages 16-24) on litter and stormwater pollution issues, and eventually change their littering behaviors. Combining the ideas of Community Based Social Marketing with traditional advertising, the Youth Campaign aims to engage youth to enable the peer-to-peer distribution of Campaign messages. The Campaign will at least run through FY 2013-2014. A brief description of the Campaign activities is provided below:
• Raising Awareness: The Campaign is raising awareness of the target audience on litter and stormwater pollution issues. Partnerships with youth commissions, high schools, and other youth focused organizations have been developed to reach the target audience. Messages targeted to youth have been created and distributed via paid advertising, email marketing, Campaign website and social networking sites (e.g., Facebook and Twitter).
• Engage the Youth - The advertisements encourage the audience to participate in the Youth Campaign by joining a Facebook page, entering a contest, taking an online quiz, etc., and providing their contact information. At the beginning of FY 2012-2013, a video contest was launched to get Bay Area youth further involved in the Campaign. An online voting system was used to select the winning entry. Media advertising was conducted to promote the winning entry.
• Change Behaviors: To move the audience along the behavior change continuum, the Campaign is using electronic platforms such as email marketing and social networking sites to encourage participants to engage in increasingly more difficult behavior changes, such as participating in a clean-up, organizing a clean-up, etc.
• Maintain Engagement: The Campaign continues to interact with the target audience through email marketing and social media websites.
The Youth Campaign includes a pre and post campaign survey to evaluate the effectiveness of outreach. The pre-campaign survey was conducted in FY 2011-2012 and the post campaign survey will begin in FY 2013-2014. Other evaluation mechanisms, such as website hits, number of youth engaged in the Campaign’s social networking website, etc. are also being used to evaluate its effectiveness in increasing awareness and changing behavior.
Activities in FY 2012-2013 included maintaining the website www.BetheStreet.org, Facebook page, and Instagram account. A video contest asking participants to submit their best anti-litter video was also conducted. The “Be the Street” campaign received 52 entries in response to the contest. The winning video was promoted on television, Pandora (online music site), YouTube, Google, and Facebook.
City of Redwood City
24
Planned for Future Implementation between July 2014 and July 2022:
• Through participation and funding of the SMCWPPP’s Public Information and Participation program (PIP), the City will continue implementing SMCWPPP and BASMAA public education and outreach programs during this time period.,
►ON-LAND CLEANUPS
Implemented Prior to and Continued After MRP Effective Date:
• The City’s Public Works Services Department patrols and removes trash and large items (e.g., mattresses, furniture, etc.) from City right-of-way and other illegal dumping areas five days/week throughout the City. Currently, one part-time employee is removing trash and large items for two hours/day. This program has been successful at removing large illegally dumped items throughout the City.
• The City’s Public Works Services Department manages individuals provided by the County’s Sheriffs Work Program. Work conducted may include removing trash and debris from public rights-of-way and streets, and providing landscape maintenance. The standard route and request area includes several locations within the City. However, the majority of
locations are within TMAs #1 and #6. The use of the Sheriffs Work Program may occur up to 5 days/week (Monday-Friday) depending on the availability of individuals. A total of one to eight people may be available to conduct on-land cleanups. The Public Works Services Department uses the Sheriffs Work Program throughout the City and is considering using them to remove trash in high generation areas.
• According to City staff, school personnel and students conduct daily on-land cleanups on school property during the school week (Monday-Friday). Trash is removed up to the curb. On occasion, school personnel and students will remove litter within the roadway. On-land cleanups are being conducted at the following sixteen (16)elementary and middle schools within the City:
o Clifford Elementary School o Roy Cloud Elementary School o Garfield Elementary School o Hoover Elementary School o Selby Lane Elementary School o Adelante Elementary School o Fair Oaks Elementary School o Henry Ford Elementary School o John Gill Elementary School o Hawes Elementary School o Orion Elementary School o Roosevelt Elementary School o Taft Elementary School o Kennedy Middle School o McKinley School of Technology o North Star Academy (Grades 3-8)
Long-Term Trash Load Reduction Plan
25
Implemented after MRP Effective Date and Prior to July 1, 2014:
• The City’s Public Works Services Department continued having one part-time employee patrol and remove trash and large items five days/week throughout the City during this time period. The City tracks the volume of trash collected from all on-land cleanups conducted by City staff.
• The City’s Public Works Services Department continued using individuals provided by the County’s Sheriffs Work Program to conduct on-land cleanups within the City during the time period.
• On-land cleanup activities conducted by school personnel and students continued at schools during the time period. The City did not implement additional on-land cleanups during this time period since existing on-land cleanup efforts are adequately addressing trash loads at schools.
Planned for Future Implementation between July 2014 and July 2022:
• The City’s Public Works Services Department will continue having one part-time employee patrol and remove trash and large items (e.g., mattresses, furniture, etc.) from City right-of-way and other illegal dumping areas five days/week throughout the City during this time period.
• The City’s Public Works Services Department will continue using individuals provided by the County’s Sheriffs Work Program to conduct on-land cleanups within the City during this time period. The use of individuals provided by the County’s Sheriffs Work Program has been a useful resource to supplement the City’s current on-land cleanup efforts.
• Existing on-land cleanup activities conducted by school personnel and students will continue at schools during this time period. The City has no additional on-land cleanups planned at schools since existing on-land cleanup efforts are an adequate level of effort to achieve “no adverse impact”. The trash condition of schools will be confirmed via assessments described in Section 4.0.
►IMPROVED TRASH BIN/CONTAINER MANAGEMENT
Implemented Prior to and Continued After MRP Effective Date:
• The City’s trash hauler, Recology maintains approximately 100 public trash bins throughout the City, with the majority of bins located within the downtown area. Trash is removed from public trash bins six days/week (except Sunday) within the downtown area, and one to three times/week at all other locations. Additional trash collection occurs by request. Recology is not aware of any chronic overflowing bins within the City.
• Prior to the effective date of the MRP, the City has worked and will continue to work with Recology to identify businesses and residents that do not subscribe to adequate trash collection service (i.e., insufficient trash collection or use of bins which are too small). This is important since businesses and residents may try to use the public trash bins to dispose of their trash rather than subscribe to adequate trash service. The implementation of this monitoring program has likely reduced trash levels in public trash bins within the City resulting in fewer overflowing trash bins.
• Cigarette butt litter is the most prevalent trash type (by number count) observed on City streets and sidewalks. Prior to the effective date of the MRP, the City did not add specialty

City of Redwood City
26
cigarette butt bins within a limited number of locations that generate large volumes of cigarette butts.
Implemented after MRP Effective Date and Prior to July 1, 2014:
• The number of public trash bins is adequate to manage the volume of trash generated by pedestrians within the downtown area and other locations within the City. Therefore, the City did not add additional public trash bins during this time period.
• The City continued working with Recology during this time period to identify businesses and residents that do not subscribe to adequate trash collection service. Businesses and residents that were identified to not have adequate trash collection service were contacted to start or enhance service.
• To help reduce cigarette butt litter, the City has installed specialty cigarette butt bins in a limited number of locations within the downtown area and at City-owned facilities within the time period. To date, the City has installed approximately 20 specialty cigarette butt bins. The City is responsible for maintaining specialty cigarette butt bins.
Planned for Future Implementation between July 2014 and July 2022:
• The City currently does not plan to add additional public trash bins during this time period. However, they are receptive to adding additional public trash bins in the future based on need.
• The City will continue working with Recology in the future to identify businesses and residents that do not subscribe to adequate trash collection service. Businesses and residents that are identified to not have adequate trash collection service will be contacted to start or enhance service.
• The City plans to evaluate the following for potential implementation. A decision regarding implementation will be made by July 1, 2017. To remedy cigarette butt litter, the City will consider the development of an ordinance that requires specific types of businesses to provide specialty cigarette butt bins for the proper disposal of cigarette butt litter. Each business would be responsible for maintaining their specialty cigarette butt bins. The City would be responsible for enforcing non-compliance with installation and maintenance. Affected businesses would be required to install specialty cigarette butt bins by July 1,
2019 if a decision is made to require such bins.
Long-Term Trash Load Reduction Plan
27
3.2.2 Trash Management Area #1
Trash Management Area #1 (TMA #1) includes approximately 718 acres of land bordered by El Camino Real to the west, Whipple Avenue to the north, US Highway 101 to the east, and Northumberland Avenue, Westmoreland Avenue and Charter Street to the south. Visual on-land assessments conducted by City staff within TMA #1 indicate that approximately 38 % of the jurisdictional area is considered as a high trash generating area, 61 % as a medium trash generating area and the remaining 1 % as low trash generating area. This area includes the “downtown area” and contains retail, commercial and industrial land uses with residential and schools adjacent to commercial and industrial land uses. TMA #1 includes El Camino Real and Caltrain which results in large volumes of vehicular and pedestrian traffic through the area. Trash is generated within the retail and commercial corridor from pedestrians and vehicles. To date, full-capture devices, street sweeping and on-land clean-ups have been implemented to address trash. Recology maintains a network of public trash bins within TMA #1. The City has installed specialty cigarette butt bins within specific locations of the downtown area and at City-owned facilities to help reduce cigarette litter. TMA #1 has been identified as the first priority for the City due to having the highest trash generation and accumulation. ►FULL-CAPTURE TREATMENT DEVICES
Implemented Prior to and Continued After MRP Effective Date:
• The City did not install full-capture devices within TMA #1 prior to the effective date of the
MRP.
Implemented after MRP Effective Date and Prior to July 1, 2014:
• In 2012 and 2013, the City installed 131 small full-capture devices (i.e., connector pipe screens) within TMA #1. This installation was funded by the Association of Bay Area Governments (ABAG) and the California State Water Resources Control Board (State Water Board) Bay Area-Wide Trash Capture Demonstration Project through the federal American Recovery and Reinvestment Act of 2009. This funding was primarily intended to provide preliminary resources to Bay Area municipalities in purchasing a limited number of the Permit-required trash full capture treatment devices for installation in municipally-owned stormwater conveyance systems. The area treated by the 131 small full capture devices is approximately 167 acres of land. This equates to approximately 23 % of the land area within TMA #1.
• These devices are inspected and maintained prior to the “first flush” with additional inspection and maintenance conducted, as necessary after major storm events (may be up to three to four times/year). The first maintenance event occurred in October 2012. Small full-capture devices are maintained by using a combination sewer truck (i.e. Vactor truck) to pressure wash and vacuum all debris from the catch basin and connector pipe screen. A Trash Capture Device Maintenance Report is filled out for every maintenance event and is kept on-file at the Public Works Services Department. To date, the City has experienced no failures or other issues with these devices. Figure 7 (Trash Full Capture Device Map) includes the areas within the City that are treated with these devices.
Planned for Future Implementation between July 2014 and July 2022:
• The City will continue inspecting and maintaining all small full-capture devices to ensure proper performance. Since TMA #1 is the highest trash generating area, the City plans to evaluate the following for potential implementation. A decision regarding implementation
City of Redwood City
28
will be made by July 1, 2014. The City will evaluate and determine the feasibility of installing additional small full-capture devices to treat trash loads generated within TMA #1. If it is determined to be feasible and resources are available, the City will install small full-capture devices to treat additional area in TMA #1 by July 1, 2015.
• The City plans to evaluate the following for potential implementation. A decision regarding implementation will be made by July 1, 2017. In accordance with their NPDES stormwater permit, Caltrans is required to implement trash control measures to reduce trash loads on state-owned streets, roads and highways. The City will collaborate with Caltrans to determine the possibility of entering into an agreement to offset the cost of installing small full- capture devices on El Camino Real. The City would be responsible for maintaining small full-capture devices. Implementation of small full- capture devices on El Camino Real will occur by July 1, 2021 if the City executes an agreement with Caltrans regarding installation.
►PARTIAL-CAPTURE TREATMENT DEVICES
Implemented Prior to and Continued After MRP Effective Date:
• The City did not install partial-capture devices within TMA #1 prior to the effective date of the MRP.
Implemented after MRP Effective Date and Prior to July 1, 2014:
• The City did not install partial-capture devices within TMA #1 during this time period.
Planned for Future Implementation between July 2014 and July 2022:
• The City plans to evaluate the following for potential implementation. A decision regarding implementation will be made by July 1, 2014. The City will evaluate and determine the feasibility of installing partial-capture devices to treat trash loads generated within TMA #1. If it is determined to be feasible and resources are available, the City will install partial-capture devices to treat TMA #1 by July 1, 2015.
• The City plans to evaluate the following for potential implementation. A decision regarding implementation will be made by July 1, 2017. In accordance with their NPDES stormwater permit, Caltrans is required to implement trash control measures to reduce trash loads on state-owned streets, roads and highways. The City will collaborate with Caltrans to determine the possibility of entering into an agreement to offset the cost of installing partial-capture devices on El Camino Real. The City would be responsible for maintaining partial-capture devices. Implementation of partial- capture devices on El Camino Real will occur by July 1, 2021 if the City executes an agreement with Caltrans regarding installation.
►STREET SWEEPING
Implemented Prior to and Continued After MRP Effective Date:
• The City sweeps Broadway (between Marshall Street and Woodside Road), Main Street (between Veterans Blvd and Middlefield Road) and surrounding streets (between Winslow Road, Maple Street and Veterans Blvd) within the downtown area four times/week. Streets within the downtown area are swept between the hours of 4:00 a.m. to 6:00 a.m. All other streets with retail, commercial and industrial land uses within TMA #1 are swept

Long-Term Trash Load Reduction Plan
29
once/month between the hours of 4:00 a.m. to 6:00 a.m. Residential areas are swept once/month between 7:30 am and 2:00 pm.
• The City entered into a maintenance agreement with CalTrans to sweep the entire 2.41 mile stretch (9.64 curb miles) of El Camino Real (CA Highway 82) from the southeast City limits near Berkshire Avenue to the northwest City limits at Cordilleras Creek, and the 2.9 mile stretch (11.6 curb miles) of Woodside Road (CA Highway 84) between Broadway and Alameda de las Pulgas. El Camino Real is swept once/week. Woodside Road between Broadway and El Camino Real is swept once/month. Both roads are swept between the hours of 4:00 a.m. to 6:00 a.m.
• In 2008, the City implemented a pilot street sweeping program with parking enforcement on Douglas Avenue (between Spring Street and Middlefield Road) and Marshall Street (between Chestnut Street and Maple Street). Both streets are posted with “No Parking - Street Cleaning” signs with sweeping being conducted on the last Thursday or last Friday of every month between 7:00 a.m. and 9:00 a.m. As a result, sweeping practices are effective on both streets since the sweeper is reaching the curb. The City intends to continue with the pilot program since noticeable decreases in trash loads have been observed.
• All other streets within TMA #1 are not posted with “No Parking- Street Cleaning” signs to prohibit parking during sweeping hours. In areas where sweeping is conducted between the hours of 4:00 a.m. and 6:00 a.m., cars are consistently not present when sweeping is conducted. As a result, sweeping practices are effective since the sweeper is reaching the curb. The presence of cars within residential areas is highly variable depending on when sweeping is conducted within the 7:30 a.m. to 2:00 p.m. time window. The sweeper is consistently reaching the curb within the downtown area, on major arterial roads and approaches near El Camino Real, Woodside Road and Middlefield Road (between Woodside Road and the City limits to the south).
Implemented after MRP Effective Date and Prior to July 1, 2014:
• In August 2013, the City’s Public Works Services Department purchased a Madvac LR50 ride-on vacuum (see below) to complement existing street sweeping and further reduce trash loads within the downtown area. City staff sweeps the following streets, areas and parking lots five days/week (Monday-Friday):
o Broadway between Main Street and El Camino Real o Main Street between Middlefield Road and Marshall Street o Jefferson Avenue between Middlefield Road and Marshall Street
City of Redwood City
30
o Theater Way between Winslow Street and Marshall Street o Hamilton Street between Winslow Street and Marshall Street o Winslow Street between Theater Way and Marshall Street o Middlefield Road between Main Street and Winslow Street o Stambaugh Street between Main Street and Walnut Street o Broadway between Walnut Street and Main Street o California Street between Broadway and James Avenue o Redwood Creek between Main Street parking lot and Marshall Street parking garage o City Hall parking lot o Perry Street parking lot o Pizza and Pipes parking lot
City staff estimates that the Madvac removes approximately 120 gallons of trash/day.
• Updated the “Street Sweeping” webpage on the City’s website. This webpage provides the street sweeping frequency by residential area within the City. Residents may view a list of streets within a residential area to determine when their street is swept. The webpage is available at: http://www.redwoodcity.org/publicworks/streets/street_cleaning.htm.
Planned for Future Implementation between July 2014 and July 2022:
• The City does not plan to increase street sweeping frequency within TMA #1 during this time period. The City plans to evaluate the following for potential implementation. A decision regarding implementation will be made by July 1, 2016.
o The City will evaluate and determine the feasibility of implementing a delayed street sweeping start time in all residential areas which have not been installed with “No Parking-Street Cleaning” signs. Other cities within the Bay area have noted that moving the residential sweeping times later in the day has resulted in better curb access since more people are at work later in the day. Sweeping practices are more effective since the sweeper is more likely to reaching the curb. Implementation will begin by July 1,
2017 if a decision is made to delay the street sweeping start time within residential areas.
• The City will collaborate with Caltrans to revise their existing maintenance agreement. The City will request full cost recovery for current street sweeping practices and future increases in street sweeping frequency on El Camino Real and Woodside Road.
►ON-LAND CLEANUPS
Implemented Prior to and Continued After MRP Effective Date:
• The City’s Parks and Recreation Department perform on-land cleanups and services trash containers daily (7 days/week) as part of their maintenance and landscaping activities in the following three parks located within TMA #1. A total of 19 full-time employees and five (5) seasonal employees are dedicated to maintaining parks within the City.
o Hoover Park o Jardin de Ninos o Mezes Park
• The City’s Parks and Recreation Department performs on-land cleanups of the entire 2.41 mile stretch of the El Camino Real median as part of their weekly or biweekly (i.e.,
Long-Term Trash Load Reduction Plan
31
twice/week) maintenance and landscaping activities. Maintenance frequency is dependent on the season. Trash types removed include food and beverage ware, food packaging, cigarette butts, and other trash from patronizing retail and commercial establishments along El Camino Real.
• The City-supported Pride & Beautification Committee sponsors two annual on-land cleanups in the spring and fall each year. Each event last approximately four hours and draws between 200 and 300 volunteers consisting of residents, community groups and local businesses. Volunteers remove litter and illegally dumped trash from school sites, the waterfront, parks, streets, and other areas. The City’s contract garbage hauler, Recology supports each event with services, funding and staffing. Each event has been a great success at bringing volunteers together in beautifying the City. In 2013, the Pride & Beautification Committee conducted on-land cleanups at the following locations within TMA #1:
o Hoover Park at Hilton St. between Woodside Rd. and Laurel St. o Broadway between Arguello Street and Walnut Street o Little River Park between California Street and James Avenue o Marshall Street between Chestnut Street and Main Street o Chestnut Street between Veterans Blvd. and El Camino Real o Redwood Creek from Bradford Street to US Highway 101 o Jefferson Street between Veterans Blvd and Middlefield Road o Transit parking lot at 1 James Avenue o Winslow Street between Industrial Way and Marshall Street
Implemented after MRP Effective Date and Prior to July 1, 2014:
• After the MRP effective date, the City’s Public Works Services Department started conducting on-land cleanups within the downtown area five days/week (Monday-
Friday) to improve overall aesthetics and reduce trash loads to the MS4. Currently, one part-time employee (i.e., “downtown assistant”) is removing litter during the work week for two hours/day. As part of on-land cleanup within the downtown area, the City blows trash from the sidewalk into the street for pick-up by the Madvac LR50 once/week (on
Fridays).
• On-land cleanup activities and trash container servicing continued within the three parks located within TMA #1 during this time period. The City did not implement additional on-land cleanups since existing on-land cleanup efforts are adequately addressing trash loads within these three parks.
• On-land cleanup activities of the El Camino Real median within TMA #1 continued during this time period. The City did not implement additional on-land cleanups since existing on-land cleanup activities are adequately addressing trash loads along the El Camino Real median.
• The City-supported Pride & Beautification Committee continued two annual on-land cleanups within TMA #1 during this time period. In 2013, approximately 800 to 2,200 pounds of trash were removed throughout the City during each event.
Planned for Future Implementation between July 2014 and July 2022:
• The City’s Public Works Services Department will continue conducting on-land cleanups within the downtown area five days/week (Monday- Friday) during this time period.
City of Redwood City
32
One part-time employee (i.e., “downtown assistant”) will remove litter during the work week for two hours/day. As part of on-land cleanups conducted in the downtown area, the City will continue to blow trash from the sidewalk into the street for pick-up by the Madvac LR50 once/week (on Fridays). This on-land cleanup is intended to continue into the foreseeable future with no plans to cease or reduce the current level of effort.
• Existing on-land cleanup activities and trash container servicing will continue within the three parks located within TMA #1. The City has no additional on-land cleanups planned for these parks since existing on-land cleanup efforts are an adequate level of effort to achieve “no adverse impact”. The trash condition of parks located within TMA #1 will be confirmed via assessments described in Section 4.0.
• Existing on-land cleanup activities of the El Camino Real median within TMA #1 will continue during this time period. The City has no additional on-land cleanups planned for the El Camino Real median since existing on-land cleanup activities are adequately addressing trash loads.
• The City plans to continue supporting Pride & Beautification Committee on-land cleanups within TMA #1 during this time period. These on-land cleanup events have been successful in bringing attention to problematic trash areas within the City.
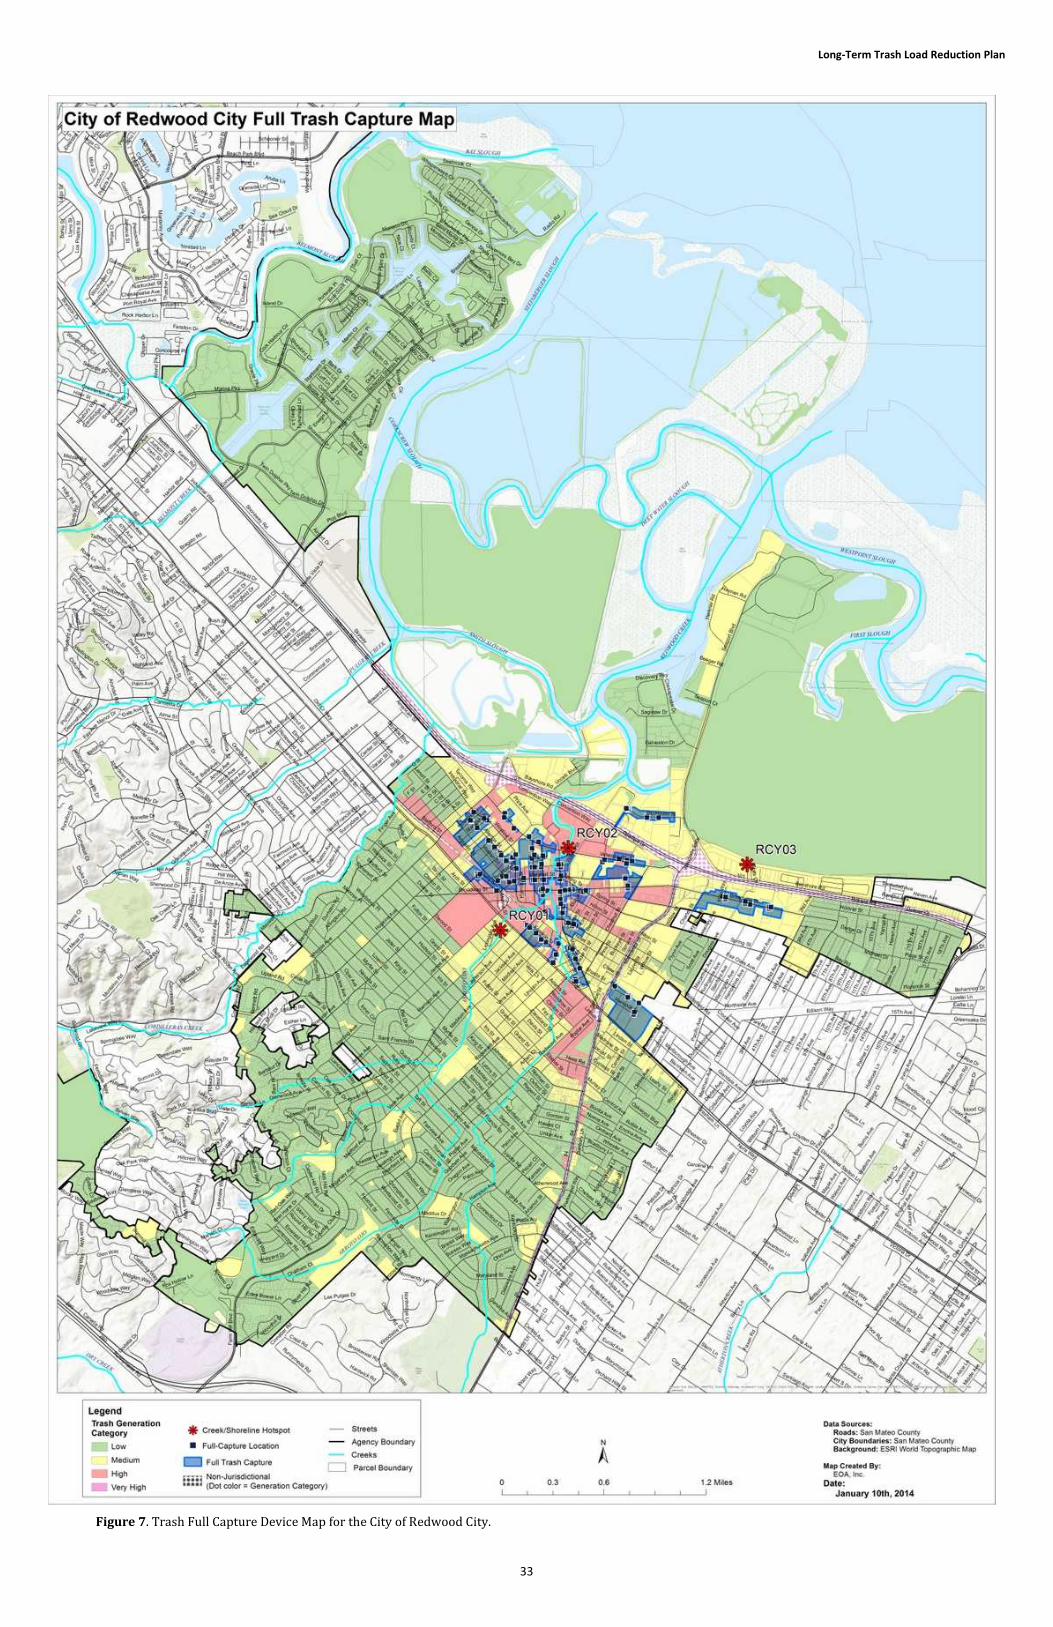
Long-Term Trash Load Reduction Plan
33
Figure 7. Trash Full Capture Device Map for the City of Redwood City.

City of Redwood City
34
Page Intentionally Left Blank
.

Long-Term Trash Load Reduction Plan
35
3.2.3 Trash Management Area #2
Trash Management Area #2 (TMA #2) includes approximately 134 acres of land bordered by Bay
Road to the west, Woodside Road to the north, US Highway 101 to the east and portions of 5th
Avenue to the west. Visual on-land assessments conducted by City staff within TMA #2 indicate
that approximately 100 % of the jurisdictional area is considered as a medium trash generating
area. The vast majority of land area within TMA #2 is commercial and industrial land uses. It also
includes some residential, commercial and industrial land uses to the west of Bay Road between
2nd Avenue to the north, Spring Street to the west and 5th Avenue to the south. Trash sources
include pedestrians and vehicles. To date, full-capture treatment devices, street sweeping and on-
land clean-ups have been implemented within this area to address trash.
►FULL-CAPTURE TREATMENT DEVICES
Implemented Prior to and Continued After MRP Effective Date:
• The City did not install full-capture devices within TMA #2 prior to the effective date of the
MRP.
Implemented after MRP Effective Date and Prior to July 1, 2014:
• In 2012 and 2013, the City installed 10 small full-capture devices (i.e., connector pipe
screens) within TMA #1. This installation was funded by the Association of Bay Area
Governments (ABAG) and the California State Water Resources Control Board (State Water
Board) Bay Area-Wide Trash Capture Demonstration Project through the federal American
Recovery and Reinvestment Act of 2009. This funding was primarily intended to provide
preliminary resources to Bay Area municipalities in purchasing a limited number of the
Permit-required trash full capture treatment devices for installation in municipally-owned
stormwater conveyance systems. The area treated by the 10 small full capture devices is
approximately 25 acres of land. This equates to approximately 18 % of the land area within
TMA #2.
• These devices are inspected and maintained prior to the “first flush” with additional
inspection and maintenance conducted, as necessary after major storm events (may be up
to three to four times/year). The first maintenance event occurred in October 2012. Small
full-capture devices are maintained by using a combination sewer truck (i.e. Vactor truck)
to pressure wash and vacuum all debris from the catch basin and connector pipe screen. A
Trash Capture Device Maintenance Report is filled out for every maintenance event and is
kept on-file at the Public Works Services Department. To date, the City has experienced no
failures or other issues with these devices. Figure 7 (Trash Full Capture Device Map)
includes the areas within the City that are treated with these devices.
Planned for Future Implementation between July 2014 and July 2022:
• The City will continue inspecting and maintaining all small full-capture devices to ensure
proper performance. The City does not plan installing additional full-capture devices
within TMA #2.
City of Redwood City
36
►STREET SWEEPING
Implemented Prior to and Continued After MRP Effective Date:
• All streets with commercial and industrial land uses within TMA #2 are swept
once/month between the hours of 4:00 a.m. to 6:00 a.m. Residential areas are swept
once/month between 7:30 am and 2:00 pm.
• All other streets within TMA #2 are not posted with “No Parking- Street Cleaning” signs to
prohibit parking during sweeping hours. In areas where sweeping is conducted between
the hours of 4:00 a.m. and 6:00 a.m., cars are consistently not present when sweeping is
conducted. As a result, sweeping practices are effective since the sweeper is reaching the
curb. The presence of cars within residential areas is highly variable depending on when
sweeping is conducted within the 7:30 a.m. to 2:00 p.m. time window. Broadway (between
Douglas Avenue and Second Ave) is red-curbed. As a result, the sweeper is reaching the
curb.
Implemented after MRP Effective Date and Prior to July 1, 2014:
• No additional street sweeping was implemented within TMA #2 during this time period.
• Updated the “Street Sweeping” webpage on the City’s website. This webpage provides the
street sweeping frequency by residential area within the City. Residents may view a list of
streets within a residential area to determine when their street is swept. The webpage is
available at: http://www.redwoodcity.org/publicworks/streets/street_cleaning.htm.
Planned for Future Implementation between July 2014 and July 2022:
• The City does not plan to increase street sweeping frequency within TMA #2 during this
time period. However, the City plans to evaluate the following for potential
implementation. A decision regarding implementation will be made by July 1, 2016. The
City will evaluate and determine the feasibility of implementing a delayed street sweeping
start time in all residential areas which have not been installed with “No Parking-Street
Cleaning” signs. Other cities within the Bay area have noted that moving the residential
sweeping times later in the day has resulted in better curb access since more people are at
work later in the day. Sweeping practices are more effective since the sweeper is more
likely to reaching the curb. Implementation will begin by July 1, 2017 if a decision is made
to delay the street sweeping start time within residential areas.
►ON-LAND CLEANUPS
Implemented Prior to and Continued After MRP Effective Date:
• The City’s Parks and Recreation Department perform on-land cleanups and services trash
containers daily (7 days/week) as part of their maintenance and landscaping activities at
Andrew Spinas Park. Trash types removed include food and beverage ware, food
packaging, cigarette butts, and other trash from retail and commercial establishments.
Implemented after MRP Effective Date and Prior to July 1, 2014:
• On-land cleanup activities and trash container servicing continued within Andrew Spinas
Park during the time period. The City did not implement additional on-land cleanups since
existing on-land cleanup efforts are adequately addressing trash loads within Andrew
Spinas Park.
Long-Term Trash Load Reduction Plan
37
Planned for Future Implementation between July 2014 and July 2022:
• Existing on-land cleanup activities and trash container servicing will continue within
Andrew Spinas Park. The City has no additional on-land cleanups planned for this park
since existing on-land cleanup efforts are an adequate level of effort to achieve “no adverse
impact”. The trash condition of Andrew Spinas Park will be confirmed via assessments
described in Section 4.0.
City of Redwood City
38
3.2.4 Trash Management Area #3
Trash Management Area #3 (TMA #3) includes approximately 494 acres of land bordered by
portions of Elwood Street, Hudson Street, Iris Street, Oxford Street, Central Avenue and Leahy
Street to the west, by portions of Hopkins Avenue, Arch Street and Whipple Road to the north, El
Camino Real to the east and portions of Center Street, Carlos Avenue and Renato Court to the south..
Visual on-land assessments conducted by City staff within TMA #3 indicate that approximately
22 % of the jurisdictional area is considered as a high trash generating area, 71 % as a medium
trash generating area and the remaining 7 % as low trash generating area. The vast majority of the
land area is residential with retail and commercial land uses adjacent to El Camino Real and
Woodside Avenue. TMA #3 borders El Camino Real and includes a stretch of Woodside Road
between El Camino Real and Oxford Street. As a result, large volumes of vehicular and pedestrian
traffic pass through the area. Several schools (including Sequoia High School) are also located
within this area. Trash sources include pedestrians and vehicles. Street sweeping and on-land
cleanups have been implemented within this area to address trash. Full-capture devices have not
been installed within TMA #3. Street sweeping and on-land cleanups have been implemented
within this area to address trash.
►FULL-CAPTURE TREATMENT DEVICES
Implemented Prior to and Continued After MRP Effective Date:
• The City did not install full-capture devices within TMA #3 prior to the effective date of the
MRP.
Implemented after MRP Effective Date and Prior to July 1, 2014:
• The City did not install full-capture devices within TMA #3 during this time period.
Planned for Future Implementation between July 2014 and July 2022:
• The City plans to evaluate the following for potential implementation. A decision regarding
implementation will be made by July 1, 2014. The City will evaluate and determine the
feasibility of installing small full-capture devices to treat trash loads generated within TMA
#3. If it is determined to be feasible and resources are available, the City will install small
full-capture devices to treat TMA #3 by July 1, 2015.
• The City plans to evaluate the following for potential implementation. A decision regarding
implementation will be made by July 1, 2017. In accordance with their NPDES stormwater
permit, Caltrans is required to implement trash control measures to reduce trash loads on
state-owned streets, roads and highways. The City will collaborate with Caltrans to
determine the possibility of entering into an agreement to offset the cost of installing small
full- capture devices on El Camino Real. The City would be responsible for maintaining
small full-capture devices. Implementation of small full- capture devices on El Camino Real
will occur by July 1, 2021 if the City executes an agreement with Caltrans regarding
installation.
►PARTIAL-CAPTURE TREATMENT DEVICES
Implemented Prior to and Continued After MRP Effective Date:
• The City did not install partial-capture devices within TMA #3 prior to the effective date of
the MRP.
Long-Term Trash Load Reduction Plan
39
Implemented after MRP Effective Date and Prior to July 1, 2014:
• The City did not install partial-capture devices within TMA #3 during this time period.
Planned for Future Implementation between July 2014 and July 2022:
• The City plans to evaluate the following for potential implementation. A decision regarding
implementation will be made by July 1, 2014. The City will evaluate and determine the
feasibility of installing partial-capture devices to treat trash loads generated within TMA
#3. If it is determined to be feasible and resources are available, the City will install partial-
capture devices to treat TMA #3 by July 1, 2015.
• The City plans to evaluate the following for potential implementation. A decision regarding
implementation will be made by July 1, 2017. In accordance with their NPDES stormwater
permit, Caltrans is required to implement trash control measures to reduce trash loads on
state-owned streets, roads and highways. The City will collaborate with Caltrans to
determine the possibility of entering into an agreement to offset the cost of installing
partial-capture devices on El Camino Real. The City would be responsible for maintaining
partial-capture devices. Implementation of partial- capture devices on El Camino Real will
occur by July 1, 2021 if the City executes an agreement with Caltrans regarding
installation.
►STREET SWEEPING
Implemented Prior to and Continued After MRP Effective Date:
• El Camino Real and Woodside Road (between El Camino Real and Alameda de las Pulgas)
are swept once/week. Both roads are swept between the hours of 4:00 a.m. to 6:00 a.m.
All streets with retail and commercial land uses within TMA #3 are swept once/month
between the hours of 4:00 a.m. to 6:00 a.m. Residential areas are swept once/month
between 7:30 am and 2:00 pm.
• All streets within TMA #3 are not posted with “No Parking- Street Cleaning” signs to
prohibit parking during sweeping hours. In areas where sweeping is conducted between
the hours of 4:00 a.m. and 6:00 a.m., cars are consistently not present when sweeping is
conducted. As a result, sweeping practices are effective since the sweeper is reaching the
curb. The presence of cars within residential areas is highly variable depending on when
sweeping is conducted within the 7:30 a.m. to 2:00 p.m. time window.
Implemented after MRP Effective Date and Prior to July 1, 2014:
• No additional street sweeping was implemented within TMA #3 during this time period.
• Updated the “Street Sweeping” webpage on the City’s website. This webpage provides the
street sweeping frequency by residential area within the City. Residents may view a list of
streets within a residential area to determine when their street is swept. The webpage is
available at: http://www.redwoodcity.org/publicworks/streets/street_cleaning.htm.
Planned for Future Implementation between July 2014 and July 2022:
• The City does not plan to increase street sweeping frequency within TMA #3 during this
time period. However, the City plans to evaluate the following for potential
implementation. A decision regarding implementation will be made by July 1, 2016. The
City will evaluate and determine the feasibility of implementing a delayed street sweeping
City of Redwood City
40
start time in all residential areas which have not been installed with “No Parking-Street
Cleaning” signs. Other cities within the Bay area have noted that moving the residential
sweeping times later in the day has resulted in better curb access since more people are at
work later in the day. Sweeping practices are more effective since the sweeper is more
likely to reaching the curb. Implementation will begin by July 1, 2017 if a decision is made
to delay the street sweeping start time within residential areas.
• The City will collaborate with Caltrans to revise their existing maintenance agreement. The
City will request full cost recovery for current street sweeping practices and future
increases in street sweeping frequency on El Camino Real and Woodside Road.
►ON-LAND CLEANUPS
Implemented Prior to and Continued After MRP Effective Date:
• The City’s Parks and Recreation Department perform on-land cleanups and services trash
containers daily (7 days/week) as part of their maintenance and landscaping activities in
the following four parks located within TMA #3. A total of 19 full-time employees and five
(5) seasonal employees are dedicated to maintaining parks within the City.
o Hawes Park
o Palm Park
o Fleishman Park
o Linden Park
• The City’s Parks and Recreation Department conducts an on-land cleanup of the El Camino
Real median within TMA #3 as part of their weekly or biweekly (i.e., twice/week)
maintenance and landscaping activities. Maintenance frequency is dependent on the
season. Trash types removed include food and beverage ware, food packaging, cigarette
butts, and other trash from patronizing retail and commercial establishments along El
Camino Real.
• As discussed under TMA #1, the City-supported Pride & Beautification Committee
sponsors two annual on-land cleanups in the spring and fall each year. In 2013, the Pride
& Beautification Committee conducted on-land cleanups at the following locations within
TMA #3:
o Union Cemetery on the 300 block of Woodside Road
o James Avenue between Elwood Street and El Camino Real
Implemented after MRP Effective Date and Prior to July 1, 2014:
• On-land cleanup activities and trash container servicing continued within the four parks
located within TMA #3 during the time period. The City did not implement additional on-
land cleanups since existing on-land cleanup efforts are adequately addressing trash loads
within these four parks.
• On-land cleanup activities of the El Camino Real median within TMA #3 continued during
this time period. The City did not implement additional on-land cleanups since existing on-
land cleanup activities are adequately addressing trash loads along the El Camino Real
median.

Long-Term Trash Load Reduction Plan
41
• The City-supported Pride & Beautification Committee continued two annual on-land
cleanups within TMA #3 during this time period. In 2013, approximately 800 to 2,200
pounds of trash were removed throughout the City during each event.
Planned for Future Implementation between July 2014 and July 2022:
• Existing on-land cleanup activities and trash container servicing will continue within the
four parks located within TMA #3. The City has no additional on-land cleanups planned for
these parks since existing on-land cleanup efforts are an adequate level of effort to achieve
“no adverse impact”. The trash condition of parks located within TMA #3 will be confirmed
via assessments described in Section 4.0.
• Existing on-land cleanup activities of the El Camino Real median within TMA #3 will
continue during this time period. The City has no additional on-land cleanups planned for
the El Camino Real median since existing on-land cleanup activities are adequately
addressing trash loads.
• The City plans to continue supporting Pride & Beautification Committee on-land cleanups
within TMA #3 during this time period. These on-land cleanup events have been successful
in bringing attention to problematic trash areas within the City.

City of Redwood City
42
3.2.5 Trash Management Area #4
Trash Management Area #4 (TMA #4 ) includes approximately 123 acres of land bordered by
Laurel Street to the west, G street (closest street to the City boundary with San Carlos) to the north,
US Highway 101 to the east and Whipple Avenue to the south. Visual on-land assessments
conducted by City staff within TMA #4 indicate that approximately 13 % of the jurisdictional area is
considered as a high trash generating area, 40 % as a medium trash generating area, and the
remaining 47 % as low trash generating area. The majority of the land area is residential with retail
and commercial land use adjacent to El Camino Real which is one block to the west of Laurel Street.
Retail, commercial and industrial land uses are adjacent to US Highway 101. TMA #4 includes El
Camino Real which results in large volumes of vehicular and pedestrian traffic through the area.
One school (i.e., Redwood High School) is also located within this area Trash is generated within the
retail, commercial and industrial corridors from pedestrians and vehicles. Full-capture devices have
not been installed within this area. To date, street sweeping and on-land cleanups have been
implemented within this area to address trash.
FULL-CAPTURE TREATMENT DEVICES
Implemented Prior to and Continued After MRP Effective Date:
• The City did not install full-capture devices within TMA #4 prior to the effective date of the
MRP.
Implemented after MRP Effective Date and Prior to July 1, 2014:
• The City did not install full-capture devices within TMA #4 during this time period.
Planned for Future Implementation between July 2014 and July 2022:
• The City plans to evaluate the following for potential implementation. A decision regarding
implementation will be made by July 1, 2014. The City will evaluate and determine the
feasibility of installing small full-capture devices to treat trash loads generated within TMA
#4. If it is determined to be feasible and resources are available, the City will install small
full-capture devices to treat TMA #4 by July 1, 2015.
• The City plans to evaluate the following for potential implementation. A decision regarding
implementation will be made by July 1, 2017. In accordance with their NPDES stormwater
permit, Caltrans is required to implement trash control measures to reduce trash loads on
state-owned streets, roads and highways. The City will collaborate with Caltrans to
determine the possibility of entering into an agreement to offset the cost of installing small
full- capture devices on El Camino Real. The City would be responsible for maintaining
small full-capture devices. Implementation of small full- capture devices on El Camino Real
will occur by July 1, 2021 if the City executes an agreement with Caltrans regarding
installation.
►PARTIAL-CAPTURE TREATMENT DEVICES
Implemented Prior to and Continued After MRP Effective Date:
• The City did not install partial-capture devices within TMA #4 prior to the effective date of
the MRP.
Long-Term Trash Load Reduction Plan
43
Implemented after MRP Effective Date and Prior to July 1, 2014:
• The City did not install partial-capture devices within TMA #4 during this time period.
Planned for Future Implementation between July 2014 and July 2022:
• The City plans to evaluate the following for potential implementation. A decision regarding
implementation will be made by July 1, 2014. The City will evaluate and determine the
feasibility of installing partial-capture devices to treat trash loads generated within TMA
#4. If it is determined to be feasible and resources are available, the City will install partial-
capture devices to treat TMA #4 by July 1, 2015.
• The City plans to evaluate the following for potential implementation. A decision regarding
implementation will be made by July 1, 2017. In accordance with their NPDES stormwater
permit, Caltrans is required to implement trash control measures to reduce trash loads on
state-owned streets, roads and highways. The City will collaborate with Caltrans to
determine the possibility of entering into an agreement to offset the cost of installing
partial-capture devices on El Camino Real. The City would be responsible for maintaining
partial-capture devices. Implementation of partial- capture devices on El Camino Real will
occur by July 1, 2021 if the City executes an agreement with Caltrans regarding
installation.
►STREET SWEEPING
Implemented Prior to and Continued After MRP Effective Date:
• El Camino Real is swept once/week between the hours of 4:00 a.m. to 6:00 a.m. All streets
with retail, commercial and industrial land uses within TMA #4 are swept once/month
between the hours of 4:00 a.m. to 6:00 a.m. Residential areas are swept once/month
between 7:30 am and 2:00 pm.
• All streets within TMA #4 are not posted with “No Parking- Street Cleaning” signs to
prohibit parking during sweeping hours. In areas where sweeping is conducted between
the hours of 4:00 a.m. and 6:00 a.m., cars are consistently not present when sweeping is
conducted. As a result, sweeping practices are effective since the sweeper is reaching the
curb. The presence of cars within residential areas is highly variable depending on when
sweeping is conducted within the 7:30 a.m. to 2:00 p.m. time window.
Implemented after MRP Effective Date and Prior to July 1, 2014:
• No additional street sweeping was implemented within TMA #4 during this time period.
• Updated the “Street Sweeping” webpage on the City’s website. This webpage provides the
street sweeping frequency by residential area within the City. Residents may view a list of
streets within a residential area to determine when their street is swept. The webpage is
available at: http://www.redwoodcity.org/publicworks/streets/street_cleaning.htm.
Planned for Future Implementation between July 2014 and July 2022:
• The City does not plan to increase street sweeping frequency within TMA #4 during this
time period. However, the City plans to evaluate the following for potential
implementation. A decision regarding implementation will be made by July 1, 2016.

City of Redwood City
44
o The City will evaluate and determine the feasibility of implementing a delayed street
sweeping start time in all residential areas which have not been installed with “No
Parking-Street Cleaning” signs. Other cities within the Bay area have noted that moving
the residential sweeping times later in the day has resulted in better curb access since
more people are at work later in the day. Sweeping practices are more effective since
the sweeper is more likely to reaching the curb. Implementation will begin by July 1,
2017 if a decision is made to delay the street sweeping start time within residential
areas.
• The City will collaborate with Caltrans to revise their existing maintenance agreement. The
City will request full cost recovery for current street sweeping practices and future
increases in street sweeping frequency on El Camino Real.
►ON-LAND CLEANUPS
Implemented Prior to and Continued After MRP Effective Date:
• The City’s Parks and Recreation Department conducts an on-land cleanup of the El Camino
Real median within TMA #4 as part of their weekly or biweekly (i.e., twice/week)
maintenance and landscaping activities. Maintenance frequency is dependent on the
season. Trash types removed include food and beverage ware, food packaging, cigarette
butts, and other trash from patronizing retail and commercial establishments along El
Camino Real.
Implemented after MRP Effective Date and Prior to July 1, 2014:
• On-land cleanup activities of the El Camino Real median within TMA #4 continued during
this time period. The City did not implement additional on-land cleanups since existing on-
land cleanup activities are adequately addressing trash loads along the El Camino Real
median.
Planned for Future Implementation between July 2014 and July 2022:
• Existing on-land cleanup activities of the El Camino Real median within TMA #4 will
continue during this time period. The City has no additional on-land cleanups planned for
the El Camino Real median since existing on-land cleanup activities are adequately
addressing trash loads.
Long-Term Trash Load Reduction Plan
45
3.2.6 Trash Management Area #5
Trash Management Area #5 (TMA #5) includes approximately 403 acres of land bordered by US
Highway 101 to the west, Whipple Avenue to the north and Marsh Road to the south. Visual on-land
assessments conducted by City staff within TMA #4 indicate that approximately 86 % of the
jurisdictional area is considered as a medium trash generating area, and the remaining 13 % as low
trash generating area. It includes retail, commercial, industrial and residential land uses on E.
Bayshore Road, Seaport Blvd, Frontage Road, Blomquist Street and Maple Street. Various
commercial and industrial businesses, a mobile home park, the City’s Police Department and the
Port of Redwood City are located within TMA #5. Trash is generated within the retail, commercial
and industrial corridors from pedestrians and vehicles. To date, full-capture treatment devices,
street sweeping and on-land clean-ups have been implemented within this area to address trash.
►FULL-CAPTURE TREATMENT DEVICES
Implemented Prior to and Continued After MRP Effective Date:
• The City did not install full-capture devices prior to the effective date of the MRP.
Implemented after MRP Effective Date and Prior to July 1, 2014:
• In 2012 and 2013, the City installed 7 small full-capture devices (i.e., connector pipe
screens) within TMA #5. This installation was funded by the Association of Bay Area
Governments (ABAG) and the California State Water Resources Control Board (State Water
Board) Bay Area-Wide Trash Capture Demonstration Project through the federal American
Recovery and Reinvestment Act of 2009. This funding was primarily intended to provide
preliminary resources to Bay Area municipalities in purchasing a limited number of the
Permit-required trash full capture treatment devices for installation in municipally-owned
stormwater conveyance systems. The area treated by the 7 small full capture devices is
approximately 2 % of the land area within TMA #5.
• These devices are inspected and maintained prior to the “first flush” with additional
inspection and maintenance conducted, as necessary after major storm events (may be up
to three to four times/year). The first maintenance event occurred in October 2012. Small
full-capture devices are maintained by using a combination sewer truck (i.e. Vactor truck)
to pressure wash and vacuum all debris from the catch basin and connector pipe screen. A
Trash Capture Device Maintenance Report is filled out for every maintenance event and is
kept on-file at the Public Works Services Department. To date, the City has experienced no
failures or other issues with these devices. Figure 7 (Trash Full Capture Device Map)
includes the areas within the City that are treated with these devices.
Planned for Future Implementation between July 2014 and July 2022:
• The City will continue inspecting and maintaining all small full-capture devices to ensure
proper performance. The City does not plan installing additional full-capture devices
within TMA #5.
City of Redwood City
46
►STREET SWEEPING
Implemented Prior to and Continued After MRP Effective Date:
• All streets with retail, commercial and industrial land uses within TMA #5 are swept
once/month between the hours of 4:00 a.m. to 6:00 a.m. Residential areas are swept
once/month between 7:30 am and 2:00 pm.
• All streets within TMA #5 are not posted with “No Parking- Street Cleaning” signs to
prohibit parking during sweeping hours. In areas where sweeping is conducted between
the hours of 4:00 a.m. and 6:00 a.m., cars are consistently not present when sweeping is
conducted. As a result, sweeping practices are effective since the sweeper is reaching the
curb. The presence of cars within residential areas is highly variable depending on when
sweeping is conducted within the 7:30 a.m. to 2:00 p.m. time window.
Implemented after MRP Effective Date and Prior to July 1, 2014:
• No additional street sweeping was implemented within TMA #5 during this time period.
• Updated the “Street Sweeping” webpage on the City’s website. This webpage provides the
street sweeping frequency by residential area within the City. Residents may view a list of
streets within a residential area to determine when their street is swept. The webpage is
available at: http://www.redwoodcity.org/publicworks/streets/street_cleaning.htm.
Planned for Future Implementation between July 2014 and July 2022:
• The City does not plan to increase street sweeping frequency within TMA #5 during this
time period. However, the City plans to evaluate the following for potential
implementation. A decision regarding implementation will be made by July 1, 2016. The
City will evaluate and determine the feasibility of implementing a delayed street sweeping
start time in all residential areas which have not been installed with “No Parking-Street
Cleaning” signs. Other cities within the Bay area have noted that moving the residential
sweeping times later in the day has resulted in better curb access since more people are at
work later in the day. Sweeping practices are more effective since the sweeper is more
likely to reaching the curb. Implementation will begin by July 1, 2017 if a decision is made
to delay the street sweeping start time within residential areas.
►ON-LAND CLEANUPS
Implemented Prior to and Continued After MRP Effective Date:
• As discussed under TMA #1, the City-supported Pride & Beautification Committee
sponsors two annual on-land cleanups in the spring and fall each year. In 2013, the Pride
& Beautification Committee conducted on-land cleanups at the following locations within
TMA #5:
o Bayfront Canal between Douglas Court and City limits with Menlo Park
Implemented after MRP Effective Date and Prior to July 1, 2014:
• The City-supported Pride & Beautification Committee continued two annual on-land
cleanups within TMA #5 during this time period. In 2013, approximately 800 to 2,200
pounds of trash were removed throughout the City during each event.
Long-Term Trash Load Reduction Plan
47
Planned for Future Implementation between July 2014 and July 2022:
• The City plans to continue supporting Pride & Beautification Committee on-land cleanups
within TMA #5 during this time period. These on-land cleanup events have been successful
in bringing attention to problematic trash areas within the City.
City of Redwood City
48
3.2.7 Trash Management Area #6
Trash Management Area #6 (TMA #6) includes almost entirely low trash generation areas within
the City that are not included in any other trash management area. Visual on-land assessments
conducted by City staff within TMA #6 indicate that approximately 4 % of the jurisdictional area is
considered as a medium trash generating area and 96 % as low trash generating area. The area
covers approximately 7,232 acres (approximately 79 % of the City’s jurisdictional area) and is
comprised of some commercial, retail, industrial land uses and mostly residential neighborhoods.
TMA #6 includes residents, parks, churches and schools located sporadically within the western
portion of the City, some industrial and commercial areas east of US Highway 101 and all of
Redwood Shores. Street sweeping is conducted once/month. Full-capture devices have not been
installed within TMA #6. On-land cleanups are conducted at schools, parks and several through
fares within Redwood Shores. The entire area benefits from jurisdictional- wide efforts which
include single-use carryout bag and polystyrene foam food service ware policies, and public
outreach and education programs. This area is the City’s lowest priority due to having almost
entirely low trash generation rate. Current trash generation rates may be high in some areas of
TMA #6. To refine current trash generation rates, the City will conduct additional on-land visual
assessments to accurately depict trash generation rates.
►STREET SWEEPING
Implemented Prior to and Continued After MRP Effective Date:
• All streets with retail, commercial and industrial land uses within TMA #6 are swept
once/month between the hours of 4:00 a.m. to 6:00 a.m. Residential areas are swept
once/month between 7:30 am and 2:00 pm.
• All streets within TMA #6 are not posted with “No Parking- Street Cleaning” signs to
prohibit parking during sweeping hours. In areas where sweeping is conducted between
the hours of 4:00 a.m. and 6:00 a.m., cars are consistently not present when sweeping is
conducted. As a result, sweeping practices are effective since the sweeper is reaching the
curb. The presence of cars within residential areas is highly variable depending on when
sweeping is conducted within the 7:30 a.m. to 2:00 p.m. time window. However, it is
important to note that residential streets in TMA #6 have been assigned a low trash
generation rate.
• Arterial roads in Redwood Shores are either red-curbed, too narrow for parking, or an
active lane of traffic. As a result, the City is achieving a parking enforcement equivalent.
Therefore, sweeping practices are effective since the sweeper is reaching the curb.
Implemented after MRP Effective Date and Prior to July 1, 2014:
• No additional street sweeping was implemented within TMA #6 during this time period.
• Updated the “Street Sweeping” webpage on the City’s website. This webpage provides the
street sweeping frequency by residential area within the City. Residents may view a list of
streets within a residential area to determine when their street is swept. The webpage is
available at: http://www.redwoodcity.org/publicworks/streets/street_cleaning.htm.
Planned for Future Implementation between July 2014 and July 2022:
• The City does not plan to increase street sweeping frequency within TMA #6 during this
time period. However, the City plans to evaluate the following for potential

Long-Term Trash Load Reduction Plan
49
implementation. A decision regarding implementation will be made by July 1, 2016. The
City will evaluate and determine the feasibility of implementing a delayed street sweeping
start time in all residential areas which have not been installed with “No Parking-Street
Cleaning” signs. Other cities within the Bay area have noted that moving the residential
sweeping times later in the day has resulted in better curb access since more people are at
work later in the day. Sweeping practices are more effective since the sweeper is more
likely to reaching the curb. Implementation will begin by July 1, 2017 if a decision is made
to delay the street sweeping start time within residential areas.
►ON-LAND CLEANUPS
Implemented Prior to and Continued After MRP Effective Date:
• The City’s Parks and Recreation Department perform on-land cleanups and services trash
containers daily (7 days/week) as part of their maintenance and landscaping activities
within the following sixteen (16) parks within TMA #6. Eight parks are located in Redwood
Shores. A total of five full-time employees and two seasonal employees solely dedicated to
maintaining city parks and through fares within Redwood Shores.
o Dolphin Park
o Dove Beeger Park
o Garrett Park
o Maddux Park
o Marlin Park
o Mariner Park
o Red Morton Community Park
o Sandpiper Park
o Shannon Park
o Shorebird Park
o Shore Dogs Park
o Stafford Park
o Stulsaft Park
o Wellesley Crescent Park
o Westwood Park
o 3.5 acre park on Shearwater Parkway
• The City’s Parks and Recreation Department conducts on-land cleanups as part of their
weekly maintenance and landscaping activities of the following thorough fares in
Redwood Shores:
o Redwood Shores Parkway (median and most of the shoulders/sides)
o Radio Road
o Marine Parkway median
o Shearwater Parkway median
o Shell Parkway median
o Bridge Parkway – median and shoulders/sides between Redwood Shore Parkway and
Redwood Shores library. The grounds around the library are also cleaned.
• The City, in conjunction with the Redwood Shores Community Association, sponsors the
annual Redwood Shores Levee Cleanup event. . Volunteers remove litter and illegally
dumped trash from the waterfront and levee.
City of Redwood City
50
Implemented after MRP Effective Date and Prior to July 1, 2014:
• On-land cleanup activities and trash container servicing continued within the sixteen parks
located within TMA #6 during the time period. The City did not implement additional on-
land cleanups since existing on-land cleanup efforts are adequately addressing trash loads
within these four parks.
• On-land cleanup activities of through fares in Redwood Shores during this time period. The
City did not implement additional on-land cleanups since existing on-land cleanup
activities are adequately addressing trash loads along these through fares.
• The City, in conjunction with the Redwood Shores Community Association, continued to
sponsor the annual Redwood Shores Levee Cleanup event. In 2013, volunteers removed
litter from seven miles of levee surrounding Redwood Shores.
Planned for Future Implementation between July 2014 and July 2022:
• Existing on-land cleanup activities and trash container servicing will continue within the
sixteen (16) parks located within TMA #6. The City has no additional on-land cleanups
planned for these parks since existing on-land cleanup efforts are an adequate level of
effort to achieve “no adverse impact”. The trash condition of parks located within TMA #6
will be confirmed via assessments described in Section 4.0.
• Existing on-land cleanup activities of through fares in Redwood Shores will continue
during this time period. The City has no additional on-land cleanups planned for theses
through fares since existing on-land cleanup activities are adequately addressing trash
loads.
• The City plans to continue supporting the annual Redwood Shores Levee Cleanup event
within TMA #6 during this time period. This event has been successful in bringing the
community together to beautify Redwood Shores and reduce trash loads discharged to San
Francisco Bay.
Long-Term Trash Load Reduction Plan
51
3.2.8 Creek and Shoreline Hot Spot Cleanups
The City’s Public Works Services Department staff coordinates and conduct annual cleanups of
three trash hot spots as required in accordance with Permit Provision C.10.b.iii of the MRP. The
City’s three trash hot spots are indicated on the Trash Generation, Trash Management Area, and
Full Capture Device maps included within this Plan. One hot spot is located on Jefferson Creek, one
is located on Redwood Creek, and one is located on Bayfront Canal. Cleanups of these hot spots
began in 2010. Cleanup data since 2010 shows no discernable trends in the quantities of trash
found at the hot spots. Common sources of the trash cleaned-up include pedestrian litter, vehicles,
and trash accumulation. Most common types of trash found at cleanups include expanded
polystyrene foam, cigarette butts, plastic bags and bottles.
City of Redwood City
52
3.2.9 Summary of Trash Control Measures
Jurisdiction-wide Control Measures
• Single-use carryout bag policy (currently implemented)
• Polystyrene foam food service ware policy (currently implemented)
• Public education and outreach programs (currently implemented)
• City-led on-land cleanups (currently implemented)
• On-land cleanups at schools (currently implemented)
• On-land cleanups- Sheriffs Work Program (currently implemented)
• Improved trash bin/container management (currently implemented and considered for
future implementation)
The implementation of jurisdiction-wide trash control measures are expected to achieve the trash
reduction goal of “No Adverse Impact” by July 1, 2022.
Trash Management Area #1
• 131 small full-capture treatment devices (currently implemented)
• Additional small full-capture treatment devices (considered for future implementation)
• Small full-capture treatment devices (collaboration with Caltrans regarding future
implementation)
• Partial-capture treatment devices (considered for future implementation)
• Partial-capture devices (collaboration with Caltrans regarding future implementation)
• Street sweeping (currently implemented)
• Street sweeping with ride-on vacuum (currently implemented)
• Street sweeping with limited parking enforcement (currently implemented)
• Street sweeping with parking enforcement equivalent (currently implemented)
• Street sweeping with delayed starting time (considered for future implementation)
• Collaborate with Caltrans to revise existing maintenance agreement (considered for future
implementation)
• On-land cleanups at parks (currently implemented)
• On-land cleanups of El Camino Real median (currently implemented)
• City-supported volunteer on-land cleanups (currently implemented)
The implementation of current and planned trash control measures are expected to achieve the
trash reduction goal of “No Adverse Impact” within Trash Management Area #1 by July 1, 2022.
Long-Term Trash Load Reduction Plan
53
Trash Management Area #2
• 10 small full-capture treatment devices (currently implemented)
• Street sweeping (currently implemented)
• Street sweeping with parking enforcement equivalent (currently implemented)
• Street sweeping with delayed starting time (considered for future implementation)
• On-land cleanups at one park (currently implemented)
The implementation of current and planned trash control measures are expected to achieve the trash
reduction goal of “No Adverse Impact” within Trash Management Area #2 by July 1, 2022.
Trash Management Area #3
• Small full-capture treatment devices (considered for future implementation)
• Small full-capture treatment devices (collaboration with Caltrans regarding future
implementation)
• Partial-capture treatment devices (considered for future implementation)
• Partial-capture devices (collaboration with Caltrans regarding future implementation)
• Street sweeping (currently implemented)
• Street sweeping with parking enforcement equivalent (currently implemented)
• Street sweeping with delayed starting time (considered for future implementation)
• Collaborate with Caltrans to revise existing maintenance agreement (considered for future
implementation)
• On-land cleanups at parks (currently implemented)
• On-land cleanups of El Camino Real median (currently implemented)
• City-supported volunteer on-land cleanups (currently implemented)
The implementation of current and planned trash control measures are expected to achieve the trash
reduction goal of “No Adverse Impact” within Trash Management Area #3 by July 1, 2022.
Trash Management Area #4
• Small full-capture treatment devices (considered for future implementation)
• Small full-capture treatment devices (collaboration with Caltrans regarding future
implementation)
• Partial-capture treatment devices (considered for future implementation)
• Partial-capture devices (collaboration with Caltrans regarding future implementation)
• Street sweeping (currently implemented)
• Street sweeping with parking enforcement equivalent (currently implemented)
• Street sweeping with delayed starting time (considered for future implementation)
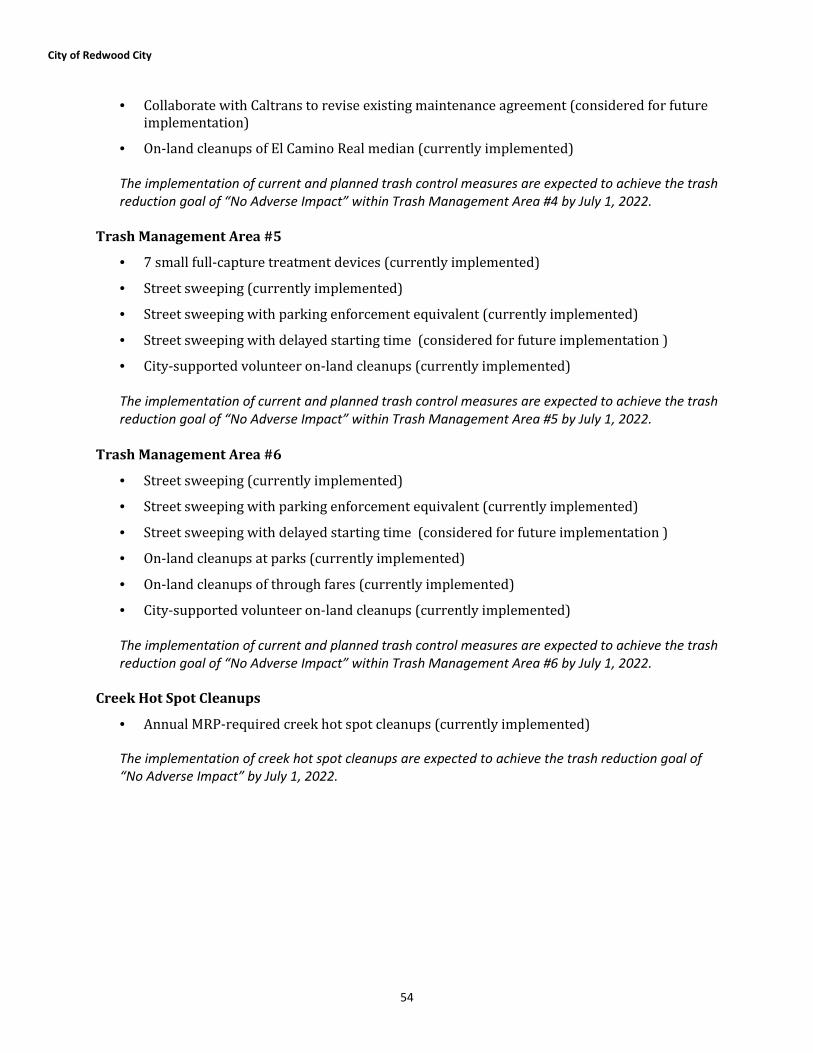
City of Redwood City
54
• Collaborate with Caltrans to revise existing maintenance agreement (considered for future
implementation)
• On-land cleanups of El Camino Real median (currently implemented)
The implementation of current and planned trash control measures are expected to achieve the trash
reduction goal of “No Adverse Impact” within Trash Management Area #4 by July 1, 2022.
Trash Management Area #5
• 7 small full-capture treatment devices (currently implemented)
• Street sweeping (currently implemented)
• Street sweeping with parking enforcement equivalent (currently implemented)
• Street sweeping with delayed starting time (considered for future implementation )
• City-supported volunteer on-land cleanups (currently implemented)
The implementation of current and planned trash control measures are expected to achieve the trash
reduction goal of “No Adverse Impact” within Trash Management Area #5 by July 1, 2022.
Trash Management Area #6
• Street sweeping (currently implemented)
• Street sweeping with parking enforcement equivalent (currently implemented)
• Street sweeping with delayed starting time (considered for future implementation )
• On-land cleanups at parks (currently implemented)
• On-land cleanups of through fares (currently implemented)
• City-supported volunteer on-land cleanups (currently implemented)
The implementation of current and planned trash control measures are expected to achieve the trash
reduction goal of “No Adverse Impact” within Trash Management Area #6 by July 1, 2022.
Creek Hot Spot Cleanups
• Annual MRP-required creek hot spot cleanups (currently implemented)
The implementation of creek hot spot cleanups are expected to achieve the trash reduction goal of
“No Adverse Impact” by July 1, 2022.
Long-Term Trash Load Reduction Plan
55
3.3 Control Measure Implementation Schedule
Based on current knowledge of trash control measure effectiveness and characteristics of the City’s
TMAs, the following schedule for control measure implementation has been proposed. The City
considers this Plan and schedule as a working guide. As such, the City may, at its discretion, modify
or reprioritize trash control measure implementation during the term of this Plan. Any changes to
the trash control measures proposed or to the implementation timeframe will be reported through
the annual report process.
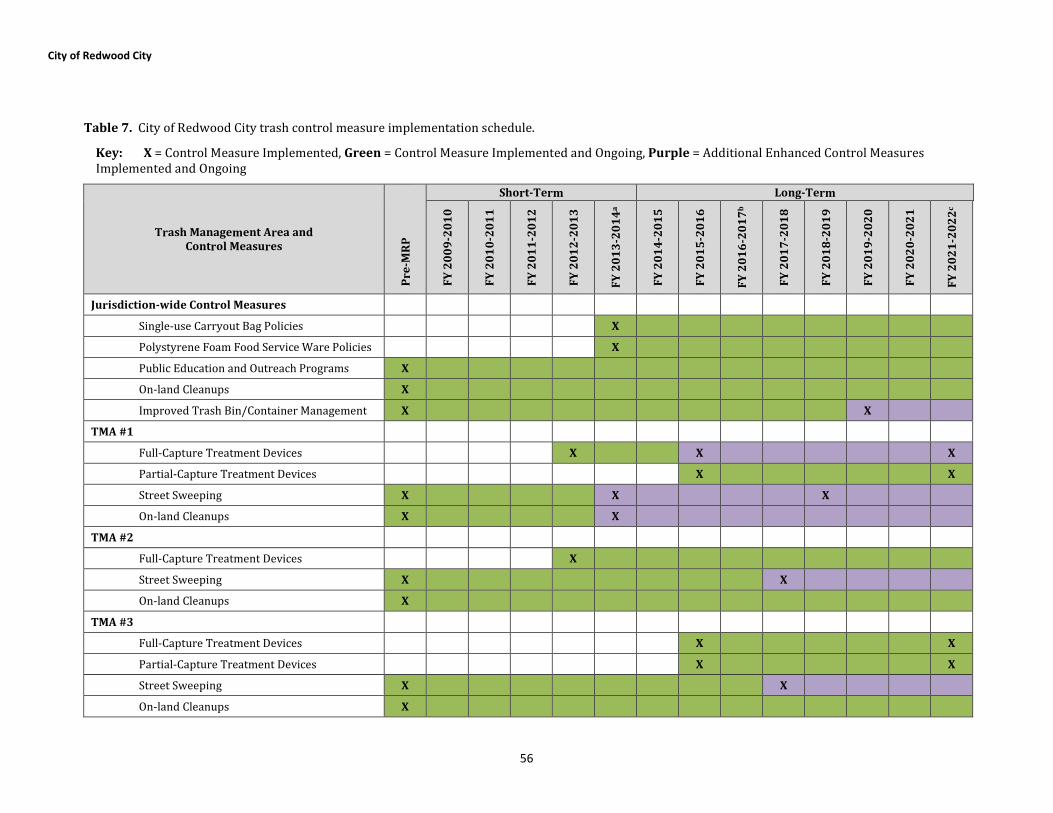
City of Redwood City
56
Table 7. City of Redwood City trash control measure implementation schedule.
Key: X = Control Measure Implemented, Green = Control Measure Implemented and Ongoing, Purple = Additional Enhanced Control Measures
Implemented and Ongoing
Trash Management Area and
Control Measures
Pr
e-M
RP
Short-Term Long-Term
FY
20
09
-20
10
FY
20
10
-20
11
FY
20
11
-20
12
FY
20
12
-20
13
FY
20
13
-20
14a
FY
20
14
-20
15
FY
20
15
-20
16
FY
20
16
-20
17b
FY
20
17
-20
18
FY
20
18
-20
19
FY
20
19
-20
20
FY
20
20
-20
21
FY
20
21
-20
22c
Jurisdiction-wide Control Measures
Single-use Carryout Bag Policies X
Polystyrene Foam Food Service Ware Policies X
Public Education and Outreach Programs X
On-land Cleanups X
Improved Trash Bin/Container Management X X
TMA #1
Full-Capture Treatment Devices X X X
Partial-Capture Treatment Devices X X
Street Sweeping X X X
On-land Cleanups X X
TMA #2
Full-Capture Treatment Devices X
Street Sweeping X X
On-land Cleanups X
TMA #3
Full-Capture Treatment Devices X X
Partial-Capture Treatment Devices X X
Street Sweeping X X
On-land Cleanups X

Long-Term Trash Load Reduction Plan
57
Trash Management Area and
Control Measures
Pr
e-M
RP
Short-Term Long-Term
FY
20
09
-20
10
FY
20
10
-20
11
FY
20
11
-20
12
FY
20
12
-20
13
FY
20
13
-20
14a
FY
20
14
-20
15
FY
20
15
-20
16
FY
20
16
-20
17b
FY
20
17
-20
18
FY
20
18
-20
19
FY
20
19
-20
20
FY
20
20
-20
21
FY
20
21
-20
22c
TMA #4
Full-Capture Treatment Devices X X
Partial-Capture Treatment Devices X X
Street Sweeping X X
On-land Cleanups X
TMA #5
Full-Capture Treatment Devices X
Street Sweeping X X
On-land Cleanups X
TMA #6
Street Sweeping X X
On-land Cleanups X
Creek Hot Spot Cleanups
On-land Cleanup X
aJuly 1, 2014 - 40% trash reduction target bJuly 1, 2017 - 70% trash reduction target cJuly 1, 2022 - 100% trash reduction target

Long-Term Trash Load Reduction Plan
58
4.0 PROGRESSASSESSMENTSTRATEGY
Provision C.10.a.ii of the MRP requires Permittees to develop and implement a trash load reduction
tracking method that will be used to account for trash load reduction actions and to demonstrate
progress and attainment of trash load reduction targets. Early into the MRP, Permittees decided to
work collaboratively to develop a trash load reduction tracking method through the Bay Area
Stormwater Management Agencies Association (BASMAA). Permittees, Water Board staff and other
stakeholders assisted in developing Version 1.0 of the tracking method. On behalf of all MRP
Permittees, the Bay Area Stormwater Management Agencies Association (BASMAA) submitted
Version 1.0 to the Water Board on February 1, 2012.
The Trash Assessment Strategy (Strategy) described in this section is intended to serve as Version
2.0 of the trash tracking method and replace version 1.0 previously submitted to the Water Board.
The Strategy is specific to Permittees participating in the San Mateo Countywide Water Pollution
Prevention Program (SMCWPPP), including the City of Redwood City. The City intends to
implement the Strategy in phases and at multiple geographical scales (i.e., jurisdiction-wide and
trash management area) in collaboration with SMCWPPP. Pilot implementation is scheduled for the
near-term and as assessment methods are tested and refined, the Strategy will be adapted into a
longer-term approach. The Strategy selected by the City is described in the following sections.
4.1 SMCWPPP Pilot Assessment Strategy
The following SMCWPPP Pilot Trash Assessment Strategy (SMCWPPP Pilot Strategy) was
developed by SMCWPPP on behalf of the City and other San Mateo County Permittees. The
SMCWPPP Pilot Strategy will be implemented at a pilot scale on a countywide basis and includes
measurements and observations in the City of Redwood City.
4.1.1 Management Questions
The SMCWPPP Pilot Strategy is intended to answer the following core management questions over
time as trash control measures outlined in Section 3.0 are implemented and refined:
• Are the MS4 trash load reduction targets (i.e., 40%, 70%, and No Adverse Impacts) being
achieved?
• Are there trash problems in receiving waters (e.g., creeks and rivers)?
• If trash problems in receiving waters exist, what are the important sources and transport
pathways?
The SMCWPPP Pilot Strategy, including indicators and methods, is summarized in this section and
fully described in the SMCWPPP Pilot Trash Assessment Strategy, a compendium document
submitted to the Water Board on February 1, 2014 on behalf of all SMCWPPP Permittees
(SMCWPPP 2014).
4.1.2 Indicators of Progress and Success
The management questions listed in the previous section will be addressed by tracking information
and collecting data needed to report on a set of key environmental indicators. Environmental
indicators are simple measures that communicate what is happening in the environment. Since
trash in the environment is very complex, indicators provide a more practical and economical way
to track the state of the environment than if we attempted to record every possible variable.

Long-Term Trash Load Reduction Plan
59
With regard to municipal stormwater trash management, indicators are intended to detect progress
towards trash load reduction targets and solving trash problems. Ideally, indicators should be
robust and able to detect progress that is attributable to multiple types of trash control measure
implementation scenarios. Assessment results should also provide Permittees with an adequate
level of confidence that trash load reductions from MS4s have occurred, while also assessing
whether trash problems in receiving waters have been resolved. Indicators must also be cost
effective, relatively easy to generate, and understandable to stakeholders.
Primary and secondary indicators that SMCWPPP Permittees will use to answer core management
questions include:
Primary Indicators:
1-A Reduction in the level of trash present on-land and available to MS4s
1-B Effective full capture device operation and maintenance
Secondary Indicators:
2-A Successful levels of trash control measures implementation
2-B Reductions in the amount of trash in receiving waters In selecting the indicators above, the City of Redwood City in collaboration with SMCWPPP and
other SMCWPPP Permittees recognize that no one environmental indicator will provide the
information necessary to effectively determine progress made in reducing trash discharged from
MS4s and improvements in the level of trash in receiving waters. Multiple indicators were therefore
selected.
The ultimate goal of municipal stormwater trash reduction strategies is to reduce the impacts of
trash associated with MS4s on receiving waters. Indicators selected to assess progress towards this
goal should ideally measure outcomes (e.g., reductions in trash discharged). The primary indicators
selected by SMCWPPP are outcome-based and include those that are directly related to MS4
discharges. Secondary indicators are outcome or output-based and are intended to provide
additional perspective on and evidence of, successful trash control measure implementation and
improvements in receiving water condition with regard to trash.
As described in Section 2.2, trash is transported to receiving waters from pathways other than
MS4s, which may confound our ability to observe MS4-associated reductions in creeks and
shorelines. Due to this challenge of linking MS4 control measure implementation to receiving water
conditions, the receiving water based indicator is currently considered a secondary indicator.
Evaluations of data on the amount of trash in receiving waters that are conducted over time
through the Pilot Assessment Strategy will assist the City in further determinations of the
important sources and pathways causing problems in local creeks, rivers and shorelines.
4.1.3 Pilot Assessment Methods
This section briefly summarizes the preliminary assessment methods that the City of Redwood City
will implement through the SMCWPPP Pilot Strategy to generate indicator information described in
the previous section. Additional information on each method can be found in the SMCWPPP Pilot
Trash Assessment Strategy submitted to the Water Board by SMCWPPP on behalf of the City.
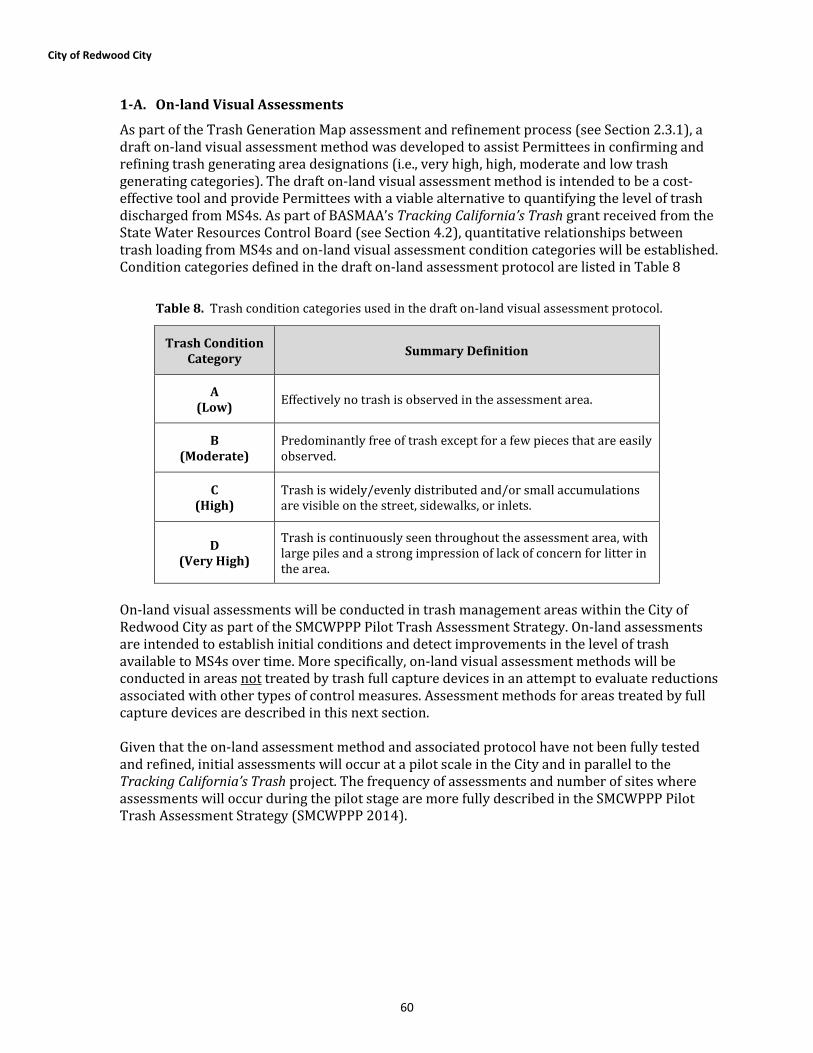
City of Redwood City
60
1-A. On-land Visual Assessments
As part of the Trash Generation Map assessment and refinement process (see Section 2.3.1), a
draft on-land visual assessment method was developed to assist Permittees in confirming and
refining trash generating area designations (i.e., very high, high, moderate and low trash
generating categories). The draft on-land visual assessment method is intended to be a cost-
effective tool and provide Permittees with a viable alternative to quantifying the level of trash
discharged from MS4s. As part of BASMAA’s Tracking California’s Trash grant received from the
State Water Resources Control Board (see Section 4.2), quantitative relationships between
trash loading from MS4s and on-land visual assessment condition categories will be established.
Condition categories defined in the draft on-land assessment protocol are listed in Table 8
Table 8. Trash condition categories used in the draft on-land visual assessment protocol.
Trash Condition
Category Summary Definition
A
(Low) Effectively no trash is observed in the assessment area.
B
(Moderate)
Predominantly free of trash except for a few pieces that are easily
observed.
C
(High)
Trash is widely/evenly distributed and/or small accumulations
are visible on the street, sidewalks, or inlets.
D
(Very High)
Trash is continuously seen throughout the assessment area, with
large piles and a strong impression of lack of concern for litter in
the area.
On-land visual assessments will be conducted in trash management areas within the City of
Redwood City as part of the SMCWPPP Pilot Trash Assessment Strategy. On-land assessments
are intended to establish initial conditions and detect improvements in the level of trash
available to MS4s over time. More specifically, on-land visual assessment methods will be
conducted in areas not treated by trash full capture devices in an attempt to evaluate reductions
associated with other types of control measures. Assessment methods for areas treated by full
capture devices are described in this next section.
Given that the on-land assessment method and associated protocol have not been fully tested
and refined, initial assessments will occur at a pilot scale in the City and in parallel to the
Tracking California’s Trash project. The frequency of assessments and number of sites where
assessments will occur during the pilot stage are more fully described in the SMCWPPP Pilot
Trash Assessment Strategy (SMCWPPP 2014).
Long-Term Trash Load Reduction Plan
61
1-B. Full Capture Operation and Maintenance Verification
Consistent with the MRP, adequate inspection and maintenance of trash full capture devices is
required to maintain full capture designation by the Water Board. The City of Redwood City is
currently developing an operation and maintenance verification program (Trash O&M
Verification Program), via SMCWPPP, to ensure that devices are inspected and maintained at a
level that maintains this designation.
The SMCWPPP Trash O&M Verification Program will be modeled on the current O&M
verification program for stormwater treatment controls implemented consistent with the
Permit new and redevelopment requirements. Additional details regarding the Trash O&M
Verification Program can be found in the SMCWPPP Pilot Trash Assessment Strategy
(SMCWPPP 2014).
2-A. Control Measure Effectiveness Evaluations
In addition to on-land trash assessments and full capture operation and maintenance
verification, the City will also conduct assessments of trash control measures implemented
within their jurisdictional area. Assessment methods will be selected based on trash sources
and the type of control measure being implemented. Control measure effectiveness evaluations
are more fully described in the SMCWPPP Pilot Trash Assessment Strategy. The following are
example assessment methods that may be used to demonstrate successful control measure
implementation and progress towards trash reduction targets:
• Product-related Ordinances – Descriptions of outreach efforts, tracking and reporting
business compliance rates, or other metrics of control measure performance.
• Street Sweeping- Identification sweeping frequency and the ability to sweep to the curb by
primary TMA, including any enhancements that have been implemented; and any other
metrics demonstrating the enhanced performance of street sweeping.
• Public/Private Trash Container Management - Descriptions of control measures
implemented to prevent overflowing trash containers or promoting the more effective use
of public/private bins, including any new or enhancements to existing actions; and any
other metrics demonstrating the performance of the control measure.
• Public Outreach and Education – Descriptions of outreach and education actions specific to
trash deduction, including the number of events conducted within the municipality;
descriptions of effectiveness measurements, including the results of pre- and post-
implementation surveys or other metrics.
• On-land Cleanups and Enforcement – Descriptions of on-land cleanup actions, including any
enhancements that have been implemented; identification of whether on-land cleanup are
Permittee or volunteer–led; or other metrics of control measure performance.
• Storm Drain Inlet Maintenance – Descriptions of the level of maintenance, including any
enhancement to maintenance frequency; the numbers of inlets where enhanced
maintenance is being implemented; and any other metrics demonstrating the performance
of inlet maintenance.
• Anti-littering and Illegal Dumping Prevention/Enforcement - Descriptions of control
measures implemented to prevent littering and illegal dumping, including any new or
enhancements to existing actions; descriptions and results of enhanced enforcement
actions; and any other metrics demonstrating the performance of the control measure.
City of Redwood City
62
• Prevention of Uncovered Loads - Descriptions of control measures implemented to prevent
trash dispersion from uncovered loads, including any new or enhancements to existing
actions; descriptions and results of enhanced enforcement actions; and any other metrics
demonstrating the performance of the control measure.
• Partial Capture Devices – Descriptions, numbers and types of devices implemented;
maintenance frequencies by device or groups of devices; and any other metrics
demonstrating the partial capture device performance.
• Other Control Measures - Descriptions of control measures implemented to prevent or
intercept trash before discharge to receiving waters, and any other metrics demonstrating
the performance of the control measure.
2-C. Receiving Water Condition Assessments
The ultimate goal of stormwater trash management in the Bay Area is to significantly reduce
the amount of trash found in receiving waters. In the last decade, San Mateo County Permittees
and volunteers have collected data on the amounts of trash removed during cleanup events.
More recently, Permittees have conducted trash assessments in creek and shoreline hotspots
using standardized assessment methods. In an effort to answer the core management question
Have trash problems in receiving waters been resolved?, the City of Redwood City plans to
continue conducting receiving water condition assessments at trash hot spots a minimum of
one time per year. Assessment will be conducted consistent with Permit hot spot cleanup and
assessment requirements. Additional information on receiving water assessment methods can
be found in the SMCWPPP Pilot Trash Assessment Strategy (SMCWPPP 2014).
4.2 BASMAA “Tracking California’s Trash” Project
The SMCWPPP Pilot Assessment Strategy described in the previous section recognizes that
outcome-based trash assessment methods needed to assess progress toward trash reduction
targets are not well established by the scientific community. In an effort to address these
information gaps associated with trash assessment methods, the Bay Area Stormwater
Management Agencies Association (BASMAA), in collaboration with SMCWPPP, the 5 Gyres
Institute, San Francisco Estuary Partnership, the City of Los Angeles, and other stormwater
programs in the Bay Area, developed the Tracking California’s Trash Project. The Project is funded
through a Proposition 84 grant awarded to BASMAA by the State Water Resources Control Board
(SWRCB) who recognized the need for standardized trash assessment methods that are robust and
cost-effective.
The Project is intended to assist BASMAA member agencies in testing trash assessment and
monitoring methods needed to evaluate trash levels in receiving waters, establish control measures
that have an equivalent performance to trash full capture devices, and assess progress in trash
reduction over time. The following sections provide brief descriptions of tasks that BASMAA will
conduct via the three-year Project. Full descriptions of project scopes, deliverables, and outcomes
will be developed as part of the task-specific Sampling and Analysis Plans required by the SWRCB
during the beginning of the Project. The Project is currently underway and will continue through
2016.
4.2.1 Testing of Trash Monitoring Methods
BASMAA and the 5 Gyres Institute will evaluate the following two types of assessment methods as
part of the Project:
Long-Term Trash Load Reduction Plan
63
• Trash Flux Monitoring – Trash flux monitoring is intended quantify the amount of trash
flowing in receiving waters under varying hydrological conditions. Flux monitoring will be
tested in up to four receiving water bodies in San Francisco Bay and/or the Los Angeles
areas. Methods selected for evaluation and monitoring will be based on a literature review
conducted during this task and through input from technical advisors and stakeholders.
Monitoring is scheduled to begin in 2014 and will be completed in 2016.
• On-land Visual Assessments – As part of the Project, BASMAA will also conduct an
evaluation of on-land visual assessment methods that are included in the SMCWPPP Pilot
Assessment Strategy. The methods are designed to determine the level of trash on streets
and public right-of-ways that may be transported to receiving waters via MS4s. BASMAA
plans to conduct field work associated with the evaluation of on-land visual assessment at a
number of sites throughout the region. To the extent practical, sites where the on-land
methods evaluations take place will be coordinated with trash flux monitoring in receiving
waters. On-land assessments will occur in areas that drain to trash full capture devices, and
all sites will be assessed during wet and dry weather seasons in order to evaluate on-land
methods during varying hydrologic conditions. Monitoring is scheduled to begin in 2014
and will be completed in 2016.
4.2.2 Full Capture Equivalent Studies
Through the implementation of BASMAA’s Tracking California’s Trash grant-funded project, a small
set of “Full Capture Equivalent” projects will also be conducted in an attempt to demonstrate that
specific combinations of control measures will reduce trash to a level equivalent to full capture
devices. Initial BMP combinations include high-frequency street sweeping, and enhanced street
sweeping with auto-retractable curb inlet screens. Other combinations will also be considered.
Studies are scheduled to begin in 2014 and will be completed in 2016.
4.3 Long-Term Assessment Strategy
The City of Redwood City is committed to implementing standardized assessment methods post-
2016 based on the lessons learned from pilot assessments and studies that will occur between 2014
and 2016. Assessment activities described in the previous sections will evaluate the utility of
different assessment methods to demonstrate progress towards trash reduction targets and
provide recommended approaches for long-term implementation. Lessons learned will be
submitted to the Water Board with the FY 2015-2016 Annual Report and a revised Strategy will be
developed and submitted, if necessary. The revised Strategy will include agreed upon assessment
methods that will be used to demonstrate progress during the remaining term of trash reduction
requirements. Reporting using the new/revised methods will begin with the FY 2016-2017 Annual
Report.
4.4 Implementation Schedule
The implementation schedule for the SMCWPPP Pilot Implementation Strategy, BASMAA’s Tracking
California’s Trash project, and the Long-Term Assessment Strategy are included in Table 9. Load
reduction reporting milestones are also denoted in the table. The schedule is consistent with the
need for near-term pilot assessment results to demonstrate progress toward short-term targets,
while acknowledging the need for testing and evaluation of assessment methods and protocols
prior to long-term implementation. For more detailed information on implementation timelines,
refer to the SMCWPPP Pilot Trash Assessment Strategy (SMCWPPP 2014) and monitoring plans
developed as part of BASMAA’s Tracking California’s Trash project.

City of Redwood City
64
Table 9. City of Redwood City trash progress assessment implementation schedule.
Trash Assessment Programs and Methods
Pr
ior
to
FY
20
13
-14
Fiscal Year
20
13
-14a
20
14
-15
20
15
-16
20
16
-17b
20
17
-18
20
18
-19
20
19
-20
20
20
-21
20
21
-22c
Pilot Trash Assessment Strategy (SMCWPPP)
On-land Visual Assessments
Initial (Baseline) Assessments X
Pilot Progress Assessments X X X X
Full Capture Operation and Maintenance Verification X X X
Control Measure Effectiveness Evaluations X X X X X
Receiving Water Condition Assessments X X X X X
Tracking California’s Trash Project (BASMAA)
Testing of Trash Monitoring Methods
Trash Flux Monitoring Protocol Testing X X X
On-land Visual Assessment Evaluations X X X
Full Capture Equivalent Studies X X X
Long-Term Trash Assessment Strategy (SMCWPPP) X X X X X
aJuly 1, 2014 - 40% trash reduction target bJuly 1, 2017 - 70% trash reduction target cJuly 1, 2022 - 100% trash reduction target

Long-Term Trash Load Reduction Plan
65
5.0 REFERENCES
Allison R.A. and F.H.S. Chiew 1995. Monitoring stormwater pollution from various land uses in an
urban catchment. Proceedings from the 2nd International Symposium on Urban Stormwater
Management, Melbourne, 551-516.
Allison, R.A., T.A. Walker, F.H.S. Chiew, I.C. O’Neill and T.A McMahon 1998. From Roads to rivers:
Gross pollutant removal from urban waterways. Report 98/6. Cooperative Research Centre for
Catchment Hydrology. Victoria, Australia. May 1998.
Armitage, N. 2003. The removal of urban solid waste from stormwater drains. Prepared for the
International Workshop on Global Developments in Urban Drainage Management, Indian
Institute of Technology, Bombay, Mumbai India. 5-7 February 2003.
Armitage, N. 2007. The reduction of urban litter in the stormwater drains of South Africa. Urban
Water Journal Vol. 4, No. 3: 151-172. September 2007.
Armitage N., A. Rooseboom, C. Nel, and P. Townshend 1998. “The removal of Urban Litter from
Stormwater Conduits and Streams. Water Research Commission (South Africa) Report No. TT
95/98, Prestoria.
Armitage, N. and A. Rooseboom 2000. The removal of urban litter from stormwater conduits and
streams: Paper 1 – The quantities involved and catchment litter management options. Water
S.A. Vol. 26. No. 2: 181-187.
ABAG (Association of Bay Area Governments). 2005. Bay Area Land Use Geographical Information
Systems Datalayer.
BASMAA (Bay Area Stormwater Management Agencies Association). 2011a. Progress Report on
Methods to Estimate Baseline Trash Loads from Bay Area Municipal Stormwater Systems and
Track Loads Reduced. February 2011.
BASMAA (Bay Area Stormwater Management Agencies Association). 2011b. Method to Estimate
Baseline Trash Loads from Bay Area Municipal Stormwater Systems: Technical Memorandum
#1. Prepared by EOA, Inc. April 2011.
BASMAA (Bay Area Stormwater Management Agencies Association). 2011c. Sampling and Analysis
Plan. Prepared by EOA, Inc. April 2011.
BASMAA (Bay Area Stormwater Management Agencies Association). 2012. Trash Baseline
Generation Rates: Technical Report. Prepared by EOA, Inc. February 1, 2012.
County of Los Angeles. 2002. Los Angeles County Litter Monitoring Plan for the Los Angeles River
and Ballona Creek Trash Total Maximum Daily Load. May 30, 2002.
County of Los Angeles. 2004a. Trash Baseline Monitoring Results Los Angles River and Ballona
Creek Watershed. Los Angeles County Department of Public Works. February 17, 2004.
County of Los Angeles 2004b. Trash Baseline Monitoring for Los Angles River and Ballona Creek
Watersheds. Los Angeles County Department of Public Works. May 6, 2004.
Kim, L.H, M. Kayhanian, M.K. Stenstrom 2004. Event mean concentration and loading of litter from
highways during storms. Science of the Total Environment Vol 330: 101-113.
Lippner, G., R. Churchwell, R. Allison, G. Moeller, and J. Johnston 2001. A Scientific Approach to
Evaluating Storm Water Best Management Practices for Litter. Transportation Research Record.
TTR 1743, 10-15.

City of Redwood City
66
SMCWPPP (San Mateo Countywide Water Pollution Prevention Program). 2014. Pilot Trash
Assessment Strategy. Prepared by EOA. February 1.
AppendixA:StaffReporttoCityCouncil
REPORT To the Honorable Mayor and City Council
From the City Manager
February 24, 2014
SUBJECT The Long-Term Trash Load Reduction Plan RECOMMENDATION Information only: The Long-Term Trash Load Reduction Plan submitted as required by provision C.10.c of the Municipal Regional Stormwater Permit. BACKGROUND The City's stormwater discharge system is regulated under the Municipal Regional Stormwater National Pollutant Discharge Elimination System Permit (Stormwater Permit) issued by the San Francisco Bay Regional Water Quality Control Board (Water Board). The Stormwater Permit specifies actions necessary to reduce the discharge of pollutants into the municipal stormwater discharge system to protect local creeks and the Bay. In October 2009, Water Board issued more stringent regulation of trash as a pollutant under the Federal Clean Water Act. The regulation requires Phase I communities in the San Francisco Bay including Redwood City and 75 other municipalities and agencies to submit a “Long Term Trash Load Reduction Plan” by February 1, 2014 that details how each agency intends to control trash from entering local waterways. The Long-Term Plan describes current and future trash control measures that may be implemented to achieve a target of 70 percent reduction in trash discharges from the City’s stormwater system by 2017, and 100 percent reduction by 2022. ANALYSIS Under the provisions of the permit, the City is required to submit the Long-Term Plan. A Notice of Violation would be issued for non-compliance with this provision and continued violation could lead to civil penalties. The goal of the Long-Term Plan is to reduce and/or eliminate trash being discharged from the City’s storm drain system. The Long-Term Plan includes:
1. Descriptions of the current level of implementation of trash control measures and the type and extent to which new or enhanced control measures will be implemented to achieve 70 and 100 percent reduction goals.
2. Description of the Trash Assessment Strategy that will be used to assess progress towards above goals.
3. Time schedules for implementing additional control measures and assessment strategy.
ALTERNATIVES The Long-Term Plan was drafted to have minimal impact on the budget and Public Works operations while working toward meeting the guidelines established by the Water Board. Alternative plans may require additional staff or sizable changes in the operations. FISCAL IMPACT Fiscal Impact for implementing the Long-Term Plan is unknown at this point. The current plan will evaluate effectiveness of partial trash capture devices in the storm drain inlets. The costs related to implementation of the plan will be analyzed and will seek approvals from the Council as required. ENVIRONMENTAL REVIEW The Long-Term Plan is not a project under California Environmental Quality Act (CEQA) as defined in CEQA guidelines.
TERENCE KYAW ASSISTANT PUBLIC WORKS DIRECTOR
BILL EKERN COMMUNITY DEVELOPMENT DIRECTOR <CITYMANAGER> ROBERT B. BELL CITY MANAGER ATTACHMENTS Long-Term Trash Load Reduction Plan