Embed Size (px)
Citation preview
H ow Different Ethnic Groups React to Legal Au t h o r i t y
• • •
Yuen J. HuoTom R. Ty l e r
2000
PUBLIC POLICY INSTITUTE OF CALIFORNIA
Library of Congress Cataloging-in-Publication DataHuo, Yuen J.
How different ethnic groups react to legal authority / Yuen J. Huo, Tom R. Tyler.
p. cm.Includes bibliographical references.ISBN: 1-58213-017-5
1. Discrimination in justice administration—California. 2. Minorities—Legal status, laws, etc.—California. 3. California—Race relations—Political aspects. I. Tyler, Tom R.II. Title.
KFC950.H86 2000305.8—dc21 00-037277
Research publications reflect the views of the authors and do notnecessarily reflect the views of the staff, officers, or Board ofDirectors of the Public Policy Institute of California.
Copyright © 2000 by Public Policy Institute of CaliforniaAll rights reservedSan Francisco, CA
Short sections of text, not to exceed three paragraphs, may be quotedwithout written permission provided that full attribution is given tothe source and the above copyright notice is included.
iii
Foreword
In the 1990s, California experienced a series of events that focused
national, and even international, attention on race and society. One of
the first events was the March 1991 beating of black motorist Rodney
King by Los Angeles police officers. The films of that beating were
shown around the world. Just one year later, the decision that
exonerated the officers of any wrongdoing ignited rioting in the streets of
Los Angeles. Blacks were pitted against Koreans, Latinos participated in
looting in alarming numbers, and the world watched on television as
stores, shopping centers, and homes burned in Los Angeles as if the city
were Beirut or Sarajevo under attack. Race took center stage again in
1994 when O. J. Simpson was handcuffed and taken to jail as the prime
suspect in a grisly double murder in West Los Angeles. The racial
dimensions of the trial riveted the country for months. In October
1995, a jury acquitted Simpson. The shock of the decision for some was
offset by the elation on the part of others who felt, for once, that a man
was not convicted for a murder just because he was black. It was clear
iv
from the intensity of conflicting public opinion that California faced
racial fissures in its social structure as deep as the San Andreas fault.
Even as the economy began to pick up in the mid-1990s,
Californians passed a series of initiatives that further highlighted the
racial divide. In 1994, the passage of Proposition 187 and its support by
Governor Wilson signaled an emphasis on punitive measures for illegal
immigrants that appeared to some to be more racially motivated than a
pragmatic approach to fiscal management. Next was the success of
Proposition 209, which prohibited preferential treatment of people on
the basis of age, sex, or race. Finally, Proposition 227 turned the tide on
bilingual education in a state where non-native English speakers may well
constitute almost half of the total population. Again, many Californians
saw the vote as a racially motivated strategy, this time to assimilate
immigrant families in a way that threatens their ethnic identities.
It was in this atmosphere that PPIC asked social psychologists Yuen
Huo and Tom Tyler to undertake a study of reactions to legal authority
in California by different ethnic groups. At the time Dr. Huo was a
Research Fellow at PPIC and Dr. Tyler was a Professor at the University
of California at Berkeley. Tyler had previously published work on the
perceptions of fairness in the judicial process, and Huo’s graduate work
led her to the tentative conclusion that different ethnic groups might well
have different perceptions of fairness. PPIC and the authors were
particularly interested in how members of different ethnic groups
experienced face-to-face interactions with legal authorities and how their
perceptions of those experiences shaped their evaluations of those
authorities. Tyler and Huo offered a paradigm for studying the issue,
and PPIC had an interest in launching a series of reports on the growing
v
ethnic and racial diversity of California and the implications of that
diversity for civil society.
The result is How Different Ethnic Groups React to Legal Authority, by
Yuen J. Huo and Tom R. Tyler. Telephone interviews were conducted
with over 1,600 residents of Los Angeles and Oakland about their most
recent encounters with a legal authority—from a parking ticket to
requesting assistance in emergencies. Three groups were identified:
African Americans, Latinos, and whites. The authors conclude that
although perceptions of unfair treatment are more prevalent among
African Americans and Latinos than among whites, all three racial groups
are more concerned about fairness in the process of rendering justice than
in the outcomes of that process. The authors also conclude that
minorities and whites have a common understanding of what constitutes
fair treatment. This shared understanding, they believe, provides the
basis for more positive relations between minority groups and the legal
authorities in their communities. In particular, that understanding
suggests that efforts on the part of legal authorities to act more fairly will
lead to more positive reactions and higher rates of compliance among
minority residents.
This is good news indeed for a state that is well on its way to having
majority minority demography—that is, no one ethnic group will
constitute a majority of the state’s total population. California is an
ongoing experiment in cultural and ethnic diversity without precedent in
U.S. history. The nation, and indeed the world, watches California with
a fascination that periodically shifts between envy and disbelief—and we
provide reasons for both reactions. At PPIC, we feel that it is part of our
responsibility to describe, monitor, and explain the emerging cultural
mix that is modern California—and to a great degree has always been
vi
California. We intend to do this in an empirical and dispassionate
fashion, and in so doing to provide everyone with a better understanding
of the changes that are happening all around us. As the first monograph
in a new PPIC series on race and ethnicity in California, this report
suggests that our differences may not be as great as thought. To quote
the authors, “rather than focus on the detrimental effects of strong ethnic
identities, public discussion should focus on how to engender stronger
identifications with American society.” Strong and encouraging words,
indeed.
David W. LyonPresident and CEOPublic Policy Institute of California
vii
Summary
Although California has always been home to many ethnic and
cultural groups, the state’s population is reaching new levels of diversity.
Demographic projections from the California Department of Finance
indicate that by the year 2020, over 60 percent of the state’s residents
will identify themselves as non-white. Given this shift in the state’s
ethnic landscape, policymakers and researchers must understand how this
diversity affects the effectiveness and day-to-day functioning of public
institutions. This project represents the first effort by the Public Policy
Institute of California to understand the social relations between
residents and officials who represent public institutions.
This study seeks to understand the influence of diversity on the
functioning of the legal system. We focused on the legal system because
of the tension between its representatives and the state’s minority
communities. We were specifically interested in how members of
different ethnic groups experienced face-to-face interactions with legal
authorities (the police, judges, and other court officials) and how their
viii
perceptions of those experiences shaped their evaluations of those
authorities. Do members of minority groups report worse outcomes
from legal authorities than whites do? Do minorities feel they are treated
unfairly? If so, how do those perceptions affect their overall evaluations
of their encounters with legal authorities? Do these perceptions affect
their willingness to cooperate with decisions made by legal authorities?
To answer these and other questions, we conducted telephone interviews
with 1,656 individuals about their most recent encounter with a legal
authority. The respondents were from one of three ethnic groups
(African American, Latino, and white). The survey was conducted
between November 1997 and July 1998. The sampling frame included
the cities of Los Angeles and Oakland. Below, we highlight some of the
study’s major findings.
Summary of Major Findings
• Compared to whites, African Americans and Latinos reportlower levels of satisfaction with their interactions with legalauthorities. They also report less willingness than whites tocomply with the directives of the authorities they deal with.This pattern of difference between minorities and whites wasespecially apparent among those who reported interactions withthe police compared to those who reported interactions withauthorities in the courts.
• Much of the difference between minorities and whites in theirreactions to legal authorities can be accounted for by differencesin their perceptions of how fairly or unfairly they were treated.When asked whether the legal authorities involved in theirencounters used fair procedures to make decisions, African
ix
Americans and Latinos reported experiencing less proceduralfairness than did whites.
• The perception of fair treatment was the most important factorin forming reactions to encounters with the police and courts.It was more important than concerns about the outcomes peoplereceived from legal authorities. This pattern held up acrossdifferent situations and ethnic groups.
• Although both fair treatment and positive outcomes increasedself-reported compliance among all ethnic groups, theirinfluences were diminished among Latinos compared to whites.
• The large majority of minorities reported interactions with alegal authority from a different ethnicity. Compared to thosewho interacted with a same ethnicity authority, those whointeracted with a different ethnicity authority paid moreattention to outcomes in forming compliance attitudes.
• Compared to minorities strongly identified with Americansociety, those who were less strongly identified paid moreattention to the outcome received and less attention to how theywere treated in forming compliance attitudes.
• Members of different ethnic groups share similar conceptionsabout what constitutes procedural fairness. An authority isperceived to have acted fairly if he or she is judged to beunbiased, concerned about the needs of the individual, andrespectful of the individual.
ConclusionThe bad news to emerge from our study is that African Americans
and Latinos report experiencing more negative treatment from legal
authorities than do whites. These perceptions of lower levels of fair
treatment have important implications for behavioral compliance rates
x
among minority groups. The good news is that minorities and whites
share similar concerns. They are concerned about receiving favorable
decisions from legal authorities, but they are more concerned about being
treated fairly. Minorities and whites also have a common understanding
of what constitutes fair treatment. These findings suggest an optimistic
future for more positive relations between minority groups and the police
and courts in their local communities. In particular, it suggests that
efforts to act more fairly will lead to more positive reactions and higher
rates of compliance.
Our findings also indicate that a strong sense of ethnic identity does
not diminish the ability of the police and courts to exercise their
authority, although a weak sense of American identity does. Legal
authorities can enforce laws and manage conflicts in their communities as
long as residents, regardless of their ethnic loyalties, have a strong sense
of attachment to American society. In fact, as a group, the respondents
in this study identified highly with their ethnic group and with American
society. Rather than focus on the detrimental effects of strong ethnic
identities, public discussion should focus on how to engender stronger
identifications with American society.
xi
Contents
Foreword..................................... iiiSummary..................................... viiFigures ...................................... xiiiTables....................................... xvAcknowledgments ............................... xvii
1. INTRODUCTION........................... 1
2. STUDY RATIONALE AND METHODOLOGY ....... 7Sampling Strategy ............................ 12Characteristics of the Sample ..................... 15
Age and Sex ............................... 15Education ................................ 16Income and Employment Status .................. 16Political Ideology ........................... 17Foreign Born .............................. 17
Self-Report Measures .......................... 17Limitations of the Study ........................ 18
3. LEVELS OF SATISFACTION AND COMPLIANCE .... 21
4. PERCEPTIONS OF OUTCOME AND TREATMENT... 27
xii
5. EXPLAINING GROUP DIFFERENCES INSATISFACTION AND COMPLIANCE ............. 33
6. TESTING THE PROCEDURAL JUSTICE EFFECT .... 39Ethnic Group Membership ...................... 41Intra-Group vs. Inter-Group Interactions ............. 43Effects of American Identity and Ethnic Identity ......... 45
7. THE COMPONENTS OF FAIR TREATMENT ....... 55
8. CONCLUSIONS AND IMPLICATIONS ............ 59
AppendixA. Sample Design .............................. 65B. Verbatim Introductions to Interviews ................ 69C. Summary of Demographic Characteristics of the Sample .... 71D. Text of Survey Questions and Supplementary Statistics..... 73
Bibliography .................................. 79
About the Authors ............................... 83
xiii
Figures
3.1. Satisfaction with Experience Across Ethnic Groups..... 22
3.2. Voluntary Compliance Across Ethnic Groups ........ 22
3.3. Satisfaction Across Types of Encounters and EthnicGroup Membership ........................ 24
3.4. Voluntary Compliance Across Types of Encounters andEthnic Group Membership.................... 25
4.1. Percentage of Respondents Receiving Positive Outcomesfrom Legal Authorities ....................... 28
4.2. Perceptions of Procedural Fairness Across EthnicGroups................................. 30
6.1. Level of American Identity Across Ethnic Groups...... 50
6.2. Level of Ethnic Identity Across Ethnic Groups ....... 50
xv
Tables
2.1. Number of Respondents, by Ethnicity and City....... 12
4.1. Percentage of Individuals Reporting an Encounter, byEthnic Group ............................ 29
5.1. The Effect of Ethnicity, Outcome Favorability, and FairTreatment on Satisfaction..................... 35
5.2. The Effect of Ethnicity, Outcome Favorability, and FairTreatment on Voluntary Compliance ............. 36
6.1. The Effect of Outcome Favorability and Fair Treatmenton Satisfaction, by Ethnic Group ................ 42
6.2. The Effect of Outcome Favorability and Fair Treatmenton Voluntary Compliance, by Ethnic Group......... 43
6.3. The Effect of Outcome Favorability and Fair Treatmenton Satisfaction, by Ethnicity Match, African Americansand Latinos Only .......................... 45
6.4. The Effect of Outcome Favorability and Fair Treatmenton Voluntary Compliance, by Ethnicity Match, AfricanAmericans and Latinos Only ................... 46
6.5. The Effect of Outcome Favorability and Fair Treatmenton Voluntary Compliance for Same Ethnicity and
xvi
Different Ethnicity Interactions, African Americans andLatinos Only ............................. 47
6.6. Typology of Acculturation Orientations............ 48
6.7. The Effect of American Identity on Satisfaction andVoluntary Compliance....................... 51
6.8. The Effect of High American Identity Compared to LowAmerican Identity on Voluntary Compliance ........ 52
6.9. The Effect of Ethnic Identity on Satisfaction andVoluntary Compliance....................... 53
6.10. The Basis of Voluntary Acceptance, by AcculturationOrientation.............................. 54
7.1. The Effect of Ethnicity on Antecedents of ProceduralFairness ................................ 57
A.1. Percentage of Eligible Respondents, by City, SamplingFrame Within City, and Ethnic Group ............ 66
C.1. Summary of Demographic Characteristics of theSample................................. 72
xvii
Acknowledgments
Our motive throughout this study has been to illuminate the
complex social relations between members of diverse communities and
the officials of the public institutions that govern them. The study posed
many challenges, some of them unexpected. We are grateful to those
who in their unique ways helped us meet those challenges. We are
indebted to the Public Policy Institute of California for providing a
substantial proportion of the funding for the survey. Special thanks are
due to David W. Lyon, President and CEO of PPIC, for his support
through the project’s extended gestation. Our survey was also funded
with a grant from the Law and Social Science Program of the National
Science Foundation.
The survey was conducted at the University of California, Berkeley’s,
Survey Research Center under the supervision of Field Director, Karen
Garrett. Karen shepherded the project through its many stages from the
development of the instrument to the day-to-day fieldwork. Her
professionalism and commitment to the project never wavered even
xviii
under the most extraordinary circumstances. We owe Karen a debt of
gratitude. We also want to extend our thanks to the many dedicated
staff members at SRC whose efforts and creativity contributed to the
success of the survey. In particular, we want to acknowledge Yuteh
Cheng, Jeff Royal, and Madonna Camel, all of whom played key roles in
the implementation of the survey.
Several colleagues generously offered their time and expertise at
different stages of the project. Deborah Hensler, Robert Kagan, Robert
MacCoun, David Sears, and Paul Sniderman provided helpful
suggestions in the conceptualization and development stage of the study.
We are grateful to Mark Baldassare, Robert MacCoun, Paul Sniderman,
and Maureen Waller for their careful reading of an earlier draft of this
report. The ideas explored in this study were developed in discussions
with Allan Lind, Heather Smith, and Robert Boeckmann. John
Ellwood, Jim Wiley, Sandy Berry, and Andrew Isserman intervened at a
critical juncture in the project and were instrumental in moving the
study toward its next phase. Deborah Reed provided useful suggestions
on the analysis of the dataset. The final report benefited substantially
from Peter Richardson’s editorial guidance. Last, we extend our thanks
to Michael Teitz for his role in the conception of the project and for
guiding it through to completion. Although this report reflects the
contribution of many people, the authors are solely responsible for its
content.
1
1. Introduction
Although California has always been home to diverse peoples, the
state’s current population is moving toward an unprecedented level of
ethnic and cultural diversity. A large influx of immigrants from Latin
America and Asia coupled with higher birth rates among immigrant
groups are changing California’s rapidly growing population
dramatically. As we move into the new century, the social trends in place
today will lead to a California that is best described as a mosaic of
different peoples in which no single ethnic group will constitute a
numerical majority. Projections from the California Department of
Finance (1993) suggest that as early as the year 2020, there will be no
majority ethnic group in California. Instead, there will be large numbers
of Latinos (41 percent) and non-Hispanic whites (41 percent)
complemented by smaller numbers of African Americans (6 percent) and
Asians/others (12 percent). Given this shift in the ethnic landscape of
the state, it has become crucial for social scientists and policymakers to
understand how the population’s diversity influences the day-to-day
2
functioning of the public institutions that serve the people. Evaluating
traditional public institutions within the new social context is particularly
important because these institutions were developed to serve a
population that is very different from the one that exists today.
Recent debates have focused on the extent to which public
institutions should adapt to California’s changing population. One of
these debates concerns bilingual education in the public school system.
Although a voters’ initiative has outlawed bilingual classrooms in the
public schools, there is still continued disagreement about how to
accommodate the needs of the growing number of students with limited
English proficiency. This question illustrates the importance and
complexity of examining the relationship between California’s changing
populace and its public institutions.
This report focuses on an equally important and perhaps more
controversial policy area—how different ethnic groups view the legal
institutions in their communities. From the Watts riots of the 1960s to
the Los Angeles riots following the acquittal of white police officers
charged with beating African American motorist Rodney King, the
relationships between law enforcement agencies and minority
communities have been characterized by high levels of tension. Although
race is a divisive factor in many policy domains in California, nowhere is
it stronger than in legal institutions. The fatal police shooting of Tyisha
Miller, an African American woman, in Riverside County, also reminds
us that race influences the public’s perceptions of the police and courts.
The controversial practice of racial profiling also fuels the flame of
debates about unequal treatment of minorities and whites by legal
authorities.
3
Diversity brings with it two sources of potential problems for legal
institutions. One has to do with flexibility: in particular, if and how
much institutions should adapt to meet the needs and concerns of people
who may differ widely in terms of their values, beliefs, and expectations
of authorities. The U.S. legal system assumes that its residents share a set
of values and understandings about standards of justice and fairness. As
California’s population becomes more diverse, it is important to test that
assumption. The second source of potential problems arises from the
perception that minorities receive worse treatment at the hands of legal
authorities than do whites. Law enforcement agencies and the courts will
have to find ways to address this perception if they are to continue to
function effectively.
In a state consisting of large numbers of immigrants and their
children, cultural differences are likely to create communicative barriers
between residents and a range of public institutions. Differing values,
beliefs, and expectations are likely to contribute to conflict in already
tense dealings with legal authorities. Anthropologists have provided
ample evidence that different cultures have different ways of handling
disputes (Nader and Todd, 1978). Hence, immigrants are likely to have
different beliefs about how and when to interact with legal authorities.
For example, refugees from nations governed by corrupted officials may
be more suspicious about legal authorities and less likely to approach
them for help. Also, some cultures emphasize social harmony rather than
the adversarial search for justice that is central to the U.S. legal system.
This study explores the ways in which members of different ethnic
groups express their needs and concerns in their dealings with legal
authorities. The results allow us to gauge the extent to which cultural
differences pose problems for a legal system founded on Anglo-American
4
traditions and values. If diversity is indeed a source of problems for legal
institutions, then an important policy consideration is whether such
institutions should change to better represent the values and beliefs of the
people they serve.
The concern about unequal outcomes and treatment has plagued
legal institutions for some time. The concern came into the forefront of
public discussions earlier this decade with the infamous incident between
Rodney King, an African American, and four white officers from the Los
Angeles Police Department (LAPD). Since that incident, public opinion
polls have indicated that minorities in general are less trusting of the
police and the criminal justice system. A national poll conducted in
October 1995 by the Gallup Organization found that African Americans
were significantly less likely than whites to believe that the police are
honest and ethical (GO 105362). Similarly, a Los Angeles Times poll of
local residents, conducted on July 17, 1991, found that African
Americans and Latinos are less likely than whites to give favorable
performance ratings to the LAPD. The ongoing investigation into police
misconduct in the Rampart division of the LAPD only adds fuel to
existing distrust of the police in minority communities. Such evidence
points to clear ethnic differences in perceptions of legal authorities.
What is less clear is the degree to which these perceptions are shaped by
personal experiences with the legal system or by other factors, such as
media portrayals of tensions between minority communities and legal
authorities. Pinpointing the source of this divergence in opinions about
the legal system has important implications for the conduct of affairs in
the police force and the courts.
5
This study was designed to understand the extent to which three
aspects of interactions with legal authorities differ across ethnic groups.
Those aspects are
• Reactions to the experience, including the levels of satisfactionpeople report as well as their willingness to comply withauthority directives,
• Perceptions of the experience, including reports about outcomesand the ways authorities handled the situation, and
• Expectations of the interaction, including the standards peoplebring to their dealings with legal authorities.
If ethnic groups differ in their views of legal authorities, are those
differences due to different outcomes, different perceptions of their
treatment, or different expectations of fair treatment generally? In
addressing these and other questions, we relied on data collected from
1,656 African American, Latino, and white residents of Los Angeles and
Oakland who responded to a telephone survey conducted between
November 1997 and July 1998.
In summary, this study tries to assess the everyday perceptions of and
experiences with the police and the courts in two ethnically diverse
California cities. It identifies the factors that underlie the public’s
reactions to their experiences with legal authorities as well as some of the
problems that are likely to arise in governing a diverse society. As a
report to the California Supreme Court noted (Dockson, 1993), the
effectiveness of the legal system depends on its ability to provide equal
justice while meeting the needs of a diverse population. We hope that
our findings inform discussions among scholars, policymakers, and
members of the legal community about how to deal with the challenges
associated with governing an ethnically diverse society.
7
2. Study Rationale andMethodology
This study draws from psychological research on authority relations,
which explores the factors that underlie reactions to authorities and their
directives. This research covers a range of social contexts, including
political, business, educational, and legal institutions. In general, it
demonstrates that when responding to institutional authorities and their
decisions, people focus on the actions and motives of the decisionmaker
(see Tyler and Lind, 1992, and Tyler, Boeckmann, Smith, and Huo,
1997, for reviews of the empirical literature). One of the strongest
correlates of how people feel about their interactions with particular
authorities is how fairly they have been treated. Indeed, perceptions of
fair treatment are more important than receiving favorable outcomes,
such as winning court cases. The research indicates that people do not
view their interactions with authorities in purely exchange terms; that is,
they are not necessarily satisfied and willing to support decisions only
when they benefit from those decisions. Rather, people are very
8
relational; they are most likely to form positive impressions of authorities
and their decisions when they feel that the authority has dealt with them
in a fair and respectful manner. This pattern of response has been
dubbed the procedural justice effect.
The finding that people are relationally oriented has important
implications for the exercise of authority. When people feel that they
have been treated fairly and that their relational concerns are satisfied,
they are more likely to comply with the authority’s wishes, even when
following the directives is not in their immediate interest. In contrast,
when people feel unfairly treated and that their relational needs have not
been met, they are less likely to voluntarily comply with the authority’s
decisions. In this latter situation, authorities can still elicit compliance
but they would have to rely on some form of intimidation or coercion.
Hence, authorities benefit from a relational orientation because it allows
them to make decisions and take action in the interest of the community
without losing the support of those individuals who disagree with their
decisions.
Although existing research on authority relations supports the
procedural justice effect, most of that research is based on samples of
white respondents. The research also suggests that authority relations are
more complex in ethnically diverse environments. As a result, it is
unclear that the procedural justice effect retains its strength across ethnic
groups. Members of these groups may judge the importance of
procedural justice differently. They may even disagree about which
aspects of an authority’s actions are relevant to those judgments.
The design of this study generally follows others we have conducted
on authority relations in diverse communities. The earlier findings
provide some interesting but preliminary insights into the exercise of
9
authority amidst diversity. These studies found that people tend to focus
less on relational concerns and more on instrumental concerns when they
perceive the authority as a member of an outgroup. For example, in a
study of teachers in an English-language program in Japan (Tyler, Lind,
Ohbuchi, Sugawara, and Huo, 1998), the authors found that the typical
procedural justice effect occurred but only in the context of teachers
seeking help from a supervisor who shared their nationality. When
teachers and their supervisors did not share a nationality, the teachers
were more focused on whether they benefited from the interaction than
whether they were treated fairly by their supervisors.
In a second study, we interviewed U.S. workers from various ethnic
backgrounds about their recent interactions with their work supervisors.
Interestingly, the findings of this study suggest that the basis of reactions
to authorities depends in large part on the group identification patterns
of the respondents. What mattered in the end was not whether the
supervisors and the respondents were from different ethnic backgrounds
but the extent to which the respondents identified with the organization
(Huo, Smith, Tyler, and Lind, 1996). By asking respondents to rate
their levels of identification with the organization and with their ethnic
group, we distinguished three patterns of social identification:
assimilators (high organizational identification, low ethnic
identification), biculturalists (high organizational and ethnic
identification), and separatists (low organizational identification, high
ethnic identification). In reports of interactions with work supervisors
who were from a different ethnic group, both the assimilators and
biculturalists focused on how fairly they were treated in forming their
reactions to authorities. The pattern of findings for the separatists shows
a much stronger emphasis on outcomes. The results of this analysis show
10
that the real question with respect to the person reacting to an authority
is one of self-identificaton, rather than one of objective classification. It
is the perception of difference, not any objective difference in ethnic
group membership, which shapes reactions to authorities. It is
interesting to note that strong ethnic identification does not necessarily
pose a threat to effective governance. Ethnic loyalty threatens the
authority’s ability to govern only when it is accompanied by an absence
of loyalty to the superordinate group (i.e., society, community, or
organization).
We also have data from several preliminary studies that address the
relationship between cultural orientation and reactions to authority.
One study examined an ethnically diverse college student sample in the
United States within the context of hypothetical interpersonal disputes
(Lind, Huo, and Tyler, 1994). A second dataset was collected from a
sample of college students in Japan using a similar format (Sugawara and
Huo, 1994). Findings from both studies suggest that there was very little
or no variation across these ethnic and national groups in terms of the
importance they placed on fair treatment. To be treated fairly was the
most important factor in shaping evaluations of authorities. The
procedural fairness phenomenon appears to hold up well across cultures
and across subcultures within one country.
Although culture does not seem to influence the importance of
procedural fairness relative to outcomes, we do find some evidence that
people from different cultural backgrounds define procedural fairness in
distinct ways. For example, a study of college students’ reactions to
conflicts with authorities found that although the Hong Kong Chinese
defined a fair procedure primarily in terms of neutrality or the absence of
11
bias, Americans defined it primarily in terms of dignity and respect
(Lind, Tyler, and Huo, 1997).
Following up on this earlier work, we designed the current study to
address three issues related to ethnicity and views of legal authority.
These are
• Whether perceptions of fair treatment differ across ethnicgroups,
• How perceptions of fair treatment affect both the relativesatisfaction residents report in their encounters with legalauthorities and their willingness to defer to the decisions andrequests made by these authorities, and
• Whether the meaning of fair treatment differs across ethnicgroups.
These issues are addressed systematically in the subsequent chapters.
Although this study builds on previous research, it differs in two
significant ways. First, data in the earlier studies were collected in
nonlegal settings. Second, they were collected from convenience
samples, which are not representative of the general population in
California or of subgroups within California. This study, however,
draws a random sample of residents from two California communities
where minorities are well represented. The findings therefore allow us to
draw more confident conclusions about the relationship between
ethnicity and legal authority.
With these questions in mind, we designed a study that took
advantage of the natural diversity that exists in two California cities: Los
Angeles and Oakland. A random digit telephone sampling procedure
was used to contact potential respondents between November 1997 and
July 1998. The sample was limited to adults who identified themselves
12
as African American, Latino, or white and who reported that they had a
personal encounter with a legal authority in the year or so before the
interview. Of those who were eligible for interviews, 1,656 respondents
completed the interview (78.9 percent response rate).1 Interviews were
conducted in English or Spanish depending on the preference of the
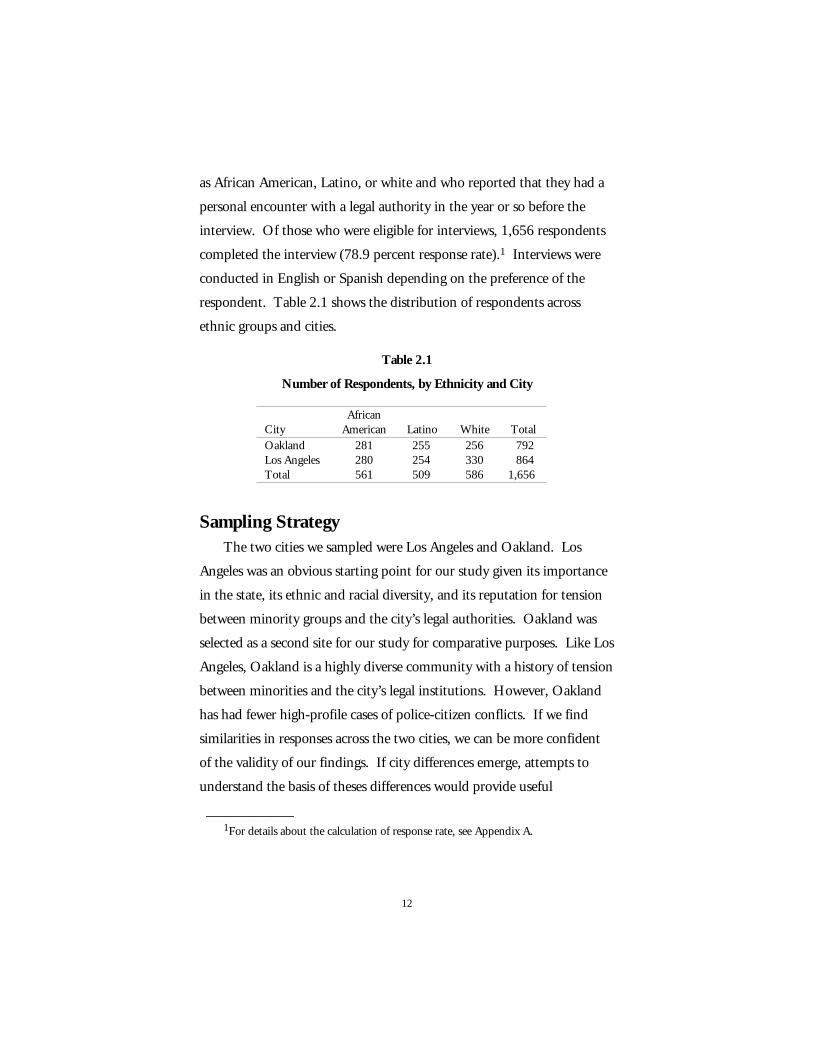
respondent. Table 2.1 shows the distribution of respondents across
ethnic groups and cities.
Table 2.1
Number of Respondents, by Ethnicity and City
CityAfrican
American Latino White TotalOakland 281 255 256 792Los Angeles 280 254 330 864Total 561 509 586 1,656
Sampling StrategyThe two cities we sampled were Los Angeles and Oakland. Los
Angeles was an obvious starting point for our study given its importance
in the state, its ethnic and racial diversity, and its reputation for tension
between minority groups and the city’s legal authorities. Oakland was
selected as a second site for our study for comparative purposes. Like Los
Angeles, Oakland is a highly diverse community with a history of tension
between minorities and the city’s legal institutions. However, Oakland
has had fewer high-profile cases of police-citizen conflicts. If we find
similarities in responses across the two cities, we can be more confident
of the validity of our findings. If city differences emerge, attempts to
understand the basis of theses differences would provide useful
____________ 1For details about the calculation of response rate, see Appendix A.
13
information about the factors that shape public perceptions of the police
and courts.
Our study is a first attempt at understanding the effects of diversity
on the public’s perceptions of legal authorities in California cities. There
have been extensive efforts to understand black-white differences in
perceptions of legal institutions (Baldassare, 1994; Sears and
McConahay, 1973). A major contribution of our study is to expand this
discussion to include Latinos, the fastest growing population in
California. Asian Americans were not included in the study because of
methodological and cost-related reasons. Telephone surveys typically
rely on geographic stratification to target members of minority
populations. This method is efficient because it reduces the total
number of calls needed to gather a designated sample and hence reduces
the overall cost of the survey. Because of patterns of residential
segregation, geographic stratification is an effective way to sample African
Americans and Latinos. This sampling method does not work as well for
sampling Asian Americans because they tend not to concentrate as
heavily in particular areas (see Mohadjer, 1988, for a discussion of this
issue). Obtaining a sample of Asian Americans equal to the sample for
African Americans and Latinos would therefore have increased the cost of
the survey prohibitively. Future efforts should focus on developing
research methods that would allow for inclusion of Asian Americans in
studies of diversity and legal institutions. As the aftermath of the Rodney
King riots illustrated, race relations in California today involve not only
African Americans and whites but Asian Americans as well.
To reduce the total number of calls made to generate the sample, a
list-assisted random digit dialing method was used to eliminate telephone
banks consisting solely of businesses. Individuals with family members
14
who are employed as a police officer, fire fighter, judge, court clerk, or
court-appointed mediator in the city of residence were not eligible for
participation in the survey.
Respondents were asked to recall and report about a specific
interaction they had with a legal authority (police officer, judge, or other
court official) from their local community within the last 12 months.
The types of incidents reported by our respondents vary widely. They
include calling the police to report suspicious activities or to ask for
assistance in emergencies. They also include being stopped by the police
for suspected traffic violations or for routine questioning. A smaller
group of respondents reported their involvement in court proceedings
involving either criminal or civil matters. Our goal in this study was to
gather a sample that approximates the universe of individuals in a
particular community who have had recent contact with the legal system.
Because the types of incidents reported ranged from the mundane to the
serious, we feel assured that the data reported here are reflective of all the
different experiences people have.
We intentionally selected a sampling strategy that ensured a final
sample of approximately equal numbers of African Americans, Latinos,
and whites. We developed this strategy in an effort to have subgroup
sample sizes that were large enough to allow us to evaluate ethnic group
similarities and differences confidently. Although this approach helps us
to understand how the experiences of one ethnic group compare with the
experiences of another group, it does not produce a sample that is
representative of the general population from which the respondents
were drawn. Unlike public opinion polls that are conducted by
professional agencies, our data do not provide population estimates.
Instead, our study was designed to collect a dataset that allows us to fully
15
explore the nature of experiences with legal authorities among African
Americans, Latinos, and whites.
Although we relied on a telephone survey of people’s self-reports of
their personal experiences, there are other approaches for understanding
the needs and concerns of different ethnic groups. An alternative
method, for example, is to use administrative records such as police
reports, court transcripts, and formal complaints against police
departments or judges. Although such records may provide more
reliable, objective information, we feel that our approach has some
advantages. First, in randomly selecting people to be interviewed, we
have information about contacts with legal authorities that may not
appear in official records. Second, our approach separates the survey
from government agencies and legal institutions themselves. In reducing
the fear associated with evaluating these institutions directly, the
responses we recorded are more likely to reflect the true attitudes and
feelings of those we surveyed. For more details about the survey
methodology, see Appendix A.
Characteristics of the SampleOur sample contains people with highly diverse backgrounds.
Below, we describe the sample in terms of some basic demographic
variables. See Appendix C for the full summary of the sample’s
demographic characteristics.
Age and Sex
Approximately half the African American and white respondents
were under the age of 40. As a group, the Latino respondents tended to
be slightly younger with nearly three-quarters reporting that they were
16
under the age of 40. Among the white respondents, there were
approximately equal numbers of males and females (49.1 percent and
50.9 percent, respectively). The Latino subsample included more men
than women (57 percent and 43 percent, respectively), and the African
American subsample included more women than men (59.5 percent and
40.5 percent, respectively).
Education
White respondents tended to have more years of education than
African American and Latino respondents. Whereas most whites
reported that they were either college graduates or had some post-college
education, less than a fifth of African Americans and just over a tenth of
Latinos fell into this category. Over 18 percent of Latino respondents
reported that they had an eighth-grade education or less compared to 1.6
percent of African American respondents and less than half a percent of
white respondents.
Income and Employment Status
As a group, white respondents reported higher annual household
income than minority respondents. Nearly half of Latinos (47.3 percent)
reported household income of $25,000 or less. Slightly less than half of
African Americans (40.4 percent) reported household income of $25,000
or less. In contrast, only a fifth of whites reported household income of
$25,000 or less. Approximately three-quarters of respondents reported
that they were employed. This number varied slightly across ethnic
groups with Latinos reporting lower employment rates than whites and
with African Americans reporting the lowest employment rate of all three
groups.
17
Political Ideology
African American and white respondents tended to be more liberal
than Latino respondents. Whereas slightly over 50 percent of African
Americans and of whites reported that they leaned toward being liberal
rather than conservative or moderate, only about a third of Latinos
reported that they leaned toward being liberal.
Foreign Born
Almost all African American and white respondents were born in the
United States (95 percent and 86.3 percent, respectively). In contrast,
over half (62.7 percent) of Latino respondents were born outside of the
United States. Although the percentage of foreign-born Latinos appears
to be high, it is comparable to what was found in a recent telephone
survey of Los Angeles residents.2
Self-Report MeasuresWe interviewed respondents at one point in time about their most
recent encounter with a police officer, judge, or other type of legal
authority. Because we measure self-reported attitudes and not observed
behavior, errors of measurement need to be considered in the analysis.
To develop reliable indicators, we collapsed multiple measures of each
variable. The one exception to this approach is our measure of the
outcome of the encounter (favorable or unfavorable). In this case, we
used a single measure to assess self-reports of whether the encounter led
____________ 2D. O. Sears, personal communication, 1998. The 1994 Los Angeles County Social
Survey is based on a probability sample of residents of the greater Los Angeles area. Datafrom that study indicated that 75 percent of the Latino respondents reported that theywere foreign-born.
18
to a positive or negative outcome for the respondent. This measure
represents an effort to assess objective outcomes (for example, whether a
police officer was successful at resolving a reported problem). Below, we
list the variables we used in our analysis.
• Satisfaction with the overall experience with the legal authority,
• Voluntary compliance with the directives of the legal authority,
• Nature of outcome,
• Perceptions of the fairness of treatment, and
• Perceptions of specific aspects of treatment.
Limitations of the StudyOur study is a first effort to look at the effect of diversity on the
public’s perceptions of legal authorities. Hence, we relied on a cross-
sectional survey approach to evaluate the relationship between
perceptions of experiences and reactions to those experiences for each of
the three ethnic groups included in our study. From a policy perspective,
a limiting factor of our study is that it is based solely on individuals’ self-
reports of their experiences. Stronger policy recommendations can be
made in future studies using methodologies that allow tracking of the
actual behavior of both individuals and the legal authorities they
encounter.
A more substantive limitation of our study concerns our sampling
strategy. The most important limitation is that a major ethnic group in
California is missing from our sample: Asian Americans. We did not
include Asian Americans in our sample because of the prohibitive costs
and time commitment required to properly sample this linguistically
heterogeneous and geographically dispersed ethnic group. Given our
19
findings, however, the exclusion of Asian Americans from our sample is
less serious than might at first be feared. Although our findings indicate
statistically significant ethnic group differences, these differences are
remarkably small compared to the similarities documented across ethnic
groups. Given the relative absence of differences observed among
African Americans, Latinos, and whites, we have little reason to suspect
that results for Asian Americans would have been strikingly different.
Moreover, other studies based on non-probability samples indicate that
the general procedural justice effect holds up among Asians and Asian
Americans (Lind, Huo, and Tyler, 1994; Lind, Tyler, and Huo, 1997;
Sugawara and Huo, 1994).
A related concern is that our respondents’ views do not accurately
represent the views of the ethnic groups to which they belong. The
absence of a wide ethnic divide appears to be at odds with public
conceptions of tumultuous race relations in the legal context. One could
argue that the sample’s selection biases resulted in underrepresentation of
the level of frustration and anger in minority communities. Perhaps
those who are most alienated from the legal system are less likely to
respond to our survey. Moreover, those who have the most negative
encounters with legal authorities may be incarcerated and unavailable to
our interviewers.
We propose an alternative interpretation for the absence of an ethnic
divide in our sample. It is likely that popular conceptions of minorities’
relations with legal authorities are shaped in large part by a few salient
and highly publicized events and that the reality of day-to-day encounters
between citizens and legal authorities are far less volatile and sensational.
Our goal was to represent the views of African Americans, Latinos, and
whites in general. We intended to assess these individuals’ day-to-day
20
interactions with legal authorities rather than those of specific subgroups
such as incarcerated individuals and political activists. Although our
sample may not be completely representative of the targeted groups, it is
a much closer approximation than convenience samples or even
telephone polls of individuals contacted through random selection
processes after a highly publicized event such as the Rodney King riots.
Furthermore, modest differences in reports of experiences with legal
authorities are consistent with the results of a recent report on racial,
religious, and ethnic fairness conducted by the Ninth Circuit Court Task
Force (Walters, 1997). The data for that report provided relatively little
evidence of group-based bias in the everyday conduct of the Ninth
District Court.
21
3. Levels of Satisfaction andCompliance
One basic question addressed in this study is whether levels of
satisfaction with legal authorities and a willingness to comply with their
directives differ across ethnic groups. The literature suggests that African
Americans are more likely to report less positive opinions of authorities
and their decisions than are whites. A related question is how the
attitudes of Latinos compare to the attitudes of African Americans and
whites. Although Latinos are one of the fastest growing ethnic groups in
California, we have little information about their experiences with and
attitudes toward legal authorities.
Two variables are of interest: overall satisfaction with the encounter
with a legal authority and voluntary compliance with the authority’s
directive. Satisfaction is based on an index of responses to four questions
(e.g., “How satisfied were you with the experience?”). Likewise,
voluntary compliance is based on an index of responses to four questions
(e.g., “How willing were you to accept the decision the [police/court]

22
made?”). The exact wording of items included in each scale are reported
in Appendix D. Each scale could range from a low of 1 to a high of 4
with a midpoint of 2.5. Higher numbers represent greater satisfaction
and willingness to go along with the legal authority’s directives.
Figures 3.1 and 3.2 present the group means on levels of satisfaction
and compliance. In general, the group means were just above the scale
midpoint of 2.5, indicating that our respondents, on average, were
generally satisfied with their experience and were willing to comply with
authority directives. A comparison of means across different groups
reveals that Latinos did not differ from African Americans in their self-
report of either satisfaction or compliance. For this reason, we collapsed
African American
Latino
White
2.56
2.92
1(Lowest)
4(Highest)
Satisfaction with Experience
2 3
2.68
Figure 3.1—Satisfaction with Experience Across Ethnic Groups
African American
Latino
White
3.28
3.51
1(Lowest)
4(Highest)
Voluntary Compliance
2 3
3.3
Figure 3.2—Voluntary Compliance Across Ethnic Groups
23
the group means and compared them to the group means for whites.
That comparison indicates higher levels of satisfaction and compliance
among whites than among minorities.
Reports from both public opinion polls and media outlets suggest
that minorities are more likely than whites to hold negative attitudes
about the legal system and its representatives. Although this pattern is
clearly replicated in this dataset, the factors that shape it are less clear.
One explanation is that these negative opinions are based on personal
experiences. Another is that these opinions reflect other factors such as
political ideology or media representations of minority-police relations.
Unlike other datasets, this one is based on interviews with
individuals about their actual experiences with the police and courts.
Although other contributing factors cannot be ruled out, we can be more
confident that the attitudes expressed by the respondents are based on
the nature of their encounters with legal authorities. Interestingly, the
data from the current study are consistent with the conclusions drawn
from past analysis of group differences in attitudes toward legal
authorities. The data suggest that African Americans and Latinos hold
less positive attitudes about their encounters with legal authorities than
whites. However, African Americans and Latinos do not appear to differ
from each other in their reactions to encounters with legal authorities.
This finding suggests that, notwithstanding their very different histories
in America, African Americans and Latinos share similar experiences
when they deal with the police and the courts.
The findings presented in Figures 3.1 and 3.2 show that minorities
and whites clearly differ in their levels of satisfaction with the reported
experience and their willingness to comply with authority directives.
However, this pattern may depend on the type of interaction the
24
respondent was interviewed about. For example, it is important to
examine whether these different levels of satisfaction depend on whether
the respondents initiated their contacts with the police. It may be that
minorities have more negative experiences than whites when stopped by
the police but similar ones when they call the police for help or to report
a crime.
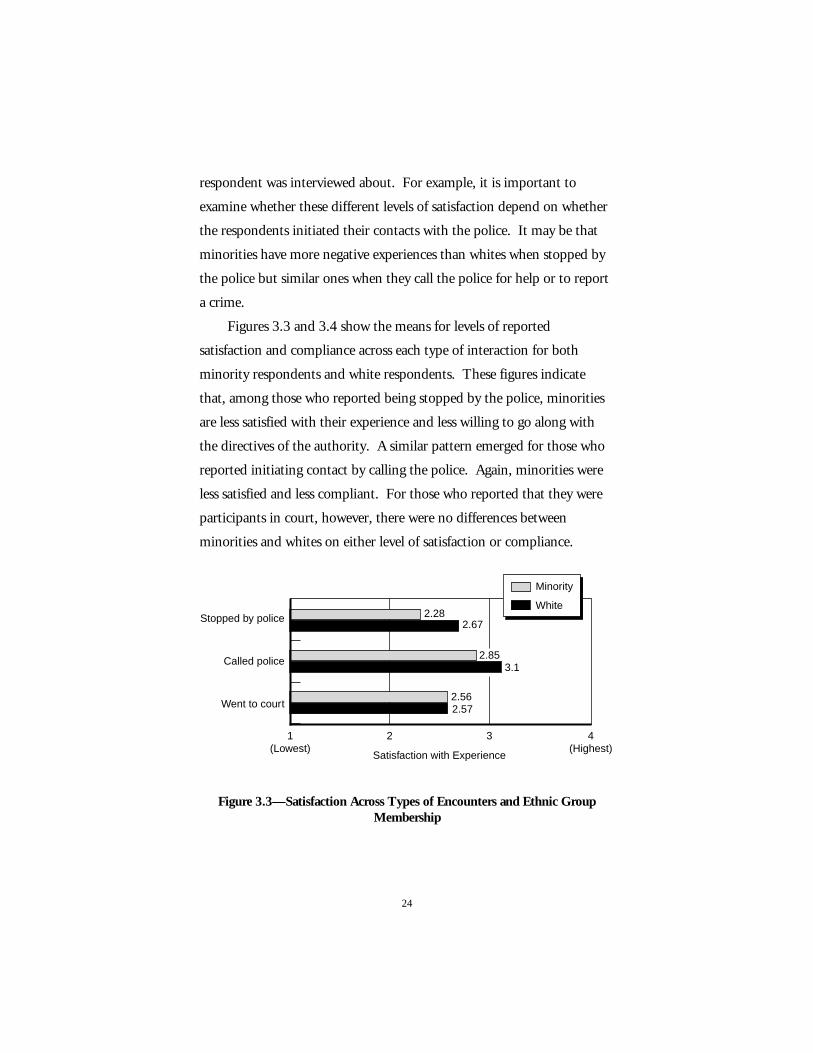
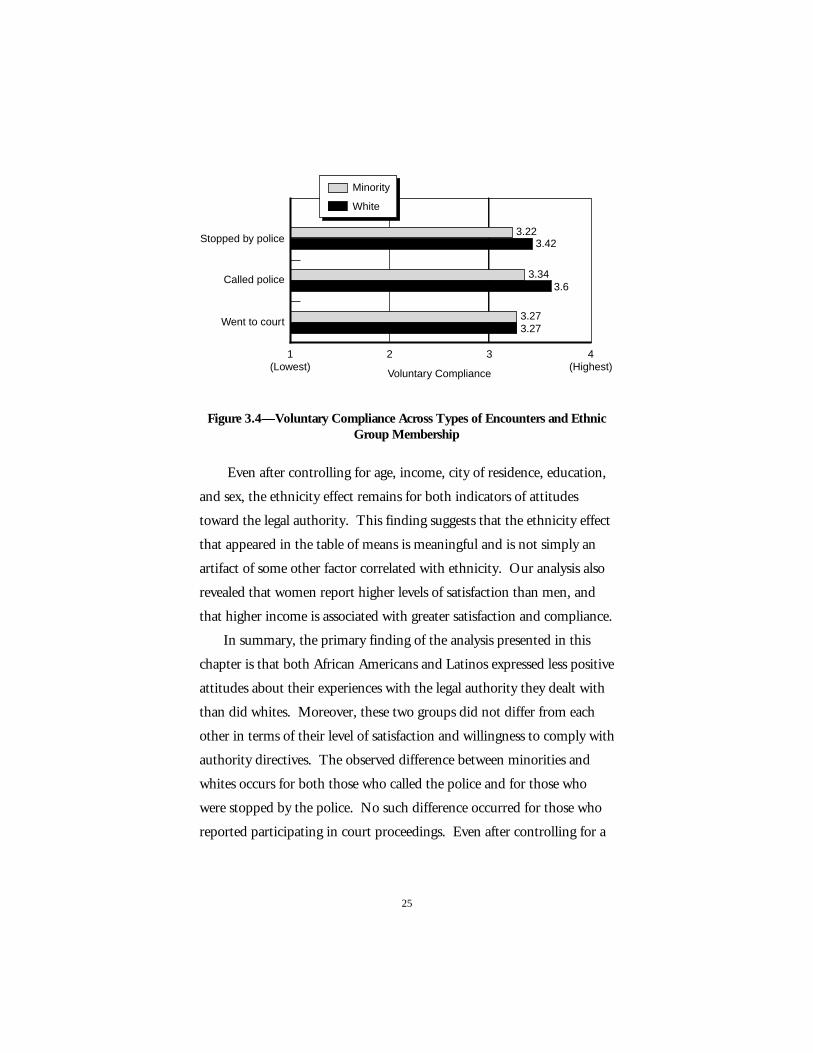
Figures 3.3 and 3.4 show the means for levels of reported
satisfaction and compliance across each type of interaction for both
minority respondents and white respondents. These figures indicate
that, among those who reported being stopped by the police, minorities
are less satisfied with their experience and less willing to go along with
the directives of the authority. A similar pattern emerged for those who
reported initiating contact by calling the police. Again, minorities were
less satisfied and less compliant. For those who reported that they were
participants in court, however, there were no differences between
minorities and whites on either level of satisfaction or compliance.
Stopped by police
Called police
Went to court
2.67
2.572.56
1(Lowest)
4(Highest)
Satisfaction with Experience
2 3
3.1
Minority
White
2.85
2.28
Figure 3.3—Satisfaction Across Types of Encounters and Ethnic GroupMembership
25
Stopped by police
Called police
Went to court
3.223.42
3.34
3.273.27
1(Lowest)
4(Highest)
Voluntary Compliance
2 3
3.6
Minority
White
Figure 3.4—Voluntary Compliance Across Types of Encounters and EthnicGroup Membership
Even after controlling for age, income, city of residence, education,
and sex, the ethnicity effect remains for both indicators of attitudes
toward the legal authority. This finding suggests that the ethnicity effect
that appeared in the table of means is meaningful and is not simply an
artifact of some other factor correlated with ethnicity. Our analysis also
revealed that women report higher levels of satisfaction than men, and
that higher income is associated with greater satisfaction and compliance.
In summary, the primary finding of the analysis presented in this
chapter is that both African Americans and Latinos expressed less positive
attitudes about their experiences with the legal authority they dealt with
than did whites. Moreover, these two groups did not differ from each
other in terms of their level of satisfaction and willingness to comply with
authority directives. The observed difference between minorities and
whites occurs for both those who called the police and for those who
were stopped by the police. No such difference occurred for those who
reported participating in court proceedings. Even after controlling for a

26
range of demographic variables correlated with ethnic group
membership, the minority-white difference in satisfaction and
compliance held.
27
4. Perceptions of Outcome andTreatment
This chapter deals with perceptions of, rather than reactions to,
experiences with legal authorities. In particular, it focuses on whether
authorities were thought to have acted fairly in specific encounters. It
also focuses on whether the outcomes of these encounters were perceived
to be positive or negative. For example, those who reported calling the
police for help were asked whether the police actually resolved the
problem they called about. Likewise, those who reported being stopped
by the police were asked whether they were cited for a violation. Finally,
individuals who reported going to court were asked whether they won or
lost their cases. Responses to these questions were used to form a
measure of self-reported outcome. Procedural fairness was assessed using
two questions that were combined to form a scaled index (e.g., “How fair
were the procedures he/she used to make decisions about how to handle
the situation?”). The scale ranges from 1 (very unfair) to 4 (very fair)
28
with a midpoint of 2.5. The exact wording of items used to measure
outcome favorability and procedural fairness is reported in Appendix D.
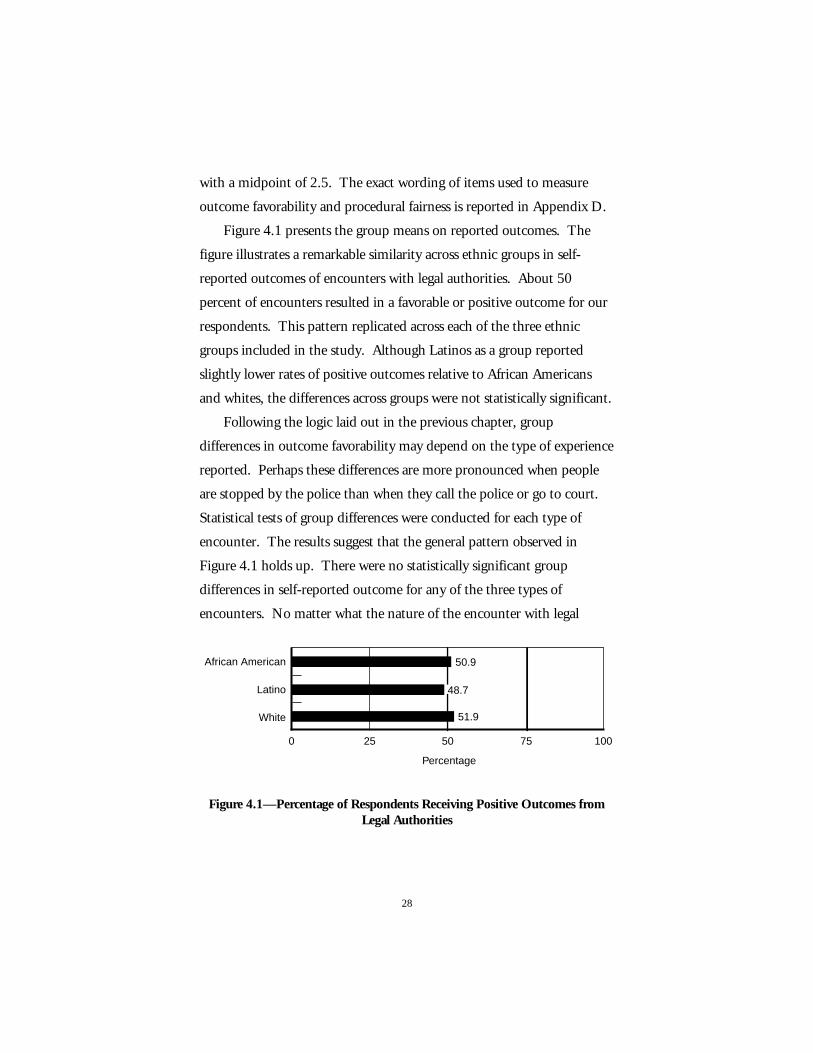
Figure 4.1 presents the group means on reported outcomes. The
figure illustrates a remarkable similarity across ethnic groups in self-
reported outcomes of encounters with legal authorities. About 50
percent of encounters resulted in a favorable or positive outcome for our
respondents. This pattern replicated across each of the three ethnic
groups included in the study. Although Latinos as a group reported
slightly lower rates of positive outcomes relative to African Americans
and whites, the differences across groups were not statistically significant.
Following the logic laid out in the previous chapter, group
differences in outcome favorability may depend on the type of experience
reported. Perhaps these differences are more pronounced when people
are stopped by the police than when they call the police or go to court.
Statistical tests of group differences were conducted for each type of
encounter. The results suggest that the general pattern observed in
Figure 4.1 holds up. There were no statistically significant group
differences in self-reported outcome for any of the three types of
encounters. No matter what the nature of the encounter with legal
African American
Latino
White
50.9
51.9
0 10075
Percentage
25 50
48.7
Figure 4.1—Percentage of Respondents Receiving Positive Outcomes fromLegal Authorities
29
authorities, African Americans, Latinos, and whites report similar levels
of positive or favorable outcomes.
Before we conclude that minorities and whites receive equal
outcomes in the legal system, we should further examine the nature of
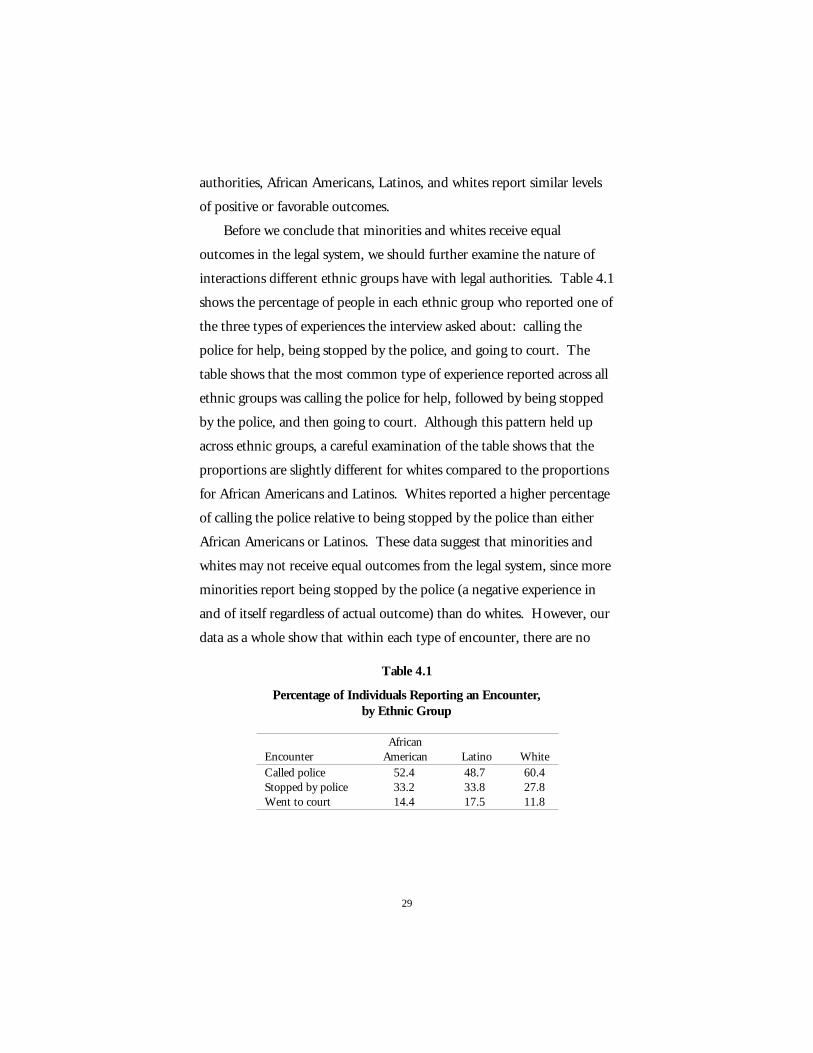
interactions different ethnic groups have with legal authorities. Table 4.1
shows the percentage of people in each ethnic group who reported one of
the three types of experiences the interview asked about: calling the
police for help, being stopped by the police, and going to court. The
table shows that the most common type of experience reported across all
ethnic groups was calling the police for help, followed by being stopped
by the police, and then going to court. Although this pattern held up
across ethnic groups, a careful examination of the table shows that the
proportions are slightly different for whites compared to the proportions
for African Americans and Latinos. Whites reported a higher percentage
of calling the police relative to being stopped by the police than either
African Americans or Latinos. These data suggest that minorities and
whites may not receive equal outcomes from the legal system, since more
minorities report being stopped by the police (a negative experience in
and of itself regardless of actual outcome) than do whites. However, our
data as a whole show that within each type of encounter, there are no
Table 4.1
Percentage of Individuals Reporting an Encounter,by Ethnic Group
EncounterAfrican
American Latino WhiteCalled police 52.4 48.7 60.4Stopped by police 33.2 33.8 27.8Went to court 14.4 17.5 11.8
30
significant differences in reports of the nature of outcomes received by
minorities versus whites.
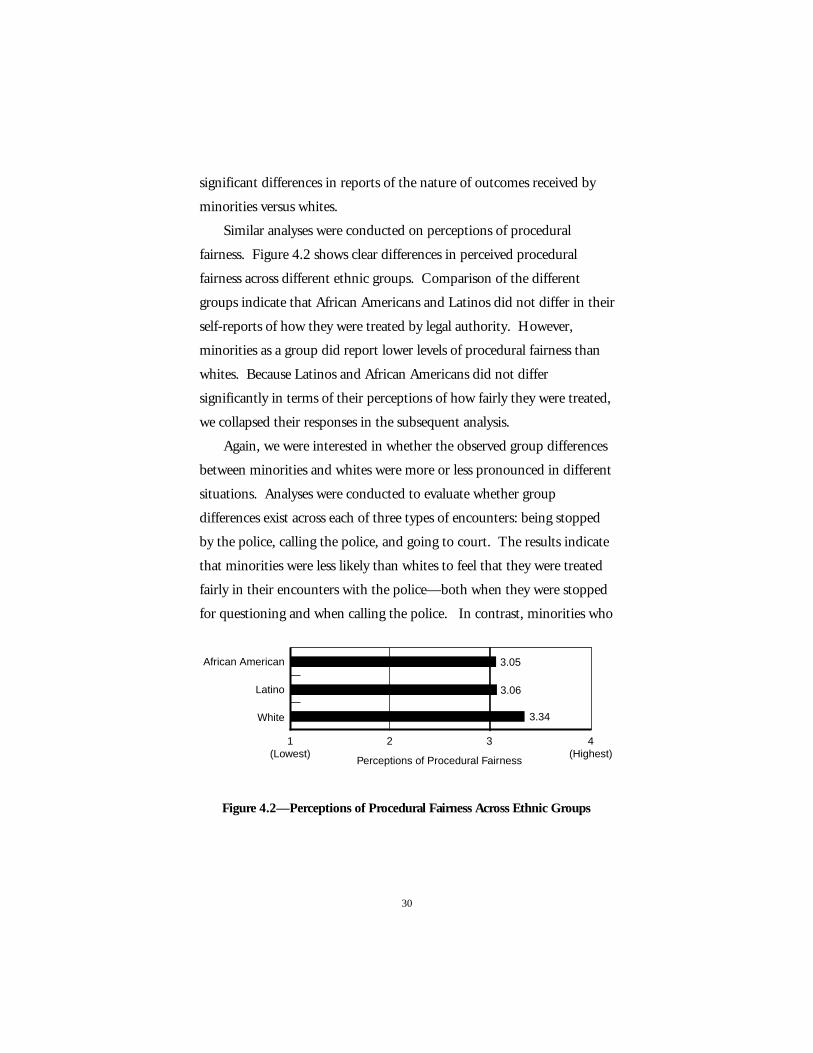
Similar analyses were conducted on perceptions of procedural
fairness. Figure 4.2 shows clear differences in perceived procedural
fairness across different ethnic groups. Comparison of the different
groups indicate that African Americans and Latinos did not differ in their
self-reports of how they were treated by legal authority. However,
minorities as a group did report lower levels of procedural fairness than
whites. Because Latinos and African Americans did not differ
significantly in terms of their perceptions of how fairly they were treated,
we collapsed their responses in the subsequent analysis.
Again, we were interested in whether the observed group differences
between minorities and whites were more or less pronounced in different
situations. Analyses were conducted to evaluate whether group
differences exist across each of three types of encounters: being stopped
by the police, calling the police, and going to court. The results indicate
that minorities were less likely than whites to feel that they were treated
fairly in their encounters with the police—both when they were stopped
for questioning and when calling the police. In contrast, minorities who
African American
Latino
White
3.05
3.34
1(Lowest)
4(Highest)
Perceptions of Procedural Fairness
2 3
3.06
Figure 4.2—Perceptions of Procedural Fairness Across Ethnic Groups
31
went to court reported slightly higher levels of procedural fairness than
whites, although this difference was not statistically reliable.
Even after controlling for related variables, the differences between
whites and minorities shown in Figure 4.2 remained significant.
Regardless of age, income, city of residence, education, or gender,
minorities report lower levels of procedural fairness than whites. The
analysis also showed that higher-income individuals report higher levels
of perceived procedural fairness.
In summary, we found significant differences in perceptions of
procedural fairness across ethnic groups. African Americans and Latinos
report lower levels of procedural fairness than whites. This pattern exists
in situations involving the police, both when respondents were stopped
by the police and when they called the police for help. However, of
those who reported going to court, the perception of procedural fairness
did not differ for minorities and whites. Surprisingly, we did not find
any evidence of ethnic group differences in perceptions of outcome
favorability. African Americans, Latinos, and whites report receiving
similar outcomes. These findings suggest that the primary complaint
minorities have with the legal system has to do with the quality of their
treatment rather than the outcomes they receive. In the next chapter, we
explore this idea in greater depth by examining how perceptions of
procedural fairness and outcome favorability shape reports of satisfaction
and voluntary compliance.
33
5. Explaining Group Differencesin Satisfaction and Compliance
The findings presented in Chapters 3 and 4 suggest that African
Americans and Latinos report more negative reactions than do whites.
Minorities report lower levels of satisfaction and less willingness to
comply with decisions made by legal authorities. This effect remains
even after controlling for other demographic variables that are correlated
with ethnicity, such as household income and educational attainment.
However, the effect appears to be especially pronounced among those
who report experiences with the police compared to those who report
court experiences. The goal in this chapter is to examine alternative
explanations for why the minorities interviewed for this study report
more negative reactions than do whites.
One possible explanation is that minorities are less satisfied with
their experiences and less willing to go along with legal decisions because
the outcomes they receive are more negative. Studies have shown that
minorities receive less favorable outcomes from legal institutions than
34
whites, including longer sentences and a higher likelihood of being
questioned, arrested, and convicted (Monahan and Walker, 1994). An
alternative explanation based on a psychological model of authority
relations suggests that minorities report lower levels of satisfaction and
compliance because they perceive that they are treated unfairly and
disrespectfully by legal authorities (Tyler, 1990; Tyler and Lind, 1992).
A growing body of research summarized in the introduction supports
this relational explanation for the observed ethnic differences in reactions
to the police and the courts. The idea underlying the relational model is
that people care about their status in their communities. Furthermore,
they infer their status in part by observing how important community
representatives, such as the police and the courts, treat them. Fair
treatment indicates that they are valued members of the community;
unfair treatment indicates that they are viewed as marginal. If the
relational explanation is correct, perceptions of treatment should fully
account for the observed differences across ethnic groups. Minorities are
less satisfied and less willing to comply with legal decisions because they
report more unfair treatment than whites.
If the instrumental explanation is correct, however, perceptions of
outcome favorability should account for the observed ethnic difference.
Minorities are less satisfied and less willing to comply with legal decisions
because they receive less favorable outcomes than whites.
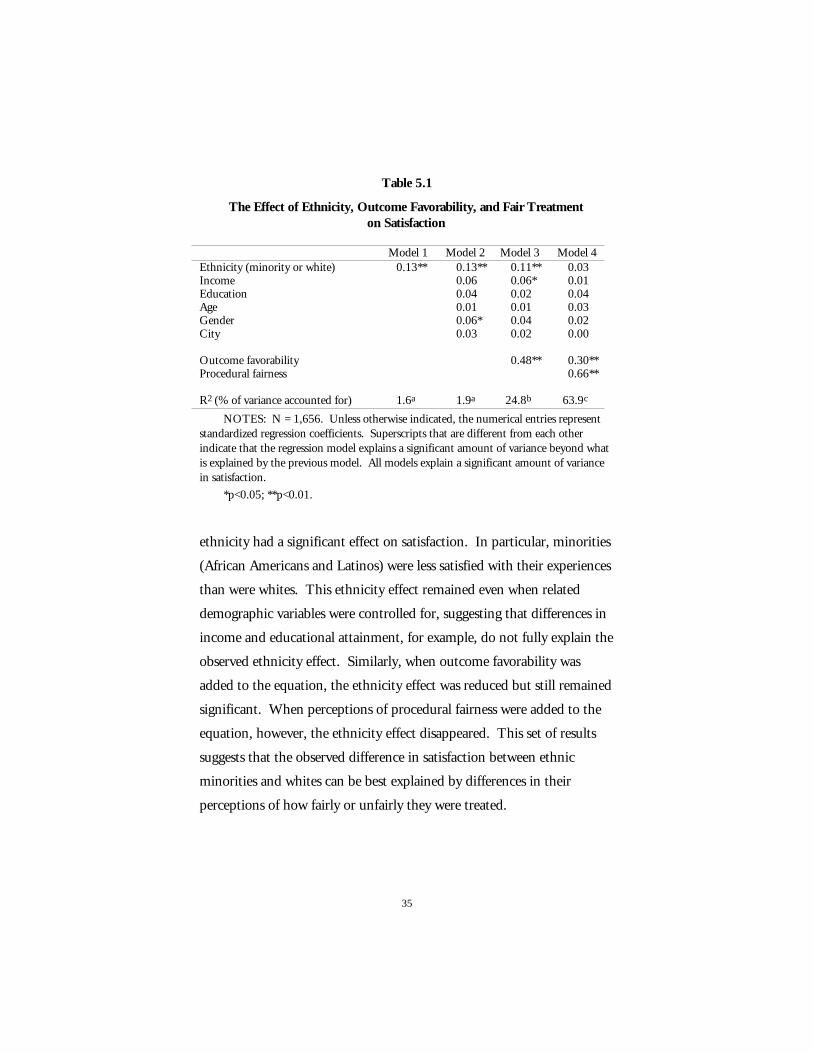
These competing explanations were tested in four regression models,
the results of which are presented in Table 5.1. The first model regressed
ethnicity (minority or white) on satisfaction. The second model added
relevant demographic variables into the regression. The third model
added outcome favorability, and the fourth model added perceptions of
procedural fairness. The results of the regression analysis indicated that
35
Table 5.1
The Effect of Ethnicity, Outcome Favorability, and Fair Treatmenton Satisfaction
Model 1 Model 2 Model 3 Model 4Ethnicity (minority or white) 0.13** 0.13** 0.11** 0.03Income 0.06 0.06* 0.01Education 0.04 0.02 0.04Age 0.01 0.01 0.03Gender 0.06* 0.04 0.02City 0.03 0.02 0.00
Outcome favorability 0.48** 0.30**Procedural fairness 0.66**
R2 (% of variance accounted for) 1.6a 1.9a 24.8b 63.9c
NOTES: N = 1,656. Unless otherwise indicated, the numerical entries representstandardized regression coefficients. Superscripts that are different from each otherindicate that the regression model explains a significant amount of variance beyond whatis explained by the previous model. All models explain a significant amount of variancein satisfaction.
*p<0.05; **p<0.01.
ethnicity had a significant effect on satisfaction. In particular, minorities
(African Americans and Latinos) were less satisfied with their experiences
than were whites. This ethnicity effect remained even when related
demographic variables were controlled for, suggesting that differences in
income and educational attainment, for example, do not fully explain the
observed ethnicity effect. Similarly, when outcome favorability was
added to the equation, the ethnicity effect was reduced but still remained
significant. When perceptions of procedural fairness were added to the
equation, however, the ethnicity effect disappeared. This set of results
suggests that the observed difference in satisfaction between ethnic
minorities and whites can be best explained by differences in their
perceptions of how fairly or unfairly they were treated.
36
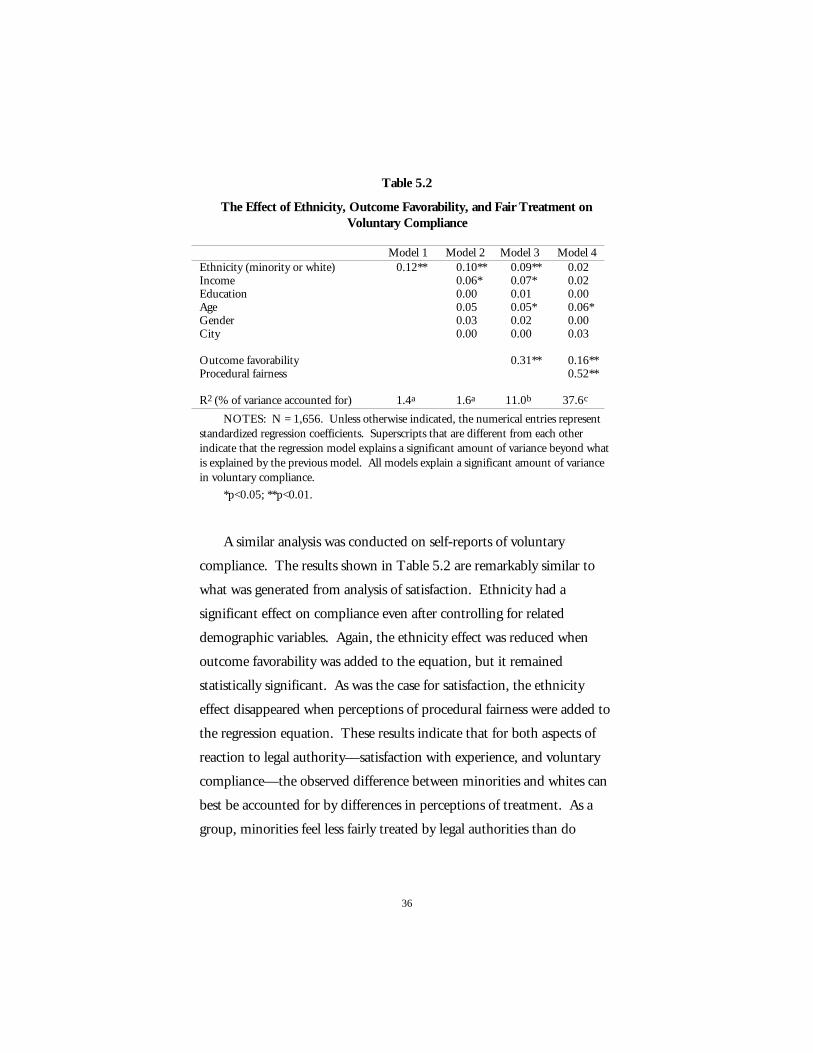
Table 5.2
The Effect of Ethnicity, Outcome Favorability, and Fair Treatment onVoluntary Compliance
Model 1 Model 2 Model 3 Model 4Ethnicity (minority or white) 0.12** 0.10** 0.09** 0.02Income 0.06* 0.07* 0.02Education 0.00 0.01 0.00Age 0.05 0.05* 0.06*Gender 0.03 0.02 0.00City 0.00 0.00 0.03
Outcome favorability 0.31** 0.16**Procedural fairness 0.52**
R2 (% of variance accounted for) 1.4a 1.6a 11.0b 37.6c
NOTES: N = 1,656. Unless otherwise indicated, the numerical entries representstandardized regression coefficients. Superscripts that are different from each otherindicate that the regression model explains a significant amount of variance beyond whatis explained by the previous model. All models explain a significant amount of variancein voluntary compliance.
*p<0.05; **p<0.01.
A similar analysis was conducted on self-reports of voluntary
compliance. The results shown in Table 5.2 are remarkably similar to
what was generated from analysis of satisfaction. Ethnicity had a
significant effect on compliance even after controlling for related
demographic variables. Again, the ethnicity effect was reduced when
outcome favorability was added to the equation, but it remained
statistically significant. As was the case for satisfaction, the ethnicity
effect disappeared when perceptions of procedural fairness were added to
the regression equation. These results indicate that for both aspects of
reaction to legal authority—satisfaction with experience, and voluntary
compliance—the observed difference between minorities and whites can
best be accounted for by differences in perceptions of treatment. As a
group, minorities feel less fairly treated by legal authorities than do
37
whites. This difference in perceptions of treatment best explains why
minorities are less satisfied with their experiences and less willing than
whites to comply with legal decisions.
In addition to demonstrating that perceptions of procedural fairness
account for ethnic group differences in satisfaction and compliance, the
results in Tables 5.1 and 5.2 provide an additional insight into the
dynamics of how people form opinions about the legal authorities they
deal with. A careful examination of Model 4 in both tables indicates that
both outcome favorability and procedural fairness explain variations in
satisfaction and compliance. In both cases, however, procedural fairness
is a more important indicator of reactions to legal authorities than
outcome favorability. This finding is consistent with the pattern of
results documented in past research (for a review, see Tyler and Lind,
1992). It also suggests that if authorities want to elevate levels of
satisfaction and compliance, they need to pay particular attention to
issues of procedural fairness.
Our analysis assumes that reactions to encounters with legal
authorities are largely shaped by judgments about the immediate
situation. Although favorable outcomes and perceptions of fairness are
important factors, it is possible that people enter these encounters with
preconceptions based on prior experience and beliefs. In particular, it is
possible that beliefs about the likelihood of unfair or discriminatory
decisions will shape responses to specific encounters with authorities. To
test this idea, we added the variable of discrimination beliefs to the full
model. The variable of discrimination beliefs was created by averaging
responses to five questions, such as “In the past, I have been
discriminated against in my dealings with the police” (see Appendix D
for the exact wording of all items). When included in the regression,
38
discrimination beliefs produced a significant effect on satisfaction with
the experience. Those who strongly endorsed the likelihood of
discrimination by legal authorities were more likely to say that they were
less satisfied with the encounter they reported. However, procedural
fairness remained the strongest predictor, followed by outcome
favorability and discrimination beliefs. Discrimination beliefs also
produced a significant effect when it was included in an equation
predicting voluntary compliance. Again, procedural fairness remained
the strongest predictor followed by outcome favorability and
discrimination beliefs.
39
6. Testing the Procedural JusticeEffect
The findings presented in the previous chapters suggest that
perceptions of fair treatment strongly influence two different evaluations
of authorities: overall satisfaction with the experience and voluntary
compliance with directives. They also indicate that many of the observed
differences in satisfaction and voluntary compliance can be traced to
perceptions of fair treatment. African Americans and Latinos are less
positive about their experiences with legal authorities not so much
because the outcomes they receive are unfavorable, but because the
procedures authorities use do not meet their expectations of fairness.
This set of findings is consistent with past research on authority relations.
It resonates particularly well with the primary conclusion of a similar
study conducted in Chicago in the late 1980s (see Tyler, 1990). That
study showed that reactions to the local police and courts in Chicago
were driven primarily by perceptions of treatment. The sample in the
Chicago study, however, consisted primarily of white respondents
40
complemented by a relatively small proportion of African American
respondents. It therefore did not examine how ethnicity might influence
the procedural justice effect.
As we noted above, ethnic diversity in the community may
complicate this pattern. This chapter explores the effects of diversity on
reactions to legal authorities by addressing three questions:
• Do ethnic groups assign different weights to procedural fairnessin forming their evaluations of their encounters with legalauthorities?
• Do concerns about procedural fairness differ in interactions withlegal authorities who share one’s ethnicity versus those whobelong to a different ethnic group?
• Do group loyalties (to America and to one’s ethnic group) affectthe level of concern about procedural fairness?
As we have suggested, the procedural justice effect has important
implications for effective authority relations. Legal authorities often
make decisions that affect people negatively. The police are obligated to
issue citations or to make arrests when laws have been violated.
Similarly, judges often hand down negative rulings. Even in situations
where the police are called to assist residents, they may not be able to
resolve the problem. For example, police usually do not recover goods
stolen during home burglaries. If legal authorities are judged more by
how they make decisions rather than by outcomes, they can maintain
high levels of satisfaction and compliance by fulfilling procedural
concerns. If the concern for procedural fairness does not hold up across
ethnic groups or in cross-ethnic interactions, however, authorities will be
challenged in their ability to resolve conflicts and uphold the law. Using
41
data from our study, we evaluate which of these scenarios best describes
two ethnically diverse cities in California.
Ethnic Group MembershipDo members of different ethnic groups differ in the weight they
assign to procedural fairness when forming reactions to their encounters
with legal authorities? We ran two regression models for each variable of
interest, satisfaction with experience and voluntary compliance.1 Table
6.1 shows the results for overall satisfaction with the experience.
Although both factors turned out to be statistically significant, the results
indicate that procedural fairness is more important in shaping satisfaction
with the experience than outcome favorability. Subsequent analysis
shows that compared to whites, Latinos assign less weight to outcome
favorability. African Americans did not differ from whites in the weight
they assigned to procedural concerns and outcome concerns. In each
case, both factors were important in forming judgments of satisfaction,
with procedural fairness being given more weight than outcome
favorability.
Table 6.2 shows the results of similar analysis for voluntary
compliance. This set of findings indicates significant group differences.
Compared to whites, Latinos assign less weight to both outcome and
procedural concerns. From a policy perspective, it would be a concern if
Latinos placed relatively less emphasis on procedural fairness and more
____________ 1The first model includes the effects for perceptions of fair treatment and favorable
outcomes along with dummy codes that represent the comparisons between Latinos andwhites (“Latino”) and between African Americans and whites (“African American”). Thesecond model includes four interaction terms that test whether Latinos and AfricanAmericans differ from whites in the importance they place on fair treatment and onfavorable outcomes.
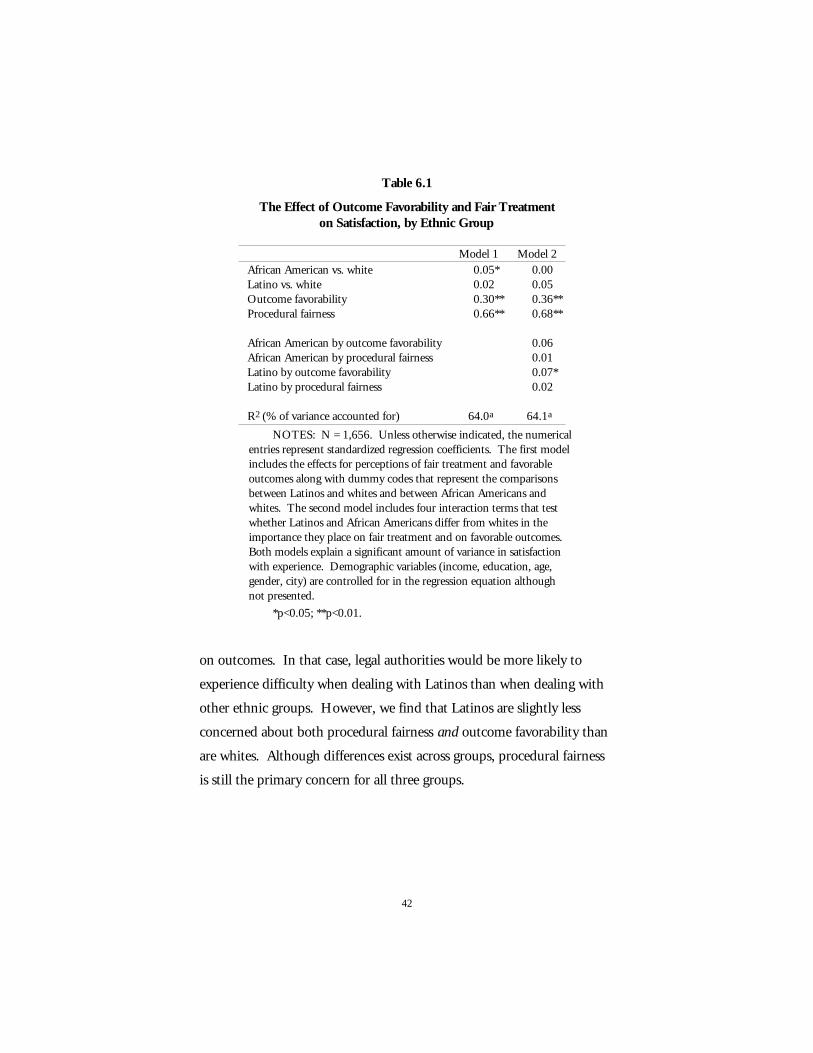
42
Table 6.1
The Effect of Outcome Favorability and Fair Treatmenton Satisfaction, by Ethnic Group
Model 1 Model 2African American vs. white 0.05* 0.00Latino vs. white 0.02 0.05Outcome favorability 0.30** 0.36**Procedural fairness 0.66** 0.68**
African American by outcome favorability 0.06African American by procedural fairness 0.01Latino by outcome favorability 0.07*Latino by procedural fairness 0.02
R2 (% of variance accounted for) 64.0a 64.1a
NOTES: N = 1,656. Unless otherwise indicated, the numericalentries represent standardized regression coefficients. The first modelincludes the effects for perceptions of fair treatment and favorableoutcomes along with dummy codes that represent the comparisonsbetween Latinos and whites and between African Americans andwhites. The second model includes four interaction terms that testwhether Latinos and African Americans differ from whites in theimportance they place on fair treatment and on favorable outcomes.Both models explain a significant amount of variance in satisfactionwith experience. Demographic variables (income, education, age,gender, city) are controlled for in the regression equation althoughnot presented.
*p<0.05; **p<0.01.
on outcomes. In that case, legal authorities would be more likely to
experience difficulty when dealing with Latinos than when dealing with
other ethnic groups. However, we find that Latinos are slightly less
concerned about both procedural fairness and outcome favorability than
are whites. Although differences exist across groups, procedural fairness
is still the primary concern for all three groups.
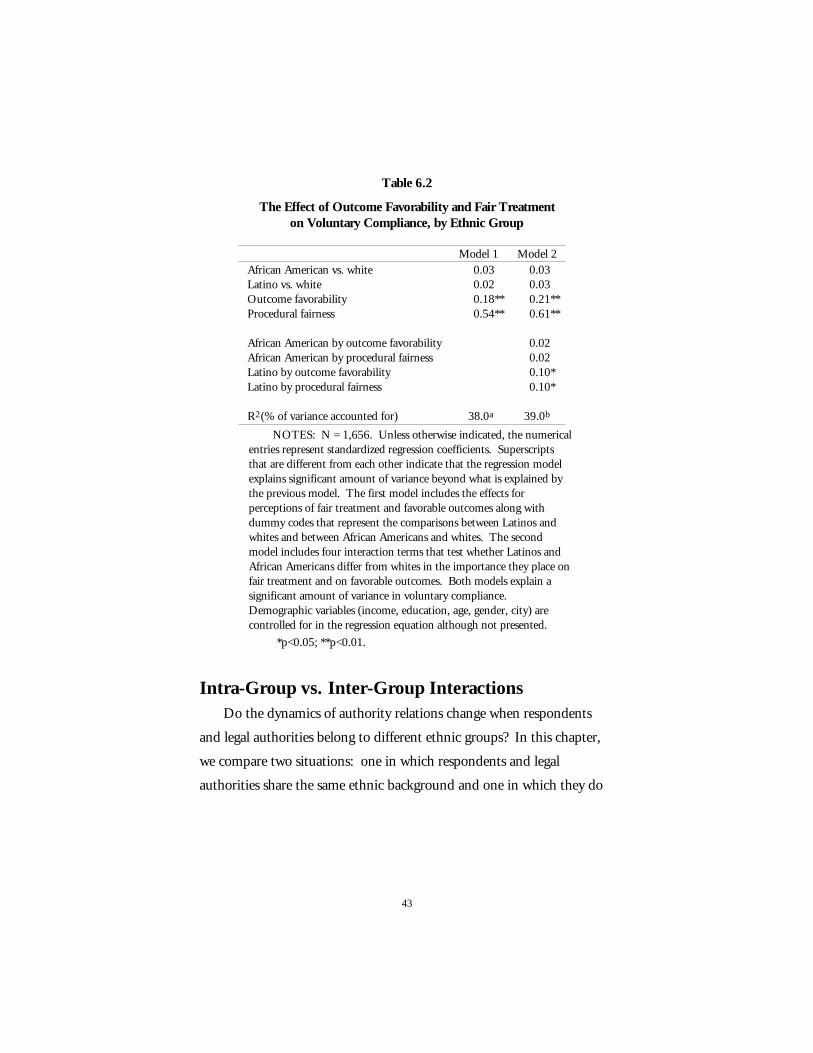
43
Table 6.2
The Effect of Outcome Favorability and Fair Treatmenton Voluntary Compliance, by Ethnic Group
Model 1 Model 2African American vs. white 0.03 0.03Latino vs. white 0.02 0.03Outcome favorability 0.18** 0.21**Procedural fairness 0.54** 0.61**
African American by outcome favorability 0.02African American by procedural fairness 0.02Latino by outcome favorability 0.10*Latino by procedural fairness 0.10*
R2(% of variance accounted for) 38.0a 39.0b
NOTES: N = 1,656. Unless otherwise indicated, the numericalentries represent standardized regression coefficients. Superscriptsthat are different from each other indicate that the regression modelexplains significant amount of variance beyond what is explained bythe previous model. The first model includes the effects forperceptions of fair treatment and favorable outcomes along withdummy codes that represent the comparisons between Latinos andwhites and between African Americans and whites. The secondmodel includes four interaction terms that test whether Latinos andAfrican Americans differ from whites in the importance they place onfair treatment and on favorable outcomes. Both models explain asignificant amount of variance in voluntary compliance.Demographic variables (income, education, age, gender, city) arecontrolled for in the regression equation although not presented.
*p<0.05; **p<0.01.
Intra-Group vs. Inter-Group InteractionsDo the dynamics of authority relations change when respondents
and legal authorities belong to different ethnic groups? In this chapter,
we compare two situations: one in which respondents and legal
authorities share the same ethnic background and one in which they do
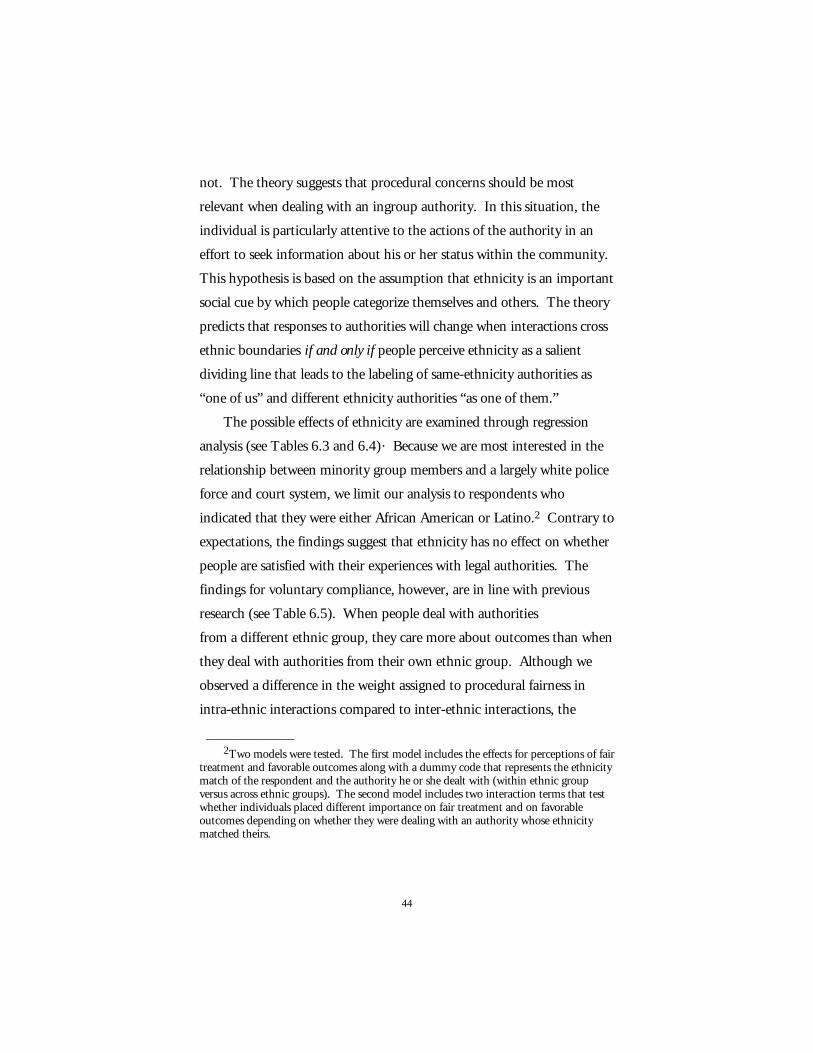
44
not. The theory suggests that procedural concerns should be most
relevant when dealing with an ingroup authority. In this situation, the
individual is particularly attentive to the actions of the authority in an
effort to seek information about his or her status within the community.
This hypothesis is based on the assumption that ethnicity is an important
social cue by which people categorize themselves and others. The theory
predicts that responses to authorities will change when interactions cross
ethnic boundaries if and only if people perceive ethnicity as a salient
dividing line that leads to the labeling of same-ethnicity authorities as
“one of us” and different ethnicity authorities “as one of them.”
The possible effects of ethnicity are examined through regression
analysis (see Tables 6.3 and 6.4). Because we are most interested in the
relationship between minority group members and a largely white police
force and court system, we limit our analysis to respondents who
indicated that they were either African American or Latino.2 Contrary to
expectations, the findings suggest that ethnicity has no effect on whether
people are satisfied with their experiences with legal authorities. The
findings for voluntary compliance, however, are in line with previous
research (see Table 6.5). When people deal with authorities
from a different ethnic group, they care more about outcomes than when
they deal with authorities from their own ethnic group. Although we
observed a difference in the weight assigned to procedural fairness in
intra-ethnic interactions compared to inter-ethnic interactions, the
____________ 2Two models were tested. The first model includes the effects for perceptions of fair
treatment and favorable outcomes along with a dummy code that represents the ethnicitymatch of the respondent and the authority he or she dealt with (within ethnic groupversus across ethnic groups). The second model includes two interaction terms that testwhether individuals placed different importance on fair treatment and on favorableoutcomes depending on whether they were dealing with an authority whose ethnicitymatched theirs.
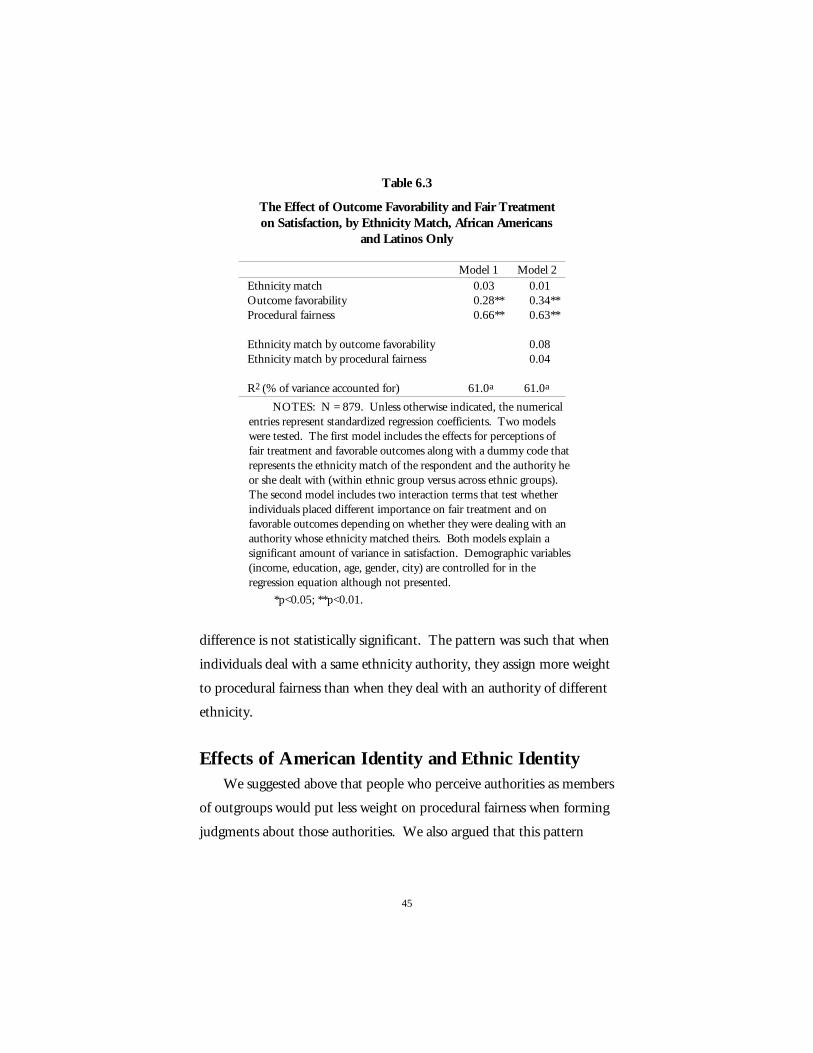
45
Table 6.3
The Effect of Outcome Favorability and Fair Treatmenton Satisfaction, by Ethnicity Match, African Americans
and Latinos Only
Model 1 Model 2Ethnicity match 0.03 0.01Outcome favorability 0.28** 0.34**Procedural fairness 0.66** 0.63**
Ethnicity match by outcome favorability 0.08Ethnicity match by procedural fairness 0.04
R2 (% of variance accounted for) 61.0a 61.0a
NOTES: N = 879. Unless otherwise indicated, the numericalentries represent standardized regression coefficients. Two modelswere tested. The first model includes the effects for perceptions offair treatment and favorable outcomes along with a dummy code thatrepresents the ethnicity match of the respondent and the authority heor she dealt with (within ethnic group versus across ethnic groups).The second model includes two interaction terms that test whetherindividuals placed different importance on fair treatment and onfavorable outcomes depending on whether they were dealing with anauthority whose ethnicity matched theirs. Both models explain asignificant amount of variance in satisfaction. Demographic variables(income, education, age, gender, city) are controlled for in theregression equation although not presented.
*p<0.05; **p<0.01.
difference is not statistically significant. The pattern was such that when
individuals deal with a same ethnicity authority, they assign more weight
to procedural fairness than when they deal with an authority of different
ethnicity.
Effects of American Identity and Ethnic IdentityWe suggested above that people who perceive authorities as members
of outgroups would put less weight on procedural fairness when forming
judgments about those authorities. We also argued that this pattern
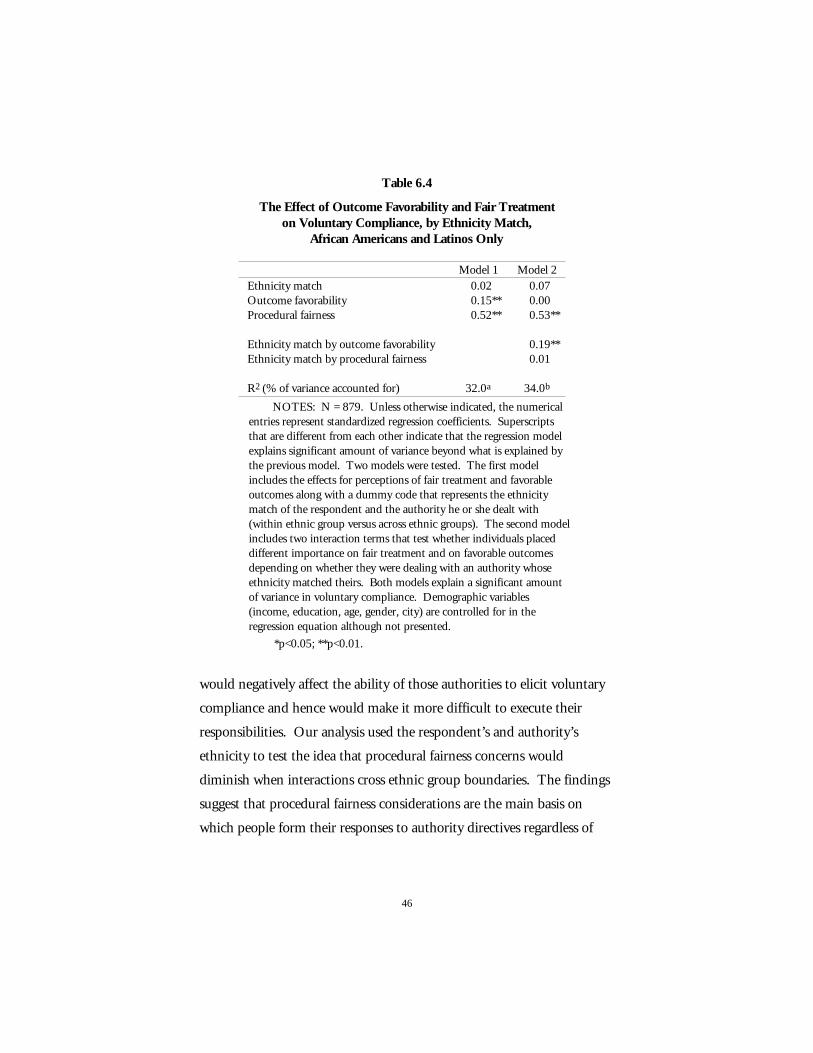
46
Table 6.4
The Effect of Outcome Favorability and Fair Treatmenton Voluntary Compliance, by Ethnicity Match,
African Americans and Latinos Only
Model 1 Model 2Ethnicity match 0.02 0.07Outcome favorability 0.15** 0.00Procedural fairness 0.52** 0.53**
Ethnicity match by outcome favorability 0.19**Ethnicity match by procedural fairness 0.01
R2 (% of variance accounted for) 32.0a 34.0b
NOTES: N = 879. Unless otherwise indicated, the numericalentries represent standardized regression coefficients. Superscriptsthat are different from each other indicate that the regression modelexplains significant amount of variance beyond what is explained bythe previous model. Two models were tested. The first modelincludes the effects for perceptions of fair treatment and favorableoutcomes along with a dummy code that represents the ethnicitymatch of the respondent and the authority he or she dealt with(within ethnic group versus across ethnic groups). The second modelincludes two interaction terms that test whether individuals placeddifferent importance on fair treatment and on favorable outcomesdepending on whether they were dealing with an authority whoseethnicity matched theirs. Both models explain a significant amountof variance in voluntary compliance. Demographic variables(income, education, age, gender, city) are controlled for in theregression equation although not presented.
*p<0.05; **p<0.01.
would negatively affect the ability of those authorities to elicit voluntary
compliance and hence would make it more difficult to execute their
responsibilities. Our analysis used the respondent’s and authority’s
ethnicity to test the idea that procedural fairness concerns would
diminish when interactions cross ethnic group boundaries. The findings
suggest that procedural fairness considerations are the main basis on
which people form their responses to authority directives regardless of
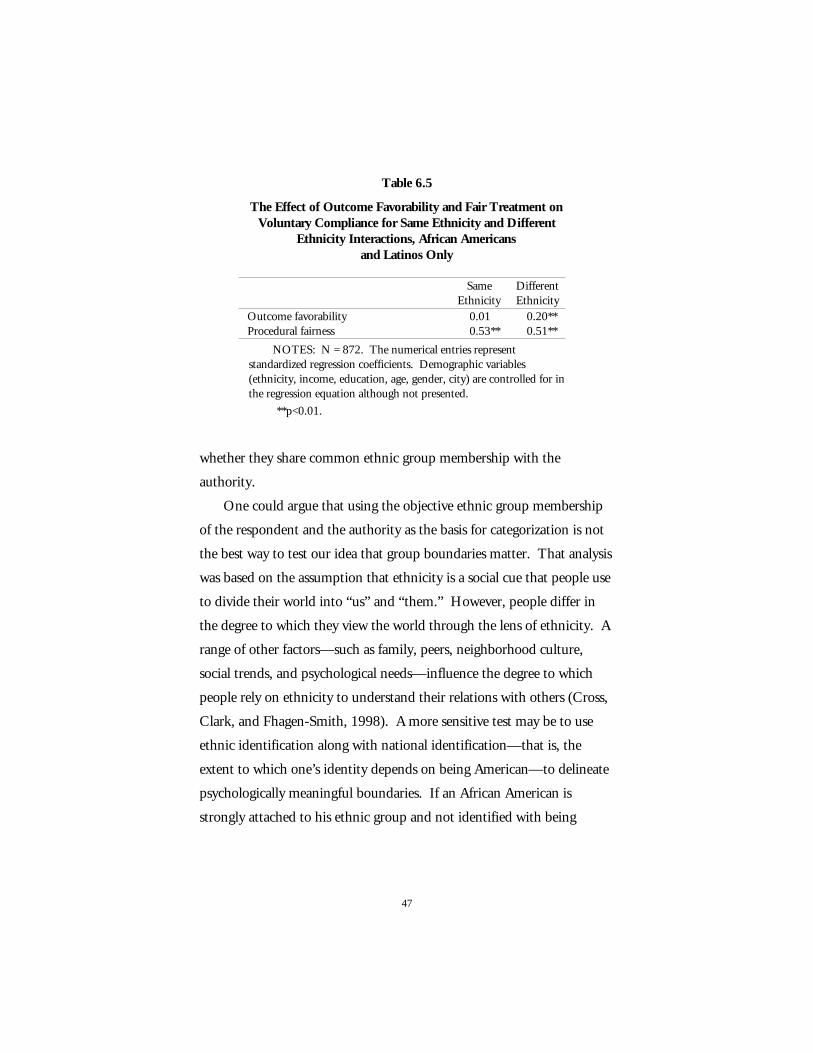
47
Table 6.5
The Effect of Outcome Favorability and Fair Treatment onVoluntary Compliance for Same Ethnicity and Different
Ethnicity Interactions, African Americansand Latinos Only
SameEthnicity
DifferentEthnicity
Outcome favorability 0.01 0.20**Procedural fairness 0.53** 0.51**
NOTES: N = 872. The numerical entries representstandardized regression coefficients. Demographic variables(ethnicity, income, education, age, gender, city) are controlled for inthe regression equation although not presented.
**p<0.01.
whether they share common ethnic group membership with the
authority.
One could argue that using the objective ethnic group membership
of the respondent and the authority as the basis for categorization is not
the best way to test our idea that group boundaries matter. That analysis
was based on the assumption that ethnicity is a social cue that people use
to divide their world into “us” and “them.” However, people differ in
the degree to which they view the world through the lens of ethnicity. A
range of other factors—such as family, peers, neighborhood culture,
social trends, and psychological needs—influence the degree to which
people rely on ethnicity to understand their relations with others (Cross,
Clark, and Fhagen-Smith, 1998). A more sensitive test may be to use
ethnic identification along with national identification—that is, the
extent to which one’s identity depends on being American—to delineate
psychologically meaningful boundaries. If an African American is
strongly attached to his ethnic group and not identified with being
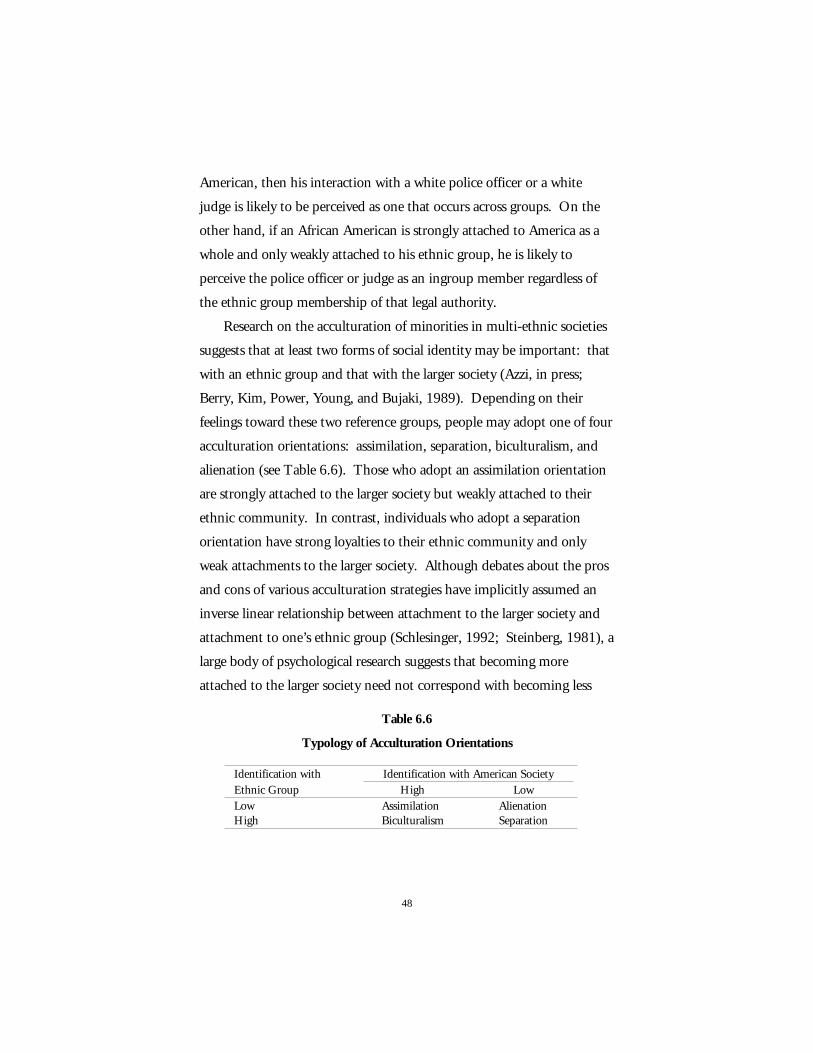
48
American, then his interaction with a white police officer or a white
judge is likely to be perceived as one that occurs across groups. On the
other hand, if an African American is strongly attached to America as a
whole and only weakly attached to his ethnic group, he is likely to
perceive the police officer or judge as an ingroup member regardless of
the ethnic group membership of that legal authority.
Research on the acculturation of minorities in multi-ethnic societies
suggests that at least two forms of social identity may be important: that
with an ethnic group and that with the larger society (Azzi, in press;
Berry, Kim, Power, Young, and Bujaki, 1989). Depending on their
feelings toward these two reference groups, people may adopt one of four
acculturation orientations: assimilation, separation, biculturalism, and
alienation (see Table 6.6). Those who adopt an assimilation orientation
are strongly attached to the larger society but weakly attached to their
ethnic community. In contrast, individuals who adopt a separation
orientation have strong loyalties to their ethnic community and only
weak attachments to the larger society. Although debates about the pros
and cons of various acculturation strategies have implicitly assumed an
inverse linear relationship between attachment to the larger society and
attachment to one’s ethnic group (Schlesinger, 1992; Steinberg, 1981), a
large body of psychological research suggests that becoming more
attached to the larger society need not correspond with becoming less
Table 6.6
Typology of Acculturation Orientations
Identification with Identification with American SocietyEthnic Group High LowLow Assimilation AlienationHigh Biculturalism Separation
49
attached to one’s ethnic group and vice versa (LaFromboise, Coleman,
and Gerton, 1993; Phinney, 1990). A third strategy is possible:
biculturalism (having strong attachment to both the larger society and
one’s ethnic group). Last, people who are weakly attached to both the
larger society and their ethnic groups are characterized as having adopted
an alienation orientation. Because policy debates about acculturation
assume that individuals have strong attachment to either American
society or their ethnic group, the first three strategies are of most interest.
The fourth strategy, that of alienation, is of less interest because this
strategy involves neither strong attachment to American society nor to
the ethnic group. Hence, our analysis will focus on the first three
strategies.
Before we test the acculturation orientation hypothesis, we first
evaluate the degree to which the respondents in our sample identify with
being American and with being a member of an ethnic group. We
assessed group attachment by asking respondents to indicate their degree
of agreement with two sets of statements: one set about America and a
similar set about their ethnic group (African American, Latino, or white).
The exact wording of the questions can be found in Appendix D (e.g.,
“What America stands for is important to me”; “I am proud to be
[respondent’s ethnic group]).” The respondents in our sample reported a
strong sense of attachment both to America and to their own ethnic
groups (see Figures 6.1 and 6.2). For attachment to America, all three
ethnic groups indicate high group identification. Compared to whites,
African Americans reported similarly high levels of attachment to
America. In contrast, Latinos reported slightly higher levels of
attachment to America compared to African Americans and whites. For
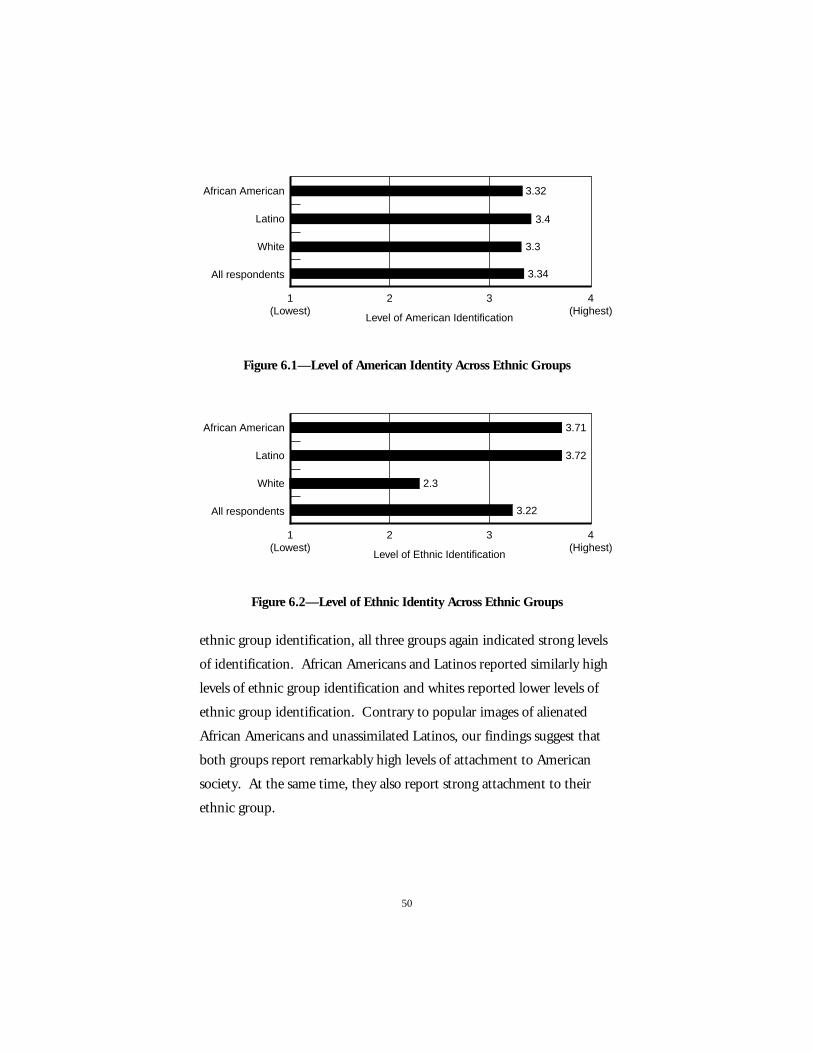
50
African American
Latino
White
All respondents
3.32
3.4
3.34
1(Lowest)
4(Highest)
Level of American Identification
2 3
3.3
Figure 6.1—Level of American Identity Across Ethnic Groups
African American
Latino
White
All respondents
3.71
3.72
2.3
3.22
1(Lowest)
4(Highest)
Level of Ethnic Identification
2 3
Figure 6.2—Level of Ethnic Identity Across Ethnic Groups
ethnic group identification, all three groups again indicated strong levels
of identification. African Americans and Latinos reported similarly high
levels of ethnic group identification and whites reported lower levels of
ethnic group identification. Contrary to popular images of alienated
African Americans and unassimilated Latinos, our findings suggest that
both groups report remarkably high levels of attachment to American
society. At the same time, they also report strong attachment to their
ethnic group.
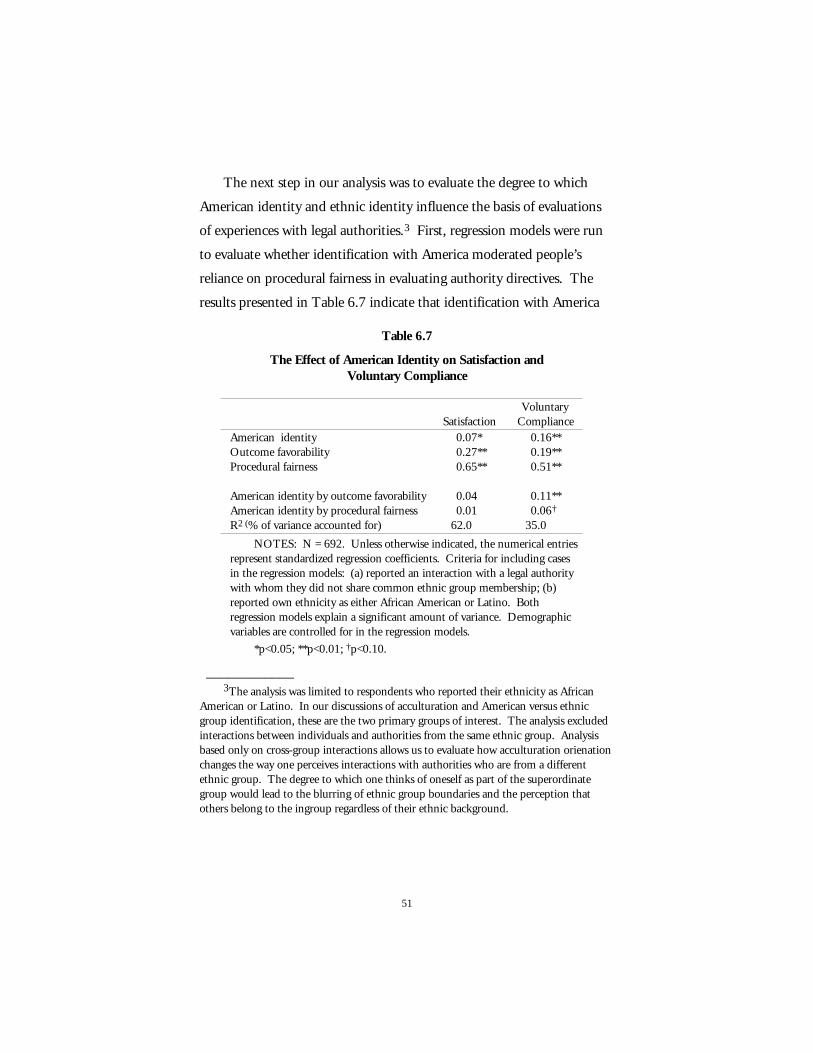
51
The next step in our analysis was to evaluate the degree to which
American identity and ethnic identity influence the basis of evaluations
of experiences with legal authorities.3 First, regression models were run
to evaluate whether identification with America moderated people’s
reliance on procedural fairness in evaluating authority directives. The
results presented in Table 6.7 indicate that identification with America
Table 6.7
The Effect of American Identity on Satisfaction andVoluntary Compliance
SatisfactionVoluntary
ComplianceAmerican identity 0.07* 0.16**Outcome favorability 0.27** 0.19**Procedural fairness 0.65** 0.51**
American identity by outcome favorability 0.04 0.11**American identity by procedural fairness 0.01 0.06†
R2 (% of variance accounted for) 62.0 35.0
NOTES: N = 692. Unless otherwise indicated, the numerical entriesrepresent standardized regression coefficients. Criteria for including casesin the regression models: (a) reported an interaction with a legal authoritywith whom they did not share common ethnic group membership; (b)reported own ethnicity as either African American or Latino. Bothregression models explain a significant amount of variance. Demographicvariables are controlled for in the regression models.
*p<0.05; **p<0.01; †p<0.10.
____________ 3The analysis was limited to respondents who reported their ethnicity as African
American or Latino. In our discussions of acculturation and American versus ethnicgroup identification, these are the two primary groups of interest. The analysis excludedinteractions between individuals and authorities from the same ethnic group. Analysisbased only on cross-group interactions allows us to evaluate how acculturation orienationchanges the way one perceives interactions with authorities who are from a differentethnic group. The degree to which one thinks of oneself as part of the superordinategroup would lead to the blurring of ethnic group boundaries and the perception thatothers belong to the ingroup regardless of their ethnic background.
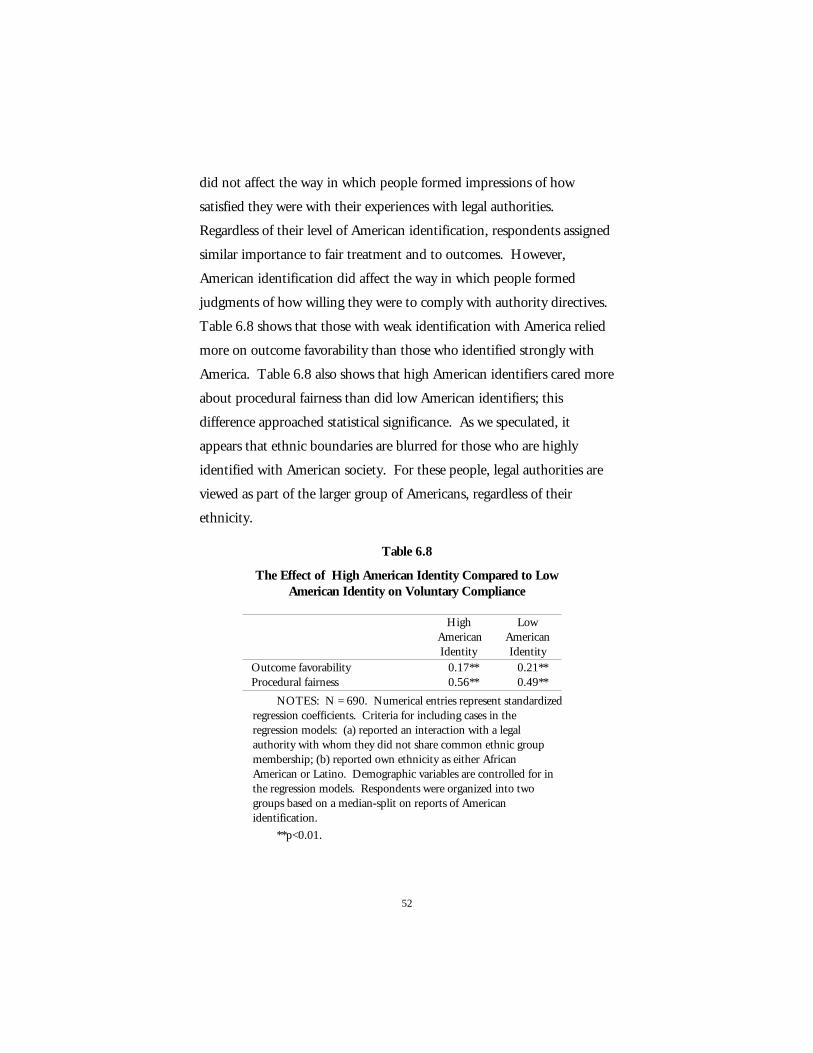
52
did not affect the way in which people formed impressions of how
satisfied they were with their experiences with legal authorities.
Regardless of their level of American identification, respondents assigned
similar importance to fair treatment and to outcomes. However,
American identification did affect the way in which people formed
judgments of how willing they were to comply with authority directives.
Table 6.8 shows that those with weak identification with America relied
more on outcome favorability than those who identified strongly with
America. Table 6.8 also shows that high American identifiers cared more
about procedural fairness than did low American identifiers; this
difference approached statistical significance. As we speculated, it
appears that ethnic boundaries are blurred for those who are highly
identified with American society. For these people, legal authorities are
viewed as part of the larger group of Americans, regardless of their
ethnicity.
Table 6.8
The Effect of High American Identity Compared to LowAmerican Identity on Voluntary Compliance
HighAmericanIdentity
LowAmericanIdentity
Outcome favorability 0.17** 0.21**Procedural fairness 0.56** 0.49**
NOTES: N = 690. Numerical entries represent standardizedregression coefficients. Criteria for including cases in theregression models: (a) reported an interaction with a legalauthority with whom they did not share common ethnic groupmembership; (b) reported own ethnicity as either AfricanAmerican or Latino. Demographic variables are controlled for inthe regression models. Respondents were organized into twogroups based on a median-split on reports of Americanidentification.
**p<0.01.
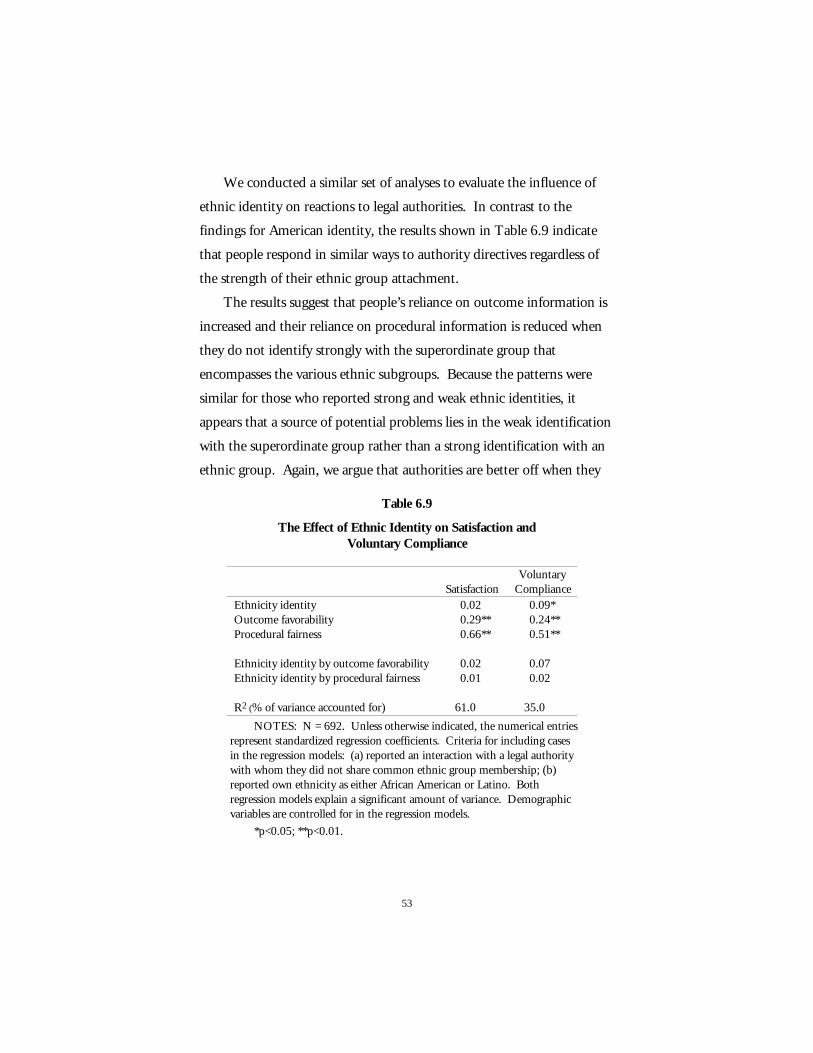
53
We conducted a similar set of analyses to evaluate the influence of
ethnic identity on reactions to legal authorities. In contrast to the
findings for American identity, the results shown in Table 6.9 indicate
that people respond in similar ways to authority directives regardless of
the strength of their ethnic group attachment.
The results suggest that people’s reliance on outcome information is
increased and their reliance on procedural information is reduced when
they do not identify strongly with the superordinate group that
encompasses the various ethnic subgroups. Because the patterns were
similar for those who reported strong and weak ethnic identities, it
appears that a source of potential problems lies in the weak identification
with the superordinate group rather than a strong identification with an
ethnic group. Again, we argue that authorities are better off when they
Table 6.9
The Effect of Ethnic Identity on Satisfaction andVoluntary Compliance
SatisfactionVoluntary
ComplianceEthnicity identity 0.02 0.09*Outcome favorability 0.29** 0.24**Procedural fairness 0.66** 0.51**
Ethnicity identity by outcome favorability 0.02 0.07Ethnicity identity by procedural fairness 0.01 0.02
R2 (% of variance accounted for) 61.0 35.0
NOTES: N = 692. Unless otherwise indicated, the numerical entriesrepresent standardized regression coefficients. Criteria for including casesin the regression models: (a) reported an interaction with a legal authoritywith whom they did not share common ethnic group membership; (b)reported own ethnicity as either African American or Latino. Bothregression models explain a significant amount of variance. Demographicvariables are controlled for in the regression models.
*p<0.05; **p<0.01.
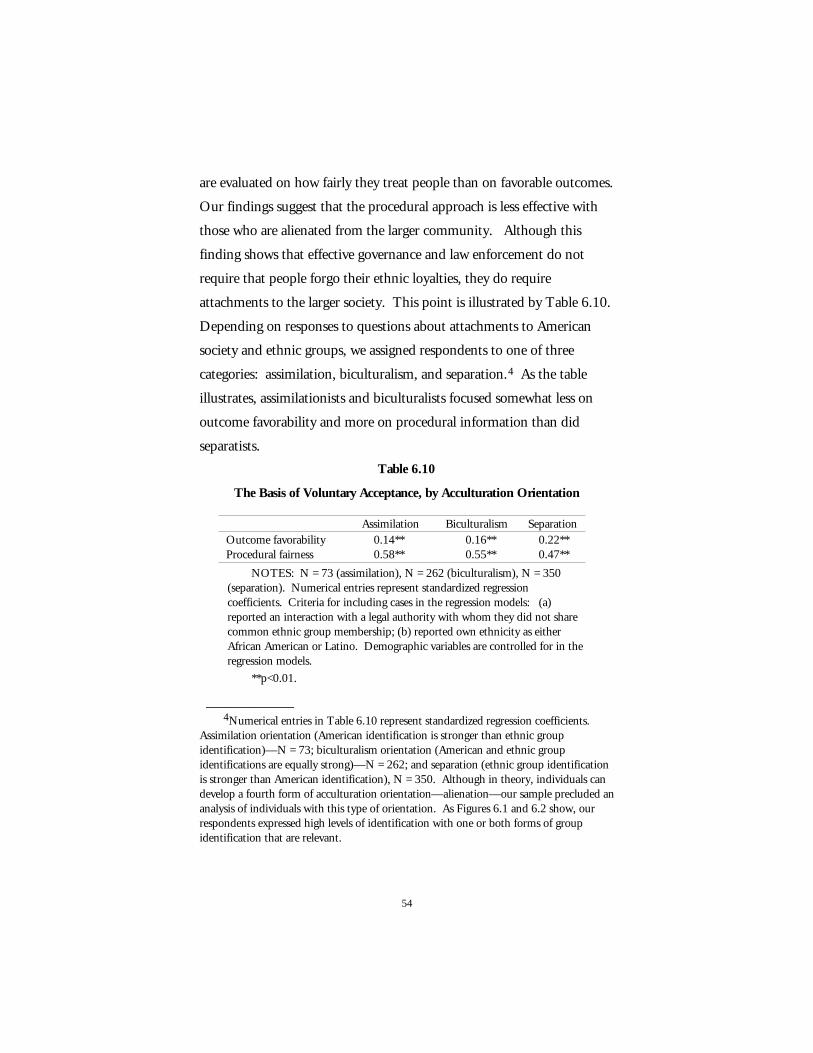
54
are evaluated on how fairly they treat people than on favorable outcomes.
Our findings suggest that the procedural approach is less effective with
those who are alienated from the larger community. Although this
finding shows that effective governance and law enforcement do not
require that people forgo their ethnic loyalties, they do require
attachments to the larger society. This point is illustrated by Table 6.10.
Depending on responses to questions about attachments to American
society and ethnic groups, we assigned respondents to one of three
categories: assimilation, biculturalism, and separation.4 As the table
illustrates, assimilationists and biculturalists focused somewhat less on
outcome favorability and more on procedural information than did
separatists.
Table 6.10
The Basis of Voluntary Acceptance, by Acculturation Orientation
Assimilation Biculturalism SeparationOutcome favorability 0.14** 0.16** 0.22**Procedural fairness 0.58** 0.55** 0.47**
NOTES: N = 73 (assimilation), N = 262 (biculturalism), N = 350(separation). Numerical entries represent standardized regressioncoefficients. Criteria for including cases in the regression models: (a)reported an interaction with a legal authority with whom they did not sharecommon ethnic group membership; (b) reported own ethnicity as eitherAfrican American or Latino. Demographic variables are controlled for in theregression models.
**p<0.01.
____________ 4Numerical entries in Table 6.10 represent standardized regression coefficients.
Assimilation orientation (American identification is stronger than ethnic groupidentification)—N = 73; biculturalism orientation (American and ethnic groupidentifications are equally strong)—N = 262; and separation (ethnic group identificationis stronger than American identification), N = 350. Although in theory, individuals candevelop a fourth form of acculturation orientation—alienation—our sample precluded ananalysis of individuals with this type of orientation. As Figures 6.1 and 6.2 show, ourrespondents expressed high levels of identification with one or both forms of groupidentification that are relevant.
55
7. The Components of FairTreatment
Our findings so far indicate that people are deeply concerned about
being treated fairly by authorities. Perceptions of fair treatment are
closely related to overall satisfaction with encounters with legal
authorities and to willingness to comply with directives. This concern
cuts across the three ethnic groups included in this study. It also applies
whether or not residents and legal authorities belong to the same ethnic
group. The only exception to this pattern involves those who report
weak identification with American society. All in all, the findings suggest
a rather optimistic outlook for legal authorities and their ability to resolve
conflicts and enforce the law. In particular, the findings suggest that
residents will respond positively to the actions and decisions of the police
and courts so long as they feel that they have been treated fairly.
What is unclear up to this point is what people mean when they refer
to procedural fairness. The group-value model of procedural justice
(Lind and Tyler, 1988; Tyler, 1989) proposes that people are attentive
56
to three aspects of the process when forming procedural justice
judgments: neutrality, benevolence, and status recognition. Neutrality
refers to evaluations that the authority acts without bias and makes
decisions based on facts (e.g., “He/She treated me the same as he/she
would treat anyone else in the same situation”). Benevolence refers to
the individual’s judgment that the authority’s motives are honorable and
can be trusted (e.g., “He/She cared about my concerns”). Status
recognition refers to the authority’s regard for the individual as a full
member of the community (“He/She treated me with dignity and
respect”). These relational judgments are thought to underlie judgments
of procedural fairness (see Appendix D for the complete text of the
different questions used to assess each of these judgments).
To specify what people mean by fair treatment, we evaluated the
degree to which the different relational judgments can account for
variations in perceptions of procedural fairness. Ratings of procedural
fairness were regressed on judgments of neutrality, benevolence, and
status recognition along with ratings of outcome favorability and key
demographic variables similar to those included in previous analyses (see
Table 7.1). The first model shows that all three relational judgments as
well as outcome favorability ratings were related to procedural fairness
judgments. However, all three relational judgments were more
important in explaining variations in procedural fairness than was
outcome favorability. These findings are consistent with the predictions
of the group-value model. When people said they were treated fairly,
they meant that their standards of neutrality, benevolence, and status
recognition had been met.
In multi-ethnic communities, it is possible that different worldviews,
values, and beliefs lead to different definitions of fairness (Miller and
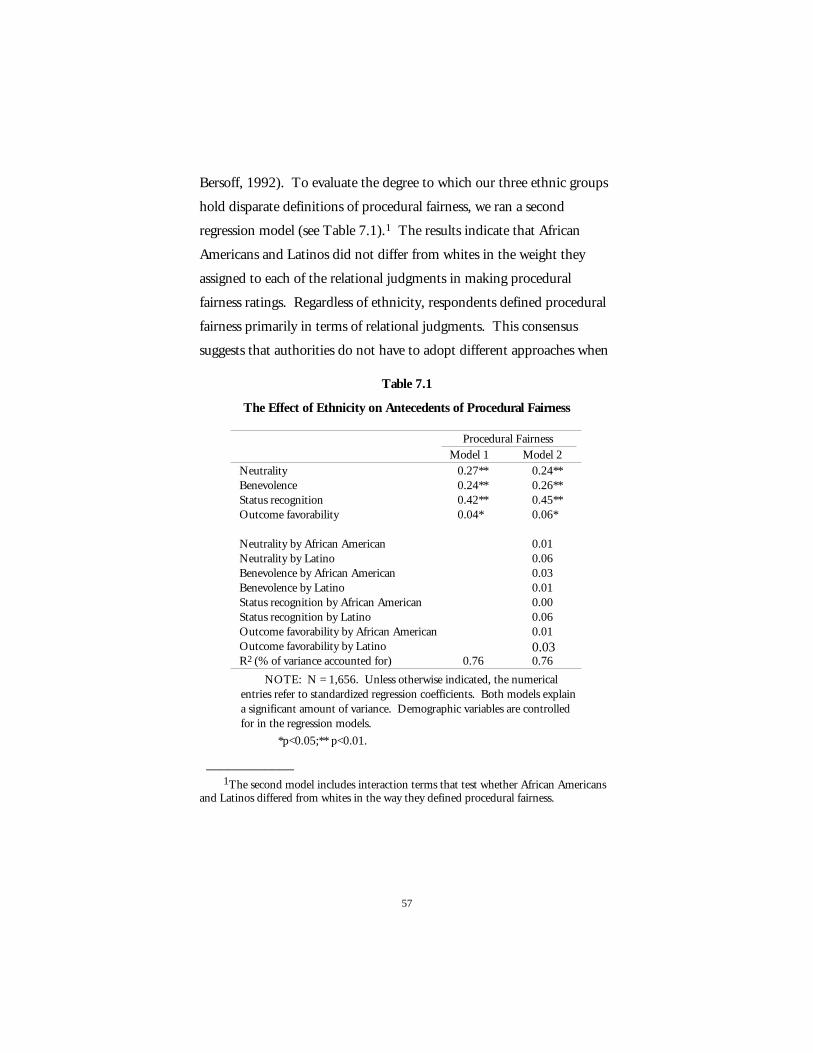
57
Bersoff, 1992). To evaluate the degree to which our three ethnic groups
hold disparate definitions of procedural fairness, we ran a second
regression model (see Table 7.1).1 The results indicate that African
Americans and Latinos did not differ from whites in the weight they
assigned to each of the relational judgments in making procedural
fairness ratings. Regardless of ethnicity, respondents defined procedural
fairness primarily in terms of relational judgments. This consensus
suggests that authorities do not have to adopt different approaches when
Table 7.1
The Effect of Ethnicity on Antecedents of Procedural Fairness
Procedural FairnessModel 1 Model 2
Neutrality 0.27** 0.24**Benevolence 0.24** 0.26**Status recognition 0.42** 0.45**Outcome favorability 0.04* 0.06*
Neutrality by African American 0.01Neutrality by Latino 0.06Benevolence by African American 0.03Benevolence by Latino 0.01Status recognition by African American 0.00Status recognition by Latino 0.06Outcome favorability by African American 0.01Outcome favorability by Latino 0.03R2 (% of variance accounted for) 0.76 0.76
NOTE: N = 1,656. Unless otherwise indicated, the numericalentries refer to standardized regression coefficients. Both models explaina significant amount of variance. Demographic variables are controlledfor in the regression models.
*p<0.05;** p<0.01.
____________ 1The second model includes interaction terms that test whether African Americans
and Latinos differed from whites in the way they defined procedural fairness.

58
dealing with members of different ethnic groups. It also reinforces the
overriding importance of evenhanded treatment, attending to personal
concerns, and respecting the dignity of individuals.
59
8. Conclusions and Implications
This study provides information about people’s everyday experiences
with the police and the courts in two ethnically diverse cities—Los
Angeles and Oakland, California. Our findings are consistent with
ethnic group differences documented in broader public opinion polls.
Compared to whites, African Americans and Latinos reported more
negative reactions to all types of experiences with the police. Regardless
of whether they initiated contact with the police or were stopped by the
police, African Americans and Latinos reported lower levels of
satisfaction than whites. Interestingly, all ethnic groups were equally
satisfied with their experiences in the courts. This same pattern emerged
in terms of the respondents’ reports of their willingness to go along with
the directives of the authority in question. Regardless of the type of
experience reported, minorities were less willing than whites to comply
with directives from the police. However, all ethnic groups were equally
willing to comply with court directives.
60
More important, our study examined the basis of people’s reactions
to their encounters with legal authorities. The instrumental model of
authority relations, which is derived from social exchange theory
(Homans, 1974; Thibaut and Walker, 1975), suggests that people tend
to pursue their self-interest. They are therefore more satisfied and more
willing to comply with decisions that benefit them. An alternative model
of authority relations suggests that in addition to their interest in
outcomes, people are concerned about how they are treated by
authorities (Tyler and Lind, 1992). In particular, they care about
whether the authorities treat them fairly in their encounters.
Our findings support both the instrumental and relational
perspectives. Respondents indicated that they cared about favorable
outcomes as well as procedural fairness. But the findings show clearly
that people cared more about fair treatment than outcomes. This pattern
was consistent across different types of encounters and all three ethnic
groups. The findings also show that although African Americans and
Latinos indicated lower levels of satisfaction and voluntary compliance
than did whites, all three groups use a common set of criteria for judging
fairness.
Although studies of the legal system have shown that minorities
often receive worse outcomes than whites (Monahan and Walker, 1994),
our study found that minorities and whites do not differ in their reports
of the outcomes they receive. We must be careful, however, about
drawing conclusions from these similarities. Once contact between a
person and a legal authority has been initiated, there are no observable
group differences in reported outcomes; but our data also show that
minorities are more likely than whites to report being stopped by the
police. As recent discussions of racial profiling suggest, group differences
61
in rates of traffic stops is an important form of outcome inequality. Also,
African Americans and Latinos are less satisfied with their experiences
with legal authorities and less willing to comply with authority directives.
However, much of the observed differences in satisfaction and voluntary
compliance can be attributed to corresponding differences in perceptions
of fair treatment rather than to differences in perceptions of outcomes
received.
Previous studies have linked perceived procedural fairness to actual
behavior. A reanalysis of data from the Milwaukee Domestic Violence
Experiment, for example, showed that procedural fairness perceptions
actually suppressed subsequent violence among individuals who were
arrested for domestic abuse (Patternoster, Bachman, Brame, and
Sherman, 1997). The analysis was based on suspects’ perceptions of how
fairly the police treated them during an arrest and their subsequent
behavior. Suspects who perceived that the police treated them fairly had
lower subsequent arrest rates than suspects who did not.1 In short, data
from the Milwaukee Domestic Violence Experiment demonstrate the
causal link between perceptions of procedural fairness and actual
behavior. Our study, which demonstrates a link between perceived
procedural fairness and subjective evaluations of encounters with legal
authorities, complements the Milwaukee study by showing that African
Americans and Latinos perceive that legal authorities treat them with less
procedural fairness than they do whites. Taken together, the two sets of
____________ 1Perceived procedural fairness in the Milwaukee Domestic Violence Experiment was
a composite variable based on responses to three questions: “Did the officers take thetime to listen to your side of the story?”; “When the officers came, did you expect to bearrested?”; and “Did the officers take the time to listen to your side of the story as well asthe victim’s side of the story?” These questions were designed to measure relationaljudgments as described in Chapter 7.
62
findings suggest that group differences in perceived procedural fairness
may lead to group differences in compliance with legal directives.
Because African Americans and Latinos report less fair treatment than
whites, their behavior in the legal system may also reflect this difference.
The bad news to emerge from our study is that African Americans
and Latinos report experiencing more negative treatment from legal
authorities than do whites. These perceptions of lower levels of fair
treatment have important implications for behavioral compliance rates
among minority groups. The good news is that minorities and whites
share a common understanding of standards of fairness in legal
institutions. They are concerned about receiving favorable decisions
from legal authorities, but they are more concerned about being treated
fairly. This finding suggests an optimistic future for more positive
relations between minority groups and the police and courts in their local
communities. In particular, it suggests that efforts to act more fairly will
lead to more positive reactions and higher rates of compliance.
We also explored the different ways in which this procedural fairness
effect is attenuated. We found that its effect on voluntary compliance is
weaker among Latinos and among minorities who reported low
identification with American society. These two exceptions
notwithstanding, we found that people are generally more concerned
with procedural issues than they are with the pursuit of favorable
outcomes. Moreover, members of all three ethnic groups included in the
study define procedural fairness in a similar way. This sense of fair
treatment, in turn, is related to more positive reactions to their
encounters with legal authorities.
One interesting implication of this research stems from the finding
that respondents’ strong sense of ethnic identity does not impede the
63
ability of the police and courts to exercise their authority. Scholars and
social commentators have expressed concern that a society’s failure to
assimilate minorities will inevitably lead to higher levels of social conflicts
and thereby threaten social cohesion (Glazer, 1997; Schlesinger, 1992).
Ethnic loyalty and attachment are considered detrimental to the
formation of positive social relations. Our findings suggest instead that
legal authorities can enforce laws and manage conflicts in their
communities as long as the residents have a strong sense of attachment to
American society. Furthermore, these authorities can govern effectively
regardless of the residents’ levels of attachment to their ethnic groups.
People who identify strongly with American society express a very strong
relational orientation toward their encounters with legal authorities.
They focus on whether authorities have met their expectations of fairness
rather than on the pursuit of favorable outcomes. This orientation allows
authorities to act on decisions they feel are necessary to protect the
interests of the larger community without losing the support of its
members.
Our findings suggest that the public debate should focus on
engendering stronger attachments to American society rather than on the
detrimental effects of strong ethnic identities. Authorities are best able to
carry out their roles when community members feel that they share a
common identity as members of American society. The large majority of
respondents identified highly with their ethnic group and American
society. Part of the fears associated with the rise of multiculturalism
stems from the assumption that loyalty to America and loyalty to one’s
ethnic group are negatively correlated. Much recent research in the
behavioral sciences and our own findings support a different conclusion,
namely, that people can be bicultural—attached to American society and
64
to their ethnic groups at the same time. Moreover, people who adopt a
bicultural orientation are as focused on the importance of fair treatment
as are people who adopt a traditional assimilation orientation. The fear
should lie in the consequences of disidentification with American society
rather than strong identification with an ethnic group.
In conclusion, the changing nature of California’s population brings
to the forefront important issues about the relationship between the
people and the public institutions that govern them. To serve a multi-
ethnic population effectively, public institutions need to understand and
recognize the needs and concerns of the diverse peoples living in the
state. The focus of our report has been on how diversity affects people’s
perceptions of and reactions to legal authorities, in particular, police
officers, judges, and other court officials. We hope that the findings
reported here will stimulate further discussions among scholars,
policymakers, and community leaders about how to meet the needs of an
increasingly diverse population and encourage positive social relations
within multi-ethnic communities.
65
Appendix A
Sample Design
Definition of the Target PopulationOur overall goal was to secure a sample of individuals of diverse
ethnic groups in the cities of Los Angeles and Oakland, California, who
had face-to-face contact with the law enforcement system in the past
year. The ideal method to obtain such a sample is to select a large
probability sample of the general population and then screen on the basis
of the desired characteristics. However, that would have been very costly
because the ethnic distributions of the two cities are quite uneven. Since
it is important to base the study on a probability sample, we decided to
use a dual frame approach, where one frame consists of exchanges
targeted for the ethnic group with the lowest proportion in the city, and
the other frame is the cross-section of the whole city. A linguistic
limitation of the target population should also be noted. The residents
of our designated cities are mostly English- or Spanish-speaking African
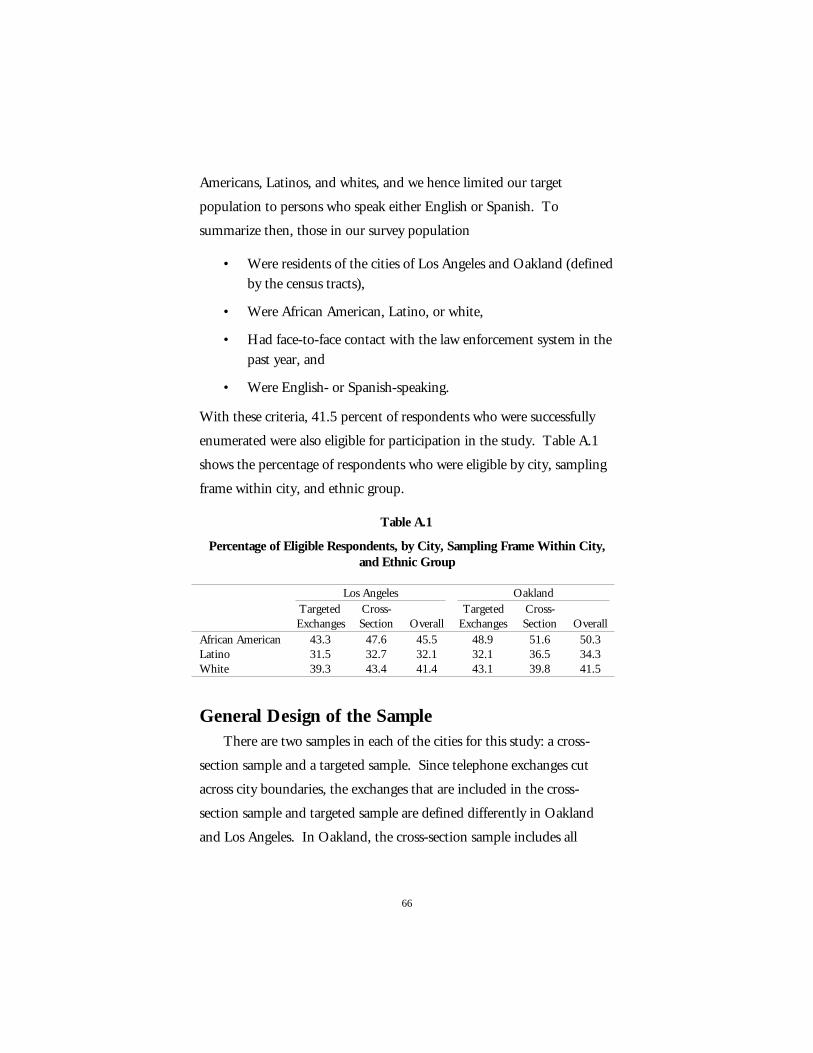
66
Americans, Latinos, and whites, and we hence limited our target
population to persons who speak either English or Spanish. To
summarize then, those in our survey population
• Were residents of the cities of Los Angeles and Oakland (definedby the census tracts),
• Were African American, Latino, or white,
• Had face-to-face contact with the law enforcement system in thepast year, and
• Were English- or Spanish-speaking.
With these criteria, 41.5 percent of respondents who were successfully
enumerated were also eligible for participation in the study. Table A.1
shows the percentage of respondents who were eligible by city, sampling
frame within city, and ethnic group.
Table A.1
Percentage of Eligible Respondents, by City, Sampling Frame Within City,and Ethnic Group
Los Angeles OaklandTargetedExchanges
Cross-Section Overall
TargetedExchanges
Cross-Section Overall
African American 43.3 47.6 45.5 48.9 51.6 50.3Latino 31.5 32.7 32.1 32.1 36.5 34.3White 39.3 43.4 41.4 43.1 39.8 41.5
General Design of the SampleThere are two samples in each of the cities for this study: a cross-
section sample and a targeted sample. Since telephone exchanges cut
across city boundaries, the exchanges that are included in the cross-
section sample and targeted sample are defined differently in Oakland
and Los Angeles. In Oakland, the cross-section sample includes all
67
telephone exchanges in the city of Oakland, at least 70 percent of whose
listed numbers fall within the city limits. This gives 99 percent coverage
for the city of Oakland. The targeted sample includes those exchanges
from the cross-section sample that have 15 percent or more Latinos
(determined by overlaying the exchanges with 1990 census statistics). In
Los Angeles, the cross-section sample includes all telephone exchanges in
the city of Los Angeles, at least 50 percent of whose listed numbers fall
within the city limits. This gives 92 percent coverage for the city of Los
Angeles. The targeted sample includes those exchanges from the cross-
section sample with 10 percent or more African Americans (determined
by overlaying the exchanges with 1990 census statistics).
Both samples of telephone numbers for this survey were generated
using a procedure called list-assisted random-digit sampling. This
recently developed methodology preserves the characteristics of a simple
random sample but takes advantage of the availability of large computer
databases of telephone directory information to make the sample more
efficient. This method allows us to reduce the number of unproductive
calls to nonworking telephone numbers and to obtain a higher
proportion of households in our sample than we would achieve by simple
random-digit dialing.
Briefly, the method works in the following way. All possible
telephone numbers in a set of area codes and exchanges are divided into
two strata—telephone numbers from a series of 100 numbers with no
residential listings in the telephone directories, and telephone numbers
from a series with at least one such listing. The sample of telephone
numbers to be included in a project is then generated with random
numbers, to include unlisted telephone numbers. Both samples for this
study are drawn exclusively from the stratum containing the series of
68
telephone numbers with at least one residential listing (for a detailed
description of this sampling method, see Casady and Lepkowski, 1993).
Field Outcome and Response RatesField Research Corporation conducted the screening process for this
project. The Survey Research Center (SRC), University of California,
Berkeley, conducted the in-depth interviews that followed the screening
interviews. The disposition of each telephone number and each eligible
person is summarized in this section. We account first for the selected
household and then for the eligible persons identified.
There were a total of 49,843 telephone numbers associated with our
target population. Of the eligible phone numbers (i.e., belonging to
households), 52.7 percent were successfully enumerated—that is, an
interviewer was able to determine whether any eligible persons resided
there and, if so, how many there were. Some households had more than
one person who was eligible for the interview. Only one eligible person
was selected for the interview. Of the selected persons, 25.2 percent
refused to let Field Research forward their names to SRC for the in-
depth interview. Of all cases forwarded to SRC, 21.1 percent either
refused or did not participate for some other reason; some of the latter
simply moved away before we could interview them. The remaining
78.9 percent completed the interview.
69
Appendix B
Verbatim Introductions to Interviews
The following are the statements made by interviewers when
introducing the two phases of the study to respondents.
Pre-Screening Interview
“Hello. I’m __________ from Field Research Corporation, a
national opinion research firm. We’re conducting a survey for the
University of California about the public’s attitudes toward different city
services, and particularly, attitudes toward law enforcement in your area.
The survey will take only a few minutes of your time and your responses
will be kept completely confidential.”
Main Interview“Hello. I’m __________ and I’m calling from the University of
California at Berkeley’s Survey Research Center. You may recall that you
70
recently told an interviewer from the Field Research Corporation that it
was okay for us to call you about a study we’re conducting for the
National Science Foundation and the Public Policy Institute of
California. It’s about people’s attitudes toward and personal experiences
with different city services. The interview usually takes about 30
minutes, but it can vary depending on how much you have to tell me.
At the end of the interview, we’ll send you a check for $10 as a thank you
for your time. The interview is completely voluntary, but we hope that
as many people as possible will agree to participate. If there are any
questions you’d rather not answer, just tell me and I’ll skip those. Most
people tell us that they enjoyed talking with us. Is this a convenient time
for us to begin?”
71
Appendix C
Summary of DemographicCharacteristics of the Sample
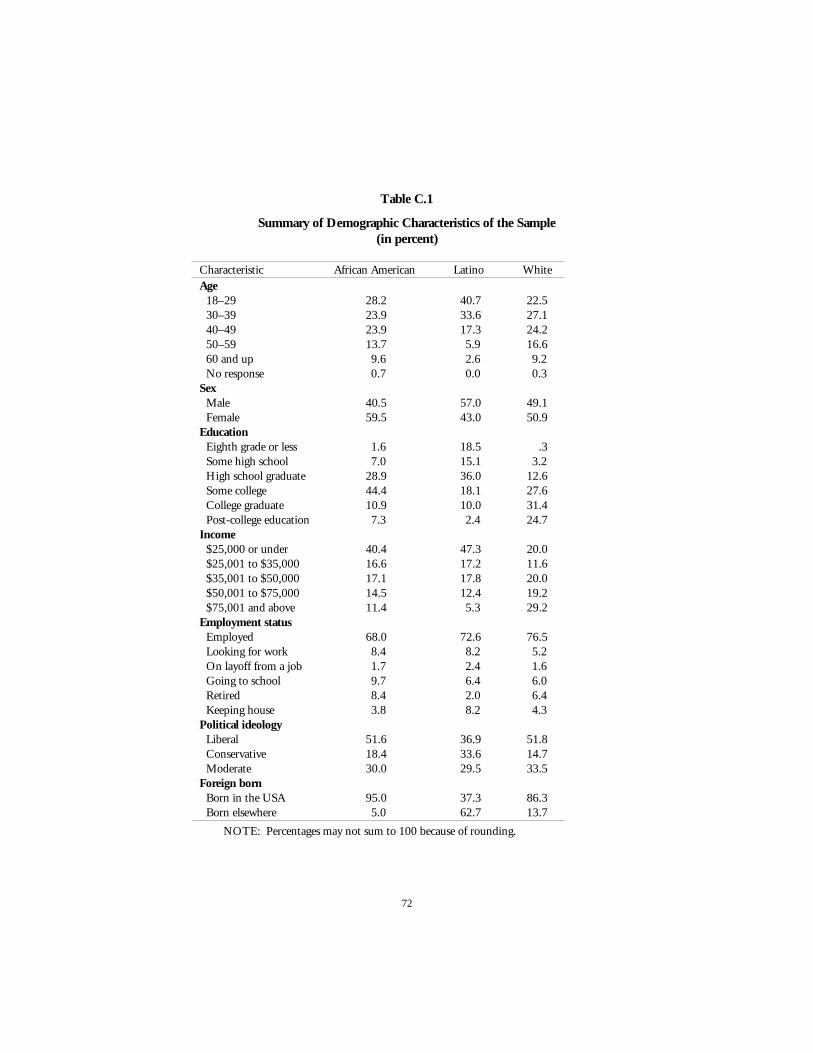
72
Table C.1
Summary of Demographic Characteristics of the Sample(in percent)
Characteristic African American Latino WhiteAge
18–29 28.2 40.7 22.530–39 23.9 33.6 27.140–49 23.9 17.3 24.250–59 13.7 5.9 16.660 and up 9.6 2.6 9.2No response 0.7 0.0 0.3
SexMale 40.5 57.0 49.1Female 59.5 43.0 50.9
EducationEighth grade or less 1.6 18.5 .3Some high school 7.0 15.1 3.2High school graduate 28.9 36.0 12.6Some college 44.4 18.1 27.6College graduate 10.9 10.0 31.4Post-college education 7.3 2.4 24.7
Income$25,000 or under 40.4 47.3 20.0$25,001 to $35,000 16.6 17.2 11.6$35,001 to $50,000 17.1 17.8 20.0$50,001 to $75,000 14.5 12.4 19.2$75,001 and above 11.4 5.3 29.2
Employment statusEmployed 68.0 72.6 76.5Looking for work 8.4 8.2 5.2On layoff from a job 1.7 2.4 1.6Going to school 9.7 6.4 6.0Retired 8.4 2.0 6.4Keeping house 3.8 8.2 4.3
Political ideologyLiberal 51.6 36.9 51.8Conservative 18.4 33.6 14.7Moderate 30.0 29.5 33.5
Foreign bornBorn in the USA 95.0 37.3 86.3Born elsewhere 5.0 62.7 13.7
NOTE: Percentages may not sum to 100 because of rounding.
73
Appendix D
Text of Survey Questions andSupplementary Statistics
Because there are unavoidable measurement errors associated with
subjective responses, we take the approach of combining responses to
multiple questions into a scale. Below, the verbatim questions that form
a scale are presented along with the scale’s alpha. Cronbach’s alpha is an
index measuring the reliability of a multi-item index (Judd, Smith, and
Kidder, 1991, pp. 51–53). It provides an indication of the internal
consistency of the items. A scale is internally consistent if responses to
items that measure the same construct follow a similar pattern. For
example, a scale of ethnic identity would be internally consistent if
people who say they are proud to be a member of their ethnic group also
say that being a member of their ethnic community is important to
them. An alpha of 0 indicates that the items have no joint correlation
and the scale has no internal consistency. An alpha of 1 indicates that
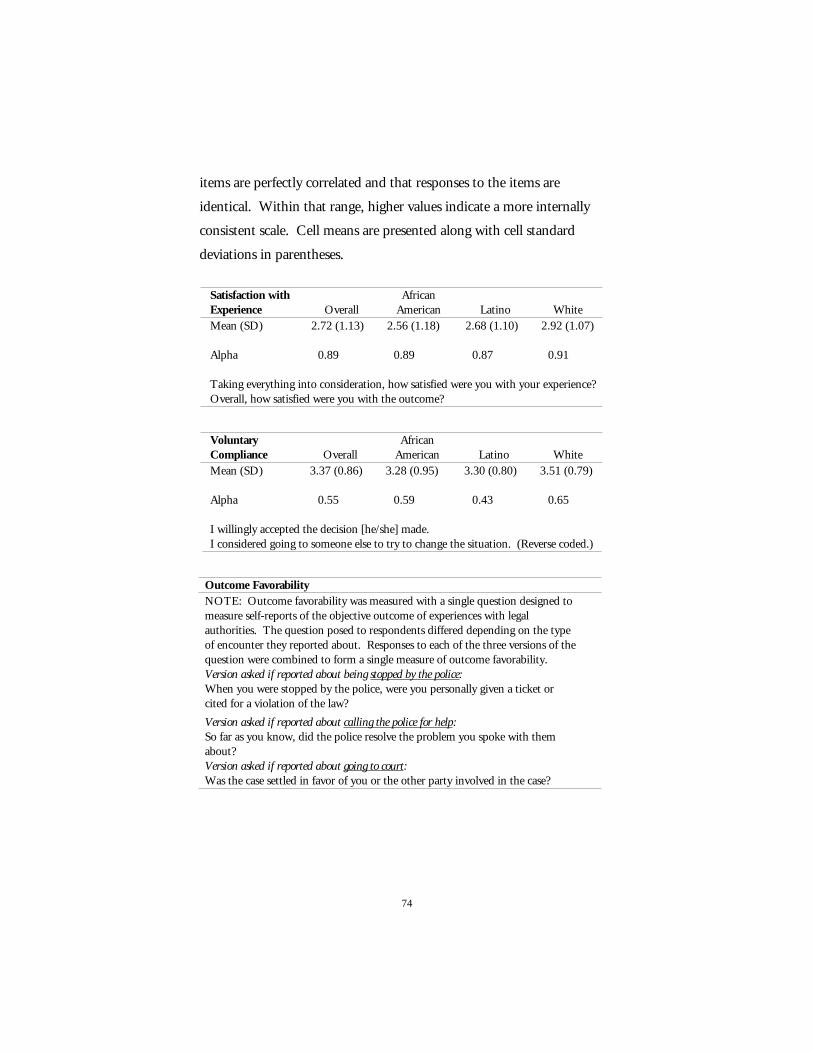
74
items are perfectly correlated and that responses to the items are
identical. Within that range, higher values indicate a more internally
consistent scale. Cell means are presented along with cell standard
deviations in parentheses.
Satisfaction withExperience Overall
AfricanAmerican Latino White
Mean (SD) 2.72 (1.13) 2.56 (1.18) 2.68 (1.10) 2.92 (1.07)
Alpha 0.89 0.89 0.87 0.91
Taking everything into consideration, how satisfied were you with your experience?Overall, how satisfied were you with the outcome?
VoluntaryCompliance Overall
AfricanAmerican Latino White
Mean (SD) 3.37 (0.86) 3.28 (0.95) 3.30 (0.80) 3.51 (0.79)
Alpha 0.55 0.59 0.43 0.65
I willingly accepted the decision [he/she] made.I considered going to someone else to try to change the situation. (Reverse coded.)
Outcome FavorabilityNOTE: Outcome favorability was measured with a single question designed tomeasure self-reports of the objective outcome of experiences with legalauthorities. The question posed to respondents differed depending on the typeof encounter they reported about. Responses to each of the three versions of thequestion were combined to form a single measure of outcome favorability.Version asked if reported about being stopped by the police:When you were stopped by the police, were you personally given a ticket orcited for a violation of the law?
Version asked if reported about calling the police for help:So far as you know, did the police resolve the problem you spoke with themabout?Version asked if reported about going to court:Was the case settled in favor of you or the other party involved in the case?
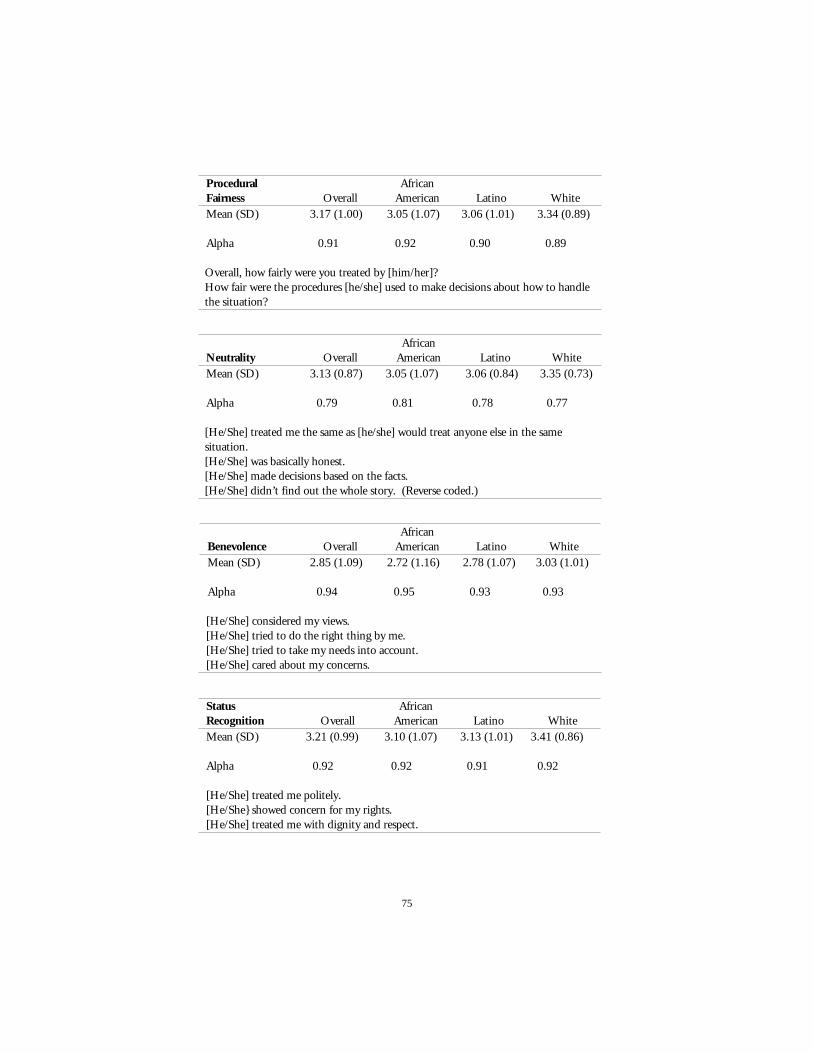
75
ProceduralFairness Overall
AfricanAmerican Latino White
Mean (SD) 3.17 (1.00) 3.05 (1.07) 3.06 (1.01) 3.34 (0.89)
Alpha 0.91 0.92 0.90 0.89
Overall, how fairly were you treated by [him/her]?How fair were the procedures [he/she] used to make decisions about how to handlethe situation?
Neutrality OverallAfrican
American Latino WhiteMean (SD) 3.13 (0.87) 3.05 (1.07) 3.06 (0.84) 3.35 (0.73)
Alpha 0.79 0.81 0.78 0.77
[He/She] treated me the same as [he/she] would treat anyone else in the samesituation.[He/She] was basically honest.[He/She] made decisions based on the facts.[He/She] didn’t find out the whole story. (Reverse coded.)
Benevolence OverallAfrican
American Latino WhiteMean (SD) 2.85 (1.09) 2.72 (1.16) 2.78 (1.07) 3.03 (1.01)
Alpha 0.94 0.95 0.93 0.93
[He/She] considered my views.[He/She] tried to do the right thing by me.[He/She] tried to take my needs into account.[He/She] cared about my concerns.
StatusRecognition Overall
AfricanAmerican Latino White
Mean (SD) 3.21 (0.99) 3.10 (1.07) 3.13 (1.01) 3.41 (0.86)
Alpha 0.92 0.92 0.91 0.92
[He/She] treated me politely.[He/She} showed concern for my rights.[He/She] treated me with dignity and respect.
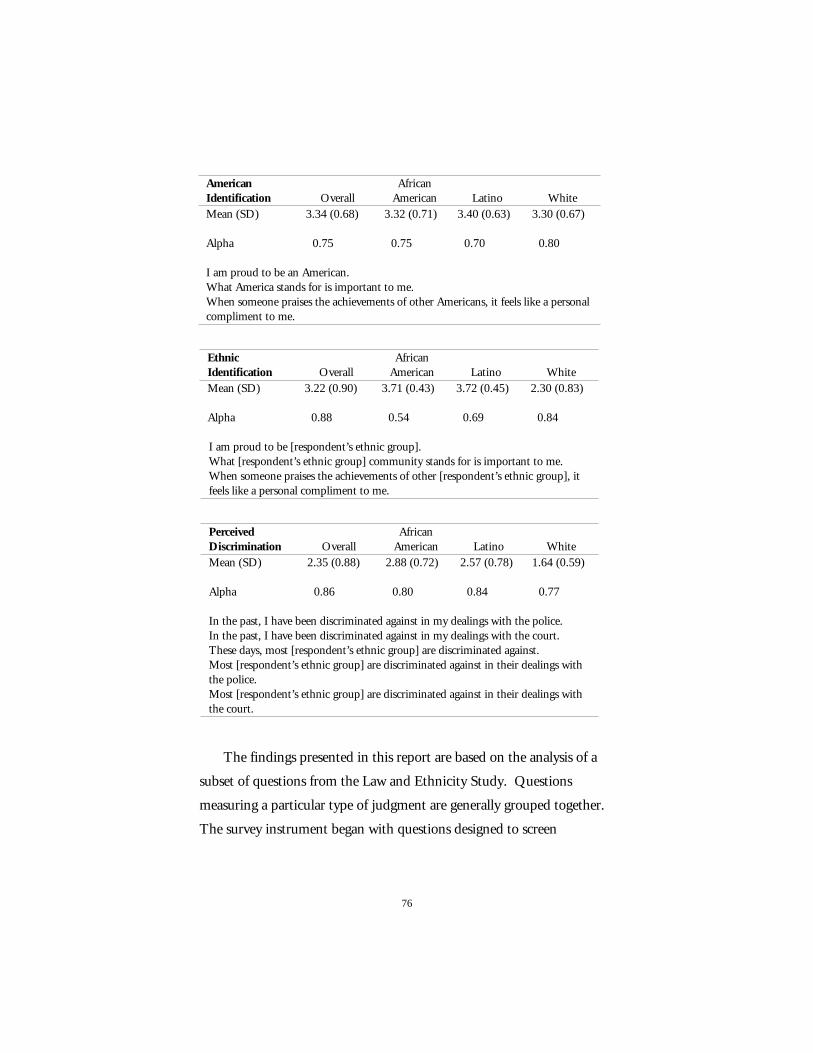
76
AmericanIdentification Overall
AfricanAmerican Latino White
Mean (SD) 3.34 (0.68) 3.32 (0.71) 3.40 (0.63) 3.30 (0.67)
Alpha 0.75 0.75 0.70 0.80
I am proud to be an American.What America stands for is important to me.When someone praises the achievements of other Americans, it feels like a personalcompliment to me.
EthnicIdentification Overall
AfricanAmerican Latino White
Mean (SD) 3.22 (0.90) 3.71 (0.43) 3.72 (0.45) 2.30 (0.83)
Alpha 0.88 0.54 0.69 0.84
I am proud to be [respondent’s ethnic group].What [respondent’s ethnic group] community stands for is important to me.When someone praises the achievements of other [respondent’s ethnic group], itfeels like a personal compliment to me.
PerceivedDiscrimination Overall
AfricanAmerican Latino White
Mean (SD) 2.35 (0.88) 2.88 (0.72) 2.57 (0.78) 1.64 (0.59)
Alpha 0.86 0.80 0.84 0.77
In the past, I have been discriminated against in my dealings with the police.In the past, I have been discriminated against in my dealings with the court.These days, most [respondent’s ethnic group] are discriminated against.Most [respondent’s ethnic group] are discriminated against in their dealings withthe police.Most [respondent’s ethnic group] are discriminated against in their dealings withthe court.
The findings presented in this report are based on the analysis of a
subset of questions from the Law and Ethnicity Study. Questions
measuring a particular type of judgment are generally grouped together.
The survey instrument began with questions designed to screen
77
respondents for eligibility followed by questions about views toward the
legal system. The major section of the survey included questions about
the specific encounter with legal authority that the respondent reported
about in the screening section. This section began with questions about
the outcome of the encounter, followed by questions about their
evaluations of their experience (e.g., satisfaction, compliance, and
procedural fairness). The last section of the survey included questions
about group identification and demographic characteristics.
79
Bibliography
Azzi, A., “From Competitive Interests, Perceived Injustice and IdentityNeeds to Collective Action: Psychological Mechanisms in EthnicNationalism,” in B. Kapferer (ed.), Nationalism, Ethnicity, andViolence, Oxford University Press, Oxford, UK, in press.
Baldassare, M. (ed.), The Los Angeles Riots: Lessons for the Urban Future,Westview Press, Boulder, CO, 1994.
Berry, J. W., U. Kim, S. Power, M. Young, and M. Bujaki,“Acculturation Attitudes in Plural Societies,” Applied Psychology: AnInternational Review, Vol. 38, 1989, pp. 185–206.
California Department of Finance, Projected Total Population ofCalifornia Counties: 1990 to 2040, Report 93 P-3, Sacramento, CA,1993.
Casady, R. J., and J. M. Lepkowski, “Stratified Telephone SurveyDesigns,” Survey Methodology, Vol. 19, 1993, pp. 103–113.
Cross, W. E., Jr., L. Clark, and P. Fhagen-Smith, “African AmericanIdentity Development Across the Life Span: EducationalImplications,” unpublished manuscript, 1998.
Dockson, R. R., Justice in the Balance: 2020, Commision on the Futureof the California Courts, Sacramento, CA, 1993.
80
Glazer, N., We Are All Multiculturalists Now, Harvard University Press,Cambridge, MA, 1997.
Homans, G. C., Social Behavior: Its Elementary Forms, (rev. ed.),Harcourt Brace Jovanovich, Inc., New York, 1974.
Huo, Y. J., and T. R. Tyler, “Ethnic Diversity and the Viability ofOrganizations: The Role of Procedural Justice in BridgingDifferences,” in J. Greenberg and R. Cropanzano, eds., Advances inOrganizational Justice, Stanford University Press, Palo Alto, in press.
Huo, Y. J., H. J. Smith, T. R. Tyler, and E. A. Lind, “SuperordinateIdentification, Subgroup Identification, and Justice Concerns: IsSeparatism the Problem; Is Assimilation the Answer?” PsychologicalScience, Vol. 7, 1996, pp. 40–45.
Judd, C. M., E. R. Smith, and L. H. Kidder, Research Methods in SocialRelations (6th ed.), Harcourt Brace Jovanovich College Publishers,Fort Worth, TX, 1991.
LaFromboise, T., H.L.K. Coleman, and J. Gerton, “PsychologicalImpact of Biculturalism: Evidence and Theory,” PsychologicalBulletin, Vol. 114, 1993, pp. 395–412.
Lind, E. A., Y. J. Huo, and T. R. Tyler, “And Justice for All: Ethnicity,Gender, and Preferences for Dispute Resolution Procedures,” Law andHuman Behavior, Vol. 18, 1994, pp. 269–290.
Lind, E. A., and T. R. Tyler, The Social Psychology of Procedural Justice,Plenum Press, New York, 1988.
Lind, E. A., T. R. Tyler, and Y. J. Huo, “Procedural Context andCulture: Variation in the Antecedents of Procedural JusticeJudgments,” Journal of Personality and Social Psychology, Vol. 73,1997, pp. 767–780.
Miller, J. G., and D. M. Bersoff, “Culture and Moral Judgment: HowAre Conflicts Between Justice and Interpersonal ResponsibilitiesResolved?” Journal of Personality and Social Psychology, Vol. 62, 1992,pp. 541–554.
81
Mohadjer, L., “Stratification of Prefix Areas for Sampling RarePopulations,” in R. M. Groves, P. P. Biemer, L. E. Lyberg, J. T.Massey, W. L. Nicholls II, and J. Waksberg (eds.), Telephone SurveyMethodology, John Wiley & Sons, New York, 1998.
Monahan, J., and L. Walker, Social Science in Law: Cases and Materials(3rd ed.), The Foundation Press, Inc., Westbury, NY, 1994.
Nader, L., and H. F. Todd, Jr. (eds.), The Disputing Process: Law in TenSocieties, Columbia University Press, New York, 1978.
Paternoster, R., R. Bachman, R. Brame, and L. W. Sherman, “Do FairProcedures Matter? The Effect of Procedural Justice on SpouseAssault,” Law and Society Review, Vol. 31, 1997, pp. 163–204.
Phinney, J. S., “Ethnic Identity in Adolescents and Adults: Review ofResearch,” Psychological Bulletin, Vol. 108, 1990, pp. 499–514.
Schlesinger, A. M., Jr., The Disuniting of America: Reflections on aMulticultural Society, W. W. Norton & Company, Inc., New York,1992.
Sears, D. O., and J. B. McConahay, The Politics of Violence: The NewUrban Blacks and the Watts Riot, Houghton Mifflin, Boston, MA,1973.
Smith, H. J., and T. R. Tyler, “Justice and Power: When Will JusticeConcerns Encourage the Advantaged to Support Policies WhichRedistribute Economic Resources and the Disadvantaged to WillinglyObey the Law?” European Journal of Social Psychology, Vol. 26, 1996,pp. 171–200.
Steinberg, S., The Ethnic Myth: Race, Ethnicity, and Class in America,Atheneum, New York, 1981.
Sugawara, I., and Y. J. Huo, “Disputes in Japan: A Cross-Cultural Testof the Procedural Justice Model,” Social Justice Research, Vol. 7, 1994,pp. 129–144.
Thibaut, J., and L. Walker, Procedural Justice: A Psychological Analysis,Erlbaum, Hillsdale, NJ, 1975.
82
Tyler, T. R., “The Psychology of Procedural Justice: A Test of theGroup Value Model,” Journal of Personality and Social Psychology, Vol.57, 1989, pp. 830–838.
Tyler, T. R., Why People Obey the Law: Procedural Justice, Legitimacy andCompliance, Yale University Press, New Haven, CT, 1990.
Tyler, T. R., R. J. Boeckmann, H. J. Smith, and Y. J. Huo, Social Justicein a Diverse Society,Westview Press, Boulder, CO, 1997.
Tyler, T. R., and E. A. Lind, “A Relational Model of Authority inGroups,” in M. Zanna (ed.), Advances in Experimental SocialPsychology, Vol. 25, 1992, pp. 115–191.
Tyler, T. R., E. A. Lind, K. Ohbuchi, K. Sugawara, and Y. J. Huo,“Conflicts with Outsiders: Disputing Within and Across CulturalBoundaries,” Personality and Social Psychology Bulletin, Vol. 24, 1998,pp. 137–146.
Walters, G. B., Final Report: Ninth Circuit Task Force on Racial,Religious, and Ethnic Fairness, Ninth Circuit Court Task Force onRacial, Religious, and Ethnic Fairness, San Francisco, CA, 1997.
83
About the Authors
YUEN J. HUO
Yuen J. Huo is an assistant professor of psychology at the Universityof California, Los Angeles. A social psychologist, her research interestsinclude social relations in ethnically diverse environments, authorityrelations, and conflict resolution. Her publications on these topics haveappeared in numerous journals and books. Before joining the UCLAfaculty, she was a research fellow at PPIC. Her research was recognizedby the Society for the Psychological Study of Social Issues’ OttoKlineberg International and Intercultural Award. She holds B.A., M.A.,and Ph.D. degrees from the University of California, Berkeley.
TOM R. TYLER
Tom R. Tyler is a professor in the psychology department at NewYork University. He has held academic positions at NorthwesternUniversity and the University of California, Berkeley. He is currently avisiting scholar at the Russell-Sage Foundation in New York City. Hisresearch explores the exercise of authority in legal, political, andmanagerial groups. In particular, he has been concerned with theinfluence of diversity on authority relations in groups. He holds a Ph.D.from the University of California, Los Angeles.