Embed Size (px)
Citation preview
Table of Contents
UNITED STATES SECURITIES AND EXCHANGE COMMISSION
Washington, D.C. 20549
FORM 10-Q
(Mark One) ⌧ QUARTERLY REPORT PURSUANT TO SECTION 13 OR 15(d)
OF THE SECURITIES EXCHANGE ACT OF 1934
For the quarterly period ended September 30, 2012
OR
TRANSITION REPORT PURSUANT TO SECTION 13 OR 15(d) OF THE SECURITIES EXCHANGE ACT OF 1934
For the transition period from _____ to _____
Commission File Number: 1-11884
ROYAL CARIBBEAN CRUISES LTD. (Exact name of registrant as specified in its charter)
1050 Caribbean Way, Miami, Florida 33132
(Address of principal executive offices) (zip code)
(305) 539-6000 (Registrant’s telephone number, including area code)
N/A
(Former name, former address and former fiscal year, if changed since last report)
Indicate by check mark whether the registrant (1) has filed all reports required to be filed by Section 13 or 15(d) of the Securities Exchange Act of 1934 during the preceding 12 months (or for such shorter period that the registrant was required to file such reports), and (2) has been subject to such filing requirements for the past 90 days. Yes ⌧ No
Indicate by check mark whether the registrant has submitted electronically and posted on its corporate Web site, if any, every
Interactive Data File required to be submitted and posted pursuant to Rule 405 of Regulation S-T (§232.405 of this chapter) during the preceding 12 months (or for such shorter period that the registrant was required to submit and post such files). Yes ⌧ No
Indicate by check mark whether the registrant is a large accelerated filer, an accelerated filer, a non-accelerated filer, or a smaller reporting company. See the definitions of “large accelerated filer,” “accelerated filer” and “smaller reporting company” in Rule 12b-2 of the Exchange Act.
(Do not check if a smaller reporting company)
Indicate by check mark whether the registrant is a shell company (as defined in Rule 12b-2 of the Exchange Act). Yes No ⌧
There were 218,100,633 shares of common stock outstanding as of October 17, 2012.
Republic of Liberia
98-0081645
(State or other jurisdiction of incorporation or organization) (I.R.S. Employer Identification No.)
Large accelerated filer ⌧ Accelerated filer Non-accelerated filer Smaller reporting company
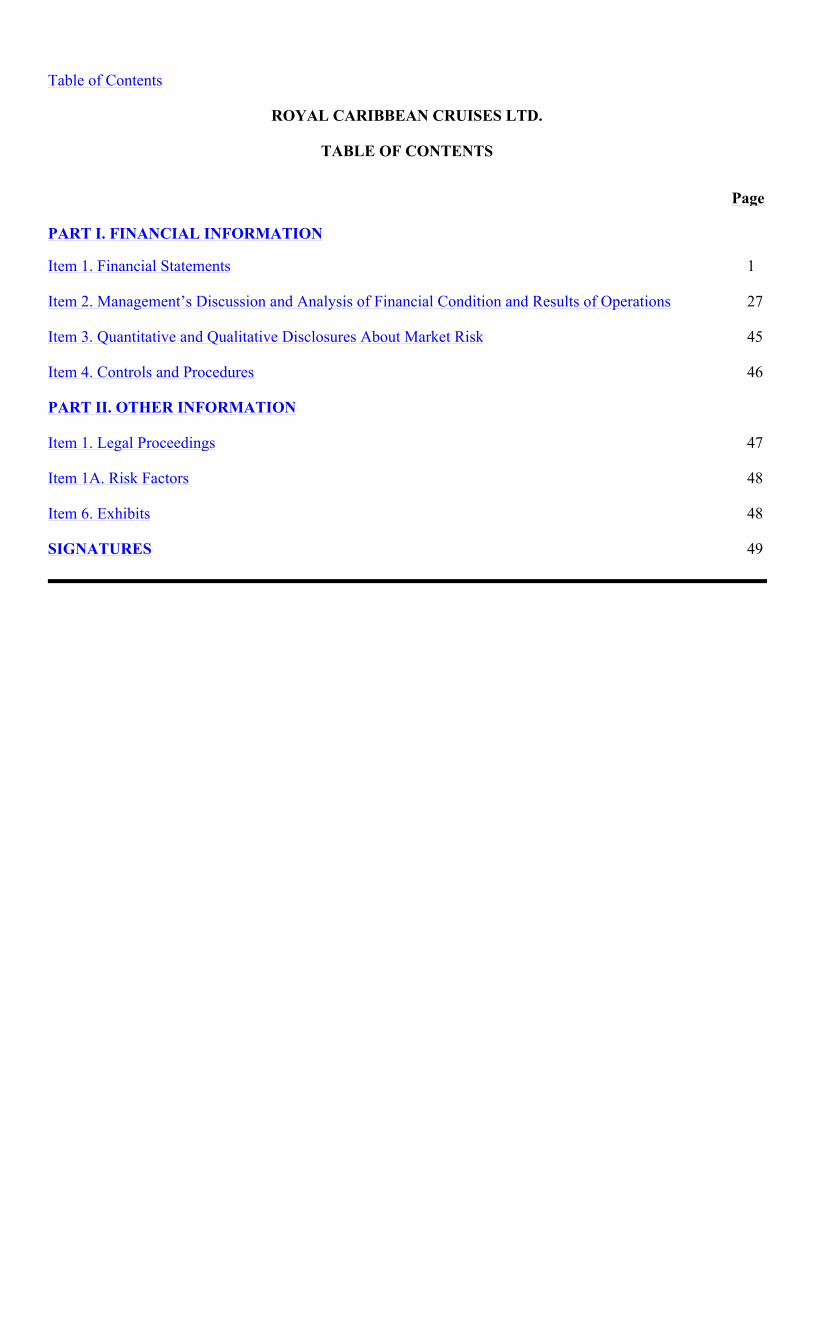
Table of Contents
ROYAL CARIBBEAN CRUISES LTD.
TABLE OF CONTENTS
Page PART I. FINANCIAL INFORMATION
Item 1. Financial Statements
1 Item 2. Management’s Discussion and Analysis of Financial Condition and Results of Operations
27 Item 3. Quantitative and Qualitative Disclosures About Market Risk
45 Item 4. Controls and Procedures
46 PART II. OTHER INFORMATION
Item 1. Legal Proceedings 47 Item 1A. Risk Factors 48 Item 6. Exhibits
48 SIGNATURES
49
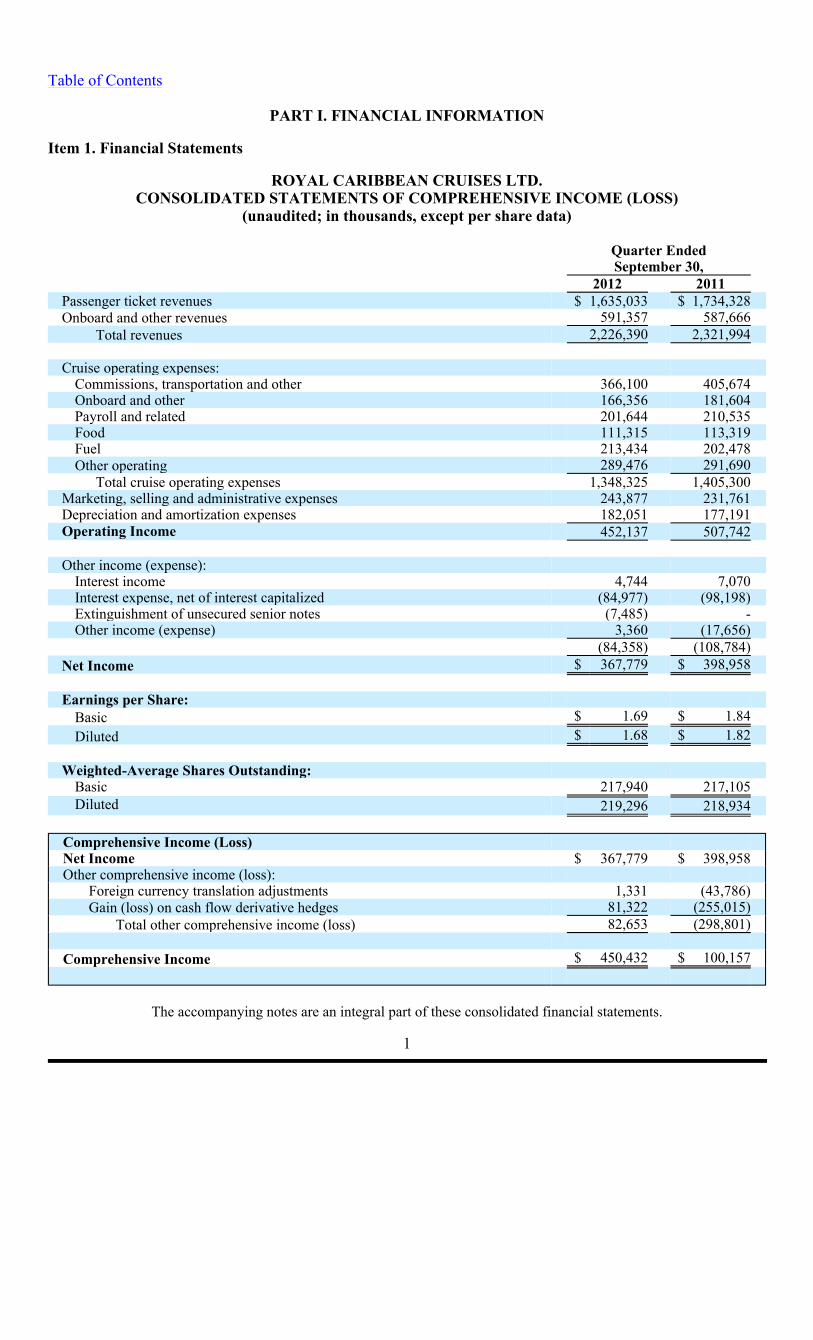
Table of Contents
PART I. FINANCIAL INFORMATION
Item 1. Financial Statements
ROYAL CARIBBEAN CRUISES LTD. CONSOLIDATED STATEMENTS OF COMPREHENSIVE INCOME (LOSS)
(unaudited; in thousands, except per share data)
The accompanying notes are an integral part of these consolidated financial statements.
1
Quarter EndedSeptember 30,
2012 2011Passenger ticket revenues $ 1,635,033
$ 1,734,328Onboard and other revenues
591,357 587,666
Total revenues
2,226,390 2,321,994
Cruise operating expenses:
Commissions, transportation and other 366,100
405,674Onboard and other
166,356 181,604
Payroll and related
201,644 210,535
Food
111,315 113,319
Fuel
213,434 202,478
Other operating 289,476 291,690
Total cruise operating expenses
1,348,325 1,405,300
Marketing, selling and administrative expenses 243,877 231,761
Depreciation and amortization expenses
182,051 177,191
Operating Income
452,137 507,742
Other income (expense):
Interest income 4,744
7,070Interest expense, net of interest capitalized (84,977)
(98,198)Extinguishment of unsecured senior notes
(7,485) -
Other income (expense) 3,360 (17,656)
(84,358) (108,784)
Net Income
$ 367,779 $ 398,958
Earnings per Share:
Basic
$ 1.69 $ 1.84
Diluted
$ 1.68 $ 1.82
Weighted-Average Shares Outstanding:
Basic
217,940 217,105
Diluted
219,296 218,934
Comprehensive Income (Loss)
Net Income
$ 367,779 $ 398,958
Other comprehensive income (loss):
Foreign currency translation adjustments
1,331 (43,786)
Gain (loss) on cash flow derivative hedges
81,322 (255,015)
Total other comprehensive income (loss)
82,653 (298,801)
Comprehensive Income
$ 450,432 $ 100,157
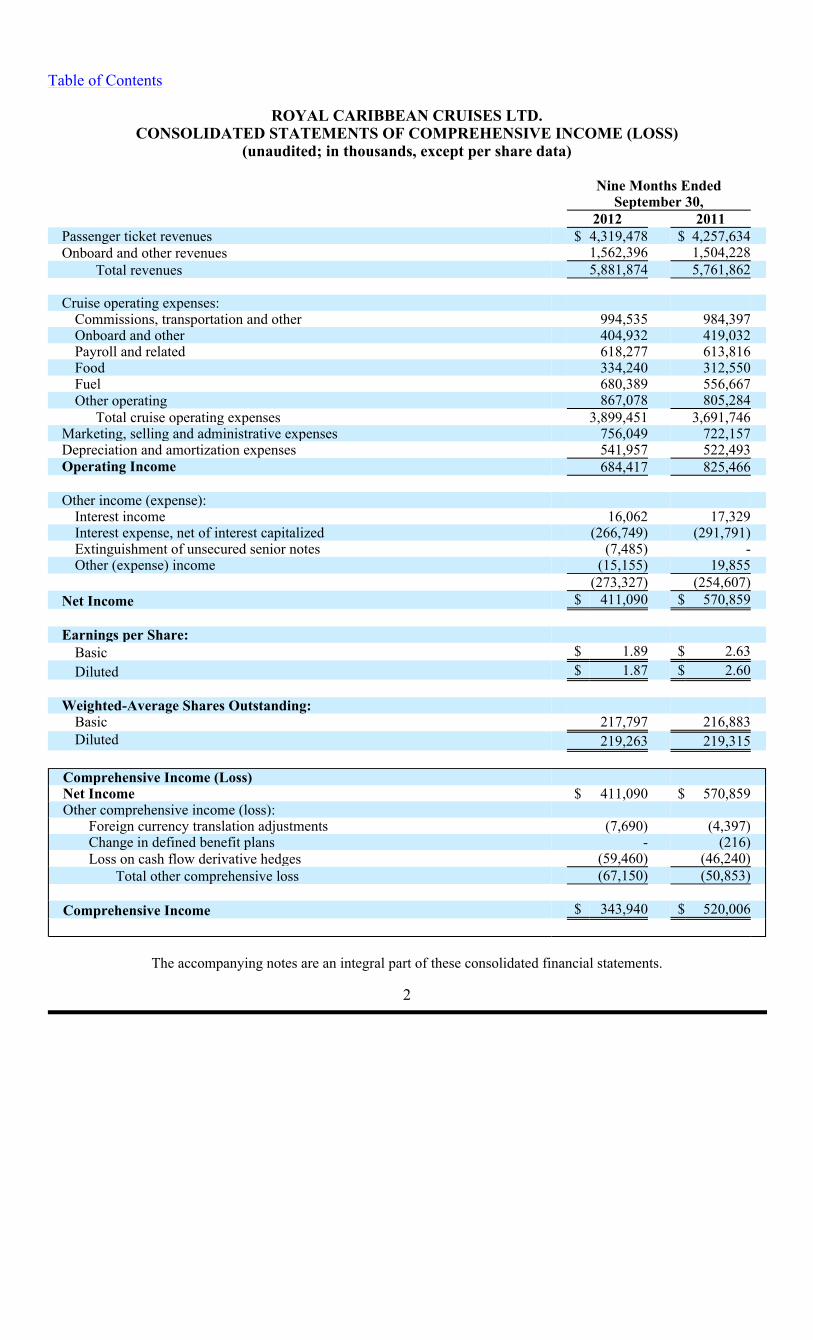
Table of Contents
ROYAL CARIBBEAN CRUISES LTD. CONSOLIDATED STATEMENTS OF COMPREHENSIVE INCOME (LOSS)
(unaudited; in thousands, except per share data)
The accompanying notes are an integral part of these consolidated financial statements.
2
Nine Months Ended September 30,
2012
2011
Passenger ticket revenues
$ 4,319,478 $ 4,257,634
Onboard and other revenues 1,562,396 1,504,228
Total revenues
5,881,874 5,761,862
Cruise operating expenses:
Commissions, transportation and other
994,535 984,397
Onboard and other
404,932 419,032
Payroll and related
618,277 613,816
Food
334,240 312,550
Fuel
680,389 556,667
Other operating
867,078 805,284
Total cruise operating expenses 3,899,451 3,691,746
Marketing, selling and administrative expenses
756,049 722,157
Depreciation and amortization expenses 541,957 522,493
Operating Income
684,417 825,466
Other income (expense):
Interest income
16,062 17,329
Interest expense, net of interest capitalized
(266,749) (291,791)
Extinguishment of unsecured senior notes
(7,485) -
Other (expense) income
(15,155) 19,855
(273,327) (254,607)
Net Income
$ 411,090 $ 570,859
Earnings per Share:
Basic
$ 1.89 $ 2.63
Diluted $ 1.87 $ 2.60
Weighted-Average Shares Outstanding:
Basic
217,797 216,883
Diluted 219,263 219,315
Comprehensive Income (Loss)
Net Income $ 411,090
$ 570,859Other comprehensive income (loss):
Foreign currency translation adjustments (7,690)
(4,397)Change in defined benefit plans -
(216)Loss on cash flow derivative hedges (59,460)
(46,240)Total other comprehensive loss
(67,150) (50,853)
Comprehensive Income
$ 343,940 $ 520,006
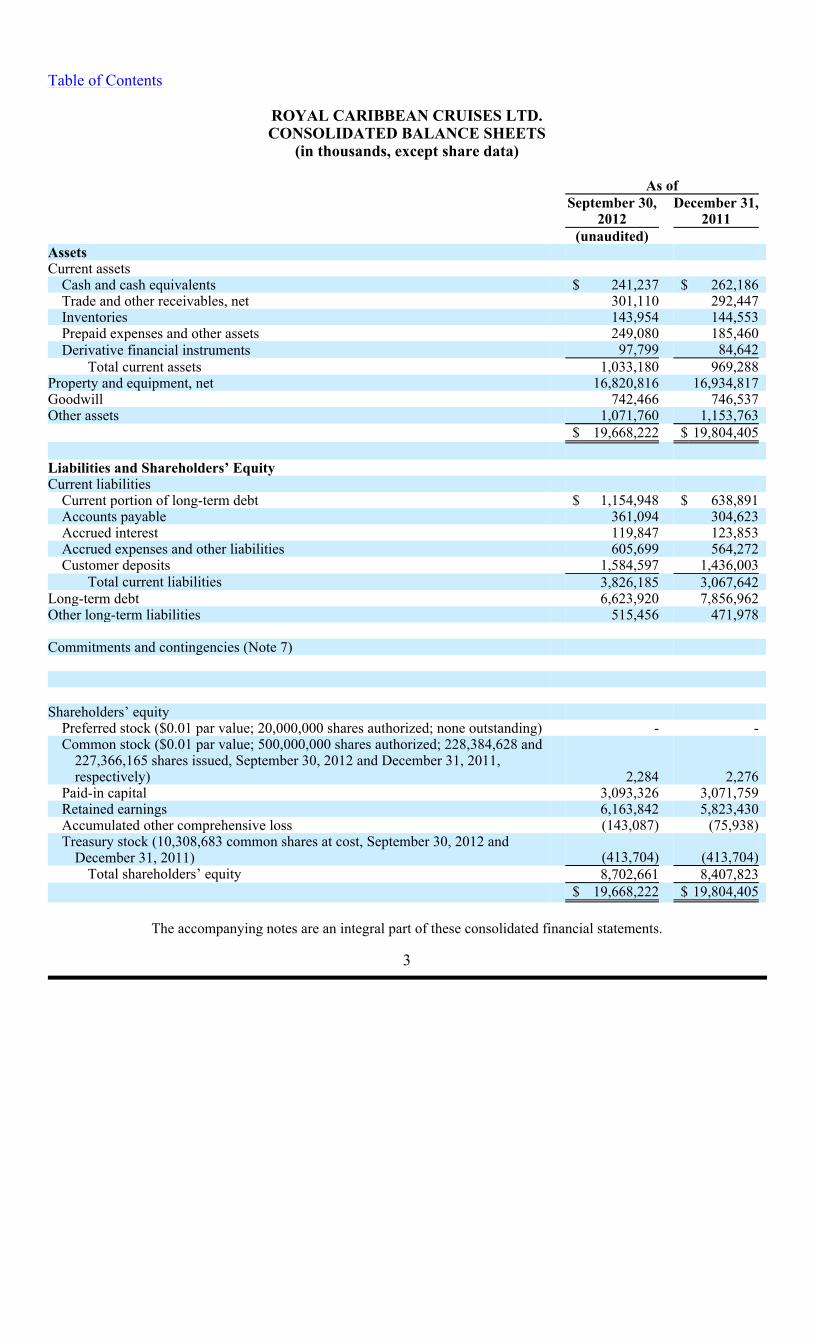
Table of Contents
ROYAL CARIBBEAN CRUISES LTD. CONSOLIDATED BALANCE SHEETS
(in thousands, except share data)
The accompanying notes are an integral part of these consolidated financial statements.
3
As of
September 30,
December 31,
2012
2011
(unaudited) Assets
Current assets
Cash and cash equivalents
$ 241,237
$ 262,186
Trade and other receivables, net
301,110
292,447
Inventories
143,954
144,553
Prepaid expenses and other assets
249,080
185,460
Derivative financial instruments
97,799
84,642
Total current assets 1,033,180 969,288Property and equipment, net 16,820,816 16,934,817Goodwill 742,466 746,537Other assets 1,071,760 1,153,763 $ 19,668,222 $ 19,804,405 Liabilities and Shareholders’ Equity
Current liabilities
Current portion of long-term debt
$ 1,154,948
$ 638,891
Accounts payable
361,094
304,623
Accrued interest
119,847
123,853
Accrued expenses and other liabilities
605,699
564,272
Customer deposits
1,584,597
1,436,003
Total current liabilities 3,826,185 3,067,642Long-term debt 6,623,920 7,856,962Other long-term liabilities
515,456
471,978
Commitments and contingencies (Note 7)
Shareholders’ equity
Preferred stock ($0.01 par value; 20,000,000 shares authorized; none outstanding)
-
-
Common stock ($0.01 par value; 500,000,000 shares authorized; 228,384,628 and 227,366,165 shares issued, September 30, 2012 and December 31, 2011, respectively)
2,284
2,276
Paid-in capital
3,093,326
3,071,759
Retained earnings
6,163,842
5,823,430
Accumulated other comprehensive loss
(143,087)
(75,938)
Treasury stock (10,308,683 common shares at cost, September 30, 2012 and December 31, 2011)
(413,704)
(413,704)
Total shareholders’ equity
8,702,661
8,407,823
$ 19,668,222
$ 19,804,405
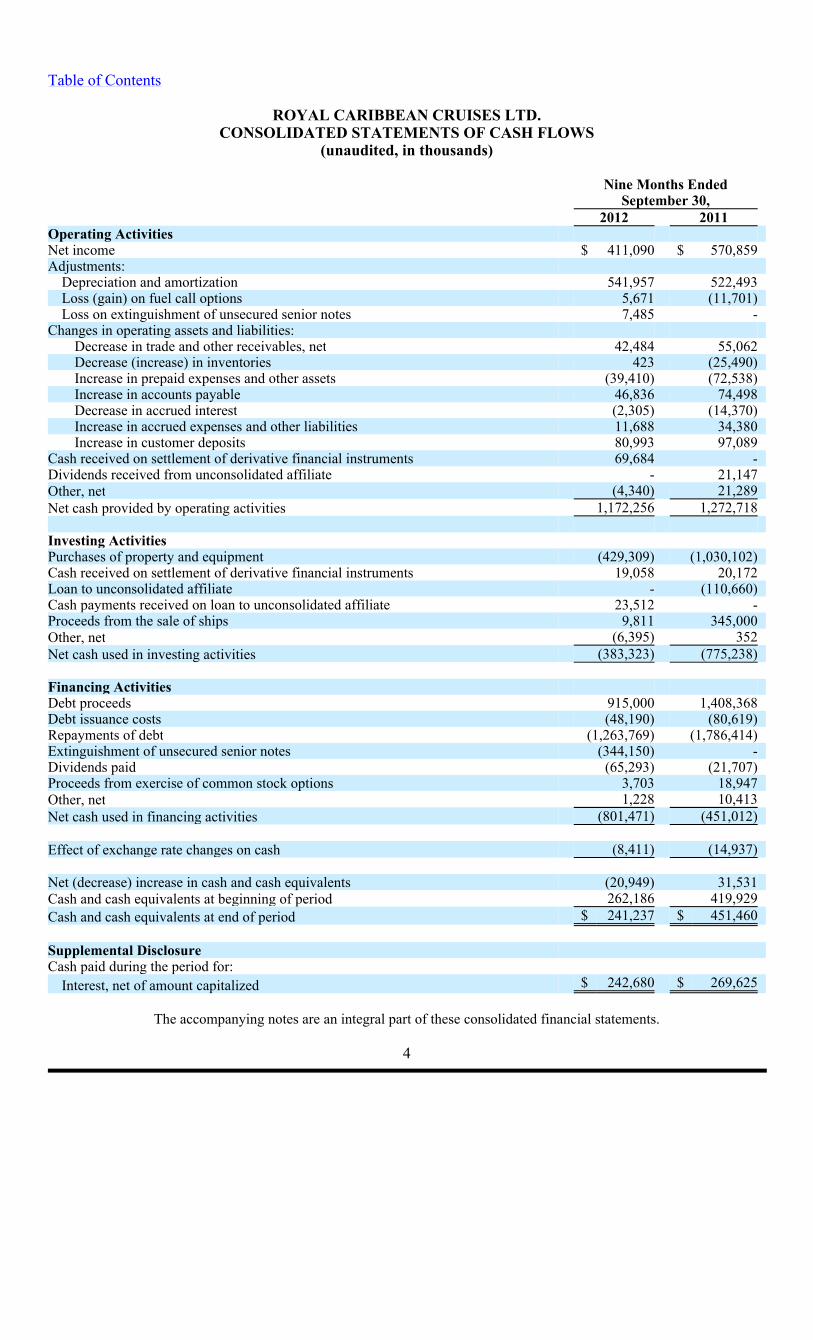
Table of Contents
ROYAL CARIBBEAN CRUISES LTD. CONSOLIDATED STATEMENTS OF CASH FLOWS
(unaudited, in thousands)
The accompanying notes are an integral part of these consolidated financial statements.
4
Nine Months Ended
September 30, 2012 2011Operating Activities Net income $ 411,090 $ 570,859Adjustments:
Depreciation and amortization 541,957 522,493Loss (gain) on fuel call options
5,671
(11,701)
Loss on extinguishment of unsecured senior notes
7,485
-
Changes in operating assets and liabilities:
Decrease in trade and other receivables, net
42,484
55,062
Decrease (increase) in inventories
423
(25,490)
Increase in prepaid expenses and other assets
(39,410)
(72,538)
Increase in accounts payable
46,836
74,498
Decrease in accrued interest (2,305) (14,370)Increase in accrued expenses and other liabilities 11,688 34,380Increase in customer deposits 80,993 97,089
Cash received on settlement of derivative financial instruments 69,684 -Dividends received from unconsolidated affiliate - 21,147Other, net (4,340) 21,289Net cash provided by operating activities
1,172,256
1,272,718
Investing Activities
Purchases of property and equipment
(429,309)
(1,030,102)
Cash received on settlement of derivative financial instruments
19,058
20,172
Loan to unconsolidated affiliate - (110,660)Cash payments received on loan to unconsolidated affiliate 23,512 -Proceeds from the sale of ships 9,811 345,000Other, net (6,395) 352Net cash used in investing activities
(383,323)
(775,238)
Financing Activities
Debt proceeds
915,000
1,408,368
Debt issuance costs
(48,190)
(80,619)
Repayments of debt
(1,263,769)
(1,786,414)
Extinguishment of unsecured senior notes (344,150) -Dividends paid (65,293) (21,707)Proceeds from exercise of common stock options 3,703 18,947Other, net 1,228 10,413Net cash used in financing activities
(801,471)
(451,012)
Effect of exchange rate changes on cash
(8,411)
(14,937)
Net (decrease) increase in cash and cash equivalents (20,949) 31,531Cash and cash equivalents at beginning of period 262,186 419,929Cash and cash equivalents at end of period
$ 241,237
$ 451,460
Supplemental Disclosure Cash paid during the period for:
Interest, net of amount capitalized $ 242,680 $ 269,625
Table of Contents
ROYAL CARIBBEAN CRUISES LTD. NOTES TO THE CONSOLIDATED FINANCIAL STATEMENTS
(unaudited)
As used in this quarterly report on Form 10-Q, the terms “Royal Caribbean,” the “Company,” “we,” “our” and “us” refer to Royal Caribbean Cruises Ltd. and, depending on the context, Royal Caribbean Cruises Ltd.’s consolidated subsidiaries and/or affiliates. The terms “Royal Caribbean International,” “Celebrity Cruises,” “Pullmantur,” “Azamara Club Cruises”, “CDF Croisières de France” and “TUI Cruises” refer to our cruise brands. In accordance with cruise vacation industry practice, the term “berths” is determined based on double occupancy per cabin even though many cabins can accommodate three or more passengers. This report shouldbe read in conjunction with our annual report on Form 10-K for the year ended December 31, 2011, includingthe audited consolidated financial statements and related notes included therein. Note 1. General Description of Business
We are a global cruise company. We own Royal Caribbean International, Celebrity Cruises, Pullmantur,Azamara Club Cruises, CDF Croisières de France as well as TUI Cruises (our 50% joint venture).
Basis for Preparation of Consolidated Financial Statements
The unaudited consolidated financial statements are prepared in accordance with accounting principlesgenerally accepted in the United States of America (“GAAP”). Estimates are required for the preparation of financial statements in accordance with these principles. Actual results could differ from these estimates. SeeNote 2. Summary of Significant Accounting Policies in this quarterly report on Form 10-Q and in our annual report on Form 10-K for the year ended December 31, 2011 for a discussion of our significant accountingpolicies.
All significant intercompany accounts and transactions are eliminated in consolidation. We consolidate
entities over which we have control, usually evidenced by a direct ownership interest of greater than 50% andvariable interest entities where we are determined to be the primary beneficiary. See Note 6. Goodwill and Other Assets for further information regarding our variable interest entities. For affiliates we do not control but overwhich we have significant influence on financial and operating policies, usually evidenced by a direct ownershipinterest from 20% to 50%, the investment is accounted for using the equity method. We consolidate theoperating results of Pullmantur and its wholly-owned brand, CDF Croisières de France, on a two-month lag to allow for more timely preparation of our consolidated financial statements. No material events or transactionsaffecting Pullmantur or CDF Croisières de France have occurred during the two-month lag period of August2012 and September 2012 that would require disclosure or adjustment to our consolidated financial statements asof September 30, 2012.
We believe the accompanying unaudited consolidated financial statements contain all normal recurring
accruals necessary for a fair statement. Our revenues are seasonal and results for interim periods are notnecessarily indicative of results for the entire year.
5
Table of Contents
Note 2. Summary of Significant Accounting Policies Stock-Based Employee Compensation
In February 2012, we redesigned our long-term incentive award program and began to grant performanceshares to our officers in lieu of stock options. Under our prior program, our officers received a combination ofstock options and restricted stock units. Beginning in February 2012, our officers instead receive their long-term incentive awards through a combination of performance shares and restricted stock units. Each performanceshare award is expressed as a target number of performance shares based upon the fair market value of ourcommon stock on the date the award is issued. The actual number of shares underlying each award (not toexceed 200% of the target number of performance shares) will be determined based upon the Company’s achievement of a specified performance target range. For the grants made in February 2012, the performancetarget is diluted earnings per share (“EPS”) for the year ended December 31, 2012, as adjusted by theCompensation Committee of our Board of Directors for events that are outside of management’s control. In February 2012, we issued a target number of 327,240 performance shares which will vest on the thirdanniversary of the award issue date.
We estimate the fair value of each performance share when the grant is authorized and the related service
period has commenced. We remeasure the fair value of each of our performance shares in each subsequentreporting period until the grant date has occurred, which represents the date when the performance conditions aresatisfied. We recognize compensation cost over the vesting period based on the probability of the service andperformance requirements being achieved over the vesting period adjusted for each subsequent fair valuemeasurement. If the specified service and performance requirements are not met, compensation expense will notbe recognized and any previously recognized compensation expense will be reversed.
For further information on our significant accounting policies, refer to our annual report on Form 10-K for the
year ended December 31, 2011. Recently Adopted Accounting Standards
In January 2012, we adopted authoritative guidance issued in 2011, the purpose of which was to achieve consistent fair value measurements and to clarify certain disclosure requirements for fair value measurements.The guidance includes clarification about when the concept of highest and best use is applicable to fair valuemeasurements, requires quantitative disclosures about inputs used and qualitative disclosures about thesensitivity of recurring Level 3 measurements, and requires the classification of all assets and liabilities measuredat fair value in the fair value hierarchy, including those assets and liabilities which are not recorded at fair valuebut for which fair value is disclosed. The adoption of this guidance did not have a material impact on ourconsolidated financial statements. See Note 9. Fair Value Measurements and Derivative Instruments for our disclosures required under this guidance.
In January 2012, we adopted authoritative guidance issued in 2011 on the presentation of comprehensive
income which requires an entity to present components of net income and other comprehensive income in onecontinuous statement, referred to as the statement of comprehensive income, or in two separate but consecutivestatements. The new guidance eliminates the option to report other comprehensive income and its components inthe statement of changes in equity. We elected to present this information using one continuous statement. Seeour consolidated statements of comprehensive income (loss) above.
6
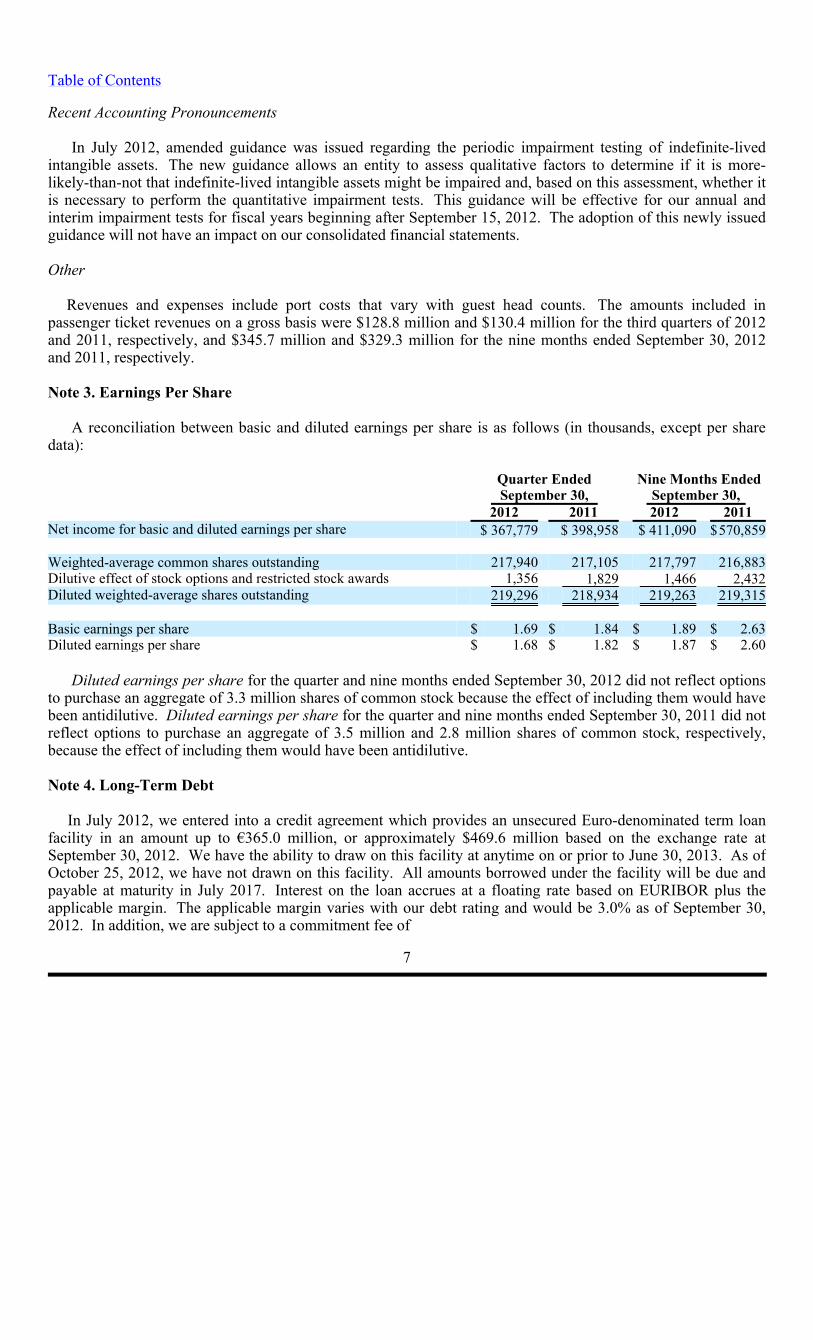
Table of Contents
Recent Accounting Pronouncements
In July 2012, amended guidance was issued regarding the periodic impairment testing of indefinite-lived intangible assets. The new guidance allows an entity to assess qualitative factors to determine if it is more-likely-than-not that indefinite-lived intangible assets might be impaired and, based on this assessment, whether itis necessary to perform the quantitative impairment tests. This guidance will be effective for our annual andinterim impairment tests for fiscal years beginning after September 15, 2012. The adoption of this newly issuedguidance will not have an impact on our consolidated financial statements.
Other
Revenues and expenses include port costs that vary with guest head counts. The amounts included in passenger ticket revenues on a gross basis were $128.8 million and $130.4 million for the third quarters of 2012and 2011, respectively, and $345.7 million and $329.3 million for the nine months ended September 30, 2012and 2011, respectively.
Note 3. Earnings Per Share
A reconciliation between basic and diluted earnings per share is as follows (in thousands, except per sharedata):
Diluted earnings per share for the quarter and nine months ended September 30, 2012 did not reflect options
to purchase an aggregate of 3.3 million shares of common stock because the effect of including them would havebeen antidilutive. Diluted earnings per share for the quarter and nine months ended September 30, 2011 did notreflect options to purchase an aggregate of 3.5 million and 2.8 million shares of common stock, respectively,because the effect of including them would have been antidilutive.
Note 4. Long-Term Debt
In July 2012, we entered into a credit agreement which provides an unsecured Euro-denominated term loan facility in an amount up to €365.0 million, or approximately $469.6 million based on the exchange rate atSeptember 30, 2012. We have the ability to draw on this facility at anytime on or prior to June 30, 2013. As ofOctober 25, 2012, we have not drawn on this facility. All amounts borrowed under the facility will be due andpayable at maturity in July 2017. Interest on the loan accrues at a floating rate based on EURIBOR plus theapplicable margin. The applicable margin varies with our debt rating and would be 3.0% as of September 30,2012. In addition, we are subject to a commitment fee of
7
Quarter Ended Nine Months Ended
September 30, September 30,
2012
2011 2012
2011Net income for basic and diluted earnings per share
$ 367,779
$ 398,958 $ 411,090
$570,859 Weighted-average common shares outstanding
217,940
217,105 217,797
216,883Dilutive effect of stock options and restricted stock awards
1,356
1,829 1,466
2,432Diluted weighted-average shares outstanding
219,296
218,934
219,263
219,315 Basic earnings per share
$ 1.69
$ 1.84 $ 1.89
$ 2.63Diluted earnings per share $ 1.68 $ 1.82
$ 1.87 $ 2.60
Table of Contents
1.05% per annum of the undrawn amount. We anticipate the proceeds from this loan facility will be usedprimarily as part of our refinancing strategy for our bond maturities in 2013 and 2014. In connection withentering into this facility, we prepaid our $100.0 million unsecured floating rate term loan due September 2013.
In August 2012, we borrowed $290.0 million under an unsecured term loan. All amounts borrowed under the
facility will be due and payable at maturity in February 2016. Interest on the loan accrues at a floating rate basedon LIBOR plus the applicable margin. The applicable margin varies with our debt rating and was 2.5% as ofSeptember 30, 2012. The proceeds of this loan were used to reduce outstanding balances on our revolving creditfacilities.
During the first nine months of 2012, we increased the capacity of our revolving credit facility due July 2016
by $233.0 million, bringing our total capacity under this facility to $1.1 billion as of September 30, 2012. Wealso have a revolving credit facility due November 2014 with capacity of $525.0 million as of September 30,2012, giving us aggregate revolving borrowing capacity of $1.6 billion.
In September 2012, we repurchased €255.0 million or approximately $328.0 million in aggregate principal
amount of our €1.0 billion 5.625% unsecured senior notes due 2014 through a debt tender offer conductedoutside of the United States. Total consideration paid in connection with the tender offer, including premiumand related fees and expenses was $344.2 million. The repurchase of the unsecured senior notes resulted in aloss on the early extinguishment of debt of approximately $7.5 million which was recognized in earningsimmediately and is reported within extinguishment of unsecured senior notes in our consolidated statement of comprehensive income (loss).
Certain of our unsecured ship financing term loans are guaranteed by the export credit agency in the
respective country in which the ship is constructed. In consideration for these guarantees, depending on thefinancing arrangement, we pay to the applicable export credit agency fees that range from either (1) 0.88% to1.48% per annum based on the outstanding loan balance semi-annually over the term of the loan (subject to adjustment in certain of our facilities based upon our credit ratings) or (2) an upfront fee of approximately 2.3%to 2.37% of the maximum loan amount. We amortize the fees that are paid upfront over the life of the loan andthose that are paid semi-annually over each respective payment period. We classify these fees within Debt issuance costs in our consolidated statement of cash flows and within Other Assets in our consolidated balancesheets.
Under certain of our agreements, the contractual interest rate, facility fee and/or export credit agency fee vary
with our debt rating. Note 5. Property and Equipment
During the second quarter of 2012, Pullmantur delivered Ocean Dream to an unrelated third party as part of a six year bareboat charter agreement. The charter agreement provides a renewal option exercisable by theunrelated third party for an additional four years. The charter agreement constitutes an operating lease andcharter revenue is being recognized on a straight-line basis over the six year charter term. The charter revenuerecognized during the second and third quarters of 2012 was not material to our results of operations.
8
Table of Contents Note 6. Goodwill and Other Assets
During the fourth quarter of 2011, we performed our annual analysis to determine if the goodwill for the Pullmantur reporting unit was impaired. We estimated the fair value of the Pullmantur reporting unit using aprobability-weighted discounted cash flow model. The principal assumptions used in the discounted cash flowmodel were projected operating results, weighted-average cost of capital, and terminal value. Significantlyimpacting these assumptions were the anticipated future transfer of vessels from our other cruise brands toPullmantur. For example, during the first quarter of 2012, we announced the redeployment of Monarch of the Seas from Royal Caribbean International to Pullmantur. The redeployment is expected to occur in April 2013.The discounted cash flow model used our 2012 projected operating results as a base. To that base we addedfuture years’ cash flows assuming multiple revenue and expense scenarios that reflect the impact on Pullmantur’s reporting unit of different global economic environments beyond 2012. We assigned a probability to eachrevenue and expense scenario. On December 31, 2011, the estimated fair value of the Pullmantur reporting unitexceeded its carrying value.
We also performed the annual impairment review of our trademarks and trade names during the fourthquarter of 2011 using a discounted cash flow model and the relief-from-royalty method. The royalty rate used was based on comparable royalty agreements in the tourism and hospitality industry. These trademarks and tradenames relate to Pullmantur and we have used the same discount rate used in valuing the Pullmantur reportingunit in our goodwill impairment test. Based on the discounted cash flow model as of December 31, 2011, wedetermined the fair value of our trademarks and trade names exceeded their carrying value.
We continue to monitor economic events in Spain for their potential impact on Pullmantur’s business and valuation. These events continue to reinforce the uncertainty and fragility of the Spanish economy. However,based on our most recent projections we do not believe an interim impairment evaluation of Pullmantur’s goodwill or trademarks and trade names is warranted as of September 30, 2012. We will evaluate theseintangible assets for potential impairment during our annual impairment test scheduled for the fourth quarter of2012.
The estimation of fair value utilizing discounted expected future cash flows includes numerous uncertainties
which require significant judgment when making assumptions of expected revenues, operating costs, marketing,selling and administrative expenses, interest rates, ship additions and retirements as well as assumptionsregarding the cruise vacation industry’s competitive environment and general economic and business conditions,among other factors. Pullmantur is a brand targeted primarily at the Spanish, Portuguese and Latin Americanmarkets. European economies continue to demonstrate instability in light of heightened concerns over sovereigndebt issues as well as the impact that proposed austerity measures will have on certain markets. The Spanisheconomy has been more severely impacted than many other economies around the world where we operate andthere is significant uncertainty as to whether or when it will recover. In addition, the Costa Concordia incidenthas had a negative impact on Pullmantur’s earnings to date in 2012 and the impact in future years is uncertain. If the Spanish economy weakens further or recovers more slowly than contemplated in our discounted cash flowmodel, if there are relatively modest changes to our projected future cash flows used in the impairment analyses,especially in Net Yields, or if certain transfers of vessels from our other cruise brands to the Pullmantur fleet donot take place, it is reasonably possible that an impairment charge of Pullmantur’s reporting unit’s goodwill, trademarks and trade name may be required.
9
Table of Contents
The factors influencing the Spanish economy and Pullmantur’s operating cash flows discussed above could also affect the recoverability of Pullmantur’s deferred tax assets. As of September 30, 2012, Pullmantur haddeferred tax assets of €25.4 million, or approximately $32.7 million based on the exchange rate at September 30,2012, resulting from previous net operating losses. We regularly review deferred tax assets for recoverabilitybased on our history of earnings, expectations for future earnings, and tax planning strategies. We believe it ismore-likely-than-not that we will recover the deferred tax assets based on our expectation of future earnings andimplementation of tax planning strategies. Realization of deferred tax assets ultimately depends on the existenceof sufficient taxable income to support the amount of deferred tax assets. It is possible we may need to establisha valuation allowance for a portion or all of the deferred tax asset balance if future earnings do not meetexpectations or we are unable to successfully implement our tax planning strategies. Variable Interest Entities
A Variable Interest Entity (“VIE”) is an entity in which the equity investors have not provided enough equityto finance the entity’s activities or the equity investors (1) cannot directly or indirectly make decisions about theentity’s activities through their voting rights or similar rights; (2) do not have the obligation to absorb theexpected losses of the entity; (3) do not have the right to receive the expected residual returns of the entity; or (4)have voting rights that are not proportionate to their economic interests and the entity’s activities involve or are conducted on behalf of an investor with a disproportionately small voting interest.
We have determined that Grand Bahama Shipyard Ltd. (“Grand Bahama”), a ship repair and maintenance facility in which we have a 40% noncontrolling interest, is a VIE. The facility serves cruise and cargo ships, oiland gas tankers, and offshore units. We utilize this facility, among other ship repair facilities, for our regularlyscheduled drydocks and certain emergency repairs as may be required. We have determined we are not theprimary beneficiary of this facility, as we do not have the power to direct the activities that most significantlyimpact the facility’s economic performance. Accordingly, we do not consolidate this entity and we account forthis investment under the equity method of accounting. As of September 30, 2012 and December 31, 2011, thenet book value of our investment in Grand Bahama, including equity and loans, was approximately $59.3 millionand $61.4 million, respectively, which is also our maximum exposure to loss as we are not contractually requiredto provide any financial or other support to the facility. The majority of our loans to Grand Bahama are in non-accrual status. During the first nine months of 2012, we received approximately $5.1 million in principal andinterest payments related to loans that are in accrual status from Grand Bahama and recorded income associatedwith our investment in Grand Bahama. We monitor credit risk associated with these loans through ourparticipation on Grand Bahama’s board of directors along with our review of Grand Bahama’s financial statements and projected cash flows. Based on this review, we believe the risk of loss associated with theseloans was remote as of September 30, 2012.
In conjunction with our acquisition of Pullmantur in 2006, we obtained a 49% noncontrolling interest in
Pullmantur Air, S.A. (“Pullmantur Air”), a small air business that operates four aircrafts in support ofPullmantur’s operations. We have determined Pullmantur Air is a VIE for which we are the primary beneficiaryas we have the power to direct the activities that most significantly impact its economic performance and we areobligated to absorb its losses. In accordance with authoritative guidance, we have consolidated the assets and liabilities of Pullmantur Air. We do not separately disclose the assets and liabilities of Pullmantur Air as they areimmaterial to our September 30, 2012 and December 31, 2011 consolidated financial statements.
10
Table of Contents
We have determined that TUI Cruises GmbH, our 50%-owned joint venture which operates the brand TUICruises, is a VIE. As of September 30, 2012 and December 31, 2011, our investment in TUI Cruises, includingequity and loans, was approximately $273.3 million and $282.0 million, respectively, and the majority of thisamount was included within other assets in our consolidated balance sheets. In addition, in conjunction with oursale of Celebrity Mercury to TUI Cruises in 2011, we and TUI AG each guaranteed the repayment of 50% of an€180.0 million 5-year bank loan provided to TUI Cruises (refer to further details below). This investmentamount and the potential obligations under this guarantee are substantially our maximum exposure to loss. Wehave determined that we are not the primary beneficiary of TUI Cruises. We believe that the power to direct theactivities that most significantly impact TUI Cruises’ economic performance are shared between ourselves andour joint venture partner, TUI AG. All the significant operating and financial decisions of TUI Cruises requirethe consent of both parties which we believe creates shared power over TUI Cruises. Accordingly, we do notconsolidate this entity and account for this investment under the equity method of accounting.
In connection with our sale of Celebrity Mercury to TUI Cruises in 2011, we provided a debt facility to TUICruises in the amount of up to €90.0 million. The outstanding principal amount of the facility as of September30, 2012 was €68.6 million, or approximately $88.2 million based on the exchange rate at September 30, 2012.The loan bears interest at the rate of 9.54% per annum, is payable over seven years, is 50% guaranteed by TUIAG (our joint venture partner) and is secured by second mortgages on both of TUI Cruises’ ships, Mein Schiff 1and Mein Schiff 2. In addition, we and TUI AG each guaranteed the repayment of 50% of an €180.0 million 5-year bank loan provided to TUI Cruises, of which €157.5 million, or approximately $203.0 million based on theexchange rate at September 30, 2012, remains outstanding as of September 30, 2012, in connection with the saleof the ship. The bank loan amortizes quarterly and is secured by first mortgages on both Mein Schiff 1 and Mein Schiff 2. Based on current facts and circumstances, we do not believe potential obligations under this guaranteeare probable.
During 2011, TUI Cruises entered into a construction agreement with STX Finland to build its first newbuild ship, scheduled for delivery in the second quarter of 2014. TUI Cruises has entered into a credit agreement forfinancing of up to 80% of the contract price of the ship. The remaining portion of the contract price of the shipwill be funded through either TUI Cruises’ cash flows from operations or loans and/or equity contributions fromus and TUI AG. The construction agreement includes certain restrictions on each of our and TUI AG’s ability to reduce our current ownership interest in TUI Cruises below 37.5% through the construction period. In addition,the credit agreement extends this restriction through 2019. TUI Cruises has an option to construct a second shipof the same class which will expire on October 31, 2012. Note 7. Commitments and Contingencies Capital Expenditures
During the first quarter of 2012, we exercised our option under the agreement with Meyer Werft to construct a second Project Sunshine ship with approximately 4,100 berths which is expected to enter service in the secondquarter of 2015. During 2011, we entered into credit agreements to finance the construction of the first andsecond Project Sunshine ships. Each facility makes available to us unsecured term loans in an amount up to theUnited States dollar equivalent corresponding to approximately €595.0 million. 50% of the facility for the second ship remains subject to syndication prior to funding. Euler Hermes Kreditversicherungs AG (“Hermes”), the official export credit agency of Germany, has agreed to guarantee to the lenders payment of 95% of thefinancing. The loans will amortize semi-annually and will mature 12 years following delivery of the applicableship. Pursuant to
11
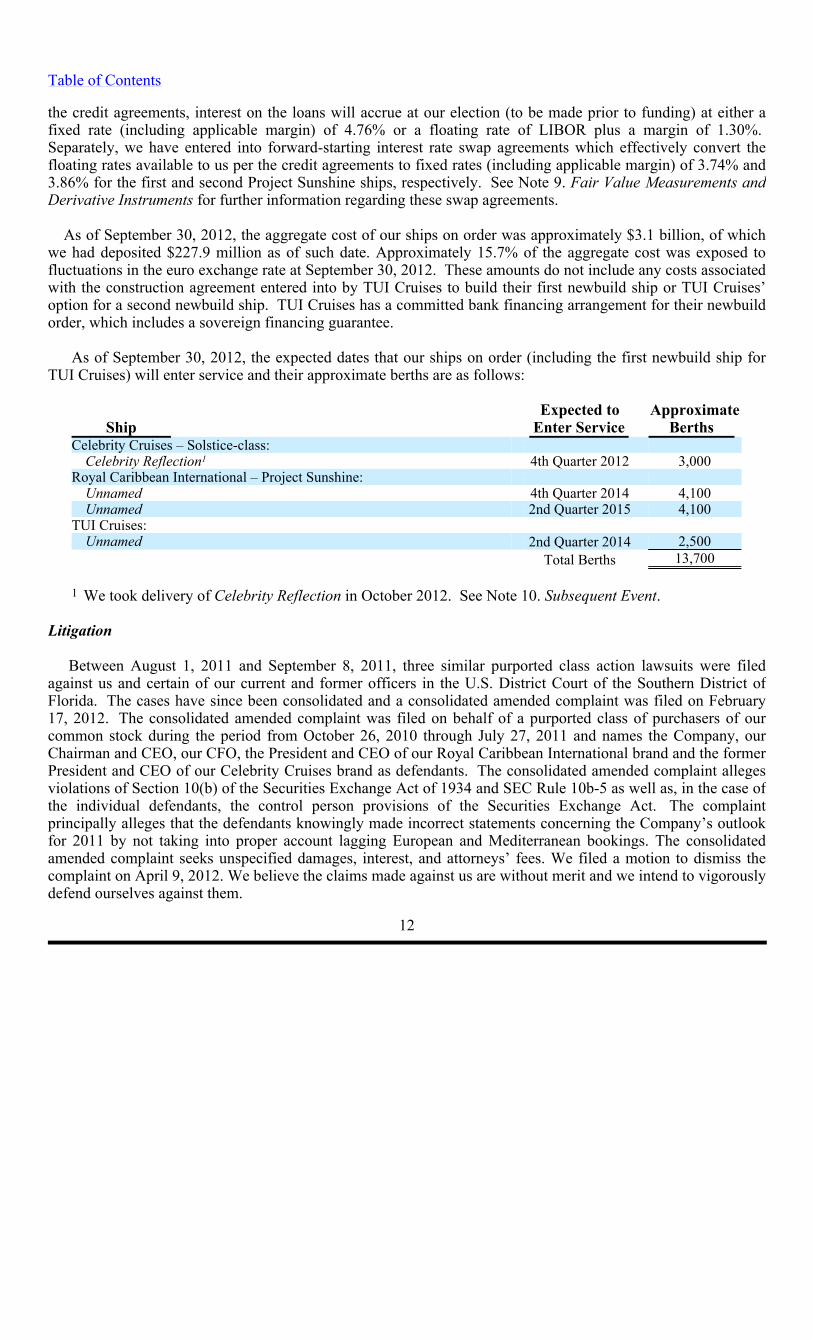
Table of Contents
the credit agreements, interest on the loans will accrue at our election (to be made prior to funding) at either afixed rate (including applicable margin) of 4.76% or a floating rate of LIBOR plus a margin of 1.30%. Separately, we have entered into forward-starting interest rate swap agreements which effectively convert thefloating rates available to us per the credit agreements to fixed rates (including applicable margin) of 3.74% and3.86% for the first and second Project Sunshine ships, respectively. See Note 9. Fair Value Measurements and Derivative Instruments for further information regarding these swap agreements.
As of September 30, 2012, the aggregate cost of our ships on order was approximately $3.1 billion, of which
we had deposited $227.9 million as of such date. Approximately 15.7% of the aggregate cost was exposed tofluctuations in the euro exchange rate at September 30, 2012. These amounts do not include any costs associatedwith the construction agreement entered into by TUI Cruises to build their first newbuild ship or TUI Cruises’ option for a second newbuild ship. TUI Cruises has a committed bank financing arrangement for their newbuildorder, which includes a sovereign financing guarantee.
As of September 30, 2012, the expected dates that our ships on order (including the first newbuild ship forTUI Cruises) will enter service and their approximate berths are as follows:
We took delivery of Celebrity Reflection in October 2012. See Note 10. Subsequent Event. Litigation
Between August 1, 2011 and September 8, 2011, three similar purported class action lawsuits were filedagainst us and certain of our current and former officers in the U.S. District Court of the Southern District ofFlorida. The cases have since been consolidated and a consolidated amended complaint was filed on February17, 2012. The consolidated amended complaint was filed on behalf of a purported class of purchasers of ourcommon stock during the period from October 26, 2010 through July 27, 2011 and names the Company, ourChairman and CEO, our CFO, the President and CEO of our Royal Caribbean International brand and the formerPresident and CEO of our Celebrity Cruises brand as defendants. The consolidated amended complaint allegesviolations of Section 10(b) of the Securities Exchange Act of 1934 and SEC Rule 10b-5 as well as, in the case ofthe individual defendants, the control person provisions of the Securities Exchange Act. The complaintprincipally alleges that the defendants knowingly made incorrect statements concerning the Company’s outlook for 2011 by not taking into proper account lagging European and Mediterranean bookings. The consolidatedamended complaint seeks unspecified damages, interest, and attorneys’ fees. We filed a motion to dismiss the complaint on April 9, 2012. We believe the claims made against us are without merit and we intend to vigorouslydefend ourselves against them.
12
Expected to Approximate
Ship
Enter Service
Berths
Celebrity Cruises – Solstice-class:
Celebrity Reflection
4th Quarter 2012 3,000
Royal Caribbean International – Project Sunshine:
Unnamed
4th Quarter 2014 4,100
Unnamed
2nd Quarter 2015 4,100
TUI Cruises:
Unnamed
2nd Quarter 2014 2,500
Total Berths 13,700
1
1
Table of Contents
A class action complaint was filed in June 2011 against Royal Caribbean Cruises Ltd. in the United StatesDistrict Court for the Southern District of Florida on behalf of a purported class of stateroom attendantsemployed onboard Royal Caribbean International cruise vessels alleging that they were required to pay othercrew members to help with their duties in violation of the U.S. Seaman’s Wage Act. The lawsuit also alleges that certain stateroom attendants were required to work back of house assignments without the ability to earngratuities in violation of the U.S. Seaman’s Wage Act. Plaintiffs seek judgment for damages, wage penalties andinterest in an indeterminate amount. In May 2012, the Court granted our motion to dismiss the complaint on thebasis that the applicable collective bargaining agreement requires any such claims to be arbitrated. Plaintiff’s appeal of this decision was dismissed for lack of jurisdiction by the United States Court of Appeals, 11 Circuit. We believe the claims made against us are without merit and we intend to vigorously defend ourselves againstthem.
We commenced an action in June 2010 in the United States District Court for Puerto Rico seeking a
declaratory judgment that Puerto Rico’s distributorship laws do not apply to our relationship with aninternational representative located in Puerto Rico. In September 2010, that international representative filed anumber of counterclaims against Royal Caribbean Cruises Ltd. and Celebrity Cruises Inc. alleging violations ofPuerto Rico’s distributorship laws, bad faith breach of contract, tortious interference with contract, violations ofvarious federal and state antitrust and unfair competition laws. In August 2012, the parties settled their disputesand dismissed their respective claims with prejudice. The impact of the settlement is immaterial to our results ofoperations and financial condition.
Because of the inherent uncertainty as to the outcome of the proceedings described above, we are unable atthis time to estimate the possible impact of these matters on us.
We are routinely involved in other claims typical within the cruise vacation industry. The majority of theseclaims are covered by insurance. We believe the outcome of such claims, net of expected insurance recoveries,will not have a material adverse impact on our financial condition or results of operations and cash flows. Other
In July 2002, we entered into an operating lease denominated in British pound sterling for the Brilliance of the Seas. The lease payments vary based on sterling LIBOR. The lease has a contractual life of 25 years; however, both the lessor and we have certain rights to cancel the lease at year 18 (i.e. 2020) upon advance notice given approximately one year prior to cancellation. In the event of early termination at year 18, we have the option to cause the sale of the vessel at its fair value and to use the proceeds towards the applicable termination payment. Alternatively, we could opt at such time to make a termination payment of approximately ₤66.8 million, or approximately $107.9 million based on the exchange rate at September 30, 2012, and relinquish our right to cause the sale of the vessel. Under current circumstances we do not believe early termination of this lease is probable.
Under the Brilliance of the Seas operating lease, we have agreed to indemnify the lessor to the extent its
after-tax return is negatively impacted by unfavorable changes in corporate tax rates, capital allowancedeductions and certain unfavorable determinations which may be made by United Kingdom tax authorities.These indemnifications could result in an increase in our lease payments. We are unable to estimate themaximum potential increase in our lease payments due to the various circumstances, timing or a combination ofevents that could trigger such indemnifications. The United Kingdom tax authorities are disputing the lessor’s accounting treatment of the lease and the lessor and tax authorities are in discussions on the matter. If thecharacterization of the lease is ultimately determined to be
13
th
Table of Contents
incorrect, we could be required to indemnify the lessor under certain circumstances. The lessor has advised usthat they believe their characterization of the lease is correct. Based on the foregoing and our review of availableinformation, we do not believe an indemnification payment is probable. However, if the lessor loses its disputeand we are required to indemnify the lessor, we cannot at this time predict the impact that such an occurrencewould have on our financial condition and results of operations.
Some of the contracts that we enter into include indemnification provisions that obligate us to make
payments to the counterparty if certain events occur. These contingencies generally relate to changes in taxes,increased lender capital costs and other similar costs. The indemnification clauses are often standard contractualterms and are entered into in the normal course of business. There are no stated or notional amounts included inthe indemnification clauses and we are not able to estimate the maximum potential amount of future payments, ifany, under these indemnification clauses. We have not been required to make any payments under suchindemnification clauses in the past and, under current circumstances, we do not believe an indemnification in anymaterial amount is probable.
If (i) any person other than A. Wilhelmsen AS. and Cruise Associates and their respective affiliates (the
“Applicable Group”) acquires ownership of more than 30% of our common stock and the Applicable Groupowns less of our common stock than such person, or (ii) subject to certain exceptions, during any 24-month period, a majority of the Board is no longer comprised of individuals who were members of the Board on thefirst day of such period, we may be obligated to prepay indebtedness outstanding under the majority of our creditfacilities, which we may be unable to replace on similar terms. Certain of our outstanding debt securities alsocontain change of control provisions that would be triggered by the acquisition of greater than 50% of ourcommon stock by a person other than a member of the Applicable Group coupled with a ratings downgrade. Ifthis were to occur, it would have an adverse impact on our liquidity and operations.
Note 8. Shareholders’ Equity
In September 2012, we declared a cash dividend on our common stock of $0.12 per share which was paid inthe fourth quarter of 2012. We declared and paid cash dividends on our common stock of $0.10 per share duringthe first and second quarters of 2012. During the first quarter of 2012, we also paid a cash dividend on ourcommon stock of $0.10 per share which was declared during the fourth quarter of 2011.
14
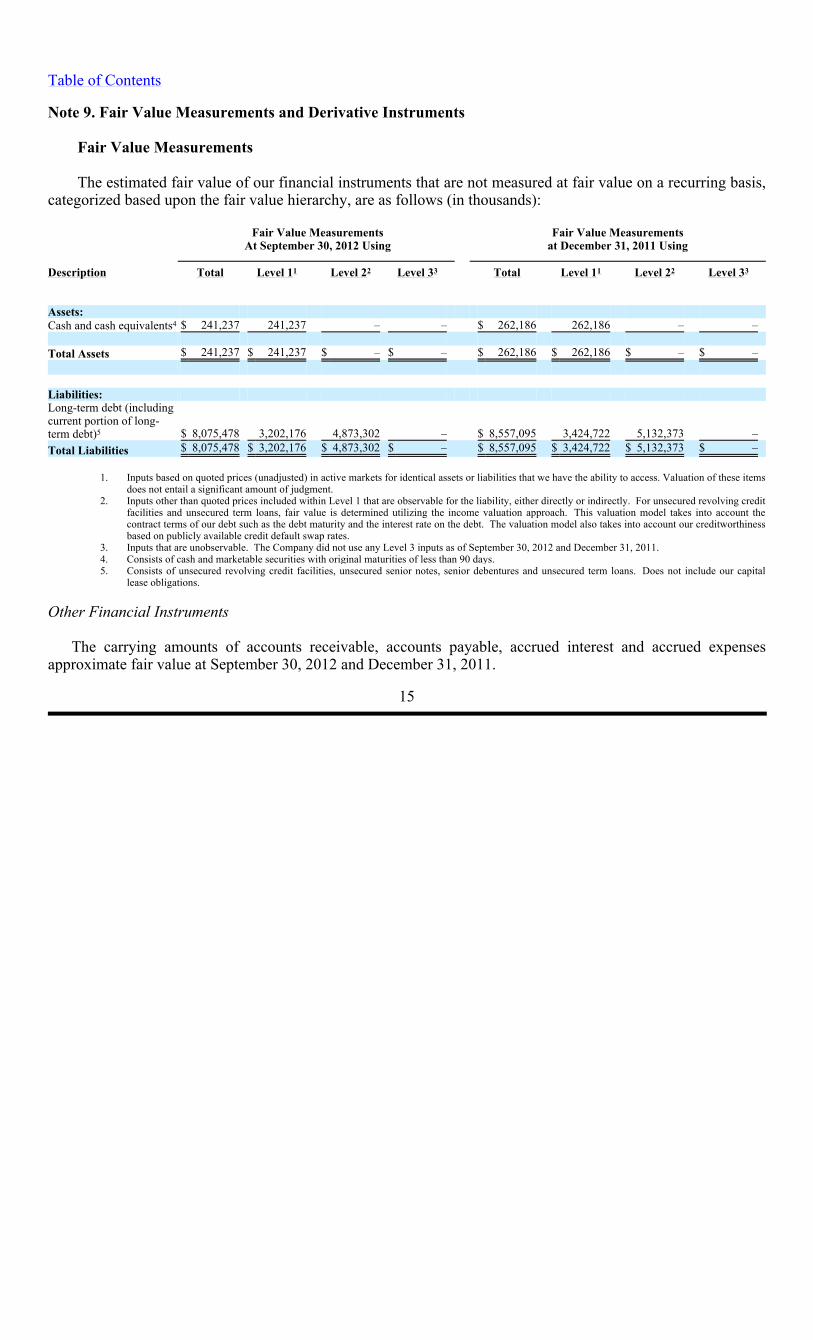
Table of Contents
Note 9. Fair Value Measurements and Derivative Instruments
Fair Value Measurements The estimated fair value of our financial instruments that are not measured at fair value on a recurring basis,
categorized based upon the fair value hierarchy, are as follows (in thousands):
Other Financial Instruments
The carrying amounts of accounts receivable, accounts payable, accrued interest and accrued expensesapproximate fair value at September 30, 2012 and December 31, 2011.
15
Fair Value Measurements
At September 30, 2012 UsingFair Value Measurements
at December 31, 2011 Using
Description Total
Level 1 Level 2 Level 3 Total Level 1
Level 2 Level 3 Assets:
Cash and cash equivalents $ 241,237
241,237 – – $ 262,186 262,186
– – Total Assets
$ 241,237 $ 241,237
$ –
$ –
$ 262,186
$ 262,186 $ –
$ –
Liabilities:
Long-term debt (including current portion of long-term debt)
$ 8,075,478 3,202,176
4,873,302 – $ 8,557,095 3,424,722 5,132,373 –
Total Liabilities $ 8,075,478
$ 3,202,176 $ 4,873,302 $ – $ 8,557,095 $ 3,424,722
$ 5,132,373 $ –
1. Inputs based on quoted prices (unadjusted) in active markets for identical assets or liabilities that we have the ability to access. Valuation of these itemsdoes not entail a significant amount of judgment.
2. Inputs other than quoted prices included within Level 1 that are observable for the liability, either directly or indirectly. For unsecured revolving creditfacilities and unsecured term loans, fair value is determined utilizing the income valuation approach. This valuation model takes into account thecontract terms of our debt such as the debt maturity and the interest rate on the debt. The valuation model also takes into account our creditworthinessbased on publicly available credit default swap rates.
3. Inputs that are unobservable. The Company did not use any Level 3 inputs as of September 30, 2012 and December 31, 2011.4. Consists of cash and marketable securities with original maturities of less than 90 days.5. Consists of unsecured revolving credit facilities, unsecured senior notes, senior debentures and unsecured term loans. Does not include our capital
lease obligations.
1 2 3 1 2 3
4
5
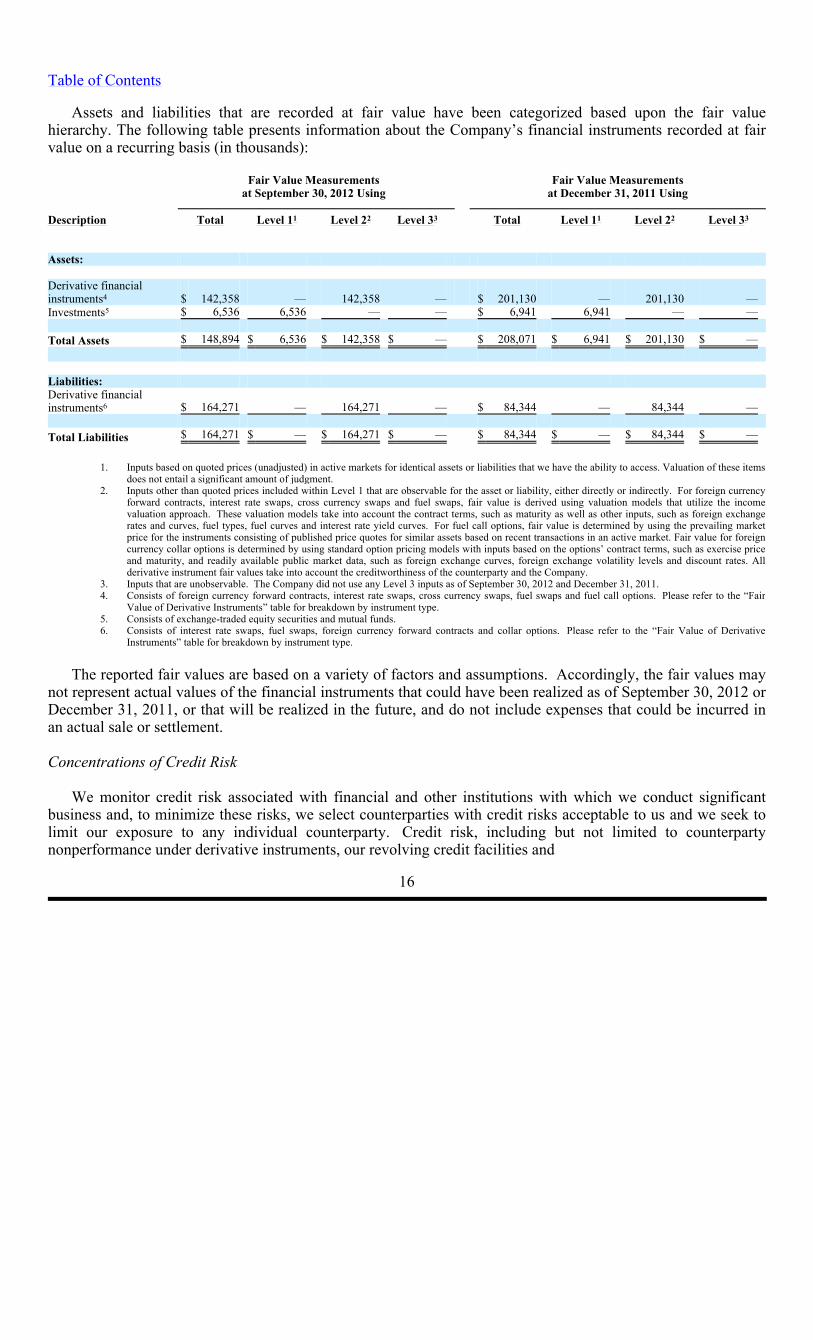
Table of Contents
Assets and liabilities that are recorded at fair value have been categorized based upon the fair valuehierarchy. The following table presents information about the Company’s financial instruments recorded at fair value on a recurring basis (in thousands):
The reported fair values are based on a variety of factors and assumptions. Accordingly, the fair values may
not represent actual values of the financial instruments that could have been realized as of September 30, 2012 orDecember 31, 2011, or that will be realized in the future, and do not include expenses that could be incurred inan actual sale or settlement.
Concentrations of Credit Risk
We monitor credit risk associated with financial and other institutions with which we conduct significantbusiness and, to minimize these risks, we select counterparties with credit risks acceptable to us and we seek tolimit our exposure to any individual counterparty. Credit risk, including but not limited to counterpartynonperformance under derivative instruments, our revolving credit facilities and
16
Fair Value Measurements
at September 30, 2012 UsingFair Value Measurements
at December 31, 2011 Using
Description Total
Level 1 Level 2 Level 3 Total Level 1
Level 2 Level 3 Assets:
Derivative financial instruments
$ 142,358 —
142,358
—
$ 201,130
— 201,130
—
Investments $ 6,536
6,536
—
—
$ 6,941
6,941 —
—
Total Assets
$ 148,894 $ 6,536
$ 142,358 $ — $ 208,071 $ 6,941 $ 201,130 $ —
Liabilities:
Derivative financial instruments
$ 164,271 —
164,271 — $ 84,344 — 84,344 —
Total Liabilities
$ 164,271 $ —
$ 164,271 $ — $ 84,344 $ — $ 84,344 $ —
1. Inputs based on quoted prices (unadjusted) in active markets for identical assets or liabilities that we have the ability to access. Valuation of these items does not entail a significant amount of judgment.
2. Inputs other than quoted prices included within Level 1 that are observable for the asset or liability, either directly or indirectly. For foreign currencyforward contracts, interest rate swaps, cross currency swaps and fuel swaps, fair value is derived using valuation models that utilize the incomevaluation approach. These valuation models take into account the contract terms, such as maturity as well as other inputs, such as foreign exchangerates and curves, fuel types, fuel curves and interest rate yield curves. For fuel call options, fair value is determined by using the prevailing marketprice for the instruments consisting of published price quotes for similar assets based on recent transactions in an active market. Fair value for foreigncurrency collar options is determined by using standard option pricing models with inputs based on the options’ contract terms, such as exercise price and maturity, and readily available public market data, such as foreign exchange curves, foreign exchange volatility levels and discount rates. Allderivative instrument fair values take into account the creditworthiness of the counterparty and the Company.
3. Inputs that are unobservable. The Company did not use any Level 3 inputs as of September 30, 2012 and December 31, 2011.4. Consists of foreign currency forward contracts, interest rate swaps, cross currency swaps, fuel swaps and fuel call options. Please refer to the “Fair
Value of Derivative Instruments” table for breakdown by instrument type.5. Consists of exchange-traded equity securities and mutual funds.6. Consists of interest rate swaps, fuel swaps, foreign currency forward contracts and collar options. Please refer to the “Fair Value of Derivative
Instruments” table for breakdown by instrument type.
1 2 3 1 2 3
4 5
6
Table of Contents new ship progress payment guarantees, is not considered significant, as we primarily conduct business withlarge, well-established financial institutions, insurance companies and export credit agencies with which we havelong-term relationships and which have credit risks acceptable to us or where the credit risk is spread out amonga large number of counterparties. In addition, our exposure under foreign currency forward contracts, foreigncurrency collar options, fuel call options, interest rate and fuel swap agreements was approximately $54.7million as of September 30, 2012, and is limited to the cost of replacing the contracts in the event of non-performance by the counterparties to the contract, all of which are currently our lending banks. We do notanticipate nonperformance by any of our significant counterparties. In addition, we have established guidelinesregarding credit ratings and instrument maturities that we follow to maintain safety and liquidity. We do notnormally require collateral or other security to support credit relationships; however, in certain circumstancesthis option is available to us. Derivative Instruments
We are exposed to market risk attributable to changes in interest rates, foreign currency exchange rates and fuel prices. We manage these risks through a combination of our normal operating and financing activities andthrough the use of derivative financial instruments pursuant to our hedging practices and policies. The financialimpact of these hedging instruments is primarily offset by corresponding changes in the underlying exposuresbeing hedged. We achieve this by closely matching the amount, term and conditions of the derivative instrumentwith the underlying risk being hedged. Although certain of our derivative financial instruments do not qualifyfor hedge accounting, we do not hold or issue derivative financial instruments for trading or other speculativepurposes. We monitor our derivative positions using techniques including market valuations and sensitivityanalyses.
We enter into various forward, swap and option contracts to manage our interest rate exposure and to limitour exposure to fluctuations in foreign currency exchange rates and fuel prices. These instruments are recordedon the balance sheet at their fair value and the vast majority are designated as hedges. We also have non-derivative financial instruments designated as hedges of our net investment in our foreign operations andinvestments.
At inception of the hedge relationship, a derivative instrument that hedges the exposure to changes in the fair value of a firm commitment or a recognized asset or liability is designated as a fair value hedge. A derivativeinstrument that hedges a forecasted transaction or the variability of cash flows related to a recognized asset orliability is designated as a cash flow hedge.
Changes in the fair value of derivatives that are designated as fair value hedges are offset against changes in
the fair value of the underlying hedged assets, liabilities or firm commitments. Gains and losses on derivativesthat are designated as cash flow hedges are recorded as a component of accumulated other comprehensive (loss) income until the underlying hedged transactions are recognized in earnings. The foreign currency transactiongain or loss of our non-derivative financial instruments designated as hedges of our net investment in foreignoperations and investments are recognized as a component of accumulated other comprehensive (loss) incomealong with the associated foreign currency translation adjustment of the foreign operation.
On an ongoing basis, we assess whether derivatives used in hedging transactions are “highly effective” in
offsetting changes in the fair value or cash flow of hedged items. We use the long-haul method to assess hedgeeffectiveness using regression analysis for each hedge relationship under our interest rate, foreign currency andfuel hedging programs. We apply the same methodology on a consistent basis for assessing hedge effectivenessto all hedges within each hedging program (i.e. interest
17
Table of Contents
rate, foreign currency and fuel). We perform regression analyses over an observation period commensurate withthe contractual life of the derivative instrument, up to three years for interest rate and foreign currencyrelationships and four years for fuel relationships. High effectiveness is achieved when a statistically validrelationship reflects a high degree of offset and correlation between the changes in the fair values of thederivative instrument and the hedged item. The determination of ineffectiveness is based on the amount of dollaroffset between the change in fair value of the derivative instrument and the change in fair value of the hedgeditem at the end of the reporting period. If it is determined that a derivative is not highly effective as a hedge orhedge accounting is discontinued, any change in fair value of the derivative since the last date at which it wasdetermined to be effective is recognized in earnings. In addition, the ineffective portion of our highly effectivehedges is recognized in earnings immediately and reported in other income (expense) in our consolidated statements of comprehensive income (loss).
Cash flows from derivative instruments that are designated as fair value or cash flow hedges are classified inthe same category as the cash flows from the underlying hedged items. In the event that hedge accounting isdiscontinued, cash flows subsequent to the date of discontinuance are classified within investing activities. Cashflows from derivative instruments not designated as hedging instruments are classified as investing activities. Interest Rate Risk
Our exposure to market risk for changes in interest rates relates to our long-term debt obligations including future interest payments. At September 30, 2012, approximately 42% of our long-term debt was effectivelyfixed as compared to 40% as of December 31, 2011. We use interest rate swap agreements to modify ourexposure to interest rate movements and to manage our interest expense. We manage the risk that changes ininterest rates will have either on the fair value of debt obligations or on the amount of future interest payments bymonitoring changes in interest rate exposures and by evaluating hedging opportunities.
Market risk associated with our long-term fixed rate debt is the potential increase in fair value resulting froma decrease in interest rates. We use interest rate swap agreements that effectively convert a portion of our fixed-rate debt to a floating-rate basis to manage this risk. At September 30, 2012 and December 31, 2011, wemaintained interest rate swap agreements on the $420.0 million fixed rate portion of our Oasis of the Seasunsecured amortizing term loan. The interest rate swap agreements effectively changed the interest rate on thebalance of the unsecured term loan, which was $332.5 million as of September 30, 2012, from a fixed rate of5.41% to a LIBOR-based floating rate equal to LIBOR plus 3.87%, currently approximately 4.60%. Theseinterest rate swap agreements are accounted for as fair value hedges.
During the third quarter of 2012, we terminated our interest rate swap agreements that effectively changed$350.0 million of debt with a fixed rate of 7.25% to LIBOR-based floating rate debt. The swaps were designatedas fair value hedges and terminating the swaps did not result in a gain or loss. We received net cash proceeds ofapproximately $60.6 million upon termination. A $60.1 million increase to the carrying value of the debt isbeing amortized to reduce interest expense over the remaining life of the debt.
Market risk associated with our long-term floating rate debt is the potential increase in interest expense froman increase in interest rates. We use interest rate swap agreements that effectively convert a portion of ourfloating-rate debt to a fixed-rate basis to manage this risk. During the second quarter of 2012, we entered intoforward-starting interest rate swap agreements that hedge the anticipated
18
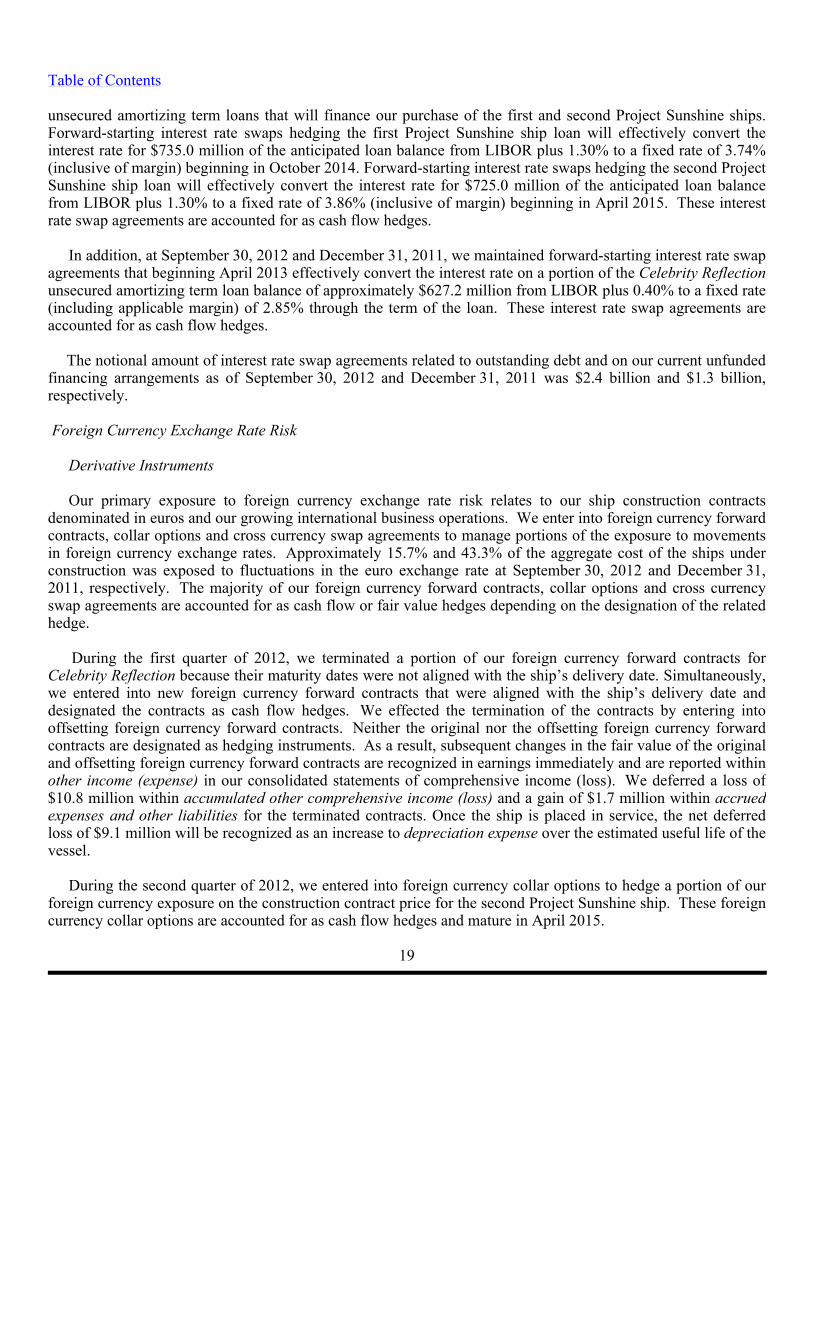
Table of Contents
unsecured amortizing term loans that will finance our purchase of the first and second Project Sunshine ships.Forward-starting interest rate swaps hedging the first Project Sunshine ship loan will effectively convert theinterest rate for $735.0 million of the anticipated loan balance from LIBOR plus 1.30% to a fixed rate of 3.74%(inclusive of margin) beginning in October 2014. Forward-starting interest rate swaps hedging the second ProjectSunshine ship loan will effectively convert the interest rate for $725.0 million of the anticipated loan balancefrom LIBOR plus 1.30% to a fixed rate of 3.86% (inclusive of margin) beginning in April 2015. These interestrate swap agreements are accounted for as cash flow hedges.
In addition, at September 30, 2012 and December 31, 2011, we maintained forward-starting interest rate swap agreements that beginning April 2013 effectively convert the interest rate on a portion of the Celebrity Reflectionunsecured amortizing term loan balance of approximately $627.2 million from LIBOR plus 0.40% to a fixed rate(including applicable margin) of 2.85% through the term of the loan. These interest rate swap agreements areaccounted for as cash flow hedges.
The notional amount of interest rate swap agreements related to outstanding debt and on our current unfunded financing arrangements as of September 30, 2012 and December 31, 2011 was $2.4 billion and $1.3 billion,respectively. Foreign Currency Exchange Rate Risk
Derivative Instruments
Our primary exposure to foreign currency exchange rate risk relates to our ship construction contracts
denominated in euros and our growing international business operations. We enter into foreign currency forwardcontracts, collar options and cross currency swap agreements to manage portions of the exposure to movementsin foreign currency exchange rates. Approximately 15.7% and 43.3% of the aggregate cost of the ships underconstruction was exposed to fluctuations in the euro exchange rate at September 30, 2012 and December 31,2011, respectively. The majority of our foreign currency forward contracts, collar options and cross currencyswap agreements are accounted for as cash flow or fair value hedges depending on the designation of the relatedhedge.
During the first quarter of 2012, we terminated a portion of our foreign currency forward contracts forCelebrity Reflection because their maturity dates were not aligned with the ship’s delivery date. Simultaneously, we entered into new foreign currency forward contracts that were aligned with the ship’s delivery date and designated the contracts as cash flow hedges. We effected the termination of the contracts by entering intooffsetting foreign currency forward contracts. Neither the original nor the offsetting foreign currency forwardcontracts are designated as hedging instruments. As a result, subsequent changes in the fair value of the originaland offsetting foreign currency forward contracts are recognized in earnings immediately and are reported withinother income (expense) in our consolidated statements of comprehensive income (loss). We deferred a loss of$10.8 million within accumulated other comprehensive income (loss) and a gain of $1.7 million within accrued expenses and other liabilities for the terminated contracts. Once the ship is placed in service, the net deferredloss of $9.1 million will be recognized as an increase to depreciation expense over the estimated useful life of the vessel.
During the second quarter of 2012, we entered into foreign currency collar options to hedge a portion of ourforeign currency exposure on the construction contract price for the second Project Sunshine ship. These foreigncurrency collar options are accounted for as cash flow hedges and mature in April 2015.
19
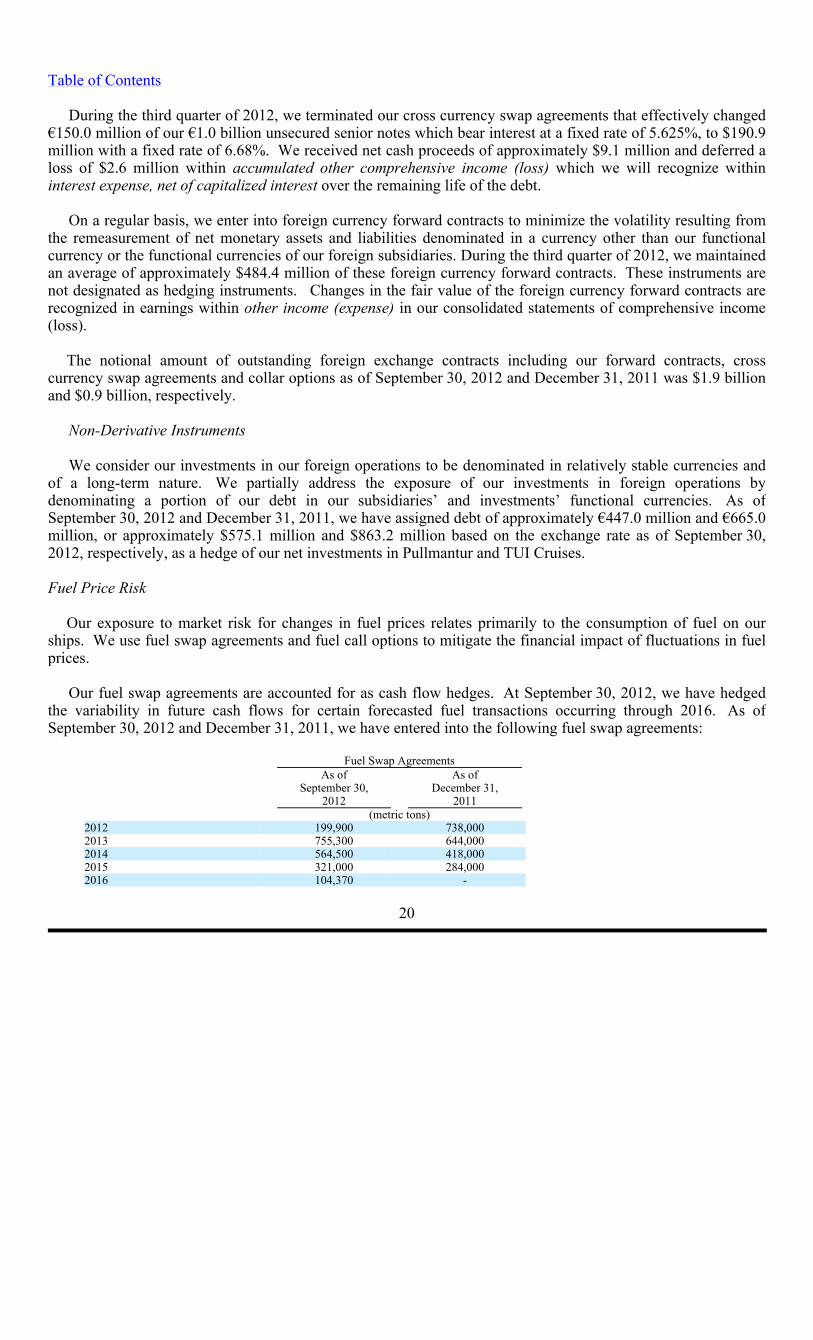
Table of Contents
During the third quarter of 2012, we terminated our cross currency swap agreements that effectively changed€150.0 million of our €1.0 billion unsecured senior notes which bear interest at a fixed rate of 5.625%, to $190.9million with a fixed rate of 6.68%. We received net cash proceeds of approximately $9.1 million and deferred aloss of $2.6 million within accumulated other comprehensive income (loss) which we will recognize within interest expense, net of capitalized interest over the remaining life of the debt.
On a regular basis, we enter into foreign currency forward contracts to minimize the volatility resulting fromthe remeasurement of net monetary assets and liabilities denominated in a currency other than our functionalcurrency or the functional currencies of our foreign subsidiaries. During the third quarter of 2012, we maintainedan average of approximately $484.4 million of these foreign currency forward contracts. These instruments arenot designated as hedging instruments. Changes in the fair value of the foreign currency forward contracts arerecognized in earnings within other income (expense) in our consolidated statements of comprehensive income (loss).
The notional amount of outstanding foreign exchange contracts including our forward contracts, cross currency swap agreements and collar options as of September 30, 2012 and December 31, 2011 was $1.9 billionand $0.9 billion, respectively.
Non-Derivative Instruments
We consider our investments in our foreign operations to be denominated in relatively stable currencies andof a long-term nature. We partially address the exposure of our investments in foreign operations bydenominating a portion of our debt in our subsidiaries’ and investments’ functional currencies. As of September 30, 2012 and December 31, 2011, we have assigned debt of approximately €447.0 million and €665.0 million, or approximately $575.1 million and $863.2 million based on the exchange rate as of September 30,2012, respectively, as a hedge of our net investments in Pullmantur and TUI Cruises. Fuel Price Risk
Our exposure to market risk for changes in fuel prices relates primarily to the consumption of fuel on our ships. We use fuel swap agreements and fuel call options to mitigate the financial impact of fluctuations in fuelprices.
Our fuel swap agreements are accounted for as cash flow hedges. At September 30, 2012, we have hedged the variability in future cash flows for certain forecasted fuel transactions occurring through 2016. As ofSeptember 30, 2012 and December 31, 2011, we have entered into the following fuel swap agreements:
20
Fuel Swap Agreements
As of September 30,
2012
As of December 31,
2011
(metric tons)2012
199,900
738,000
2013 755,300 644,000
2014 564,500
418,000
2015 321,000
284,000
2016 104,370 -
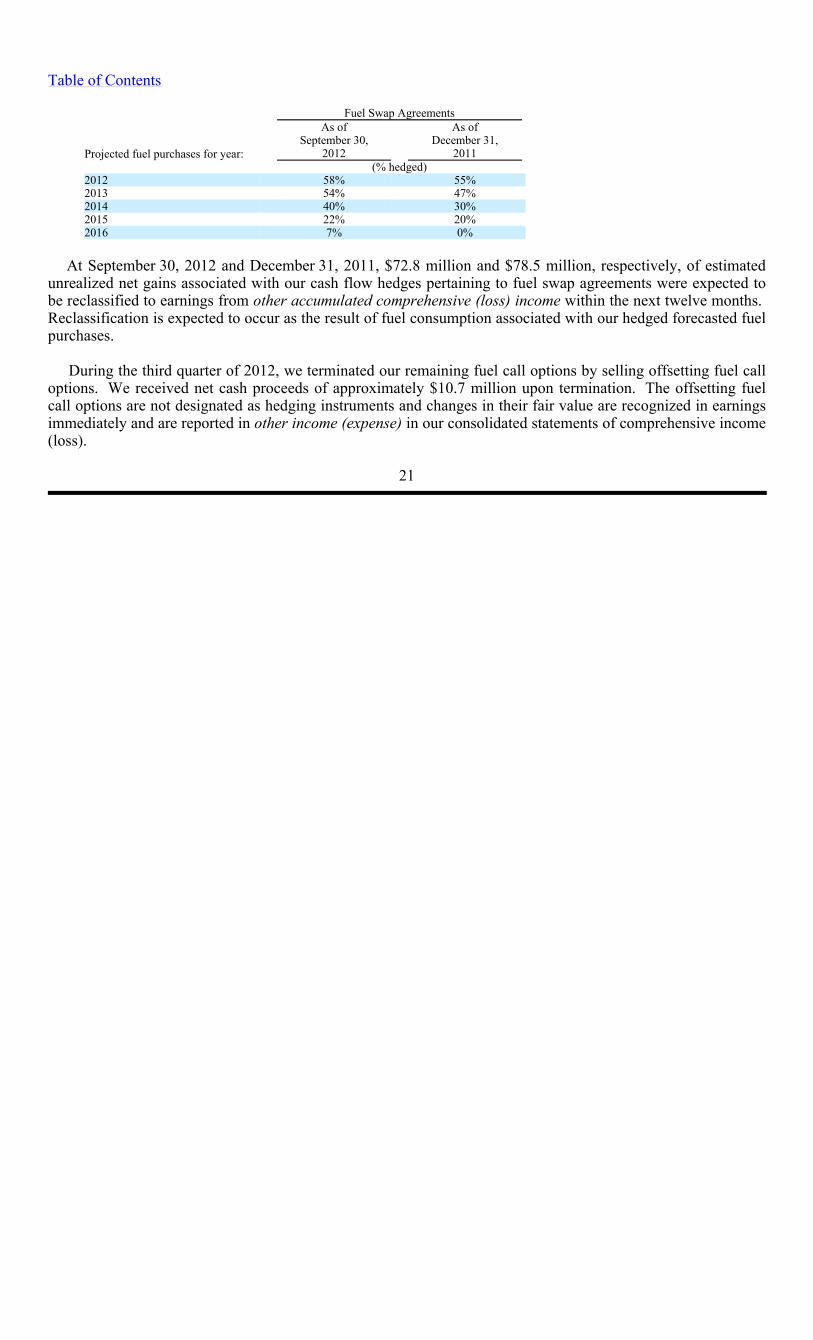
Table of Contents
At September 30, 2012 and December 31, 2011, $72.8 million and $78.5 million, respectively, of estimated
unrealized net gains associated with our cash flow hedges pertaining to fuel swap agreements were expected tobe reclassified to earnings from other accumulated comprehensive (loss) income within the next twelve months. Reclassification is expected to occur as the result of fuel consumption associated with our hedged forecasted fuelpurchases.
During the third quarter of 2012, we terminated our remaining fuel call options by selling offsetting fuel calloptions. We received net cash proceeds of approximately $10.7 million upon termination. The offsetting fuelcall options are not designated as hedging instruments and changes in their fair value are recognized in earningsimmediately and are reported in other income (expense) in our consolidated statements of comprehensive income(loss).
21
Fuel Swap Agreements
Projected fuel purchases for year:
As of September 30,
2012
As of December 31,
2011
(% hedged)
2012 58%
55%
2013 54% 47%
2014 40%
30%
2015 22% 20%
2016 7%
0%
Table of Contents
The fair value and line item caption of derivative instruments recorded were as follows:
Fair Value of Derivative Instruments
Accounting Standard Codification 815-20 “Derivatives and Hedging”.
22
Asset Derivatives
Liability Derivatives
As of September 30,
2012
As of December 31,
2011
As of September 30,
2012
As of December 31,
2011
Balance Sheet
Location Fair Value Fair Value
Balance Sheet Location
Fair Value Fair ValueIn thousands
Derivatives designated as hedging instruments under ASC 815-20
Interest rate swaps Other Assets $ 5,978 $ 65,531
Other long-term liabilities
$ 60,570 $ 11,369
Cross currency swaps Other Assets - 2,914
Other long-term liabilities
- -
Foreign currency forward contracts Derivative
Financial Instruments
863 1,895 Accrued expenses
and other liabilities
31,728 31,775
Foreign currency forward contracts Other Assets
7,112 -
Other long-term liabilities
7,096 -
Foreign currency collar options Other Assets - -
Other long-term liabilities
2,678 -
Fuel swaps Derivative Financial Instruments
73,362 82,747 Accrued expenses
and other liabilities
921 -
Fuel swaps Other Assets 18,218 26,258
Other long-term liabilities
9,801 29,213
Total derivatives designated as hedging instruments under 815-20
105,533
179,345
112,794
72,357
Derivatives not designated as hedging instruments under ASC 815-20
Foreign currency forward contracts Derivative
Financial Instruments
$ 10,857 $ -
Accrued expenses and other liabilities
$ 19,835
$ -
Foreign currency forward contracts Other Assets
13,251 5,414
Other long-term liabilities
19,641
11,987
Fuel swaps Derivative Financial Instruments
1,786 - Accrued expenses
and other liabilities
1,079 -
Fuel call options Derivative Financial Instruments
10,931 - Accrued expenses
and other liabilities
10,922 -
Fuel call options Other Assets - 16,371 Other long-term
liabilities - -
Total derivatives not designated as hedging instruments under 815-20
36,825
21,785 51,477
11,987
Total derivatives $ 142,358 $ 201,130
$ 164,271 $ 84,344
1
1
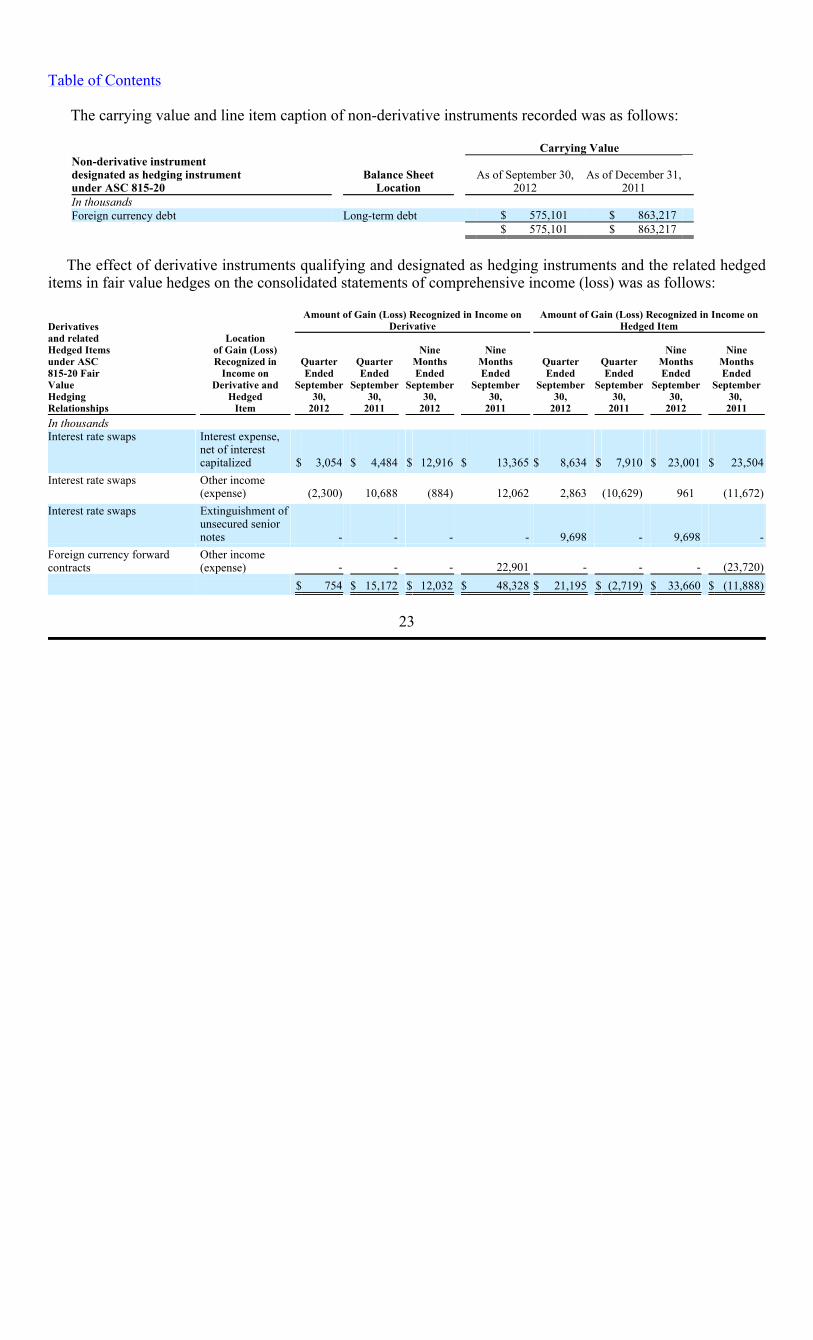
Table of Contents
The carrying value and line item caption of non-derivative instruments recorded was as follows:
The effect of derivative instruments qualifying and designated as hedging instruments and the related hedged
items in fair value hedges on the consolidated statements of comprehensive income (loss) was as follows:
23
Carrying Value
Non-derivative instrument designated as hedging instrument under ASC 815-20
Balance SheetLocation
As of September 30,2012
As of December 31,
2011 In thousands
Foreign currency debt
Long-term debt
$ 575,101 $ 863,217
$ 575,101 $ 863,217
Derivatives
Amount of Gain (Loss) Recognized in Income onDerivative
Amount of Gain (Loss) Recognized in Income onHedged Item
and related Hedged Items under ASC 815-20 Fair Value Hedging Relationships
Location of Gain (Loss) Recognized in
Income on Derivative and
Hedged Item
QuarterEnded
September30,
2012
QuarterEnded
September30,
2011
NineMonthsEnded
September30,
2012
NineMonths Ended
September 30,
2011
Quarter Ended
September 30,
2012
Quarter Ended
September 30,
2011
NineMonths Ended
September30,
2012
NineMonths Ended
September30,
2011
In thousands
Interest rate swaps
Interest expense, net of interest capitalized
$ 3,054
$ 4,484
$ 12,916
$ 13,365
$ 8,634
$ 7,910
$ 23,001
$ 23,504
Interest rate swaps
Other income (expense)
(2,300) 10,688 (884) 12,062 2,863 (10,629)
961 (11,672) Interest rate swaps
Extinguishment of unsecured senior notes
-
-
-
-
9,698 -
9,698
-
Foreign currency forward contracts
Other income (expense)
- - - 22,901 - -
- (23,720) $ 754 $ 15,172 $ 12,032 $ 48,328 $ 21,195
$ (2,719)
$ 33,660 $ (11,888)
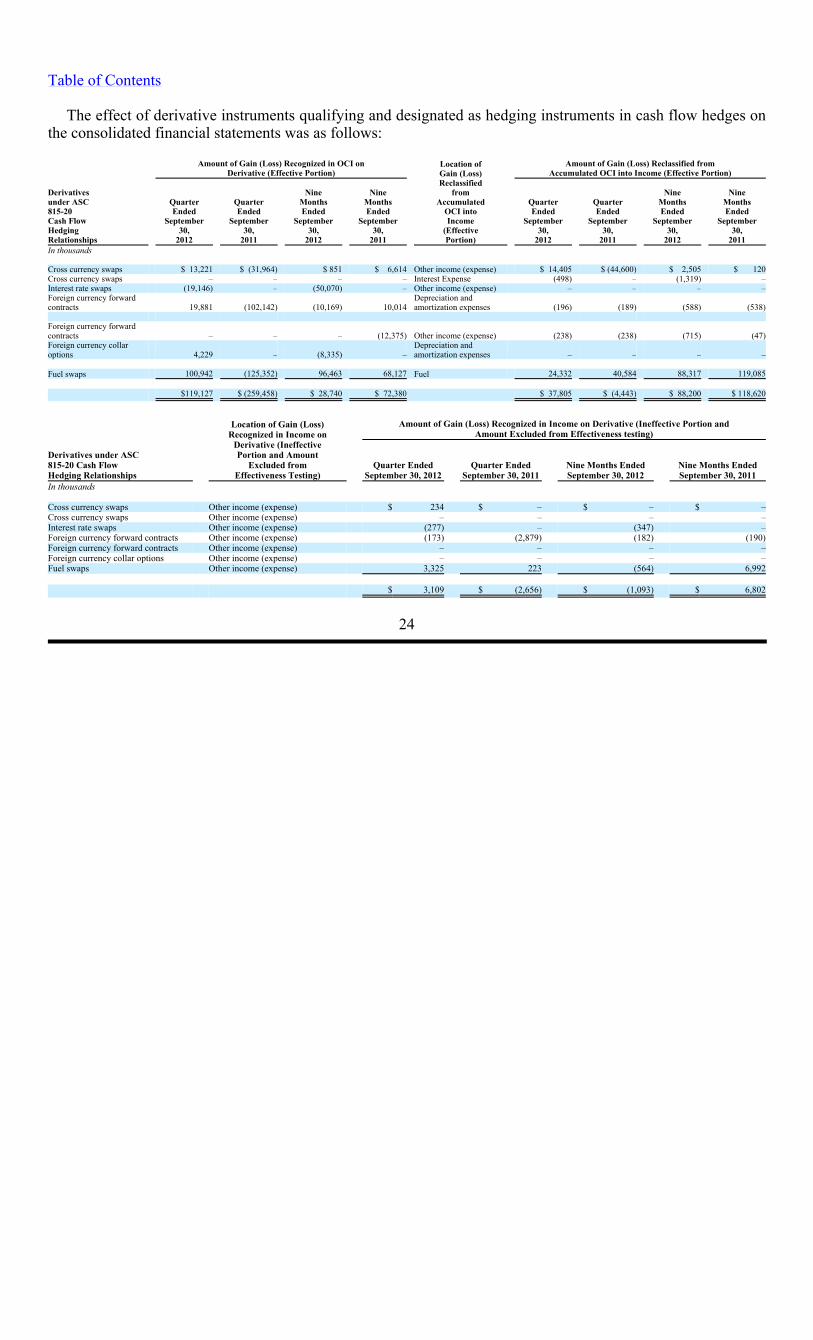
Table of Contents
The effect of derivative instruments qualifying and designated as hedging instruments in cash flow hedges on the consolidated financial statements was as follows:
24
Amount of Gain (Loss) Recognized in OCI on
Derivative (Effective Portion)Location ofGain (Loss)
Amount of Gain (Loss) Reclassified fromAccumulated OCI into Income (Effective Portion)
Reclassified
Derivatives under ASC 815-20 Cash Flow Hedging Relationships
Quarter Ended
September 30,
2012
Quarter Ended
September 30,
2011
Nine Months Ended
September 30,
2012
NineMonths Ended
September 30,
2011
fromAccumulated
OCI into Income
(Effective Portion)
QuarterEnded
September 30,
2012
Quarter Ended
September 30,
2011
NineMonths Ended
September 30,
2012
NineMonths Ended
September 30,
2011In thousands
Cross currency swaps
$ 13,221 $ (31,964)
$ 851
$ 6,614
Other income (expense)
$ 14,405 $ (44,600)
$ 2,505
$ 120Cross currency swaps
– –
– – Interest Expense (498) –
(1,319) –Interest rate swaps
(19,146) –
(50,070) – Other income (expense) – –
– –Foreign currency forward contracts
19,881 (102,142)
(10,169)
10,014
Depreciation and amortization expenses
(196)
(189) (588)
(538)
Foreign currency forward contracts
– –
–
(12,375)
Other income (expense)
(238) (238)
(715)
(47)Foreign currency collar options
4,229 –
(8,335) –Depreciation and amortization expenses –
– – –
Fuel swaps
100,942 (125,352)
96,463 68,127 Fuel 24,332 40,584
88,317 119,085 $119,127
$ (259,458) $ 28,740 $ 72,380 $ 37,805
$ (4,443) $ 88,200 $ 118,620
Location of Gain (Loss)
Recognized in Income on
Amount of Gain (Loss) Recognized in Income on Derivative (Ineffective Portion and Amount Excluded from Effectiveness testing)
Derivatives under ASC 815-20 Cash Flow Hedging Relationships
Derivative (Ineffective Portion and Amount
Excluded from Effectiveness Testing)
Quarter EndedSeptember 30, 2012
Quarter EndedSeptember 30, 2011
Nine Months Ended September 30, 2012
Nine Months EndedSeptember 30, 2011
In thousands
Cross currency swaps
Other income (expense)
$ 234
$ –
$ –
$ –Cross currency swaps
Other income (expense)
–
–
–
–Interest rate swaps
Other income (expense)
(277)
–
(347)
–Foreign currency forward contracts
Other income (expense)
(173)
(2,879)
(182)
(190)Foreign currency forward contracts
Other income (expense)
–
–
–
–Foreign currency collar options
Other income (expense)
–
–
–
–Fuel swaps
Other income (expense)
3,325
223
(564)
6,992
$ 3,109 $ (2,656) $ (1,093) $ 6,802
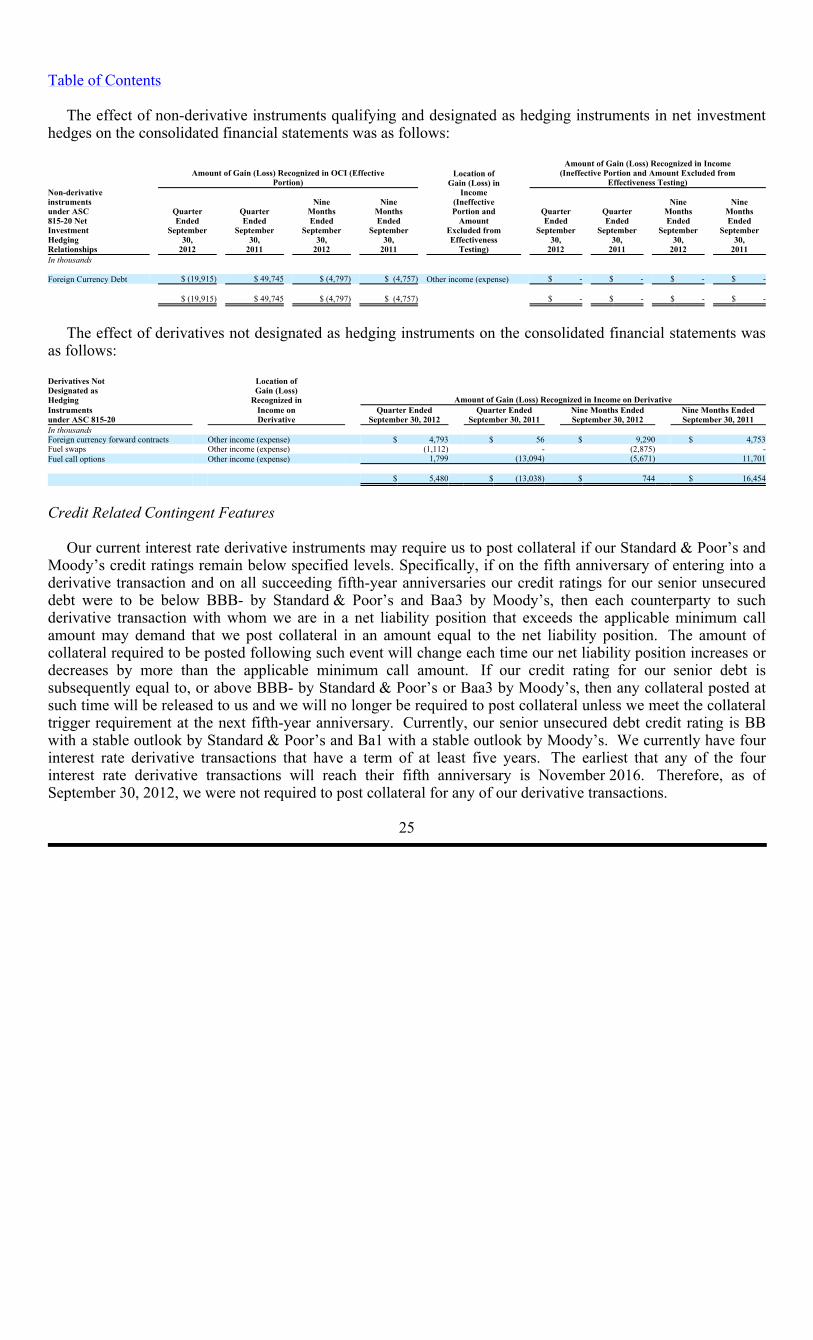
Table of Contents
The effect of non-derivative instruments qualifying and designated as hedging instruments in net investment hedges on the consolidated financial statements was as follows:
The effect of derivatives not designated as hedging instruments on the consolidated financial statements was
as follows:
Credit Related Contingent Features
Our current interest rate derivative instruments may require us to post collateral if our Standard & Poor’s and Moody’s credit ratings remain below specified levels. Specifically, if on the fifth anniversary of entering into aderivative transaction and on all succeeding fifth-year anniversaries our credit ratings for our senior unsecureddebt were to be below BBB- by Standard & Poor’s and Baa3 by Moody’s, then each counterparty to such derivative transaction with whom we are in a net liability position that exceeds the applicable minimum callamount may demand that we post collateral in an amount equal to the net liability position. The amount ofcollateral required to be posted following such event will change each time our net liability position increases ordecreases by more than the applicable minimum call amount. If our credit rating for our senior debt issubsequently equal to, or above BBB- by Standard & Poor’s or Baa3 by Moody’s, then any collateral posted at such time will be released to us and we will no longer be required to post collateral unless we meet the collateraltrigger requirement at the next fifth-year anniversary. Currently, our senior unsecured debt credit rating is BBwith a stable outlook by Standard & Poor’s and Ba1 with a stable outlook by Moody’s. We currently have fourinterest rate derivative transactions that have a term of at least five years. The earliest that any of the fourinterest rate derivative transactions will reach their fifth anniversary is November 2016. Therefore, as ofSeptember 30, 2012, we were not required to post collateral for any of our derivative transactions.
25
Amount of Gain (Loss) Recognized in OCI (Effective
Portion) Location ofGain (Loss) in
Amount of Gain (Loss) Recognized in Income(Ineffective Portion and Amount Excluded from
Effectiveness Testing) Non-derivative instruments under ASC 815-20 Net Investment Hedging Relationships
Quarter Ended
September 30,
2012
Quarter Ended
September 30,
2011
NineMonths Ended
September 30,
2012
NineMonths Ended
September 30,
2011
Income(Ineffective Portion and
Amount Excluded from Effectiveness
Testing)
Quarter Ended
September 30,
2012
Quarter Ended
September 30,
2011
NineMonths Ended
September 30,
2012
NineMonths Ended
September 30,
2011In thousands
Foreign Currency Debt
$ (19,915)
$ 49,745 $ (4,797) $ (4,757) Other income (expense) $ -
$ -
$ - $ -
$ (19,915) $ 49,745
$ (4,797) $ (4,757) $ -
$ -
$ - $ -
Derivatives Not Designated as Hedging
Location of Gain (Loss)
Recognized in
Amount of Gain (Loss) Recognized in Income on DerivativeInstruments under ASC 815-20
Income on Derivative
Quarter EndedSeptember 30, 2012
Quarter EndedSeptember 30, 2011
Nine Months Ended September 30, 2012
Nine Months EndedSeptember 30, 2011
In thousands
Foreign currency forward contracts Other income (expense)
$ 4,793
$ 56
$ 9,290
$ 4,753
Fuel swaps Other income (expense)
(1,112)
-
(2,875)
-
Fuel call options Other income (expense) 1,799 (13,094) (5,671) 11,701
$ 5,480 $ (13,038) $ 744 $ 16,454
Table of Contents
Note 10. Subsequent Event
In October 2012, we took delivery of Celebrity Reflection. To finance the purchase, we borrowed $673.5 million under a previously committed unsecured term loan which is 95% guaranteed by Hermes. The loanamortizes semi-annually over 12 years and bears interest at LIBOR plus a margin of 0.40%, currentlyapproximately 1.03%. In addition during 2011, we entered into forward-starting interest rate swap agreements which effectively convert the floating rate available to us per the credit agreement to a fixed rate (includingapplicable margin) of 2.85% effective April 2013 through the remaining term of the loan. See Note 9. Fair Value Measurements and Derivative Instruments for further information regarding these agreements.
26
Table of Contents
Item 2. Management’s Discussion and Analysis of Financial Condition and Results of Operations Cautionary Note Concerning Forward-Looking Statements
The discussion under this caption “Management’s Discussion and Analysis of Financial Condition andResults of Operations” and elsewhere in this document includes “forward-looking statements” within the meaning of the Private Securities Litigation Reform Act of 1995. All statements other than statements ofhistorical fact, including statements regarding guidance (including our expectations for the fourth quarter and fullyear of 2012 set forth under the heading “—Outlook” below), business and industry prospects or future results ofoperations or financial position, made in this Quarterly Report on Form 10-Q are forward-looking. Words such as “anticipate,” “believe,” “could,” “estimate,” “expect,” “goal,” “intend,” “may,” “plan,” “project,” “seek,” “should,” “will,” and similar expressions are intended to further identify any of these forward-looking statements. Forward-looking statements reflect management’s current expectations but they are based on judgments and are inherently uncertain. Furthermore, they are subject to risks, uncertainties and other factors,which could cause our actual results, performance or achievements to differ materially from the future results,performance or achievements expressed or implied in those forward-looking statements. Examples of these risks, uncertainties and other factors include, but are not limited to, the following:
27
• the impact of the worldwide economic and geopolitical environment or other conditions on the demandfor cruises;
• the impact of the worldwide economic environment on our ability to generate cash flows from
operations, satisfy the financial covenants required by our credit facilities, or obtain new borrowingsfrom the credit or capital markets;
• the impact of disruptions in the global financial markets on the ability of our counterparties and others to
perform their obligations to us including those associated with our loan agreements and derivativecontracts;
• negative incidents concerning the Company and the cruise vacation industry, or adverse publicity,
including those involving the health, safety and security of guests, accidents, unusual weather conditionsor natural disasters or disruptions;
• our ability to appropriately balance our cost management strategy with our goal of satisfying guest
expectations; • failure to keep pace with developments in technology which could impair our operations or competitive
position; • the uncertainties of conducting business globally and our ability to realize the intended benefits of our
investments in new markets; • changes in operating and financing costs, including changes in foreign exchange rates, interest rates, fuel,
food, payroll, airfare, insurance and security costs; • vacation industry competition and industry overcapacity in certain markets; • the cost of or changes in tax, environmental, labor, health, safety, security and other laws and regulations
affecting our business;
Table of Contents
The above examples are not exhaustive and, in addition, new risks emerge from time to time. All forward-
looking statements made in this Quarterly Report on Form 10-Q speak only as of the date of this document. Given these risks and uncertainties, readers are cautioned not to place undue reliance on such forward-looking statements. We undertake no obligation to publicly update or revise any forward-looking statements, whether as a result of new information, future events or otherwise. For a further discussion of risk factors related to ourbusiness, see Part I, Item 1A. Risk Factors in our annual report on Form 10-K for the year ended December 31, 2011.
Overview
The discussion and analysis of our financial condition and results of operations has been organized to presentthe following:
28
• pending or threatened litigation, enforcement actions, fines or penalties; • emergency ship repairs, including the related lost revenue; • the impact of ship construction, repair or refurbishment delays, ship cancellations or ship construction
price increases brought about by construction faults, mechanical problems or financial difficultiesencountered by shipyards or their subcontractors;
• the global political climate, fears of terrorist and pirate attacks, armed conflict, the unavailability or cost
of air service and the resulting concerns over safety and security aspects of traveling; • the spread of contagious diseases; • disruptions to our shoreside business related to actual or threatened natural disasters, information systems
failure or similar events; • our ability to differentiate our products; • our ability to manage our business activities that involve our co-investment with third parties; • our inability to adequately incentivize our travel agents or changes and/or disruptions to the travel agency
industry; • the loss of key personnel, strained employee relations and/or our inability to retain or recruit qualified
personnel; • changes in our stock price or principal shareholders; • uncertainties of a foreign legal system as we are not incorporated in the United States; • the unavailability of ports of call; and • weather.
• a review of our financial presentation, including discussion of certain operational and financial metricswe utilize to assist us in managing our business;
Table of Contents
Critical Accounting Policies
For a discussion of our critical accounting policies, refer to Item 7. Management’s Discussion and Analysisof Financial Condition and Results of Operations within our annual report on Form 10-K for the year ended December 31, 2011.
Seasonality
Our revenues are seasonal based on demand for cruises. Demand is strongest for cruises during the NorthernHemisphere’s summer months and holidays. In order to mitigate the impact of the winter weather in the NorthernHemisphere and to capitalize on the summer season in the Southern Hemisphere, our brands have increaseddeployment to South America and Australia during the Northern Hemisphere winter months.
Financial Presentation
Description of Certain Line Items Revenues
Our revenues are comprised of the following:
Onboard and other revenues also include revenues we receive from independent third party concessionaires
that pay us a percentage of their revenues in exchange for the right to provide selected goods and/or servicesonboard our ships.
Cruise Operating Expenses
Our cruise operating expenses are comprised of the following:
29
• a discussion of our results of operations for the quarter and nine months ended September 30, 2012compared to the same period in 2011;
• a discussion of our business outlook, including our expectations for selected financial items for the fourth
quarter and full year of 2012; and • a discussion of our liquidity and capital resources, including our future capital and contractual
commitments and potential funding sources.
• Passenger ticket revenues, which consist of revenue recognized from the sale of passenger tickets andthe sale of air transportation to and from our ships; and
• Onboard and other revenues, which consist primarily of revenues from the sale of goods and/or services
onboard our ships not included in passenger ticket prices, cancellation fees, sales of vacation protectioninsurance, pre- and post-cruise tours, Pullmantur’s land-based tours and hotel and air packages including Pullmantur Air’s charter business to third parties.
• Commissions, transportation and other expenses, which consist of those costs directly associated withpassenger ticket revenues, including travel agent commissions, air and other transportation expenses, portcosts that vary with passenger head counts and related credit card fees;
Table of Contents
We do not allocate payroll and related costs, food costs, fuel costs or other operating costs to the expense
categories attributable to passenger ticket revenues or onboard and other revenues since they are incurred toprovide the total cruise vacation experience.
Selected Operational and Financial Metrics
We utilize a variety of operational and financial metrics which are defined below to evaluate our performance
and financial condition. As discussed in more detail herein, certain of these metrics are non-GAAP financial measures, which we believe provide useful information to investors as a supplement to our consolidated financialstatements, which are prepared and presented in accordance with GAAP. The presentation of non-GAAP financial information is not intended to be considered in isolation or as a substitute for, or superior to, thefinancial information prepared and presented in accordance with GAAP.
Available Passenger Cruise Days (“APCD”) is our measurement of capacity and represents double
occupancy per cabin multiplied by the number of cruise days for the period. We use this measure to performcapacity and rate analyses to identify the main non-capacity drivers that cause our cruise revenue and expenses tovary.
Gross Cruise Costs represent the sum of total cruise operating expenses plus marketing, selling and
administrative expenses. Gross Yields represent total revenues per APCD. Net Cruise Costs and Net Cruise Costs Excluding Fuel represent Gross Cruise Costs excluding commissions,
transportation and other expenses and onboard and other expenses and, in the case of Net Cruise Costs ExcludingFuel, fuel expenses (each of which is described above under the Description of Certain Line Items heading). Inmeasuring our ability to control costs in a manner that positively impacts net income, we believe changes in NetCruise Costs and Net Cruise Costs Excluding Fuel to be the most relevant indicators of our performance. Areconciliation of historical Gross Cruise Costs to Net Cruise Costs and Net Cruise Costs Excluding Fuel isprovided below under Results of Operations. We have not
30
• Onboard and other expenses, which consist of the direct costs associated with onboard and other revenues, including the cost of products sold onboard our ships, vacation protection insurance premiums,costs associated with pre- and post-cruise tours and related credit card fees as well as the minimal costs associated with concession revenues, as the costs are mostly incurred by third-party concessionaires;
• Payroll and related expenses, which consist of costs for shipboard personnel (costs associated with our
shoreside personnel are included in marketing, selling and administrative expenses); • Food expenses, which include food costs for both passengers and crew; • Fuel expenses, which include fuel and related delivery and storage costs, including the financial impact
of fuel swap agreements accounted for as hedges; and • Other operating expenses, which consist primarily of operating costs such as repairs and maintenance,
port costs that do not vary with passenger head counts, vessel operating lease costs, costs associated withPullmantur’s land-based tours and Pullmantur Air’s charter business to third parties, vessel relatedinsurance and entertainment.
Table of Contents
provided a quantitative reconciliation of projected Gross Cruise Costs to projected Net Cruise Costs andprojected Net Cruise Costs Excluding Fuel due to the significant uncertainty in projecting the costs deducted toarrive at these measures. Accordingly, we do not believe that reconciling information for such projected figureswould be meaningful.
Net Debt-to-Capital is a ratio which represents total long-term debt, including the current portion of long-
term debt, less cash and cash equivalents (“Net Debt”) divided by the sum of Net Debt and total shareholders’ equity. We believe Net Debt and Net Debt-to-Capital, along with total long-term debt and shareholders’ equity are useful measures of our capital structure. A reconciliation of historical Debt-to-Capital to Net Debt-to-Capital is provided below under Results of Operations.
Net Revenues represent total revenues less commissions, transportation and other expenses and onboard and
other expenses (each of which is described under the Description of Certain Line Items heading). Net Yields represent Net Revenues per APCD. We utilize Net Revenues and Net Yields to manage our
business on a day-to-day basis as we believe that it is the most relevant measure of our pricing performancebecause it reflects the cruise revenues earned by us net of our most significant variable costs, which arecommissions, transportation and other expenses and onboard and other expenses. A reconciliation of historicalGross Yields to Net Yields is provided below under Results of Operations. We have not provided a quantitative reconciliation of projected Gross Yields to projected Net Yields due to the significant uncertainty in projectingthe costs deducted to arrive at this measure. Accordingly, we do not believe that reconciling information forsuch projected figures would be meaningful.
Occupancy, in accordance with cruise vacation industry practice, is calculated by dividing Passenger CruiseDays by APCD. A percentage in excess of 100% indicates that three or more passengers occupied some cabins.
Passenger Cruise Days represent the number of passengers carried for the period multiplied by the number
of days of their respective cruises. We believe Net Yields, Net Cruise Costs and Net Cruise Costs Excluding Fuel are our most relevant non-
GAAP financial measures. However, a significant portion of our revenue and expenses are denominated incurrencies other than the United States dollar. Because our reporting currency is the United States dollar, thevalue of these revenues and expenses can be affected by changes in currency exchange rates. Although suchchanges in local currency prices is just one of many elements impacting our revenues and expenses, it can be animportant element. For this reason, we also monitor Net Yields, Net Cruise Costs and Net Cruise CostsExcluding Fuel as if the current periods’ currency exchange rates had remained constant with the comparable prior periods’ rates, or on a “Constant Currency” basis.
It should be emphasized that Constant Currency is primarily used for comparing short-term changes and/or
projections. Over the longer term, changes in guest sourcing and shifting the amount of purchases betweencurrencies can significantly change the impact of the purely currency based fluctuations.
The use of certain significant non-GAAP measures, such as Net Yields, Net Cruise Costs and Net Cruise
Costs Excluding Fuel, allow us to perform capacity and rate analysis to separate the impact of known capacitychanges from other less predictable changes which affect our business. We believe these non-GAAP measures provide expanded insight to measure revenue and cost performance in
31
Table of Contents
addition to the standard United States GAAP based financial measures. There are no specific rules or regulationsfor determining non-GAAP and Constant Currency measures, and as such, there exists the possibility that theymay not be comparable to other companies within the industry.
Results of Operations
Our results of operations for the quarter and nine months ended September 30, 2012 were negatively impacted by the Costa Concordia incident which occurred in early 2012 during WAVE season (traditionally thefirst two months of the year where cruise lines experience disproportionately higher volume cruise sales),affecting our booking patterns. We still believe the impact of the Costa Concordia incident will not have asignificant long term impact to our business.
Our results of operations were also influenced by changes to our international distribution system mainly in Latin America implemented in late 2011 pursuant to which we began directly distributing certain of our cruisesrather than indirectly distributing them through charter arrangements. Our results were also impacted by certaindeployment initiatives including, but not limited to, increased deployment in Australia and China.
Our net income for the third quarter of 2012 was $367.8 million or $1.68 per share on a diluted basis as compared to net income of $399.0 million or $1.82 per share on a diluted basis for the third quarter of 2011. Significant items for the third quarter of 2012 include:
32
• Total revenues decreased 4.1% to $2.2 billion from $2.3 billion in 2011 partially due to the unfavorableimpact of fluctuations in exchange rates.
• Cruise operating expenses decreased 4.1% to $1.3 billion from $1.4 billion in 2011 partially due to the
favorable impact of changes in exchange rates. • Net Debt-to-Capital decreased to 46.4% as of September 30, 2012 compared to 49.5% as of
December 31, 2011. Similarly, our Debt-to-Capital ratio decreased to 47.2% as of September 30, 2012 compared to 50.3% as of December 31, 2011.
• We repurchased €255.0 million, or approximately $328.0 million, in aggregate principal amount of our
outstanding €1.0 billion 5.625% unsecured senior notes due 2014 through a debt tender offer and recorded a loss on early extinguishment of debt of approximately $7.5 million.
• We entered into a credit agreement which provides an unsecured Euro-denominated term loan facility in
an amount up to €365.0 million or approximately $469.6 million based on the exchange rate at September 30, 2012. See Note 4. Long-Term Debt in our consolidated financial statements for further information regarding this term loan.
• We entered into and borrowed $290.0 million under an unsecured term loan. See Note 4. Long-Term
Debt in our consolidated financial statements for further information regarding this term loan. • Our board of directors declared a cash dividend on our common stock of $0.12 per share, which was paid
in the fourth quarter of 2012.
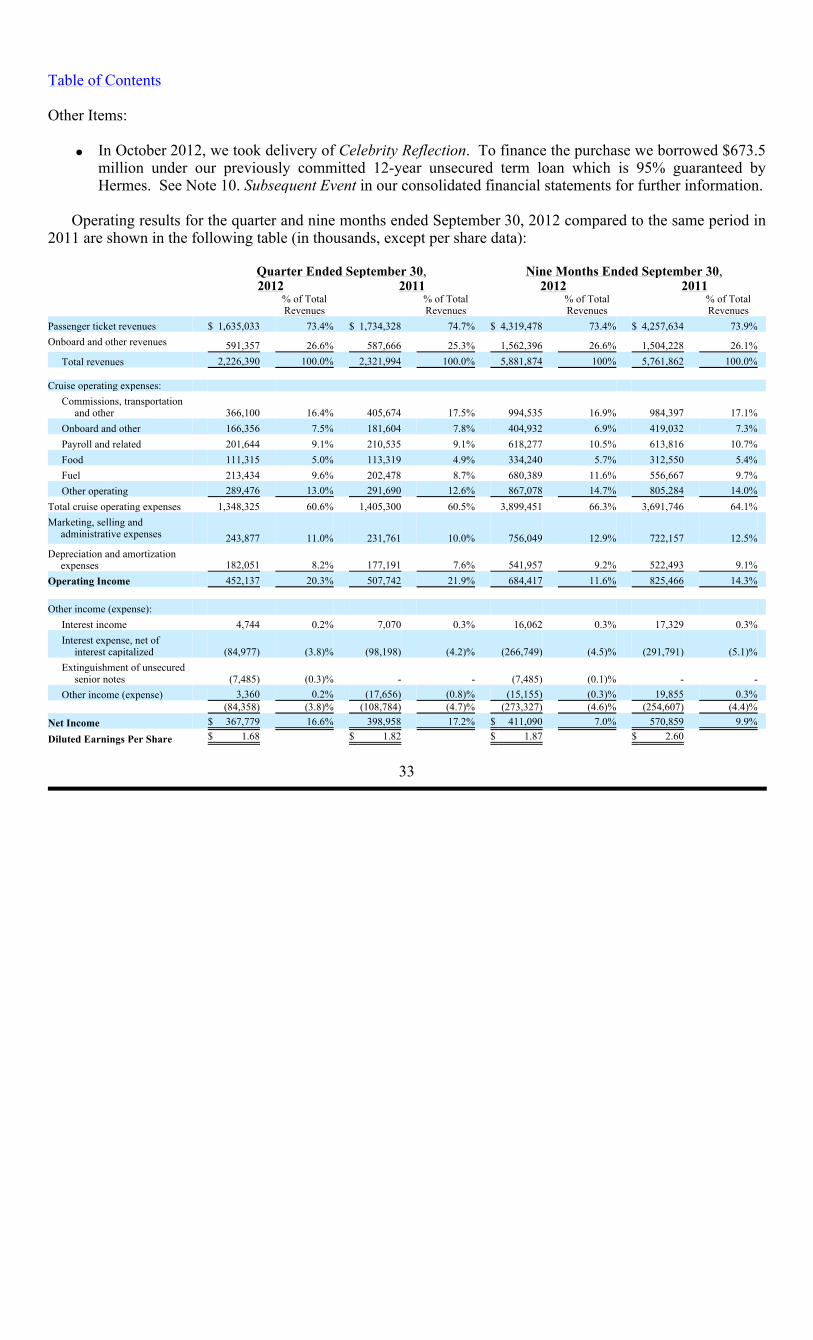
Table of Contents
Other Items:
Operating results for the quarter and nine months ended September 30, 2012 compared to the same period in
2011 are shown in the following table (in thousands, except per share data):
33
• In October 2012, we took delivery of Celebrity Reflection. To finance the purchase we borrowed $673.5 million under our previously committed 12-year unsecured term loan which is 95% guaranteed by Hermes. See Note 10. Subsequent Event in our consolidated financial statements for further information.
Quarter Ended September 30, Nine Months Ended September 30, 2012 2011 2012
2011
% of TotalRevenues
% of TotalRevenues
% of Total Revenues
% of Total Revenues
Passenger ticket revenues $ 1,635,033
73.4% $ 1,734,328 74.7% $ 4,319,478 73.4% $ 4,257,634 73.9%
Onboard and other revenues 591,357
26.6%
587,666
25.3%
1,562,396
26.6% 1,504,228
26.1%
Total revenues 2,226,390
100.0%
2,321,994
100.0%
5,881,874
100% 5,761,862
100.0%
Cruise operating expenses:
Commissions, transportation
and other 366,100
16.4%
405,674
17.5%
994,535
16.9% 984,397
17.1%
Onboard and other 166,356
7.5%
181,604
7.8%
404,932
6.9% 419,032
7.3%
Payroll and related 201,644
9.1% 210,535 9.1% 618,277 10.5% 613,816 10.7%
Food 111,315
5.0% 113,319 4.9% 334,240 5.7% 312,550 5.4%
Fuel 213,434
9.6%
202,478
8.7%
680,389
11.6% 556,667
9.7%
Other operating 289,476
13.0%
291,690
12.6%
867,078
14.7% 805,284
14.0%
Total cruise operating expenses 1,348,325
60.6% 1,405,300 60.5% 3,899,451 66.3% 3,691,746 64.1%
Marketing, selling and administrative expenses 243,877
11.0%
231,761
10.0%
756,049
12.9% 722,157
12.5%
Depreciation and amortization expenses
182,051 8.2%
177,191
7.6%
541,957
9.2% 522,493
9.1%
Operating Income 452,137
20.3%
507,742
21.9%
684,417
11.6% 825,466
14.3%
Other income (expense):
Interest income 4,744
0.2% 7,070 0.3% 16,062 0.3% 17,329 0.3%
Interest expense, net of interest capitalized
(84,977) (3.8)% (98,198) (4.2)% (266,749) (4.5)%
(291,791) (5.1)%Extinguishment of unsecured
senior notes (7,485)
(0.3)% - - (7,485) (0.1)% - -
Other income (expense) 3,360
0.2%
(17,656)
(0.8)%
(15,155)
(0.3)% 19,855
0.3%
(84,358) (3.8)%
(108,784)
(4.7)%
(273,327)
(4.6)% (254,607)
(4.4)%
Net Income $ 367,779
16.6% 398,958 17.2% $ 411,090 7.0% 570,859 9.9%
Diluted Earnings Per Share $ 1.68
$ 1.82 $ 1.87 $ 2.60
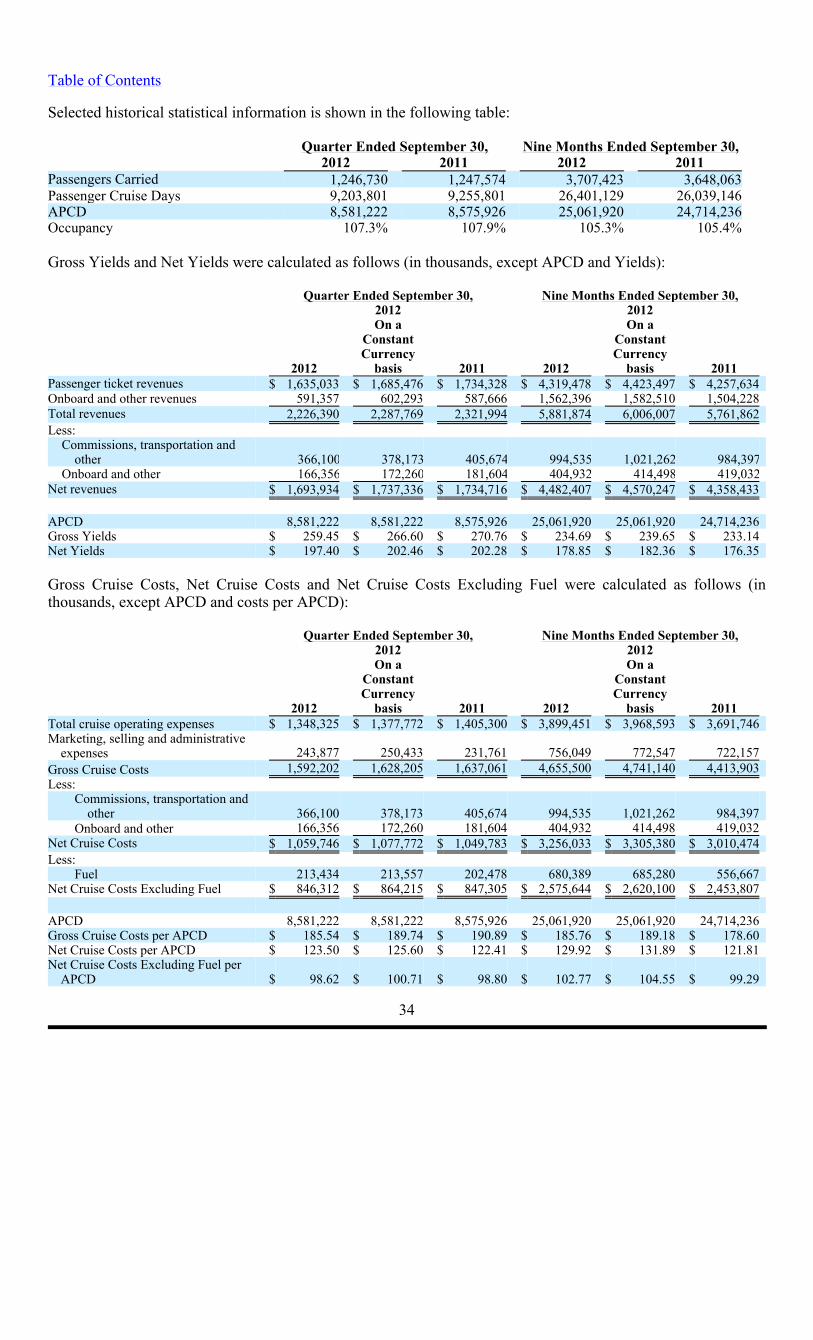
Table of Contents Selected historical statistical information is shown in the following table:
Gross Yields and Net Yields were calculated as follows (in thousands, except APCD and Yields):
Gross Cruise Costs, Net Cruise Costs and Net Cruise Costs Excluding Fuel were calculated as follows (inthousands, except APCD and costs per APCD):
34
Quarter Ended September 30,
Nine Months Ended September 30, 2012
2011
2012 2011
Passengers Carried 1,246,730
1,247,574
3,707,423 3,648,063
Passenger Cruise Days 9,203,801
9,255,801
26,401,129 26,039,146
APCD 8,581,222
8,575,926
25,061,920 24,714,236
Occupancy 107.3%
107.9%
105.3% 105.4%
Quarter Ended September 30, Nine Months Ended September 30,
2012
2012
2012
On aConstantCurrency
basis 2011 2012
On a Constant Currency
basis 2011Passenger ticket revenues
$ 1,635,033 $ 1,685,476 $ 1,734,328 $ 4,319,478
$ 4,423,497 $ 4,257,634
Onboard and other revenues
591,357 602,293 587,666 1,562,396
1,582,510 1,504,228
Total revenues
2,226,390
2,287,769
2,321,994
5,881,874
6,006,007
5,761,862
Less:
Commissions, transportation and other 366,100 378,173 405,674 994,535 1,021,262 984,397
Onboard and other 166,356 172,260 181,604 404,932 414,498 419,032
Net revenues
$ 1,693,934 $ 1,737,336 $ 1,734,716 $ 4,482,407
$ 4,570,247 $ 4,358,433 APCD
8,581,222 8,581,222 8,575,926 25,061,920
25,061,920 24,714,236
Gross Yields
$ 259.45
$ 266.60
$ 270.76
$ 234.69
$ 239.65
$ 233.14
Net Yields
$ 197.40
$ 202.46
$ 202.28
$ 178.85
$ 182.36
$ 176.35
Quarter Ended September 30,
Nine Months Ended September 30,
2012 2012
2012
On aConstantCurrency
basis
2011
2012
On aConstantCurrency
basis
2011
Total cruise operating expenses $ 1,348,325 $ 1,377,772 $ 1,405,300 $ 3,899,451
$ 3,968,593 $ 3,691,746Marketing, selling and administrative
expenses 243,877
250,433
231,761
756,049 772,547
722,157
Gross Cruise Costs 1,592,202 1,628,205 1,637,061 4,655,500
4,741,140 4,413,903Less:
Commissions, transportation and
other 366,100
378,173
405,674
994,535 1,021,262
984,397
Onboard and other 166,356
172,260
181,604
404,932 414,498
419,032
Net Cruise Costs $ 1,059,746
$ 1,077,772
$ 1,049,783
$ 3,256,033 $ 3,305,380
$ 3,010,474
Less:
Fuel 213,434 213,557 202,478 680,389
685,280 556,667Net Cruise Costs Excluding Fuel
$ 846,312
$ 864,215
$ 847,305
$ 2,575,644 $ 2,620,100
$ 2,453,807
APCD
8,581,222
8,581,222
8,575,926
25,061,920 25,061,920
24,714,236
Gross Cruise Costs per APCD $ 185.54
$ 189.74
$ 190.89
$ 185.76 $ 189.18
$ 178.60
Net Cruise Costs per APCD $ 123.50 $ 125.60 $ 122.41 $ 129.92
$ 131.89 $ 121.81Net Cruise Costs Excluding Fuel per
APCD $ 98.62
$ 100.71
$ 98.80
$ 102.77 $ 104.55
$ 99.29
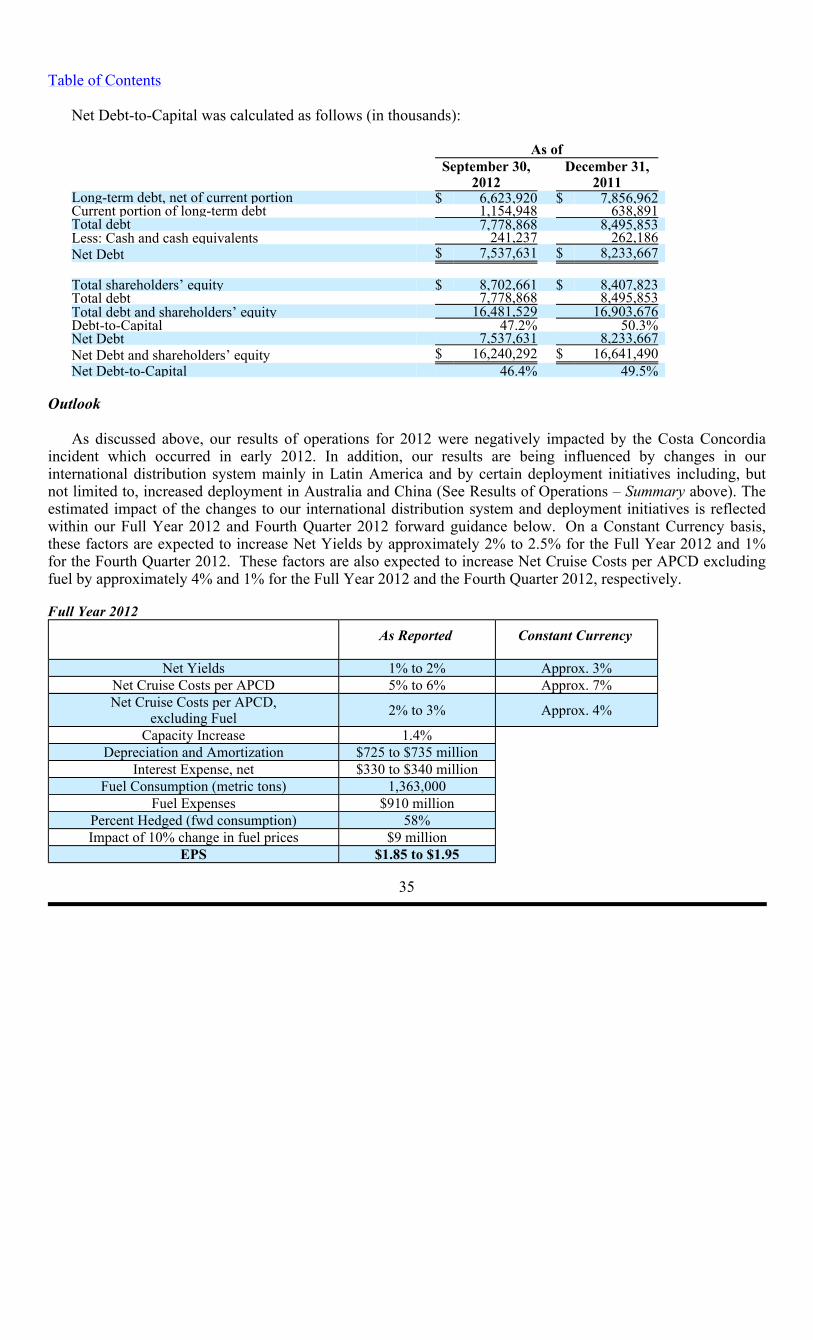
Table of Contents Net Debt-to-Capital was calculated as follows (in thousands):
Outlook
As discussed above, our results of operations for 2012 were negatively impacted by the Costa Concordiaincident which occurred in early 2012. In addition, our results are being influenced by changes in ourinternational distribution system mainly in Latin America and by certain deployment initiatives including, butnot limited to, increased deployment in Australia and China (See Results of Operations – Summary above). The estimated impact of the changes to our international distribution system and deployment initiatives is reflectedwithin our Full Year 2012 and Fourth Quarter 2012 forward guidance below. On a Constant Currency basis,these factors are expected to increase Net Yields by approximately 2% to 2.5% for the Full Year 2012 and 1%for the Fourth Quarter 2012. These factors are also expected to increase Net Cruise Costs per APCD excludingfuel by approximately 4% and 1% for the Full Year 2012 and the Fourth Quarter 2012, respectively. Full Year 2012
35
As of
September 30,
December 31,
2012
2011
Long-term debt, net of current portion
$ 6,623,920
$ 7,856,962
Current portion of long-term debt
1,154,948
638,891
Total debt
7,778,868
8,495,853
Less: Cash and cash equivalents 241,237 262,186Net Debt
$ 7,537,631
$ 8,233,667
Total shareholders’ equity
$ 8,702,661
$ 8,407,823
Total debt
7,778,868
8,495,853
Total debt and shareholders’ equity
16,481,529
16,903,676
Debt-to-Capital 47.2% 50.3%Net Debt 7,537,631 8,233,667Net Debt and shareholders’ equity
$ 16,240,292
$ 16,641,490
Net Debt-to-Capital 46.4% 49.5%
As Reported
Constant Currency
Net Yields 1% to 2% Approx. 3% Net Cruise Costs per APCD 5% to 6% Approx. 7% Net Cruise Costs per APCD,
excluding Fuel 2% to 3% Approx. 4% Capacity Increase 1.4%
Depreciation and Amortization $725 to $735 million
Interest Expense, net $330 to $340 million
Fuel Consumption (metric tons) 1,363,000
Fuel Expenses $910 million
Percent Hedged (fwd consumption) 58%
Impact of 10% change in fuel prices $9 million
EPS $1.85 to $1.95
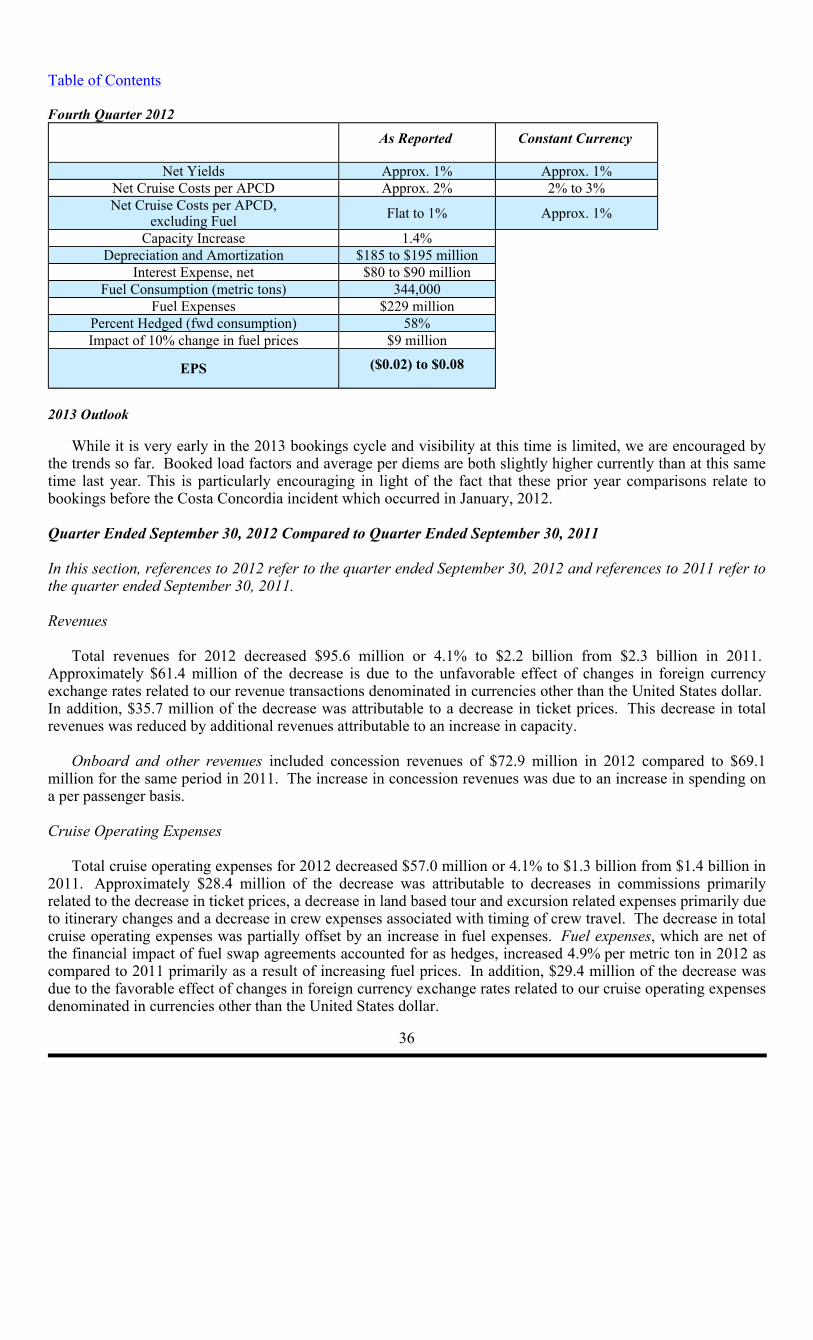
Table of Contents Fourth Quarter 2012
2013 Outlook
While it is very early in the 2013 bookings cycle and visibility at this time is limited, we are encouraged bythe trends so far. Booked load factors and average per diems are both slightly higher currently than at this sametime last year. This is particularly encouraging in light of the fact that these prior year comparisons relate tobookings before the Costa Concordia incident which occurred in January, 2012. Quarter Ended September 30, 2012 Compared to Quarter Ended September 30, 2011 In this section, references to 2012 refer to the quarter ended September 30, 2012 and references to 2011 refer tothe quarter ended September 30, 2011. Revenues
Total revenues for 2012 decreased $95.6 million or 4.1% to $2.2 billion from $2.3 billion in 2011. Approximately $61.4 million of the decrease is due to the unfavorable effect of changes in foreign currencyexchange rates related to our revenue transactions denominated in currencies other than the United States dollar. In addition, $35.7 million of the decrease was attributable to a decrease in ticket prices. This decrease in totalrevenues was reduced by additional revenues attributable to an increase in capacity.
Onboard and other revenues included concession revenues of $72.9 million in 2012 compared to $69.1
million for the same period in 2011. The increase in concession revenues was due to an increase in spending ona per passenger basis.
Cruise Operating Expenses
Total cruise operating expenses for 2012 decreased $57.0 million or 4.1% to $1.3 billion from $1.4 billion in2011. Approximately $28.4 million of the decrease was attributable to decreases in commissions primarilyrelated to the decrease in ticket prices, a decrease in land based tour and excursion related expenses primarily dueto itinerary changes and a decrease in crew expenses associated with timing of crew travel. The decrease in totalcruise operating expenses was partially offset by an increase in fuel expenses. Fuel expenses, which are net of the financial impact of fuel swap agreements accounted for as hedges, increased 4.9% per metric ton in 2012 ascompared to 2011 primarily as a result of increasing fuel prices. In addition, $29.4 million of the decrease wasdue to the favorable effect of changes in foreign currency exchange rates related to our cruise operating expensesdenominated in currencies other than the United States dollar.
36
As Reported
Constant Currency
Net Yields Approx. 1% Approx. 1% Net Cruise Costs per APCD Approx. 2% 2% to 3% Net Cruise Costs per APCD,
excluding Fuel Flat to 1% Approx. 1% Capacity Increase 1.4%
Depreciation and Amortization $185 to $195 million
Interest Expense, net $80 to $90 million
Fuel Consumption (metric tons) 344,000
Fuel Expenses $229 million
Percent Hedged (fwd consumption) 58%
Impact of 10% change in fuel prices $9 million
EPS ($0.02) to $0.08
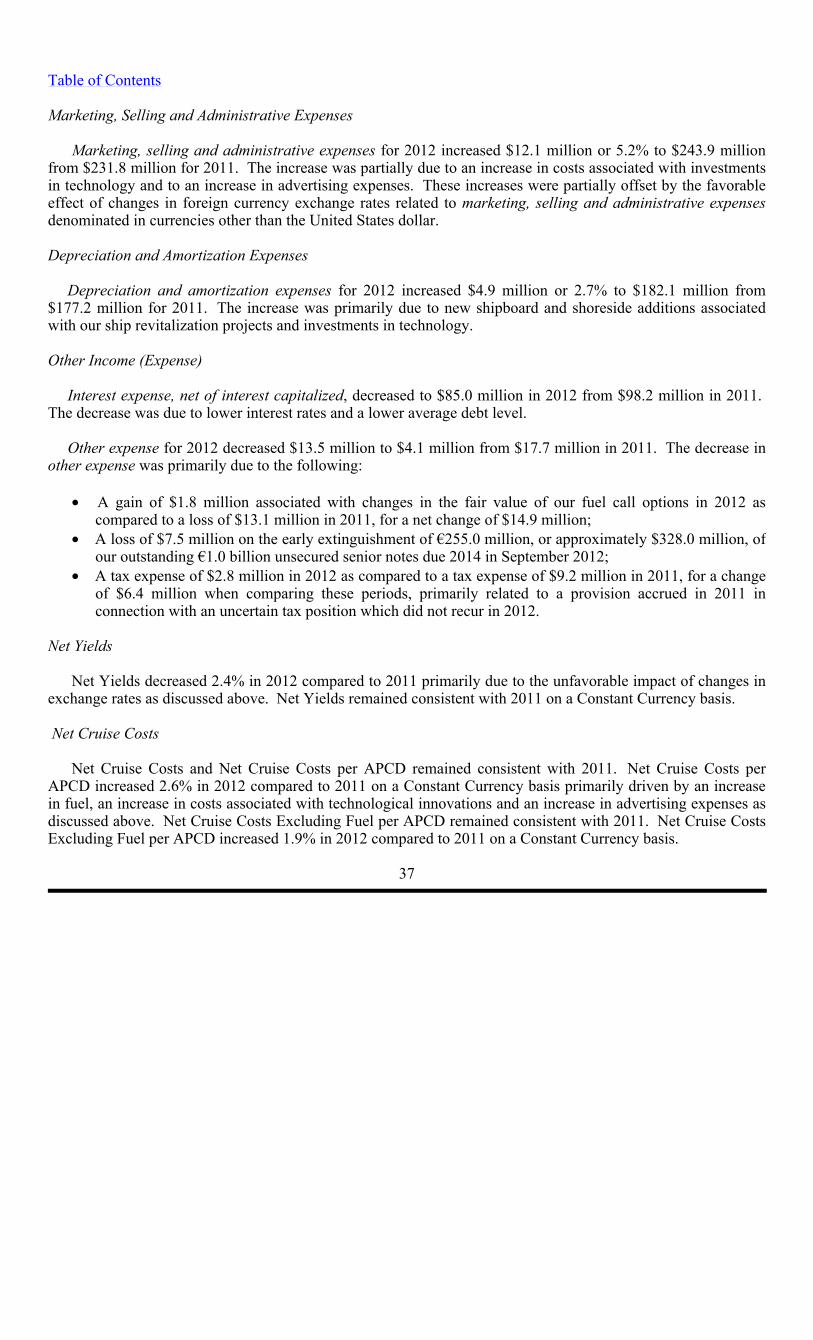
Table of Contents
Marketing, Selling and Administrative Expenses
Marketing, selling and administrative expenses for 2012 increased $12.1 million or 5.2% to $243.9 millionfrom $231.8 million for 2011. The increase was partially due to an increase in costs associated with investmentsin technology and to an increase in advertising expenses. These increases were partially offset by the favorableeffect of changes in foreign currency exchange rates related to marketing, selling and administrative expensesdenominated in currencies other than the United States dollar.
Depreciation and Amortization Expenses
Depreciation and amortization expenses for 2012 increased $4.9 million or 2.7% to $182.1 million from$177.2 million for 2011. The increase was primarily due to new shipboard and shoreside additions associatedwith our ship revitalization projects and investments in technology. Other Income (Expense)
Interest expense, net of interest capitalized, decreased to $85.0 million in 2012 from $98.2 million in 2011. The decrease was due to lower interest rates and a lower average debt level.
Other expense for 2012 decreased $13.5 million to $4.1 million from $17.7 million in 2011. The decrease inother expense was primarily due to the following:
• A gain of $1.8 million associated with changes in the fair value of our fuel call options in 2012 ascompared to a loss of $13.1 million in 2011, for a net change of $14.9 million;
• A loss of $7.5 million on the early extinguishment of €255.0 million, or approximately $328.0 million, of our outstanding €1.0 billion unsecured senior notes due 2014 in September 2012;
• A tax expense of $2.8 million in 2012 as compared to a tax expense of $9.2 million in 2011, for a changeof $6.4 million when comparing these periods, primarily related to a provision accrued in 2011 inconnection with an uncertain tax position which did not recur in 2012.
Net Yields
Net Yields decreased 2.4% in 2012 compared to 2011 primarily due to the unfavorable impact of changes inexchange rates as discussed above. Net Yields remained consistent with 2011 on a Constant Currency basis.
Net Cruise Costs
Net Cruise Costs and Net Cruise Costs per APCD remained consistent with 2011. Net Cruise Costs per
APCD increased 2.6% in 2012 compared to 2011 on a Constant Currency basis primarily driven by an increasein fuel, an increase in costs associated with technological innovations and an increase in advertising expenses asdiscussed above. Net Cruise Costs Excluding Fuel per APCD remained consistent with 2011. Net Cruise CostsExcluding Fuel per APCD increased 1.9% in 2012 compared to 2011 on a Constant Currency basis.
37
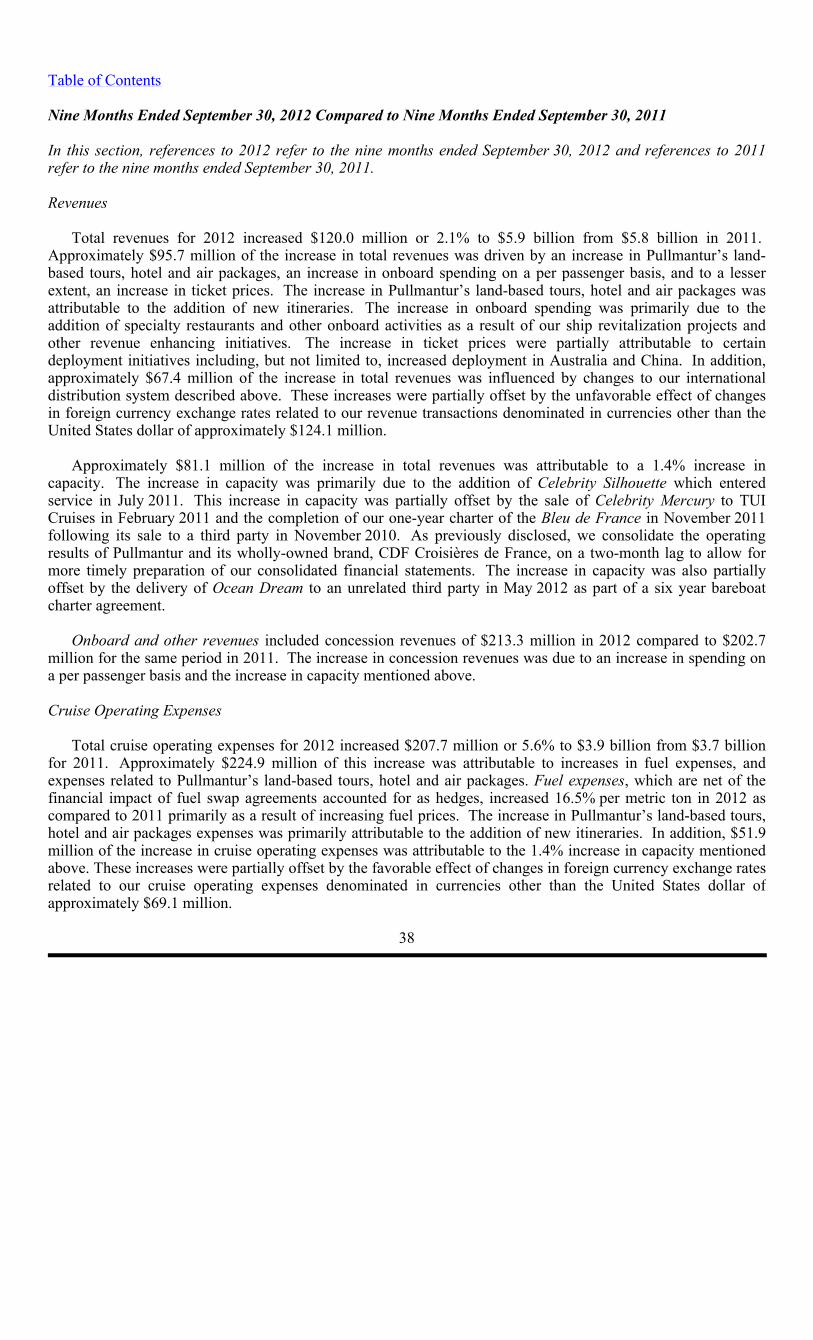
Table of Contents
Nine Months Ended September 30, 2012 Compared to Nine Months Ended September 30, 2011 In this section, references to 2012 refer to the nine months ended September 30, 2012 and references to 2011refer to the nine months ended September 30, 2011. Revenues
Total revenues for 2012 increased $120.0 million or 2.1% to $5.9 billion from $5.8 billion in 2011. Approximately $95.7 million of the increase in total revenues was driven by an increase in Pullmantur’s land-based tours, hotel and air packages, an increase in onboard spending on a per passenger basis, and to a lesserextent, an increase in ticket prices. The increase in Pullmantur’s land-based tours, hotel and air packages was attributable to the addition of new itineraries. The increase in onboard spending was primarily due to theaddition of specialty restaurants and other onboard activities as a result of our ship revitalization projects andother revenue enhancing initiatives. The increase in ticket prices were partially attributable to certaindeployment initiatives including, but not limited to, increased deployment in Australia and China. In addition,approximately $67.4 million of the increase in total revenues was influenced by changes to our internationaldistribution system described above. These increases were partially offset by the unfavorable effect of changesin foreign currency exchange rates related to our revenue transactions denominated in currencies other than theUnited States dollar of approximately $124.1 million.
Approximately $81.1 million of the increase in total revenues was attributable to a 1.4% increase in
capacity. The increase in capacity was primarily due to the addition of Celebrity Silhouette which entered service in July 2011. This increase in capacity was partially offset by the sale of Celebrity Mercury to TUI Cruises in February 2011 and the completion of our one-year charter of the Bleu de France in November 2011 following its sale to a third party in November 2010. As previously disclosed, we consolidate the operatingresults of Pullmantur and its wholly-owned brand, CDF Croisières de France, on a two-month lag to allow for more timely preparation of our consolidated financial statements. The increase in capacity was also partiallyoffset by the delivery of Ocean Dream to an unrelated third party in May 2012 as part of a six year bareboatcharter agreement.
Onboard and other revenues included concession revenues of $213.3 million in 2012 compared to $202.7
million for the same period in 2011. The increase in concession revenues was due to an increase in spending ona per passenger basis and the increase in capacity mentioned above.
Cruise Operating Expenses
Total cruise operating expenses for 2012 increased $207.7 million or 5.6% to $3.9 billion from $3.7 billionfor 2011. Approximately $224.9 million of this increase was attributable to increases in fuel expenses, andexpenses related to Pullmantur’s land-based tours, hotel and air packages. Fuel expenses, which are net of the financial impact of fuel swap agreements accounted for as hedges, increased 16.5% per metric ton in 2012 ascompared to 2011 primarily as a result of increasing fuel prices. The increase in Pullmantur’s land-based tours, hotel and air packages expenses was primarily attributable to the addition of new itineraries. In addition, $51.9million of the increase in cruise operating expenses was attributable to the 1.4% increase in capacity mentionedabove. These increases were partially offset by the favorable effect of changes in foreign currency exchange ratesrelated to our cruise operating expenses denominated in currencies other than the United States dollar ofapproximately $69.1 million.
38
Table of Contents
Marketing, Selling and Administrative Expenses
Marketing, selling and administrative expenses for 2012 increased $33.9 million or 4.7% to $756.0 millionfrom $722.2 million for 2011. The increase is due to an increase in payroll and benefits due to higher employeeheadcount partially resulting from the changes to our international distribution system and to an increase in costsassociated with technological innovations. These increases were partially offset by the favorable effect ofchanges in foreign currency exchange rates related to our marketing, selling and administrative expensesdenominated in currencies other than the United States dollar.
Depreciation and Amortization Expenses
Depreciation and amortization expenses for 2012 increased $19.5 million or 3.7% to $542.0 million from$522.5 million for 2011. The increase is primarily due to the addition of Celebrity Silhouette which entered service in July 2011. This increase was partially offset by the sale of Celebrity Mercury to TUI Cruises in February 2011. Other Income (Expense)
Interest expense, net of interest capitalized, decreased to $266.7 million in 2012 from $291.8 million in 2011. The decrease was due to lower interest rates and a lower average debt level.
Other expense was $22.6 million in 2012 compared to other income of $19.9 million in 2011 for a net change of $42.5 million when comparing these periods. The change in other expense was primarily due to thefollowing:
• A loss of $5.7 million associated with changes in the fair value of our fuel call options in 2012 ascompared to a gain of $11.7 million in 2011, for a net change of $17.4 million;
• A loss of $2.4 million due to ineffectiveness on our fuel swaps in 2012 as compared to a gain of $7.0million in 2011, for a net change of $9.4 million;
• A loss of $7.5 million on the early extinguishment of €255.0 million, or approximately $328.0 of our outstanding €1.0 billion unsecured senior notes due 2014 in September 2012.
Net Yields
Net Yields increased 1.4% in 2012 compared to 2011 primarily due to the changes to our international
distribution system, an increase in Pullmantur’s land based tours, hotel and air packages revenue and to anincrease in ticket prices partially attributable to the deployment initiatives. Net Yields increased 3.4% in 2012compared to 2011 on a Constant Currency basis.
Net Cruise Costs
Net Cruise Costs increased 8.2% in 2012 compared to 2011 due to the 1.4% increase in capacity and a 6.7%increase in Net Cruise Cost per APCD. The increase in Net Cruise Costs per APCD was primarily driven by anincrease in fuel and Pullmantur’s land-based tours, hotel and air packages expenses as discussed above. Inaddition, the increase in Net Cruise Cost per APCD was due to the changes in our international distributionsystem and certain deployment initiatives. Net Cruise Costs per APCD increased 8.3% in 2012 compared to2011 on a Constant Currency basis. Net Cruise Costs Excluding Fuel per APCD increased 3.5% in 2012compared to 2011. Net Cruise Costs Excluding Fuel per APCD increased 5.3% in 2012 compared to 2011 on aConstant Currency basis.
39
Table of Contents
Recently Adopted, and Future Application of, Accounting Standards Refer to Note 2. Summary of Significant Accounting Policies to our consolidated financial statements for furtherinformation on Recently Adopted Accounting Standards and Recent Accounting Pronouncements. Liquidity and Capital Resources Sources and Uses of Cash
Cash flow generated from operations provides us with a significant source of liquidity. Net cash provided by operating activities decreased $100.5 million to $1.2 billion for the first nine months of 2012 compared to $1.3billion for the same period in 2011. This decrease was primarily a result of the timing of payments on ouraccounts payable and accrued expenses and other liabilities and to a lower rate of increase in customer deposits.
Net cash used in investing activities was $383.3 million for the first nine months of 2012 compared to $775.2million for the same period in 2011. The change was primarily due to a decrease in capital expenditures. Duringthe first nine months of 2012, we used cash for capital expenditures of $429.3 million, down from $1.0 billionfor the same period in 2011. For the first nine months of 2012 and 2011, capital expenditures primarily consistedof payments for our ship revitalization projects and the delivery of Celebrity Silhouette, respectively. In addition, we provided $110.7 million under a debt facility to one of our unconsolidated affiliates during the firstnine months of 2011 which did not recur in 2012. The change was also due to $290.0 million of proceedsreceived from the sale of Celebrity Mercury and $55.0 million of proceeds received from the sale of Bleu de France during the first nine months of 2011 which did not recur in 2012.
Net cash used in financing activities was $801.5 million for the first nine months of 2012 compared to $451.0 million for the same period in 2011. The change was primarily due to a net decrease in debt facilitydrawings of $493.4 million during the first nine months of 2012 as compared to the same period in 2011. The netdecrease in debt facility drawings was primarily due to amounts received under an unsecured term loan of $632.0million to purchase Celebrity Silhouette during the first nine months of 2011 which did not recur in 2012 and to adecrease of $135.0 million in amounts drawn under our unsecured revolving credit facilities, offset by amountsborrowed under an unsecured term loan of $290.0 million in the same period in 2012. The increase in net cashused in financing activities was partially offset by the decrease in repayments of debt of approximately $178.5million. The decrease in repayments of debt was primarily due to the repayment of a $500.0 million unsecuredsenior note and a prepayment of $200.0 million on our Allure of the Seas unsecured term loan during the first nine months of 2011 as compared to $344.2 million paid in conjunction with the repurchase of €255.0 million or approximately $328.0 million in aggregate principal amount of our €1.0 billion 5.625% unsecured senior notes and the repayment of a $100.0 million unsecured term loan during the same period in 2012. Future Capital Commitments
Our future capital commitments consist primarily of new ship orders. As of September 30, 2012, we have Celebrity Reflection under construction, two Project Sunshine ships and TUI Cruises’ first newbuild ship on order for an aggregate additional capacity of approximately 13,700 berths.
40
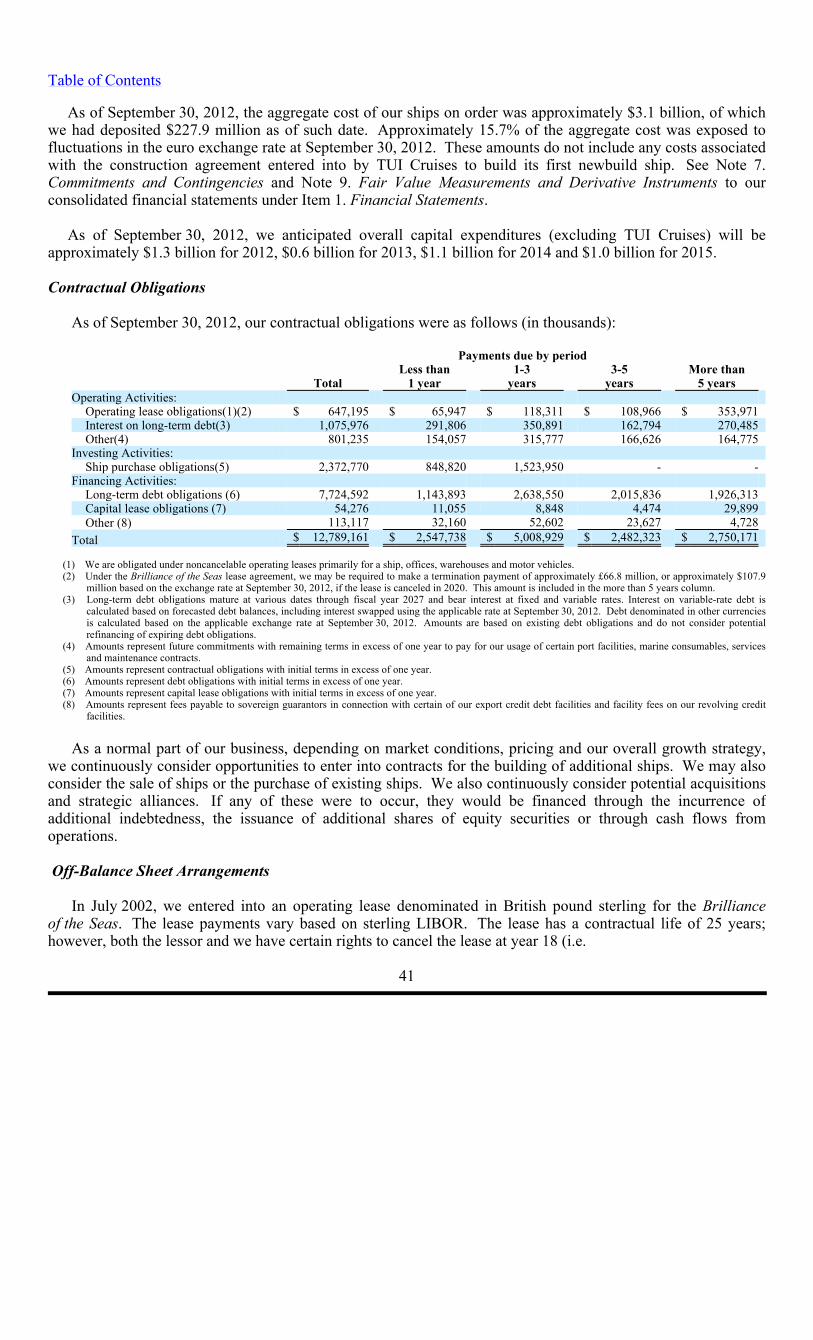
Table of Contents
As of September 30, 2012, the aggregate cost of our ships on order was approximately $3.1 billion, of which we had deposited $227.9 million as of such date. Approximately 15.7% of the aggregate cost was exposed tofluctuations in the euro exchange rate at September 30, 2012. These amounts do not include any costs associatedwith the construction agreement entered into by TUI Cruises to build its first newbuild ship. See Note 7.Commitments and Contingencies and Note 9. Fair Value Measurements and Derivative Instruments to our consolidated financial statements under Item 1. Financial Statements.
As of September 30, 2012, we anticipated overall capital expenditures (excluding TUI Cruises) will be approximately $1.3 billion for 2012, $0.6 billion for 2013, $1.1 billion for 2014 and $1.0 billion for 2015. Contractual Obligations
As of September 30, 2012, our contractual obligations were as follows (in thousands):
(1) We are obligated under noncancelable operating leases primarily for a ship, offices, warehouses and motor vehicles. (2) Under the Brilliance of the Seas lease agreement, we may be required to make a termination payment of approximately £66.8 million, or approximately $107.9
million based on the exchange rate at September 30, 2012, if the lease is canceled in 2020. This amount is included in the more than 5 years column. (3) Long-term debt obligations mature at various dates through fiscal year 2027 and bear interest at fixed and variable rates. Interest on variable-rate debt is
calculated based on forecasted debt balances, including interest swapped using the applicable rate at September 30, 2012. Debt denominated in other currenciesis calculated based on the applicable exchange rate at September 30, 2012. Amounts are based on existing debt obligations and do not consider potentialrefinancing of expiring debt obligations.
(4) Amounts represent future commitments with remaining terms in excess of one year to pay for our usage of certain port facilities, marine consumables, servicesand maintenance contracts.
(5) Amounts represent contractual obligations with initial terms in excess of one year. (6) Amounts represent debt obligations with initial terms in excess of one year. (7) Amounts represent capital lease obligations with initial terms in excess of one year. (8) Amounts represent fees payable to sovereign guarantors in connection with certain of our export credit debt facilities and facility fees on our revolving credit
facilities.
As a normal part of our business, depending on market conditions, pricing and our overall growth strategy,we continuously consider opportunities to enter into contracts for the building of additional ships. We may alsoconsider the sale of ships or the purchase of existing ships. We also continuously consider potential acquisitionsand strategic alliances. If any of these were to occur, they would be financed through the incurrence ofadditional indebtedness, the issuance of additional shares of equity securities or through cash flows fromoperations. Off-Balance Sheet Arrangements
In July 2002, we entered into an operating lease denominated in British pound sterling for the Brilliance
of the Seas. The lease payments vary based on sterling LIBOR. The lease has a contractual life of 25 years;however, both the lessor and we have certain rights to cancel the lease at year 18 (i.e.
41
Payments due by period
Less than 1-3 3-5 More than
Total
1 year
years years
5 years
Operating Activities:
Operating lease obligations(1)(2) $ 647,195 $ 65,947 $ 118,311 $ 108,966 $ 353,971
Interest on long-term debt(3) 1,075,976
291,806
350,891
162,794
270,485
Other(4) 801,235
154,057
315,777
166,626
164,775
Investing Activities:
Ship purchase obligations(5) 2,372,770
848,820
1,523,950
-
-
Financing Activities:
Long-term debt obligations (6) 7,724,592 1,143,893 2,638,550 2,015,836 1,926,313
Capital lease obligations (7) 54,276
11,055
8,848
4,474
29,899
Other (8) 113,117
32,160
52,602
23,627
4,728
Total $ 12,789,161
$ 2,547,738
$ 5,008,929
$ 2,482,323
$ 2,750,171
Table of Contents
2020) upon advance notice given approximately one year prior to cancellation. In the event of early terminationat year 18, we have the option to cause the sale of the vessel at its fair value and to use the proceeds towards theapplicable termination payment. Alternatively, we could opt at such time to make a termination payment ofapproximately ₤66.8 million, or approximately $107.9 million based on the exchange rate at September 30, 2012and relinquish our right to cause the sale of the vessel. Under current circumstances we do not believe earlytermination of this lease is probable.
Under the Brilliance of the Seas operating lease, we have agreed to indemnify the lessor to the extent its
after-tax return is negatively impacted by unfavorable changes in corporate tax rates, capital allowancedeductions and certain unfavorable determinations which may be made by United Kingdom tax authorities.These indemnifications could result in an increase in our lease payments. We are unable to estimate themaximum potential increase in our lease payments due to the various circumstances, timing or a combination ofevents that could trigger such indemnifications. The United Kingdom tax authorities are disputing the lessor’s accounting treatment of the lease and the lessor and tax authorities are in discussions on the matter. If thecharacterization of the lease is ultimately determined to be incorrect, we could be required to indemnify thelessor under certain circumstances. The lessor has advised us that they believe their characterization of the leaseis correct. Based on the foregoing and our review of available information, we do not believe an indemnificationpayment is probable. However, if the lessor loses its dispute and we are required to indemnify the lessor, wecannot at this time predict the impact that such an occurrence would have on our financial condition and resultsof operations.
Some of the contracts that we enter into include indemnification provisions that obligate us to make
payments to the counterparty if certain events occur. These contingencies generally relate to changes in taxes,increased lender capital costs and other similar costs. The indemnification clauses are often standard contractualterms and are entered into in the normal course of business. There are no stated or notional amounts included inthe indemnification clauses and we are not able to estimate the maximum potential amount of future payments, ifany, under these indemnification clauses. We have not been required to make any payments under suchindemnification clauses in the past and, under current circumstances, we do not believe an indemnificationobligation is probable.
In connection with the sale of Celebrity Mercury, we and TUI AG each guaranteed repayment of 50% of an
€180.0 million 5-year amortizing bank loan provided to TUI Cruises, of which €157.5 million, or approximately $203.0 million based on the exchange rate at September 30, 2012, remains outstanding as of September 30,2012. Based on current facts and circumstances, we do not believe potential obligations under this guarantee areprobable.
TUI Cruises entered into a construction agreement with STX Finland that includes certain restrictions on each
of our and TUI AG’s ability to reduce our current ownership interest in TUI Cruises below 37.5% through theconstruction period. In addition, the bank credit facility agreement for the financing of the ship extends thisrestriction through 2019.
Other than the items described above, we are not party to any other off-balance sheet arrangements, including guarantee contracts, retained or contingent interest, certain derivative instruments and variable interest entities,that either have, or are reasonably likely to have, a current or future material effect on our financial position.
42
Table of Contents
Funding Needs and Sources
We have significant contractual obligations of which the capital expenditures associated with our shippurchases and our debt service obligations represent our largest funding needs. We have approximately $2.5billion in contractual obligations due during the twelve-month period ending September 30, 2013, of whichapproximately $848.8 million relates to the acquisition of Celebrity Reflection along with progress payments on our Project Sunshine ships, $1.1 billion relates to debt maturities and $291.8 million relates to interest on ourlong-term debt. In addition, we have $10.2 billion in contractual obligations due beyond the twelve-month period ending September 30, 2013 of which debt maturities, interest on our long-term debt and ship purchaseobligations represent $6.6 billion, $784.0 million and $1.5 billion, respectively. We have historically relied on acombination of cash flows provided by operations, drawdowns under our available credit facilities, theincurrence of additional debt and/or the refinancing of our existing debt and the issuance of additional shares ofequity securities to fund these obligations.
As of September 30, 2012, our liquidity was $1.9 billion, consisting of approximately $241.2 million in cash
and cash equivalents and $1.7 billion available under our unsecured credit facilities. We had a working capital deficit of $2.8 billion as of September 30, 2012 as compared to a working capital
deficit of $2.1 billion as of December 31, 2011. Similar to others in our industry, we operate with a substantialworking capital deficit. This deficit is mainly attributable to the fact that, under our business model, a vastmajority of our passenger ticket receipts are collected in advance of the applicable sailing date. These advancepassenger receipts remain a current liability until the sailing date. The cash generated from these advancereceipts is used interchangeably with cash on hand from other sources, such as our revolving credit facilities andother cash from operations. The cash received as advanced receipts can be used to fund operating expenses forthe applicable future sailing or otherwise, pay down our revolving credit facilities, invest in long terminvestments or any other use of cash. In addition, we have a relatively low-level of accounts receivable and rapid turnover results in a limited investment in inventories. We generate substantial cash flows from operations andour business model, along with our unsecured revolving credit facilities, has historically allowed us to maintainthis working capital deficit and still meet our operating, investing and financing needs. We expect that we willcontinue to have working capital deficits in the future.
As of September 30, 2012, we had Celebrity Reflection on order. In October 2012, we took delivery of theship and borrowed $673.5 million under a previously committed unsecured term loan to finance the purchase.See Note 10. Subsequent Events for additional information. As of September 30, 2012, we also had on order twoProject Sunshine ships in Germany each of which has committed unsecured bank financing arrangements whichinclude sovereign financing guarantees. 50% of the facility for the second Project Sunshine ship remains subjectto syndication prior to delivery. TUI Cruises has a committed bank financing arrangement for their newbuild order, which includes a sovereign financing guarantee.
During the third quarter of 2012, we entered into a credit agreement which provides an unsecured Euro-denominated term loan facility in an amount up to €365.0 million, or approximately $469.6 million based on theexchange rate at September 30, 2012. We have the ability to draw on this facility at any time on or prior toJune 30, 2013. As of October 25, 2012, we have not drawn on this facility. All amounts borrowed under thefacility will be due and payable at maturity in July 2017. Interest on the loan accrues at a floating rate based onEURIBOR plus the applicable margin. The applicable margin varies with our debt rating and would currently be3.0%. In addition, we are subject to a commitment fee of 1.05% per annum of the undrawn amount. Weanticipate the proceeds from this loan facility will be used primarily as part of our refinancing strategy for ourbond maturities in 2013 and 2014. In connection with this transaction, we prepaid our $100.0 million unsecuredfloating rate term loan due
43
Table of Contents
September 2013. In addition to the €365.0 million in available capacity under this term loan and also as part ofour refinancing strategy, since the beginning of the year, we have raised $233.0 million in additional revolvingcredit capacity.
In August 2012, we borrowed $290.0 million under an unsecured term loan. All amounts borrowed under the facility will be due and payable at maturity in February 2016. Interest on the loan accrues at a floating rate basedon LIBOR plus the applicable margin. The applicable margin varies with our debt rating and is 2.5% as ofSeptember 30, 2012. The proceeds from this loan facility were used to reduce outstanding balances on ourrevolving credit facilities.
In September 2012, we repurchased €255.0 million or approximately $328.0 million in aggregate principal amount of our €1.0 billion 5.625% unsecured senior notes due 2014 through a debt tender offer conductedoutside of the United States. Total consideration paid in connection with the tender offer, including premiumand related fees and expenses was $344.2 million. The repurchase of the unsecured senior notes resulted in aloss on the early extinguishment of debt of approximately $7.5 million which was recognized in earningsimmediately and is reported within extinguishment of unsecured senior notes in our consolidated statements of comprehensive income (loss). We may from time to time repurchase our debt in the open market, through debttender offers, exchanges of debt securities, by exercising redemption rights or in privately negotiatedtransactions. We may also refinance existing debt or exchange existing debt for newly issued debt obligations.
We continue our focus on ensuring adequate cash and liquidity. We are committed to improving our cost focus and continue to implement cost containment initiatives including a number of initiatives to reduce energyconsumption and, by extension, fuel costs. These include the design of more fuel efficient ships and theimplementation of other hardware and energy efficiencies. We anticipate that our cash flows from operations,our current available credit facilities and our current and anticipated financing arrangements will be adequate tomeet our capital expenditures and debt repayments over the next twelve-month period. In addition, we may elect to fund our contractual obligations through other means if opportunities arise. During the third quarter of 2012,we declared a cash dividend on our common stock of $0.12 per share, which was paid in the fourth quarter of2012.
If (i) any person other than A. Wilhelmsen AS. and Cruise Associates and their respective affiliates (the “Applicable Group”) acquires ownership of more than 30% of our common stock and the Applicable Groupowns less of our common stock than such person, or (ii) subject to certain exceptions, during any 24-month period, a majority of the Board is no longer comprised of individuals who were members of the Board on thefirst day of such period, we may be obligated to prepay indebtedness outstanding under the majority of our creditfacilities, which we may be unable to replace on similar terms. Certain of our outstanding debt securities alsocontain change of control provisions that would be triggered by the acquisition of greater than 50% of ourcommon stock by a person other than a member of the Applicable Group coupled with a ratings downgrade. Ifthis were to occur, it would have an adverse impact on our liquidity and operations. Debt Covenants
Certain of our financing agreements contain covenants that require us, among other things, to maintainminimum net worth of at least $5.6 billion and a fixed charge coverage ratio of at least 1.25x and to limit our netdebt-to-capital ratio to no more than 62.5%. The fixed charge coverage ratio is calculated by dividing net cashfrom operations for the past four quarters by the sum of dividend payments plus scheduled principal debtpayments in excess of any new financings for the past four
44
Table of Contents
quarters. Our minimum net worth and maximum net debt-to-capital calculations exclude the impact of accumulated other comprehensive (loss) income on total shareholders’ equity. We are well in excess of all debt covenant requirements as of September 30, 2012. The specific covenants and related definitions can be found inthe applicable debt agreements, the majority of which have been previously filed with the Securities andExchange Commission. Item 3. Quantitative and Qualitative Disclosures About Market Risk Interest Rate Risk
During the second quarter of 2012, we entered into forward-starting interest rate swap agreements that hedge the anticipated unsecured amortizing term loans that will finance our purchase of the first and second ProjectSunshine ships. Forward-starting interest rate swaps hedging the first Project Sunshine ship loan will effectivelyconvert the interest rate for $735.0 million of the anticipated loan balance from LIBOR plus 1.30% to a fixed rateof 3.74% (inclusive of margin) beginning in October 2014. Forward-starting interest rate swaps hedging the second Project Sunshine ship loan will effectively convert the interest rate for $725.0 million of the anticipatedloan balance from LIBOR plus 1.30% to a fixed rate of 3.86% (inclusive of margin) beginning in April 2015.
During the third quarter of 2012, we terminated our interest rate swap agreements that effectively changed
$350.0 million of debt with a fixed rate of 7.25% to LIBOR-based floating rate debt. Terminating the swaps did not result in a gain or loss. Upon termination of these swaps, we received net cash proceeds of approximately$60.6 million.
The notional amount of interest rate swap agreements related to outstanding debt and on our current
unfunded financing arrangements as of September 30, 2012 and December 31, 2011 was $2.4 billion and $1.3billion, respectively. Foreign Currency Exchange Rate Risk
During the second quarter of 2012, we entered into foreign currency collar options to hedge a portion of ourforeign currency exposure on the construction contract price for the second Project Sunshine ship. These optionsmature in April 2015.
During the third quarter of 2012, we terminated our cross currency swap agreements that effectively changed
€150.0 million of our €1.0 billion unsecured senior notes which bear interest at a fixed rate of 5.625%, to $190.9million with a fixed rate of 6.68%. Upon termination of these swaps, we received net cash proceeds ofapproximately $9.1 million and deferred a loss of $2.6 million.
The notional amount of outstanding foreign exchange contracts including our forward contracts, cross
currency swap agreements and collar options as of September 30, 2012 and December 31, 2011 was $1.9 billionand $0.9 billion, respectively. Fuel Price Risk
During the third quarter of 2012, we terminated our remaining fuel call options by selling offsetting fuel calloptions. Upon termination, we received net cash proceeds of approximately $10.7 million.
Other than these changes there have been no significant developments or material changes with respect to our
exposure to the market risks previously reported in our annual report on Form 10-K for the year ended December 31, 2011. For a further discussion of our market risks, refer to Part II, Item 7A. Quantitative and Qualitative Disclosures About Market Risk in our annual report on Form 10-K for the year ended December 31, 2011.
45
Table of Contents
Item 4. Controls and Procedures Evaluation of Disclosure Controls and Procedures
Our management, with the participation of our Chairman and Chief Executive Officer and Vice Chairmanand Chief Financial Officer, conducted an evaluation of the effectiveness of our disclosure controls andprocedures, as such term is defined in Exchange Act Rule 13a-15(e), as of the end of the period covered by this report. Based upon such evaluation, our Chairman and Chief Executive Officer and Vice Chairman and ChiefFinancial Officer concluded that those controls and procedures are effective to provide reasonable assurance thatinformation required to be disclosed by us in the reports that we file or submit under the Exchange Act isaccumulated and communicated to management, including our Chairman and Chief Executive Officer and ourVice Chairman and Chief Financial Officer, as appropriate, to allow timely decisions regarding requireddisclosure and are effective to provide reasonable assurance that such information is recorded, processed,summarized and reported within the time periods specified by the SEC’s rules and forms.
Changes in Internal Control Over Financial Reporting
There were no changes in our internal control over financial reporting identified in connection with theevaluation required by paragraph (d) of Exchange Act Rule 13a-15 during the quarter ended September 30, 2012 that have materially affected, or are reasonably likely to materially affect, our internal control over financialreporting.
Inherent Limitations on Effectiveness of Controls
It should be noted that any system of controls, however well designed and operated, can provide onlyreasonable, and not absolute, assurance that the objectives of the system will be met. In addition, the design ofany control system is based in part upon certain assumptions about the likelihood of future events. Because ofthese and other inherent limitations of control systems, there is only reasonable assurance that our controls willsucceed in achieving their goals under all potential future conditions.
46
Table of Contents
PART II. OTHER INFORMATION Item 1. Legal Proceedings
As previously reported in our quarterly report on Form 10-Q for the quarter ended March 31, 2012, between August 1, 2011 and September 8, 2011, three similar purported class action lawsuits were filed againstus and certain of our current and former officers in the U.S. District Court of the Southern District of Florida. The cases have since been consolidated and a consolidated amended complaint was filed on February 17, 2012. The consolidated amended complaint was filed on behalf of a purported class of purchasers of our common stockduring the period from October 26, 2010 through July 27, 2011 and names the Company, our Chairman andCEO, our CFO, the President and CEO of our Royal Caribbean International brand and the former President andCEO of our Celebrity Cruises brand as defendants. The consolidated amended complaint alleges violations ofSection 10(b) of the Securities Exchange Act of 1934 and SEC Rule 10b-5 as well as, in the case of the individual defendants, the control person provisions of the Securities Exchange Act. The complaint principallyalleges that the defendants knowingly made incorrect statements concerning the Company’s outlook for 2011 by not taking into proper account lagging European and Mediterranean bookings. The consolidated amendedcomplaint seeks unspecified damages, interest, and attorneys’ fees. We filed a motion to dismiss the complaint on April 9, 2012. We believe the claims made against us are without merit and we intend to vigorously defendourselves against them.
As previously reported in our annual report on Form 10-K for the year ended December 31, 2011, a class
action complaint was filed in June 2011 against Royal Caribbean Cruises Ltd. in the United States District Courtfor the Southern District of Florida on behalf of a purported class of stateroom attendants employed onboardRoyal Caribbean International cruise vessels alleging that they were required to pay other crew members to helpwith their duties in violation of the U.S. Seaman’s Wage Act. The lawsuit also alleges that certain stateroomattendants were required to work back of house assignments without the ability to earn gratuities in violation ofthe U.S. Seaman’s Wage Act. Plaintiffs seek judgment for damages, wage penalties and interest in anindeterminate amount. In May 2012, the Court granted our motion to dismiss the complaint on the basis that theapplicable collective bargaining agreement requires any such claims to be arbitrated. Plaintiff’s appeal of this decision was dismissed for lack of jurisdiction by the United States Court of Appeals, 11 Circuit. We believe the claims made against us are without merit and we intend to vigorously defend ourselves against them.
As previously reported in our annual report on Form 10-K for the year ended December 31, 2011, we commenced an action in June 2010 in the United States District Court for Puerto Rico seeking a declaratoryjudgment that Puerto Rico’s distributorship laws do not apply to our relationship with an internationalrepresentative located in Puerto Rico. In September 2010, that international representative filed a number ofcounterclaims against Royal Caribbean Cruises Ltd. and Celebrity Cruises Inc. alleging violations of PuertoRico’s distributorship laws, bad faith breach of contract, tortious interference with contract, violations of variousfederal and state antitrust and unfair competition laws. In August 2012, the parties settled their disputes anddismissed their respective claims with prejudice. The impact of the settlement is immaterial to our results ofoperations and financial condition.
47
th
Table of Contents
Item 1A. Risk Factors
The risk factors that affect our business and financial results are discussed in “Item 1A. Risk Factors” in the 2011 annual report on Form 10-K and there has been no material change to these risk factors since previouslydisclosed. We wish to caution the reader that the risk factors discussed in “Item 1A. Risk Factors” in our 2011 annual report on Form 10-K, and those described elsewhere in this report or other Securities and ExchangeCommission filings, could cause future results to differ materially from those stated in any forward-looking statements.
Item 6. Exhibits
48
31.1 Certification of the Chairman and Chief Executive Officer pursuant to Rule 13a-14(a) of the Securities Exchange Act of 1934*
31.2
Certification of the Vice Chairman and Chief Financial Officer pursuant to Rule 13a-14(a) of the Securities Exchange Act of 1934*
32.1
Certifications of the Chairman and Chief Executive Officer and the Vice Chairman and Chief Financial Officer pursuant to Rule 13a-14(b) of the Securities Exchange Act of 1934 andSection 1350 of Chapter 63 of Title 18 of the United States Code**
*
Filed herewith **
Furnished herewith Interactive Data File 101
The following financial statements from Royal Caribbean Cruises Ltd.’s Quarterly Report on Form 10-Q for the quarter ended September 30, 2012, as filed with the SEC on October 25,2012, formatted in XBRL, as follows:
(i) the Consolidated Statements of Comprehensive Income (Loss) for the three months ended
September 30, 2012 and 2011;
(ii) the Consolidated Statements of Comprehensive Income (Loss) for the nine months ended
September 30, 2012 and 2011;
(iii) the Consolidated Balance Sheets at September 30, 2012 and December 31, 2011;
(iv) the Consolidated Statements of Cash Flows for the nine months ended September 30, 2012
and 2011; and
(v) the Notes to the Consolidated Financial Statements, tagged in summary and detail.

Table of Contents
SIGNATURES
Pursuant to the requirements of the Securities Exchange Act of 1934, the registrant has duly caused thisreport to be signed on its behalf by the undersigned thereunto duly authorized.
49
ROYAL CARIBBEAN CRUISES LTD.
(Registrant)
/s/ BRIAN J. RICE
Brian J. Rice
Vice Chairman and
Chief Financial Officer Date: October 25, 2012 (Principal Financial Officer and duly authorized
signatory)