Embed Size (px)
Citation preview

UNITED STATES SECURITIES AND EXCHANGE COMMISSIONWASHINGTON, D.C. 20549
FORM 10-Qþ QUARTERLY REPORT PURSUANT TO SECTION 13 OR 15(d) OF THE SECURITIES EXCHANGE
ACT OF 1934
For the quarterly period ended September 30, 2016
OR
o TRANSITION REPORT PURSUANT TO SECTION 13 OR 15(d) OF THE SECURITIES EXCHANGEACT OF 1934
Commission File Number 1-37394
Black Knight Financial Services, Inc.______________________________________________________________________________________________________________________________________________________
(Exact name of registrant as specified in its charter)
Delaware 36-4798491(State or other jurisdiction ofincorporation or organization)
(I.R.S. EmployerIdentification Number)
601 Riverside Avenue, Jacksonville, Florida 32204(Address of principal executive offices) (Zip Code)
(904) 854-5100___________________________________________________________________
(Registrant's telephone number, including area code)
Indicate by check mark whether the registrant (1) has filed all reports required to be filed by Section 13 or 15(d) of the Securities Exchange Act of 1934 duringthe preceding 12 months (or for such shorter period that the registrant was required to file such reports), and (2) has been subject to such filing requirements for thepast 90 days.
YES þNO o
Indicate by check mark whether the registrant has submitted electronically and posted on its corporate Web site, if any, every Interactive Data File required tobe submitted and posted pursuant to Rule 405 of Regulation S-T (§232.405 of this chapter) during the preceding 12 months (or for such shorter period that theregistrant was required to submit and post such files).
YES þNO o
Indicate by check mark whether the registrant is a large accelerated filer, an accelerated filer, a non-accelerated filer, or a smaller reporting company. See thedefinitions of "large accelerated filer," "accelerated filer" and "smaller reporting company" in Rule 12b-2 of the Exchange Act. (Check one):
Large accelerated filer þ Accelerated filer o Non-accelerated filer o Smaller reporting company o
(Do not check if a smaller
reporting company)
Indicate by check mark whether the registrant is a shell company (as defined in Rule 12b-2 of the Exchange Act).YES oNO þ
The number of shares outstanding of the Registrant's common stock as of November 2, 2016 were:
Class A common stock 69,090,980 sharesClass B common stock 84,826,282 shares

FORM 10-QQUARTERLY REPORT
Quarter Ended September 30, 2016TABLE OF CONTENTS
Page
Part I: FINANCIAL INFORMATION Item 1. Condensed Consolidated Financial Statements (Unaudited)
A. Condensed Consolidated Balance Sheets (Unaudited) as of September 30, 2016 and December 31, 2015 1B. Condensed Consolidated Statements of Earnings and Comprehensive Earnings (Unaudited) for the three and nine months endedSeptember 30, 2016 and 2015 2C. Condensed Consolidated Statement of Equity (Unaudited) for the nine months ended September 30, 2016 3D. Condensed Consolidated Statements of Cash Flows (Unaudited) for the nine months ended September 30, 2016 and 2015 4E. Notes to Condensed Consolidated Financial Statements (Unaudited) 5
Item 2. Management's Discussion and Analysis of Financial Condition and Results of Operations 21Item 3. Quantitative and Qualitative Disclosure About Market Risk 31Item 4. Controls and Procedures 32
Part II: OTHER INFORMATION 32Item 1. Legal Proceedings 32Item 1A. Risk Factors 32Item 2. Unregistered Sales of Equity Securities and Use of Proceeds 32Item 3. Defaults Upon Senior Securities 32Item 4. Mine Safety Disclosures 32Item 5. Other Information 32Item 6. Exhibits 33
i

Table of Contents
Part I: FINANCIAL INFORMATION
Item 1. Condensed Consolidated Financial Statements (Unaudited)
BLACK KNIGHT FINANCIAL SERVICES, INC.Condensed Consolidated Balance Sheets
(Unaudited)(In millions, except share data)
September 30, 2016 December 31, 2015
ASSETS
Current assets:
Cash and cash equivalents $ 58.9 $ 186.0
Trade receivables, net 163.1 134.9
Prepaid expenses and other current assets 36.7 28.2
Receivables from related parties 9.8 7.6Total current assets 268.5 356.7
Property and equipment, net 164.2 152.0
Computer software, net 460.4 466.5
Other intangible assets, net 323.0 330.2
Goodwill 2,304.3 2,223.9
Other non-current assets 193.1 174.4
Total assets $ 3,713.5 $ 3,703.7
LIABILITIES AND EQUITY
Current liabilities:
Trade accounts payable and other accrued liabilities $ 55.9 $ 42.1
Accrued compensation and benefits 48.2 52.2
Current portion of long-term debt 53.4 43.5
Deferred revenues 46.5 40.4Total current liabilities 204.0 178.2
Deferred revenues 67.8 56.2
Deferred income taxes 8.4 4.7
Long-term debt, net of current portion 1,527.1 1,618.0
Other non-current liabilities 3.6 1.6
Total liabilities 1,810.9 1,858.7
Commitments and contingencies (Note 10)
Equity: Class A common stock; $0.0001 par value; 350,000,000 shares authorized, 69,090,967 and 68,303,680 shares issued and outstandingas of September 30, 2016 and December 31, 2015, respectively — —Class B common stock; $0.0001 par value; 200,000,000 shares authorized, 84,826,282 shares issued and outstanding as of September30, 2016 and December 31, 2015 — —
Preferred stock; $0.0001 par value; 25,000,000 shares authorized; issued and outstanding, none — —
Additional paid-in capital 807.7 798.9
Retained earnings 54.0 19.9
Accumulated other comprehensive loss (0.7) (0.1)
Total shareholders' equity 861.0 818.7
Noncontrolling interests 1,041.6 1,026.3
Total equity 1,902.6 1,845.0
Total liabilities and equity $ 3,713.5 $ 3,703.7
See Notes to Condensed Consolidated Financial Statements (Unaudited).
1

BLACK KNIGHT FINANCIAL SERVICES, INC.Condensed Consolidated Statements of Earnings and Comprehensive Earnings
(Unaudited)(In millions, except per share data)
Three months ended September 30, Nine months ended September 30,
2016 2015 2016 2015
Revenues $ 267.1 $ 233.6 $ 764.5 $ 692.9
Expenses:
Operating expenses 152.2 131.4 433.4 404.9
Depreciation and amortization 56.8 48.7 154.2 143.4
Transition and integration costs 1.1 0.1 2.2 7.4
Total expenses 210.1 180.2 589.8 555.7
Operating income 57.0 53.4 174.7 137.2
Other income and expense:
Interest expense (16.9) (17.0) (50.6) (73.3)
Other expense, net (1.4) — (6.2) (4.6)
Total other expense, net (18.3) (17.0) (56.8) (77.9)
Earnings from continuing operations before income taxes 38.7 36.4 117.9 59.3
Income tax expense 6.3 6.6 19.2 7.0
Net earnings from continuing operations 32.4 29.8 98.7 52.3
Earnings from discontinued operations, net of tax — 0.2 — —
Net earnings 32.4 30.0 98.7 52.3
Less: Net earnings attributable to noncontrolling interests 21.2 20.1 64.7 42.1Net earnings attributable to Black KnightFinancial Services, Inc. $ 11.2 $ 9.9 $ 34.0 $ 10.2
Other comprehensive earnings (loss):
Unrealized holding gains (losses), net of tax 0.4 — (0.9) —Reclassification adjustments for lossesincluded in net earnings, net of tax (1) 0.1 — 0.4 —
Total unrealized gains (losses) on interest rate swaps, net oftax (2) 0.5 — (0.5) —
Foreign currency translation adjustment 0.1 — (0.1) (0.1)
Other comprehensive earnings (loss) 0.6 — (0.6) (0.1)Comprehensive earnings attributable to noncontrollinginterests 22.2 20.1 63.9 42.1
Comprehensive earnings $ 34.0 $ 30.0 $ 97.3 $ 52.2
Three months ended September 30,
Nine months endedSeptember 30, 2016
May 26, 2015 through
September 30, 2015 2016 2015
Earnings per share: Net earnings per share attributable to Black Knight FinancialServices, Inc., Class A common shareholders:
Basic $ 0.17 $ 0.15 $ 0.52 $ 0.16
Diluted $ 0.16 $ 0.15 $ 0.50 $ 0.15Weighted average shares of Class A common stockoutstanding (Note 3):
Basic 65.9 64.4 65.9 64.4
Diluted 67.9 67.7 67.8 67.7______________________________(1) Amounts reclassified to net earnings relate to losses on interest rate swaps and are included in Interest expense on the Condensed Consolidated Statements of Earnings and Comprehensive
Earnings (Unaudited). Amount is net of income tax expense of $0.1 million and $0.3 million for the three and nine months ended September 30, 2016 , respectively.(2) Net of income tax expense of $0.3 million for the three months ended September 30, 2016 and an income tax benefit of $0.3 million for the three nine months ended September 30, 2016 .
See Notes to Condensed Consolidated Financial Statements (Unaudited).
2

BLACK KNIGHT FINANCIAL SERVICES, INC.Condensed Consolidated Statement of Equity
(Unaudited)(In millions)
Class A common stock Class B common stock
Shares $ Shares $ Additional paid-incapital Retained earnings Accumulated other
comprehensive loss Noncontrollinginterests Total equity
Balance, December 31, 2015 68.3 $ — 84.8 $ — $ 798.9 $ 19.9 $ (0.1) $ 1,026.3 $ 1,845.0
Issuance of restricted shares of Class A common stock 0.8 — — — — — — — —
Equity-based compensation expense — — — — 8.8 — — — 8.8
Net earnings — — — — — 34.0 — 64.7 98.7
Foreign currency translation adjustment — — — — — — (0.1) — (0.1)
Unrealized loss on interest rate swaps — — — — — — (0.5) (0.8) (1.3)
Tax distributions to members — — — — — 0.1 — (48.6) (48.5)
Balance, September 30, 2016 69.1 $ — 84.8 $ — $ 807.7 $ 54.0 $ (0.7) $ 1,041.6 $ 1,902.6
See Notes to Condensed Consolidated Financial Statements (Unaudited).
3

BLACK KNIGHT FINANCIAL SERVICES, INC.Condensed Consolidated Statements of Cash Flows
(Unaudited)(In millions)
Nine months ended September 30, 2016 2015
Cash flows from operating activities:
Net earnings $ 98.7 $ 52.3
Adjustments to reconcile net earnings to net cash provided by operating activities:
Depreciation and amortization 154.2 143.4
Amortization of debt issuance costs, bond premium and original issue discount 2.0 0.1
Loss on extinguishment of debt, net — 4.8
Deferred income taxes, net 3.7 5.7
Equity-based compensation 9.5 10.4
Changes in assets and liabilities, net of acquired assets and liabilities:
Trade and other receivables, including receivables from related parties (23.1) (33.2)
Prepaid expenses and other assets (7.0) (10.3)
Deferred contract costs (41.1) (43.8)
Deferred revenues 15.8 30.5
Trade accounts payable and other accrued liabilities, including accrued compensation and benefits (2.2) (1.0)
Net cash provided by operating activities 210.5 158.9
Cash flows from investing activities:
Additions to property and equipment (24.0) (35.3)
Additions to computer software (31.9) (39.2)
Business acquisitions, net of cash acquired (150.2) —
Investment in property records database — (6.8)
Net cash used in investing activities (206.1) (81.3)
Cash flows from financing activities:
Borrowings, net of original issue discount 55.0 1,299.0
Debt service payments (138.0) (1,734.9)
Distributions to members (48.5) (17.3)
Proceeds from issuance of Class A common stock, before offering expenses — 479.3
Costs directly associated with issuance of Class A common stock — (4.2)
Debt issuance costs — (20.6)
Senior notes call premium — (11.8)
Net cash used in financing activities (131.5) (10.5)
Net (decrease) increase in cash and cash equivalents (127.1) 67.1
Cash and cash equivalents, beginning of period 186.0 61.9
Cash and cash equivalents, end of period $ 58.9 $ 129.0
Supplemental cash flow information:
Interest paid $ (39.6) $ (68.9)
Income taxes paid, net $ (16.0) $ (0.1)
See Notes to Condensed Consolidated Financial Statements (Unaudited).
4

Table of Contents
BLACK KNIGHT FINANCIAL SERVICES, INC. AND SUBSIDIARIESNOTES TO CONDENSED CONSOLIDATED FINANCIAL STATEMENTS (UNAUDITED)
Except as otherwise indicated or unless the context otherwise requires, all references to "Black Knight," "us," "we" or "our" are to Black Knight FinancialServices, Inc., a Delaware corporation, and its subsidiaries.
(1) Basis of Presentation
The accompanying Condensed Consolidated Financial Statements (Unaudited) were prepared in accordance with U.S. generally accepted accountingprinciples ("GAAP"), and all adjustments considered necessary for a fair presentation have been included. All significant intercompany accounts and transactionshave been eliminated. The preparation of these Condensed Consolidated Financial Statements (Unaudited) in conformity with GAAP requires management tomake estimates and assumptions. These estimates and assumptions affect the reported amounts of assets and liabilities and disclosure of contingent assets andliabilities as of the date of the Condensed Consolidated Financial Statements (Unaudited), as well as the reported amounts of revenues and expenses during thereporting periods. Actual results could differ from those estimates. This Quarterly Report on Form 10-Q should be read in conjunction with our Annual Report onForm 10-K for the year ended December 31, 2015 filed with the Securities and Exchange Commission ("SEC") on February 26, 2016.
Prior period amounts related to the Legal and regulatory accrual and Accrued interest on the Condensed Consolidated Balance Sheets (Unaudited) have beenreclassified to Trade accounts payable and other accrued liabilities in order to conform to the current period presentation.
Description of Business
Black Knight is a holding company that conducts business through our sole managing member interest in Black Knight Financial Services, LLC ("BKFSLLC"). Through its subsidiaries, BKFS LLC is a leading provider of integrated technology, workflow automation and data and analytics to the mortgage and realestate industries. Our solutions facilitate and automate many of the mission-critical business processes across the entire mortgage loan life cycle, from originationuntil asset disposition. We believe we differentiate ourselves by the breadth and depth of our comprehensive, integrated solutions and the insight we provide to ourclients.
We are a majority-owned subsidiary of Fidelity National Financial, Inc. ("FNF"). Our business generally represents a reorganization of the formerTechnology, Data and Analytics segment of Lender Processing Services, Inc. ("LPS"), a former provider of integrated technology, data and services to themortgage lending industry in the United States that FNF acquired in January 2014. Our business also includes two companies that were contributed to us by FNF:Fidelity National Commerce Velocity, LLC and Property Insight, LLC. ServiceLink Holdings, LLC ("ServiceLink"), another majority-owned subsidiary of FNF,operates the Transaction Services businesses of the former LPS as well as FNF’s legacy ServiceLink businesses.
Reporting Segments
We conduct our operations through two reporting segments: (1) Technology and (2) Data and Analytics. See further discussion in Note 12 — SegmentInformation .
Consolidation
BKFS LLC is subject to the consolidation guidance related to variable interest entities as set forth in Accounting Standards Codification ("ASC") Topic 810,Consolidation ("ASC 810"). Black Knight, as the sole managing member of BKFS LLC, has the exclusive authority to manage, control and operate the businessand affairs of BKFS LLC and its subsidiaries, pursuant to the terms of the Second Amended and Restated Limited Liability Company Agreement ("LLCAgreement"). Under the terms of the LLC Agreement, Black Knight is authorized to manage the business of BKFS LLC, including the authority to enter intocontracts, manage bank accounts, hire employees and agents, incur and pay debts and expenses, merge or consolidate with other entities and pay taxes. BecauseBlack Knight is the primary beneficiary through its sole managing member interest and possesses the rights established in the LLC Agreement, in accordance withthe requirements of ASC 810, Black Knight controls BKFS LLC and appropriately consolidates the operations thereof.
We account for noncontrolling interests in accordance with ASC 810. Our Class A shareholders indirectly control BKFS LLC through our managing memberinterest. Our Class B shareholders have a noncontrolling interest in BKFS LLC. Their share of equity in BKFS LLC is reflected in Noncontrolling interests in ourCondensed Consolidated Balance Sheets (Unaudited), and their share of net earnings or loss in BKFS LLC is reported in Net earnings attributable tononcontrolling interests in our Condensed Consolidated Statements of Earnings and Comprehensive Earnings (Unaudited). Net earnings attributable tononcontrolling interests do not include expenses incurred directly by Black Knight, including income tax expense attributable to Black Knight.
5

Table of Contents
BLACK KNIGHT FINANCIAL SERVICES, INC.NOTES TO CONDENSED CONSOLIDATED FINANCIAL STATEMENTS (Unaudited) - (Continued)
All earnings prior to the closing of our initial public offering ("IPO") on May 26, 2015 have been disclosed as Net earnings attributable to noncontrollinginterests.
Cash and Cash Equivalents
Cash and cash equivalents include the following (in millions):
September 30, 2016 December 31, 2015
Unrestricted: Cash $ 56.6 $ 52.3Cash equivalents — 130.1Total unrestricted cash and cash equivalents 56.6 182.4
Restricted cash equivalents (1) 2.3 3.6 Total cash and cash equivalents $ 58.9 $ 186.0
_______________(1) Restricted cash equivalents relate to our subsidiary, I-Net Reinsurance Limited, and are held in trust until the final reinsurance policy is canceled.
Allowance for Doubtful Accounts
Trade receivables, net includes an allowance for doubtful accounts of $2.5 million as of September 30, 2016 and December 31, 2015 .
Capital Lease
On June 29, 2016, Black Knight entered into a one -year capital lease agreement with a bargain purchase option for certain computer equipment. The leasedequipment has a useful life of five years and will be depreciated on a straight-line basis over this period. The leased equipment was valued based on the net presentvalue of the minimum lease payments, which was $10.0 million (net of imputed interest of $0.1 million ) and is included in Property and equipment, net on theCondensed Consolidated Balance Sheets (Unaudited). The remaining capital lease obligation of $8.4 million is included in Trade accounts payable and otheraccrued liabilities on the Condensed Consolidated Balance Sheets (Unaudited). This transaction is a non-cash investing and financing activity.
Total minimum lease payments as of September 30, 2016 for the remainder of 2016 and 2017 are as follows (in millions):
2016 (remaining) $ 3.42017 5.0
Total $ 8.4
Depreciation and Amortization
Depreciation and amortization on the Condensed Consolidated Statements of Earnings and Comprehensive Earnings (Unaudited) include the following (inmillions):
Three months ended September 30, Nine months ended September 30,
2016 2015 2016 2015
Property and equipment $ 7.2 $ 7.0 $ 21.4 $ 21.5Computer software 20.6 17.7 57.5 52.1Other intangible assets 20.5 21.9 56.2 64.6Deferred contract costs 8.5 2.1 19.1 5.2
Total $ 56.8 $ 48.7 $ 154.2 $ 143.4
6

Table of Contents
BLACK KNIGHT FINANCIAL SERVICES, INC.NOTES TO CONDENSED CONSOLIDATED FINANCIAL STATEMENTS (Unaudited) - (Continued)
Deferred contract costs amortization for the three and nine months ended September 30, 2016 includes accelerated amortization of $2.9 million related tocertain deferred implementation costs.
Transition and Integration Costs
Transition and integration costs during the three and nine months ended September 30, 2016 primarily represent costs related to business acquisitions. Seefurther discussion in Note 2 — Business Acquisitions . Transition and integration costs during the three and nine months ended September 30, 2015 primarilyrepresent management fees paid to FNF and Thomas H. Lee Partners, L.P. ("THL"), and costs related to the IPO.
Recent Accounting Pronouncements
Revenue Recognition (Topic 606)
In May 2016, the Financial Accounting Standards Board ("FASB") issued Accounting Standards Update ("ASU") 2016-12, Revenue from Contracts withCustomers (Topic 606): Narrow-Scope Improvements and Practical Expedients . The amendments in this ASU do not change the core principle of the guidance inTopic 606. Rather, the amendments in this update simplify the transition and clarify certain aspects of the revenue standard.
Also in May 2016, the FASB issued ASU 2016-11, Revenue Recognition (Topic 605) and Derivatives and Hedging (Topic 815): Rescission of SEC GuidanceBecause of Accounting Standards Updates 2014-09 and 2014-16 Pursuant to Staff Announcements at the March 3, 2016 EITF Meeting . The SEC Staff isrescinding certain SEC Staff Observer comments that are codified in ASC Topic 605, Revenue Recognition , and ASC Topic 932, Extractive Activities-Oil and Gas, effective upon adoption of ASC Topic 606, Revenue from Contracts with Customers (“ASC 606”). Specifically, registrants should not rely on the SEC StaffObserver comments upon adoption of ASC 606 related to revenue and expense recognition for freight services in process, accounting for shipping and handlingfees and costs, accounting for consideration given by a vendor to a customer and accounting for gas-balancing arrangements.
In April 2016, the FASB issued ASU 2016-10, Revenue from Contracts with Customers (Topic 606): Identifying Performance Obligations and Licensing. Thisguidance clarifies how to determine whether goods and services are separately identifiable and thus accounted for as separate performance obligations.Additionally, this update clarifies how to evaluate the nature of a promise in granting a license of intellectual property, which determines whether to recognizerevenue over time or at a point in time.
In March 2016, the FASB issued ASU 2016-08, Revenue from Contracts with Customers (Topic 606): Principal versus Agent Considerations (ReportingRevenue Gross versus Net). This new standard requires a company to determine whether it is a principal (that controls the promised good or service beforetransferring it to the customer) or an agent (that arranges for another entity to provide the goods or services). Principals are required to recognize revenue equal tothe gross amount of consideration exchanged for the promised good or service. Agents are required to recognize revenue net of any fees or commissions paid forarranging the promised good or service to be provided by another party.
The ASUs listed above are effective on adoption of ASU 2014-09, Revenue from Contracts with Customers , which is effective for fiscal years, and interimperiods within those fiscal years, beginning after December 15, 2017. We are currently evaluating which transition approach to use and assessing the effect theadoption of these ASUs will have on our results of operations and our financial position.
Other Accounting Pronouncements
In August 2016, the FASB issued ASU 2016-15, Statement of Cash Flows (Topic 230): Classification of Certain Cash Receipts and Cash Payments . Theamendments in this ASU introduce clarifications to the presentation of certain cash receipts and cash payments in the statement of cash flows. The primary updatesinclude additions and clarifications of the classification of cash flows related to certain debt repayment activities, contingent consideration payments related tobusiness combinations, proceeds from insurance policies, distributions from equity method investees and cash flows related to securitized receivables. This updateis effective for annual periods beginning after December 15, 2017, including interim periods within those fiscal years. Early adoption is permitted, including ininterim periods. This ASU requires retrospective application to all prior periods presented upon adoption. We do not expect this update to have a material effect onour statement of cash flows.
In June 2016, the FASB issued ASU 2016-13, Financial Instruments — Credit Losses . This guidance significantly changes how companies measure andrecognize credit impairment for many financial assets. The new Current Expected Credit Loss Model will require companies to immediately recognize an estimateof credit losses expected to occur over the remaining life of the financial assets included in the scope of this standard, which include trade receivables. Thisstandard is effective for fiscal years, and interim periods within those fiscal years, beginning after December 15, 2019. Early adoption is permitted for annual and
7
Table of Contents
BLACK KNIGHT FINANCIAL SERVICES, INC.NOTES TO CONDENSED CONSOLIDATED FINANCIAL STATEMENTS (Unaudited) - (Continued)
interim periods in fiscal years beginning after December 15, 2018. We do not expect this update to have a material effect on our results of operations or ourfinancial position.
In March 2016, the FASB issued ASU 2016-09, Compensation-Stock Compensation (Topic 718): Improvements to Employee Share-Based PaymentAccounting . Under the new guidance, companies will no longer record excess tax benefits and certain tax deficiencies related to share-based awards in additionalpaid-in capital. Instead, income tax effects of awards will be recorded in the income statement when the awards vest or are settled. It also will allow an employer torepurchase more of an employee’s shares than it can today for tax withholding purposes without triggering liability accounting and to make a policy election toaccount for forfeitures as they occur. Amendments requiring recognition of excess tax benefits and tax deficiencies in the income statements should be appliedprospectively. Amendments related to minimum statutory withholding requirements and forfeitures should be applied using a modified retrospective transitionmethod by means of a cumulative-effect adjustment to equity as of the beginning of the period in which the guidance is adopted. The guidance is effective forpublic companies for fiscal years beginning after December 15, 2016, and interim periods within those fiscal years. Early adoption is permitted, but all of theguidance must be adopted in the same period. We do not expect this update to have a material effect on our results of operations or our financial position.
(2) Business Acquisitions
We include the results of operations of acquired businesses beginning on the respective acquisition dates. The purchase price is allocated to the tangible andintangible assets acquired and the liabilities assumed based on their estimated fair values, with the excess recorded as goodwill. Measurement period adjustmentsto provisional purchase price allocations are recognized in the period in which they are determined, with the effect on earnings of changes in depreciation,amortization or other income resulting from such changes calculated as if the accounting had been completed on the acquisition date. Acquisition-related costs areexpensed as incurred.
During the nine months ended September 30, 2016 , Black Knight completed the acquisitions of eLynx Holdings, Inc. ("eLynx") and Motivity Solutions, Inc.("Motivity"). Neither acquisition meets the definition of "significant" pursuant to Article 3 of Regulation S-X (§210.3-05) either individually or in the aggregate.Further, the individual and aggregate results of operations are not material to Black Knight's financial statements. Further details on each acquisition are discussedbelow.
Allocation of Purchase Price
The fair value of the acquired Computer software and Other intangible assets for both transactions was determined using a preliminary third-party valuationbased on significant estimates and assumptions, including Level 3 inputs, which are judgmental in nature. These estimates and assumptions include the projectedtiming and amount of future cash flows, discount rates reflecting the risk inherent in the future cash flows and future market prices. These estimates are preliminaryand subject to adjustments as we complete our valuation process with respect to capitalized software, other intangible assets and goodwill. The fair value of theremaining assets acquired and liabilities assumed approximate their carrying values, and therefore, no fair value adjustments are reflected in these amounts.
eLynx
On May 16, 2016, Black Knight completed its acquisition of eLynx, a leading lending document and data delivery platform. eLynx helps clients in thefinancial services and real estate industries electronically capture and manage documents and associated data throughout the document lifecycle. Black Knightpurchased eLynx to augment its origination technologies. This acquisition positions Black Knight to electronically support the full mortgage origination process.
Total consideration paid, net of cash received, was $115.0 million for 100% of the equity interests of eLynx. Additionally, Black Knight incurred directtransaction costs of $0.4 million and $1.2 million for the three months ended September 30, 2016 and the nine months ended September 30, 2016 , respectively,that are included in Transition and integration costs on the Condensed Consolidated Statement of Earnings and Comprehensive Earnings (Unaudited). The totalconsideration paid was as follows (in millions):
Cash paid from cash on hand $ 95.6Cash paid from Revolver borrowing (Note 8) 25.0Less: cash acquired (5.6)
Total consideration paid, net $ 115.0
8

Table of Contents
BLACK KNIGHT FINANCIAL SERVICES, INC.NOTES TO CONDENSED CONSOLIDATED FINANCIAL STATEMENTS (Unaudited) - (Continued)
The following table summarizes the total purchase price consideration and the preliminary fair value amounts recognized for the assets acquired and liabilitiesassumed as of the acquisition date (in millions):
Total purchase price consideration $ 115.0
Accounts receivable $ 3.8Prepaid expenses and other current assets 0.5Property and equipment 1.1Computer software 14.0Other intangible assets (Note 6) 38.5Goodwill (Note 7) 60.7
Total assets acquired 118.6Trade accounts payable and other accrued liabilities (0.9)Accrued salaries and benefits (1.3)Deferred revenues (1.4)
Total liabilities assumed (3.6)
Net assets acquired $ 115.0
Motivity
On June 22, 2016, Black Knight completed its acquisition of Motivity, which provides customized mortgage business intelligence software solutions. Motivitywill be integrated with Black Knight's LoanSphere product suite, including the LoanSphere Data Hub, to provide clients with deeper insights into their originationand servicing operations and portfolios.
Total consideration paid, net of cash received, was $35.2 million for 100% of the equity interests of Motivity. Additionally, Black Knight incurred directtransaction costs of $0.1 million and $0.4 million for the three months ended September 30, 2016 and the nine months ended September 30, 2016 , respectively,that are included in Transition and integration costs on the Condensed Consolidated Statement of Earnings and Comprehensive Earnings (Unaudited). The totalconsideration paid was as follows (in millions):
Cash paid from Revolver borrowing (Note 8) $ 30.0Cash paid from cash on hand 6.0Less: cash acquired (0.8)
Total consideration paid, net $ 35.2
The following table summarizes the total purchase price consideration and the preliminary fair value amounts recognized for the assets acquired and liabilitiesassumed as of the acquisition date (in millions):
Total purchase price consideration $ 35.2
Accounts receivable $ 0.4Prepaid expenses and other current assets 0.7Property and equipment 0.1Computer software 5.7Other intangible assets (Note 6) 10.5Goodwill (Note 7) 19.7Total assets acquired 37.1Trade accounts payable and other accrued liabilities (1.4)Deferred revenues (0.5)Total liabilities assumed (1.9)
Net assets acquired $ 35.2
9

Table of Contents
BLACK KNIGHT FINANCIAL SERVICES, INC.NOTES TO CONDENSED CONSOLIDATED FINANCIAL STATEMENTS (Unaudited) - (Continued)
Estimated Useful Lives of Property and Equipment, Computer Software and Other Intangible Assets Acquired
As of the respective acquisition dates, the gross carrying value and weighted average estimated useful lives of Property and equipment, Computer softwareand Other intangible assets acquired in the above acquisitions consisted of the following (dollars in millions):
Gross Carrying Value Weighted AverageEstimated Life
(in Years) eLynx Motivity Total Computer software $ 14.0 $ 5.7 $ 19.7 5Property and equipment 1.1 0.1 1.2 3Other intangible assets:
Customer relationships 34.6 8.4 43.0 10Trade name 3.7 1.7 5.4 10Non-compete agreements 0.2 0.4 0.6 5Total Other intangible assets (Note 6) 38.5 10.5 49.0
Total gross carrying value $ 53.6 $ 16.3 $ 69.9
(3) Earnings Per Share
Basic earnings per share is computed by dividing Net earnings attributable to Black Knight by the weighted-average number of shares of Class A commonstock outstanding during the period.
For the periods presented, potentially dilutive securities include unvested restricted stock awards and the shares of Class B common stock that are convertibleon a one -for-one basis into shares of our Class A common stock. However, the 84.8 million shares of Class B common shares have been excluded in computingdiluted net earnings per share because including them on an "if-converted" basis would have an anti-dilutive effect. Diluted net earnings per share is calculated bydividing Net earnings attributable to Black Knight by the weighted-average diluted number of shares of Class A common stock outstanding. The denominatorincludes the dilutive effect of approximately 2.0 million and 3.3 million shares of unvested restricted shares of Class A common stock for the three months endedSeptember 30, 2016 and 2015, respectively, and approximately 1.9 million and 3.3 million for the nine months ended September 30, 2016 and the period from May26, 2015 through September 30, 2015, respectively.
The shares of Class B common stock do not share in the earnings or losses of Black Knight and are, therefore, not participating securities. Accordingly, basicand diluted net earnings per share of Class B common stock have not been presented.
10

Table of Contents
BLACK KNIGHT FINANCIAL SERVICES, INC.NOTES TO CONDENSED CONSOLIDATED FINANCIAL STATEMENTS (Unaudited) - (Continued)
The following table sets forth the computation of basic and diluted earnings per share (in millions, except per share amounts):
Three months ended September 30, Nine months endedSeptember 30, 2016
May 26, 2015 throughSeptember 30, 2015 2016 2015
Basic:
Net earnings attributable to Black Knight $ 11.2 $ 9.9 $ 34.0 $ 10.2
Shares used for basic net earnings per share: Weighted average shares of Class A common stockoutstanding 65.9 64.4 65.9 64.4
Basic net earnings per share $ 0.17 $ 0.15 $ 0.52 $ 0.16
Diluted:
Net earnings attributable to Black Knight $ 11.2 $ 9.9 $ 34.0 $ 10.2
Shares used for diluted net earnings per share: Weighted average shares of Class A common stockoutstanding 65.9 64.4 65.9 64.4Dilutive effect of unvested restricted shares of Class Acommon stock 2.0 3.3 1.9 3.3
Weighted average shares of common stock, diluted 67.9 67.7 67.8 67.7
Diluted net earnings per share $ 0.16 $ 0.15 $ 0.50 $ 0.15
Basic and diluted net earnings per share information is not applicable for reporting periods prior to the completion of the IPO.
(4) Related Party Transactions
We are party to certain related party agreements, including those with FNF and THL. The following table sets forth the ownership interests of FNF, THL andother holders of Black Knight common stock (shares in millions):
September 30, 2016 December 31, 2015
Shares OwnershipPercentage Shares
OwnershipPercentage
Class A common stock: THL and its affiliates 39.3 25.5% 39.3 25.7%Restricted shares 3.2 2.1% 3.9 2.5%Other, including those publicly traded 26.6 17.3% 25.1 16.4%
Total shares of Class A common stock 69.1 44.9% 68.3 44.6%Class B common stock:
FNF subsidiaries 83.3 54.1% 83.3 54.4%THL and its affiliates 1.5 1.0% 1.5 1.0%
Total shares of Class B common stock 84.8 55.1% 84.8 55.4%
Total common stock outstanding 153.9 100.0% 153.1 100.0%
Transactions with FNF and THL are described below.
FNF
We have various agreements with FNF and certain FNF subsidiaries to provide technology, data and analytics services, as well as corporate shared servicesand information technology. In addition, FNF provided certain corporate services to us, including management consulting and corporate administrative services.Following the IPO, we no longer pay management fees to FNF. We are also a party to certain other agreements under which we incur other expenses or receiverevenues from FNF.
11

Table of Contents
BLACK KNIGHT FINANCIAL SERVICES, INC.NOTES TO CONDENSED CONSOLIDATED FINANCIAL STATEMENTS (Unaudited) - (Continued)
A detail of the revenues and expenses from FNF is set forth in the table below (in millions):
Three months ended September 30, Nine months ended September 30,
2016 2015 2016 2015
Revenues $ 19.2 $ 18.5 $ 53.4 $ 52.6Operating expenses 3.8 2.7 11.5 4.8Management fees (1) — — — 2.4Interest expense (2) 0.9 1.0 2.9 38.6_______________(1) Amounts are included in Transition and integration costs on the Condensed Consolidated Statements of Earnings and Comprehensive Earnings (Unaudited).
(2) Amounts include guarantee fee (see below).
We were party to intercompany notes with FNF through May 27, 2015 and recognized $37.2 million in Interest expense related to the intercompany notes forthe nine months ended September 30, 2015 . We had no outstanding intercompany notes in 2016 .
Beginning on May 26, 2015, we pay to FNF a guarantee fee of 1.0% of the outstanding principal of the Senior Notes (as defined in Note 8 — Long-Term Debt) in exchange for the ongoing guarantee by FNF of the Senior Notes. In October 2017, the guarantee fee increases to 2.0% of the outstanding principal of theSenior Notes. During the three months ended September 30, 2016 and 2015 , we recognized $0.9 million and $1.0 million , respectively, in Interest expense relatedto the guarantee fee. During the nine months ended September 30, 2016 and 2015 , we recognized $2.9 million and $1.4 million , respectively, in Interest expenserelated to the guarantee fee.
FNF subsidiaries held $49.4 million and $49.9 million as of September 30, 2016 and December 31, 2015 , respectively, of principal amount of our Term BLoan (as defined in Note 8 — Long-Term Debt ) from our credit agreement dated May 27, 2015.
THL
Two managing directors of THL currently serve on our Board of Directors. We purchase software and systems services from certain entities over which THLexercises control. In addition, THL provided certain corporate services to us, including management and consulting services. Following the IPO, we no longer paymanagement fees to THL.
A detail of the expenses, net from THL is set forth in the table below (in millions):
Three months ended September 30, Nine months ended September 30,
2016 2015 2016 2015
Operating expenses $ 0.2 $ 0.4 $ 1.0 $ 1.3Management fees (1) — — — 1.3Software and software-related purchases — 0.1 1.1 1.4_______________(1) Amounts are included in Transition and integration costs on the Condensed Consolidated Statements of Earnings and Comprehensive Earnings (Unaudited).
In connection with the IPO, we made a $17.3 million cash payment to certain THL affiliates during the nine months ended September 30, 2015 , in connectionwith the merger of certain THL intermediaries with and into us.
THL affiliates held $39.5 million and $39.9 million as of September 30, 2016 and December 31, 2015 , respectively, of principal amount of our Term Loan B(as defined in Note 8 — Long-Term Debt ) from our credit agreement dated May 27, 2015.
Revenues and Expenses
A detail of related party items included in Revenues is as follows (in millions):
Three months ended September 30, Nine months ended September 30,
2016 2015 2016 2015
Data and analytics services $ 12.3 $ 13.0 $ 34.2 $ 38.0Servicing, origination and default technology services 6.9 5.5 19.2 14.6
Total related party revenues $ 19.2 $ 18.5 $ 53.4 $ 52.6
12

Table of Contents
BLACK KNIGHT FINANCIAL SERVICES, INC.NOTES TO CONDENSED CONSOLIDATED FINANCIAL STATEMENTS (Unaudited) - (Continued)
A detail of related party items included in Operating expenses (net of expense reimbursements) is as follows (in millions):
Three months ended September 30, Nine months ended September 30,
2016 2015 2016 2015
Data entry, indexing services and other operating expenses $ 2.4 $ 2.2 $ 7.3 $ 6.5Corporate services operating expenses 2.4 2.3 7.6 6.7Technology and corporate services expense reimbursement (0.8) (1.4) (2.4) (7.1)
Total related party expenses, net $ 4.0 $ 3.1 $ 12.5 $ 6.1
Additionally, related party prepaid fees were $0.3 million and $0.2 million as of September 30, 2016 and December 31, 2015 , respectively, which areincluded in Prepaid expenses and other current assets on the Condensed Consolidated Balance Sheets (Unaudited).
We believe the amounts earned from or charged by us under each of the foregoing arrangements are fair and reasonable. We believe our service arrangementsare priced within the range of prices we offer to third parties, except for certain corporate services provided to an FNF subsidiary and certain corporate servicesprovided by FNF, which are at cost. However, the amounts we earned or that were charged under these arrangements were not negotiated at arm's length, and maynot represent the terms that we might have obtained from an unrelated third party.
(5) Computer Software
Computer software as of September 30, 2016 includes those assets acquired as part of the eLynx and Motivity acquisitions (see further discussion in Note 2 —Business Acquisitions ) and consists of the following (in millions):
September 30, 2016 December 31, 2015
Internally-developed software $ 626.5 $ 578.1Purchased software 40.7 37.8
Computer software 667.2 615.9Accumulated amortization (206.8) (149.4)
Computer software, net $ 460.4 $ 466.5
(6) Other Intangible Assets
Other intangible assets as of September 30, 2016 include those assets acquired as part of the eLynx and Motivity acquisitions (see further discussion in Note 2— Business Acquisitions ) and consist of the following (in millions):
September 30, 2016 December 31, 2015
Gross Carrying
Amount Accumulated Amortization
Net Carrying Amount
Gross Carrying Amount
Accumulated Amortization
Net Carrying Amount
Customer relationships $ 557.8 $ (241.3) $ 316.5 $ 514.8 $ (186.3) $ 328.5Other 15.9 (9.4) 6.5 9.8 (8.1) 1.7
Total other intangible assets $ 573.7 $ (250.7) $ 323.0 $ 524.6 $ (194.4) $ 330.2
(7) Goodwill
Changes in goodwill during the nine months ended September 30, 2016 consist of the following (in millions):
Technology Data and Analytics Total
Balance, December 31, 2015 $ 2,050.7 $ 173.2 $ 2,223.9 Increases to goodwill related to:
eLynx acquisition (Note 2) 60.7 — 60.7Motivity acquisition (Note 2) — 19.7 19.7
Balance, September 30, 2016 $ 2,111.4 $ 192.9 $ 2,304.3
13

Table of Contents
BLACK KNIGHT FINANCIAL SERVICES, INC.NOTES TO CONDENSED CONSOLIDATED FINANCIAL STATEMENTS (Unaudited) - (Continued)
Goodwill related to the eLynx and Motivity acquisitions is expected to be deductible for tax purposes.
(8) Long-Term Debt
Long-term debt consists of the following (in millions):
September 30, 2016 December 31, 2015
Principal
DebtIssuance
Costs Premium(Discount) Total Principal
DebtIssuance
Costs Premium(Discount) Total
Term A Loan $ 750.0 $ (7.6) $ — $ 742.4 $ 780.0 $ (9.4) $ — $ 770.6Term B Loan 395.0 (3.5) (0.8) 390.7 398.0 (3.9) (0.9) 393.2Revolving Credit Facility 50.0 (4.1) — 45.9 100.0 (4.8) — 95.2Senior Notes, issued at par 390.0 — 11.5 401.5 390.0 — 12.5 402.5 Total long-term debt 1,585.0 (15.2) 10.7 1,580.5 1,668.0 (18.1) 11.6 1,661.5Less: Current portion of long-term debt 54.0 (0.6) — 53.4 44.0 (0.5) — 43.5
Long-term debt, net of current portion $ 1,531.0 $ (14.6) $ 10.7 $ 1,527.1 $ 1,624.0 $ (17.6) $ 11.6 $ 1,618.0
Principal maturities as of September 30, 2016 for each of the next five years and thereafter are as follows (in millions):
2016 (remaining) $ 11.02017 64.02018 84.02019 104.02020 554.0Thereafter 768.0
Total $ 1,585.0
Scheduled maturities noted above exclude the effect of the debt issuance costs of $15.2 million as well as $10.7 million net unamortized debt premium.
Credit Agreement
On May 27, 2015, our indirect subsidiary, Black Knight InfoServ, LLC ("BKIS"), entered into a credit and guaranty agreement (the "Credit Agreement") withJPMorgan Chase Bank, N.A., as administrative agent, the guarantors party thereto and the other agents and lenders party thereto. The Credit Agreement providesfor (i) an $800.0 million term loan A facility (the "Term A Loan"), (ii) a $400.0 million term loan B facility (the "Term B Loan") and (iii) a $400.0 millionrevolving credit facility (the "Revolving Credit Facility", and collectively with the Term A Loan and Term B Loan, the "Facilities"). The Term A Loan and theRevolving Credit Facility mature on May 27, 2020, and the Term B Loan matures on May 27, 2022. The Facilities are guaranteed by substantially all of BKIS'swholly-owned domestic restricted subsidiaries and BKFS LLC, and are secured by associated collateral agreements that pledge a lien on virtually all of BKIS'sassets, including fixed assets and intangible assets, and the assets of the guarantors.
As of September 30, 2016 , the Term A Loan and the Revolving Credit Facility bear interest at the Eurodollar rate plus a margin of 200 basis points, and theTerm B Loan bears interest at the Eurodollar rate plus a margin of 300 basis points, subject to a Eurodollar rate floor of 75 basis points. As of September 30, 2016 ,we have $350.0 million capacity on the Revolving Credit Facility and pay an unused commitment fee of 30 basis points. During the nine months endedSeptember 30, 2016 , Black Knight borrowed $55.0 million on our Revolving Credit Facility, all of which was related to the eLynx and Motivity acquisitions. Seefurther discussion in Note 2 — Business Acquisitions. We made payments of $105.0 million on this facility during the nine months ended September 30, 2016 . Asof September 30, 2016 , the interest rates on the Term A Loan, Term B Loan and Revolving Credit Facility were 2.56% , 3.75% and 2.56% , respectively.
Senior Notes
BKIS has 5.75% Senior Notes, interest paid semi-annually, which mature on April 15, 2023 (the "Senior Notes"). The Senior Notes are senior unsecuredobligations, registered under the Securities Act and contain customary affirmative, negative and financial covenants, and events of default for indebtedness of thistype (with grace periods, as applicable, and lender remedies).
14

Table of Contents
BLACK KNIGHT FINANCIAL SERVICES, INC.NOTES TO CONDENSED CONSOLIDATED FINANCIAL STATEMENTS (Unaudited) - (Continued)
Prior to October 15, 2017, we may redeem some or all of the Senior Notes by paying a "make-whole" premium based on U.S. Treasury rates. On or afterOctober 15, 2017, we may redeem some or all of the Senior Notes at the redemption prices listed in the table below, plus accrued and unpaid interest. In addition, ifa change of control occurs, we are required to offer to purchase all outstanding Senior Notes at a price equal to 101% of the principal amount plus accrued andunpaid interest, if any, to the date of purchase.
Redemption Period PercentageOctober 15, 2017 to October 14, 2018 102.875%October 15, 2018 to October 14, 2019 101.917%October 15, 2019 to October 14, 2020 100.958%October 15, 2020 and thereafter 100.000%
Fair Value of Long-Term Debt
The fair value of our Senior Notes as of September 30, 2016 was $410.5 million ( 105.25% of par value), based upon established market prices for thesecurities using level 2 inputs. The fair value of our Facilities approximates their carrying value at September 30, 2016 . The fair value of our Facilities is basedupon established market prices for the securities using level 2 inputs.
Interest Rate Swaps
On January 20, 2016, we entered into two interest rate swap agreements to hedge forecasted monthly interest rate payments on $400.0 million of our floatingrate debt ( $200.0 million notional value each) (the "Swap Agreements"). Under the terms of the Swap Agreements, we receive payments based on the 1-monthLIBOR rate (equal to 0 .5625% as of September 30, 2016 ) and pay a weighted average fixed rate of 1.01% . The effective term for the Swap Agreements isFebruary 1, 2016 through January 31, 2019.
We entered into the Swap Agreements to convert a portion of the interest rate exposure on our floating rate debt from variable to fixed. We designated theseSwap Agreements as cash flow hedges. A portion of the amount included in Accumulated other comprehensive loss will be reclassified into Interest expense as ayield adjustment as interest payments are made on the Term A Loan. The fair value of our Swap Agreements is based upon level 2 inputs. We have considered ourown credit risk when determining the fair value of our Swap Agreements.
The estimated fair values of our Swap Agreements are as follows (in millions):
Balance Sheet Account September 30, 2016 December 31, 2015
Other non-current liabilities $ 1.8 $ —
As of September 30, 2016 , a cumulative loss of $0.8 million ( $0.5 million net of tax) is reflected in Accumulated other comprehensive loss, and a cumulativeloss of $0.8 million is reflected in Noncontrolling interests. Below is a summary of the effect of derivative instruments on amounts recognized in othercomprehensive earnings ("OCE") on the accompanying Condensed Consolidated Statements of Earnings and Comprehensive Earnings (Unaudited) for the threeand nine months ended September 30, 2016 (in millions):
Three months ended September 30, 2016 Nine months ended September 30, 2016
Amount of (Loss) Gain Recognized
in OCE
Amount of LossReclassified from
Accumulated OCE into Net earnings
Amount of Loss Recognized
in OCE
Amount of Loss Reclassifiedfrom Accumulated OCE
into Net earnings
Swap agreements Attributable to noncontrolling interests $ 0.7 $ 0.3 $ (1.6) $ 0.8Attributable to Black Knight Financial Services, Inc. 0.4 0.1 (0.9) 0.4
Total $ 1.1 $ 0.4 $ (2.5) $ 1.2
Approximately $1.1 million ( $0.9 million net of tax) of the balance in Accumulated other comprehensive loss and noncontrolling interests as ofSeptember 30, 2016 is expected to be reclassified into Interest expense over the next 12 months.
15

Table of Contents
BLACK KNIGHT FINANCIAL SERVICES, INC.NOTES TO CONDENSED CONSOLIDATED FINANCIAL STATEMENTS (Unaudited) - (Continued)
It is our policy to execute such instruments with credit-worthy banks and not to enter into derivative financial instruments for speculative purposes. As ofSeptember 30, 2016 , we believe our interest rate swap counterparties will be able to fulfill their obligations under our agreements, and we believe we will havedebt outstanding through the various expiration dates of the swaps such that the occurrence of future cash flow hedges remains probable.
(9) Income Taxes
For the period prior to the IPO, substantially all of the income taxes of BKFS LLC were not reflected in the accompanying Condensed Consolidated FinancialStatements (Unaudited) as the responsibility for payment of income taxes was borne by the members of BKFS LLC and not by us.
As of September 30, 2016 and December 31, 2015 , we had no uncertain tax positions. We record interest and penalties related to income taxes, if any, as acomponent of Income tax expense. Our effective tax rate for the three months ended September 30, 2016 and 2015 was 16.3% and 18.1% , respectively, and 16.3%and 11.8% for the nine months ended September 30, 2016 and 2015 , respectively. These rates are lower than the typical federal and state statutory rate because ofthe effect of our noncontrolling interests.
(10) Commitments and Contingencies
In the ordinary course of business, we are involved in various pending and threatened litigation and regulatory matters related to our operations, some ofwhich include claims for punitive or exemplary damages. Our ordinary course litigation includes purported class action lawsuits, which make allegations related tovarious aspects of our business. From time to time, we also receive requests for information from various state and federal regulatory authorities, some of whichtake the form of civil investigative demands or subpoenas. Some of these regulatory inquiries may result in the assessment of fines for violations of regulations orsettlements with such authorities requiring a variety of remedies. We believe that no actions, other than those discussed below, depart from customary litigation orregulatory inquiries incidental to our business.
We review lawsuits and other legal and regulatory matters (collectively “legal proceedings”) on an ongoing basis when making accrual and disclosuredecisions. When assessing reasonably possible and probable outcomes, management bases its decision on its assessment of the ultimate outcome assuming allappeals have been exhausted. For legal proceedings where it has been determined that a loss is both probable and reasonably estimable, a liability based on knownfacts and which represents our best estimate has been recorded. Actual losses may materially differ from the amounts recorded and the ultimate outcome of ourpending cases is generally not yet determinable. The accrual for legal and regulatory matters, which includes expenses incurred through the balance sheet date, was$3.5 million and $8.0 million as of September 30, 2016 and December 31, 2015 , respectively. While some of these matters could be material to our operatingresults or cash flows for any particular period if an unfavorable outcome results, at present we do not believe that the ultimate resolution of currently pending legalproceedings, either individually or in the aggregate, will have a material adverse effect on our financial condition.
Litigation Matters
On December 16, 2013, LPS received notice that Merion Capital, L.P. and Merion Capital II, L.P. (together "Merion Capital") were asserting their appraisalright relative to their ownership of 5,682,276 shares of LPS stock (the “Appraisal Shares”) in connection with the acquisition of LPS by FNF on January 2, 2014.On February 6, 2014, Merion Capital filed an appraisal proceeding, captioned Merion Capital LP and Merion Capital II, LP v. Lender Processing Services, Inc.,C.A. No. 9320-VCL, in the Delaware Court of Chancery seeking a judicial determination of the "fair" value of Merion Capital's 5,682,276 shares of LPS commonstock under Delaware law, together with statutory interest. We filed an answer to this suit on March 3, 2014. Merion’s expert has opined that the considerationshould have been $50.46 per share, which is approximately 36 percent higher than the final consideration of $37.14 , and therefore, they are owed an additional$75.7 million plus statutory interest, which is approximately $13.0 million as of September 30, 2016 . Black Knight’s position is that no additional consideration isowed. A bench trial was held May 2 through May 5, 2016, and post-trial arguments were held on September 21, 2016. We will continue to vigorously defendagainst the appraisal proceedings, and we do not believe the result will have a material adverse effect on our financial condition.
Regulatory Matters
Following a review by the Board of Governors of the Federal Reserve System, the Federal Deposit Insurance Corporation, the Office of the Comptroller of theCurrency and the Office of Thrift Supervision (collectively, the "banking agencies"), LPS entered into a consent order (the "Order") dated April 13, 2011 with thebanking agencies. The banking agencies' review of LPS's services included the services provided by its default operations to mortgage servicers regulated by thebanking agencies, including document execution services. The Order did not make any findings of fact or conclusions of wrongdoing, nor did LPS admit any faultor liability. Although LPS is a party to the Order, the ongoing costs of litigation and any potential resulting liability is expected
16

Table of Contents
BLACK KNIGHT FINANCIAL SERVICES, INC.NOTES TO CONDENSED CONSOLIDATED FINANCIAL STATEMENTS (Unaudited) - (Continued)
to be borne by the underlying LPS default operations, which are now part of ServiceLink. Under the Order, ServiceLink agreed to further study the issuesidentified in the review and to enhance ServiceLink's compliance, internal audit, risk management and board oversight plans with respect to those businesses. LPSalso agreed to engage an independent third party to conduct a risk assessment and review of its default management businesses and document execution services itprovided to mortgage servicers from January 1, 2008 through December 31, 2010, which has been on hold since June 2013.
To the extent such third party review, once completed, requires additional remediation of mortgage documents, ServiceLink has agreed to implement anappropriate plan to address the issues. The Order does not include any fine or other monetary penalty. The banking agencies notified ServiceLink in December2015 that they wish to discuss terminating the Order through a possible agreed civil monetary penalty amount in lieu of requiring any additional documentexecution review by the independent third party. At this time, the parties have not agreed on a possible civil monetary penalty amount. The parties entered into atolling agreement to allow the parties to engage in these discussions.
This matter is subject to a Cross-Indemnity Agreement between BKFS LLC and ServiceLink (see Indemnification Agreement below).
Indemnifications and Warranties
We often agree to indemnify our clients against damages and costs resulting from claims of patent, copyright, trademark infringement or breaches ofconfidentiality associated with use of our software through software licensing agreements. Historically, we have not made any payments under suchindemnifications, but continue to monitor the conditions that are subject to the indemnifications to identify whether a loss has occurred that is both probable andestimable that would require recognition. In addition, we warrant to clients that our software operates substantially in accordance with the software specifications.Historically, no costs have been incurred related to software warranties and none are expected in the future, and as such, no accruals for warranty costs have beenmade.
Indemnification Agreement
We are party to the Cross-Indemnity Agreement with ServiceLink. Pursuant to this agreement, ServiceLink indemnifies us from liabilities relating to, arisingout of or resulting from the conduct of ServiceLink's business or any action, suit or proceeding in which we or any of our subsidiaries are named by reason of beinga successor to the business of LPS and the cause of such action, suit or proceeding relates to the business of ServiceLink. In return, we indemnify ServiceLink forliabilities relating to, arising out of, or resulting from the conduct of our business.
(11) Equity-Based Compensation
On February 3, 2016, we granted approximately 0.8 million restricted shares of our Class A common stock with a grant date fair value of $28.29 per share,which was based on the closing price of our common stock on the date of grant. The vesting for these shares is based on certain operating performance and servicecriteria. Of the 0.8 million restricted shares granted, 0.2 million restricted shares vest over a three -year period, and 0.6 million restricted shares vest over a four -year period.
Restricted stock transactions in 2016 are as follows (shares in millions):
Shares Weighted Averaged
Grant Date Fair ValueBalance, December 31, 2015 3.9 *Granted 0.8 $ 28.54Vested (1.5) *Balance, September 30, 2016 3.2 *
______________________________* The BKFS LLC profits interest units that were converted into restricted shares in connection with our IPO had a weighted average grant date fair value of $2.10
per unit. The fair value of the restricted shares at the date of conversion, May 20, 2015, was $24.50 per share. The original grant date fair value of the vestedrestricted shares, which were originally granted as profits interests units, was $2.01 per unit.
17

Table of Contents
BLACK KNIGHT FINANCIAL SERVICES, INC.NOTES TO CONDENSED CONSOLIDATED FINANCIAL STATEMENTS (Unaudited) - (Continued)
Equity-based compensation expense was $3.4 million and $0.9 million for the three months ended September 30, 2016 and 2015 , respectively, and $9.5million and $10.4 million for the nine months ended September 30, 2016 and 2015 , respectively. These expenses are included in Operating expenses in theCondensed Consolidated Statements of Earnings and Comprehensive Earnings (Unaudited). Equity-based compensation expense for the nine months endedSeptember 30, 2015 includes an acceleration charge of $6.2 million related to the accelerated vesting of 4.4 million restricted shares of Class A common stock inconnection with the IPO.
Total unrecognized compensation cost was $28.3 million as of September 30, 2016 and is expected to be recognized over a weighted average period ofapproximately 2.7 years.
(12) Segment Information
ASC Topic 280, Segment Reporting ("ASC 280") establishes standards for reporting information about segments and requires that a public businessenterprise reports financial and descriptive information about its segments. Segments are components of an enterprise for which separate financial information isavailable and are evaluated regularly by the chief operating decision maker (“CODM”) in deciding how to allocate resources and in assessing performance. BlackKnight’s president and chief executive officer is identified as the CODM as defined by ASC 280. To align with the internal management of our business operationsbased on service offerings, our business is organized into two segments:
• Technology - offers software and hosting solutions that support loan servicing, loan origination and settlement services.• Data and Analytics - offers data and analytics solutions to the mortgage, real estate and capital markets industries. These solutions include property
ownership data, lien data, servicing data, automated valuation models, collateral risk scores, prepayment and default models, lead generation and otherdata solutions.
Separate discrete financial information is available for these two segments and the operating results of each segment are regularly evaluated by theCODM in order to assess performance and allocate resources. We use EBITDA as the primary profitability measure for making decisions regarding ongoingoperations. EBITDA is earnings before Interest expense, Income tax expense and the Depreciation and amortization of Property and equipment, Computersoftware, Other intangible assets and deferred contract costs. We do not allocate Interest expense, Other expense, net, Income tax expense and certain other items,such as purchase accounting adjustments and acquisition-related costs to the segments, since these items are not considered in evaluating the segments' overalloperating performance.
Summarized financial information concerning our segments is shown in the tables below (in millions). Prior period results have been reclassified toconform to the current segment presentation. We have reclassified purchase accounting adjustments from the Technology and Data and Analytics segments toCorporate and Other to provide a better indication of ongoing segment performance.
Three months ended September 30, 2016
Technology Data and Analytics Corporate and
Other Total
Revenues $ 221.0 $ 47.6 $ (1.5) (1) $ 267.1Expenses:
Operating expenses 95.9 39.2 17.1 152.2Transition and integration costs — — 1.1 1.1
EBITDA 125.1 8.4 (19.7) 113.8Depreciation and amortization 29.0 2.1 25.7 (2) 56.8Operating income (loss) 96.1 6.3 (45.4) 57.0Interest expense (16.9)Other expense, net (1.4)Earnings from continuing operations before income taxes 38.7Income tax expense 6.3
Net earnings from continuing operations $ 32.4
_______________________________________________________(1) Revenues for Corporate and Other represent deferred revenue purchase accounting adjustments recorded in accordance with GAAP.
(2) Depreciation and amortization for Corporate and Other primarily represents net incremental depreciation and amortization adjustments associated with the application of purchaseaccounting recorded in accordance with GAAP.
18

Table of Contents
BLACK KNIGHT FINANCIAL SERVICES, INC.NOTES TO CONDENSED CONSOLIDATED FINANCIAL STATEMENTS (Unaudited) - (Continued)
Three months ended September 30, 2015
Technology Data and Analytics Corporate and
Other Total
Revenues $ 192.5 $ 43.5 $ (2.4) (1) $ 233.6Expenses:
Operating expenses 84.1 36.1 11.2 131.4Transition and integration costs — — 0.1 0.1
EBITDA 108.4 7.4 (13.7) 102.1Depreciation and amortization 22.7 2.0 24.0 (2) 48.7Operating income (loss) 85.7 5.4 (37.7) 53.4Interest expense (17.0)Other expense, net —Earnings from continuing operations before income taxes 36.4Income tax expense 6.6
Net earnings from continuing operations $ 29.8_______________________________________________________(1) Revenues for Corporate and Other represent deferred revenue purchase accounting adjustments recorded in accordance with GAAP.
(2) Depreciation and amortization for Corporate and Other primarily represents net incremental depreciation and amortization adjustments associated with the application of purchaseaccounting recorded in accordance with GAAP.
Nine months ended September 30, 2016
Technology Data and Analytics Corporate and
Other Total
Revenues $ 636.6 $ 133.7 $ (5.8) (1) $ 764.5Expenses:
Operating expenses 273.2 111.7 48.5 433.4Transition and integration costs — — 2.2 2.2
EBITDA 363.4 22.0 (56.5) 328.9Depreciation and amortization 80.2 6.5 67.5 (2) 154.2Operating income (loss) 283.2 15.5 (124.0) 174.7Interest expense (50.6)Other expense, net (6.2)Earnings from continuing operations before income taxes 117.9Income tax expense 19.2
Net earnings from continuing operations $ 98.7
Balance sheet data:
Total assets $ 3,225.6 $ 353.4 $ 134.5 $ 3,713.5
Goodwill $ 2,111.4 $ 192.9 $ — $ 2,304.3
_______________________________________________________(1) Revenues for Corporate and Other represent deferred revenue purchase accounting adjustments recorded in accordance with GAAP.
(2) Depreciation and amortization for Corporate and Other primarily represents net incremental depreciation and amortization adjustments associated with the application of purchaseaccounting recorded in accordance with GAAP.
19

Table of Contents
BLACK KNIGHT FINANCIAL SERVICES, INC.NOTES TO CONDENSED CONSOLIDATED FINANCIAL STATEMENTS (Unaudited) - (Continued)
Nine months ended September 30, 2015
Technology Data and Analytics Corporate and
Other Total
Revenues $ 568.2 $ 132.0 $ (7.3) (1) $ 692.9Expenses:
Operating expenses 254.0 110.4 40.5 404.9Transition and integration costs — — 7.4 7.4
EBITDA 314.2 21.6 (55.2) 280.6Depreciation and amortization 69.0 5.3 69.1 (2) 143.4Operating income (loss) 245.2 16.3 (124.3) 137.2Interest expense (73.3)Other expense, net (4.6)Earnings from continuing operations before income taxes 59.3Income tax expense 7.0
Net earnings from continuing operations $ 52.3
Balance sheet data:
Total assets $ 3,159.4 $ 313.4 $ 216.4 $ 3,689.2
Goodwill $ 2,050.7 $ 173.2 $ — $ 2,223.9_______________________________________________________(1) Revenues for Corporate and Other represent deferred revenue purchase accounting adjustments recorded in accordance with GAAP.
(2) Depreciation and amortization for Corporate and Other primarily represents net incremental depreciation and amortization adjustments associated with the application of purchaseaccounting recorded in accordance with GAAP.
20

Table of Contents
Item 2. Management's Discussion and Analysis of Financial Condition and Results of Operations
The statements contained in this Quarterly Report on Form 10-Q that are not purely historical are forward-looking statements within the meaning ofSection 27A of the Securities Act and Section 21E of the Exchange Act, including statements regarding expectations, hopes, intentions or strategies regarding thefuture. Forward-looking statements are based on Black Knight management's beliefs, as well as assumptions made by, and information currently available to, them.Because such statements are based on expectations as to future financial and operating results and are not statements of fact, actual results may differ materiallyfrom those projected. Black Knight Financial Services, Inc. ( "Black Knight," "us," "we" or "our" ) undertakes no obligation to update any forward-lookingstatements, whether as a result of new information, future events or otherwise. The risks and uncertainties that forward-looking statements are subject to include,but are not limited to: electronic security breaches against our information systems; our ability to maintain and grow our relationships with our customers; changesto the laws, rules and regulations that affect our and our customers' businesses; our ability to adapt our services to changes in technology or the marketplace; theeffect of any potential defects, development delays, installation difficulties or system failures on our business and reputation; changes in general economic,business, regulatory and political conditions, particularly as they effect the mortgage industry; risks associated with the availability of data; the effects of oursubstantial leverage on our ability to make acquisitions and invest in our business; risks associated with our structure and status as a "controlled company"; ourability to successfully integrate strategic acquisitions; and other risks detailed in the "Statement Regarding Forward-Looking Information," "Risk Factors" andother sections of our Annual Report on Form 10-K for the year ended December 31, 2015 and other filings with the Securities and Exchange Commission ("SEC").
The following discussion should be read in conjunction with our Annual Report on Form 10-K for the year ended December 31, 2015 filed with the SEC onFebruary 26, 2016.
History
Black Knight is a holding company that conducts our business through our interest in Black Knight Financial Services, LLC ("BKFS LLC"). Through itssubsidiaries, BKFS LLC is a leading provider of integrated technology, workflow automation and data and analytics to the mortgage and real estate industries. Oursolutions facilitate and automate many of the mission-critical business processes across the entire mortgage loan life cycle, from origination until asset disposition.We believe we differentiate ourselves by the breadth and depth of our comprehensive, integrated solutions and the insight we provide to our clients.
We are a majority-owned subsidiary of Fidelity National Financial, Inc. ("FNF"). Our business generally represents a reorganization of the formerTechnology, Data and Analytics segment of Lender Processing Services, Inc. ("LPS"), a former provider of integrated technology, data and services to themortgage lending industry in the United States that FNF acquired in January 2014. Our business also includes the businesses of Fidelity National CommerceVelocity, LLC and Property Insight, LLC, two companies that were contributed to us by FNF. ServiceLink Holdings, LLC, ("ServiceLink"), another majority-owned subsidiary of FNF, operates the Transaction Services businesses of the former LPS as well as FNF’s legacy ServiceLink businesses.
Overview
We have market-leading positions in mortgage processing and technology solutions combined with comprehensive real estate data and extensive analyticcapabilities. Our solutions are utilized by U.S. mortgage originators and mortgage servicers, as well as other financial institutions, investors and real estateprofessionals, to support mortgage lending and servicing operations, analyze portfolios and properties, operate more efficiently, meet regulatory compliancerequirements and mitigate risk.
The U.S. mortgage market is undergoing significant change, and mortgage market participants have been subjected to more stringent oversight in recent years.Regulators have increasingly focused on better disclosure, improved risk mitigation and enhanced oversight. Mortgage lenders large and small have experiencedhigher costs in order to comply with this higher level of regulation. Despite these new regulatory burdens, the mortgage industry remains a competitivemarketplace with numerous large lenders and smaller institutions competing for new loan originations. In order to comply with this increased regulatory burdenand compete more effectively, mortgage market participants have continued to outsource mission-critical functions to third party technology providers that canoffer comprehensive and integrated solutions, which are also cost-effective, due to their deep domain expertise and economies of scale.
We believe our comprehensive end-to-end, integrated solutions differentiate us from other technology providers serving the mortgage industry and position usparticularly well for evolving opportunities in this market. We have served the mortgage and real estate industries for over 50 years and utilize this experience todesign and develop solutions that fit our clients’ ever-evolving needs. Our proprietary technology platforms and data and analytics capabilities reduce manualprocesses, improve compliance and quality, mitigate risk and deliver significant cost savings to our clients. Our scale allows us to continually and cost-effectivelyinvest in our business in order to meet evolving industry requirements and maintain our position as an industry-standard platform for mortgage market participants.We had 32.3 million and 30.7 million active loans on our mortgage servicing platform on
21

Table of Contents
September 30, 2016 and 2015 , respectively. Based on the total number of U.S. first lien mortgages outstanding on September 30, 2016 , according to the BlackKnight Mortgage Monitor Report, our proprietary technology platform is used to service approximately 61% of all U.S. first lien mortgages, reflecting ourleadership in technology for the mortgage servicing market.
Our business is organized into two segments:
• Technology - offers software and hosting solutions that support loan servicing, loan origination and settlement services.
• Data and Analytics - offers data and analytics solutions to the mortgage, real estate and capital markets industries. These solutions include propertyownership data, lien data, servicing data, automated valuation models, collateral risk scores, prepayment and default models, lead generation and otherdata solutions.
We offer our solutions to a wide range of clients across the mortgage industry. The quality and breadth of our solutions contributes to the long-standing natureof our relationships with our clients, the majority of whom enter into long-term contracts across multiple products that are embedded in their mission criticalworkflow and decision processes. Given the contractual nature of our revenues and stickiness of our client relationships, our revenues are highly visible andrecurring in nature. Due to our integrated suite of solutions and our scale in the mortgage market, we are able to drive significant operating leverage, which webelieve enables our clients to operate more efficiently while allowing us to generate strong margins and cash flow.
Business Trends and ConditionsGeneral
The U.S. mortgage market is large, and the loan life cycle is complex and consists of several stages. The mortgage loan life cycle includes origination,servicing and default. Mortgages are originated through home purchases or refinancing of existing mortgages. Once a mortgage is originated, it is serviced on aperiodic basis by mortgage servicers, which may not be the lenders that originated the mortgage. Furthermore, if a mortgage experiences default, it triggers a set ofmultifaceted processes with an assortment of potential outcomes depending on a mix of variables.
Underlying the three major components of the mortgage loan life cycle is the technology, data and analytics support behind each process, which has becomeincreasingly critical to industry participants due to the complexity of regulatory requirements. As the industry has grown in complexity, participants haveresponded by outsourcing to large scale specialty providers, automating manual processes and seeking end-to-end solutions that support the processes required tomanage the entire mortgage loan life cycle.
The U.S. mortgage market has seen significant change over the past few years and is expected to continue to evolve going forward. Key regulatory actionsarising from the recent financial crisis, such as the Dodd-Frank Wall Street Reform and Consumer Protection Act ("Dodd-Frank Act") and the establishment of theConsumer Financial Protection Bureau ("CFPB"), impose new and evolving standards for market participants. These regulatory changes have spurred lenders andservicers to seek technology solutions that facilitate the meeting of compliance obligations in the face of a changing regulatory environment while remainingefficient and profitable.
• Increased regulation . Most U.S. mortgage market participants have become subject to increasing regulatory oversight and regulatory requirements asfederal and state governments have enacted various new laws, rules and regulations. One example of such legislation is the Dodd-Frank Act, whichcontains broad changes for many sectors of the financial services and lending industries and established the CFPB, a new federal regulatory agencyresponsible for regulating consumer financial protection within the United States. It is our experience that mortgage lenders have become more focusedon minimizing the risk of non-compliance with these evolving regulations and are looking toward technologies and solutions that help them comply withthe increased regulatory oversight and burdens. The CFPB final rules became effective October 2015, amending Regulation Z (the Truth in Lending Act)("TILA") and Regulation X (Real Estate Settlement Procedures Act) ("RESPA") (the “TILA-RESPA Rule”) to consolidate existing loan disclosures underTILA and RESPA for closed-end credit transactions secured by real property. The TILA-RESPA Rule requires (i) timely delivery of a loan estimate uponreceipt of a consumer’s application and (ii) timely delivery of a closing disclosure prior to consummation of a transaction. The TILA-RESPA Rule alsoimposes certain restrictions, including the prohibition of imposing fees prior to provision of an estimate and the prohibition of providing estimates prior toa consumer’s submission of verifying documents.
• Lenders increasingly focused on core operations. As a result of greater regulatory scrutiny and the higher cost of doing business, we believe lenders havebecome more focused on their core operations and customers. We believe lenders are increasingly shifting from in-house technologies to solutions withthird-party providers who can provide better technology and services more efficiently. Lenders require these vendors to provide best-in-class technologyand deep domain expertise and to assist them in maintaining regulatory compliance.
22

Table of Contents
• Growing role of technology in the U.S. mortgage industry. Banks and other lenders and servicers have become increasingly focused on technologyautomation and workflow management to operate more efficiently and meet their regulatory guidelines. We believe vendors must be able to support thecomplexity of the market, display extensive industry knowledge and possess the financial resources to make the necessary investments in technology tosupport lenders.
• Increased demand for enhanced transparency and analytic insight . As U.S. mortgage market participants work to minimize the risk in lending, servicingand capital markets, they rely on the integration of data and analytics with technologies that enhance the decision making process. These industryparticipants rely on large comprehensive third party databases coupled with enhanced analytics to achieve these goals.
Mortgage Originations
Our various businesses are affected differently by the level of mortgage originations, including refinancing transactions. Our mortgage servicing platform isless affected by varying levels of mortgage originations because it earns revenues based on the total number of mortgage loans it processes, which tend to staymore constant than the market for originations. Our origination technology and some of our data businesses are directly affected by the volume of real estatetransactions and mortgage originations, but many of our client contracts for origination technology contain minimum charges.
Economic Conditions
Our various businesses are also affected by general economic conditions. For example, in the event that a difficult economy or other factors lead to a declinein levels of home ownership and a reduction in the number of mortgage loans outstanding and we are not able to counter the effect of those events with increasedmarket share or higher fees, it could have a material adverse effect on our mortgage processing revenues. In contrast, we believe that a weaker economy tends toincrease the volume of consumer mortgage defaults, which can increase the revenues in our specialty servicing technology business that is used to serviceresidential mortgage loans in default. Also, interest rates tend to decline in a weaker economy driving higher than normal refinance transactions that providepotential volume increases to our origination technology offerings, most specifically the RealEC Exchange platform.
Results of Operations
Key Performance Metrics
We use Adjusted Revenues, Adjusted EBITDA and Adjusted EBITDA Margin for financial and operational decision making and as a means to evaluateperiod-to-period comparisons. Adjusted Revenues, Adjusted EBITDA and Adjusted EBITDA Margin are non-GAAP financial measures, which we believe areuseful for investors in evaluating our overall financial performances. Black Knight believes these measures provide useful information about operating results,enhance the overall understanding of past financial performance and future prospects and allow for greater transparency with respect to key metrics used bymanagement in its financial and operational decision making, including determining a portion of executive compensation.
• Adjusted Revenues - We define Adjusted Revenues as Revenues adjusted to include the revenues that were not recorded by Black Knight during the periodspresented due to the deferred revenue purchase accounting adjustment recorded in accordance with GAAP. These adjustments are reflected in Corporate andOther.
• Adjusted EBITDA - We define Adjusted EBITDA as Net earnings from continuing operations, with adjustments to reflect the addition or elimination of certainincome statement items including, but not limited to (i) depreciation and amortization; (ii) interest expense; (iii) income tax expense; (iv) the deferred revenuepurchase accounting adjustment recorded in accordance with GAAP; (v) equity-based compensation; (vi) charges associated with significant legal andregulatory matters; (vii) member management fees paid to FNF and THL Managers, LLC; (viii) exit costs, impairments and other charges; (ix) costsassociated with debt and equity offerings; (x) acquisition-related costs; and (xi) other expenses, net. These adjustments are reflected in Corporate and Other.
• Adjusted EBITDA Margin - Adjusted EBITDA Margin is calculated by dividing Adjusted EBITDA by Adjusted Revenues.
23
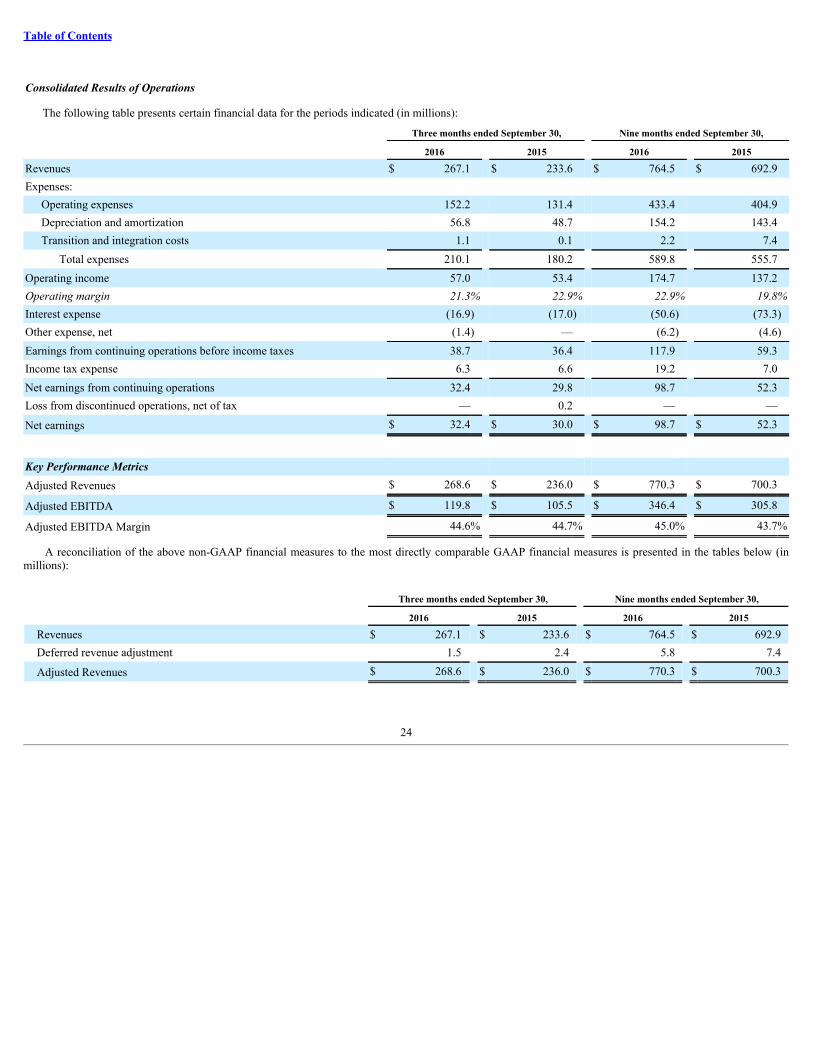
Table of Contents
Consolidated Results of Operations
The following table presents certain financial data for the periods indicated (in millions):
Three months ended September 30, Nine months ended September 30,
2016 2015 2016 2015
Revenues $ 267.1 $ 233.6 $ 764.5 $ 692.9Expenses:
Operating expenses 152.2 131.4 433.4 404.9Depreciation and amortization 56.8 48.7 154.2 143.4Transition and integration costs 1.1 0.1 2.2 7.4
Total expenses 210.1 180.2 589.8 555.7Operating income 57.0 53.4 174.7 137.2Operating margin 21.3% 22.9% 22.9% 19.8%Interest expense (16.9) (17.0) (50.6) (73.3)Other expense, net (1.4) — (6.2) (4.6)Earnings from continuing operations before income taxes 38.7 36.4 117.9 59.3Income tax expense 6.3 6.6 19.2 7.0Net earnings from continuing operations 32.4 29.8 98.7 52.3Loss from discontinued operations, net of tax — 0.2 — —
Net earnings $ 32.4 $ 30.0 $ 98.7 $ 52.3
Key Performance Metrics Adjusted Revenues $ 268.6 $ 236.0 $ 770.3 $ 700.3
Adjusted EBITDA $ 119.8 $ 105.5 $ 346.4 $ 305.8
Adjusted EBITDA Margin 44.6% 44.7% 45.0% 43.7%
A reconciliation of the above non-GAAP financial measures to the most directly comparable GAAP financial measures is presented in the tables below (inmillions):
Three months ended September 30, Nine months ended September 30,
2016 2015 2016 2015
Revenues $ 267.1 $ 233.6 $ 764.5 $ 692.9Deferred revenue adjustment 1.5 2.4 5.8 7.4
Adjusted Revenues $ 268.6 $ 236.0 $ 770.3 $ 700.3
24

Table of Contents
Three months ended September 30, Nine months ended September 30,
2016 2015 2016 2015
Net earnings from continuing operations $ 32.4 $ 29.8 $ 98.7 $ 52.3Depreciation and amortization 56.8 48.7 154.2 143.4Interest expense 16.9 17.0 50.6 73.3Income tax expense 6.3 6.6 19.2 7.0Other expense, net 1.4 — 6.2 4.6EBITDA 113.8 102.1 328.9 280.6Deferred revenue adjustment 1.5 2.4 5.8 7.4Equity-based compensation 3.4 0.9 9.5 10.4Transition and integration costs 1.1 — 2.2 3.6IPO costs — 0.1 — 3.8
Adjusted EBITDA $ 119.8 $ 105.5 $ 346.4 $ 305.8
Adjusted EBITDA Margin 44.6% 44.7% 45.0% 43.7%
Revenues
Consolidated revenues were $267.1 million and $233.6 million in the three months ended September 30, 2016 and 2015 , respectively, and $764.5 million and$692.9 million in the nine months ended September 30, 2016 and 2015 , respectively. The change in revenues is discussed further at the segment level below.
The following table sets forth revenues by segment for the periods presented (in millions):
Three months ended September 30, Nine months ended September 30,
2016 2015 2016 2015
Technology $ 221.0 $ 192.5 $ 636.6 $ 568.2Data and Analytics 47.6 43.5 133.7 132.0Corporate and Other (1) (1.5) (2.4) (5.8) (7.3)
Total $ 267.1 $ 233.6 $ 764.5 $ 692.9
_______________________________________________________(1) Revenues for Corporate and Other represent deferred revenue purchase accounting adjustments recorded in accordance with GAAP.
Technology
Revenues were $221.0 million in the three months ended September 30, 2016 as compared to $192.5 million in the 2015 period, an increase of $28.5 million ,or 15% . Our servicing technology business contributed $13.2 million of this increase, primarily driven by higher average loan volumes, which increased 6% to32.4 million average loans on our servicing platform, price increases and new client wins. Our origination technology business contributed $15.3 million of thisincrease, primarily driven by prior year client implementations, higher transaction volumes and revenues attributable to the acquisition of eLynx Holdings, Inc.("eLynx").
Revenues were $636.6 million in the nine months ended September 30, 2016 as compared to $568.2 million in the 2015 period, an increase of $68.4 million ,or 12% . Our servicing technology business contributed $32.9 million of this increase, primarily driven by higher average loan volumes, which increased 6% to31.9 million average loans on our servicing platform, price increases and new client wins. Our origination technology business contributed $35.5 million of thisincrease, primarily driven by prior year client implementations, higher transaction volumes and revenues attributable to eLynx.
Data and Analytics
Revenues were $47.6 million in the three months ended September 30, 2016 as compared to $43.5 million in the 2015 period, an increase of $4.1 million , or9% . The increase was primarily attributable to the acquisition of Motivity Solutions, Inc. ("Motivity"), new client wins and higher transaction volumes fromexisting clients.
Revenues were $133.7 million in the nine months ended September 30, 2016 as compared to $132.0 million in the 2015 period, an increase of $1.7 million , or1% .
25

Table of Contents
Operating Expenses
Consolidated operating expenses were $152.2 million and $131.4 million in the three months ended September 30, 2016 and 2015 , respectively, and $433.4million and $404.9 million in the nine months ended September 30, 2016 and 2015 , respectively. The changes in operating expenses are discussed further at thesegment level below.
The following table sets forth operating expenses by segment for the periods presented (in millions):
Three months ended September 30, Nine months ended September 30,
2016 2015 2016 2015
Technology $ 95.9 $ 84.1 $ 273.2 $ 254.0Data and Analytics 39.2 36.1 111.7 110.4Corporate and Other 17.1 11.2 48.5 40.5
Total $ 152.2 $ 131.4 $ 433.4 $ 404.9
Technology
Operating expenses were $95.9 million in the three months ended September 30, 2016 as compared to $84.1 million in the 2015 period, representing anincrease of $11.8 million , or 14% . Our origination technology business experienced an increase in operating expenses primarily driven by higher net personnelexpense as well as expenses attributable to eLynx.
Operating expenses were $273.2 million in the nine months ended September 30, 2016 as compared to $254.0 million in the 2015 period, representing anincrease of $19.2 million , or 8% . In our origination technology business, the increase was primarily driven by the addition of eLynx and lower capitalizedsoftware development and deferred implementation costs. Our servicing technology business experienced a decrease in operating expenses, primarily driven bylower personnel costs.
Data and Analytics
Operating expenses were $39.2 million in the three months ended September 30, 2016 as compared to $36.1 million in the 2015 period, an increase of $3.1,million or 9%. The increase was primarily driven by expenses associated with Motivity and lower capitalized software development costs.
Operating expenses were $111.7 million in the nine months ended September 30, 2016 as compared to $110.4 million in the 2015 period.
Corporate and Other
Operating expenses were $17.1 million in the three months ended September 30, 2016 as compared to $11.2 million in the 2015 period, an increase of $5.9million , or 53% . The increase was primarily driven by higher incentive bonus accruals, higher compensation and employee-related costs as we expanded certaincorporate functions in 2016 to support our continued growth.
Operating expenses were $48.5 million in the nine months ended September 30, 2016 as compared to $40.5 million in the 2015 period, an increase of $8.0million , or 20% . The increase was primarily driven by higher incentive bonus accruals, higher compensation and employee-related costs as we expanded certaincorporate functions in 2016 to support our continued growth and public company costs.
Depreciation and AmortizationConsolidated depreciation and amortization was $56.8 million and $48.7 million in the three months ended September 30, 2016 and 2015 , respectively, and
$154.2 million and $143.4 million in the nine months ended September 30, 2016 and 2015 , respectively. The changes in depreciation and amortization arediscussed further at the segment level below.
26

Table of Contents
The following table sets forth depreciation and amortization by segment for the periods presented (in millions):
Three months ended September 30, Nine months ended September 30,
2016 2015 2016 2015
Technology $ 29.0 $ 22.7 $ 80.2 $ 69.0Data and Analytics 2.1 2.0 6.5 5.3Corporate and Other (1) 25.7 24.0 67.5 69.1
Total $ 56.8 $ 48.7 $ 154.2 $ 143.4
_______________________________________________________(1) Depreciation and amortization for Corporate and Other primarily represents net incremental depreciation and amortization adjustments associated with the application of purchase
accounting recorded in accordance with GAAP.
Technology
Depreciation and amortization was $29.0 million in the three months ended September 30, 2016 compared to $22.7 million in the 2015 period, an increase of$6.3 million , or 28% . The main drivers of this increase are the amortization of deferred contract costs relating to client implementations, including acceleratedamortization of $2.9 million related to certain deferred implementation costs, and the amortization from new software development.
Depreciation and amortization was $80.2 million in the nine months ended September 30, 2016 as compared to $69.0 million in the 2015 period, an increaseof $11.2 million , or 16% . The main drivers of this increase are the amortization of deferred contract costs relating to client implementations, including acceleratedamortization of $2.9 million related to certain deferred implementation costs, and the amortization from new software development offset by lower amortization ofcustomer relationship assets.
Transition and Integration CostsTransition and integration costs were $1.1 million in the three months ended September 30, 2016 compared to $0.1 million in the 2015 period and were $2.2
million in the nine months ended September 30, 2016 as compared to $7.4 million in the 2015 period. Transition and integration costs for the 2016 period primarilyrepresent costs associated with the eLynx and Motivity acquisitions. Transition and integration costs for the 2015 period represent management fees paid to FNFand THL through May 25, 2015, prior to the IPO, and costs related to the IPO.
Operating Income (Loss)Consolidated operating income was $57.0 million and $53.4 million in the three months ended September 30, 2016 and 2015 , respectively, and $174.7
million and $137.2 million in the nine months ended September 30, 2016 and 2015 , respectively. The changes in operating income are discussed further at thesegment level below.
The following table sets forth operating income (loss) by segment for the periods presented (in millions):
Three months ended September 30, Nine months ended September 30,
2016 2015 2016 2015
Technology $ 96.1 $ 85.7 $ 283.2 $ 245.2Data and Analytics 6.3 5.4 15.5 16.3Corporate and Other (45.4) (37.7) (124.0) (124.3)
Total $ 57.0 $ 53.4 $ 174.7 $ 137.2
Technology
Operating income was $96.1 million in the three months ended September 30, 2016 as compared to $85.7 million in the 2015 period, representing an increaseof $10.4 million , or 12% . Operating margin was 43.5% in the three months ended September 30, 2016 as compared to 44.5% in 2015 . The margin decline wasprimarily due to higher depreciation and amortization.
Operating income was $283.2 million in the nine months ended September 30, 2016 as compared to $245.2 million in the 2015 period, representing anincrease of $38.0 million , or 15% . Operating margin was 44.5% in the nine months ended September 30, 2016 as compared to 43.2% in 2015 . The increases inoperating income and operating margin are due to strong incremental margins on the revenue growth and the benefit of prior year cost actions that were partiallyoffset by higher depreciation and amortization.
27

Table of Contents
Data and Analytics
Operating income was $6.3 million in the three months ended September 30, 2016 as compared to $5.4 million in the 2015 period. Operating margin was13.2% in the three months ended September 30, 2016 as compared to 12.4% in 2015 .
Operating income was $15.5 million in the nine months ended September 30, 2016 as compared to $16.3 million in the 2015 period. Operating margin was11.6% in the nine months ended September 30, 2016 as compared to 12.3% in 2015 . The decrease is primarily due to the net impact of lower upfront revenuesfrom long-term strategic license deals in the current year.
Corporate and Other
Operating loss was $45.4 million in the three months ended September 30, 2016 as compared to $37.7 million in the 2015 period. The increase was primarilydriven by higher incentive bonus accruals, higher compensation and employee-related costs as we expanded certain corporate functions in 2016 to support ourcontinued growth.
Operating loss was $124.0 million in the nine months ended September 30, 2016 as compared to $124.3 million in the 2015 period.
Interest ExpenseInterest expense was $16.9 million in the three months ended September 30, 2016 compared to $17.0 million in the 2015 period, a decrease of $0.1 million , or
1% .
Interest expense was $50.6 million in the nine months ended September 30, 2016 compared to $73.3 million in the 2015 period, a decrease of $22.7 million ,or 31% . The decrease is attributable to lower interest payments as a result of our new credit facilities entered into during 2015, as well as lower debt outstandingfollowing the IPO.
Other Expense, NetOther expense, net was $1.4 million in the three months ended September 30, 2016 compared to $0.0 million in the 2015 period, and $6.2 million in the nine
months ended September 30, 2016 compared to $4.6 million in the 2015 period. The increase in both periods was primarily driven by legal fees associated withlitigation matters.
Income Tax ExpenseConsolidated Income tax expense was $6.3 million and $6.6 million for the three months ended September 30, 2016 and 2015 , respectively, and $19.2 million
and $7.0 million in the nine months ended September 30, 2016 and 2015 , respectively. Our effective tax rate for the three months ended September 30, 2016 andSeptember 30, 2015 was 16.3% and 18.1% , respectively, and 16.3% and 11.8% for the nine months ended September 30, 2016 and September 30, 2015 ,respectively. These rates are lower than the typical federal and state statutory rate because of the effect of our noncontrolling interests.
Adjusted EBITDA and Adjusted EBITDA MarginConsolidated Adjusted EBITDA was $119.8 million in the three months ended September 30, 2016 compared to $105.5 million in the 2015 period.
Consolidated Adjusted EBITDA was $346.4 million in the nine months ended September 30, 2016 compared to $305.8 million in the 2015 period. The changes inAdjusted EBITDA are discussed further at the segment level below.
Consolidated Adjusted EBITDA Margin was 44.6% in the three months ended September 30, 2016 compared to 44.7% in the 2015 period. ConsolidatedAdjusted EBITDA Margin was 45.0% in the nine months ended September 30, 2016 compared to 43.7% in the 2015 period. The changes in Adjusted EBITDAMargin are discussed further at the segment level below.
The following tables sets forth Adjusted EBITDA (in millions) and Adjusted EBITDA Margin by segment for the periods presented:
Three months ended September 30, Nine months ended September 30,
2016 2015 2016 2015
Technology $ 125.1 $ 108.4 $ 363.4 $ 314.2Data and Analytics 8.4 7.4 22.0 21.6Corporate and Other (13.7) (10.3) (39.0) (30.0)
Total $ 119.8 $ 105.5 $ 346.4 $ 305.8
28

Table of Contents
Three months ended September 30, Nine months ended September 30,
2016 2015 2016 2015
Technology 56.6% 56.3% 57.1% 55.3%Data and Analytics 17.6% 17.0% 16.5% 16.4%Corporate and Other N/A N/A N/A N/A
Total 44.6% 44.7% 45.0% 43.7%
Technology
Adjusted EBITDA was $125.1 million in the three months ended September 30, 2016 as compared to $108.4 million in the 2015 period, an increase of $16.7million , or 15% , with an Adjusted EBITDA Margin of 56.6% , an increase of 30 basis points from the prior year quarter. The increase was primarily driven byincremental margins on revenue growth.
Adjusted EBITDA was $363.4 million in the nine months ended September 30, 2016 as compared to $314.2 million in the 2015 period, an increase of $49.2million , or 16% , with an Adjusted EBITDA Margin of 57.1% , an increase of 180 basis points from the prior year period. The increase was primarily driven byincremental margins on revenue growth and the benefit of prior year cost actions.
Data and Analytics
Adjusted EBITDA was $8.4 million in the three months ended September 30, 2016 as compared to $7.4 million in the 2015 period, an increase of $1.0 million, or 14% , with an Adjusted EBITDA Margin of 17.6% , an increase of 60 basis points from the prior year quarter.
Adjusted EBITDA was $22.0 million in the nine months ended September 30, 2016 as compared to $21.6 million in the 2015 period, an increase of $0.4million , or 2% , with an Adjusted EBITDA Margin of 16.5% , an increase of 10 basis points from the prior year period.Liquidity and Capital Resources
Cash RequirementsOur primary sources of liquidity are our existing cash balances, cash flows from operations and borrowings on our revolving credit facility.
Our primary cash requirements include operating expenses, debt service payments (principal and interest), capital expenditures (including property, equipmentand computer software expenditures) and income tax payments and may include business acquisitions, dividends and/or share repurchases. Our cash requirementsmay also include tax distributions to holders of membership units of BKFS LLC units, the timing and amount of which will be dependent upon the taxable incomeallocable to such holders. BKFS LLC made tax distributions of $48.5 million during the nine months ended September 30, 2016 . We do not anticipate anysignificant tax distributions for the remainder of 2016. In addition, we would need cash to purchase shares of Class B common stock that are converted into sharesof Class A common stock pursuant to the Second Amended and Restated Limited Liability Company Agreement if we choose to pay cash for such shares.
As of September 30, 2016 , we had cash and cash equivalents of $58.9 million and debt of $1,580.5 million , excluding the debt issuance costs and theunamortized premium associated with our 5.75% Senior Notes maturing on April 15, 2023 ("Senior Notes"). We believe our cash flow from operations andavailable cash and cash equivalents are sufficient to meet our liquidity needs, including the repayment of our outstanding debt, for at least the next 12 months. Weanticipate that to the extent that we require additional liquidity, it will be funded through borrowings on our revolving credit facility, the incurrence of otherindebtedness, equity issuance or a combination thereof. We cannot be assured that we will be able to obtain this additional liquidity on reasonable terms, or at all.The loss of the largest lender on our revolving credit facility would reduce our borrowing capacity by $36.7 million . Additionally, our liquidity and our ability tomeet our obligations and fund our capital requirements are also dependent on our future financial performance, which is subject to general economic, financial andother factors that are beyond our control. Accordingly, we cannot be assured that our business will generate sufficient cash flow from operations or that futureborrowings will be available from additional indebtedness or otherwise to meet our liquidity needs. Although we have no specific current plans to do so, if wedecide to pursue one or more significant acquisitions, we may incur additional debt or sell additional equity to finance such acquisitions.
29

Table of Contents
Cash Flows
The following table provides a summary of cash flows from operating, investing and financing activities for the periods presented (in millions):
Nine months ended September 30,
2016 2015
Cash flows from operating activities $ 210.5 $ 158.9Cash flows from investing activities (206.1) (81.3)Cash flows from financing activities (131.5) (10.5)
Net (decrease) increase in cash and cash equivalents $ (127.1) $ 67.1
Operating ActivitiesCash provided by operating activities was $210.5 million and $158.9 million for the nine months ended September 30, 2016 and 2015 , respectively. The
increase in cash provided by operating activities in the nine months ended September 30, 2016 as compared to the 2015 period is primarily related to increasedearnings.
Investing ActivitiesCash used in investing activities was $206.1 million and $81.3 million for the nine months ended September 30, 2016 and 2015 , respectively. The increase in
cash used in investing activities in the nine months ended September 30, 2016 as compared to the 2015 period is primarily related to the eLynx and Motivityacquisitions that were partially offset by lower capital expenditures in the 2016 period and a one-time investment in our property records database from the buyoutof a strategic data partner in the 2015 period.
Financing Activities
Cash used in financing activities was $131.5 million and $10.5 million for the nine months ended September 30, 2016 and 2015 , respectively. The 2016period includes debt service payments of $138.0 million and tax distributions to BKFS LLC members of $48.5 million , partially offset by cash inflows of $55.0million in borrowings. In the 2015 period, we had cash inflows of $1,299.0 million in borrowings, net of original discount, and $479.3 million in gross proceedsfrom the IPO. These inflows were offset primarily by $1,734.9 million in debt service payments, as well as debt issuance costs and other costs attributable to theIPO.
Financing
For a description of our financing arrangements, see Note 8 — Long-Term Debt in the Notes to Condensed Consolidated Financial Statements (Unaudited)included in Item 1 of Part 1 of this Report, which is incorporated by reference into this Part I Item 2.
Contractual Obligations
Our long-term contractual obligations generally include our debt and related interest payments, data processing and maintenance commitments and operatingand capital lease payments on certain of our property and equipment. In June 2016, we entered into a one-year capital lease agreement with a bargain purchaseoption for certain computer equipment.
Total minimum lease payments as of September 30, 2016 for the capital lease agreement for the remainder of 2016 and 2017 are as follows (in millions):
2016 (remaining) $ 3.42017 5.0
Total $ 8.4
There were no other significant changes to contractual obligations from those disclosed in the Annual Report on Form 10-K for the year ended December 31,2015 .
Indemnifications and Warranties
We often indemnify our clients against damages and costs resulting from claims of patent, copyright, trademark infringement or breaches of confidentialityassociated with use of our software through software licensing agreements. Historically, we have not made any payments under such indemnifications, butcontinue to monitor the conditions that are subject to the indemnifications
30

Table of Contents
to identify whether a loss has occurred that is both probable and estimable that would require recognition. In addition, we warrant to clients that our softwareoperates substantially in accordance with the software specifications. Historically, no costs have been incurred related to software warranties and none are expectedin the future, and as such no accruals for warranty costs have been made.
Off-Balance Sheet Arrangements
We do not have any material off-balance sheet arrangements other than operating leases and interest rate swaps.
Critical Accounting Policies
There have been no material changes to our critical accounting policies described in our Annual Report on Form 10-K for the year ended December 31, 2015 .
Item 3. Quantitative and Qualitative Disclosure about Market Risk
Market RiskWe regularly assess market risks and have established policies and business practices designed to protect against the adverse effects of these exposures. We
are exposed to market risks primarily from changes in interest rates. We use interest rate swaps to manage interest rate risk. We do not use interest rate swaps fortrading purposes, to generate income or to engage in speculative activity.Interest Rate Risk
In addition to existing cash balances and cash provided by operating activities, we use fixed rate and variable rate debt to finance our operations. We areexposed to interest rate risk on these debt obligations and related interest rate swaps. We had $1,580.5 million in long-term debt outstanding as of September 30,2016 . The Senior Notes represent all of our fixed-rate long-term debt obligations as of September 30, 2016 . The carrying value of the Senior Notes was $401.5million as of September 30, 2016 . The fair value of the Senior Notes was $410.5 million as of September 30, 2016 .
The credit facilities as described in Note 8 to the Condensed Consolidated Financial Statements (Unaudited) represent our variable rate long-term debtobligations as of September 30, 2016 . The carrying value of these facilities was $1,179.0 million as of September 30, 2016 . We performed a sensitivity analysison the principal amount of our long-term debt subject to variable interest rates as of September 30, 2016 . This sensitivity analysis is based solely on the principalamount of such debt as of September 30, 2016 , and does not take into account any changes that occurred in the prior 12 months or that may take place in the next12 months in the amount of our outstanding debt or in the notional amount of outstanding interest rate swaps. Further, in this sensitivity analysis, the change ininterest rates is assumed to be applicable for an entire year. An increase of 100 basis points in the applicable interest rate would cause an increase in interestexpense of $11.2 million on an annual basis ( $7.2 million including the effect of our current interest rate swaps). A decrease of 100 basis points in the applicablerate would cause a decrease in interest expense of $4.5 million on an annual basis ( $2.3 million including the effect of our current interest rate swaps) as thecurrent LIBOR rate is less than 1% .
On January 20, 2016, we entered into two interest rate swap agreements to hedge forecasted monthly interest rate payments on $400.0 million of our floatingrate debt ($200.0 million notional value each) (the “Swap Agreements”). The Swap Agreements were designated as cash flow hedging instruments. Under theterms of the Swap Agreements, we receive payments based on the 1-month LIBOR rate and pay a weighted average fixed rate of 1.01% . A portion of the amountincluded in accumulated other comprehensive earnings is reclassified into interest expense as a yield adjustment as interest payments are made on the term andrevolving loans. In accordance with the authoritative guidance for fair value measurements, the inputs used to determine the estimated fair value of our interest rateswaps are Level 2-type measurements. We considered our own credit risk and the credit risk of the counterparties when determining the fair value of our interestrate swaps. The effective term for the Swap Agreements is February 1, 2016 through January 31, 2019.
31

Item 4. Controls and ProceduresEvaluation of Disclosure Controls and Procedures
As of September 30, 2016 , under the supervision and with the participation of our President and Chief Executive Officer ("CEO") and Executive VicePresident and Chief Financial Officer ("CFO"), management has evaluated the effectiveness of the design and operation of our disclosure controls and procedures,as such term is defined in Rules 13a-15(e) and 15d-15(e) under the Exchange Act, as of the end of the period covered by this Quarterly Report on Form 10-Q.
There are inherent limitations to the effectiveness of any system of disclosure controls and procedures, including the possibility of human error and thecircumvention or overriding of the controls and procedures. Our disclosure controls and procedures are designed to provide reasonable assurance of achieving theircontrol objectives.
Based on that evaluation, our CEO and CFO concluded that as of September 30, 2016 , our disclosure controls and procedures were effective to providereasonable assurance that the information required to be disclosed by us in the reports we file or submit with the SEC are recorded, processed, summarized andreported within the time periods specified in SEC rules and forms and is accumulated and communicated to our management, including the principal executive andprincipal financial officers, or persons performing similar functions, as appropriate to allow timely decisions regarding required disclosure.
Changes in Internal Control over Financial Reporting
There was no change in our internal control over financial reporting identified in connection with the evaluation required by Rules 13a-15(d) and 15d-15(d) ofthe Exchange Act that occurred during the period covered by this Quarterly Report on Form 10-Q that have materially affected, or are reasonably likely tomaterially affect, our internal control over financial reporting.
Part II: OTHER INFORMATION
Item 1. Legal Proceedings
See discussion of legal proceedings in Note 10 — Commitments and Contingencies in the Notes to Condensed Consolidated Financial Statements (Unaudited)included in Item 1of Part I of this Quarterly Report on Form 10-Q, which is incorporated by reference into this Item 1 of Part II.
Item 1A. Risk Factors
There have been no material changes in our risk factors since the filing of our Annual Report on Form 10-K for the year ended December 31, 2015 .
Item 2. Unregistered Sales of Equity Securities and Use of Proceeds
None.
Item 3. Defaults Upon Senior Securities
None.
Item 4. Mine Safety Disclosures
Not applicable.
Item 5. Other Information
None.
32

Item 6. Exhibits
(a) Exhibits
10.1 Amendment to the Restricted Stock Award Agreement (Subject to Time-Based Restriction)
31.1 Certification of Chief Executive Officer pursuant to Section 302 of the Sarbanes-Oxley Act of 2002.
31.2 Certification of Chief Financial Officer pursuant to Section 302 of the Sarbanes-Oxley Act of 2002.
32.1
Certification by Chief Executive Officer of Periodic Financial Reports pursuant to Section 906 of the Sarbanes-Oxley Act of2002, 18 U.S.C. Section 1350.
32.2
Certification by Chief Financial Officer of Periodic Financial Reports pursuant to Section 906 of the Sarbanes-Oxley Act of2002, 18 U.S.C. Section 1350.
101 Interactive data files.
33

SIGNATURES
Pursuant to the requirements of the Securities Exchange Act of 1934, as amended, the registrant has duly caused this Quarterly Report on Form 10-Q to besigned on its behalf by the undersigned thereunto duly authorized.
Date: November 3, 2016 BLACK KNIGHT FINANCIAL SERVICES, INC.(registrant)
By: /s/ Kirk T. Larsen Kirk T. Larsen
Executive Vice President and Chief Financial Officer(Principal Financial and Accounting Officer)
34

EXHIBIT INDEX
Exhibit No. Description
10.1 Amendment to the Restricted Stock Award Agreement (Subject to Time-Based Restriction)
31.1 Certification of Chief Executive Officer pursuant to Section 302 of the Sarbanes-Oxley Act of 2002.
31.2 Certification of Chief Financial Officer pursuant to Section 302 of the Sarbanes-Oxley Act of 2002.
32.1
Certification by Chief Executive Officer of Periodic Financial Reports pursuant to Section 906 of the Sarbanes-Oxley Act of2002, 18 U.S.C. Section 1350.
32.2
Certification by Chief Financial Officer of Periodic Financial Reports pursuant to Section 906 of the Sarbanes-Oxley Act of2002, 18 U.S.C. Section 1350.
101 Interactive data files.
35

Exhibit 10.1Amendment
to the
Restricted Stock Award Agreement(Subject to Time-Based Restriction)
This AMENDMENT (the “ Amendment ”), effective as of August 19, 2016, is by and between Black Knight Financial Services, Inc., aDelaware corporation (the “ Company ”), and [ ] (the “Grantee”).
WHEREAS, the Grantee was previously granted an award (the “ Award ”) of restricted shares of the Company’s Class A common stock on May 26, 2015, inexchange for the Grantee’s profits interest award of Class B Units in Black Knight Financial Services, LLC granted to Grantee on [ ], 2014; and
WHEREAS, the Company and the Executive wish to amend the Restricted Stock Award Agreement, pursuant to which the Award was granted (the “ AwardAgreement ”);
NOW, THEREFORE, intending to be bound, the parties hereby agree as follows.
1. Section 2(a)(i) of the Award Agreement is amended to read as follows:
“If the Grantee’s (A) employment or service as a Director or Consultant is terminated by the Company or a Subsidiary without Cause or (B)employment agreement with the Company or a Subsidiary provides for severance benefits upon a termination for “Good Reason” and theGrantee terminates employment for Good Reason in accordance with the employment agreement, then any Shares of Restricted Stock that wouldhave vested within the 12 months immediately following the date of the Grantee’s termination (had the Grantee’s employment or services notterminated) shall vest as of the date of termination. Except as otherwise provided in the previous sentence, if the Grantee’s employment orservice as a Director or Consultant is terminated by the Company or Grantee for any reason, including as a result of the Grantee’s death orDisability, the Grantee shall, for no consideration, forfeit to the Company the Shares of Restricted Stock to the extent such Shares are subject toa Period of Restriction at the time of such termination.”
2. A new Section (iv) shall be added after Section 2(a)(iii) to read as follows:
“(iv) The term “Disability” shall have the meaning ascribed to such term in the Grantee’s employment, director services or similar agreementwith the Company or a Subsidiary. If the Grantee’s employment, director services or similar agreement does not define the term “Disability,” orif the Grantee has not entered into an employment, director services or similar agreement with the Company or a Subsidiary, the term“Disability” shall mean a total or permanent disability of Grantee that would entitle the Grantee to long-term disability benefits under theCompany’s or a Subsidiary’s long-term disability plan in which Grantee is eligible to participate.”
IN WITNESS WHEREOF, the Company and the Grantee have caused this Amendment to be duly executed, effective as of the date first set forth above.
BLACK KNIGHT FINANCIAL SERVICES, INC. By: ______________________________
Thomas J. SanzonePresident and Chief Executive Officer
GRANTEE
__________________________________[ ]

Exhibit 31.1
CERTIFICATIONSI, Thomas J. Sanzone, certify that:
1. I have reviewed this Quarterly Report on Form 10-Q of Black Knight Financial Services, Inc.;
2. Based on my knowledge, this report does not contain any untrue statement of a material fact or omit to state a material fact necessary to make the statementsmade, in light of the circumstances under which such statements were made, not misleading with respect to the period covered by this report;
3. Based on my knowledge, the financial statements, and other financial information included in this report, fairly present in all material respects the financialcondition, results of operations and cash flows of the registrant as of, and for, the periods presented in this report;
4. The registrant's other certifying officer and I are responsible for establishing and maintaining disclosure controls and procedures (as defined in Exchange ActRules 13a-15(e) and 15d-15(e)) for the registrant and have:
(a) designed such disclosure controls and procedures, or caused such disclosure controls and procedures to be designed under our supervision, toensure that material information relating to the registrant, including its consolidated subsidiaries, is made known to us by others within thoseentities, particularly during the period in which this report is being prepared;
(b) omitted;
(c) evaluated the effectiveness of the registrant's disclosure controls and procedures and presented in this report our conclusions about theeffectiveness of the disclosure controls and procedures, as of the end of the period covered by this report based on such evaluation; and
(d) disclosed in this report any change in the registrant's internal control over financial reporting that occurred during the registrant's most recentfiscal quarter (the registrant's fourth fiscal quarter in the case of an annual report) that has materially affected, or is reasonably likely tomaterially affect, the registrant's internal control over financial reporting; and
5. The registrant's other certifying officer and I have disclosed, based on our most recent evaluation of internal control over financial reporting, to the registrant'sauditors and the audit committee of registrant's board of directors (or persons performing the equivalent functions):
(a) all significant deficiencies and material weaknesses in the design or operation of internal control over financial reporting which are reasonablylikely to adversely affect the registrant's ability to record, process, summarize and report financial information; and
(b) any fraud, whether or not material, that involves management or other employees who have a significant role in the registrant's internal controlover financial reporting.
Date: November 3, 2016
By: /s/ Thomas J. Sanzone
Thomas J. Sanzone President and Chief Executive Officer

Exhibit 31.2
CERTIFICATIONSI, Kirk T. Larsen, certify that:
1. I have reviewed this Quarterly Report on Form 10-Q of Black Knight Financial Services, Inc.;
2. Based on my knowledge, this report does not contain any untrue statement of a material fact or omit to state a material fact necessary to make the statementsmade, in light of the circumstances under which such statements were made, not misleading with respect to the period covered by this report;
3. Based on my knowledge, the financial statements, and other financial information included in this report, fairly present in all material respects the financialcondition, results of operations and cash flows of the registrant as of, and for, the periods presented in this report;
4. The registrant's other certifying officer and I are responsible for establishing and maintaining disclosure controls and procedures (as defined in Exchange ActRules 13a-15(e) and 15d-15(e)) for the registrant and have:
(a) designed such disclosure controls and procedures, or caused such disclosure controls and procedures to be designed under our supervision, toensure that material information relating to the registrant, including its consolidated subsidiaries, is made known to us by others within thoseentities, particularly during the period in which this report is being prepared;
(b) omitted;
(c) evaluated the effectiveness of the registrant's disclosure controls and procedures and presented in this report our conclusions about theeffectiveness of the disclosure controls and procedures, as of the end of the period covered by this report based on such evaluation; and
(d) disclosed in this report any change in the registrant's internal control over financial reporting that occurred during the registrant's most recentfiscal quarter (the registrant's fourth fiscal quarter in the case of an annual report) that has materially affected, or is reasonably likely tomaterially affect, the registrant's internal control over financial reporting; and
5. The registrant's other certifying officer and I have disclosed, based on our most recent evaluation of internal control over financial reporting, to the registrant'sauditors and the audit committee of registrant's board of directors (or persons performing the equivalent functions):
(a) all significant deficiencies and material weaknesses in the design or operation of internal control over financial reporting which are reasonablylikely to adversely affect the registrant's ability to record, process, summarize and report financial information; and
(b) any fraud, whether or not material, that involves management or other employees who have a significant role in the registrant's internal controlover financial reporting.
Date: November 3, 2016
By: /s/ Kirk T. Larsen
Kirk T. Larsen Executive Vice President and Chief FinancialOfficer

Exhibit 32.1
CERTIFICATION OF PERIODIC FINANCIAL REPORTS PURSUANT TO 18 U.S.C. §1350
The undersigned hereby certifies that he is the duly appointed and acting President and Chief Executive Officer of Black Knight Financial Services, Inc., aDelaware corporation (the “Company”), and hereby further certifies as follows.
1. The periodic report containing financial statements to which this certificate is an exhibit fully complies with the requirements of Section 13(a) or 15(d)of the Securities Exchange Act of 1934.
2. The information contained in the periodic report to which this certificate is an exhibit fairly presents, in all material respects, the financial conditionand results of operations of the Company.
In witness whereof, the undersigned has executed and delivered this certificate as of the date set forth opposite his signature below.
Date: November 3, 2016
By: /s/ Thomas J. Sanzone Thomas J. Sanzone President and Chief Executive Officer

Exhibit 32.2
CERTIFICATION OF PERIODIC FINANCIAL REPORTS PURSUANT TO 18 U.S.C. §1350
The undersigned hereby certifies that he is the duly appointed and acting Executive Vice President and Chief Financial Officer of Black Knight FinancialServices, Inc., a Delaware corporation (the “Company”), and hereby further certifies as follows.
1. The periodic report containing financial statements to which this certificate is an exhibit fully complies with the requirements of Section 13(a) or 15(d)of the Securities Exchange Act of 1934.
2. The information contained in the periodic report to which this certificate is an exhibit fairly presents, in all material respects, the financial conditionand results of operations of the Company.
In witness whereof, the undersigned has executed and delivered this certificate as of the date set forth opposite his signature below.
Date: November 3, 2016
By: /s/ Kirk T. Larsen Kirk T. Larsen
Executive Vice President and Chief Financial Officer