Embed Size (px)
Citation preview
EXCHANGE RATES: CONCEPTS, MEASUREMENTS AND ASSESSMENT OF COMPETITIVENESS
Bangkok November 28, 2014
Rajan Govil, Consultant This activity is supported by a grant from Japan.
BANGKOK, THAILAND NOVEMBER 24 – DECEMBER 3, 2014
2
Lecture outline
Competitiveness Bilateral nominal exchange rate and cross
rates Nominal effective exchange rate (NEER) Real effective exchange rate (REER) Exchange rate indices as indicators of
competitiveness and equilibrium Assessment of Competitiveness
The Concept of Competitiveness
Tradable goods can be produced domestically and then be sold either domestically or abroad in exchange for other goods.
Competitiveness is the incentive for domestic/foreign
economies to produce and/or purchase these goods in/from the domestic economy, rather than in/from foreign economies.
At the level of individual producers, competitiveness
is generally defined on the basis of (quality-adjusted) prices: lower-price producers are more competitive.
3

4
Measuring Competitiveness
There are many aspects of competitiveness:
o product quality
o ability to innovate
o capacity to adjust rapidly to customers’ needs
o absence of restrictive practices
o price or cost competitiveness.
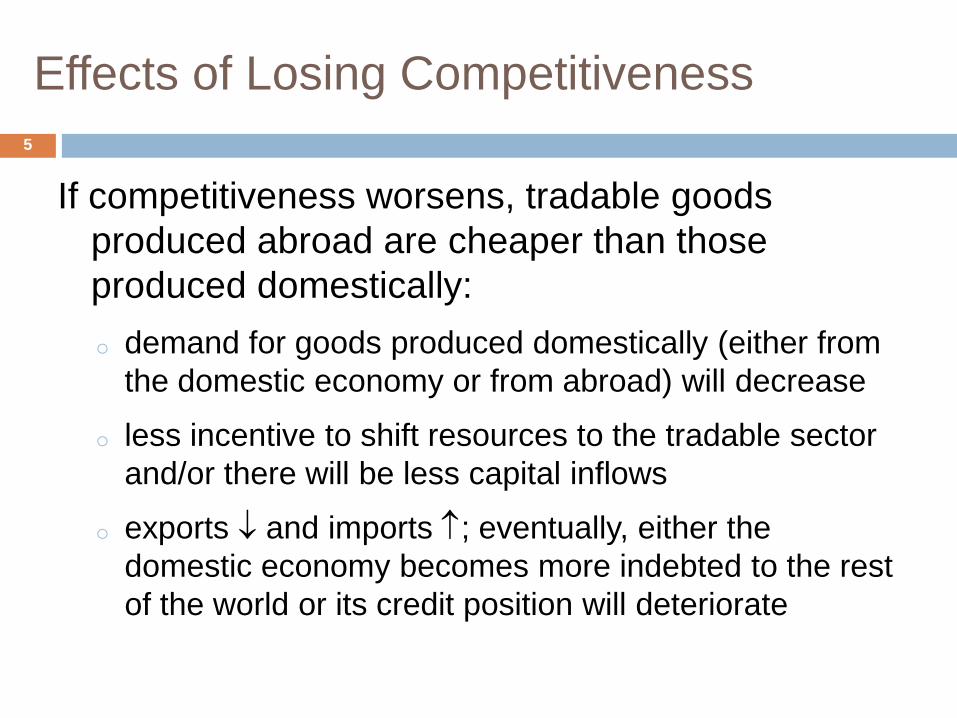
Effects of Losing Competitiveness
If competitiveness worsens, tradable goods produced abroad are cheaper than those produced domestically: o demand for goods produced domestically (either from
the domestic economy or from abroad) will decrease
o less incentive to shift resources to the tradable sector and/or there will be less capital inflows
o exports ↓ and imports ↑; eventually, either the domestic economy becomes more indebted to the rest of the world or its credit position will deteriorate
5
6
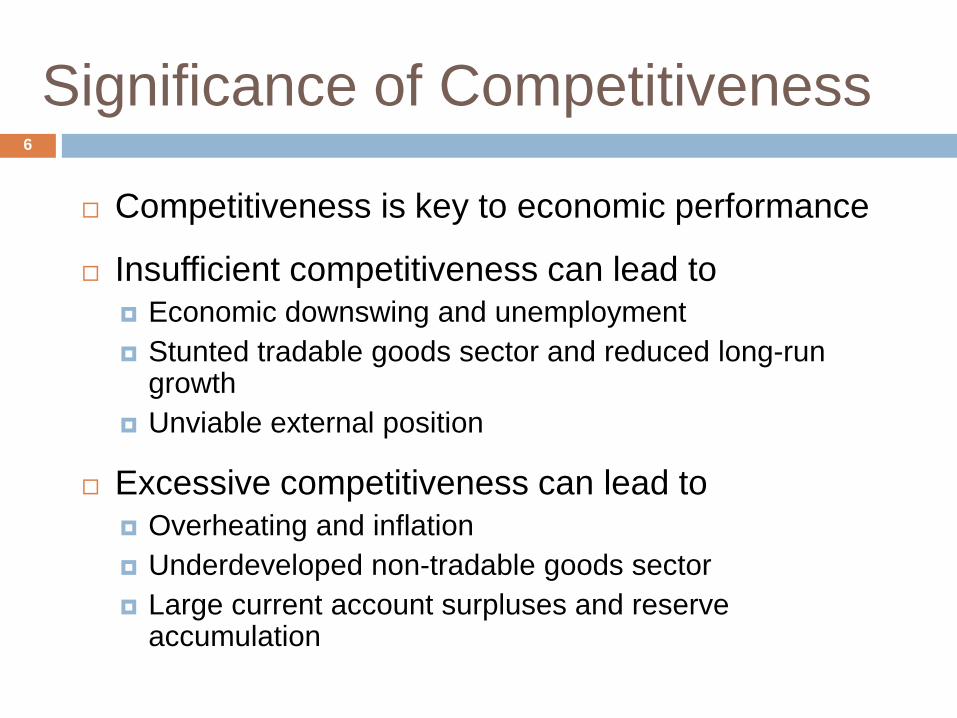
Significance of Competitiveness
Competitiveness is key to economic performance Insufficient competitiveness can lead to
Economic downswing and unemployment Stunted tradable goods sector and reduced long-run
growth Unviable external position
Excessive competitiveness can lead to Overheating and inflation Underdeveloped non-tradable goods sector Large current account surpluses and reserve
accumulation
7
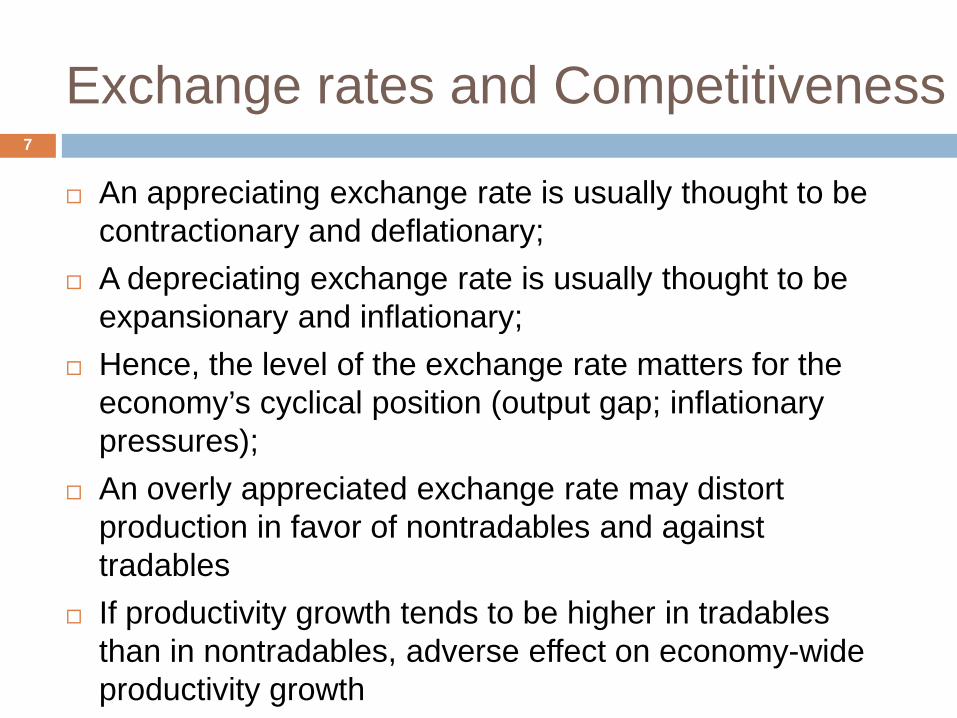
Exchange rates and Competitiveness
An appreciating exchange rate is usually thought to be contractionary and deflationary;
A depreciating exchange rate is usually thought to be expansionary and inflationary;
Hence, the level of the exchange rate matters for the economy’s cyclical position (output gap; inflationary pressures);
An overly appreciated exchange rate may distort production in favor of nontradables and against tradables
If productivity growth tends to be higher in tradables than in nontradables, adverse effect on economy-wide productivity growth
8
Exchange Rates: Concepts and Measurement
9
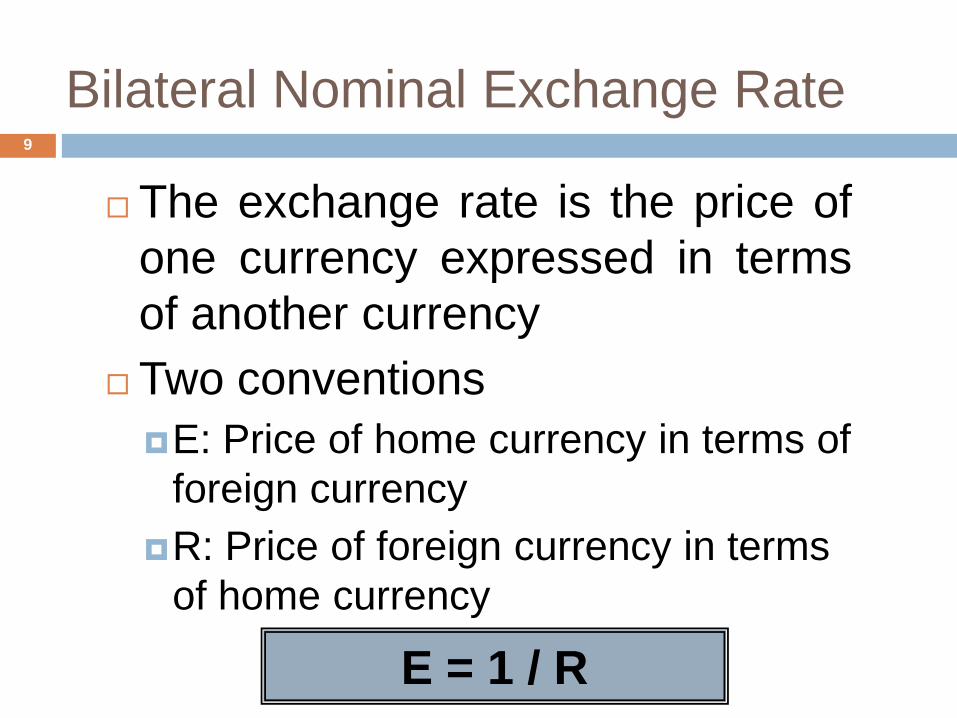
Bilateral Nominal Exchange Rate
The exchange rate is the price of one currency expressed in terms of another currency
Two conventions E: Price of home currency in terms of
foreign currency R: Price of foreign currency in terms
of home currency
E = 1 / R
10
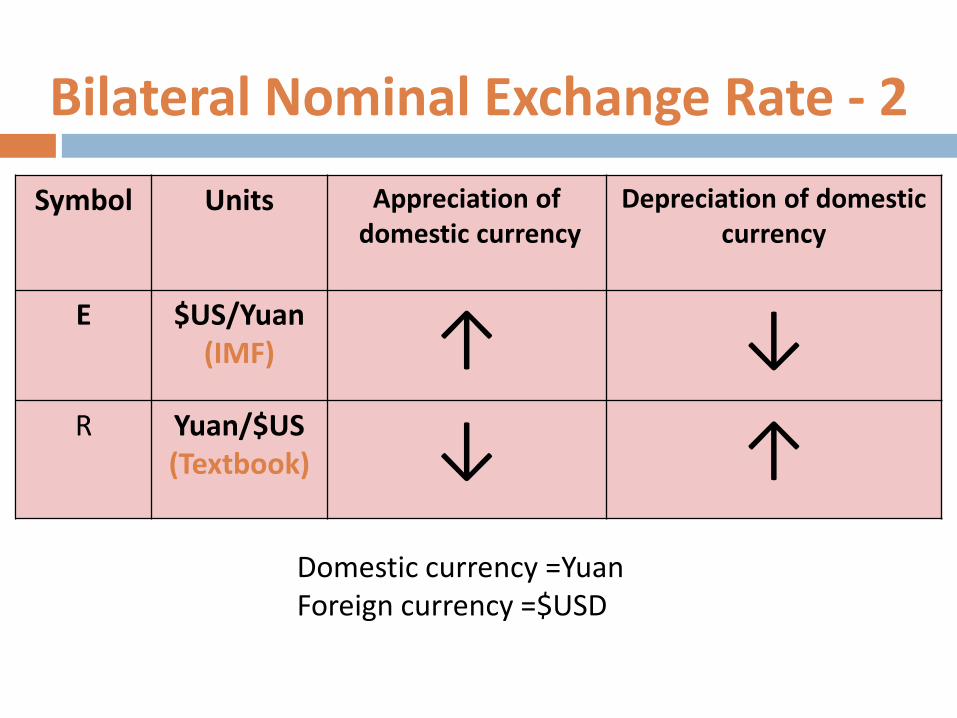
Bilateral Nominal Exchange Rate - 2
Symbol Units Appreciation of domestic currency
Depreciation of domestic currency
E $US/Yuan (IMF) ↑ ↓
R Yuan/$US (Textbook) ↓ ↑
Domestic currency =Yuan Foreign currency =$USD
11
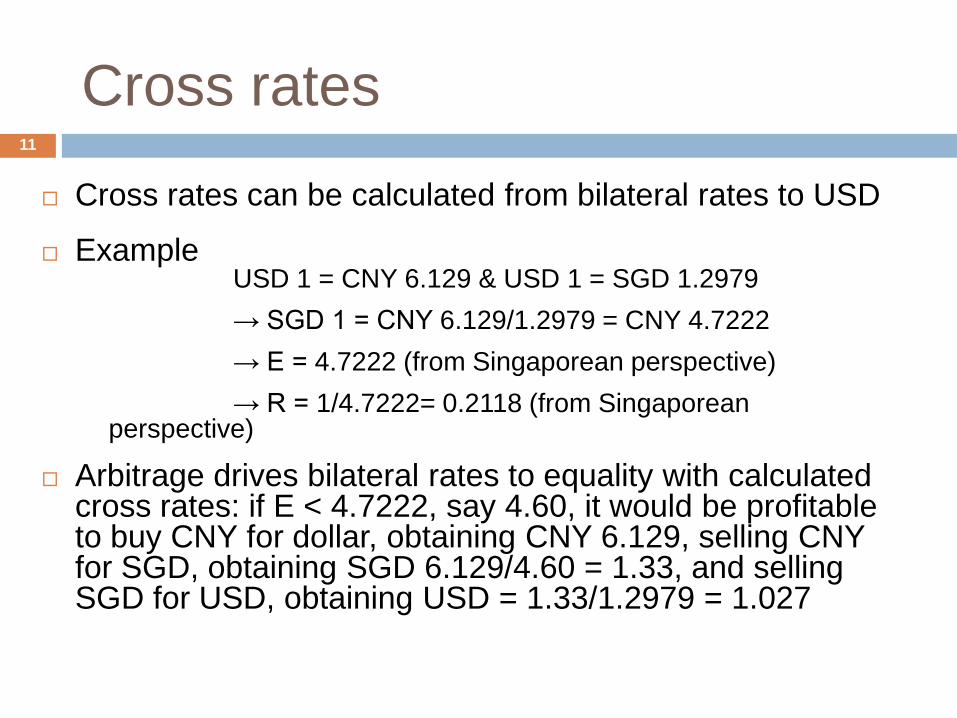
Cross rates Cross rates can be calculated from bilateral rates to USD Example
USD 1 = CNY 6.129 & USD 1 = SGD 1.2979 → SGD 1 = CNY 6.129/1.2979 = CNY 4.7222 → E = 4.7222 (from Singaporean perspective) → R = 1/4.7222= 0.2118 (from Singaporean
perspective)
Arbitrage drives bilateral rates to equality with calculated cross rates: if E < 4.7222, say 4.60, it would be profitable to buy CNY for dollar, obtaining CNY 6.129, selling CNY for SGD, obtaining SGD 6.129/4.60 = 1.33, and selling SGD for USD, obtaining USD = 1.33/1.2979 = 1.027
12
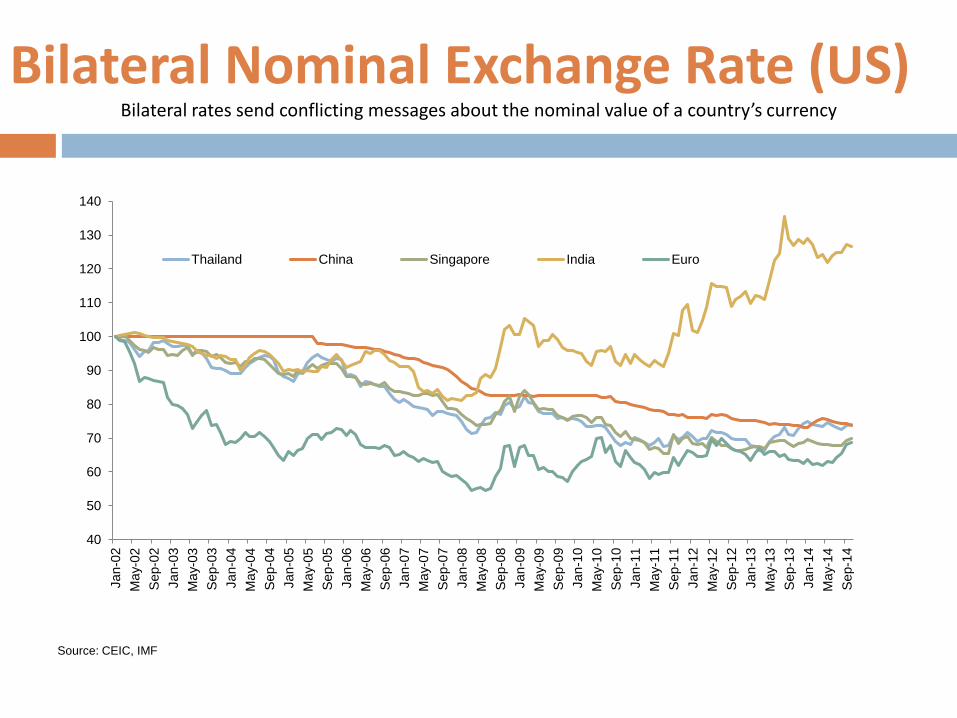
Bilateral Nominal Exchange Rate (US) Bilateral rates send conflicting messages about the nominal value of a country’s currency
40
50
60
70
80
90
100
110
120
130
140
Jan-
02
May
-02
Sep-
02
Jan-
03
May
-03
Sep-
03
Jan-
04
May
-04
Sep-
04
Jan-
05
May
-05
Sep-
05
Jan-
06
May
-06
Sep-
06
Jan-
07
May
-07
Sep-
07
Jan-
08
May
-08
Sep-
08
Jan-
09
May
-09
Sep-
09
Jan-
10
May
-10
Sep-
10
Jan-
11
May
-11
Sep-
11
Jan-
12
May
-12
Sep-
12
Jan-
13
May
-13
Sep-
13
Jan-
14
May
-14
Sep-
14
Thailand China Singapore India Euro
Source: CEIC, IMF
13
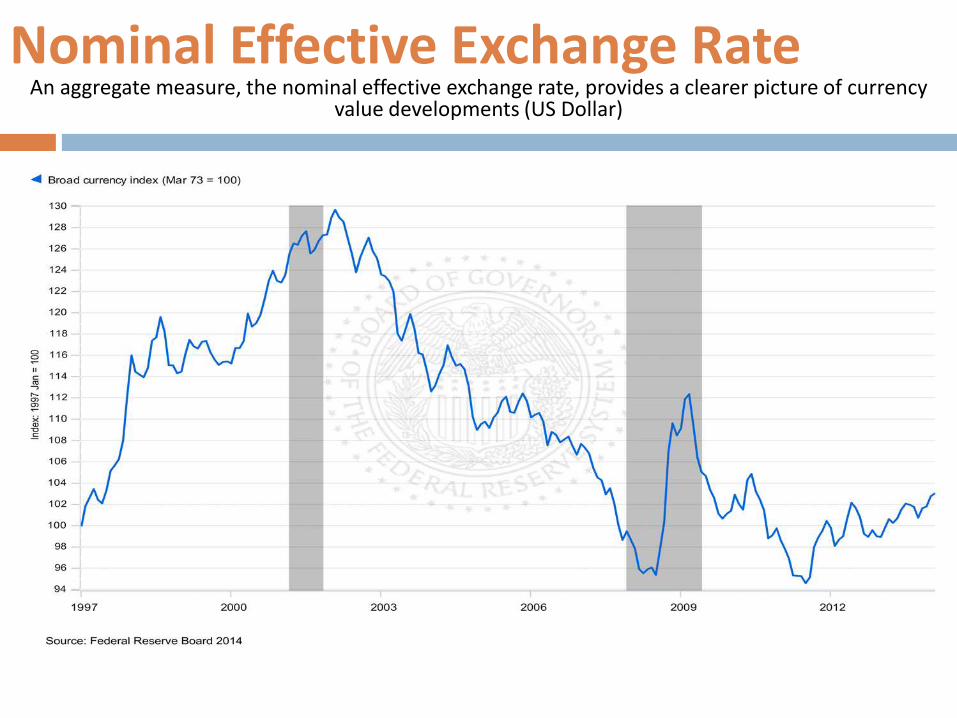
Nominal Effective Exchange Rate An aggregate measure, the nominal effective exchange rate, provides a clearer picture of currency
value developments (US Dollar)
14
NEER
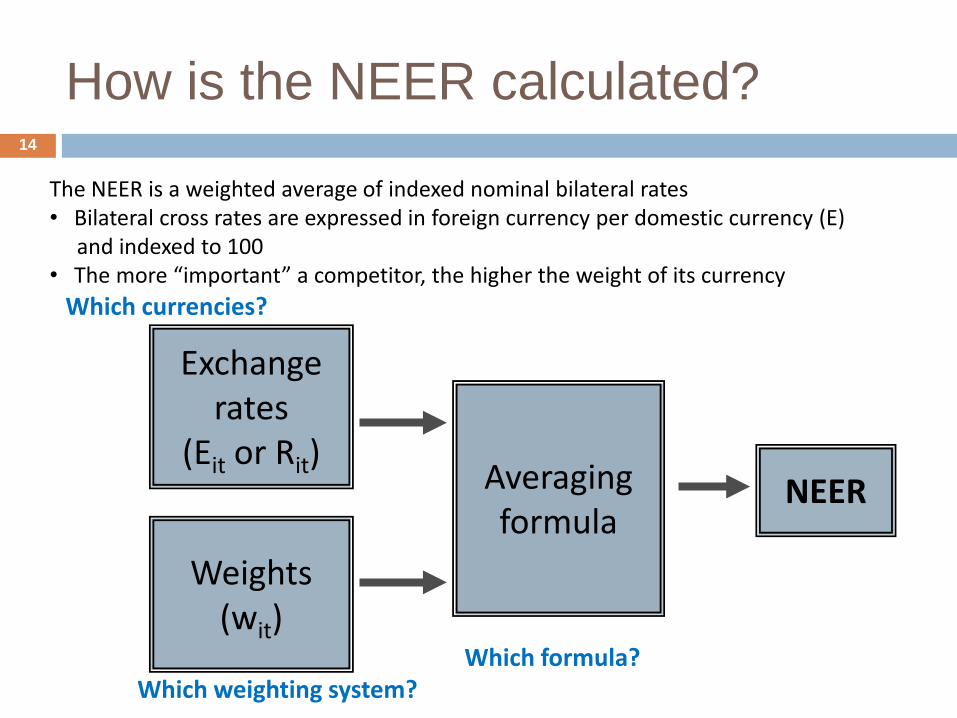
How is the NEER calculated?
Exchange rates
(Eit or Rit) Averaging formula
Weights (wit)
Which currencies?
Which weighting system? Which formula?
The NEER is a weighted average of indexed nominal bilateral rates • Bilateral cross rates are expressed in foreign currency per domestic currency (E) and indexed to 100 • The more “important” a competitor, the higher the weight of its currency
15
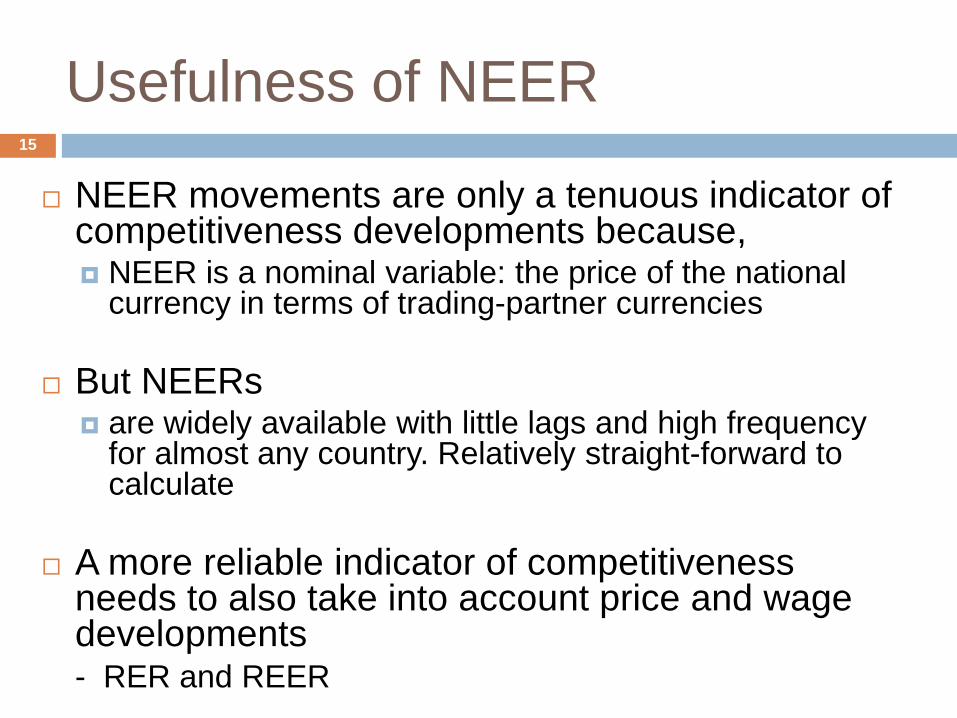
Usefulness of NEER
NEER movements are only a tenuous indicator of competitiveness developments because, NEER is a nominal variable: the price of the national
currency in terms of trading-partner currencies
But NEERs are widely available with little lags and high frequency
for almost any country. Relatively straight-forward to calculate
A more reliable indicator of competitiveness needs to also take into account price and wage developments
- RER and REER
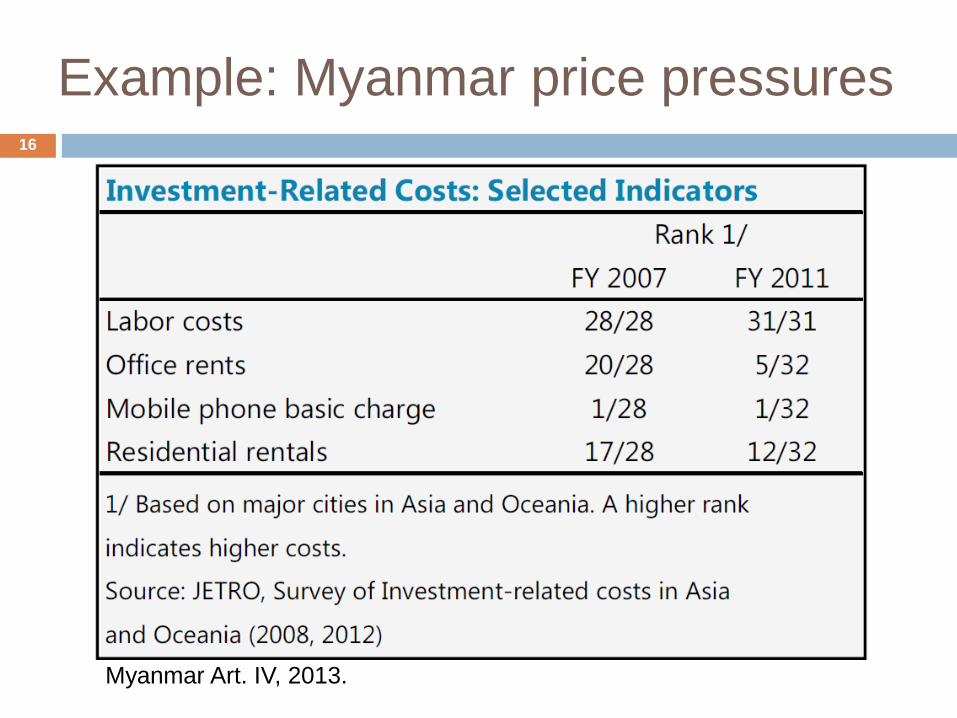
Example: Myanmar price pressures 16
Myanmar Art. IV, 2013.
17
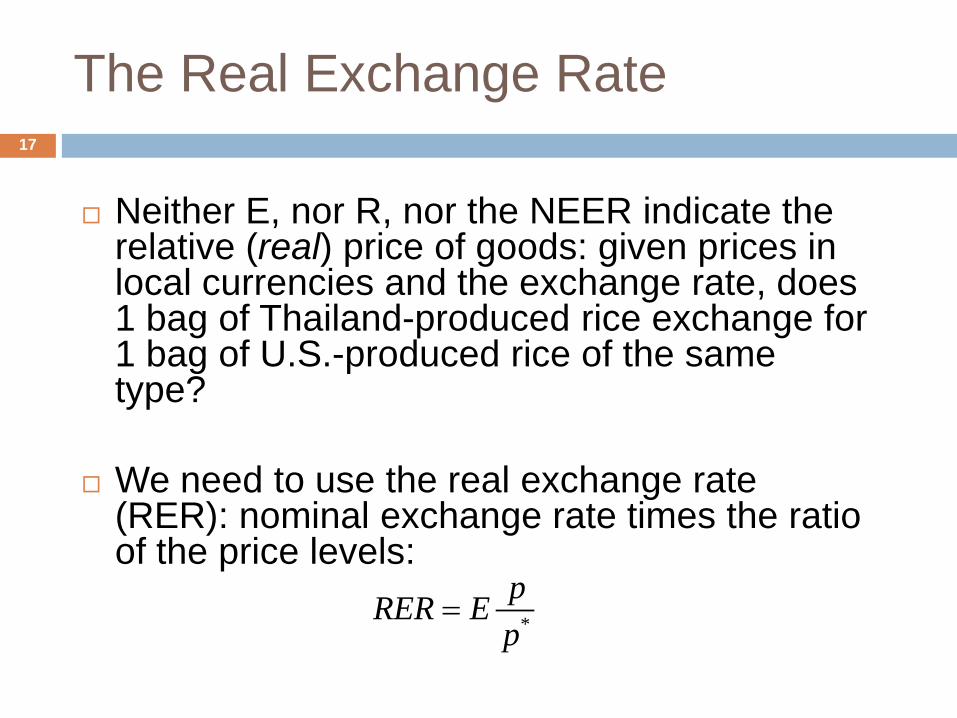
The Real Exchange Rate
Neither E, nor R, nor the NEER indicate the relative (real) price of goods: given prices in local currencies and the exchange rate, does 1 bag of Thailand-produced rice exchange for 1 bag of U.S.-produced rice of the same type?
We need to use the real exchange rate (RER): nominal exchange rate times the ratio of the price levels: *
pRER Ep
=
18
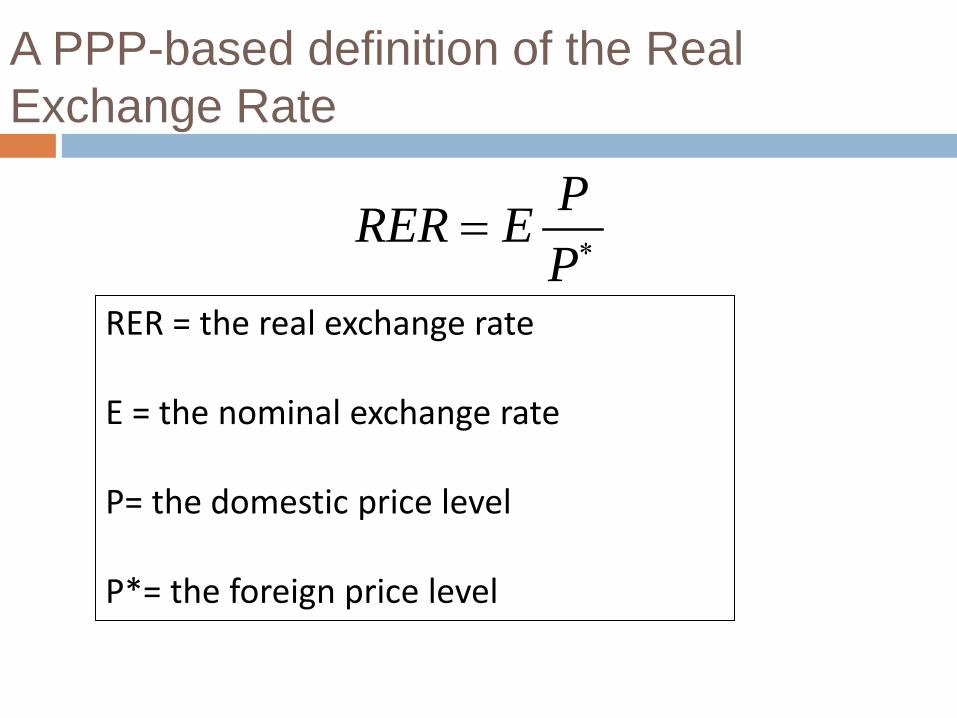
A PPP-based definition of the Real Exchange Rate
PRER EP∗=
RER = the real exchange rate E = the nominal exchange rate P= the domestic price level P*= the foreign price level
19
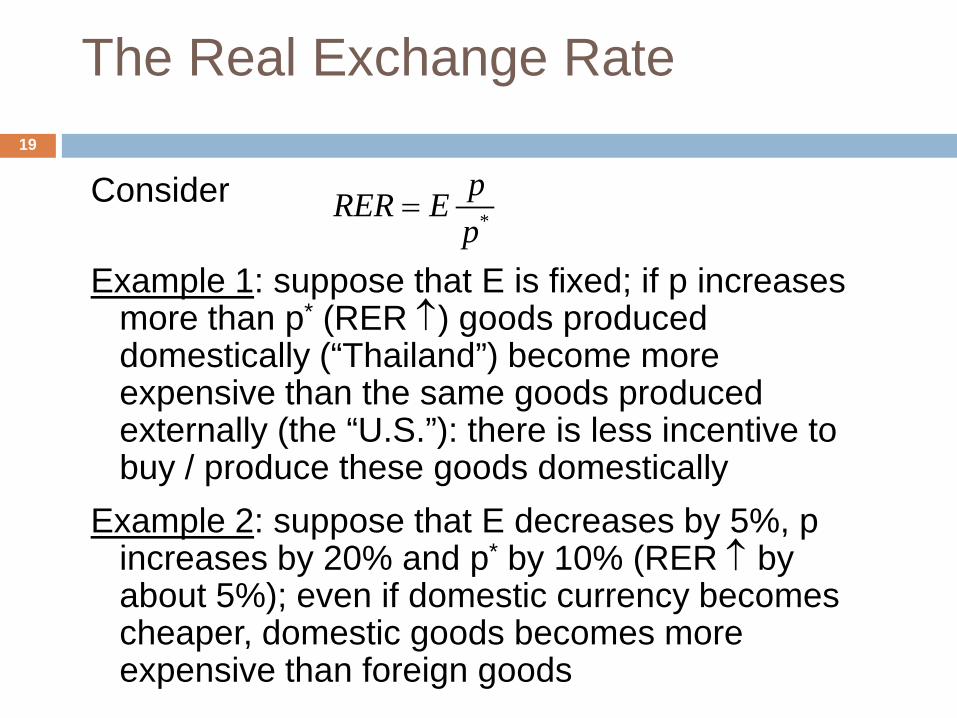
The Real Exchange Rate
Consider Example 1: suppose that E is fixed; if p increases
more than p* (RER ↑) goods produced domestically (“Thailand”) become more expensive than the same goods produced externally (the “U.S.”): there is less incentive to buy / produce these goods domestically
Example 2: suppose that E decreases by 5%, p increases by 20% and p* by 10% (RER ↑ by about 5%); even if domestic currency becomes cheaper, domestic goods becomes more expensive than foreign goods
*
pRER Ep
=
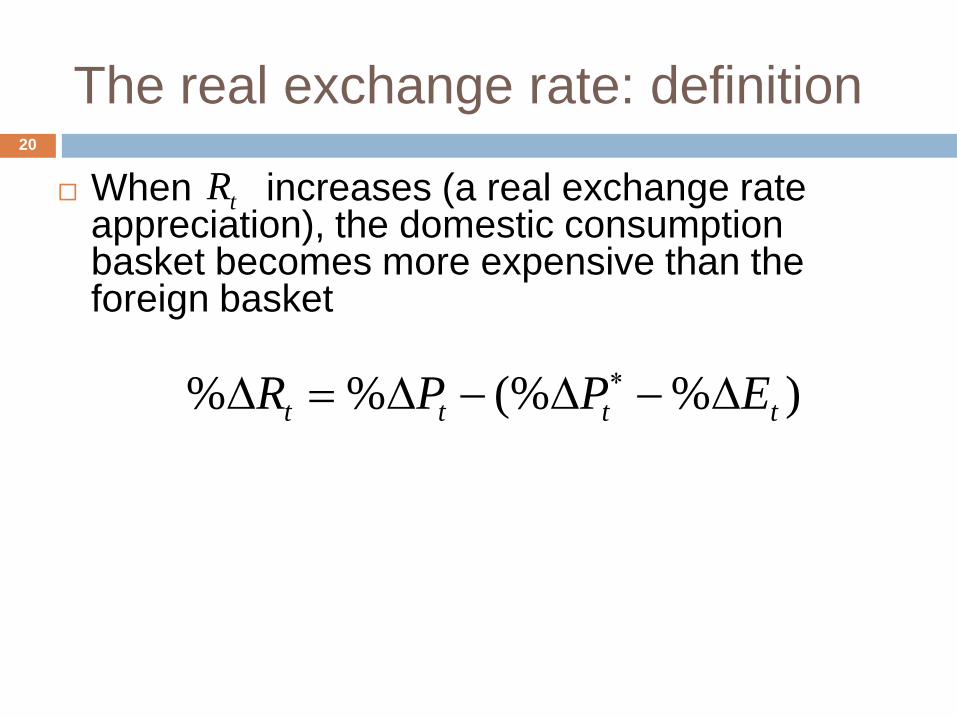
The real exchange rate: definition
When increases (a real exchange rate appreciation), the domestic consumption basket becomes more expensive than the foreign basket
20
tR
)%(%%% tttt EPPR ∆−∆−∆=∆ ∗
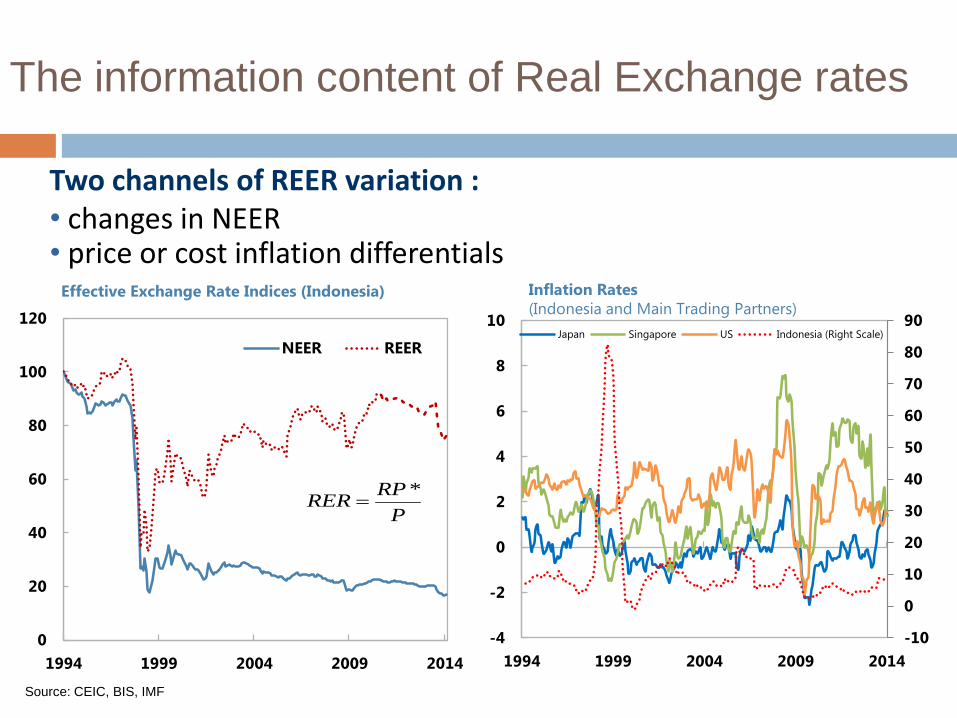
The information content of Real Exchange rates
PRPRER *
=
Two channels of REER variation : • changes in NEER • price or cost inflation differentials
Source: CEIC, BIS, IMF
0
20
40
60
80
100
120
1994 1999 2004 2009 2014
NEER REER
Effective Exchange Rate Indices (Indonesia)
-10
0
10
20
30
40
50
60
70
80
90
-4
-2
0
2
4
6
8
10
1994 1999 2004 2009 2014
Japan Singapore US Indonesia (Right Scale)
Inflation Rates (Indonesia and Main Trading Partners)
22
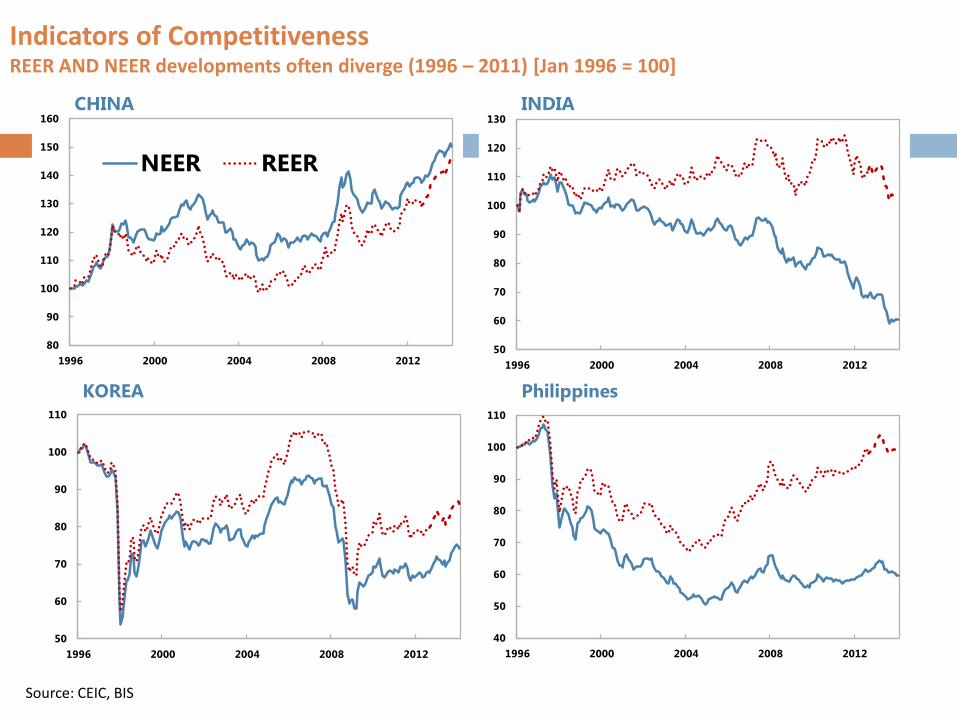
Indicators of Competitiveness REER AND NEER developments often diverge (1996 – 2011) [Jan 1996 = 100]
Source: CEIC, BIS
80
90
100
110
120
130
140
150
160
1996 2000 2004 2008 2012
NEER REER
CHINA
50
60
70
80
90
100
110
120
130
1996 2000 2004 2008 2012
INDIA
50
60
70
80
90
100
110
1996 2000 2004 2008 2012
KOREA
40
50
60
70
80
90
100
110
1996 2000 2004 2008 2012
Philippines
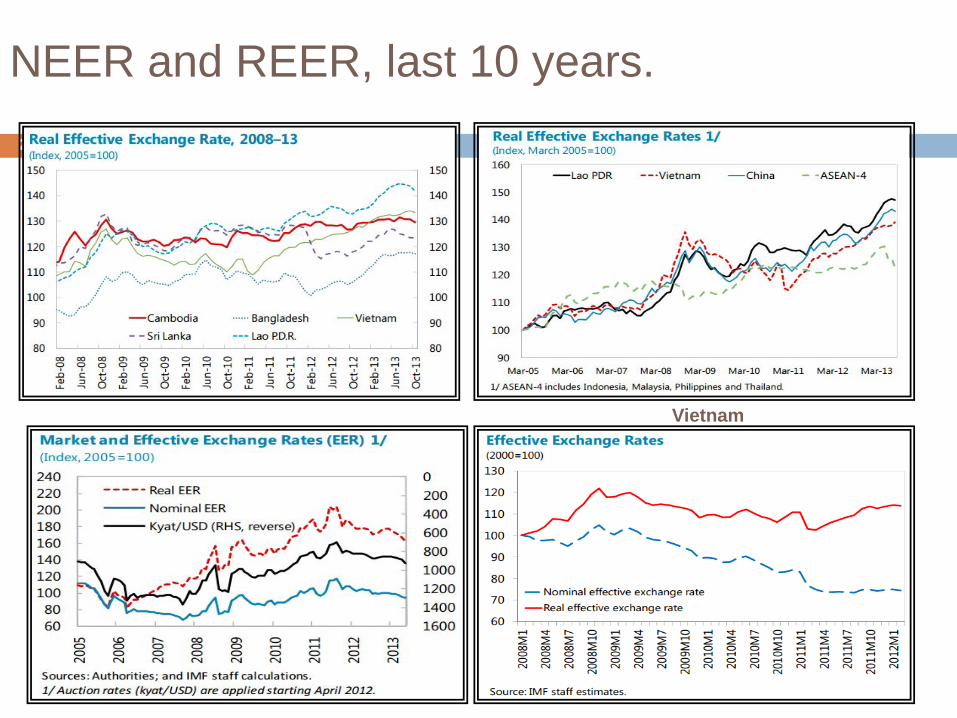
NEER and REER, last 10 years. 23
Vietnam
24
Choice of price or cost index
Aggregate Price Index based measures Consumer price index Wholesale or producer price index Export unit values GDP deflator
Unit labor cost (ULC) based measures
REERs based on CPIs and ULCs most common
IMF publishes REERs based on CPIs for almost all countries and ULC-based REERs for most industrial countries
25
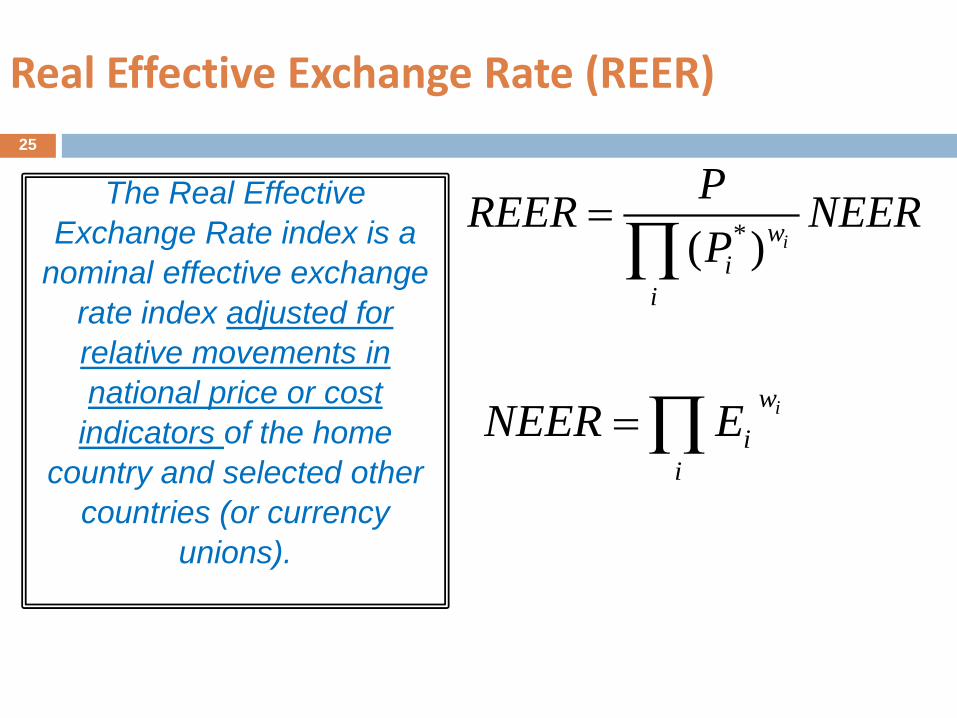
Real Effective Exchange Rate (REER)
The Real Effective Exchange Rate index is a
nominal effective exchange rate index adjusted for relative movements in national price or cost
indicators of the home country and selected other
countries (or currency unions).
iwi
i
NEER E=∏
*( ) iwi
i
PREER NEERP
=∏
26
Why REER?
Why is such an adjustment sensible for competitiveness assessment? A nominal depreciation matched by a positive
inflation differential with trading partners leaves relative prices of domestic and foreign goods, expressed in a common currency, unchanged
Similarly, a nominal depreciation matched by a rising cost differential gives exporters no additional edge over foreign competitors
27
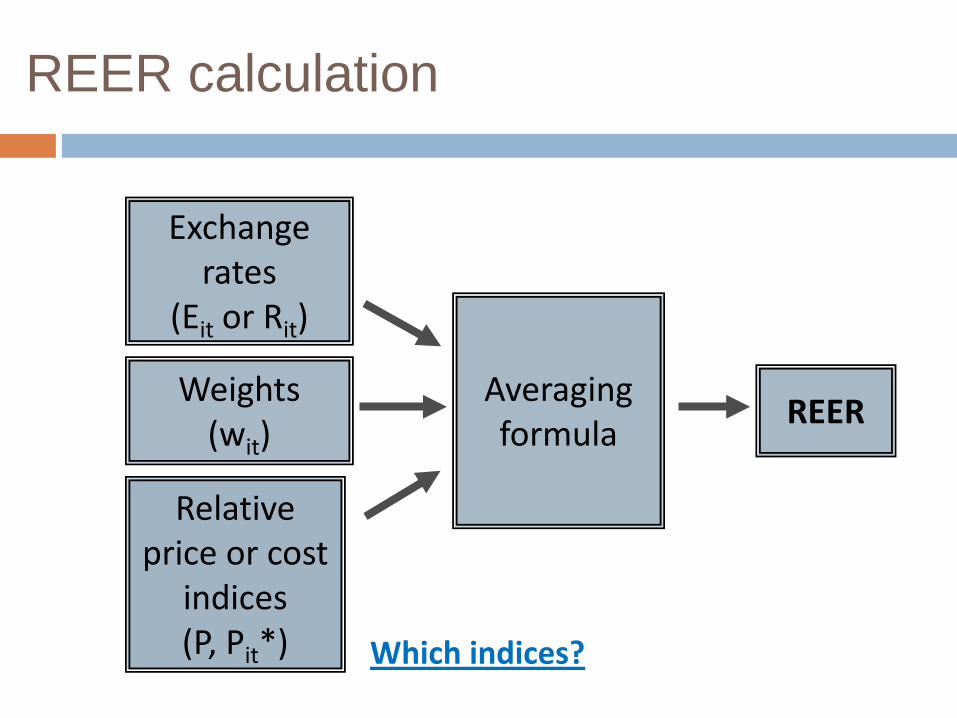
REER
REER calculation
Exchange rates
(Eit or Rit)
Averaging formula
Weights (wit)
Which indices?
Relative price or cost
indices (P, Pit*)
28
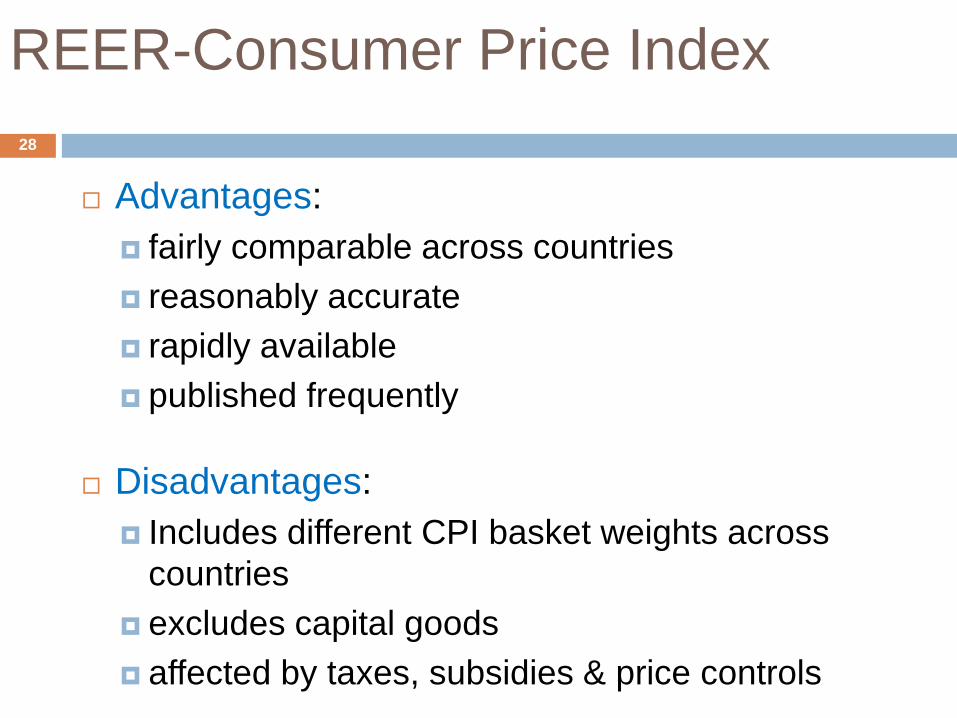
REER-Consumer Price Index
Advantages: fairly comparable across countries reasonably accurate rapidly available published frequently
Disadvantages: Includes different CPI basket weights across
countries excludes capital goods affected by taxes, subsidies & price controls
29
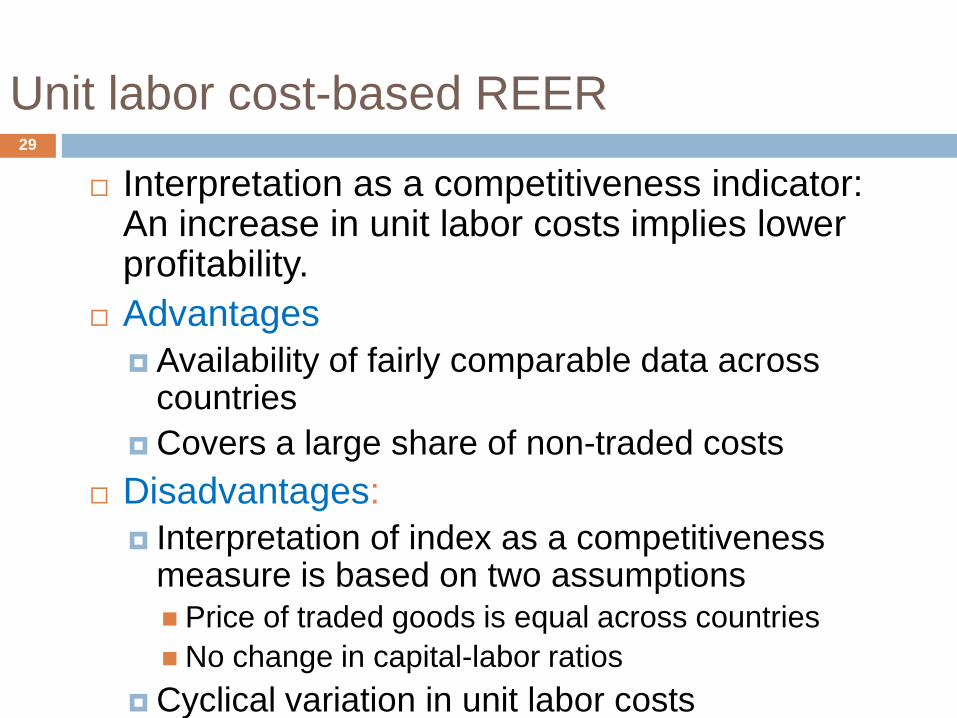
Unit labor cost-based REER
Interpretation as a competitiveness indicator: An increase in unit labor costs implies lower profitability.
Advantages Availability of fairly comparable data across
countries Covers a large share of non-traded costs
Disadvantages: Interpretation of index as a competitiveness
measure is based on two assumptions Price of traded goods is equal across countries No change in capital-labor ratios
Cyclical variation in unit labor costs
30
Estimating the Equilibrium REER
Why do we care about the equilibrium REER?
Why should we care about it:
Overvaluation of a currency may induce global investors to speculate on a devaluation;
REER expectations may affect borrowers’ decisions about borrowing in national/foreign currency;
International trade and politics.
Use of estimates of the equilibrium REER: Make medium-term forecasts Assess the sustainability of existing exchange rate
policies
31
What do we mean by equilibrium?
When thinking about the equilibrium REER, should we focus on the short-run (day-to-day) or the long-run?
Markets for foreign currencies are very liquid and efficient: the nominal exchange rates are thought to be always in equilibrium (they equalize demand and supply for foreign currency) The question of whether the REER is in short run
equilibrium is not sensible…
Most approaches for assessing equilibrium ERs focus on medium-term equilibrium.
32
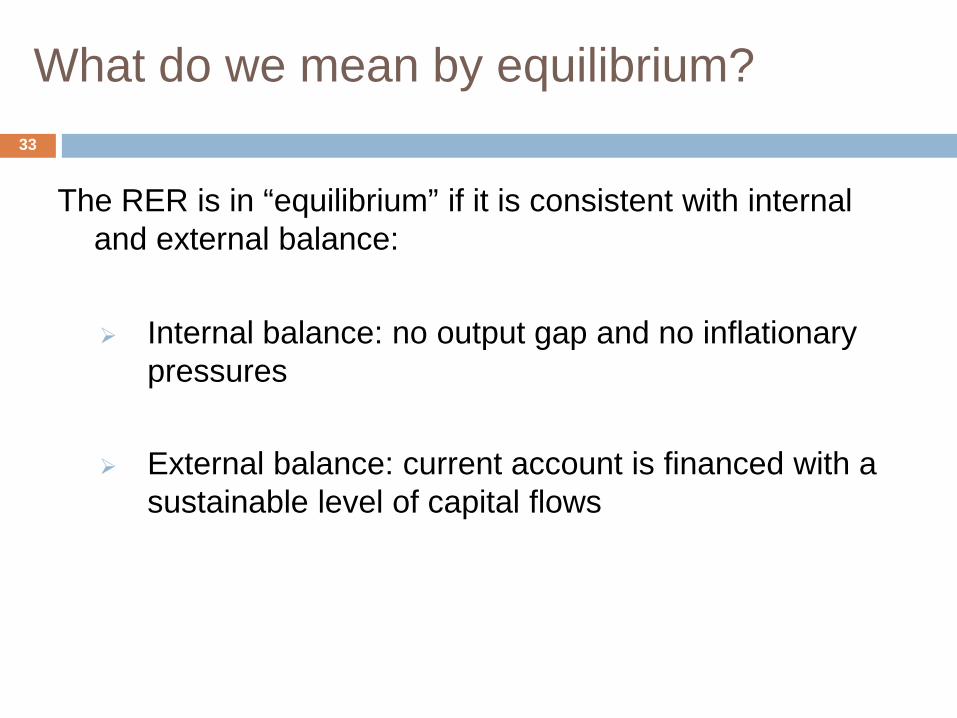
The RER is in “equilibrium” if it is consistent with internal and external balance:
Internal balance: no output gap and no inflationary
pressures
External balance: current account is financed with a sustainable level of capital flows
33
What do we mean by equilibrium?
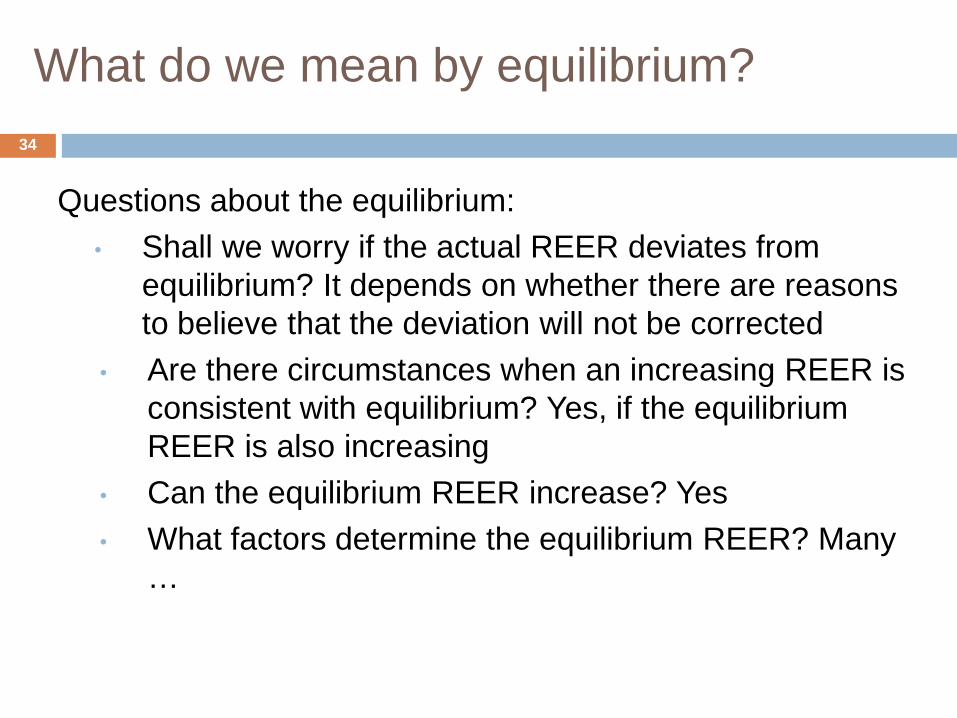
Questions about the equilibrium: • Shall we worry if the actual REER deviates from
equilibrium? It depends on whether there are reasons to believe that the deviation will not be corrected
• Are there circumstances when an increasing REER is consistent with equilibrium? Yes, if the equilibrium REER is also increasing
• Can the equilibrium REER increase? Yes • What factors determine the equilibrium REER? Many
…
34
What do we mean by equilibrium?
Methodologies to Estimate Equilibrium REER
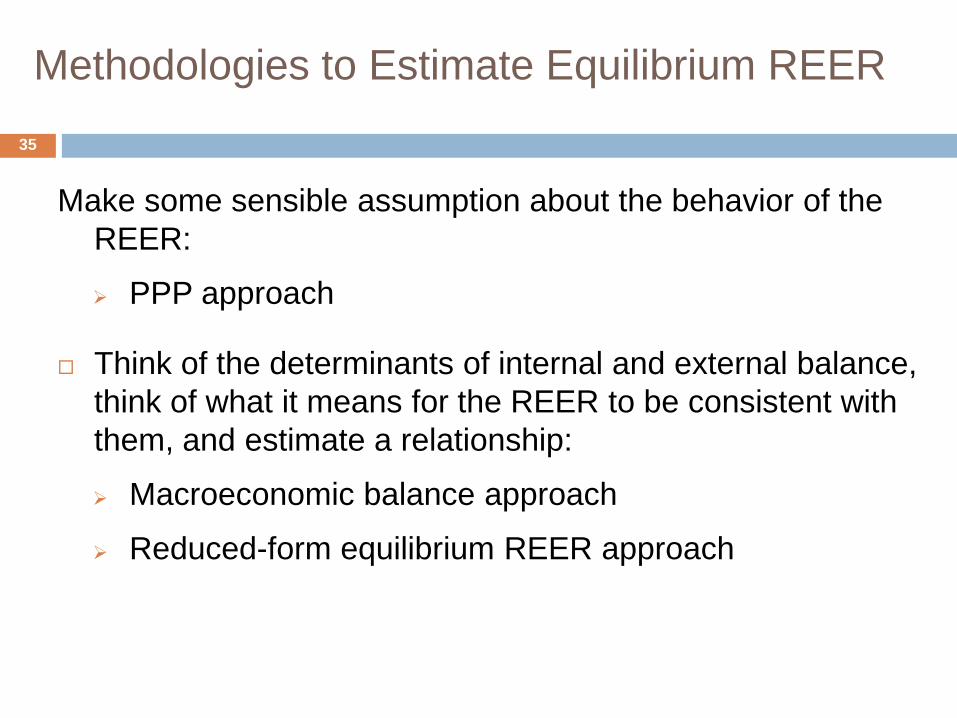
Make some sensible assumption about the behavior of the REER:
PPP approach
Think of the determinants of internal and external balance, think of what it means for the REER to be consistent with them, and estimate a relationship:
Macroeconomic balance approach
Reduced-form equilibrium REER approach
35
The PPP approach
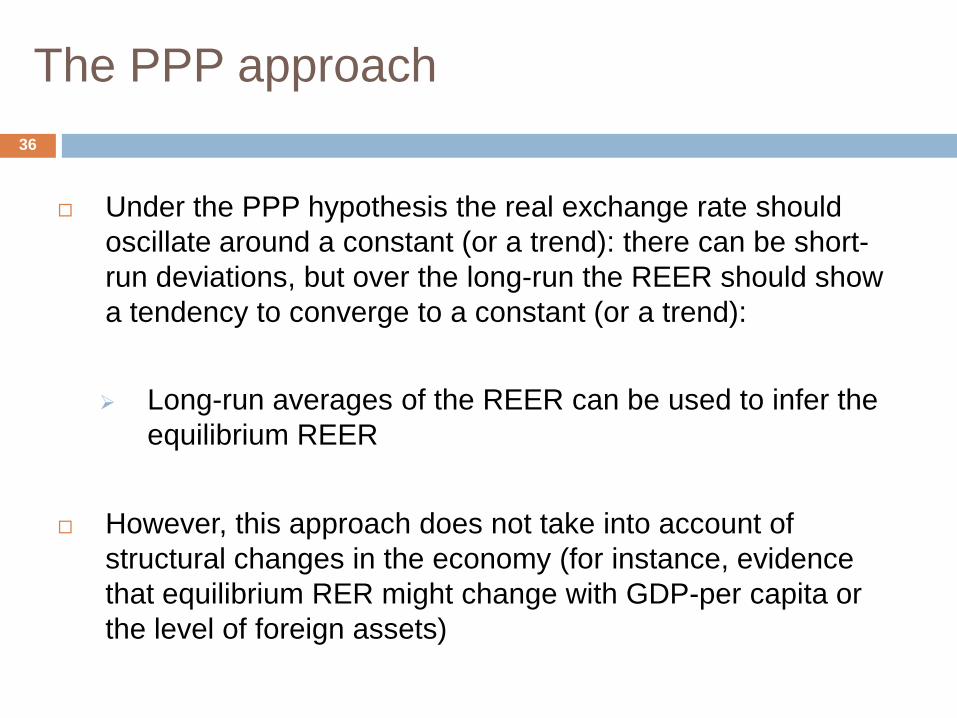
Under the PPP hypothesis the real exchange rate should oscillate around a constant (or a trend): there can be short-run deviations, but over the long-run the REER should show a tendency to converge to a constant (or a trend): Long-run averages of the REER can be used to infer the
equilibrium REER
However, this approach does not take into account of structural changes in the economy (for instance, evidence that equilibrium RER might change with GDP-per capita or the level of foreign assets)
36
Macroeconomic Balance Approach
37
Macroeconomic Balance Approach
Focus on the multilateral real exchange rate that is consistent with current account (CA) balance.
The CA balance does not need to be zero in the medium-term equilibrium. It will depend on the level of savings and the return on domestic investment relative to investments abroad.
38
Think of possible determinants of the long-run S – I balance:
Fiscal policy (a surplus contributes to saving); Level of development (in emerging markets the return
on investment is higher than in mature economies); Net foreign asset position (high return on net assets
encourages invest); Population dynamic (a younger or an expanding
population draws down national savings) Others?
39
Macroeconomic Balance Approach
Calculate current account CA “norm” based on the coefficient estimates and the medium-term values of the determinants.
Determine relationship between the REER and the Underlying Current Account - UCA (export and import elasticities);
The equilibrium REER is the level that closes the gap between the UCA and the CA norm.
40
Macroeconomic Balance Approach
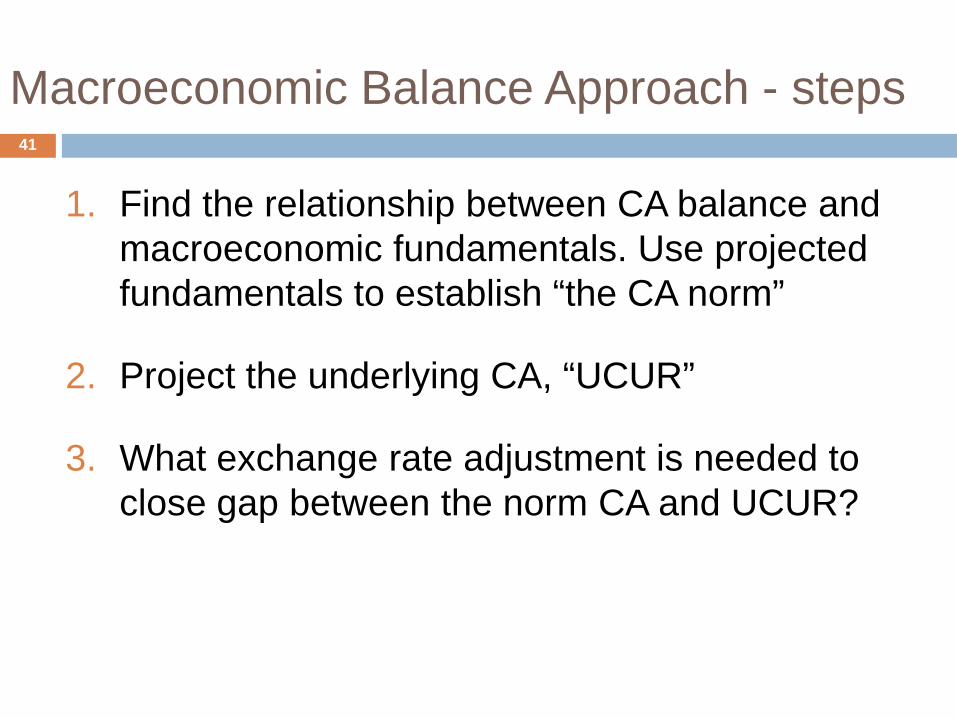
Macroeconomic Balance Approach - steps
1. Find the relationship between CA balance and macroeconomic fundamentals. Use projected fundamentals to establish “the CA norm”
2. Project the underlying CA, “UCUR”
3. What exchange rate adjustment is needed to close gap between the norm CA and UCUR?
41
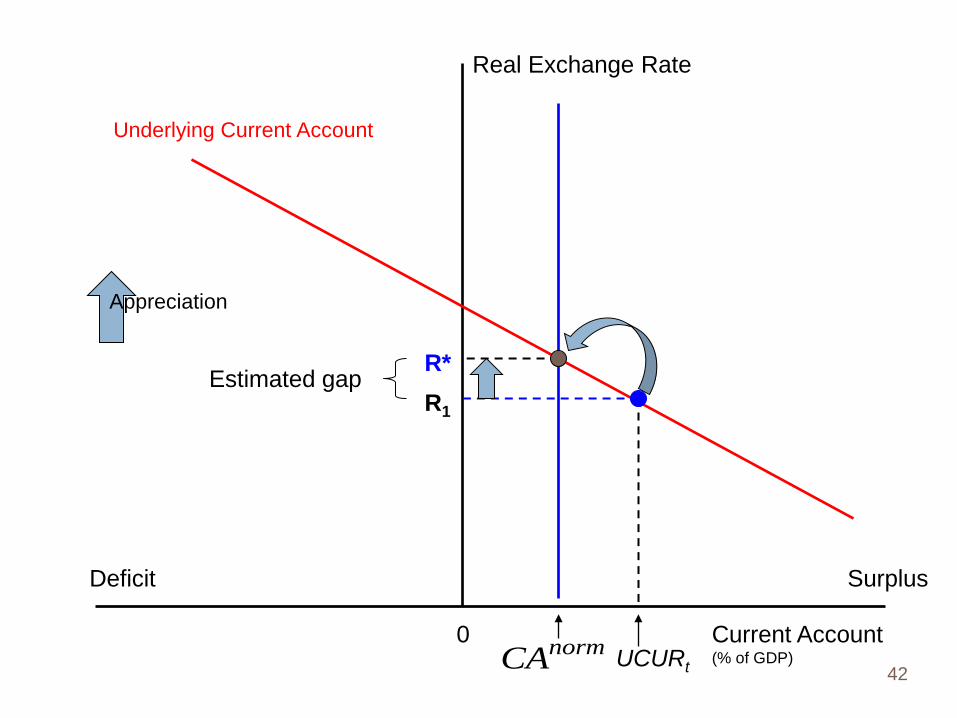
Current Account (% of GDP)
0
Deficit Surplus
Real Exchange Rate
R1
R* Estimated gap
UCURt normCA
Underlying Current Account
42
Appreciation
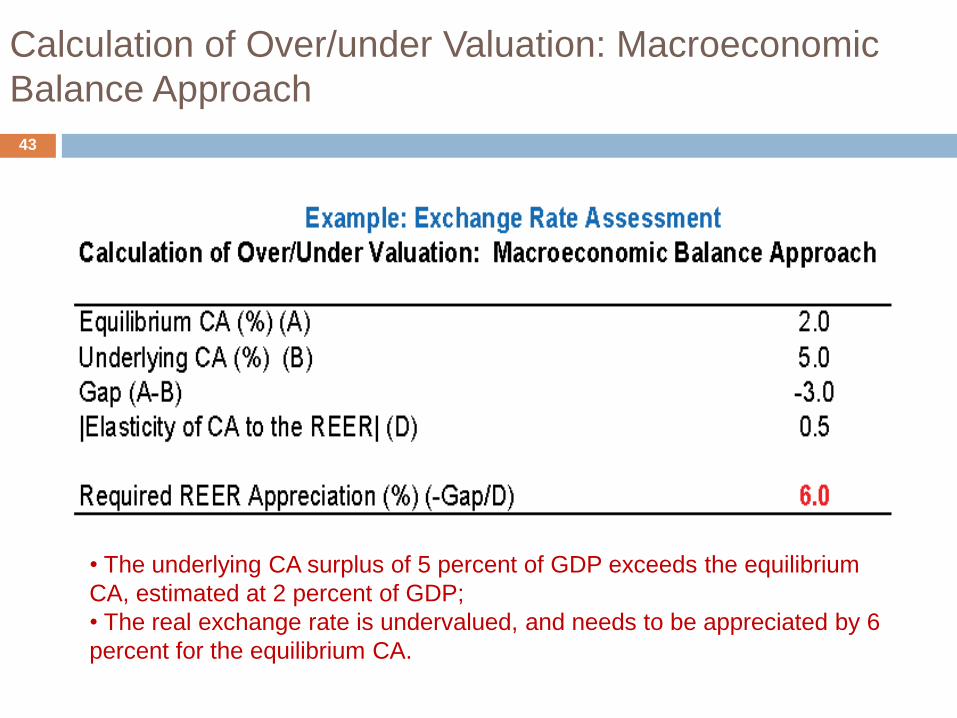
Calculation of Over/under Valuation: Macroeconomic Balance Approach
• The underlying CA surplus of 5 percent of GDP exceeds the equilibrium CA, estimated at 2 percent of GDP; • The real exchange rate is undervalued, and needs to be appreciated by 6 percent for the equilibrium CA.
43
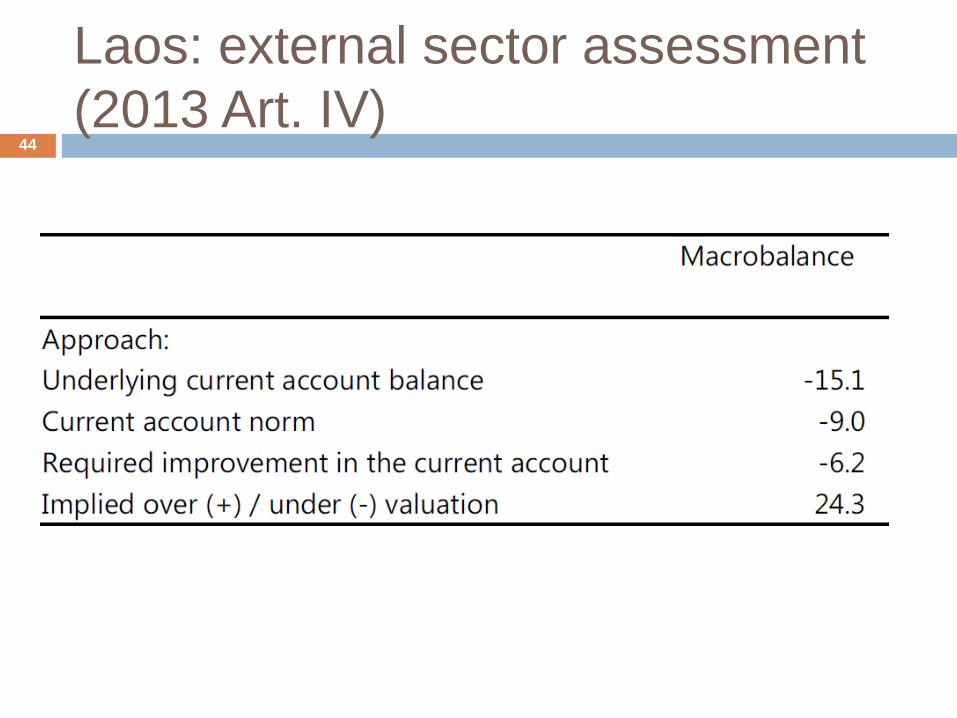
Laos: external sector assessment (2013 Art. IV)
44
Laos: external vulnerabilities
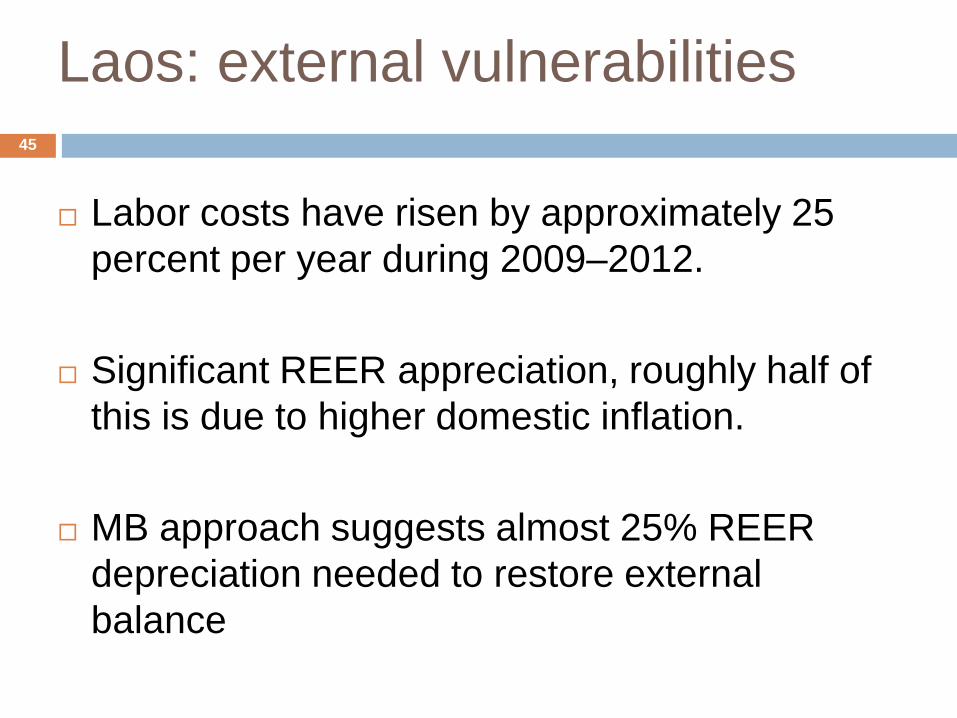
Labor costs have risen by approximately 25 percent per year during 2009–2012.
Significant REER appreciation, roughly half of this is due to higher domestic inflation.
MB approach suggests almost 25% REER depreciation needed to restore external balance
45
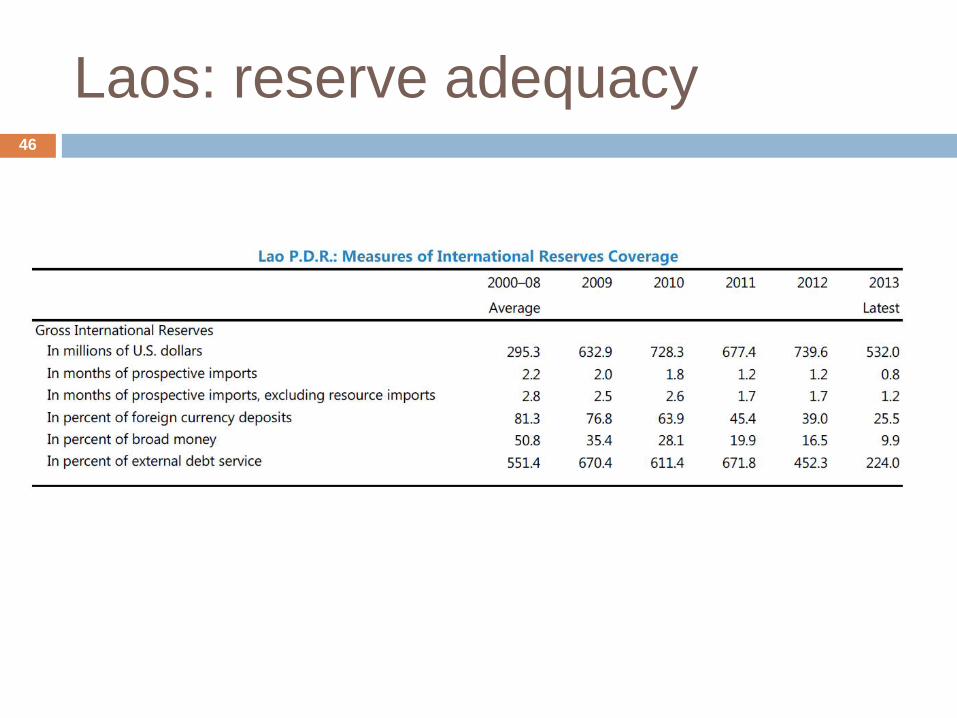
Laos: reserve adequacy 46
Myanmar: stable external sector
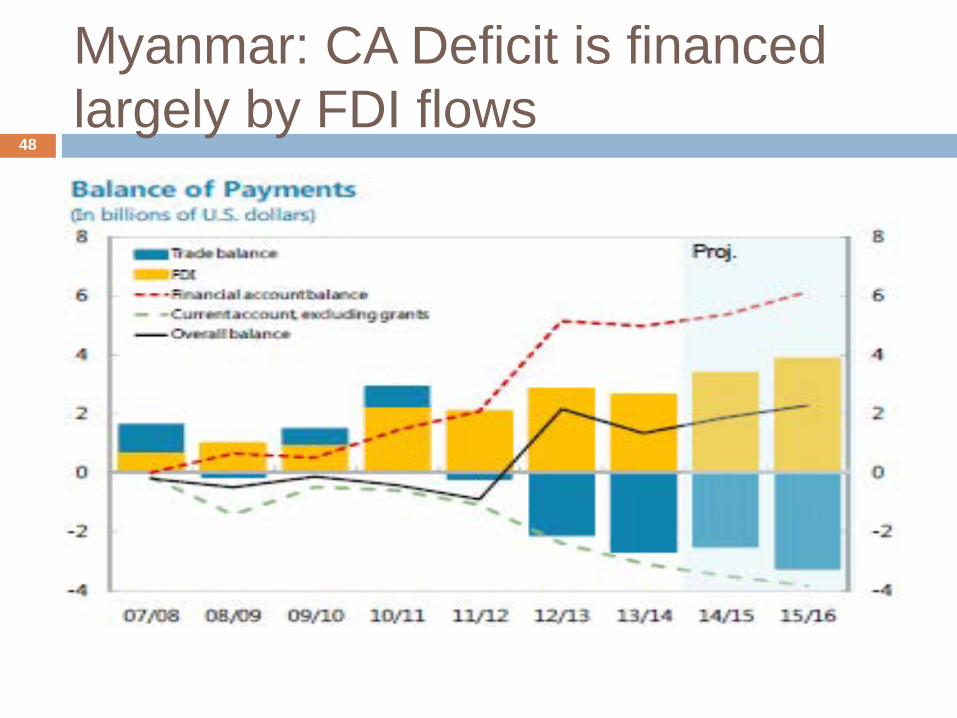
The current account deficit is estimated to have widened to 5½ percent of GDP in 2013/14, but to have been more than financed by foreign direct investment (FDI), new loans, and inflows related to telecommunications licenses.
International reserves held by the CBM increased to US$4.5 billion by end-March, covering nearly 3 months of prospective imports.
The exchange rate appears broadly in line with fundamentals but reserves remain low
47
48
Myanmar: CA Deficit is financed largely by FDI flows
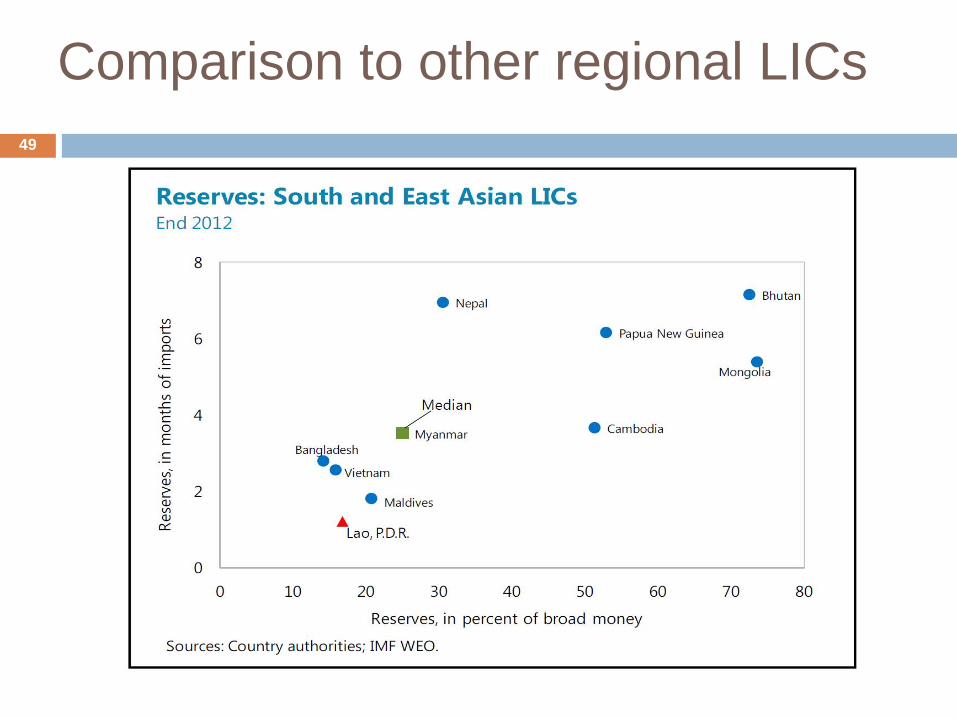
Comparison to other regional LICs 49
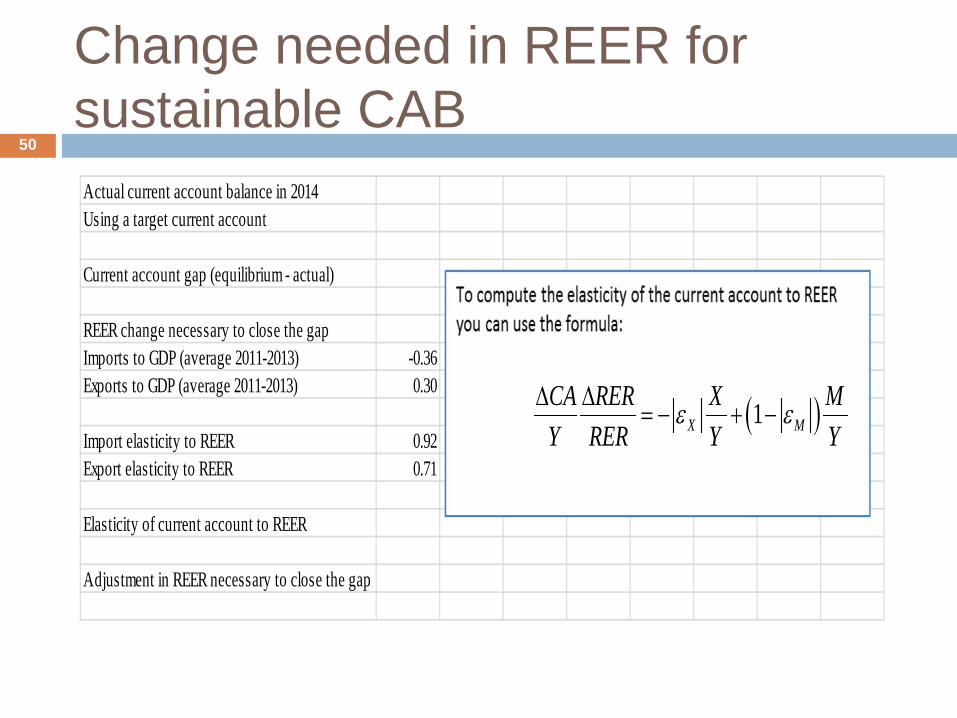
Change needed in REER for sustainable CAB
50
Actual current account balance in 2014Using a target current account
Current account gap (equilibrium - actual)
REER change necessary to close the gapImports to GDP (average 2011-2013) -0.36Exports to GDP (average 2011-2013) 0.30
Import elasticity to REER 0.92Export elasticity to REER 0.71
Elasticity of current account to REER
Adjustment in REER necessary to close the gap
( )1X MCA RER X MY RER Y Y
ε ε∆ ∆= − + −
Export and import elasticities with respect to REER
51
Export elasticity (Ɛₓ)– measures the responsiveness of the exports to changes in the REER (‘the price’)
If REER depreciates by 10 percent resulting in exports increasing by 5 percent, then export elasticity would be equal to 5/10 = 0.5
If we know the export and import elasticities, we can measure the impact of change in REER on both exports and imports and the impact on the current account (exports minus imports)


![Untitled-1 [] Kumar Govil Independent Director Yogesh Samat Additional Director (w.e.f. 30-05-2017) Aarti Shah Independent Director COMMITTEES AUDIT COMMITTEE STAKEHOLDERS RELATIONSHIP](https://img.pdfslide.us/doc/110x75/5b086c6b7f8b9a93738c58d9/untitled-1-kumar-govil-independent-director-yogesh-samat-additional-director.jpg)


![[XLS]library.iima.ac.inlibrary.iima.ac.in/public/download/FP_2017.xlsx · Web viewMavalankar, Dileep; Govil, Dipti Gupta, Sanjay Kumar Kaul, Asha Banerjee, Gargi Sahay, Arvind; Sinha,](https://img.pdfslide.us/doc/110x75/5b086c6b7f8b9a93738c5918/xls-viewmavalankar-dileep-govil-dipti-gupta-sanjay-kumar-kaul-asha-banerjee.jpg)