Embed Size (px)
Citation preview
DAFTAR PUSTAKA Daya, Mohammed Ibrahim Abu. Coastal Water Quality Monitoring with Remote Sensing in
(East Kalimantan) Makassar Strait, Indonesia. 2004. International Institute for Geo-Information Science and Earth Observation. Enschede, The Netherlands
Abdel-Halim, Ahmed M., Aboel-Khair, E. M, Fahmy M. A, Shridah M. A. Environmental
Assessment of The Aqaba Gulf Coastal Water, Egypt. 2007. Egyptian Journal of Aquatic Research. Volume 33 No. 1 p1-14
Ali, Hafizh. Presentasi Thesis Derivasi Indeks Kerentanan Lingkungan berdasarkan
Parameter-parameter Fisik pada Kawasan Pulau-pulau Kecil Berterumbu Karang. Studi Kasus : Tumpahan Minyak di Kepulauan Seribu, Teluk Jakarta. 2003. Program Studi Magister Teknik Geodesi Fakultas Teknik Sipil dan Lingkungan Institut Teknologi Bandung.
Bina Usaha dan Instalasi Lingkungan dan Cuaca, Pusat Pengembangan Pemanfaatan dan
Teknologi Penginderaan Jauh. http://www.lapanrs.com/BINUS/SIKAN/ind/BINUS--SIKAN--65--ind--laplengkap--Laporan_%20Smster-I_ZPPI-2004.pdf
Brown, Otis B., Peter J. Minnet. MODIS Infrared Sea Surface Temperature Algorithm
Algorithm Theoretical Basis Document. Version 2.0. 1999. University of Miami Butler, M. J. A. The Application of Remote Sensing Technology to Marine Fisheries: An
Introductory Manual. Chapter 07. FAO Fisheries Technical Paper. 1988. Food and Agriculture Organization of The United Nations. http://www.fao.org/docrep/003/t0355e/T0355E00.HTM
Coble, Paula, Chuanmin Hu, Richard W. Gould Jr., Grace Chang, A. Michelle Wood. Colored
Dissolved Organic in The Coastal Ocean An Optical Tool for Coastal Zone Environmental Assessment and Management. 2003. Oceanography. Volume 17 No. 2.
Coulon, Frédéric, Boyd A. McKew, A. Mark Osborn, Terry J. McGenity, Kenenth N. Timmis.
Effects of Temperature and Biostimulation on Oil-degrading Microbial Communities in Temperate Estuarine Waters. 2007. Environmental Microbiology 9(1) p. 177-186
Coulon, Frédéric, Emilien Pelletier, Lénaick Gourhant, Daniel Delille. Effects of Nutrient and
Temperature onDegradation of Petroleum Hydrocarbons in Contaminated Sub-Antarctic Soil. 2003. Chemosphere 58 p. 1439-1448.
Elachi, Charles, Jakob van Zyl. Introduction to The Physics and Techniques of Remote
Sensing”. Second Edition. 2006. John Wiley & Sons Inc.
Leahy, Joseph G. Rita R. Colwell. Microbial Degradation of Hydrocarbons in the Environment. 1990. Microbiological Reviews, p. 305-315. Department of Microbiology, University of Maryland
Rallyanti, Putri, Johar Setiyadi. Ringkasan Hasil Survei Sisa Tumpahan Minyak di Pulau Pramuka, Pulau Panggang, dan Pulau Karya, Kepulauan Seribu, DKI Jakarta. Laporan No. 02/2006. 2006, Kelompok Keahlian Sains dan Rekayasa Hidrografi Fakultas Teknik Sipil dan Lingkungan Institut Teknologi Bandung.
Smith, Val H.. Using Primary Productivity as an Index of Coastal Eutrophication: The Units of Measurement Matter. 2007. Journal of Plankton Research. Volume 29, p. 1-6. Oxford University Press
U.S Environmental Protection Agency. 2003. Aerobic Biodegradation of Oily Wastes A Field Guidance Book For Federal On-scene Coordinators. U.S Environmental Protection Agency Region 6 South Central Response and Prevention Branch
U.S Environmental Protection Agency. 2000. Clean Charles 2005 Water Quality Report 1999
Core Monitoring Program. US EPA Office of Environmental Measurement and Evaluation
Welderr, Jeremy. “Aqua Validation Results”. 2007. National Aeronatics and Space
Administration. http://seabass.gsfc.nasa.gov/matchup_results.html Zhu, Xueqing, Albert D. Venosa, Makram T. Suidan, Kenneth Lee. Guidelines for The
Bioremediation of Marine Shorelines and Freshwater Wetlands. 2001. U. S. Environmental Protection Agency
“Colored Dissolved Organic Matter (CDOM)”. Smithsonian Environmental Research Center.
http://www.serc.si.edu/labs/phytoplankton/primer/components.jsp “Common Water Quality Tests And Why They Are Important”. Florida Oceanographic Society.
2003. http://www.floridaoceanographic.org/water.htm#info “Coral Reef Biology”. 2007. National Oceanic and Atmospheric Administration.
http://coris.noaa.gov/about/biology/ “Oil in the Sea III: Inputs, Fates, and Effects”. The National Academy of Sciences. 2003.
http://www.nap.edu/openbook/ “Pulau Seribu Kembali Tercemar Minyak”. 2004. Kompas Cyber Media.
http://www.kompas.com/kompas-cetak/0411/25/metro/1399659.htm. Juni 2006 “Sensor to User – NASA/EOS Data for Coastal Zone Management Applications Developed
from Integrated Analyses Verification, Validation and Benchmark Report”. National Aeronatics and Space Administration. John C. Stennis Space Center
“Sosialisasi dan Survei Lapangan Pemanfaatan Data Inderaja dan Sistem Informasi Geografis
untuk Pengembangan Budidaya Laut”. Program Peningkatan Kapasitas IPTEK dan Sistem Produksi. 2005. Instalasi Lingkungan dan Cuaca Pengembangan Pemanfaatan dan Teknologi Penginderaan Jauh Lembaga Penerbangan dan Antariksa Nasional.
“The Basics of Ocean Chemistry: Carbon, Circulation, and Critters”. NASA Educational
Workshop. SeaWiFS: Ocean Chemistry. http://oceancolor.gsfc.nasa.gov/SEAWIFS.html

“Tumpahan Minyak Merambah Zona Inti TN Kepulauan Seribu”. 2006. Kompas Cyber Media.
http://www.kompas.com/kompas-cetak/0602/21/metro/2455721.htm. Juni 2006 “Understanding Oil Spills and Oil Spill Response”. Office of Emergency and Remedial
Response Environmental Protection Agency United States. 1999. http://www.epa.gov/oilspill.
“What Happens to Spilled Oil?”. Australian Maritime Safety Authority.
http://www.amsa.gov.au/Marine_Environment_Protection.html

Lampiran A Dokumentasi Pencemaran Minyak di
Kepulauan Seribu dan Pemantauan Lapangan
A - 1
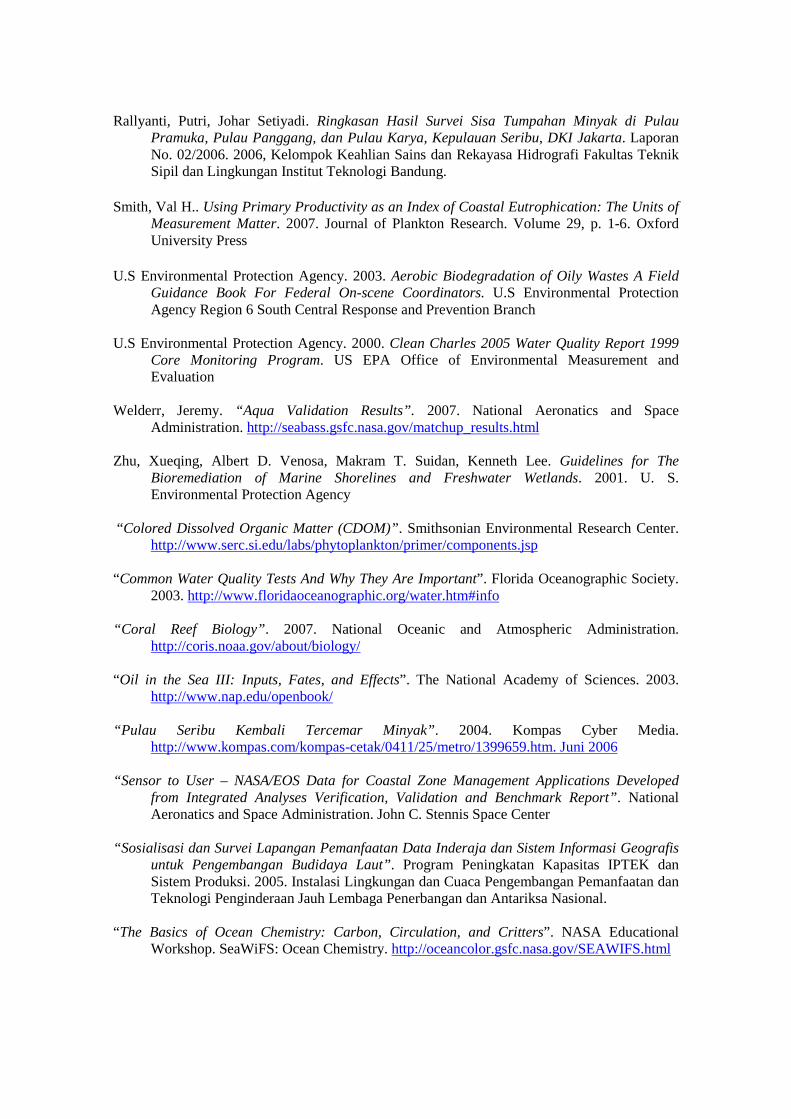
A.1 Dokumentasi Tumpahan Minyak di Kepulauan Seribu
Sumber :
http://www.jatam.org/indonesia/case/migas/pencemaran_minyak/pseribu/galeri.ph
p
Gambar A.1 Penyu Sisik yang menjadi korban pencemaran minyak di Kepulauan Seribu
Gambar A.2 Lumba-Lumba yang menjadi korban pencemaran minyak di Kepulauan Seribu
Gambar A.3 Pulau Pramuka, 11 Oktober 2004. Minyak dan Tar Ball di sekitar pantai
Gambar A.4 Pulau Pramuka, 5 Oktober 2004. Pencemaran minyak di sepanjang pantai menurunkan minat berkunjung wisatawan.
A - 2
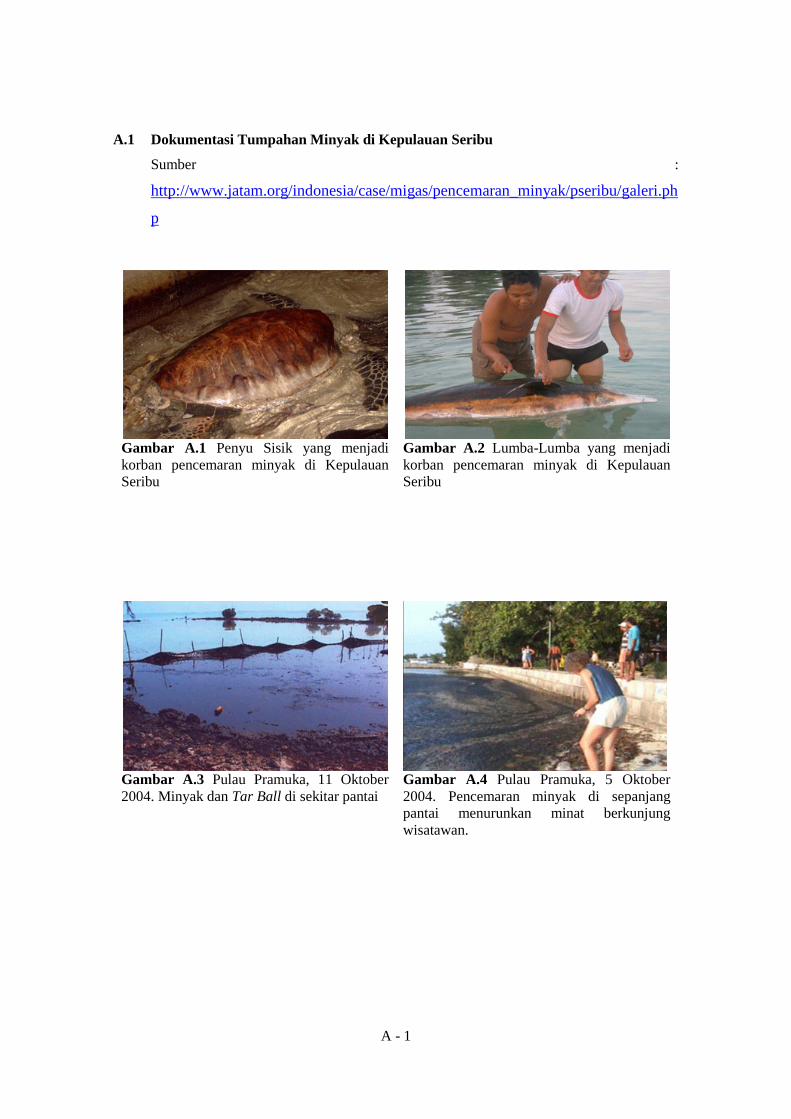
A.2 Dokumentasi Sampel Sisa Minyak
Tabel A.1 Pengambilan Data Tanggal 6 Agustus 2006
No. ID Jam Posisi
Sampel X Y
1 PRA007 14.30 678666 9364842 - 2 PRA006 14.45 678653 9364814 - 3 PRA005 14.47 678641 9364786 - 4 PRA004 14.50 678614 9364724 - 5 PRA003 14.53 678568 9364734 - 6 PRA002 14.58 678526 9364722 - 7 PRA058 15.00 678552 9364698 - 8 PRA057 15.06 678521 9364642 - 9 PRA056 15.10 678573 9364600 - 10 PRA055 15.13 678560 9364564 - 11 PRA053 - 678526 9364516 ada 12 PRA052 15.38 678490 9364404 - 13 PRA047 15.45 678474 9364350 - 14 PRA046 15.49 678474 9364350 - 15 PRA045 - 678456 9364254 ada 16 PRA038 16.10 678589 9364244 - 17 PRA037 16.15 678613 9364261 - 18 PRA036 16.18 678639 9364290 - 19 PRA033 16.22 678713 9364360 - 20 PRA030 16.36 678780 9364462 ada 21 PRA029 16.45 678798 9364506 ada 22 PRA028 16.47 678827 9364540 - 23 PRA027 16.50 678846 9364566 - 24 PRA026 16.55 678856 9364594 - 25 PRA025 16.57 678872 9364638 - 26 PRA023 17.07 678893 9364702 - 27 PRA022 17.05 678907 9364734 - 28 PRA021 17.10 678924 9364780 - 29 PRA020 17.15 678933 9364806 - 30 PRA019 17.19 678944 9364852 ada 31 PRA018 17.21 678950 9364888 - 32 PRA017 17.25 678950 9364952 ada 33 PRA016 17.30 678943 9364998 - 34 PRA015 17.32 678910 9365032 ada 35 PRA014 17.37 678870 9365054 - 36 PRA013 17.40 678845 9365064 - 37 PRA012 17.45 678795 9365032 ada 38 PRA011 17.50 678753 9364998 ada 39 PRA010 17.55 678718 9364962 ada 40 PRA009 17.58 678711 9364934 - 41 PRA008 18.01 678682 9364878 -
Sumber: Rallyanti, 2006
A - 3
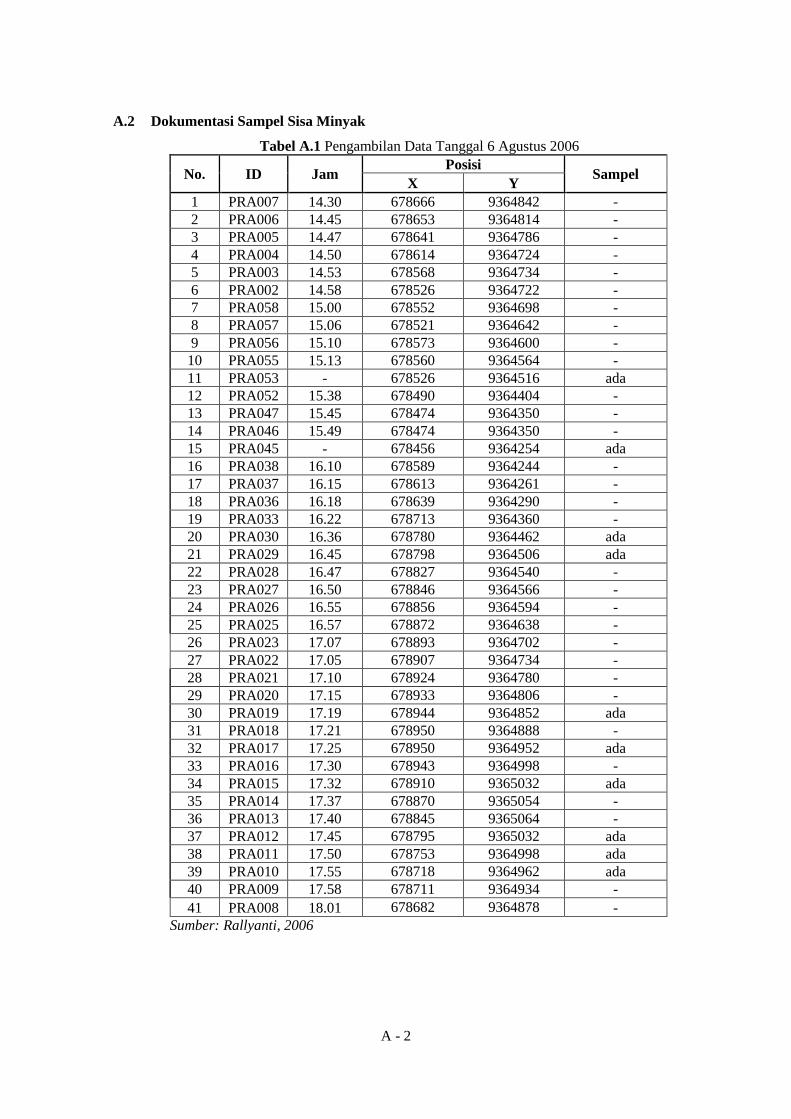
Pemantauan lapangan dilakukan pada tanggal 6-7 Agustus 2004 di pesisir Pulau Pramuka
Kepulauan Seribu oleh tim dari Kelompok Keahlian Sains dan Rekayasa Hidrografi ITB.
Pengambilan data diambil pada 48 titik dengan 15 titik pengambilan sampel. Tabel A.1
dan Tabel A.2 menjelaskan mengenai uraian pengambilan data di Pulau Pramuka.
Tabel A.2 Pengambilan Data Tanggal 7 Agustus 2006
No. ID Jam Posisi
Sampel X Y
1 PRA09B 07.07 678713 9364944 ada 2 PRA09C 07.10 678738 9364988 ada 3 PRA11A 07.15 678755 9365016 ada 4 PRA11B 07.19 678712 9365064 ada 5 PRA13A 07.27 678823 9365062 - 6 PRA15A 07.43 678954 9365012 ada 7 PRA09' 07.55 - - -
Sumber: Rallyanti, 2006
Gambar A.5 menunjukkan peta sebaran hasil pemantauan lapangan yang telah
dilakukan. Titik berwarna merah menunjukkan titik-titik pengambilan sampel. Sampel
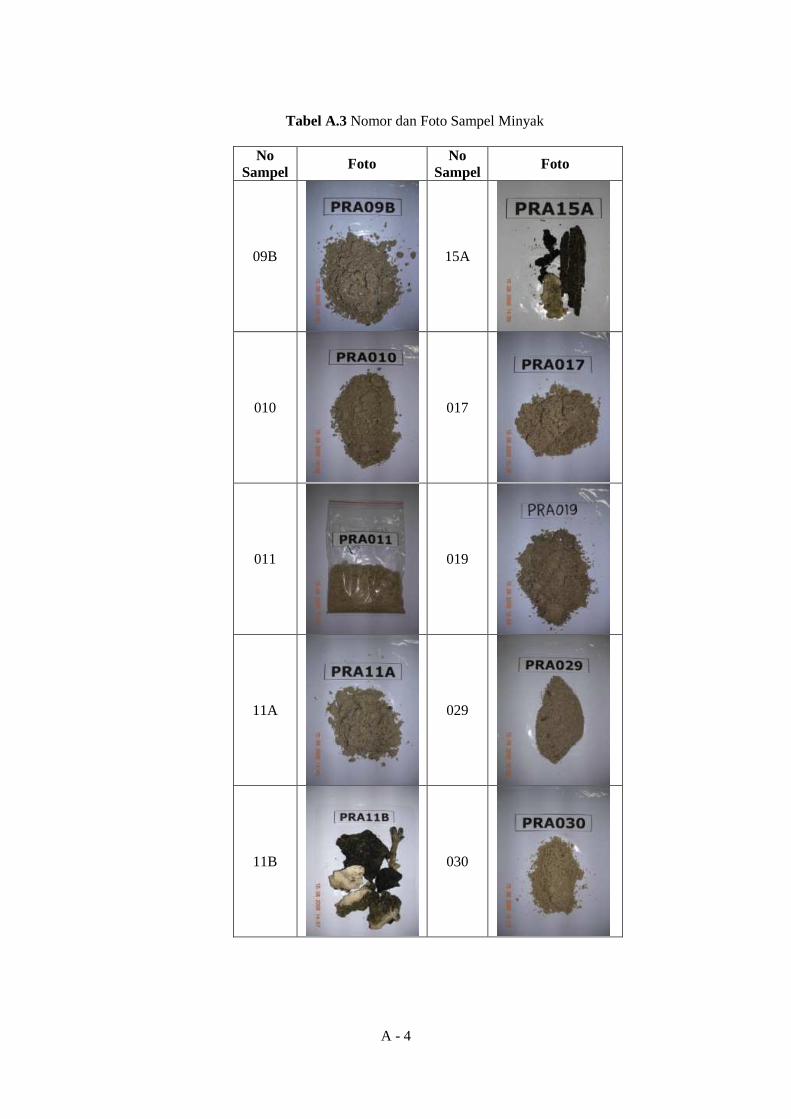
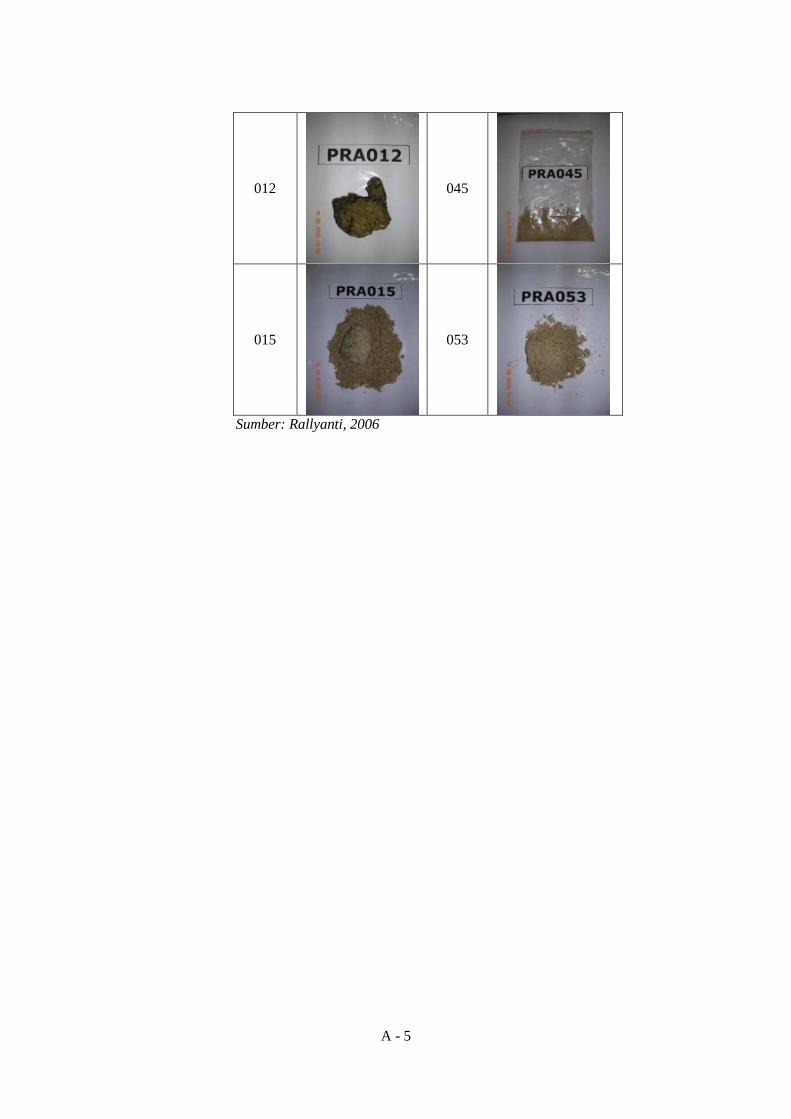
yang diambil terdiri dari pasir, kayu, dan sisa terumbu karang. Tabel A.3 menunjukkan
dokumentasi dari sampel hasil pemantauan lapangan.
Gambar A.5 Sebaran Titik-titik Pemantauan Lapangan
PRA007PRA006
PRA005
PRA004
PRA003PRA002
PRA058PRA057
PRA056PRA055
PRA053
PRA052PRA046
PRA047
PRA045 PRA038 PRA037PRA036
PRA033
PRA030PRA029
PRA028PRA027
PRA026PRA025
PRA023PRA022
PRA021PRA020
PRA019PRA018
PRA017PRA016
PRA015PRA014
PRA013PRA012
PRA011PRA010
PRA009PRA008
PRA09B
PRA09CPRA11A
PRA11B PRA13APRA15A
9364200
9364300
9364400
9364500
9364600
9364700
9364800
9364900
9365000
9365100
9365200
678400 678500 678600 678700 678800 678900 679000
Koo
rdin
at Y
Koordinat XTitik Sampling
A - 4
Tabel A.3 Nomor dan Foto Sampel Minyak
No Sampel Foto No
Sampel Foto
09B
15A
010
017
011
019
11A
029
11B
030
A - 5
012
045
015
053
Sumber: Rallyanti, 2006
Lampiran B
Peta Sebaran Temperatur, Klorofil-a, dan CDOM

B - 1
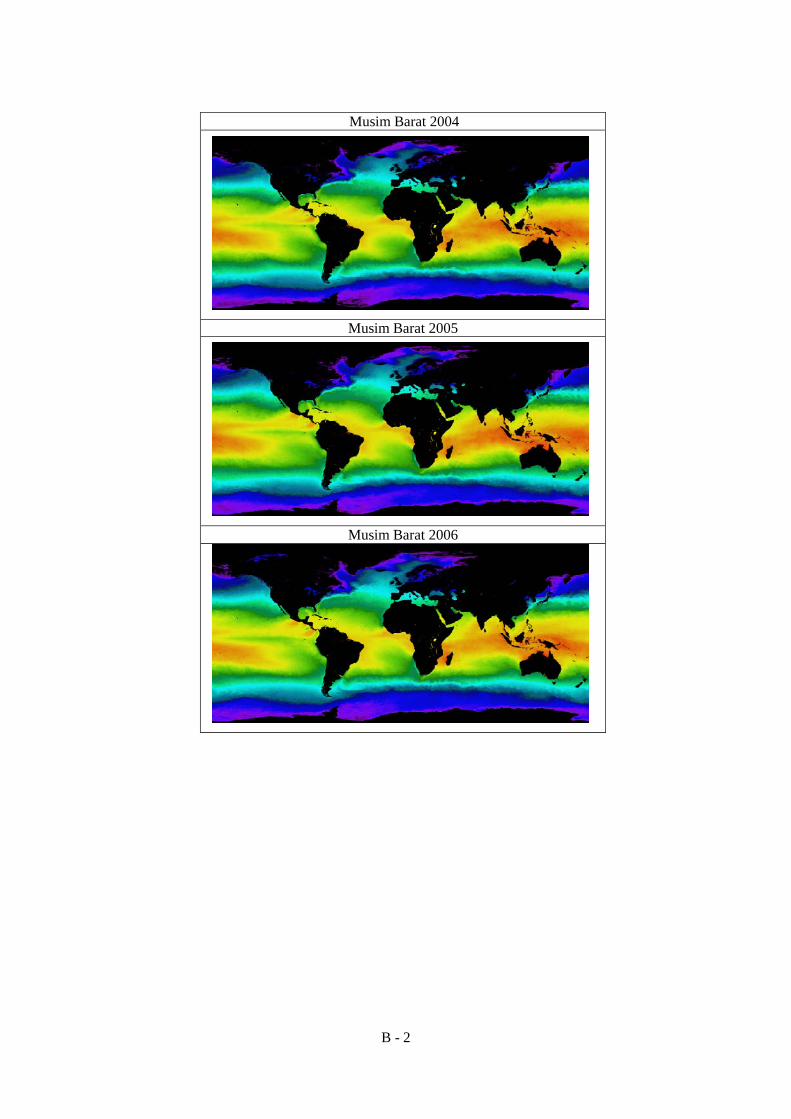
B.1 Temperatur Permukaan Laut
Sumber data: http://oceancolor.gsfc.nasa.gov/cgi/level3.pl?
Tabel B.1 Peta Global Sebaran Temperatur Permukaan Laut
Musim Timur 2004
Musim Timur 2005
Musim Timur 2006
B - 2
Musim Barat 2004
Musim Barat 2005
Musim Barat 2006
B - 3
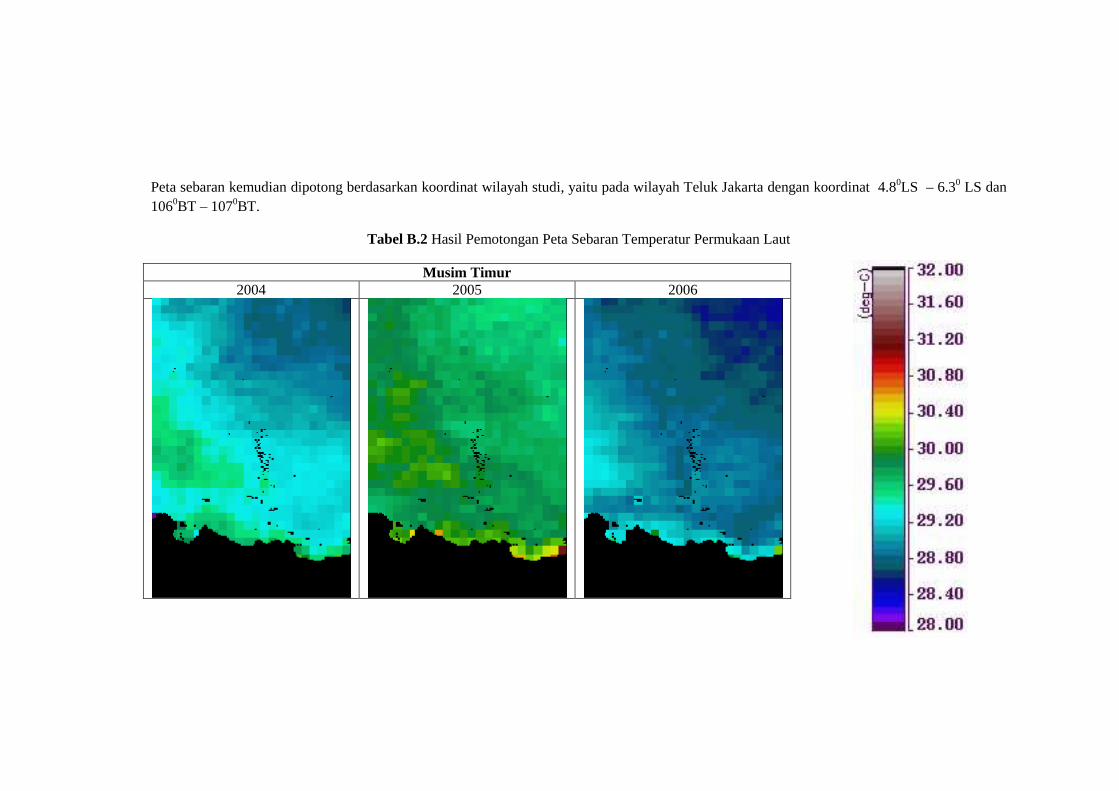
Peta sebaran kemudian dipotong berdasarkan koordinat wilayah studi, yaitu pada wilayah Teluk Jakarta dengan koordinat 4.80LS – 6.30 LS dan 1060BT – 1070BT.
Tabel B.2 Hasil Pemotongan Peta Sebaran Temperatur Permukaan Laut
Musim Timur 2004 2005 2006

B - 4
Musim Barat 2004 2005 2006
B - 5
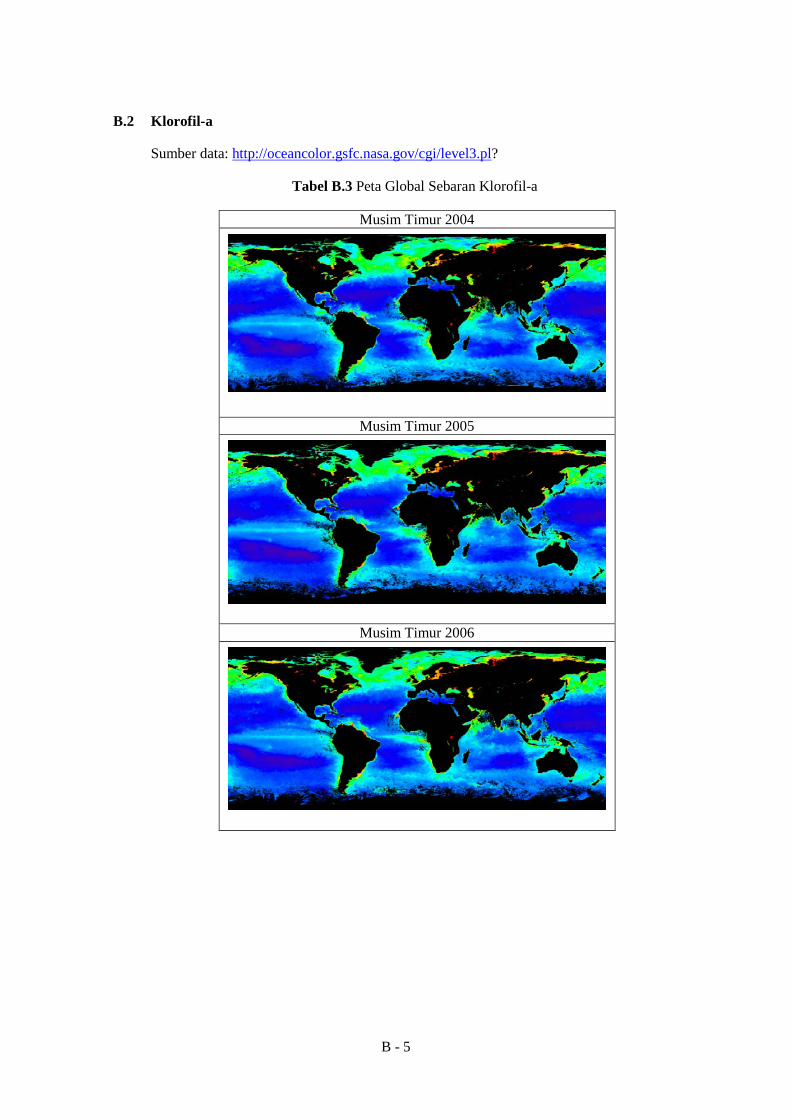
B.2 Klorofil-a
Sumber data: http://oceancolor.gsfc.nasa.gov/cgi/level3.pl?
Tabel B.3 Peta Global Sebaran Klorofil-a
Musim Timur 2004
Musim Timur 2005
Musim Timur 2006
B - 6
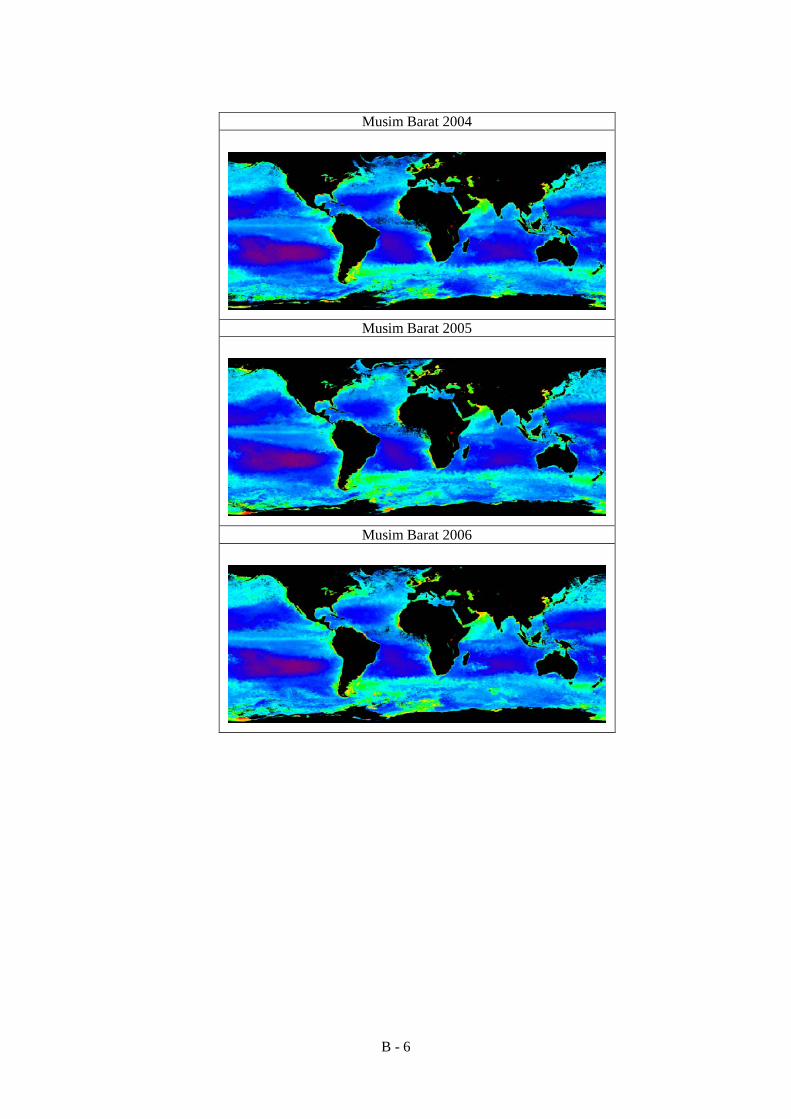
Musim Barat 2004
Musim Barat 2005
Musim Barat 2006

B - 7
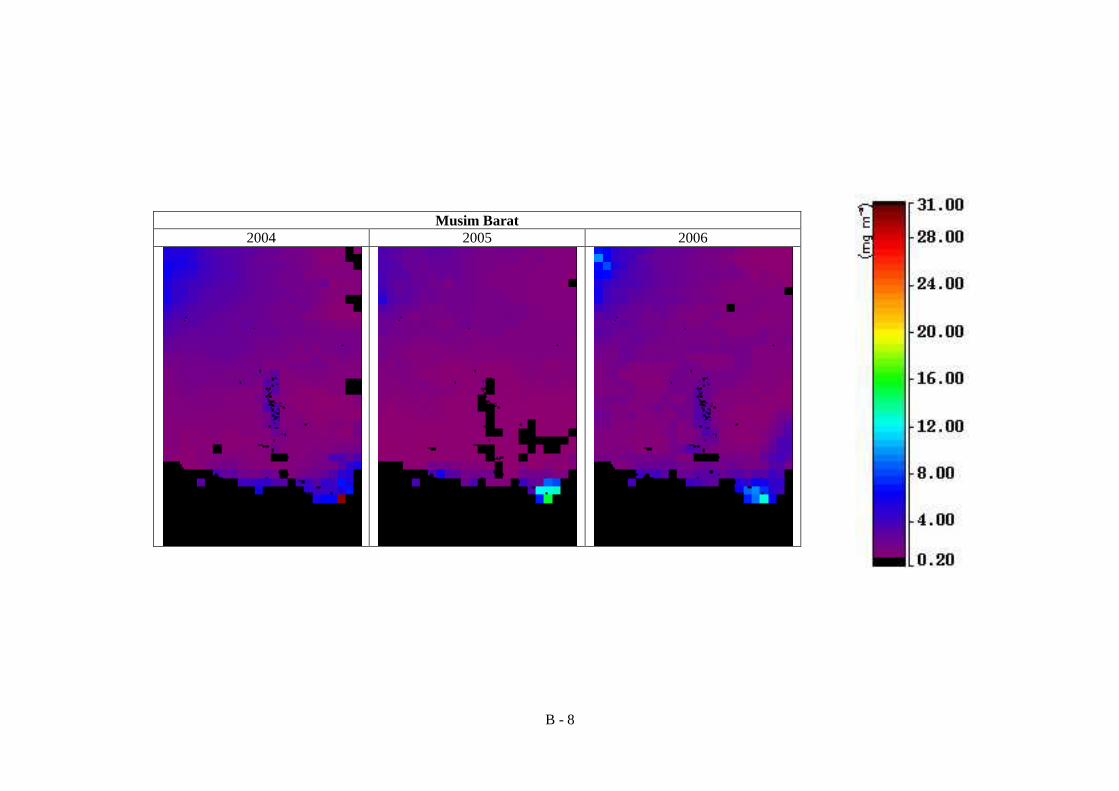
Peta sebaran kemudian dipotong berdasarkan koordinat wilayah studi, yaitu pada wilayah Teluk Jakarta dengan koordinat 4.80LS – 6.30 LS dan 1060BT – 1070BT.
Tabel B.4 Hasil Pemotongan Peta Sebaran Klorofil-a
Musim Timur 2004 2005 2006
B - 8
Musim Barat 2004 2005 2006
B - 9
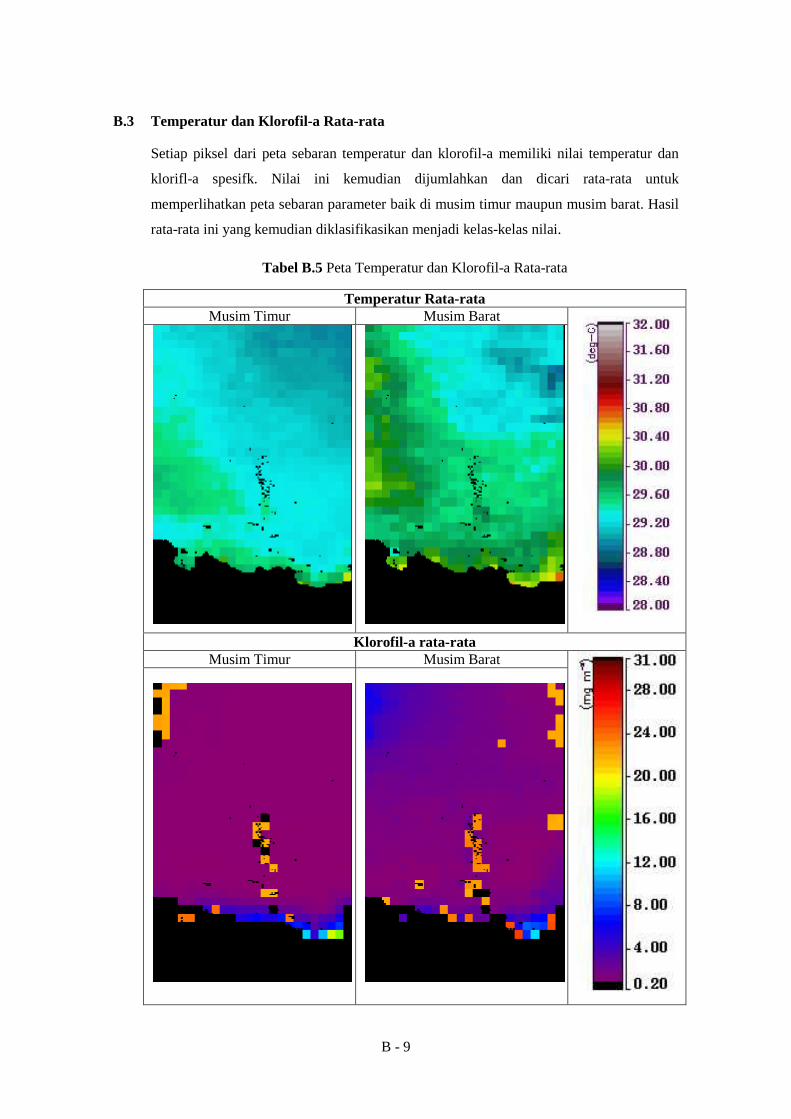
B.3 Temperatur dan Klorofil-a Rata-rata
Setiap piksel dari peta sebaran temperatur dan klorofil-a memiliki nilai temperatur dan
klorifl-a spesifk. Nilai ini kemudian dijumlahkan dan dicari rata-rata untuk
memperlihatkan peta sebaran parameter baik di musim timur maupun musim barat. Hasil
rata-rata ini yang kemudian diklasifikasikan menjadi kelas-kelas nilai.
Tabel B.5 Peta Temperatur dan Klorofil-a Rata-rata
Temperatur Rata-rata Musim Timur Musim Barat
Klorofil-a rata-rata Musim Timur Musim Barat
B - 10
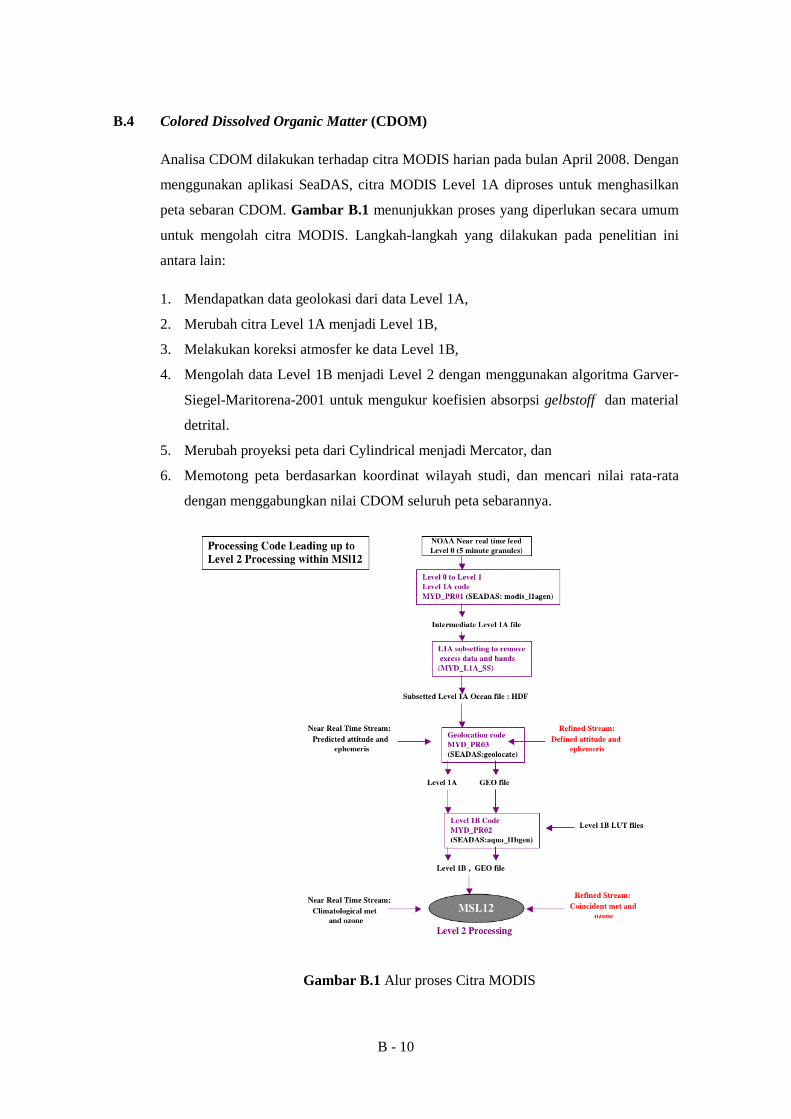
B.4 Colored Dissolved Organic Matter (CDOM)
Analisa CDOM dilakukan terhadap citra MODIS harian pada bulan April 2008. Dengan
menggunakan aplikasi SeaDAS, citra MODIS Level 1A diproses untuk menghasilkan
peta sebaran CDOM. Gambar B.1 menunjukkan proses yang diperlukan secara umum
untuk mengolah citra MODIS. Langkah-langkah yang dilakukan pada penelitian ini
antara lain:
1. Mendapatkan data geolokasi dari data Level 1A,
2. Merubah citra Level 1A menjadi Level 1B,
3. Melakukan koreksi atmosfer ke data Level 1B,
4. Mengolah data Level 1B menjadi Level 2 dengan menggunakan algoritma Garver-
Siegel-Maritorena-2001 untuk mengukur koefisien absorpsi gelbstoff dan material
detrital.
5. Merubah proyeksi peta dari Cylindrical menjadi Mercator, dan
6. Memotong peta berdasarkan koordinat wilayah studi, dan mencari nilai rata-rata
dengan menggabungkan nilai CDOM seluruh peta sebarannya.
Gambar B.1 Alur proses Citra MODIS
B - 11
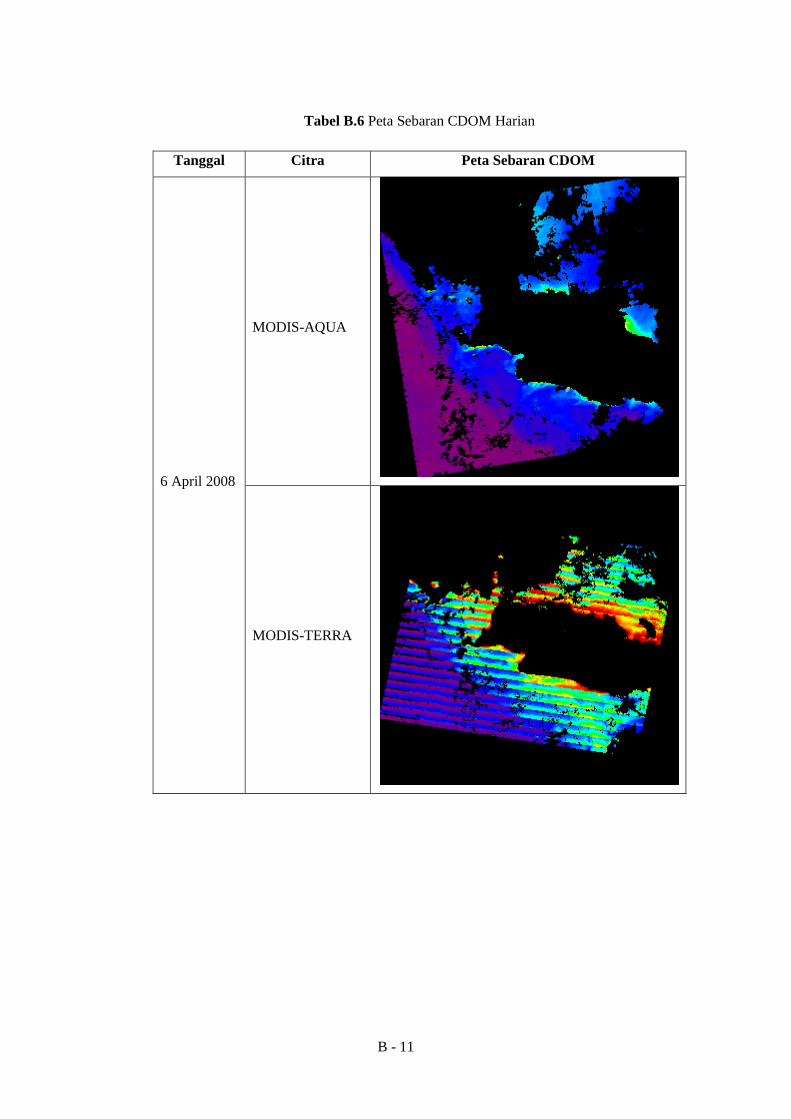
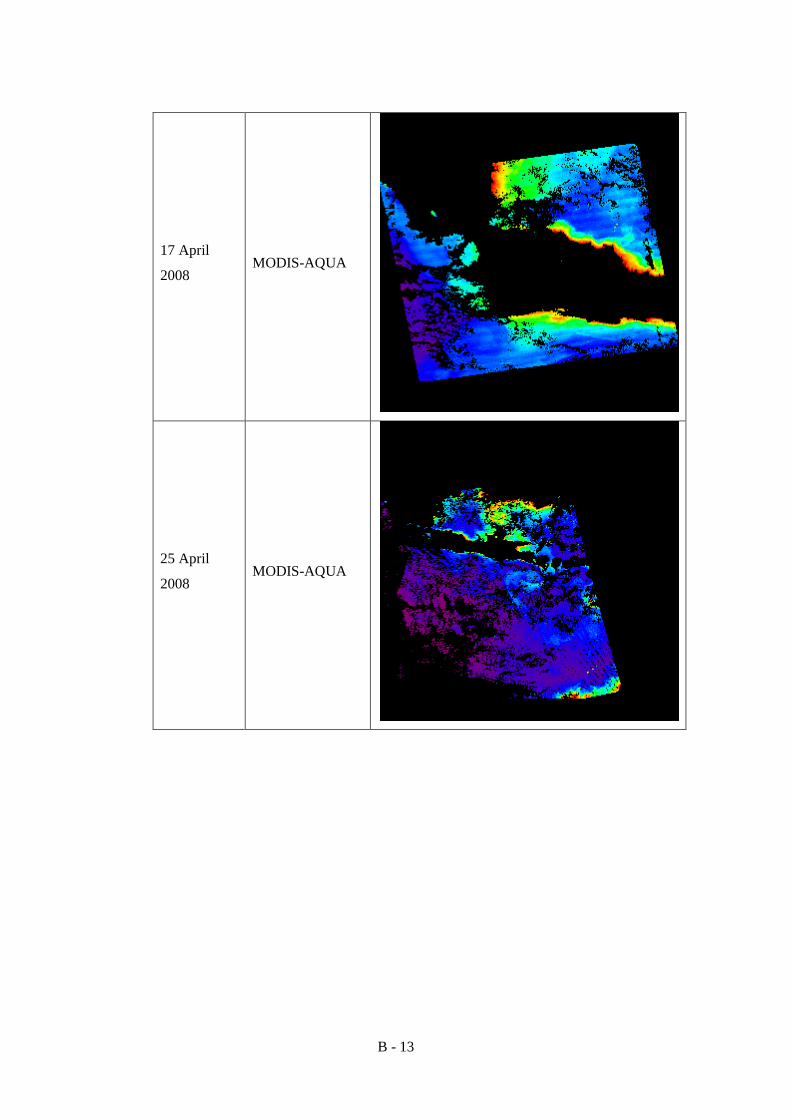
Tabel B.6 Peta Sebaran CDOM Harian
Tanggal Citra Peta Sebaran CDOM
6 April 2008
MODIS-AQUA
MODIS-TERRA
B - 12
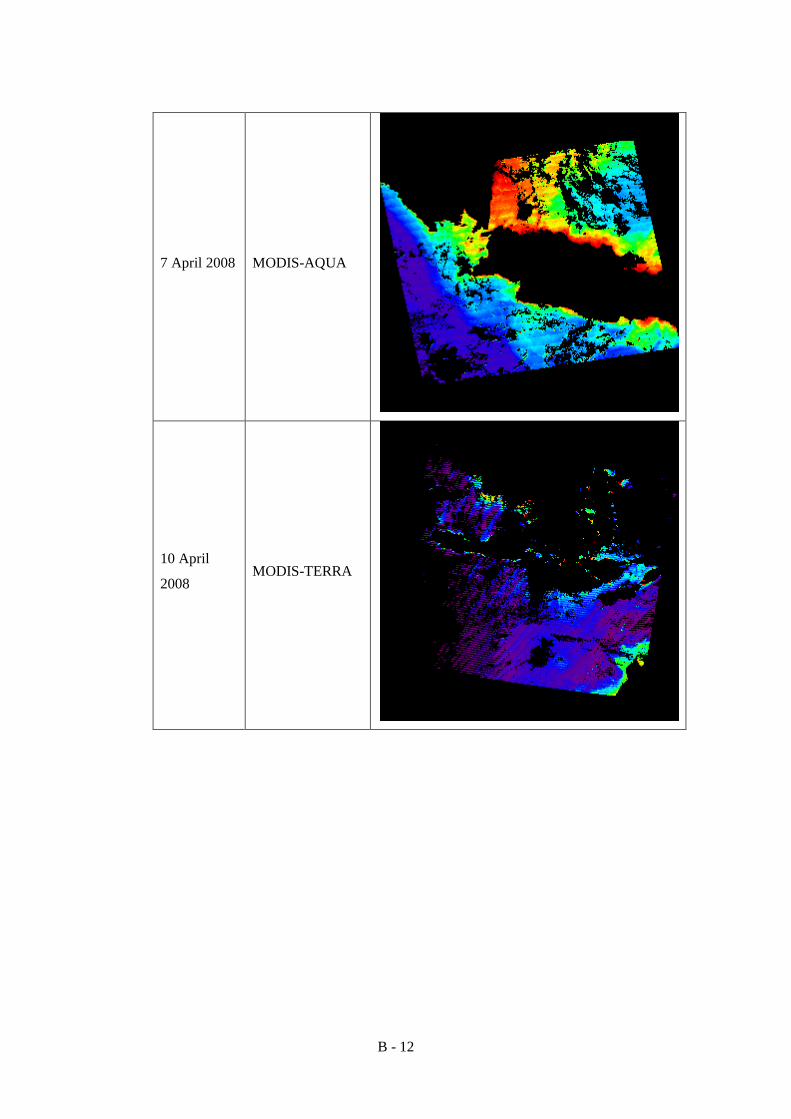
7 April 2008 MODIS-AQUA
10 April
2008 MODIS-TERRA
B - 13
17 April
2008 MODIS-AQUA
25 April
2008 MODIS-AQUA


![DAFTAR PUSTAKA - etd.repository.ugm.ac.idetd.repository.ugm.ac.id/downloadfile/96937/potongan/S1-2016... · 90 DAFTAR PUSTAKA DAFTAR PUSTAKA [1] Badan Standardisasi Nasional. “SNI](https://img.pdfslide.us/doc/110x75/5ccf188d88c99385278e02a1/daftar-pustaka-etd-90-daftar-pustaka-daftar-pustaka-1-badan-standardisasi.jpg)