Embed Size (px)
Citation preview

NIST GCR 14-917-26
Cost Analyses and Benefit Studies for
Earthquake-Resistant Construction in
Memphis, Tennessee
NEHRP Consultants Joint Venture A partnership of the Applied Technology Council and the
Consortium of Universities for Research in Earthquake Engineering

Disclaimers
This report was prepared for the Engineering Laboratory of the National Institute of Standards and Technology (NIST) under the National Earthquake Hazards Reduction Program (NEHRP) Earthquake Structural and Engineering Research Contract SB134107CQ0019, Task Order 10251. The contents of this publication do not necessarily reflect the views and policies of NIST or the U.S. Government. This report was produced by the NEHRP Consultants Joint Venture, a joint venture of the Applied Technology Council (ATC) and the Consortium of Universities for Research in Earthquake Engineering (CUREE). While endeavoring to provide practical and accurate information, the NEHRP Consultants Joint Venture, the authors, and the reviewers assume no liability for, nor express or imply any warranty with regard to, the information contained herein. Users of information contained in this report assume all liability arising from such use. Unless otherwise noted, photos, figures, and data presented in this report have been developed or provided by NEHRP Consultants Joint Venture staff or consultants engaged under contract to provide information as works for hire. Any similarity with other published information is coincidental. Photos and figures cited from outside sources have been reproduced in this report with permission. Any other use requires additional permission from the copyright holders. Certain commercial software, equipment, instruments, or materials may have been used in the preparation of information contributing to this report. Identification in this report is not intended to imply recommendation or endorsement by NIST, nor is it intended to imply that such software, equipment, instruments, or materials are necessarily the best available for the purpose. NIST policy is to use the International System of Units (metric units) in all its publications. In this report, however, information is presented in U.S. Customary Units (inch-pound), as this is the preferred system of units in the U.S. earthquake engineering industry. Cover image – U.S. Geological Survey 2008 National Seismic Hazard Map for 2% in 50 year Peak Ground Acceleration for the Central and Eastern U.S. Available from: http://earthquake.usgs.gov/hazards/products/conterminous/2008/.

NIST GCR 14-917-26
Cost Analyses and Benefit Studies for
Earthquake-Resistant Construction in
Memphis, Tennessee
Prepared for U.S. Department of Commerce
National Institute of Standards and Technology Engineering Laboratory
Gaithersburg, MD 20899
By NEHRP Consultants Joint Venture
A partnership of the Applied Technology Council and the Consortium of Universities for Research in Earthquake Engineering
December 2013
U.S. Department of Commerce
Penny Pritzker, Secretary
National Institute of Standards and Technology Patrick Gallagher, Under Secretary of Commerce for Standards
and Technology and Director


Participants National Institute of Standards and Technology
John (Jack) R. Hayes, Jr., Director, National Earthquake Hazards Reduction Program Steven L. McCabe, Deputy Director, National Earthquake Hazards Reduction Program Matthew Speicher, NIST Project Manager
NEHRP Consultants Joint Venture
Applied Technology Council 201 Redwood Shores Parkway, Suite 240 Redwood City, California 94065 www.ATCouncil.org
Consortium of Universities for Research in Earthquake Engineering 1301 S. 46th Street, Building 420 Richmond, California 94804 www.CUREE.org
Joint Venture Management Committee
James R. Harris Robert Reitherman Christopher Rojahn Andrew Whittaker
Joint Venture Program Committee
Jon A. Heintz (Program Manager) Michael Constantinou C.B. Crouse James R. Harris William T. Holmes Jack P. Moehle Andrew Whittaker
Project Technical Committee
James. R. Harris (Project Director) David Bonneville Ryan Kersting John Lawson Peter Morris Working Group Members
Kevin Cissna Evan Hammel Erica Hays Guy Mazotta Albert Misajon Fred Rutz Gene Stevens
Project Review Panel Michael E. Corrin Ashraf Elsayed Julie C. Furr Richard W. Howe Richard T. Meena Luke Newman Robert Norcross Robert B. Paullus John Walpole Project Manager
Ayse Hortacsu
NIST GCR 14-917-26


GCR 14-917-26 Preface iii
Preface
The NEHRP Consultants Joint Venture is a partnership between the Applied
Technology Council (ATC) and the Consortium of Universities for Research in
Earthquake Engineering (CUREE). In 2007, the National Institute of Standards and
Technology (NIST) awarded a National Earthquake Hazards Reduction Program
(NEHRP) “Earthquake Structural and Engineering Research” contract
(SB134107CQ0019) to the NEHRP Consultants Joint Venture to conduct a variety of
tasks, including Task Order 10251 entitled “Cost-Benefit Analysis of Codes and
Standards for Earthquake-Resistant Construction in Selected U.S. Regions –
Phase I.”
The fundamental objective of the project was to develop realistic cost premiums
associated with earthquake-resistant building construction in the middle Mississippi
River Valley region. An additional objective was to investigate the benefits expected
from instituting modern building code provisions for seismic safety. This report
provides a summary of cost analyses and benefit studies conducted on six buildings
located in Memphis metropolitan area. The six selected building types were selected
to be representative of construction expected in the area. Three levels of design were
conducted to facilitate comparison of total construction cost and earthquake
resistance.
The NEHRP Consultants Joint Venture is indebted to the leadership of Jim Harris,
Project Director, and to the members of the project team for their efforts in
developing this report. The Project Technical Committee, consisting of David
Bonneville, Ryan Kersting, John Lawson, and Peter Morris, performed, monitored,
and guided the technical work on the project. The Working Groups, including Kevin
Cissna, Evan Hammel, Erica Hays, Guy Mazotta, Albert Misajon, Fred Rutz, and
Gene Stevens, performed the building designs, developed cost estimates, and
conducted benefit analyses. The Project Review Panel, consisting of Ashraf Alsayed,
Michael Corrin, Julie Furr, Richard Howe, Richard Meena, Luke Newman, Robert
Norcross, Robert Paullus, and John Walpole provided technical review, advice, and
consultation at key stages of the work. The names and affiliations of all who
contributed to this report are provided in the list of Project Participants.
The NEHRP Consultants Joint Venture also gratefully acknowledges Jack Hayes
(NEHRP Director), Steve McCabe (NEHRP Deputy Director), and Matthew Speicher
(NIST Project Manager) for their input and guidance in the preparation of this report,

iv Preface GCR 14-917-26
Ayse Hortacsu for ATC project management, and Amber Houchen and Peter N.
Mork for ATC report production services.
Jon A. Heintz
Program Manager

GCR 14-917-26 Executive Summary v
Executive Summary
The cost premium for earthquake-resistant construction is of great interest in regions
that have significant seismic hazard, but have not suffered serious damage from
earthquakes in the memories of people now living. The middle Mississippi River
Valley was struck by very large earthquakes in 1811 and 1812, and scientific study
has found evidence of multiple large earthquakes prior to that. This history indicates
that the risk for loss of human life due to earthquake hazard in the region is high.
This inference is confirmed by hazard assessment information based on expert
consensus studies conducted by leading seismologists who are engaged with the U.S.
Geological Survey. Based on risk to life-safety, the hazard is very similar to coastal
California, but there have been essentially no damaging earthquakes to remind the
populace of the hazard. This understandably leads to questions about the value (cost)
of including earthquake-resistant construction requirements in the local building
codes.
In 2010, the National Institute of Standards and Technology (NIST) initiated a
project to investigate cost premiums associated with earthquake-resistant building
construction in the middle Mississippi River Valley region. Similar studies were
conducted in 1982 and 1998 through the Building Seismic Safety Council (BSSC)
under sponsorship of the Federal Emergency Management Agency (FEMA). In this
project, cost premiums were developed by comparing building design requirements
found in national model codes and current local codes, both with and without seismic
requirements, and then developing structural designs and construction cost estimates
for selected representative building types. The benefits of earthquake-resistant
construction were also analyzed.
Selection of building types for this study was initiated by an analysis of construction
data for Shelby County, Tennessee, provided by the NIST Applied Economics
Office. These data covered building information from several decades, ranging from
1940 to 2007. The project team, with the assistance of Memphis-area professionals,
analyzed this data set and then projected to future expectations based on observations
of current construction practice in the region. Six building types were selected for
study: a three-story apartment, a four-story office, a one-story retail, a one-story
warehouse, a six-story hospital, and a two-story elementary school. Each design was
configured to be a realistic building in terms of size, structural system, and location
within the metropolitan area.

vi Executive Summary GCR 14-917-26
Three designs were developed for each of the six building types:
1. A design developed without consideration of any specified seismic hazard, but
with a lateral force-resisting system in conformance with requirements for wind
load based on ASCE/SEI 7-05, Minimum Design Loads for Buildings and Other
Structures (ASCE, 2006). This wind load is consistent with recent and projected
future building codes in Memphis.
2. A design developed based on current local building code provisions. At the time
this study was performed, Memphis and Shelby County were in the process of
adopting a new local building code, but the implementation of the structural
provisions of that code was delayed pending resolution of local application of
seismic design provisions. Thus for structural design purposes, the current local
Memphis and Shelby County Building Code1 used in this study is based upon the
2003 edition of the International Building Code (ICC, 2003), with a local
amendment permitting seismic design based on the 1999 Standard Building Code
(SBCCI, 1999), except for hospitals and other essential facilities. In the case of
hospitals and other essential facilities, this code requires compliance with the
seismic provisions of the 2003 International Building Code, which essentially
results in hospital designs consistent with current national seismic requirements.
3. A design developed based on ASCE/SEI 7-10, Minimum Design Loads for
Buildings and Other Structures (ASCE, 2010), which is the current national
standard for earthquake-resistant design, and is also the basis of the structural
provisions of the 2012 edition of the International Building Code (ICC, 2012)2.
In a few cases, the lateral strength required for seismic design was less than that
required for code-specified wind design. In such cases, the design strength was not
reduced (i.e., wind load cases governed the minimum design strength for these
buildings).
Experience in seismic design was judged to be most critical in developing efficient
designs. As a result, teams performing the structural design work included firms
from California and Colorado. The resulting designs and cost estimates were
extensively reviewed by Memphis-area professionals, who were consulted at length
about local codes and design practices for each building type.
Cost estimates were developed by a cost consulting firm using a national database of
construction costs. Costs assume competitively procured prices in the Memphis-area
1 On October 1, 2013, Memphis and Shelby County approved the 2012 International Building Code (ICC, 2012), including the seismic design provisions, as the basis of the local Memphis and Shelby County building code. 2 With adoption of the 2012 IBC, the structural and seismic design provisions of local Memphis and Shelby County building code are now based on ASCE/SEI 7-10, the national standard for earthquake-resistant design. The comparative design studies in this report serve to illustrate the effect of this change.

GCR 14-917-26 Executive Summary vii
market in the fourth quarter of 2012. Quantities and materials were selected to
represent building practices typical of the region, at an overall mid-level of quality.
The quantities and materials assumed in the estimates were reviewed by local design
and construction professionals and found to be consistent with local practices.
Estimates include costs for structural systems and nonstructural systems, including
equipment and architectural finishes that would be provided as part of the core and
shell. Estimates consider costs for building construction only, excluding costs related
to site development and utilities. These excluded costs are considered relatively
constant for different structural designs. In the case of commercial buildings,
estimates exclude costs for items that would normally be associated with tenant
improvements. The estimates include an allowance for contingencies that might be
missed in the preliminary design of nonstructural aspects of the buildings. Costs
associated with design, testing, and inspection services are also excluded, except for
special inspections associated with seismic design requirements.
Table ES-1 and Table ES-2 summarize construction cost ratios among the three
different design levels. Table ES-1 compares cost estimates for the seismic designs
to those for the wind design, whereas Table ES-2 compares the cost estimates for the
two seismic designs. In Table ES-1, the column labeled “Wind” is taken as the base,
and is populated with the value 1.0. Similarly, “Current Local Seismic Code Design”
is taken as the base in Table ES-2.
Table ES-1 Summary of Construction Cost Ratios and Cost Premiums at Three Design Levels
Building Wind(1)
Current Local Seismic Code(2)
Current National Seismic Code(3)
Cost Ratio(4)
Cost Premium
Cost Ratio(4)
Cost Premium
Apartment 1.0 1.003 0.3% 1.012 1.2%
Office 1.0 1.021 2.1% 1.028 2.8%
Retail 1.0 1.003 0.3% 1.005 0.5%
Warehouse 1.0 1.004 0.4% 1.014 1.4%
Hospital 1.0 1.025 2.5% 1.025 2.5%
School 1.0 1.010 1.0% 1.014 1.4%
Notes: (1) Wind-only lateral design for all buildings is conducted according to ASCE/SEI 7-05.
(2) The current local seismic code is the 2003 International Building Code. For most buildings, the local code allows structural design to conform to the 1999 Standard Building Code, which is less demanding and was used for all buildings except the hospital. The local code does not permit the exception for design of hospitals. ASCE/SEI 7-02 was used as the basis for the hospital design.
(3) The current national seismic code design for all buildings is conducted according to the 2012 International Building Code with ASCE/SEI 7-10 used as the basis.
(4) Ratios are total construction costs for seismic design relative to wind design.

viii Executive Summary GCR 14-917-26
The columns labeled “Cost Ratio” are populated with ratios of construction costs, and
the “Cost Premium” column indicates the cost premium as a percentage of the base.
The results in the tables can be interpreted as follows: the design according to the
current local seismic code design for the three-story apartment building is shown to
have a cost ratio of 1.003 when compared to the wind design, indicating a cost
differential of 0.3% more than the design for wind only.
Table ES-2 Summary of Construction Cost Ratios and Cost Premiums for Seismic Design Levels
Building Current Local
Seismic Code(1)
Current National Seismic Code(2)
Cost Ratio(3) Cost Premium
Apartment 1.0 1.009 0.9%
Office 1.0 1.007 0.7%
Retail 1.0 1.002 0.2%
Warehouse 1.0 1.010 1.0%
Hospital 1.0 1.000 0.0%
School 1.0 1.004 0.4%
Notes: (1) The current local seismic code is the 2003 International Building Code. For most buildings, the local code allows structural design to conform to the 1999 Standard Building Code, which is less demanding and was used for all buildings except the hospital. The local code does not permit the exception for design of hospitals. ASCE/SEI 7-02 was used as the basis for the hospital design.
(2) The current national seismic code design for all buildings is conducted according to the 2012 International Building Code with ASCE/SEI 7-10 used as the basis.
(3) Ratios are total construction costs for current national seismic code design relative to current local seismic code design.
In this study, benefits are assessed based on relative performance between the
designs. For each building, an assessment of benefits is presented. Relative
performance is determined based on a qualitative comparison of relative design
strengths, code detailing requirements, and the judgment of engineers familiar with
the performance of modern building construction in strong earthquake shaking. It
includes consideration of differences among the three designs that, in the judgment of
the engineers preparing the designs, are likely to have the most impact on
performance in the event that strong ground shaking from an earthquake was to
occur.
In general, better seismic performance is achieved through increased lateral design
forces (i.e., base shear), and detailing requirements that improve structural
connection strength or structural member behavior in the inelastic range of response.
Requirements for seismic bracing and anchorage of nonstructural components reduce
potential for nonstructural damage and loss of building (or system) functionality.

GCR 14-917-26 Executive Summary ix
Given the now prevalent styles of construction in Memphis, the most significant
changes in the details to accommodate seismic requirements in the lateral force-
resisting system include:
Stronger and tougher connections to tie heavy walls, such as tilt-up concrete
panels or masonry walls, to floor and roof diaphragms that provide lateral
support for the walls ,
Stronger and tougher connections of diagonal braces in steel frames, and
Use of structural wood panels, such as plywood or oriented strand board, as
sheathing in wood frame construction, unless a significant strength penalty is
taken for other types of sheathing, such as gypsum wallboard.
In general, benefits were assessed on a qualitative basis for each building. The
publication of FEMA P-58-1, Seismic Performance Assessment of Buildings Volume
1 – Methodology (FEMA, 2012a), however, provides a new opportunity to assess the
performance of individual buildings on a quantitative, probabilistic basis. As a result,
buildings in this study that fit within the range of applicability of the FEMA P-58-1
methodology have also been assessed on a quantitative basis. These buildings
include the apartment building, office building, and hospital. Results from
quantitative assessments of benefits are presented in the body of the report and in
Appendix E.
The major conclusion of this study is that construction cost premiums associated with
meeting current national standards for earthquake resistance are small, generally
3% or less over design for wind only, and 1% or less over what is currently required
for seismic design in the Memphis area. Weighted averages for these cost premiums
are 1.65% and 0.53%, respectively. Benefits associated with improved seismic
design, whether measured qualitatively or quantitatively, were shown to be
significant.


GCR 14-917-26 Table of Contents xi
Table of Contents
Preface ................................................................................. iii
Executive Summary .................................................................. v
List of Figures ....................................................................... xv
List of Tables ......................................................................... xxi
1. Introduction ................................................................ 1-1 1.1 Previous Work ................................................................................ 1-1 1.2 Project Objectives and Scope.......................................................... 1-2 1.3 Conduct of the Project .................................................................... 1-2 1.4 Report Organization and Content ................................................... 1-4
2. Scope and Criteria ........................................................ 2-1 2.1 Selection of Building Types and Structural Systems ...................... 2-1 2.2 Building Locations and Site Specific Data ..................................... 2-5 2.3 Foundation Design Criteria and Seismic Site Class ........................ 2-7 2.4 Design Criteria ................................................................................ 2-8 2.4.1 Overview ............................................................................ 2-8 2.4.2 Local Code in Memphis ..................................................... 2-8 2.4.3 Design Levels .................................................................... 2-9 2.4.4 Seismic Design Parameters .............................................. 2-11 2.5 Development of Cost Estimates .................................................... 2-12 2.6 Assessment of Benefits ................................................................. 2-13 2.7 Summary ....................................................................................... 2-14
3. Apartment Building ....................................................... 3-1 3.1 Building Description ....................................................................... 3-1 3.1.1 General ............................................................................... 3-1 3.1.2 Foundations ........................................................................ 3-3 3.1.3 Gravity Framing System .................................................... 3-4 3.1.4 Lateral Force-Resisting System ......................................... 3-7 3.2 Wind Design ................................................................................... 3-7 3.3 Current Local Seismic Code Design ............................................. 3-10 3.4 Current National Seismic Code Design ........................................ 3-11 3.5 Cost Comparison ........................................................................... 3-14 3.6 Benefits Comparison ..................................................................... 3-16 3.6.1 Qualitative Comparison ................................................... 3-16 3.6.2 Quantitative Comparison ................................................. 3-17 3.7 Conclusions ................................................................................... 3-18
4. Office Building ............................................................. 4-1 4.1 Building Description ....................................................................... 4-1
4.1.1 General ............................................................................... 4-1

xii Table of Contents GCR 14-917-26
4.1.2 Foundations ........................................................................ 4-2 4.1.3 Gravity Framing System .................................................... 4-2 4.1.4 Lateral Force-Resisting System ......................................... 4-3
4.2 Wind Design .................................................................................... 4-3 4.3 Current Local Seismic Code Design ............................................... 4-4 4.4 Current National Seismic Code Design ........................................... 4-6 4.5 Cost Comparison ............................................................................. 4-7 4.6 Benefits Comparison ....................................................................... 4-9 4.6.1 Qualitative Comparison ..................................................... 4-9 4.6.2 Quantitative Comparison.................................................. 4-10 4.7 Conclusions ................................................................................... 4-11
5. Retail Building .............................................................. 5-1 5.1 Building Description ....................................................................... 5-1
5.1.1 General ............................................................................... 5-1 5.1.2 Foundations ........................................................................ 5-3 5.1.3 Gravity Framing System .................................................... 5-3 5.1.4 Lateral Force-Resisting System ......................................... 5-3
5.2 Wind Design .................................................................................... 5-3 5.3 Current Local Seismic Code Design ............................................... 5-5 5.4 Current National Seismic Code Design ........................................... 5-7 5.5 Cost Comparison ............................................................................. 5-9 5.6 Benefits Comparison ..................................................................... 5-10 5.6.1 Qualitative Comparison ................................................... 5-10 5.7 Conclusions ................................................................................... 5-13
6. Warehouse Building ....................................................... 6-1 6.1 Building Description ....................................................................... 6-1
6.1.1 General ............................................................................... 6-1 6.1.2 Foundations ........................................................................ 6-3 6.1.3 Gravity Framing System .................................................... 6-3 6.1.4 Lateral Force-Resisting System ......................................... 6-4
6.2 Wind Design .................................................................................... 6-4 6.3 Current Local Seismic Code Design ............................................... 6-6 6.4 Current National Seismic Code Design ........................................... 6-8 6.5 Cost Comparison ........................................................................... 6-11 6.6 Benefits Comparison ..................................................................... 6-12 6.6.1 Qualitative Comparison ................................................... 6-12 6.7 Conclusions ................................................................................... 6-14
7. Hospital Building ........................................................... 7-1 7.1 Building Description ....................................................................... 7-1
7.1.1 General ............................................................................... 7-1 7.1.2 Foundations ........................................................................ 7-2 7.1.3 Gravity Framing System .................................................... 7-2
7.1.4 Lateral Force-Resisting System ......................................... 7-3 7.2 Wind Design .................................................................................... 7-3 7.3 Current Local Seismic Code Design ............................................... 7-4 7.4 Current National Seismic Code Design ........................................... 7-6 7.5 Cost Comparison ............................................................................. 7-7 7.6 Benefits Comparison ....................................................................... 7-8
GCR 14-917-26 Table of Contents xiii
7.6.1 Qualitative Comparison ..................................................... 7-8 7.6.2 Quantitative Comparison ................................................. 7-10 7.7 Conclusions ................................................................................... 7-11
8. School Building ............................................................ 8-1 8.1 Building Description ....................................................................... 8-1 8.1.1 General ............................................................................... 8-1 8.1.2 Foundations ........................................................................ 8-2 8.1.3 Gravity Framing System .................................................... 8-3 8.1.4 Lateral Force-Resisting System ......................................... 8-3 8.2 Wind Design ................................................................................... 8-5 8.3 Current Local Seismic Code Design ............................................... 8-6 8.4 Current National Seismic Code Design .......................................... 8-8 8.5 Cost Comparison ............................................................................. 8-9 8.6 Benefits Comparison ..................................................................... 8-10 8.6.1 Qualitative Comparison ................................................... 8-10 8.7 Conclusions ................................................................................... 8-12
9. Development of Cost Estimates ........................................ 9-1 9.1 Cost Model Basis ............................................................................ 9-2
9.1.1 Structural Elements ............................................................ 9-2 9.1.2 Nonstructural Elements ...................................................... 9-2
9.2 Pricing Basis ................................................................................... 9-2 9.3 Site Preparation Costs ..................................................................... 9-3 9.4 Other Costs ..................................................................................... 9-3
9.4.1 Site Utilities ....................................................................... 9-3 9.4.2 Design, Testing, and Inspection ......................................... 9-4 9.4.3 Fees .................................................................................... 9-4
10. Summary and Conclusions .............................................. 10-1 10.1 Summary of Cost Analyses ........................................................... 10-1 10.2 Summary of Benefits Studies........................................................ 10-3 10.3 Summary of Conclusions .............................................................. 10-7
A. Historical Building Construction Data ................................. A-1
B. Geotechnical Data for Design ........................................... B-1 B.1 General Area Geology .................................................................... B-1 B.2 General Subsurface Soil Conditions ............................................... B-2 B.2.1 Apartment Site ................................................................... B-3 B.2.2 Office Site .......................................................................... B-5 B.2.3 Retail Site ........................................................................... B-7 B.2.4 Warehouse Site .................................................................. B-9 B.2.5 Hospital Site ....................................................................... B-9 B.2.6 School Site ....................................................................... B-12
C. Cost Data .................................................................... C-1 C.1 Apartment Building ........................................................................ C-1 C.2 Office Building ............................................................................... C-4 C.3 Retail Building…. ........................................................................... C-8 C.4 Warehouse Building ..................................................................... C-13

xiv Table of Contents GCR 14-917-26
C.5 Hospital Building ......................................................................... C-17 C.6 School Building ............................................................................ C-21
D. Design Drawings ........................................................... D-1 D.1 Apartment Building ........................................................................ D-1 D.2 Office Building ............................................................................... D-1 D.3 Retail Building…. .......................................................................... D-2 D.4 Warehouse Building ....................................................................... D-2 D.5 Hospital Building ........................................................................... D-3 D.6 School Building .............................................................................. D-4
E. Quantitative Benefits Analysis .......................................... E-1 E.1 Quantitative Performance Assessment Using FEMA P-58 ............ E-1 E.2 Quantitative Assessment of the Apartment Building ..................... E-3 E.2.1 Hazard Curve .................................................................... E-3 E.2.2 Characterization of Structural Response ........................... E-4 E.2.3 Collapse Fragility .............................................................. E-7 E.2.4 Inventory of Damageable Components and Systems ...... E-12 E.2.5 Assessment Results ......................................................... E-13 E.3 Quantitative Assessment of the Office Building .......................... E-14 E.3.1 Hazard Curve .................................................................. E-14 E.3.2 Characterization of Structural Response ......................... E-15 E.3.3 Collapse Fragility ............................................................ E-15 E.3.4 Inventory of Damageable Components and Systems ...... E-16 E.3.5 Assessment Results ......................................................... E-16 E.4 Quantitative Assessment of the Hospital Building ....................... E-18 E.4.1 Hazard Curve .................................................................. E-18 E.4.2 Characterization of Structural Response ......................... E-18 E.4.3 Collapse Fragility ............................................................ E-19 E.4.4 Inventory of Damageable Components and Systems ...... E-19 E.4.5 Assessment Results ......................................................... E-19
References ........................................................................... F-1
Project Participants ............................................................... G-1

GCR 14-917-26 List of Figures xv
List of Figures
Figure 2-1 Map of Memphis showing location of building sites ...................... 2-5
Figure 2-2 Map showing values of seismic parameter, Aa ............................... 2-6
Figure 3-1 Plan of apartment building .............................................................. 3-2
Figure 3-2 Plan of typical apartment unit at east or west end (1 of 7 unit types) ............................................................................ 3-2
Figure 3-3 Longitudinal elevation of apartment building ................................. 3-3
Figure 3-4 Transverse elevation of apartment building .................................... 3-3
Figure 3-5 Foundation at exterior wall of apartment building .......................... 3-3
Figure 3-6 Foundation at interior wall of apartment building .......................... 3-4
Figure 3-7 Typical apartment unit floor framing plan ...................................... 3-5
Figure 3-8 Transverse section of apartment building ....................................... 3-5
Figure 3-9 Section at typical bearing party wall ............................................... 3-6
Figure 3-10 Section at corridor wall ................................................................... 3-6
Figure 3-11 Plan of shear walls (northwest corner) for wind design .................. 3-8
Figure 3-12 Plan of shear walls (northeast corner) for wind design ................... 3-9
Figure 3-13 Plan of shear walls (southwest corner) for wind design ................. 3-9
Figure 3-14 Plan of shear walls (southeast corner) for wind design ................ 3-10
Figure 3-15 Plan of shear walls (northwest corner) for current national seismic code design ...................................................................... 3-13
Figure 3-16 Plan of shear walls (northeast corner) for current national seismic code design ...................................................................... 3-13
Figure 3-17 Plan of shear walls (southwest corner) for current national seismic code design ...................................................................... 3-14
Figure 3-18 Plan of shear walls (southeast corner) for current national seismic code design ...................................................................... 3-14
Figure 3-19 Pushover curve and trilinear approximation for current national seismic code design of apartment building, north- south direction ............................................................................... 3-18
Figure 3-20 Comparison of annualized losses for the apartment building, as a ratio of annualized losses for the wind design ........................... 3-19

xvi List of Figures GCR 14-917-26
Figure 4-1 Office building foundation plan showing brace layout for wind design ..................................................................................... 4-2
Figure 4-2 Office building braced frame elevations for: (a) wind design; and (b) current local seismic code design ........................... 4-4
Figure 4-3 Office building foundation plan showing brace layout for current local seismic code design .................................................... 4-5
Figure 4-4 Office building foundation plan showing brace layout for current national seismic code design ............................................... 4-7
Figure 4-5 Comparison of annualized losses for the office building, as a ratio of annualized losses for the wind design ....................... 4-11
Figure 5-1 Basic foundation plan for retail building (all designs) .................... 5-2
Figure 5-2 Basic roof framing plan for retail building (all designs) ................. 5-2
Figure 5-3 Elevation of north and south (side) walls of the retail building (all designs) ..................................................................................... 5-4
Figure 5-4 Elevation of west (front) and east (rear) walls of the retail building (all designs) ....................................................................... 5-5
Figure 6-1 Basic foundation plan for warehouse building (all designs) ........... 6-2
Figure 6-2 Basic roof framing plan for warehouse building (all designs) ........ 6-3
Figure 6-3 Elevation of north (side) wall of the warehouse building (all designs) ..................................................................................... 6-5
Figure 6-4 Elevation of west (front) and east (rear) walls of the warehouse building (all designs) ..................................................... 6-5
Figure 6-5 Elevation of steel braced frame of the warehouse building: (a) wind and current local seismic code design; and (b) current national seismic code design ........................................................... 6-6
Figure 7-1 Hospital building foundation plan showing brace layout for wind design ................................................................................ 7-2
Figure 7-2 Hospital building braced frame elevations for: (a) wind design; and (b) current local seismic code design ........................... 7-4
Figure 7-3 Hospital building foundation plan showing brace layout for seismic designs ................................................................................ 7-5
Figure 7-4 Comparison of annualized losses for the hospital building, as a ratio of annualized losses for the wind design ....................... 7-10
Figure 8-1 School general building plan ........................................................... 8-2
Figure 8-2 South elevation of school building .................................................. 8-2
Figure 8-3 Foundation at exterior wall of school building ............................... 8-3

GCR 14-917-26 List of Figures xvii
Figure 8-4 Floor to shear wall connection for school building ......................... 8-4
Figure 8-5 Roof deck to shear wall connection for school building ................. 8-4
Figure 8-6 Joist bearing detail at roof of school building ................................. 8-5
Figure A-1 Pie chart showing occupancy type by count, all years ................... A-2
Figure A-2 Pie chart showing occupancy type by count, since 1990 ............... A-2
Figure A-3 Pie chart showing occupancy type by floor area, all years ............ A-3
Figure A-4 Pie chart showing occupancy type by floor area, since 1990 ........ A-3
Figure A-5 Pie chart showing occupancy type by value, all years ................... A-4
Figure A-6 Pie chart showing occupancy type by value, since 1990 ............... A-4
Figure A-7 Pie chart showing structure type by count, all years. ..................... A-5
Figure A-8 Pie chart showing structure type by count, since 1990. ................. A-5
Figure A-9 Pie chart showing structure type by floor area, all years. .............. A-6
Figure A-10 Pie chart showing structure type by floor area, since 1990. .......... A-6
Figure A-11 Pie chart showing structure type by value, all years ...................... A-7
Figure A-12 Pie chart showing structure type by value, since 1990. ................. A-7
Figure A-13 Pie chart showing number of stories by count, all years ................ A-8
Figure A-14 Pie chart showing number of stories by count, since 1990. ........... A-8
Figure A-15 Pie chart showing number of stories by area, all years. ................. A-9
Figure A-16 Pie chart showing number of stories by area, since 1990 .............. A-9
Figure A-17 Pie chart showing number of stories by value, all years. ............. A-10
Figure A-18 Pie chart showing number of stories by area, since 1990. ........... A-10
Figure B-1 Map of Memphis showing location of building sites ...................... B-2
Figure B-2 Soil profile at the site of the apartment building ............................. B-4
Figure B-3 Soil profile at the site of the office building ................................... B-6
Figure B-4 Soil profile at the site of the retail building .................................... B-8
Figure B-5 Soil profile at the site of the hospital building .............................. B-11
Figure B-6 Soil profile at the site of the school building ................................ B-13
Figure C-1 Apartment building component cost summary for wind design (ASCE/SEI 7-05) ................................................................. C-2
Figure C-2 Apartment building component cost summary for current local seismic code design (1999 SBC) ............................................ C-3

xviii List of Figures GCR 14-917-26
Figure C-3 Apartment Building Component Cost Summary for Current National Seismic Code Design (ASCE/SEI 7-10) ......................... C-4
Figure C-4 Office building component cost summary for wind design (ASCE/SEI 7-05)............................................................................ C-6
Figure C-5 Office building component cost summary for current local seismic code design (1999 SBC) .................................................... C-7
Figure C-6 Office building component cost summary for current national seismic code design (ASCE/SEI 7-10) ............................. C-8
Figure C-7 Retail building component cost summary for wind design (ASCE/SEI 7-05).......................................................................... C-10
Figure C-8 Retail building component cost summary for current local seismic code design (1999 SBC) ............................................................... C-11
Figure C-9 Retail building component cost summary for current national seismic code design (ASCE/SEI 7-10) ........................... C-12
Figure C-10 Warehouse building component cost summary for wind design (ASCE/SEI 7-05) .............................................................. C-14
Figure C-11 Warehouse building component cost summary for current local seismic code design (1999 SBC) ......................................... C-15
Figure C-12 Warehouse building component cost summary for current national seismic code design (ASCE/SEI 7-10) ........................... C-16
Figure C-13 Hospital building component cost summary for wind design (ASCE/SEI 7-05) .............................................................. C-18
Figure C-14 Hospital building component cost summary for current local seismic code design (2003 IBC) .......................................... C-19
Figure C-15 Hospital building component cost summary for current national seismic code design (ASCE/SEI 7-10) ........................... C-20
Figure C-16 School building component cost summary for wind design (ASCE/SEI 7-05).......................................................................... C-22
Figure C-17 School building component cost summary for current local seismic code design (1999 SBC) ......................................... C-23
Figure C-18 School building component cost summary for current national seismic code design (ASCE/SEI 7-10) ........................... C-24
Figure E-1 Seismic hazard curve for the apartment building with a fundamental period of 0.39 seconds ............................................... E-5
Figure E-2 Shear force versus drift ratio curves for structural sheathing materials with high-displacement capacity .................................... E-6
Figure E-3 Shear force versus drift ratio curves for sheathing materials with low-displacement capacity ..................................................... E-6
GCR 14-917-26 List of Figures xix
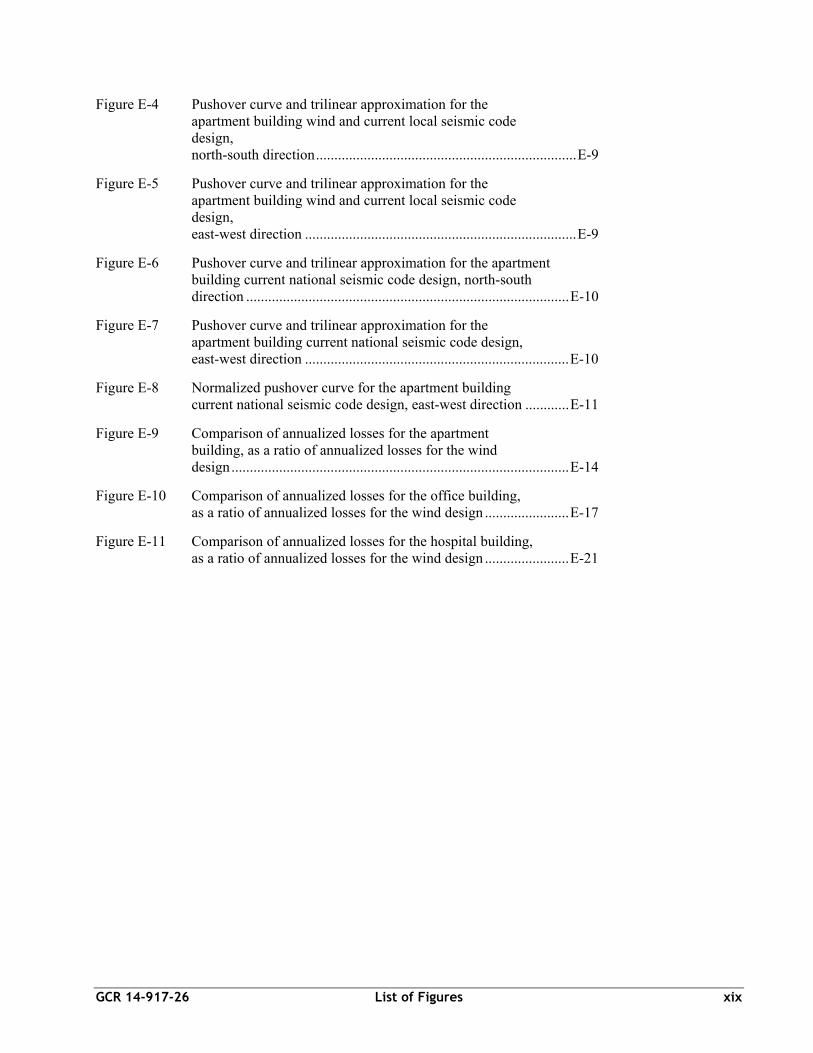
Figure E-4 Pushover curve and trilinear approximation for the apartment building wind and current local seismic code design, north-south direction ....................................................................... E-9
Figure E-5 Pushover curve and trilinear approximation for the apartment building wind and current local seismic code design, east-west direction .......................................................................... E-9
Figure E-6 Pushover curve and trilinear approximation for the apartment building current national seismic code design, north-south direction ........................................................................................ E-10
Figure E-7 Pushover curve and trilinear approximation for the apartment building current national seismic code design, east-west direction ........................................................................ E-10
Figure E-8 Normalized pushover curve for the apartment building current national seismic code design, east-west direction ............ E-11
Figure E-9 Comparison of annualized losses for the apartment building, as a ratio of annualized losses for the wind design ............................................................................................ E-14
Figure E-10 Comparison of annualized losses for the office building, as a ratio of annualized losses for the wind design ....................... E-17
Figure E-11 Comparison of annualized losses for the hospital building, as a ratio of annualized losses for the wind design ....................... E-21


GCR 14-917-26 List of Tables xxi
List of Tables
Table ES-1 Summary of Construction Cost Ratios and Cost Premiums at Three Design Levels .................................................................... vii
Table ES-2 Summary of Construction Cost Ratios and Cost Premiums for Seismic Design Levels .............................................................. viii
Table 2-1 Rank Order of the Most Prevalent Occupancy Types ..................... 2-2
Table 2-2 Rank Order of the Most Prevalent Structure Types ........................ 2-3
Table 2-3 Percentage of Buildings by Number of Stories ............................... 2-4
Table 2-4 Summary of Buildings Selected for Study ...................................... 2-4
Table 2-5 Seismic Ground Motion Parameters ............................................... 2-7
Table 2-6 Site Class and Allowable Soil Bearing Pressure Values ................. 2-7
Table 2-7 Ratios of Ground Motion Acceleration ......................................... 2-11
Table 3-1 Base Shear and Cost Comparisons between the Apartment Building Wind and Seismic Designs ............................................ 3-15
Table 3-2 Base Shear and Cost Comparisons between the Apartment Building Seismic Designs ............................................................. 3-16
Table 4-1 Base Shear and Cost Comparisons between the Office Building Wind and Seismic Designs .............................................. 4-8
Table 4-2 Base Shear and Cost Comparisons between the Office Building Seismic Designs ............................................................... 4-8
Table 5-1 Base Shear and Cost Comparisons between the Retail Building Wind and Seismic Designs .............................................. 5-9
Table 5-2 Base Shear and Cost Comparisons between the Retail Building Seismic Designs ............................................................. 5-10
Table 6-1 Base Shear and Cost Comparisons between the Warehouse Building Wind and Seismic Designs ............................................ 6-11
Table 6-2 Base Shear and Cost Comparisons between the Warehouse Building Seismic Designs ............................................................. 6-12
Table 7-1 Base Shear and Cost Comparisons between the Hospital Building Wind and Seismic Designs .............................................. 7-7
Table 7-2 Base Shear and Cost Comparisons between the Hospital Building Seismic Designs ............................................................... 7-8
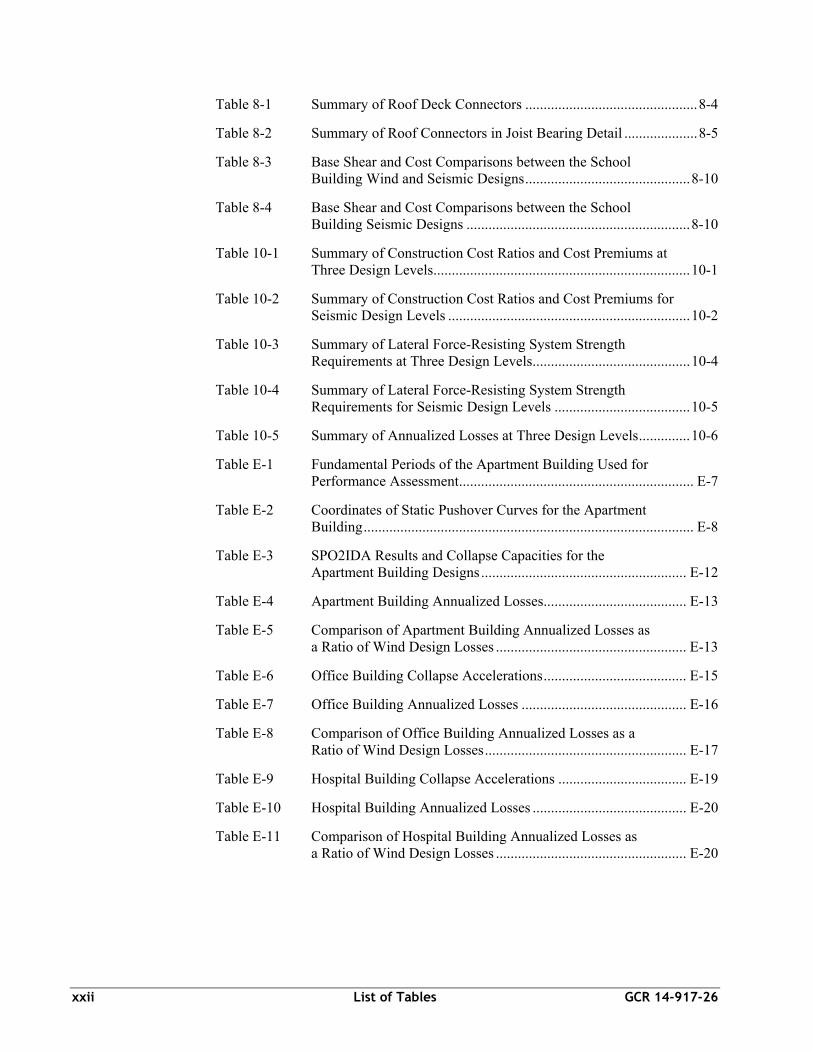
xxii List of Tables GCR 14-917-26
Table 8-1 Summary of Roof Deck Connectors ............................................... 8-4
Table 8-2 Summary of Roof Connectors in Joist Bearing Detail .................... 8-5
Table 8-3 Base Shear and Cost Comparisons between the School Building Wind and Seismic Designs ............................................. 8-10
Table 8-4 Base Shear and Cost Comparisons between the School Building Seismic Designs ............................................................. 8-10
Table 10-1 Summary of Construction Cost Ratios and Cost Premiums at Three Design Levels ...................................................................... 10-1
Table 10-2 Summary of Construction Cost Ratios and Cost Premiums for Seismic Design Levels .................................................................. 10-2
Table 10-3 Summary of Lateral Force-Resisting System Strength Requirements at Three Design Levels ........................................... 10-4
Table 10-4 Summary of Lateral Force-Resisting System Strength Requirements for Seismic Design Levels ..................................... 10-5
Table 10-5 Summary of Annualized Losses at Three Design Levels .............. 10-6
Table E-1 Fundamental Periods of the Apartment Building Used for Performance Assessment ................................................................ E-7
Table E-2 Coordinates of Static Pushover Curves for the Apartment Building .......................................................................................... E-8
Table E-3 SPO2IDA Results and Collapse Capacities for the Apartment Building Designs ........................................................ E-12
Table E-4 Apartment Building Annualized Losses....................................... E-13
Table E-5 Comparison of Apartment Building Annualized Losses as a Ratio of Wind Design Losses .................................................... E-13
Table E-6 Office Building Collapse Accelerations ....................................... E-15
Table E-7 Office Building Annualized Losses ............................................. E-16
Table E-8 Comparison of Office Building Annualized Losses as a Ratio of Wind Design Losses ....................................................... E-17
Table E-9 Hospital Building Collapse Accelerations ................................... E-19
Table E-10 Hospital Building Annualized Losses .......................................... E-20
Table E-11 Comparison of Hospital Building Annualized Losses as a Ratio of Wind Design Losses .................................................... E-20

GCR 14-917-26 1: Introduction 1-1
Chapter 1
Introduction
The cost premium for earthquake-resistant construction is of great interest in regions
that have significant seismic hazard but have not suffered serious damage from
earthquakes in the memories of people now living. The middle Mississippi River
Valley was struck by very large earthquakes in 1811 and 1812, and scientific study
has found evidence of multiple large earthquakes prior to that. This indicates that the
risk for loss of human life due to earthquake hazard in the region is high. This
inference is confirmed by hazard assessment information based on expert consensus
studies conducted by leading seismologists who are engaged with the U.S.
Geological Survey. Based on risk to life-safety, the hazard is very similar to coastal
California, but there have been essentially no damaging earthquakes to remind the
populace of the hazard. This understandably leads to questions about the value (cost)
of including earthquake-resistant construction requirements in the local building
codes.
1.1 Previous Work
In the early 1980s, the Federal Emergency Management Agency (FEMA) supported
a study by the Building Seismic Safety Council (BSSC) examining costs associated
with implementing the emerging seismic design provisions of the time (Weber, 1985;
NBS, 1982). This study was part of a program in which 52 hypothetical buildings
located in seven cities across the nation were examined. Seismic hazard levels varied
from high to low. The study was stimulated by the availability of a new set of
provisions proposed for earthquake-resistant design and construction of buildings.
Local engineering firms in each city were retained to perform the designs and cost
estimates.
Six of the buildings were located in Memphis. These included a 10-story steel frame
apartment building, a 10-story steel frame office building, a 5-story and a 10-story
concrete apartment building, a 2-story masonry commercial building, and a 1-story
steel and precast warehouse. The buildings were designed by two Memphis
engineering firms. The overall increase in construction cost for all 52 buildings was
projected to be 1.6% on average, but the increase in Memphis was projected to be
5.2%, the highest increase of any of the cities considered in the study. It was
suggested that a possible reason for this increase was that designs were not optimized
for construction costs in cities where there was little prior experience with seismic
design.

1-2 1: Introduction GCR 14-917-26
In 1998, a follow-on study limited to costs (BSSC, 2000) focused on cast-in-place
concrete buildings. This study projected an increase in construction costs in
Memphis that was more in line with the previous national average (i.e., close to
1.6%). In 2004, BSSC completed a study documenting differences in structural
material quantities, which did not consider costs (not published). No other similar
studies are known to have been accomplished since then, and no other reports on this
subject are known to be available in the published literature.
1.2 Project Objectives and Scope
In 2010, the National Institute of Standards and Technology (NIST) initiated this
project to investigate cost premiums associated with earthquake-resistant building
construction in the middle Mississippi River Valley region, and to investigate the
benefits expected from instituting modern building code provisions for seismic
safety. The scope of this study was focused on engineered buildings that require the
application of model building code provisions, and excluded one- and two-family
homes as well as non-building structures.
Case study buildings were selected to be representative of future construction
expected to occur in the Memphis, Shelby County metropolitan area. Designs, cost
estimates, and relative benefits were compared among three design levels: (1) with a
design basis in Memphis assuming there was no seismic requirements in the local
building code; (2) a design basis conforming to the current local building code of
Memphis and Shelby County; and (3) a design basis conforming to the current
national model code, which was under consideration as the basis for the future
building code in Memphis and Shelby County at the time of this study.
1.3 Conduct of the Project
Cost premiums were developed by comparing building design requirements in
national model codes and current local codes, both with and without seismic
requirements, and by developing structural designs and construction cost estimates
for selected representative building types.
Selection of building types for this study was initiated by an analysis of construction
data for Shelby County, Tennessee, provided by the NIST Applied Economics
Office. These data covered building information from several decades, ranging from
1940 to 2007. The project team, with the assistance of Memphis-area professionals,
analyzed this data set and projected future expectations based on observations of
current construction practice in the region. Six building types were selected for
study: a three-story apartment, a four-story office, a one-story retail, a one-story
warehouse, a six-story hospital, and a two-story elementary school. Each design was
configured to be a realistic building in terms of size, structural system, and location
within the Memphis, Shelby County metropolitan area.

GCR 14-917-26 1: Introduction 1-3
The following three designs were developed for each of the six building types:
1. A design developed without consideration of any specified seismic hazard, but
with a lateral force-resisting system in conformance with requirements for wind
load based on ASCE/SEI 7-05, Minimum Design Loads for Buildings and Other
Structures (ASCE, 2006). This wind load is consistent with recent and projected
future building codes in Memphis.
2. A design developed based on current local building code provisions. At the time
this study was performed, Memphis and Shelby County were in the process of
adopting a new local building code, but the implementation of the structural
provisions of that code was delayed pending resolution of local application of
seismic design provisions. Thus for structural design purposes, the current local
Memphis and Shelby County Building Code1 used in this study is based upon the
2003 edition of the International Building Code (ICC, 2003), with a local
amendment permitting seismic design based on the 1999 Standard Building Code
(SBCCI, 1999), except for hospitals and other essential facilities. In the case of
hospitals and other essential facilities, this code requires compliance with the
seismic provisions of the 2003 International Building Code, which essentially
results in hospital designs consistent with current national seismic requirements.
3. A design developed based on ASCE/SEI 7-10, Minimum Design Loads for
Buildings and Other Structures (ASCE, 2010), which is the current national
standard for earthquake-resistant design, and is also the basis of the structural
provisions of the 2012 edition of the International Building Code (ICC, 2012)2.
In a few cases, the lateral strength required for seismic design was less than that
required for code-specified wind design. This is not unexpected for lightweight
construction, especially with large horizontal dimensions. In such cases, the design
strength for the lateral force-resisting system was not reduced. For these buildings
wind load cases governed the minimum design strength; however, the seismic system
selection and detailing provisions of the pertinent seismic code were followed.
Seismic design experience was judged to be most critical in developing efficient
designs. As a result, teams performing the structural design work included firms
from California and Colorado. The resulting designs and cost estimates were
extensively reviewed by Memphis-area professionals, who were consulted at length
about local codes and design practices for each building type.
1 On October 1, 2013, Memphis and Shelby County approved the 2012 International Building Code (ICC, 2012), including the seismic design provisions, as the basis of the local Memphis and Shelby County building code. 2 With adoption of the 2012 IBC, the structural and seismic design provisions of local Memphis and Shelby County building code are now based on ASCE/SEI 7-10, the national standard for earthquake-resistant design. The comparative design studies in this report serve to illustrate the effect of this change.

1-4 1: Introduction GCR 14-917-26
Cost data are based on competitively procured prices in the Memphis, Shelby County
metropolitan area market during the fourth quarter of 2012. Quantities and materials
were selected to represent building practices typical of the region, at an overall mid-
level of quality, which is consistent with the objective to determine an average
overall cost impact. The quantities and materials assumed in the estimates were
reviewed by local design and construction professionals.
Estimates include costs for structural systems and nonstructural systems, including
equipment and architectural finishes that would be provided as part of the core and
shell. Estimates consider costs for building construction only, excluding costs related
to site development and utilities. These excluded costs are considered relatively
constant for different structural designs. In the case of commercial buildings,
estimates exclude costs for items that would normally be associated with tenant
improvements. The estimates include an allowance for contingencies that might be
missed in the preliminary design of nonstructural aspects of the buildings. Costs
associated with design, testing, and inspection services are also excluded, except for
special inspections associated with seismic design requirements. Cost increases
associated with additional design effort or temporary learning curve issues are
similarly excluded.
Benefits are assessed based on relative performance of the building designs. A
benefits analysis is provided for each building by qualitatively comparing
performance based on relative design strengths, code detailing requirements, and the
judgment of engineers familiar with the performance of modern building construction
in strong earthquake shaking. In addition, three of the buildings were subjected to a
quantitative assessment of benefits by comparing probabilistic earthquake losses in
terms of relative potential for building collapses, casualties, and repair costs.
1.4 Report Organization and Content
This report presents the process and findings from a study of the cost and benefits of
earthquake-resistant construction in the Memphis, Shelby County metropolitan area.
Chapter 2 describes the selection criteria for building locations, structure types, local
soil conditions, design criteria, cost estimation criteria, and assessment of benefits.
Chapter 3 describes the three levels of design for the apartment building, summarizes
the total cost of the building designs, and provides a comparison of the expected
seismic performance.
Chapter 4 describes the three levels of design for the office building, summarizes the
total cost of the building designs, and provides a comparison of the expected seismic
performance.
GCR 14-917-26 1: Introduction 1-5
Chapter 5 describes the three levels of design for the retail building, summarizes the
total cost of the building designs, and provides a comparison of the expected seismic
performance.
Chapter 6 describes the three levels of design for the warehouse building,
summarizes the total cost of the building designs, and provides a comparison of
expected the seismic performance.
Chapter 7 describes the three levels of design for the hospital building, summarizes
the total cost of the building designs, and provides a comparison of the expected
seismic performance.
Chapter 8 describes the three levels of design for the school building, summarizes the
total cost of the building designs, and provides a comparison of the expected seismic
performance.
Chapter 9 describes the basis of the costs estimated for each of the buildings.
Chapter 10 summarizes the cost analyses and benefit studies conducted.
Appendix A provides additional information on the historical building construction
data.
Appendix B provides detailed information regarding geology of the general area and
specific building sites.
Appendix C provides the basis for developing the cost models for each of the
buildings related to building construction and a summary of the cost data developed.
Appendix D provides a list of design drawings available for each building. The
design drawings are provided in a separate electronic document available as a
companion volume to this report.
Appendix E provides information on the basis of the quantitative performance
assessment methodology, presents the building-specific information used as inputs to
the methodology, and summarizes results.
References cited and a list of project participants are also provided at the end of this
report.


GCR 14-917-26 2: Scope and Criteria 2-1
Chapter 2
Scope and Criteria
This chapter summarizes the information used for selecting building types and design
criteria considered in this study. In addition, information used for foundation design,
cost estimation, and benefits analysis is also summarized.
2.1 Selection of Building Types and Structural Systems
Over 40 counties, including over 300 local jurisdictions in Mississippi, Tennessee,
Arkansas, Missouri, Kentucky, Illinois, and Indiana are located within the New
Madrid seismic zone and face ground motions that are comparable to those that
trigger the highest seismic design requirements on the West Coast of the United
States. The Memphis, Shelby County metropolitan area was selected for this study
because Memphis is a large city and a national distribution hub located in this region.
In order to quantify the cost premium associated with earthquake-resistant
construction in the region, it is necessary to predict the types of construction expected
in the future. Recent history is a good indicator for the future, but it requires
interpretation and judgment.
Building types for study were selected using a database provided by the NIST Office
of Applied Economics. Provided data were arranged in 21 occupancy types, 11
structure types, and 5 height ranges, and ranked by total number of buildings (count),
total square feet of floor area (area), and total replacement cost (value), by decade,
between 1940 and 2007. One- and two-family homes were excluded from the
database. Table 2-1 provides the rank order of the most prevalent occupancy types
derived from the data. A more detailed abstract of the data is presented in
Appendix A.
The four occupancy types that represent the highest number of buildings in the area
can be described as developer-driven projects, in which the initial cost of
construction is considered to be more important than the life-cycle cost of a project.
These four occupancy types (multi-family, warehouse, retail, and office) were
selected for study.
Although trends in more recent years are considered more relevant to future
predictions, the data for schools represent an anomaly because local school districts
occasionally experience long intervals between school construction programs. Thus,
for the school occupancy, rankings by total floor area (5) and replacement value (4)
Building Selection Buildings were selected to be representative of future construction based upon historical data and local knowledge of current trends.

2-2 2: Scope and Criteria GCR 14-917-26
over a longer period of time were considered more meaningful for identifying future
long-term trends. Accordingly, the study included a school building in addition to
the four top-ranked occupancy types. A hospital building was also included in the
study because hospital construction provides an opportunity to examine the impact of
more stringent seismic design requirements placed upon essential facilities.
Table 2-1 Rank Order of the Most Prevalent Occupancy Types
Occupancy Type
From 1940 to 2007 From 1990 to 2007
Count(1) Area(2) Value(3) Count(1) Area(2) Value(3)
Multi-family 1 2 1 1 2 2
Warehouse 2 1 2 2 1 1
Retail 3 3 5 3 3 4
Office 4 4 3 4 4 3
School 12 5 4 15 19 18
Notes: (1) Rank based on total number of buildings
(2) Rank based on total square feet of floor area
(3) Rank based on total replacement cost
The provided data, sorted by structure type, were not specific enough because the
descriptor for each category did not always clearly indicate the type of lateral force-
resisting system that would be present in buildings of that category. The 11 structure
type categories provided in the database, together with interpretive comments, are
provided for reference:
1. Wood, light frame: The lateral force-resisting system for this structure type is
composed mostly of sheathing products nailed to wall frames of dimensional
lumber. Although traditionally the lateral force-resisting systems were composed
entirely of dimensional lumber, by the 1960s plywood was incorporated, and
today many engineered lumber products and factory-assembled components are
incorporated.
2. Wood frame, commercial: This category traditionally includes members larger
than in the previous category used for longer spans; today there is little difference
from the elements used in the previous category, except the spacing of interior
walls is greater.
3. Steel frame: This category does not distinguish between moment-resisting
frames and braced frames; in recent years braced frames have become the
predominant type of steel frame construction in Memphis.
4. Light metal frame: Existence of a significant number of such buildings in the
database from the 1940s leads to the assumption that this category is composed
of pre-engineered steel buildings that typically include welded, tapered plate

GCR 14-917-26 2: Scope and Criteria 2-3
girder frames and not the more current (and relatively new, especially in
Memphis) structures composed of light-gauge, cold-formed steel framing.
5. Concrete moment-resisting frame: Many of the older large buildings in the city
center are of this structure type, often with masonry infill walls at the perimeter.
This construction is not very common in recent years.
6. Concrete frame with shear wall: Many of the large concrete buildings
constructed after the 1960s are of such construction, but more recently steel
framing has become more popular.
7. Concrete, tilt-up: This structure type is popular for warehouse, light industry,
and large, single outlet retail (big box) occupancies; in some markets many such
buildings use masonry, but in Memphis tilt-up construction is the dominant
system for warehouses and retail.
8. Concrete, precast frame: The only fabrication plant for structural precast
concrete in the local area closed during the recent economic downturn.
9. Unreinforced masonry: This form of construction was replaced by reinforced
masonry in the 1970s.
10. Reinforced masonry: This form of construction first appeared in the 1960s.
11. Mobile homes: Given the exclusion of single-family homes from this database,
this category is assumed to be limited to temporary classrooms, construction site
offices, and other similar uses; the numbers are very small.
Table 2-2 presents the rank order of the top five structure types, based on total
number of buildings, total square feet of floor area, and total replacement cost from
1940 to 2007.
Table 2-2 Rank Order of the Most Prevalent Structure Types
Structure Type
From 1940 to 2007 From 1990 to 2007
Count(1) Area(2) Value(3) Count(1) Area(2) Value(3)
Wood 1 2 2 1 3 3
Steel 2 1 1 2 2 1
Masonry 3 4 5 3 4 4
Tilt-up 4 3 3 4 1 2
Concrete 5 5 4 5 6 5
Notes: (1) Rank based on total number of buildings
(2) Rank based on total square feet of floor area
(3) Rank based on total replacement cost

2-4 2: Scope and Criteria GCR 14-917-26
For the purpose of rank ordering shown in Table 2-2, the data for similar structure
types were combined as follows: (1) the two wood structure types were combined;
(2) the two steel structure types were combined; (3) the two cast-in-place concrete
structure types (moment-resisting frame and frame with shear wall) were combined;
and (4) the two masonry structure types were combined.
Table 2-3 shows a summary of the data by number of stories. Although one-story
construction is dominant, this study includes multistory buildings in recognition of
the type of construction likely to be used for each of the selected occupancy types.
Table 2-3 Percentage of Buildings by Number of Stories
Number of Stories
From 1940 to 2007 From 1990 to 2007
Count(1) Area(2) Value(3) Count(1) Area(2) Value(3)
1 63% 53% 43% 68% 68% 56%
2 32% 25% 30% 22% 14% 16%
3 4% 11% 13% 8% 10% 12%
4 to 9 1% 7% 10% 2% 7% 14%
10 and more 0% 4% 5% 0% 1% 1%
Notes: (1) Percentage based on total number of buildings
(2) Percentage based on total square feet of floor area
(3) Percentage based on total replacement cost
In order to select buildings and structural systems for study, prevalence as reflected
in Table 2-2 and Table 2-3, current construction trends, and consistency with the
selected occupancy types (multi-family apartment, office, retail, warehouse, hospital,
and school) were considered. Table 2-4 summarizes the six building types that were
selected for study.
Table 2-4 Summary of Buildings Selected for Study
Occupancy Type Basic Size Structural System
Lateral Force-Resisting System Remark
Apartment 3-story, 50 units Wood frame Wood frame walls Maximum size for no fire rating
Office 4-story Steel joists, beams, columns
Steel bracing Maximum size for one-hour fire rating
Retail 1-story, 40,000 sf Steel joists, tilt-up walls Tilt-up walls Typical big box retail
Warehouse 1-story, 400,000 sf Steel joists, tilt-up walls Tilt-up walls, steel bracing Includes expansion joint
Hospital 6-story, patient tower
Steel beams, girders, columns
Steel bracing Essential facility, but no operating suite in this tower
Elementary school
2-story Steel joists, masonry walls Masonry walls Includes gym and cafeteria

GCR 14-917-26 2: Scope and Criteria 2-5
As a result, one wood, one masonry, two steel, and two tilt-up lateral force-resisting
systems were selected. A cast-in-place concrete lateral force-resisting system was
strongly considered for the hospital, but the observed trend in recent years is that the
most modern hospitals in the area are being constructed using steel.
2.2 Building Locations and Site Specific Data
Currently, building development in Memphis, Shelby County metropolitan area is
most intense in the southern and eastern portions of the area. This study attempts to
be true to this trend, locating each building on sites where that type of construction
would be expected to occur, without regard to variation of seismic intensity in the
region. Based on the observed expansion of the residential population, the school
building was located in Desoto County, Mississippi.
The map in Figure 2-1 shows the selected locations of the six buildings in this study.
Precise building locations are needed to correctly determine the ground motion
parameters for design. In order to avoid any implication about an actual building
location, building sites in this study have been fictitiously located in the centers of
streets and highways.
Figure 2-1 Map of Memphis showing location of building sites (courtesy of University of Memphis).

2-6 2: Scope and Criteria GCR 14-917-26
The ground motion hazard varies significantly across the county. Figure 2-2 shows a
map of Shelby County overlaid with the seismic ground motion design parameter, Aa,
used in the current local code. The value at the southeastern corner of the county is
only 40% of the value at the northwestern corner, which is closer to the fault zone.
Figure 2-2 Map showing values of seismic parameter, Aa (map developed by the Center for Earthquake Research and Information, University of Memphis, 1996).
Table 2-5 lists the ground motion parameters used in this study. For the 1999
Standard Building Code (SBCCI, 1999) design, values for effective peak
acceleration, Aa, at each site are interpolated from Figure 2-1. Values for effective
peak velocity related acceleration, Av, at each site are interpolated from a similar
figure. In the case of the 2003 edition of the International Building Code (ICC,
2003) and ASCE/SEI 7-10, Minimum Design Loads for Buildings and Other
Structures (ASCE, 2010), values for 5%-damped spectral response acceleration
parameters based on the Maximum Considered Earthquake (MCE) at each site for
short (or 1-second) period, SS (or S1), are obtained using a framework developed by
the U.S. Geological Survey specifically for the purpose of providing ground motion
parameters for model building codes and standards in the United States. The
parameters are available at http://earthquake.usgs.gov/hazards/designmaps/. Values
for 5%-damped spectral response acceleration parameters based on the design
earthquake for short (or 1-second) period, SDS (or SD1), are computed according to
equations provided in the 2003 IBC or ASCE/SEI 7-10.
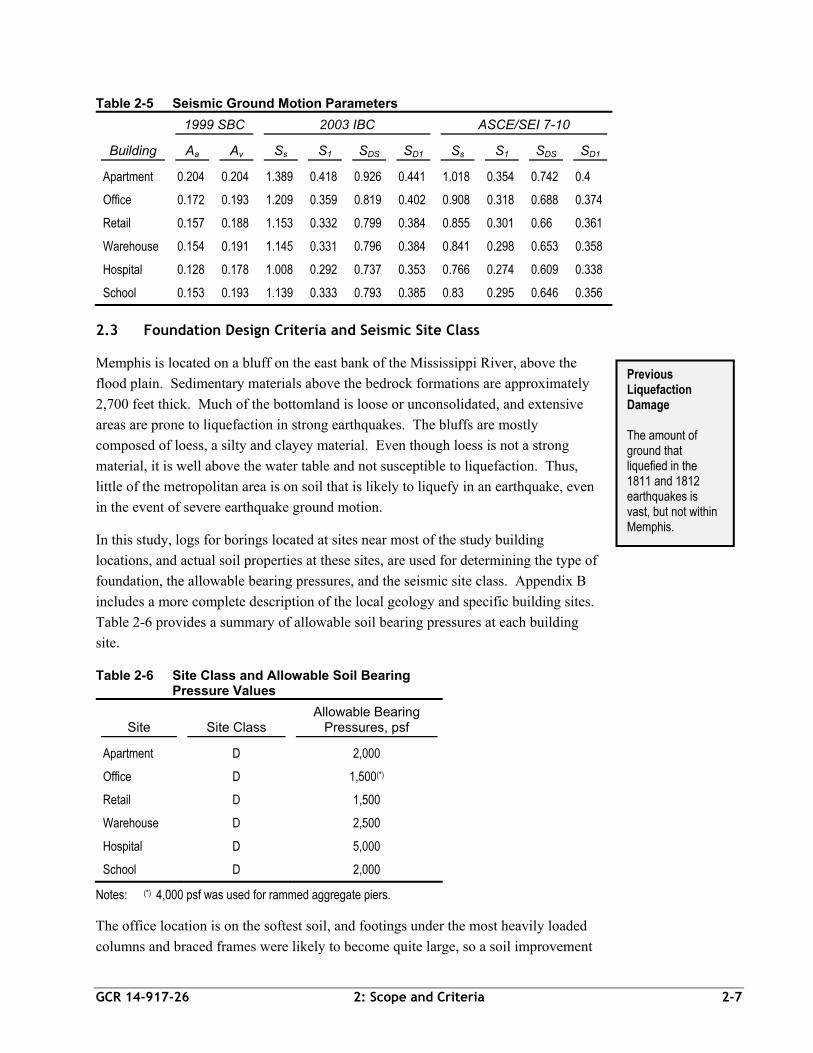
GCR 14-917-26 2: Scope and Criteria 2-7
Table 2-5 Seismic Ground Motion Parameters
1999 SBC 2003 IBC ASCE/SEI 7-10
Building Aa Av Ss S1 SDS SD1 Ss S1 SDS SD1
Apartment 0.204 0.204 1.389 0.418 0.926 0.441 1.018 0.354 0.742 0.4
Office 0.172 0.193 1.209 0.359 0.819 0.402 0.908 0.318 0.688 0.374
Retail 0.157 0.188 1.153 0.332 0.799 0.384 0.855 0.301 0.66 0.361
Warehouse 0.154 0.191 1.145 0.331 0.796 0.384 0.841 0.298 0.653 0.358
Hospital 0.128 0.178 1.008 0.292 0.737 0.353 0.766 0.274 0.609 0.338
School 0.153 0.193 1.139 0.333 0.793 0.385 0.83 0.295 0.646 0.356
2.3 Foundation Design Criteria and Seismic Site Class
Memphis is located on a bluff on the east bank of the Mississippi River, above the
flood plain. Sedimentary materials above the bedrock formations are approximately
2,700 feet thick. Much of the bottomland is loose or unconsolidated, and extensive
areas are prone to liquefaction in strong earthquakes. The bluffs are mostly
composed of loess, a silty and clayey material. Even though loess is not a strong
material, it is well above the water table and not susceptible to liquefaction. Thus,
little of the metropolitan area is on soil that is likely to liquefy in an earthquake, even
in the event of severe earthquake ground motion.
In this study, logs for borings located at sites near most of the study building
locations, and actual soil properties at these sites, are used for determining the type of
foundation, the allowable bearing pressures, and the seismic site class. Appendix B
includes a more complete description of the local geology and specific building sites.
Table 2-6 provides a summary of allowable soil bearing pressures at each building
site.
Table 2-6 Site Class and Allowable Soil Bearing Pressure Values
Site Site Class Allowable Bearing
Pressures, psf
Apartment D 2,000
Office D 1,500(*)
Retail D 1,500
Warehouse D 2,500
Hospital D 5,000
School D 2,000
Notes: (*) 4,000 psf was used for rammed aggregate piers.
The office location is on the softest soil, and footings under the most heavily loaded
columns and braced frames were likely to become quite large, so a soil improvement
Previous Liquefaction Damage The amount of ground that liquefied in the 1811 and 1812 earthquakes is vast, but not within Memphis.
2-8 2: Scope and Criteria GCR 14-917-26
technique known as rammed aggregate piers was specified to improve allowable
bearing pressures. Allowable bearing pressures at the hospital site are high because
the building is designed to have a full basement, and the soils improve significantly
with depth at that site. Soil bearing pressures used in the trial designs were rounded
from site specific values.
All sites were classified as having stiff soil (site class D). Mapped ground motions
are amplified in moderately stiff soils by approximately 10% to 20% at short periods
of vibration and by 70% to 80% percent at longer periods of vibration.
2.4 Design Criteria
Memphis and Shelby County, as well as much of the New Madrid seismic zone, have
been in transition regarding seismic provisions in building codes for nearly 40 years.
There has been significant debate as to whether the local building code should
contain any provision for seismic safety. Part of the debate concerns the financial
impact that such provisions might place on the community. This study is aimed at
quantifying the financial impact and potential benefits to help resolve that debate.
2.4.1 Overview
Nearly all cities and states in the United States enforce building codes. In general,
these jurisdictions do not write the technical provisions. Instead they rely upon
model building codes and voluntary national consensus standards. Today, the nearly
universal model building code in the United States is the 2012 edition of the
International Building Code (ICC, 2012), which in turn references many standards.
For structural loads, including wind and seismic provisions, the 2012 IBC makes
direct references to the standard, ASCE/SEI 7-10. The seismic provisions of
ASCE/SEI 7-10 are based on FEMA P-750, NEHRP Recommended Seismic
Provisions for New Buildings and Other Structures (FEMA, 2009b). New editions of
the IBC typically appear on a three-year cycle, whereas ASCE/SEI 7 is not updated
as often.
2.4.2 Local Code in Memphis
Memphis and Shelby County have a joint Office of Construction Code Enforcement.
Each jurisdiction adopts the Memphis and Shelby County Joint Building Code
(Shelby County Commission and Memphis City Council, 2005 and 2012), which
references a national model building code and contains local amendments. At the
time of this study, the current edition of the Memphis and Shelby County Joint
Building Code was the 2005 edition, and the national model code basis was the 2003
IBC, but the Memphis and Shelby County Joint Building Code contained an
exception that permitted structural engineering design to be based upon the
provisions of the 1999 SBC. The seismic provisions in the 1999 SBC are based on
the 1991 edition of NEHRP Recommended Provisions and do not reflect changes

GCR 14-917-26 2: Scope and Criteria 2-9
introduced in 1997 that effectively increased the strength demands on buildings in the
Memphis area. This exception was not permitted for several types of essential
facilities, including hospitals. In late 2012, the Memphis and Shelby County Joint
Building Code was updated to cite the 2009 edition of the International Building
Code (ICC, 2009) for all except structural provisions, which were to be based upon
the 2012 IBC. However, the implementation of these new structural provisions has
been delayed. Thus the seismic provisions of the “current” local building code used
in this study are based on the 2003 IBC for essential facilities and the 1999 SBC for
all other buildings.
There have been many significant changes in the NEHRP Recommended Provisions
since the 1991 edition. Many of these result in structures that are better able to
withstand the damage inherent in repeated loading in excess of yield strength, and
several have changed the basic demand required for resistance to lateral loads. The
1994 edition of the NEHRP Recommended Provisions introduced a new method of
accounting for the amplifying effect of soft soils on ground motions, which raised the
strength demand for many low-rise buildings in the Memphis area by a modest
amount (generally 10% to 20%). The 1997 edition of the NEHRP Recommended
Provisions introduced ground motion maps based upon a longer time period, in large
part because many felt that the maps in earlier editions, which had not changed since
1976, severely underestimated the ground motions in the New Madrid seismic zone.
The new maps greatly increased the strength demands for buildings of all heights in
the Memphis area. The 2009 edition of the NEHRP Recommended Provisions
introduced a refinement in the ground motions intended to better reflect the risk over
the full range of seismic hazard (see Section 2.4.4).
2.4.3 Design Levels
Given the nature of the local debate on seismic provisions, and the national interest in
the general subject of cost premiums for earthquake-resistant design and
construction, the following three levels of design were considered for each building
in this study:
1. A design for lateral force based on wind, but ignoring any seismic requirements
(designated the “wind design”), providing an aseismic baseline for cost
comparisons.
2. A design based on the current local code1 for Memphis and Shelby County
(designated the “current local seismic code design”).
1 On October 1, 2013, Memphis and Shelby County approved the 2012 IBC, including the seismic provisions, as the basis of the local Memphis and Shelby County building code.

2-10 2: Scope and Criteria GCR 14-917-26
3. A design based on the most current model code for seismic requirements
(designated the “current national seismic code design”)2.
For wind designs, wind loads from ASCE/SEI 7-05, Minimum Design Loads for
Buildings and Other Structures (ASCE, 2006), are used. The 2010 edition of
ASCE/SEI 7 includes a substantial change in format for wind loads, and the
profession is not yet familiar with its use. In order to avoid the confusion that might
result from trying to explain those differences, ASCE/SEI 7-05 wind loads are used
in this study. In reality, the strength and stiffness of the lateral force-resisting system
that will result from application of the ASCE/SEI 7-10 wind loads would be
essentially the same as those developed from application of the ASCE/SEI 7-05 wind
loads, but different wind speeds and load factors are used.
For current local seismic code designs, all buildings (except the hospital) make use of
the alternative provision that allows use of the 1999 SBC as the basis for seismic
forces and design requirements. The hospital is designed for the requirements of the
2003 IBC. In the case where seismic design requires less strength or stiffness in the
lateral force-resisting system than the wind design, the quantities required for the
wind design are used (this is true in one direction for the apartment building);
however, the seismic system selection and detailing provisions of the pertinent
seismic code are followed. In the case where local state of practice is to use more
modern standards for design of the structural materials (e.g., concrete, steel, wood,
and masonry), these same modern standards were used in this study. This was the
case for the hospital, which uses a buckling-restrained braced frame system.
Although this particular system was not yet included in the 2003 IBC, buckling-
restrained braced frame systems have been used in several projects in the Memphis
area.
For current national seismic code design, seismic provisions are in accordance with
ASCE/SEI 7-10, which is directly referenced in the 2012 IBC for seismic design.
There is a significant difference in ground motions in the 2003 IBC and ASCE/SEI
7-10 when compared to the 1999 SBC. The difference in ground motion acceleration
varies with each site and each building, but in general the ratios are close, as shown
in Table 2-7 (the importance factor for schools and hospitals is not included in the
ratios in Table 2-7).
The actual base shear demands for each building are presented in the chapter
describing that building. There are many other differences that affect the design of
2 With adoption of the 2012 IBC, the structural and seismic design provisions of local Memphis and Shelby County building code are now based on ASCE/SEI 7-10, the national standard for earthquake-resistant design. The comparative design studies in this report serve to illustrate the effect of this change.

GCR 14-917-26 2: Scope and Criteria 2-11
the lateral force-resisting system for each building. These differences are described
in the chapter describing each building.
Table 2-7 Ratios of Ground Motion Acceleration
2003 IBC
to 1999 SBC ASCE/SEI 7-10
to 1999 SBC
Low-rise Buildings 1.8 to 2.1 1.5 to 1.9
Mid-rise Buildings 1.4 to 1.5 1.3 to 1.4
2.4.4 Seismic Design Parameters
Among the changes to the NEHRP Seismic Provisions since 1991, the seismic design
parameter that has changed the most for buildings in this study is the amplitude of
ground shaking. This parameter is composed of two fundamental parts: (1) the
amplitude of shaking expected if bedrock is present at the surface; and (2) the change
to that amplitude of shaking due to the presence of soil over the bedrock. For the
seismic codes considered, the amplitude of shaking at bedrock is adjusted by site
coefficients, Fa and Fv, for short-period (low-rise) and long period (taller) buildings,
respectively. The manner in which bedrock motion is specified changed between the
1999 SBC and the 2003 IBC, but this change is not responsible for much, if any, of
the change in the ground motion demand summarized in Table 2-7.
Ground motions are computed probabilistically by considering the key characteristics
(location, size, and rate of earthquake occurrence) of earthquake sources close
enough to cause shaking at a site and the attenuation (decay) of motion between the
source and the site. There is considerable uncertainty in all these factors. The
bedrock motions in the 1999 SBC are taken from maps developed in the middle
1970’s and documented in ATC-3-06, Tentative Provisions for the Development of
Seismic Regulations for Buildings (ATC, 1978). The bedrock motions in the 2003
IBC are taken from maps developed by the USGS in 1996, and the bedrock motions
in ASCE/SEI 7-10 are taken from maps developed by the USGS in 2008. The basic
methodology for probabilistic assessment of the hazard used in development of the
maps in the 1999 SBC did not include the variability in ground motion attenuation,
whereas the maps in the more recent codes include that variability.
The bedrock ground motion parameter for the 1999 SBC and the 2003 IBC are both
stated in terms of a level of ground motion expected to be exceeded with a given
probability. The bedrock ground motion in ASCE/SEI 7-10 is stated as a “risk-
targeted” motion. The difference is that ground motions in the older codes are based
upon a probability that the ground motion is exceeded, while ASCE/SEI 7-10 ground
motions are based upon a probability that an average building would collapse. The
probabilistic calculations for the risk-targeted motions are based upon a generic
structural fragility intended to represent average buildings designed according to the

2-12 2: Scope and Criteria GCR 14-917-26
new building code. The method was adopted to better represent the overall degree of
seismic hazard at a location, because it is influenced by the level of ground motion at
all probabilities of occurrence, rather than just the level previously selected for the
building code. In locations with frequent large earthquakes, this change did not have
a large effect, but in the New Madrid seismic zone, this change had the effect of
lowering the strength demands for new buildings by roughly 20%. In Memphis and
Shelby County, the ground motions associated with return intervals of 100 and 500
years are much smaller than those for a 2,500 year return interval, and the risk-
targeted motion is smaller than for a location in California with the same 2,500 year
motion.
Other important seismic design parameters specified in the codes include: (1) the
response modification factor, R, which is used to account for the ability of seismic-
force resisting systems to respond to earthquake shaking in a ductile manner without
loss of load-carrying capacity (the higher the R factor, the more ductile response); (2)
the overstrength factor, Ω0, which is used to account for the fact that the actual
seismic forces on some elements of a structure can significantly exceed those
indicated by analysis using the design seismic forces (most structural systems are
assigned a Ω0 value of 2 or 3); and (3) the deflection amplification coefficient, Cd,
which is used to adjust lateral displacements for the structure determined under the
influence of design seismic forces to the actual anticipated lateral displacement in
response to design earthquake shaking (the value of Cd is typically similar to the R
factor) (FEMA, 2010). These three factors all stem from the basic objective that
buildings will be damaged, but are intended to have a low likelihood of collapse,
should a large earthquake occur. This objective is adopted in the codes because it is
generally too expensive to design and construct buildings to resist large earthquakes
without damage. Changes in the value for the R factor can affect the structural
design for a building even more than changes in the ground motion parameters.
Some of the buildings in this study, notably the apartment building, illustrate this
point.
2.5 Development of Cost Estimates
In this study, total building construction costs are estimated, excluding any costs for
site construction, such as grading, landscaping, parking lots, buried utilities, and
private drives. Excavation for the foundation is included. Also excluded are “soft”
costs, such as pre-construction and post-construction costs (e.g., design fees,
furnishings, and tenant improvement costs), third-party inspection, and quality
assurance. One exception to this is costs for inspection that are driven by the seismic
requirements. Such costs are specifically included in the estimates when pertinent for
a particular structural system.

GCR 14-917-26 2: Scope and Criteria 2-13
Total building construction cost was selected as the basis for comparison rather than
structural cost alone (i.e., the cost of the structural framing and foundation). This
was done for two reasons. Seismic design of buildings also requires anchorage of
nonstructural components, such as walls that are not load bearing, certain types of
ceilings, heavy equipment (e.g., water heaters, transformers, boilers), as well as
detailing to accommodate structural deformation in elements that extend from floor
to floor, such as stairs and partitions. Costs for nonstructural anchorage would not be
reflected if the basis was structural costs alone. Also, in some buildings, the
distinction between structural and architectural components is not clear. For
example, gypsum wallboard in the apartment building is a key part of the lateral
force-resisting system but is not considered a structural component, and, thus would
not be included in the calculated structural costs. Details for how total building
construction costs were estimated are provided in Chapter 9, and dollar estimates are
included in Appendix C.
Structural costs were typically estimated from quantities provided on the structural
drawings for each design (Appendix D). Costs for nonstructural anchorage and
bracing were usually estimated on the basis of adjusted unit costs, but in some
instances specific amounts were entered in the estimate.
2.6 Assessment of Benefits
A typical cost-benefit analysis compares the present value of future returns with
present costs as an aid in making decisions on issues with long-term impacts. When
considering building code provisions for life safety, quantitative assessment of future
returns in terms of life safety have traditionally not been possible, and benefit
analyses have been more qualitative.
In this study, benefits are assessed based on relative performance between the
designs. For each building, an assessment of benefits is presented. Relative
performance is determined based on a qualitative comparison of relative design
strengths, code detailing requirements, and the judgment of engineers familiar with
the performance of modern building construction in strong earthquake shaking. It
includes consideration of differences among the three designs that, in the judgment of
the engineers preparing the designs, are likely to have the most impact on
performance in the event that strong ground shaking from an earthquake was to
occur.
Consideration of future returns can also include reduction or avoidance of future
losses. Future losses might include quantitative estimates of direct costs to repair
damage or rebuild buildings and infrastructure after an earthquake, or indirect costs
associated with economic recovery of a community, as well as fatalities and injuries.

2-14 2: Scope and Criteria GCR 14-917-26
In general, consideration of these types of future losses was beyond the scope of this
study.
The recently completed FEMA P-58-1 report, Seismic Performance Assessment of
Buildings, Volume 1 – Methodology (FEMA, 2012a), however, presents a new
methodology for quantitatively assessing the performance of buildings subjected to
earthquakes. The methodology probabilistically assesses performance in terms of
potential future losses including repair costs, repair time, and casualties. Use of this
methodology requires quantitative knowledge of ground shaking hazard, the response
of the structure to ground shaking, the building collapse fragility, an inventory of
damageable components and systems in the building (both structural and
nonstructural) and the likely costs to repair damage, and the population that occupies
the building over time. All this information must be characterized by both expected
values and uncertainties (or total dispersion) in these values. Computations are made
using an electronic Performance Assessment Calculation Tool (PACT), provided in
FEMA P-58-3, Seismic Performance Assessment of Buildings, Methodology and
Implementation, Volume 3 – Supporting Electronic Materials and Background
Documentation (FEMA, 2012c). PACT includes a database of fragility and
consequence data for selected structural systems and components, and performs
extensive Monte Carlo simulations to arrive at a probabilistic estimate of future
performance.
Fragility and consequence data currently available within PACT cover only some of
the structural and nonstructural systems that are present in the buildings selected for
this study. Such information remains under development for the other building
systems at this time. As a result, quantitative assessment of benefits is performed on
only the apartment building, the office building, and the hospital. Results are
presented in the chapters describing those three buildings, and additional detail is
provided in Appendix E.
Quantitative results presented in this report are generally stated in relative terms, to
emphasize differences among designs. No attempt is made to combine casualties
with economic loss, nor is any attempt made to assess indirect costs associated with
building downtime following an earthquake.
2.7 Summary
In this study, six buildings were each designed to three different levels of earthquake
resistance to study the effect of seismic provisions in building codes. The buildings
were selected to be a representative sample of building construction expected in the
near future in the Memphis, Shelby County metropolitan area. Each design was
configured to be a realistic building in terms of size, structural system, and location
within the metropolitan area. The base design is a building proportioned to resist

GCR 14-917-26 2: Scope and Criteria 2-15
gravity and wind forces only, with no consideration for seismic forces, the second
design includes seismic resistance as required by the current local building code, and
the third design conforms to the most current national seismic standard, as it would
apply in Memphis.
The study was configured to deliver designs for seismic building regulations that are
of reasonable economy. For each building, costs were estimated consistently and
rigorously for each of the three designs, and the benefits expected from improved
performance were qualitatively assessed. Both the designs and costs were reviewed
with local engineers, architects, and cost estimators for realism in the context of the
local market.


GCR 14-917-26 3: Apartment Building 3-1
Chapter 3
Apartment Building
This chapter compares relative construction costs associated with varying levels of
earthquake resistance for differing lateral force-resisting system designs of an
apartment building located in Memphis, Tennessee, and assesses the benefits of
improved seismic resistance. To make these comparisons, three different designs
were developed:
1. Wind design according to ASCE/SEI 7-05, Minimum Design Loads for Buildings
and Other Structures (ASCE, 2006),
2. Current local seismic code design according to the 1999 SBC, Standard Building
Code (SBCCI, 1999), and
3. Current national seismic code design according to ASCE/SEI 7-10, Minimum
Design Loads for Buildings and Other Structures (ASCE, 2010), which is the
basis for the 2012 edition of the International Building Code (ICC, 2012).
3.1 Building Description
The apartment is a three-story wood-framed building. The footprint of the building is
approximately 68 feet long in the north-south direction by 261 feet long in the east-
west direction, providing roughly 18,000 square feet per floor, for a total of 54,000
square feet of floor area. The building has fifty apartment units of seven different
types along a central corridor running the length of the building, as well as two stair
wells and an elevator. Appendix D provides a list of complete drawings available for
this building.
3.1.1 General
Figure 3-1 shows the plan of the building. Double lines indicate party walls between apartment units, and single lines indicate bearing walls. Figure 3-2 shows the plan of one of the seven apartment types, which is a corner unit. The building’s elevation and floor plan are the same in all three designs.
The typical floor-to-floor height is 10 feet 6 inches and the top of the sloping roof is located 42 feet 8 inches above the base. The roof has a four in twelve (4:12) pitch and is covered with metal roofing. Exterior walls are framed with 2x6 studs spaced at 16 inch centers. These walls are sheathed with 1/2 inch thick gypsum wallboard (GWB) on the interior and with 7/16 inch thick oriented strand board (OSB) and stucco on the exterior. The stucco includes synthetic stone at the first story. It should be noted that the use of synthetic stone on the first story and stucco on upper
Residential Construction Residential occupancies comprise over half of total building volume. This building shares some structural features with single family home construction, although many single family homes do not have engineered designs for lateral forces.

3-2 3: Apartment Building GCR 14-917-26
stories produces a slightly higher seismic demand than brick veneer on the first story and cement board panels on the upper stories, which is also a common exterior for such buildings. Figure 3-3 and Figure 3-4 show longitudinal and transverse elevations of the apartment building.
Figure 3-1 Plan of apartment building.
Figure 3-2 Plan of typical apartment unit at east or west end (1 of 7 unit types).
W/D is the laundry and WH is the water heater.
2
6
A J260'-7"
68'-1
"
ELEVATORSTAIRS
STAIRSEXTERIOR WALLS BEARING WALLS WITHIN UNITS
CORRIDOR
APT UNITS
BEDROOM 1
BEDROOM 2
KITCHEN
LIVING
CLOSET
CLOSETBATH
BATH
W/D WH
34'-0
"
34'-1112"
UNIT C3 ARCH PLAN-1 OF 7 UNITS
PARTY WALLCORRIDOR
PARTY WALL
EXTERIORWALL

GCR 14-917-26 3: Apartment Building 3-3
Figure 3-3 Longitudinal elevation of apartment building.
Figure 3-4 Transverse elevation of apartment building.
3.1.2 Foundations
All three designs use the same foundation system consisting of shallow reinforced
concrete spread footings. These foundations are cast integrally with a four inch thick
reinforced concrete slab-on-grade with welded wire fabric (WWF). The slab-on-
grade is located at the top of the foundation and supports interior load bearing walls
and exterior walls as shown in Figure 3-5 and Figure 3-6.
Figure 3-5 Foundation at exterior wall of apartment building.
1'-0"
2'-0
"
SILL PLATE FASTENER
WWF
EXTERIOR FINISH MATERIAL
9"
11
OPTIONALCONSTRUCTION
JOINT
68'-1"
PERFORATED EXTERIORSHEAR WALLS
30'-0
"

3-4 3: Apartment Building GCR 14-917-26
Figure 3-6 Foundation at interior wall of apartment building (A.B. is anchor bolt, and HD anchor is a holdown attached to the end post of a wall).
3.1.3 Gravity Framing System
All three designs use the same gravity framing system. Floors above the slab on
grade consist of 1 1/2 inch thick gypsum concrete topping on 3/4 inch thick tongue
and groove plywood or OSB sheathing, rated by APA-The Engineered Wood
Association (formerly the American Plywood Association (APA)). Floors are
supported on 18 inch deep wood trusses spaced at 24 inch centers. Trusses consist of
2x4 lumber connected with toothed steel plates and are supported by party, bearing,
and exterior walls that run in the north-south direction. At openings in the bearing
walls, short headers are dimensional lumber and longer spans are supported by
manufactured beams. Figure 3-7 shows a typical apartment unit with the truss
framing.
Roof sheathing is unblocked 15/32 inch thick plywood or OSB structural panels with
a span rating of 32/16. Roof framing consists of wood roof trusses spanning north-
south across the building and bearing on the corridor and exterior walls. Figure 3-8
shows a transverse section cut through the building that illustrates the gravity
framing.
4"8"
RE:PLAN
GWB OROSB W/ GWB
STUD WALL
BASE FASTENER
1" 312"31
2"
MIN
WWF
A.B.
HD ANCHOR

GCR 14-917-26 3: Apartment Building 3-5
Figure 3-7 Typical apartment unit floor framing plan.
Figure 3-8 Transverse section of apartment building.
Exterior walls are 2x6 studs at 16 inch centers, and interior wall are 2x4 studs at 12
inch or 16 inch centers, with multiple studs supporting beam reactions. Details of the
floor truss supports at party walls, which are typically shear walls, are shown in
Figure 3-9.
EXTERIOR WALL
PARTY WALLS
WOOD FLOOR TRUSSESAT 24 IN O.C.
CORRIDOR WALL
UNIT A5
HEADER
31
UNITSTYP
CORRIDOR
ROOFTRUSSES
FLOORTRUSSES
BEARINGWALL BEYOND

3-6 3: Apartment Building GCR 14-917-26
Figure 3-9 Section at typical bearing party wall.
Corridor floor framing consists of 2x10 joists at 16 inch centers with floor sheathing
doubled for acoustic and durability issues. Details of the floor and wall framing at
the corridor are shown in Figure 3-10.
Figure 3-10 Section at corridor wall.
STUD WALL
58" GWB OR
OSB W/ GWB
OSB SHEARPANEL
2x4 BLKG
GYPSUM CONCRETE
SHEATHINGCONTINUOUSOVER JOINT
2x10 TOP PL
1", RE:PLAN
WD FLRTRUSS
CORRIDOR
SHEATHINGEDGE NAILING
GLUE & SCREW
JOISTHANGER
2x10 LEDGER
SEE NAILING SCHED
GWB
WALL SHTHG
GWB ONACOUSTIC
FURRING
DROPPEDCEILING

GCR 14-917-26 3: Apartment Building 3-7
3.1.4 Lateral Force-Resisting System
The lateral force-resisting system includes wood-framed walls sheathed with either
wood structural panels rated for shear resistance or GWB panels. Floor and roof
diaphragms use nailed wood panel sheathing on the trusses. The diaphragms and
exterior wall construction are the same in the three designs, except some holdown
anchors and a closer spacing of edge nails are required at exterior walls for the
current national seismic code design.
For the wind and current local seismic code designs, interior shear walls of the lateral
force-resisting system consist mostly of 1/2 inch thick, unblocked GWB, with 5/8
inch thick, unblocked GWB used for corridor walls (primarily for acoustic control).
For most shear walls, GWB panels are attached with 6d cooler nails at 7 inch centers.
For all designs, the resistance provided by the stucco and the GWB on the interior
face of the exterior walls is ignored in the design of the lateral force-resisting system.
In the current national seismic code design, for the interior walls sheathed with OSB,
the GWB covering the OSB and the GWB on the far face of the wall (where it exists)
are also ignored. Additionally, the GWB on the corridor face of the corridor walls is
ignored in all designs because it is mounted on resilient channels for acoustic
isolation.
The diaphragms are considerably stiffer than the shear walls, so the analysis for all
lateral loads is performed assuming rigid diaphragm behavior. The effect of the
gypsum concrete topping on the diaphragm is ignored. For distributing the design
forces, wall stiffness is computed using only the sheathing designated for design,
ignoring the other materials.
3.2 Wind Design
For wind design, lateral forces are in accordance with ASCE/SEI 7-05. The following factors were considered in the design:
Occupancy category: II
Importance factor: I = 1.0
Exposure category: B
Basic wind speed: 90 miles per hour (3-second gust)
Base shear: V = 157 kips (north-south direction) and 32 kips (east-west
direction), factored to the strength design level (1.6W) to facilitate comparison
with the seismic forces in the other designs
The shear wall construction types for the wind design are as follows:
Gypsum Wallboard Gypsum wallboard is often thought of as a nonstructural product, but it often plays a key role in structural systems composed of light framing members. These functions include bracing individual members against buckling and bracing wall panels to control racking of entire buildings. This building has a fire suppression sprinkler system and is designed such that the structural system does not require a 1-hour fire rating, so most of the GWB is 1/2 inch thick.
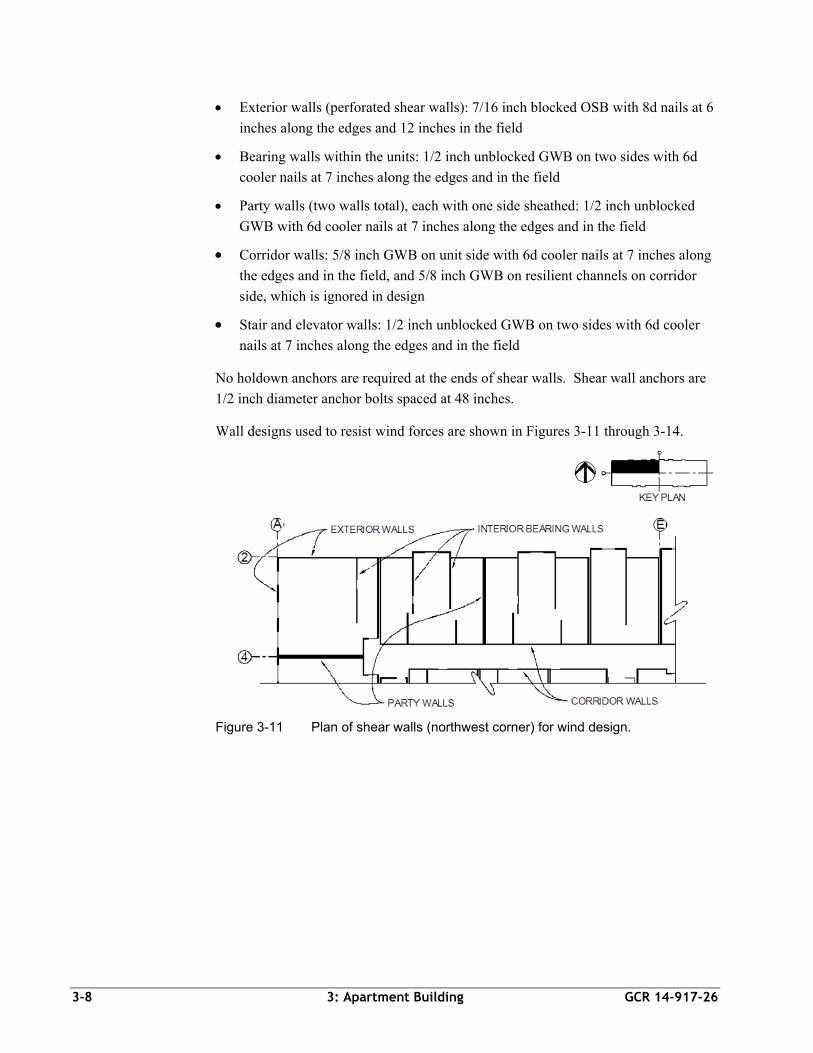
3-8 3: Apartment Building GCR 14-917-26
Exterior walls (perforated shear walls): 7/16 inch blocked OSB with 8d nails at 6
inches along the edges and 12 inches in the field
Bearing walls within the units: 1/2 inch unblocked GWB on two sides with 6d
cooler nails at 7 inches along the edges and in the field
Party walls (two walls total), each with one side sheathed: 1/2 inch unblocked
GWB with 6d cooler nails at 7 inches along the edges and in the field
Corridor walls: 5/8 inch GWB on unit side with 6d cooler nails at 7 inches along
the edges and in the field, and 5/8 inch GWB on resilient channels on corridor
side, which is ignored in design
Stair and elevator walls: 1/2 inch unblocked GWB on two sides with 6d cooler
nails at 7 inches along the edges and in the field
No holdown anchors are required at the ends of shear walls. Shear wall anchors are
1/2 inch diameter anchor bolts spaced at 48 inches.
Wall designs used to resist wind forces are shown in Figures 3-11 through 3-14.
Figure 3-11 Plan of shear walls (northwest corner) for wind design.
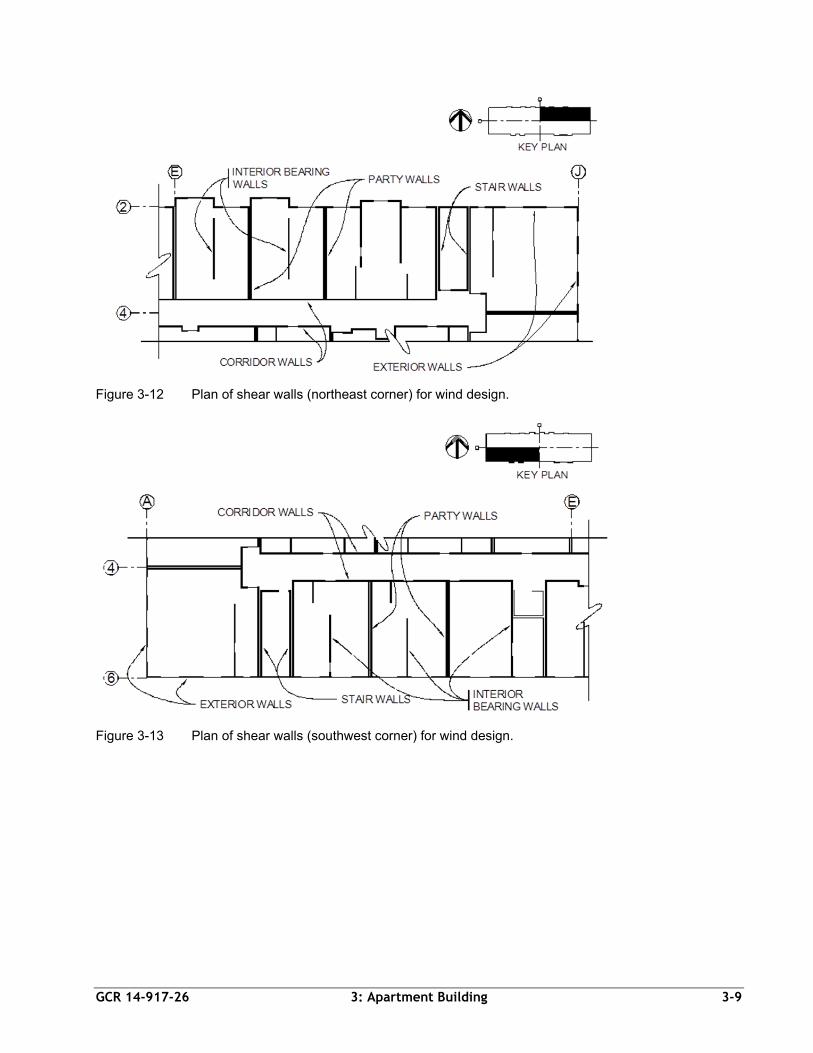
GCR 14-917-26 3: Apartment Building 3-9
Figure 3-12 Plan of shear walls (northeast corner) for wind design.
Figure 3-13 Plan of shear walls (southwest corner) for wind design.

3-10 3: Apartment Building GCR 14-917-26
Figure 3-14 Plan of shear walls (southeast corner) for wind design.
3.3 Current Local Seismic Code Design
Consistent with current practice in Memphis, the current local seismic code design
utilizes the 1999 SBC. As is common practice for this type of building, the seismic
base shear of the building was evaluated using linear static analysis, or more
specifically, the Equivalent Lateral Force procedure, as defined in the 1999 SBC.
The strength values and the detailing requirements are in accordance with the 2005
edition of the Special Design Provisions for Wind and Seismic Standard with
Commentary (AF&PA, 2005), consistent with local practice. The following seismic
factors were considered in the design:
Seismic hazard exposure group: I
Importance factor: I= 1.0
Soil site coefficient: S3 = 1.5
Seismic performance category: D
Effective peak acceleration: Aa = 0.204g
Effective peak velocity related acceleration: Av = 0.204g
Response modification coefficient: R = 6.5
Base shear: V = 147 kips
The base shear in the north-south direction for the 1999 SBC seismic design is
slightly smaller than that due to the wind loads (147 kips versus 157 kips), so the
design is unchanged in that direction.

GCR 14-917-26 3: Apartment Building 3-11
The base shear in the east-west direction for the 1999 SBC seismic design is
approximately 4.6 times the base shear due to wind load in that direction. To
accommodate the higher seismic forces in this direction, the interior longitudinal
shear walls were modified, as follows:
In the first story, the nail spacing for two pairs of party walls (one at each end of
the building) and the corridor walls was reduced from 7 inches to 4 inches, and
the horizontal joints were blocked in the first story. The walls in the upper
stories were unchanged.
Fifteen of the shear walls in the first story and 11 in the second story were
provided with holdown anchors. The required capacities were mostly small
(3,000 to 4,500 pounds allowable load).
Overall, the wind and current local seismic designs are very similar, except that
several nonstructural elements required bracing for seismic forces (e.g., water
heaters, suspended fan-coil units, fire-suppression piping, and the elevator). The
ceilings did not require extra bracing for the current local seismic code design.
3.4 Current National Seismic Code Design
The current national seismic code design complies with ASCE/SEI 7-10 seismic
design provisions, which is the basis for the 2012 IBC. Seismic forces were
calculated using the Equivalent Lateral Force procedure. Detailing requirements are
in accordance with the 2008 edition of the Special Design Provisions for Wind and
Seismic Standard with Commentary (AF&PA, 2009), as referenced by ASCE/SEI
7-10. The following seismic factors were considered in the design:
Risk category: II
Importance factor: I = 1.0
Soil site class: D (stiff soil)
Seismic design category: SDC D
Short period design spectral response acceleration: SDS = 0.742g
1-second period design spectral response acceleration: SD1 = 0.40g
Response modification coefficient: R = 6.5
Seismic base shear coefficient: CS = 0.114
Base shear: V = 214 kips
Seismic hazard parameters for ASCE/SEI 7-10 are different from the 1999 SBC,
resulting a 46% increase in seismic design forces based upon the definition of ground
motion alone. In addition, an increase occurs because of the use of shear walls
sheathed with GWB, exclusively or in combination with OSB sheathing. This

3-12 3: Apartment Building GCR 14-917-26
increase occurs because the current local seismic code does not distinguish between
OSB and GWB panels in the seismic design provisions, assigning the same seismic
response modification coefficient, R, of 6.5 for each. ASCE/SEI 7-10, however,
uniquely identifies the two materials, and provides different seismic design
parameters for each. The seismic response modification coefficient, R, is 6.5 for the
OSB panels and 2.0 for the GWB panels. Thus the seismic design force for GWB is
increased by a factor of 3.25.
Shear walls sheathed with OSB at ordinary nail spacing have more than twice the
shear resistance of GWB. Thus fewer OSB shear walls are required for the
ASCE/SEI 7-10 design, even with a 46% increase in seismic design forces.
Therefore, the basic system is changed, and selected interior walls were sheathed
with OSB before being covered with GWB. These walls work together with the
exterior walls such that all shear walls designed for seismic force are constructed
with OSB, and the GWB is ignored in the lateral force-resisting system.
All shear walls are 7/16 inch thick OSB blocked sheathing with 8d nails at 6 inch and
4 inch centers along the edges, and at 12 inch centers in the field. Solid and
perforated shear walls are designed for selected interior bearing walls, party walls,
corridor walls, and all exterior walls. Since seismic design forces decrease from
bottom to top, the number of interior walls sheathed with OSB correspondingly
decreases from bottom to top. The GWB nailing that was used in shear walls in the
other designs is relaxed to the minimum for general purposes (generally 8 inch
centers). The first-story shear walls, which are required to resist ASCE/SEI 7-10
seismic forces, are shown as heavy lines in Figures 3-15 through 3-18.
Of the 38 shear walls sheathed with structural wood panels in the first story, all but
10 required holdowns at each end. These holdowns vary from small (3,000 pound
allowable load) to large (12,000 pound allowable load). For shear walls on the
second story, 20 of the 38 shear walls required holdowns, and on the third story, 17
of the 23 shear walls required holdowns. Wall anchors for shear are 1/2 inch
diameter anchor bolts at 48 inch centers for the six shear walls with edge nails at 6
inch centers, and 1/2 inch diameter anchor bolts at 32 inch centers for the 32 shear
walls with edge nails at 4 inch centers. The spacing of anchor bolts at other walls
was increased to 6 feet, maintaining the total quantity of anchors essentially the same
as the 1999 SBC design, and thus not affecting the total cost.
Nonstructural items requiring seismic bracing are the same as for the 1999 SBC
design. Explicit consideration of drift compatibility at the stair connections is also
required.

GCR 14-917-26 3: Apartment Building 3-13
Figure 3-15 Plan of shear walls (northwest corner) for current national seismic
code design.
Figure 3-16 Plan of shear walls (northeast corner) for current national seismic code design.
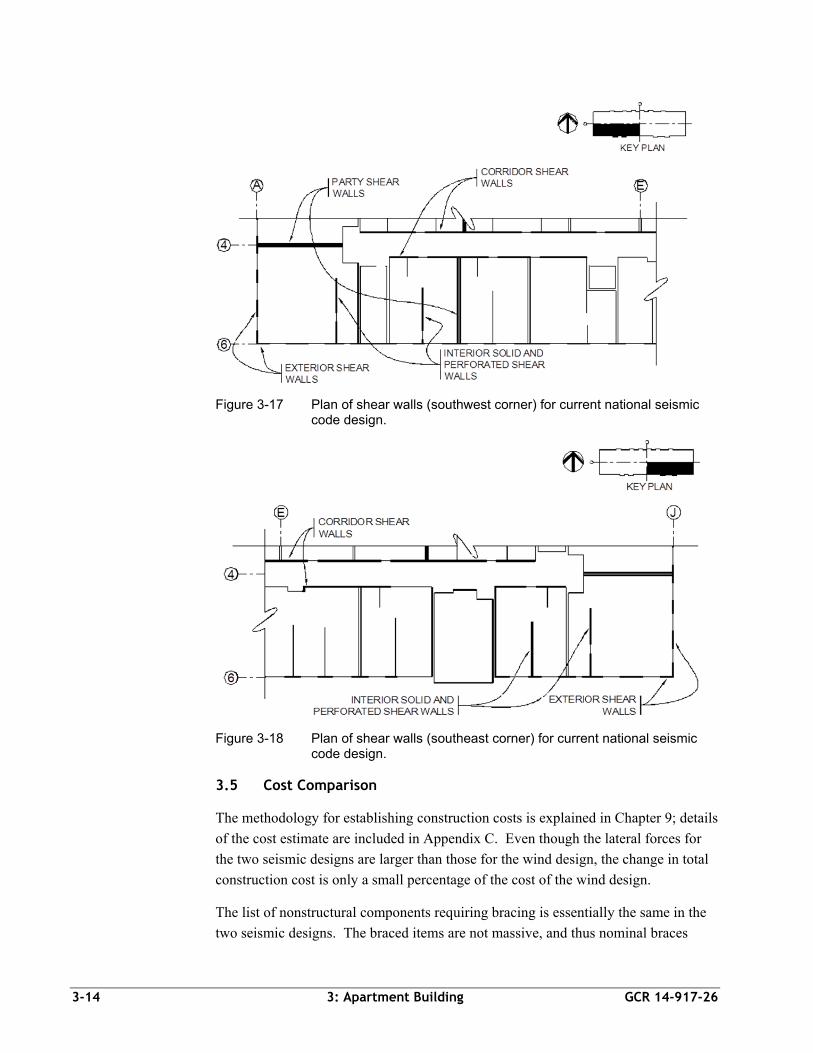
3-14 3: Apartment Building GCR 14-917-26
Figure 3-17 Plan of shear walls (southwest corner) for current national seismic code design.
Figure 3-18 Plan of shear walls (southeast corner) for current national seismic code design.
3.5 Cost Comparison
The methodology for establishing construction costs is explained in Chapter 9; details
of the cost estimate are included in Appendix C. Even though the lateral forces for
the two seismic designs are larger than those for the wind design, the change in total
construction cost is only a small percentage of the cost of the wind design.
The list of nonstructural components requiring bracing is essentially the same in the
two seismic designs. The braced items are not massive, and thus nominal braces

GCR 14-917-26 3: Apartment Building 3-15
suffice for both of the designs. Therefore, nonstructural costs were taken to be the
same for the two seismic designs, but an additional allowance was added for the
deformation compatibility requirement at the stairs in the ASCE/SEI 7-10 design.
A comparison of costs and required strengths for each design level is shown in Table
3-1 and Table 3-2. The results in Table 3-1 are shown as ratios relative to the values
of base shear or cost for the wind design. For this building, the estimated total
construction cost for the wind design is $120.79 per square foot. Table 3-1 shows
that the total construction cost of the apartment building increases by 0.3% and 1.2%,
relative to the wind design, when considering 1999 SBC and ASCE/SEI 7-10 seismic
design requirements, respectively. The biggest contributing factor in the structural
cost increase for the 1999 SBC seismic design is the need for holdown anchors at the
ends of several walls.
Table 3-1 Base Shear and Cost Comparisons between the Apartment Building Wind and Seismic Designs
Wind
Design Current Local
Seismic Code(1) Current National Seismic Code(1)
Ratio Increase Ratio Increase
Base Shear
North-South Direction
East-West Direction
1.0
1.0
(1.0)
4.59
-
-
1.36
6.69
-
-
Structural Cost(2) 1.0 1.008 0.8% 1.041 4.1%
Total Building Cost 1.0 1.003 0.3% 1.012 1.2%
Notes: (1) Ratios and increases are relative to wind design.
(2) The structural cost includes wood framing and foundation, but it does not include GWB or stucco, even though sheathing is a key element of the lateral force-resisting system. The cost for additional nailing of GWB is included in the structural ratio for the current local seismic code design.
Table 3-2 compares the two seismic designs. Results in Table 3-2 are shown as
ratios relative to the values of base shear or cost for the current local seismic code
design. The increase in total construction cost between the 1999 SBC design and the
ASCE/SEI 7-10 design is 0.9%. The biggest contributing factor in this increase is the
need for interior OSB shear walls due to differences in the R factor.
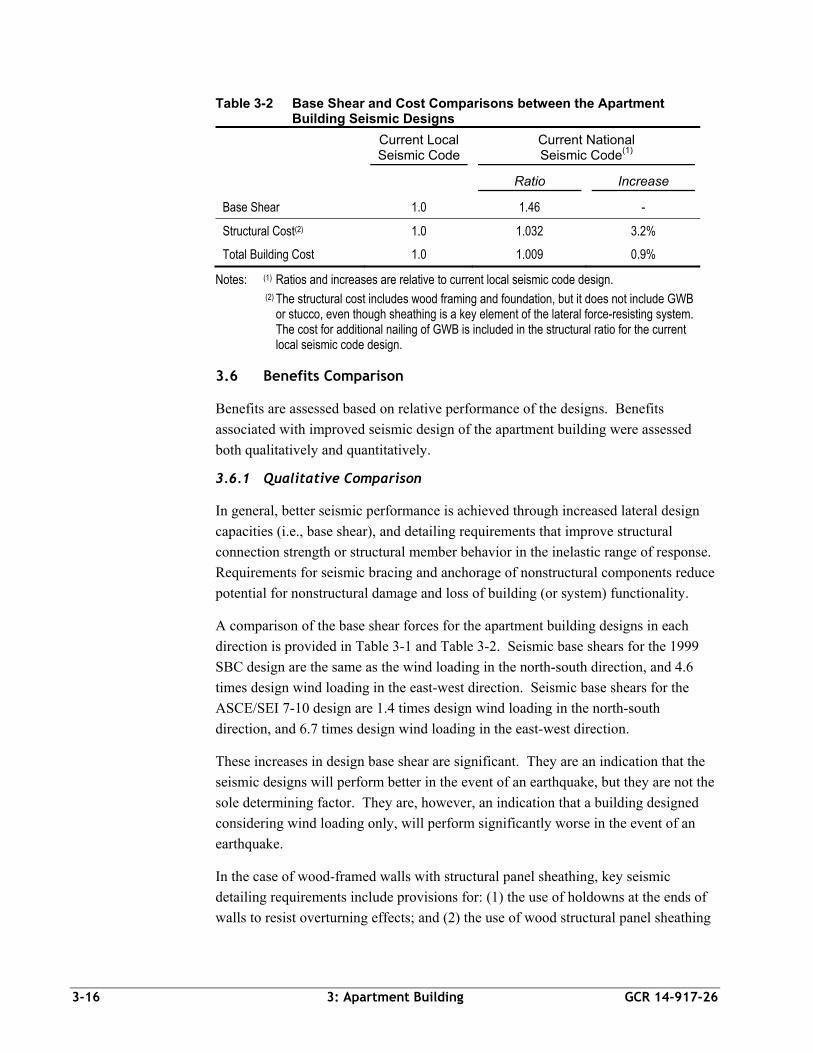
3-16 3: Apartment Building GCR 14-917-26
Table 3-2 Base Shear and Cost Comparisons between the Apartment Building Seismic Designs
Current Local Seismic Code
Current National Seismic Code(1)
Ratio Increase
Base Shear 1.0 1.46 -
Structural Cost(2) 1.0 1.032 3.2%
Total Building Cost 1.0 1.009 0.9%
Notes: (1) Ratios and increases are relative to current local seismic code design.
(2) The structural cost includes wood framing and foundation, but it does not include GWB or stucco, even though sheathing is a key element of the lateral force-resisting system. The cost for additional nailing of GWB is included in the structural ratio for the current local seismic code design.
3.6 Benefits Comparison
Benefits are assessed based on relative performance of the designs. Benefits
associated with improved seismic design of the apartment building were assessed
both qualitatively and quantitatively.
3.6.1 Qualitative Comparison
In general, better seismic performance is achieved through increased lateral design
capacities (i.e., base shear), and detailing requirements that improve structural
connection strength or structural member behavior in the inelastic range of response.
Requirements for seismic bracing and anchorage of nonstructural components reduce
potential for nonstructural damage and loss of building (or system) functionality.
A comparison of the base shear forces for the apartment building designs in each
direction is provided in Table 3-1 and Table 3-2. Seismic base shears for the 1999
SBC design are the same as the wind loading in the north-south direction, and 4.6
times design wind loading in the east-west direction. Seismic base shears for the
ASCE/SEI 7-10 design are 1.4 times design wind loading in the north-south
direction, and 6.7 times design wind loading in the east-west direction.
These increases in design base shear are significant. They are an indication that the
seismic designs will perform better in the event of an earthquake, but they are not the
sole determining factor. They are, however, an indication that a building designed
considering wind loading only, will perform significantly worse in the event of an
earthquake.
In the case of wood-framed walls with structural panel sheathing, key seismic
detailing requirements include provisions for: (1) the use of holdowns at the ends of
walls to resist overturning effects; and (2) the use of wood structural panel sheathing

GCR 14-917-26 3: Apartment Building 3-17
(rather than nonstructural sheathing like gypsum wallboard) to resist seismic forces
without degradation.
Based on strength and ductility considerations, an apartment building designed to
resist the effects of wind load alone will have a higher potential for damage, a higher
probability of collapse, and a correspondingly higher risk for casualties.
Although most nonstructural items in an apartment building are noncritical, damage
to certain key elements, such as water heaters, water piping, and fire sprinkler
systems, can cause a building to become unusable due to water damage, lack of water
supply, and lack of fire suppression capability. Additional limitations in the ability to
evacuate or continue to use a building can arise as a result of damage to stairs and
elevators. In both the 1999 SBC and the ASCE/SEI 7-10 designs, nonstructural
bracing for seismic demands, along with some consideration for story drift, is
required to minimize the potential for damage to nonstructural systems.
The increased strength and improved detailing of a seismic system can increase the
resistance of a structure to extreme windstorms, and wind loads in excess of code
design levels. Seismic design, however, will not improve the resistance of roofing
and roof framing to wind-induced uplift, or the exterior enclosure of the building
(i.e., windows and doors) to extreme wind loads or wind-borne debris.
3.6.2 Quantitative Comparison
The seismic performance of the apartment building was also assessed using the
FEMA P-58-1 methodology (FEMA, 2012a). Using this methodology, performance
was measured in terms of annualized losses (i.e., the average value of loss, per year,
over a period of years) for repair costs, casualties, and probability of collapse.
Details of the quantitative assessment of the apartment building are provided in
Appendix E.
The apartment building includes structural walls and non-bearing partitions that are
sheathed with oriented strand board (OSB), gypsum wallboard (GWB), or stucco.
Many walls include more than one type of sheathing. Design of the apartment
building ignores non-bearing partitions and one or more of the sheathing materials on
the structural walls, but the performance of the apartment building will be strongly
influenced by all the wall elements that are present in the building, whether they are
considered in the design or not. Because the actual lateral strength is derived from
the sum of all structural and nonstructural shear panels on the walls, direct
comparison of the design base shear is not as meaningful as actual strength in the
case of the apartment building.
The methodology presented in FEMA P-807 (FEMA, 2012d) was used to develop a
static pushover analysis of the first story and quantify the contribution of all walls

3-18 3: Apartment Building GCR 14-917-26
with combinations of OSB, stucco, and GWB. Figure 3-19 shows a comparison of
base shear versus drift curves for the total resistance considering all sheathing
materials, and for resistance considering only the OSB. The figure shows that the
contribution of the stucco and the GWB to the total resistance is significant.
Figure 3-19 Pushover curve and trilinear approximation for current national seismic code design of apartment building, north-south direction.
Quantitative results are summarized in Figure 3-20. In the figure, it can be seen that
annualized losses, in terms of repair cost, fatalities, and probability of collapse for the
apartment building, would be reduced by approximately 50% when current national
seismic code provisions are implemented. These results are consistent with
qualitative expectations for improved performance based on increased design
strength and improved detailing requirements.
3.7 Conclusions
Implementation of seismic design requirements for apartment buildings will result in
total construction cost increases of 0.3% for current local seismic code (1999 SBC)
requirements, and 1.2% for current national seismic code (ASCE/SEI 7-10)
requirements, when compared to the wind design.
Qualitatively, an apartment building designed to resist the effects of wind load alone
will have a higher potential for damage, a higher probability of collapse, and a
correspondingly higher risk for casualties than a building designed specifically for
earthquake effects. Quantitatively, annualized repair costs, fatalities, and
probabilities of collapse for an apartment building would be reduced by more than
0, 0
0.6, 685
2.9, 780
4, 560
0, 0
0.75, 380
2.7, 420
4, 600
100
200
300
400
500
600
700
800
900
0.00 0.50 1.00 1.50 2.00 2.50 3.00 3.50 4.00 4.50
Base Shear, kips
Interstory Drift, %
Pushover Analysis, North‐South Direction (ASCE/SEI 7‐10 Seismic Design)
Total (OSB, Stucco, GWB)
Total (trilinear)
OSB only
OSB (trilinear)

GCR 14-917-26 3: Apartment Building 3-19
50% when current national seismic design provisions are implemented, relative to the
annualized losses that would be expected for wind design provisions alone.
Figure 3-20 Comparison of annualized losses for the apartment building, as a ratio of annualized losses for the wind design.
0
0.2
0.4
0.6
0.8
1
1.2
Probability of Collapse Fatalities Repair Cost
Ratio of Annualized Losses Relative to W
ind Design
Losses
Consequences
Wind Design
Current Local Seismic Code Design
Current National Seismic Code Design


GCR 14-917-26 4: Office Building 4-1
Chapter 4
Office Building
This chapter compares relative construction costs associated with varying levels of
earthquake resistance for differing lateral force-resisting system designs of an office
building located in Memphis, Tennessee, and assesses the benefits of improvements
in seismic resistance. To make these comparisons, three different designs were
developed:
1. Wind design according to ASCE/SEI 7-05, Minimum Design Loads for Buildings
and Other Structures (ASCE, 2006),
2. Current local seismic code design according to the 1999 SBC, Standard Building
Code (SBCCI, 1999), and
3. Current national seismic code design according to ASCE/SEI 7-10 Minimum
Design Loads for Buildings and Other Structures (ASCE, 2010), which is the
basis for the 2012 edition of the International Building Code (ICC, 2012).
4.1 Building Description
The office is a four-story steel-framed building. The footprint of the building is
approximately 115 feet by 214 feet, providing roughly 100,000 square feet of floor
area. The building cladding consists of typical glass and aluminum curtain wall with
bands of brick veneer at each floor level. The elevator, stair, and mechanical shaft
openings are located near the center of the building. Appendix D provides a list of
complete drawings available for this building.
4.1.1 General
Figure 4-1 shows the plan of the building. The bays are spaced at 30 feet in the
north-south direction and vary between 21 feet and 48 feet in the east-west direction.
Floor heights vary between 12 feet 10 inches and 14 feet with an overall building
height of 53 feet 4 inches above grade.
The primary gravity framing system consists of concrete slab on steel deck spanning
between steel open web joists (OWJ). The composite steel joist framing provides
gravity support for each floor.
Although the gravity system remains the same in all designs, the lateral force-
resisting system changes among the three designs in terms of design strength and
detailing requirements.
Location The majority of new office buildings in the Memphis area are built outside the downtown core. Such projects invariably include significant site construction outside the building, such as landscaping, driveways and parking lots. This study focuses on the building and therefore excludes those site development costs.

4-2 4: Office Building GCR 14-917-26
Figure 4-1 Office building foundation plan showing brace layout for wind design.
4.1.2 Foundations
The columns supporting the wide flange girders are supported on concrete spread
footings. The ground below the spread footings was improved with rammed
aggregate piers to increase allowable bearing pressures. The use of rammed
aggregate piers is based on local practice in the Memphis area. The sizes of the
footings differ among the three design levels.
4.1.3 Gravity Framing System
The floor slabs consist of a 3 1/4 inch thick lightweight concrete topping slab over a
2 inch deep 20 gauge steel deck. Generally, the deck is supported by steel OWJs that
frame into wide flange girders. Consistent with current design practice in Memphis,
joist design is deferred to the joist manufacturer. Shear studs are provided
throughout the floor area to achieve composite action between the slab and the joists
and girders. The wide flange girders frame into W10 columns.
The roof framing consists of a 1 1/2 inch deep 18 gauge untopped steel deck
supported on steel OWJs. The joist spacing and orientation at the roof are consistent
with the typical floor plan, and the joist designation is 28K10. For each design, the
deck has a 4-weld pattern with button punch (BP) side laps. For the wind design, the
BP spacing is at 24 inches on center while the other designs have 12 inch spacing.

GCR 14-917-26 4: Office Building 4-3
4.1.4 Lateral Force-Resisting System
The lateral force-resisting system consists of steel braced frame systems in each
design: (1) concentrically braced frames for wind design; (2) ordinary concentrically
braced frames for current local seismic code design; and (3) special concentrically
braced frames for current national seismic code design.
4.2 Wind Design
For wind design, lateral forces are in accordance with ASCE/SEI 7-05. The
following factors were considered in the design:
Occupancy category: II
Importance factor: I = 1.0
Exposure category: B (the building is in an urban or suburban area with
numerous closely spaced obstructions)
Base shear: V = 107 kips (north-south direction) and 230 kips (east-west
direction) factored to the strength design level (1.6W) to facilitate comparison
with the seismic forces in the other designs
There are two lines of braced frames in each direction as shown in Figure 4-1. The
braces are designed in accordance with the Steel Construction Manual 13th Edition
(AISC, 2006) to perform elastically for wind loading. There are no special detailing
requirements related to wind design. Hollow structural section (HSS) steel tubes are
used for braces, and they are oriented in a 2-story X configuration as shown in Figure
4-2.
Wide flange members are used for column and beam elements within the braced
frames. Diaphragm forces are delivered to the frames through wide flange collector
elements used in gravity framing. The standard shear tabs connecting the beams to
columns are adequate to deliver collector loads. The typical footings sized for
gravity loads are adequate for the lateral loading due to wind in the longitudinal
direction.
Braced Frame Foundations The increase in the weight of steel for seismically resistant braced frames is modest in comparison to the increase in the lateral force. Braced frames, like some types of shear walls, concentrate the lateral force demand on the foundations, and the size of the footings increase proportionately more than the increase in the superstructure framing.

4-4 4: Office Building GCR 14-917-26
(a) (b)
Figure 4-2 Office building braced frame elevations for: (a) wind design; and (b) current local seismic code design.
4.3 Current Local Seismic Code Design
Consistent with current practice in Memphis, the current local seismic code design
utilizes the 1999 SBC. As is common practice for this type of building, lateral forces
were evaluated using linear dynamic analysis, or more specifically, Modal Response
Spectrum Analysis, as defined in the 1999 SBC. The following seismic factors were
considered in the design:
Seismic hazard exposure group: I
Importance factor: I = 1.0
Soil site coefficient: S3 = 1.5
Seismic performance category: C
Effective peak acceleration: Aa = 0.172g
Effective peak velocity related acceleration: Av = 0.193g
Response modification coefficient: R = 5
Base shear: V = 503 kips

GCR 14-917-26 4: Office Building 4-5
The lateral force-resisting system consists of four bays of ordinary concentrically
braced frames in each direction, as shown in Figure 4-3. The detailing requirements
are in accordance with the 1997 edition of the Seismic Provisions for Structural Steel
Buildings (AISC, 1997), as referenced by the 1999 SBC.
Figure 4-3 Office building foundation plan showing brace layout for current local seismic code design.
The comparison of the current local seismic code design to wind design shows that
base shear forces increase by a factor of 4.7 in the north-south direction and by a
factor of 2.2 in the east-west direction. To accommodate the higher forces, two
additional bays of bracing were added in each direction. Because of the increased
strength demand, as well as the need to meet compactness and slenderness
requirements in the 1999 SBC, wide flange sections were used for braces rather than
the HSS sections that were used in the wind design. Similarly, the columns were
increased in size to accommodate higher design forces, column strength
requirements, and compactness criteria.
Because there are twice as many braced frames there are also twice as many collector
beams. Although the 1999 SBC does not require forces in collector elements to be
amplified by an overstrength factor, moment connections at columns are used in lieu
of standard shear tabs to accommodate the higher demands. In addition, the footings
at the braced frames in the north-south direction increase six feet in length and width
and one foot in depth. The foundations at the braced frames in the east-west
direction increase three feet in length and width and one foot in depth. The 1999

4-6 4: Office Building GCR 14-917-26
SBC requires brace connections in ordinary concentrically braced frames to be
designed for brace forces that are amplified by an overstrength factor, resulting in
more robust connections than in the wind design. This affects gusset plates and
welds. Similarly, columns within the braced frames are required to meet AISC
column strength requirements, and have been designed using the overstrength factor.
4.4 Current National Seismic Code Design
The current national seismic code design complies with ASCE/SEI 7-10 seismic
design provisions, which is the basis for the 2012 IBC. Seismic forces were
calculated using Modal Response Spectrum Analysis. The following seismic factors
were considered in the design:
Risk category: II
Importance factor: I = 1.0
Soil site class: D (stiff soil)
Seismic design category: SDC D
Short period design spectral response acceleration: SDS = 0.688g
1-second period design spectral response acceleration: SD1 = 0.374g
Response modification coefficient: R = 6
Base shear: V = 571 kips
Because the building is in seismic design category D, it must be detailed as a steel
special concentrically braced frame. The detailing requirements are in accordance
with the 2005 edition of the Seismic Provisions for Structural Steel Buildings (AISC,
2005), as referenced in ASCE/SEI 7-10.
The ground motion maps in ASCE/SEI 7-10 provide spectral accelerations that are
60% higher than those in the 1999 SBC, but this is partially offset by the higher
response modification coefficient (R = 6) that is associated with special
concentrically braced frames. Ultimately, the design base shear calculated using
ASCE/SEI 7-10 is only 1.13 times the base shear calculated using the 1999 SBC.
The layout of the lateral force-resisting system remains the same as the layout in the
1999 SBC design, but many of the structural members increase in size because of the
higher forces. The typical brace member sizes were increased from W10x49 to
W10x68 mainly because of more stringent compactness and slenderness criteria
associated with special concentrically braced frames. Column sizes also increased
because of the increase in base shear and because of column compactness,
slenderness, and strength requirements per the 2005 Seismic Provisions for special
concentrically braced frames. Increases in column sizes were typically in the range

GCR 14-917-26 4: Office Building 4-7
of 6 to 9 pounds per foot compared to the 1999 SBC design. Similarly, collector
beams increased in size to comply with overstrength requirements in the seismic
provisions. To address the increased collector force demands, girder flanges are fully
welded to column flanges, as would be done in moment-resisting frame connections.
Brace connections were increased in size as they must be designed for the capacity of
the longer braces, whereas the 1999 SBC requires only that the brace connections be
designed for an overstrength factor (i.e., a factor of 2.0).
As shown in Figure 4-4, footing sizes also increased because of higher seismic loads.
The two footings for the braced frames in the east-west direction became one large
footing, 40 feet 4 inches by 15 feet 6 inches in size. Footing sizes for the braced
frames in the north-south direction increased 18 inches in length and width, as
compared to the footings in the 1999 SBC design.
Figure 4-4 Office building foundation plan showing brace layout for current national seismic code design.
4.5 Cost Comparison
The methodology for establishing construction costs is explained in Chapter 9; details
of the cost estimate are included in Appendix C. Even though the lateral forces for
the two seismic designs are larger than those for the wind design, the change in total
construction cost is only a small percentage of the cost of the wind design.

4-8 4: Office Building GCR 14-917-26
A comparison of costs and required strength for each design level is shown in Table
4-1 and Table 4-2. The results in Table 4-1 are shown as ratios relative to the values
of base shear or cost for the wind design. For this building, the estimated total
construction cost for the wind design is $192.16 per square foot. Table 4-1 shows
that the total construction cost of the office building increases by 2.1% and 2.8%,
relative to the wind design, when considering 1999 SBC and ASCE/SEI 7-10 seismic
design requirements, respectively. The increase in structural costs for the two
seismic designs is largely due to more substantial braced frames, collectors, and
foundations in the structural system. Required bracing and anchorage of
nonstructural components and systems adds to the increase in total construction costs.
Table 4-1 Base Shear and Cost Comparisons between the Office Building Wind and Seismic Designs
Wind
Design Current Local
Seismic Code(1) Current National Seismic Code(1)
Ratio Increase Ratio Increase
Base Shear
North-South Direction
East-West Direction
1.0
1.0
4.70
2.19
-
-
5.34
2.48
-
-
Structural Cost 1.0 1.144 14.4% 1.196 19.6%
Total Building Cost 1.0 1.021 2.1% 1.028 2.8%
Notes: (1) Ratios and increases are relative to wind design.
Table 4-2 compares the two seismic designs. Results in Table 4-2 are shown as
ratios relative to the values of base shear or cost for the current local seismic code
design. The increase in total construction cost between the 1999 SBC design and the
ASCE/SEI 7-10 design is 0.7%.
Table 4-2 Base Shear and Cost Comparisons between the Office Building Seismic Designs
Current Local Seismic Code
Current National Seismic Code(1)
Ratio Increase
Base Shear 1.0 1.14 -
Structural Cost 1.0 1.046 4.6%
Total Building Cost 1.0 1.007 0.7%
Notes: (1) Ratios and increases are relative to current local seismic code design.
When expressed as a ratio of total construction costs, the cost increase for seismic
design is nominal. When expressed as a ratio of the structural costs alone, the cost
increase for the office building is higher than for most other buildings in this study.

GCR 14-917-26 4: Office Building 4-9
This is because the structural system for this type of construction (i.e., the steel
frame) represents a smaller portion of the overall cost for the building.
4.6 Benefits Comparison
Benefits are assessed based on relative performance of the designs. Benefits
associated with improved seismic design of the office building were assessed both
qualitatively and quantitatively.
4.6.1 Qualitative Comparison
In general, better seismic performance is achieved through increased lateral design
forces (i.e., base shear), and detailing requirements that improve structural
connection strength or structural member behavior in the inelastic range of response.
Requirements for seismic bracing and anchorage of nonstructural components reduce
potential for nonstructural damage and loss of building (or system) functionality.
A comparison of the base shear forces for the office building designs in each
direction is provided in Table 4-1 and Table 4-2. Seismic base shears for the 1999
SBC design are 4.7 times design wind loading in the north-south direction, and 2.2
times design wind loading in the east-west direction. Seismic base shears for the
ASCE/SEI 7-10 design are 5.3 times design wind loading in the north-south
direction, and 2.5 times design wind loading in the east-west direction.
These increases in design base shear are significant. They are an indication that the
seismic designs will perform better in the event of an earthquake, but they are not the
sole determining factor. They are, however, an indication that a building designed
considering wind loading only, will perform significantly worse in the event of an
earthquake.
In the case of steel braced frame systems, key seismic detailing requirements include
provisions for: (1) brace connections to be designed to resist amplified forces or the
capacity of the braces to avoid premature failure of the connections; (2) member
compactness and slenderness requirements to avoid premature fracture of the braces
due to buckling and low-cycle fatigue; (3) collector design for amplified forces to
deliver seismic forces to the braced frames without premature failure; and (4)
enhanced column design requirements to resist vertical components of braces.
Braced frame systems designed for wind load requirements alone do not have the
ductility inherent in seismic braced frame systems, and therefore, do not have the
ability to perform well in the event of an earthquake. In comparison to the wind
design, the ordinary concentrically braced frame system of the 1999 SBC design has
more stringent guidelines on compactness and slenderness limits. These limits help
reduce damage as brace buckling occurs, and allow for greater energy dissipation.
The brace connection designs also allow buckling to occur without connection

4-10 4: Office Building GCR 14-917-26
failure, resulting in more ductile behavior. Stronger collectors and connections are
intended to allow the braces to yield without failure in the load path due to fracture of
the collectors or their connections. The additional ductility, as well as the added
strength, of the ordinary concentrically braced frame system produces a more
earthquake-resistant design.
The special concentrically braced system of the ASCE/SEI 7-10 design is intended to
withstand significant inelastic deformation without failure, and, therefore, has
enhanced detailing requirements over those for the ordinary concentrically braced
frame system. More stringent connection detailing requirements, further restrictions
on slenderness and compactness requirements, and higher collector design forces all
contribute to increased ductility, making the special concentrically braced system
more likely to perform well in the event of an earthquake.
Based on strength and ductility considerations, an office building designed to resist
the effects of wind load alone will have a higher potential for damage, a higher
probability of collapse, and a correspondingly higher risk for casualties.
Although most nonstructural items in an office building are noncritical, damage to
certain key elements, such as water piping, fire sprinkler systems, electrical power,
and heating and air-conditioning systems, can cause a building to become unusable
due to water damage, lack of water and power supply, and lack of fire suppression
capability. Additional limitations in the ability to evacuate or continue to use a
building can arise as a result of damage to stairs and elevators. In both the 1999 SBC
and the ASCE/SEI 7-10 designs, nonstructural bracing for seismic demands, along
with some consideration for story drift, is required to minimize the potential for
damage to nonstructural systems.
The increased strength and improved detailing of a seismic system can increase the
resistance of a structure to extreme windstorms, and wind loads in excess of code
design levels. Seismic design, however, will not improve the resistance of roof joists
to wind-induced uplift, or the exterior enclosure of the building (i.e., windows and
doors) to extreme wind loads or wind-borne debris.
4.6.2 Quantitative Comparison
The seismic performance of the office building was also assessed using the FEMA
P-58-1 methodology (FEMA, 2012a). Using this methodology, performance was
measured in terms of annualized losses (i.e., the average value of loss, per year, over
a period of years) for repair costs, casualties, and probability of collapse. Details of
the quantitative assessment of the office building are provided in Appendix E.
Quantitative results are summarized in Figure 4-5. In the figure, it can be seen that
annualized losses, in terms of repair costs, fatalities, and probabilities of collapse for

GCR 14-917-26 4: Office Building 4-11
the office building, would be reduced by more than 30% when current local seismic
design provisions are implemented, and by more than 70% when current national
seismic design provisions are implemented, relative to the annualized losses that
would be expected for wind design provisions, alone. These results are consistent
with qualitative expectations for improved performance based on increased design
strength and improved detailing requirements.
Figure 4-5 Comparison of annualized losses for the office building, as a ratio of annualized losses for the wind design.
4.7 Conclusions
Implementation of seismic design requirements for office buildings will result in total
construction cost increases of 2.1% for current local seismic code (1999 SBC)
requirements, and 2.8% for current national seismic code (ASCE/SEI 7-10)
requirements, when compared to the wind design.
Qualitatively, an office building designed to resist the effects of wind load alone will
have a higher potential for damage, a higher probability of collapse, and a
correspondingly higher risk for casualties than a building designed specifically for
earthquake effects. Quantitatively, annualized repair costs, fatalities, and
probabilities of collapse for an office building would be reduced by more than 30%
when current local seismic design provisions are implemented, and by more than
70% when current national seismic design provisions are implemented, relative to the
annualized losses that would be expected for wind design provisions alone.
0
0.2
0.4
0.6
0.8
1
1.2
Probability of Collapse Fatalities Repair Cost
Ratio of Annualized Losses Relative to W
ind Design
Losses
Consequences
Wind Design
Current Local Seismic Code Design
Current National Seismic Code Design


GCR 14-917-26 5: Retail Building 5-1
Chapter 5
Retail Building
This chapter compares relative construction costs associated with varying levels of
earthquake resistance for differing lateral force-resisting system designs of a retail
building located in Memphis, Tennessee, and assesses the benefits of improved
seismic resistance. To make these comparisons, three different designs were
developed:
1. Wind design according to ASCE/SEI 7-05, Minimum Design Loads for Buildings
and Other Structures (ASCE, 2006),
2. Current local seismic code design according to the 1999 SBC, Standard Building
Code (SBCCI, 1999), and
3. Current national seismic code design according to ASCE/SEI 7-10, Minimum
Design Loads for Buildings and Other Structures (ASCE, 2010), which is the
basis for the 2012 edition of the International Building Code (ICC, 2012).
5.1 Building Description
The retail building is a one-story concrete tilt-up wall structure. The footprint of the
building is approximately 160 feet by 240 feet, providing roughly 38,000 square feet
of floor area. The building floor plan includes space allocated toward the back of the
building for typical support services (office suite and restrooms) and a loading dock.
Appendix D provides a list of complete drawings available for this building.
5.1.1 General
Figure 5-1 shows the plan of the building. The bays are spaced at 40 feet in each
direction. The height of the roof is approximately 24 feet at the ridge and 22 feet at
the side walls. The perimeter tilt-up concrete walls serve as the primary cladding
system, and include a parapet that ranges between two and seven feet tall (retail
buildings often have tall parapet requirements in order to visually screen rooftop
mechanical equipment). Some curtain wall cladding is assumed at the building entry.
The primary gravity framing system consists of untopped steel deck spanning
between steel open web joists (OWJ) supported on steel open web joist-girders
(OWG) at the interior and tilt-up concrete walls at the perimeter. The basic roof
framing plan is depicted in Figure 5-2.
Building Selection Big box retail stores are very common across the country. In Memphis, the walls typically consist of tilt-up concrete panels, while in some other parts of the country the walls would consist of masonry.

5-2 5: Retail Building GCR 14-917-26
Although the gravity system remains the same in all designs, the lateral force-
resisting system changes among the three designs in terms of design strength and
detailing requirements. The primary lateral force-resisting system for all three
designs consists of tilt-up concrete shear walls around the perimeter.
Figure 5-1 Basic foundation plan for retail building (all designs).
Figure 5-2 Basic roof framing plan for retail building (all designs).

GCR 14-917-26 5: Retail Building 5-3
5.1.2 Foundations
All three designs have the same foundation system consisting of shallow reinforced
concrete spread footings supporting the steel columns, and continuous footings
supporting the perimeter tilt-up concrete walls, as shown in Figure 5-1. The slab-on-
grade is five inches thick with welded wire fabric.
5.1.3 Gravity Framing System
The roof structure consists of 1 1/2 inch deep, 22 gauge, untopped steel deck
spanning between steel OWJs. The spacing of the OWJs complies with FM Global
rating requirements for steel deck supporting roofing. The OWJs are supported on
steel OWGs at the interior grid lines, and on steel angle ledgers at the 6 inch thick
tilt-up concrete perimeter walls. The OWGs are supported by 6x6 hollow structural
section (HSS) steel tube columns. Columns are located adjacent to the front and rear
walls to avoid placing concentrated bearing loads on the tilt-up walls.
The design includes dead loads of 13.5 pounds per square foot, including an
allowance for ceilings, and live loads of 20.0 pounds per square foot for the OWJs.
The OWJ and OWG are designated as 26K6 and 40G6N7.8k, respectively. Although
in practice OWJ and OWG designs are deferred to the joist manufacturer, preliminary
calculations and past project experience were used to establish specific designations
to allow for estimation of construction costs.
5.1.4 Lateral Force-Resisting System
The lateral force-resisting system consists of the steel roof deck diaphragm spanning
to perimeter tilt-up concrete shear walls. The steel deck attachment pattern varied
based on lateral force levels and detailing requirements for each applicable building
code. The longer side walls were classified as bearing shear walls, while the shorter
front and rear walls were classified as non-bearing shear walls. Appropriate lateral
design factors were chosen for each direction, based on the designation of the system
under each applicable building code, as discussed below. Design and anchorage of
perimeter walls for out-of-plane forces, and associated detailing requirements, varied
depending on the applicable building code for each design scenario.
5.2 Wind Design
For wind design, lateral forces are in accordance with ASCE/SEI 7-05. The
following factors were considered in the design:
Occupancy category: II
Importance factor: I = 1.0
Exposure category for wind design: C (retail buildings are frequently located
adjacent to large open parking areas)

5-4 5: Retail Building GCR 14-917-26
Basic wind speed: 90 miles per hour (3-second gust)
Base shear: V = 120 kips (north-south direction) and 80 kips (east-west direction)
factored to the strength design level (1.6W) to facilitate comparison with the
seismic forces in the other designs
Out-of-plane wall design force: 27 psf for typical portions of panels away from
areas of discontinuity factored to the strength design level (1.6W) to facilitate
comparison with the seismic forces in other designs
The main lateral force-resisting system for the structure is tilt-up reinforced concrete
shear walls around the perimeter of the building, as shown in Figure 5-1. Elevation
views of the perimeter walls are shown in Figure 5-3 and Figure 5-4. ACI 318-05,
Building Code Requirements for Structural Concrete and Commentary (ACI, 2005),
provisions were utilized for shear wall design. Because this is a design for wind
loads, there are no special considerations or detailing requirements related to the in-
plane design, out-of-plane design, or out-of-plane anchorage for the tilt-up reinforced
concrete walls.
Figure 5-3 Elevation of north and south (side) walls of the retail building (all designs).

GCR 14-917-26 5: Retail Building 5-5
Figure 5-4 Elevation of west (front) and east (rear) walls of the retail building (all designs).
5.3 Current Local Seismic Code Design
Consistent with current practice in Memphis, the current local seismic code design
utilizes the 1999 SBC. As is common practice for this type of building, the seismic
base shear of the building was evaluated using linear static analysis, or more
specifically, the Equivalent Lateral Force procedure, as defined in the 1999 SBC.
For seismic design using the 1999 SBC, the tilt-up shear walls are classified as
“reinforced concrete shear walls” within a “bearing wall” system when supporting
vertical loads, and within a “building frame” system when not supporting vertical
loads. ACI 318-95, Building Code Requirements for Structural Concrete and
Commentary (ACI, 1995), provisions are used for shear wall design, as referenced by
the 1999 SBC. Although seismic loads are considered, the 1999 SBC does not have
any special detailing requirements related to in-plane design or out-of plane design
for the tilt-up concrete walls for seismic effects. However, the 1999 SBC does
contain requirements for consideration of the out-of-plane anchorage design for
seismic effects beyond that required for wind loading. The following seismic factors
were considered in the design:
Seismic hazard exposure group: I
Importance factor: I = 1.0
Soil site coefficient: S3 = 1.5

5-6 5: Retail Building GCR 14-917-26
Seismic performance category: C
Effective peak acceleration: Aa = 0.157g
Effective peak velocity related acceleration: Av = 0.188g
Response modification coefficient: R = 4.5 for bearing wall system (east-west
loading direction) and 5.5 for building frame system (north-south loading
direction)
Seismic base shear coefficient: Cs = 0.087 (east-west direction) and 0.071 (north-
south direction)
Base shear:
For shear walls: V = 155 kips (east-west direction) and 125 kips (north-south
direction)
For diaphragms: V = 95 kips (east-west direction) and 100 kips (north-south
direction)
Out-of-plane wall design force: Fp = 0.188wp = 15 psf
Wall anchorage design force:
Bearing walls: Fp = 0.188wp = 15 psf
Non-bearing walls: Fp = 0.254wp = 20 psf
Seismic base shear forces for the shear walls are approximately 1.05 and 1.9 times
larger than the wind loads in the north-south and east-west directions, respectively.
However, for wall reinforcing and detailing, factored ASCE/SEI 7-05 out-of-plane
forces for wind (27 psf at 1.6W), rather than in-plane forces, govern the wall design,
even when increased 1999 SBC in-plane and out-of-plane seismic forces (15 psf to
20 psf) are considered.
For diaphragm design and shear transfer detailing, 1999 SBC seismic forces are
approximately 0.8 and 1.2 times the calculated wind loads in the north-south and
east-west directions, respectively. However, because of the overall magnitude of the
loading, the same nominal detailing of the diaphragm (1 1/2 inch deep, 22 gauge steel
deck with 60 inches on center side lap fastener spacing) and shear-transfer details
(standard joist roll-over mechanism and 24 inch ledger bolt spacing) can be used for
both designs. Likewise, similar in-plane detailing of nominal connections for shear
transfer and overturning resistance along the base of the walls to the slab-on-grade or
foundation satisfies requirements for both design cases.
For out-of-plane wall anchorage design, the 1999 SBC contains specific seismic
force requirements. The magnitude of the seismic forces (20 psf) is still less than the
magnitude of the factored wind design forces (27 psf at 1.6W). The 1999 SBC does
Bearing Wall Systems In this design, a building frame system was defined as a structure with an essentially complete space frame (therefore columns) for all gravity loads, consistent with editions of ASCE/SEI 7 prior to 2005. Thus, the building is classified as a bearing wall type of system even if all the bearing walls are aligned in one of the two principal directions. However, the practice in Memphis has been to follow the concept in ASCE/SEI 7-10 where the R factor is different for the two directions, and that was applied to the design per the 1999 SBC.

GCR 14-917-26 5: Retail Building 5-7
not contain any additional seismic detailing requirements for transferring anchorage
forces from the wall anchors into the diaphragm, (i.e., there are no subdiaphragm
requirements). Therefore, the same detailing used for the wind design is used in the
seismic design for wall anchorage connections and diaphragm attachment patterns in
the bays adjacent to the walls. However, to resolve the seismic anchorage forces in a
shorter depth of diaphragm, the spacing of diaphragm side lap fasteners is reduced
from 60 inches to 24 inches in a portion of the bays adjacent to the front and rear
walls in both designs.
5.4 Current National Seismic Code Design
The current national seismic code design complies with ASCE/SEI 7-10 seismic
design provisions, which is the basis for the 2012 IBC. Seismic forces were
evaluated using the Equivalent Lateral Force procedure.
For seismic design using ASCE/SEI 7-10, the tilt-up shear walls are classified as
“intermediate precast shear walls” within a “bearing wall” system when supporting
vertical loads, and within a “building frame” system when not supporting vertical
loads. ACI 318-08, Building Code Requirements for Structural Concrete and
Commentary (ACI, 2008), provisions for intermediate precast shear walls are
followed for this design, as referenced by ASCE/SEI 7-10, but detailing for “special”
shear walls is not required in this scenario. ASCE/SEI 7-10 contains requirements
for consideration of the out-of-plane anchorage design and detailing for seismic
effects beyond that required for wind loading. The following seismic factors were
considered in the design:
Risk category: II
Importance factor: I = 1.0
Soil site class: D (stiff soil)
Seismic design category: SDC D
Short period design spectral response acceleration: SDS = 0.660g
1-second period design spectral response acceleration: SD1 = 0.361g
Response modification coefficient: R = 4.0 for bearing wall system (east-west
loading direction) and 5.0 for building frame system (north-south loading
direction)
Seismic base shear coefficient: Cs = 0.165 (east-west direction) and 0.132 (north-
south direction)
Base shear:
For shear walls: V = 300 kips (east-west direction) and 240 kips (north-south
direction)
Tilt-up Walls Even though precast concrete tilt-up walls under strong ground shaking behave very differently than cast-in-place concrete walls, there has been a long practice of using the same design parameters as those used for cast-in-place walls, and ignoring cast-in-place detailing rules that simply do not apply to precast panels. The newer standards, as represented by ASCE/SEI 7-10, have changed that practice by creating design rules specifically for precast panels.

5-8 5: Retail Building GCR 14-917-26
For diaphragms: V = 180 kips (east-west direction) and 185 kips (north-south
direction)
Out-of-plane wall design force: Fp = 0.264wp = 21 psf
Wall anchorage design force: Fp = 0.528wp = 42 psf (structural walls)
The layout of the lateral force-resisting system remains the same as in previous
designs, but some of the detailing is changed because of higher forces and additional
detailing requirements.
Seismic base shear forces for the shear walls in the ASCE/SEI 7-10 design are
approximately 1.9 times the 1999 SBC seismic base shear, and as much as 3.75 times
ASCE/SEI 7-05 wind loading (depending on direction). However, for wall
reinforcing and detailing, the factored ASCE/SEI 7-05 out-of-plane forces for wind
(27 psf at 1.6W), rather than in-plane forces, govern the wall design, even when
increased ASCE/SEI 7-10 in-plane and out-of-plane seismic loads (21 psf at 1.0E)
are considered.
For diaphragm design and shear transfer detailing, ASCE/SEI 7-10 seismic forces are
approximately 1.9 times the 1999 SBC seismic forces, and as much as 2.3 times the
design wind load (depending on direction). Even with the increase in seismic forces,
the magnitude is such that the same nominal detailing of the diaphragm (1 1/2 inch
deep, 22 gauge deck with 60 inches on center side lap fastener spacing) can be used
for over 75% of the diaphragm area (see below regarding out-of-plane wall
anchorage detailing considerations for the perimeter bays at the front and rear walls).
Similarly, the size of the perimeter ledger angle, and its bolted shear transfer
connection to the walls, remain the same among all three designs. On the other hand,
the ASCE/SEI 7-10 design requires changes to details for shear transfer between the
diaphragm and the ledger angle, through use of blocking elements between joists to
directly transfer the shear forces, because the capacity of the joist roll-over
mechanism is not sufficient.
For out-of-plane wall anchorage design and detailing, ASCE/SEI 7-10 seismic forces
(42 psf at 1.0E) and detailing requirements necessitate the following changes to the
prior designs: (1) increased strength of anchors at wall anchorage connections to
OWJs; (2) increased axial strength of OWJs and joist seats; (3) increased connection
requirements between OWJs at grid lines and between OWGs to create continuous
crossties; (4) increased depth of subdiaphragm regions to comply with the 5:2 ratio;
and (5) increased deck attachments within the subdiaphragm regions in the perimeter
bays at the front and rear walls.
Nominal connections along wall bases at the slab-on-grade or foundation satisfy
shear transfer and overturning requirements for all design cases, except that dowels

GCR 14-917-26 5: Retail Building 5-9
are added in the ASCE/SEI 7-10 design between the slab and foundation to comply
with requirements for positive connections to the foundation.
5.5 Cost Comparison
The methodology for establishing construction costs is explained in Chapter 9; details
of the cost estimate are included in Appendix C. Even though the lateral forces for
the two seismic designs are larger than those for the wind design, the change in total
construction cost is only a small percentage of the cost of the wind design.
A comparison of costs and required strengths for each design level is shown in Table
5-1 and Table 5-2. The results in Table 5-1 are shown as ratios relative to the values
of base shear or cost for the wind design. For this building, the estimated total
construction cost for the wind design is $101.15 per square foot. Table 5-1 shows
that the total construction cost of the retail building increases by 0.3% and 0.5%,
relative to the wind design, when considering 1999 SBC and ASCE/SEI 7-10 seismic
design requirements, respectively. The increased structural costs for the two seismic
designs are primarily due to increased detailing requirements related to out-of-plane
wall anchorage, and to a lesser extent due to increased seismic forces.
Table 5-1 Base Shear and Cost Comparisons between the Retail Building Wind and Seismic Designs
Wind
Design Current Local
Seismic Code(1) Current National Seismic Code(1)
Ratio Increase Ratio Increase
Base Shear
North-South Direction
East-West Direction
1.0
1.0
1.04
1.94
-
-
2.00
3.75
-
-
Structural Cost 1.0 1.002 0.2% 1.006 0.6%
Total Building Cost 1.0 1.003 0.3% 1.005 0.5%
Notes: (1) Ratios and increases are relative to wind design.
Table 5-2 compares the two seismic designs. Results in Table 5-2 are shown as
ratios relative to the values of base shear or cost for current local seismic code
design. The increase in total construction cost between the 1999 SBC design and the
ASCE/SEI 7-10 design is 0.2%.

5-10 5: Retail Building GCR 14-917-26
Table 5-2 Base Shear and Cost Comparisons between the Retail Building Seismic Designs
Current Local Seismic Code Current National Seismic Code(1)
Ratio Increase
Base Shear
North-South Direction 1.0 1.92 -
East-West Direction 1.0 1.94 -
Structural Cost 1.0 1.005 0.5%
Total Building Cost 1.0 1.002 0.2%
Notes: (1) Ratios and increases are relative to current local seismic code design.
5.6 Benefits Comparison
Benefits are assessed based on relative performance of the designs. Benefits
associated with improved seismic design of the retail building were assessed
qualitatively.
5.6.1 Qualitative Comparison
In general, better seismic performance is achieved through increased lateral design
forces (i.e., base shear), and detailing requirements that improve structural
connection strength or structural member behavior in the inelastic range of response.
Requirements for seismic bracing and anchorage of nonstructural components reduce
potential for nonstructural damage and loss of building (or system) functionality.
A comparison of the base shear forces for the retail building designs in each direction
is provided in Table 5-1 and Table 5-2. Seismic base shears for the 1999 SBC design
are essentially the same as design wind loading in the north-south direction, and 1.9
times design wind loading in the east-west direction. Seismic base shears for the
ASCE/SEI 7-10 design are 2.0 times design wind loading in the north-south
direction, and 3.8 times design wind loading in the east-west direction.
These increases in design base shear are significant. They are an indication that the
seismic designs will perform better in the event of an earthquake, but they are not the
sole determining factor. They are, however, an indication that a building designed
considering wind loading only, will perform significantly worse in the event of an
earthquake.
The performance of tilt-up concrete building structures, especially those with
untopped steel deck diaphragms, is highly dependent on both the in-plane behavior of
the roof deck diaphragm and the out-of-plane behavior of the walls and their
connections. For low-rise buildings with large concrete wall panels, in-plane strength
of walls acting as shear walls usually far exceeds that of the other elements of the

GCR 14-917-26 5: Retail Building 5-11
system. Contrary to the assumption inherent in the seismic provisions of building
codes, the dynamic response of the structure as a whole depends on the behavior of
the flexible (and relatively weak) diaphragm.
Tilt-up wall buildings are particularly vulnerable to partial collapse, in which one or
more wall panels separate from the roof and fall away from the building. This can
lead to collapse of an adjacent bay of roof framing. The out-of-plane behavior of
walls is generally considered to be more dependent on the behavior of the
connections and systems (subdiaphragms) at the points of anchorage of panels than
simply on the behavior of the concrete and reinforcing steel within the panels
themselves. For buildings with tilt-up walls anchored to a flexible diaphragm, the
importance of the out-of-plane anchorage is evident in the specific provisions enacted
in newer building codes in response to undesirable performance observed in actual
earthquakes.
Of the three designs, the building designed for wind loads alone is expected to have
the highest likelihood of experiencing some degree of collapse in a significant
earthquake. The wind design uses the same force for design of the wall for out-of-
plane wall resistance and for design of the anchorage at the top of wall. There are no
special detailing requirements regarding the out-of-plane wall anchorage. Given the
normal proportions of concrete wall panels, a brittle anchorage failure is more likely
to occur than a brittle failure of the wall panel itself. The out-of-plane wall
anchorage design force for the wind design is approximately 40% less than the
comparable ASCE/SEI 7-10 seismic design force, and the resulting anchorage design
is inadequate for the ASCE/SEI 7-10 design forces. Furthermore, the detailing used
to resist the anchorage force lacks the capability to avoid a premature breakout failure
in the concrete or to develop the anchorage force into the diaphragm (through
subdiaphragms) in such a way so as to develop ductile and predictable behavior as
required by ASCE/SEI 7-10. Much of the nominal design and detailing for the
concrete shear wall under wind loading is still adequate under ASCE/SEI 7-10
loading. However, design and detailing for shear transfer between the diaphragm and
walls, and between the walls and foundation, for the wind design would be
inadequate for the ASCE/SEI 7-10 design force levels.
In the 1999 SBC design, the lateral force-resisting system is classified as a reinforced
concrete shear wall system and is designed in accordance with ACI 318-95
provisions. Under ASCE/SEI 7-10, the lateral force-resisting system is classified as
an intermediate precast shear wall system and is designed in accordance with ACI
318-08 provisions, which has fewer extra detailing rules than the special shear wall
system. Much of the nominal design and detailing for the shear wall under the 1999
SBC loading is still adequate under the ASCE/SEI 7-10 loading. However, design
and detailing for shear transfer between the diaphragm and walls and between the

5-12 5: Retail Building GCR 14-917-26
walls and foundation for the 1999 SBC design would be inadequate for the
ASCE/SEI 7-10 design force levels.
Although the 1999 SBC does not have any special detailing requirements related to
in-plane and out-of-plane design for the tilt-up concrete walls, it does contain some
requirements for out-of-plane wall anchorage design beyond those required for a
wind-only design. However, there are no specific detailing requirements, so the
anchorage is vulnerable to premature failure in the concrete or on the diaphragm
edge.
The lack of adequate load paths for shear transfer and out-of-plane anchorage for the
wind design and the 1999 SBC design increases the probability of collapse, damage,
and casualties in the event of a moderate to large earthquake, such as the design
ground motion and the MCE ground motion based on ASCE/SEI 7-10. The highest
risk of collapse is likely attributable to the behavior of the out-of-plane wall
anchorage system.
The ASCE/SEI 7-10 design is considered to provide an acceptable level of
performance during a design seismic event and an acceptable level of safety against
collapse during a Maximum Considered Earthquake (MCE).
Another difference between the wind design and the seismic designs, is the
performance of nonstructural items, such as windows, ceilings, mechanical,
electrical, and plumbing (MEP) equipment and distribution systems, fire sprinkler
systems, storage racks, and other furnishings. Under ASCE/SEI 7-05 wind design
requirements, nonstructural items likely would not be anchored or braced to resist
seismic forces and deformations. In the 1999 SBC design, nonstructural items would
be anchored or braced, but design forces would be smaller than those required in
ASCE/SEI 7-10. Although most nonstructural items are generally considered
noncritical in a retail building, the lack of adequate bracing and anchorage could
cause the building to become unusable due to water damage, lack of water and power
supply, and lack of fire suppression capability. In addition, damage to storage racks
due to lack of adequate bracing and anchorage could result in financial loss (based on
the value of the stored inventory), injury to occupants, and structural damage
depending on configuration and size of the racks.
The increased strength and improved detailing of a seismic system can increase the
resistance of a structure to extreme windstorms, and wind loads in excess of code
design levels. Seismic design, however, will not improve some aspects of wind load
resistance on buildings. Suction can create net uplift on the roof structure, and steel
OWJ systems require specific design and detail features for resistance to uplift that
are not inherent in the seismic design. Thus, if the roof configuration is such that
uplift is a controlling failure mode, seismic design will not improve the performance.

GCR 14-917-26 5: Retail Building 5-13
Similarly, seismic design will not improve the resistance of nonstructural portions of
the walls (e.g., glass and aluminum storefronts) to extreme wind loads or wind-borne
debris.
5.7 Conclusions
Implementation of seismic design requirements for retail buildings will result in total
construction cost increases of 0.3% for current local seismic code (1999 SBC)
requirements, and 0.5% for current national seismic code (ASCE/SEI 7-10)
requirements, when compared to the wind design.
Qualitatively, the lack of adequate load paths for shear transfer and out-of-plane
anchorage for the wind and 1999 SBC designs increases the probability of collapse,
damage, and casualties in the event of a moderate to large earthquake, such as the
design ground motion and the MCE ground motion based on ASCE/SEI 7-10. The
highest risk of collapse is likely attributable to the behavior of the out-of-plane wall
anchorage system. The ASCE/SEI 7-10 design is considered to provide an
acceptable level of performance during a design seismic event and an acceptable
level of safety against collapse during a Maximum Considered Earthquake (MCE).


GCR 14-917-26 6: Warehouse Building 6-1
Chapter 6
Warehouse Building
This chapter compares relative construction costs associated with varying levels of
earthquake resistance for differing lateral force-resisting system designs of a
warehouse building located in Memphis, Tennessee, and assesses the benefits of
improved seismic resistance. To make these comparisons, three different designs
were developed:
1. Wind design according to ASCE/SEI 7-05, Minimum Design Loads for Buildings
and Other Structures (ASCE, 2006),
2. Current local seismic code design according to the 1999 SBC, Standard Building
Code (SBCCI, 1999), and
3. Current national seismic code design according to ASCE/SEI 7-10, Minimum
Design Loads for Buildings and Other Structures (ASCE, 2010), which is the
basis for the 2012 edition of the International Building Code (ICC, 2012).
6.1 Building Description
The warehouse is a one-story tilt-up concrete (tilt-wall) building. The footprint of the
building is approximately 500 feet by 800 feet, providing roughly 400,000 square
feet of floor area. A separation joint in the north-south direction divides the structure
equally into western and eastern halves. Appendix D provides a list of complete
drawings available for this building.
6.1.1 General
Figure 6-1 shows the plan of the building. The bays are spaced at 50 feet in each
direction. The height of the roof is approximately 40 feet at the ridge (which runs in
the east-west direction) and 35 feet at the north and south side walls. The perimeter
tilt-up concrete walls serve as the primary cladding system and top of wall elevation
typically follows the top of roofing with no parapet. The side walls contain
numerous openings for roll-up doors. Standard exit doors are spaced regularly
around the perimeter. A minor amount of storefront cladding is assumed at one
corner of the building where a small office or support space would likely be located.
A separation joint in the north-south direction utilizing a double column grid divides
the structure equally into a western half and an eastern half.
Large Warehouses Many large warehouse buildings of the type examined in this chapter exist in Memphis because the area is a distribution hub.

6-2 6: Warehouse Building GCR 14-917-26
The primary gravity framing system consists of untopped steel deck spanning
between steel open web joists (OWJ) supported on steel open web joist-girders
(OWG) at the interior and tilt-up concrete walls at the perimeter. The basic roof
framing plan is depicted in Figure 6-2.
Although the gravity system remains the same in all designs, the lateral force-
resisting system changes among the three designs in terms of design strength and
detailing requirements. The primary lateral force-resisting system for all three
designs for each half of the structure, as separated by the separation joint running in
the north-south direction, consists of perimeter tilt-up concrete shear walls on three
sides and a steel braced frame system along the grid line adjacent to the separation
joint.
Figure 6-1 Basic foundation plan for warehouse building (all designs).

GCR 14-917-26 6: Warehouse Building 6-3
Figure 6-2 Basic roof framing plan for warehouse building (all designs). Note that joists are omitted in central area to make notes visible.
6.1.2 Foundations
All three designs have the same foundation system consisting of shallow reinforced
concrete spread footings supporting the steel columns, and continuous footings
supporting the perimeter tilt-up concrete walls, as shown in Figure 6-1. The side
walls have stepped-down footings to accommodate loading dock access. The slab-
on-grade is unreinforced and six inches thick over a 12 inch thick soil-cement base
per the recommendations of the soils report for the site (see Appendix B for a
detailed soils report).
6.1.3 Gravity Framing System
The roof structure consists of 1 1/2 inch deep, 22 gauge, untopped steel deck
spanning to steel OWJs. The spacing of the OWJs complies with FM Global rating
requirements for steel deck supporting roofing. The OWJs are supported on steel
OWGs at the interior grid lines. The OWGs are supported by 9x9 hollow structural
section (HSS) steel tube columns throughout the interior space. A girder that
supports a half-bay width bears on an embedded steel connection in the walls near
each corner of the building. At the 8.5 inch thick tilt-up concrete perimeter walls, the
OWJs bear on steel angle ledgers. The OWJ layout is such that essentially all
perimeter walls serve as bearing walls, as shown in Figure 6-2. By rotating the

6-4 6: Warehouse Building GCR 14-917-26
framing in this layout, the effects of concentrated point loads on the walls from the
OWGs have been minimized.
The design includes dead loads of 11.5 pounds per square foot and live loads of 20.0
pounds per square foot for the OWJs. The OWJ and OWG are designated as 30K7
and 50G8N8.5k, respectively. Although in practice OWJ and OWG designs are
deferred to the joist manufacturer, preliminary calculations and past project
experience were used to establish specific designations to allow for estimation of
construction costs.
6.1.4 Lateral Force-Resisting System
The lateral force-resisting system consists of the steel roof deck diaphragm spanning
to perimeter tilt-up concrete shear walls in combination with an inverted-V steel
braced frame along the separation joint. Along each braced frame line, wide-flange
(WF) steel girder collectors replace OWGs. The steel deck attachment pattern varied
based on lateral force levels and detailing requirements for each applicable building
code. The walls on all sides were classified as bearing shear walls. Appropriate
lateral design factors for the east-west direction were chosen based on the applicable
code designation for bearing concrete shear walls. The north-south direction uses
perimeter shear walls and interior brace frames. Therefore, the appropriate lateral
design factors were chosen for the building as a whole or on a line-by-line basis,
based on the provisions of the applicable building code, as discussed below. Design
and anchorage of perimeter walls for out-of-plane forces, and associated detailing
requirements, varied depending on the applicable building code for each design
scenario.
6.2 Wind Design
For wind design, lateral forces are in accordance with ASCE/SEI 7-05. The
following factors were considered in the design:
Occupancy category: II
Importance factor: I = 1.0
Exposure category for wind design: C (warehouse buildings are frequently
located adjacent to large open parking areas)
Basic wind speed: 90 miles per hour (3-second gust)
Base shear: V = 150 kips (north-south direction) and 180 kips (east-west
direction) factored to the strength design level (1.6W) to facilitate comparison
with the seismic forces in the other designs

GCR 14-917-26 6: Warehouse Building 6-5
Out-of-plane wall design force: 28 psf for typical portions of panels away from
areas of discontinuity factored to the strength design level (1.6W) to facilitate
comparison with the seismic forces in other designs
The main lateral force-resisting system for each half of the structure, as separated by
the separation joint running in the north-south direction, consists of tilt-up reinforced
concrete shear walls around the three exterior sides of the building and a single-bay
inverted-V steel braced frame along the interior, as shown in Figure 6-2. Elevation
views of the perimeter walls and steel braced frame are shown in Figures 6-3 through
6-5. ACI 318-05, Building Code Requirements for Structural Concrete and
Commentary (ACI, 2005), provisions are utilized for shear wall design. Because this
is a wind design, there are no special considerations or detailing requirements related
to the in-plane design, out-of-plane design, or out-of-plane anchorage for the tilt-up
concrete walls. ANSI/AISC 360-05, Specification for Structural Steel Buildings
(ANSI/AISC, 2005), provisions are utilized for steel braced frame member and
connection design without consideration of seismic load effects or special detailing.
Figure 6-3 Elevation of north (side) wall of the warehouse building (all designs).
Figure 6-4 Elevation of west (front) and east (rear) walls of the warehouse building (all designs).

6-6 6: Warehouse Building GCR 14-917-26
(a)
(b)
Figure 6-5 Elevation of steel braced frame of the warehouse building: (a) wind and current local seismic code design; and (b) current national seismic code design.
6.3 Current Local Seismic Code Design
Consistent with current practice in Memphis, the current local seismic code design
utilizes the 1999 SBC. As is common practice for this type of building, the seismic
base shear of the building was evaluated using a linear static analysis, or more
specifically, the Equivalent Lateral Force procedure, as defined in the 1999 SBC.
For seismic design using the 1999 SBC, the tilt-up shear walls are classified as
“reinforced concrete shear walls” within a “bearing wall” system in each direction,
and the braced frame is classified as a “steel concentrically braced frame” within a
“building frame” system. ACI 318-95, Building Code Requirements for Structural
Concrete and Commentary (ACI, 1995), provisions are used for shear wall design, as
referenced by the 1999 SBC. The Seismic Provisions for Structural Steel Buildings
(AISC, 1997) is used for steel braced frame member and connection design, as
referenced by the 1999 SBC, considering the system as an ordinary concentrically
braced frame. Although seismic loads are considered, the 1999 SBC does not have
GCR 14-917-26 6: Warehouse Building 6-7
any special detailing requirements related to in-plane design and out-of plane design
of tilt-up concrete walls for seismic effects. However, the 1999 SBC contains
requirements for consideration of out-of-plane anchorage design for seismic effects
beyond that required for wind loading. The following seismic factors were
considered in the design:
Seismic hazard exposure group: I
Importance factor: I = 1.0
Soil site coefficient: S3 = 1.5
Seismic performance category: C
Effective peak acceleration: Aa = 0.154g
Effective peak velocity related acceleration: Av = 0.191g
Response modification coefficient: R = 4.5 for reinforced concrete shear wall
bearing wall system (east-west loading direction and north-south loading
direction along exterior line) and 5.0 for steel concentrically braced frame
building frame system (north-south loading direction along interior line)
Seismic base shear coefficient: Cs = 0.086 (east-west direction, the diaphragm,
and the reinforced concrete shear wall in the north-south direction), and 0.077
(steel concentrically braced frame in the north-south direction)
Base shear:
For shear walls: V = 500 kips (east-west direction) and 500 kips (north-south
direction)
For braced frame: V = 450 kips (north-south direction)
For diaphragms: V = 365 kips (east-west direction) and 410 kips (north-south
direction)
Out-of-plane wall design force: Fp = 0.191wp = 20 psf
Wall anchorage design force: Fp = 0.191wp = 20 psf (bearing walls)
Seismic base shear forces for the shear walls are approximately 3.33 times and 2.75
times the wind loads in the north-south and east-west directions, respectively.
However, factored ASCE/SEI 7-05 wind out-of-plane forces (28 psf at 1.6W), rather
than in-plane forces, govern the wall reinforcing design and detailing, even when
1999 SBC in-plane and out-of-plane (20 psf at 1.0E) seismic forces are considered.
Seismic base shear forces for the braced frame are approximately 3.0 times the wind
loads. Therefore, the 1999 SBC seismic design requires both more braces (two-bay
configuration versus one-bay configuration) and larger braces (HSS 12x12x5/16
versus HSS 8x8x5/16) as compared to the wind design. However, by designing the
Wind and Seismic Loads Although the warehouse building and the retail building, described in Chapter 5, are of very similar construction, it should be noted that the increase in difference between the wind design and the current local seismic code design is much larger for the warehouse building. This is because wind loading depends primarily on the extent of the building in a vertical plane (the “sail” area), while seismic loading depends primarily on the extent in plan.
6-8 6: Warehouse Building GCR 14-917-26
braced frame as an ordinary concentrically braced frame, and employing overstrength
(0) loading to certain design calculations, no additional detailing requirements were
triggered regarding member slenderness and section compactness, or unbalanced load
on the girder compared to the wind design.
For diaphragm design and shear transfer detailing, 1999 SBC seismic forces are
approximately 2.4 and 2.3 times the design wind loads in the north-south and east-
west directions, respectively. However, because of the overall magnitude of the
loading, the same nominal detailing of the diaphragm (1 1/2 inch deep, 22 gauge deck
with 60 inches on center side lap fastener spacing) and shear-transfer details
(standard joist roll-over mechanism and 24 inches ledger bolt spacing) can be used
for both designs. Along the braced frame line, a slight increase in size is required for
some of the wide-flange girders (from W24x55 for wind design to W24x68 for
seismic design) due to subtle differences in the design requirements.
For out-of-plane wall anchorage design, the 1999 SBC contains specific seismic
force requirements. The magnitude of the seismic forces (20 psf) is still less than the
magnitude of the factored wind design loads (28 psf at 1.6W). The 1999 SBC does
not contain any additional seismic detailing requirements for transferring anchorage
forces from the wall anchors into the diaphragm (i.e., there are no subdiaphragm
requirements). Therefore, the same detailing used for the wind design is used in the
seismic design for wall anchorage connections and diaphragm attachment patterns in
the bays adjacent to the walls.
6.4 Current National Seismic Code Design
The current national seismic code design complies with ASCE/SEI 7-10 seismic
design provisions, which is the basis for the 2012 IBC. Seismic forces were
evaluated using the Equivalent Lateral Force procedure.
For seismic design using ASCE/SEI 7-10, the tilt-up shear walls are classified as
“intermediate precast shear walls” within a “bearing wall” system. The steel braced
frame is classified as a “steel ordinary concentrically braced frame” within a
“building frame” system (as allowed for one-story buildings by the footnote in
ASCE/SEI 7-10 Table 12.2-1). ACI 318-08, Building Code Requirements for
Structural Concrete and Commentary (ACI, 2008), provisions for intermediate
precast shear walls are followed for the wall design in this scenario, as referenced by
ASCE/SEI 7-10, but detailing for “special” shear walls is not required. The Seismic
Provisions for Structural Steel Buildings (AISC, 2005) are utilized for the design of
the steel brace members and connections, as referenced by ASCE/SEI 7-10.
ASCE/SEI 7-10 contains requirements for consideration of out-of-plane anchorage
design and detailing for seismic effects beyond that required for wind loading (and

GCR 14-917-26 6: Warehouse Building 6-9
beyond those required by the 1999 SBC). The following seismic factors were
considered in the design:
Risk category: II
Importance factor: I = 1.0
Soil site class: D (stiff soil)
Seismic design category: SDC D
Short period design spectral response acceleration: SDS = 0.653g
1-second period design spectral response acceleration: SD1 = 0.358g
Response modification coefficient: R = 4.0 for bearing wall system (east-west
loading direction and north-south direction loading along exterior line) and 3.25
for building frame system (north-south loading direction along interior line)
Seismic base shear coefficient: Cs = 0.163 (east-west direction, east-west
diaphragm, and north-south shear walls) and 0.201 (north-south braced frame and
north-south diaphragm)
Base shear:
For shear walls: V = 940 kips (east-west direction and north-south direction)
For braced frame: 1155 kips (north-south direction)
For diaphragms: 700 kips (east-west direction) and 950 kips (north-south
direction)
Out-of-plane wall design force: Fp = 0.262wp = 28 psf
Seismic wall anchorage design force: Fp = 0.524wp = 56 psf (structural walls)
The layout of the lateral force-resisting system remains the same as in previous
designs, but the detailing is changed significantly because of higher loads and
additional code requirements. (From the discussion in Section 6.3 above, the 1999
SBC seismic design and the ASCE/SEI 7-05 wind design were slightly different,
notably regarding the braced frame configuration and design.)
Seismic base shear forces for the shear walls in the ASCE/SEI 7-10 design, including
the differences in ground motion acceleration and response modification factors, are
approximately 1.88 times the 1999 SBC seismic base shear, and as much as 6.27
times ASCE/SEI 7-05 wind loading. For wall vertical reinforcing and detailing,
ASCE/SEI 7-10 out-of-plane seismic design forces, rather than in-plane forces,
govern the design, yielding increased reinforcing steel and detailing considerations as
compared to the prior designs. Furthermore, ACI 318-08 provisions for intermediate
precast shear walls require additional wall horizontal reinforcing steel and detailing

6-10 6: Warehouse Building GCR 14-917-26
considerations relative to the prior designs (although still not “special” detailing
considerations and still not as much reinforcing as would be in special shear walls).
The base shear load for the braced frame for the ASCE/SEI 7-10 design is 2.57 times
that calculated for 1999 SBC seismic design, which was larger than that calculated
for wind design. Although a two-bay configuration is maintained to minimize impact
to the floor space, the ASCE/SEI 7-10 seismic design requires larger braces
compared to the 1999 SBC seismic design. The 2005 Seismic Provisions used also
contain more restrictive requirements for ordinary concentrically braced frames
compared to the 1999 SBC design based on the 1997 Seismic Provisions. Therefore,
the ordinary concentrically braced frames for the ASCE/SEI 7-10 design complies
with tighter limits for member slenderness and section compactness and must
consider unbalanced load effects on the girder. The unbalance occurs in an inverted-
V bracing system when the brace in compression buckles while the brace in tension
continues to resist higher loads. This imbalance causes a net downward load at the
midspan of the girder. The unbalanced load effect is such that a large “zipper”
column is used.
For diaphragm design and shear transfer detailing, ASCE/SEI 7-10 seismic forces are
approximately 2.3 and 1.9 times the calculated 1999 SBC seismic forces in the north-
south and east-west loading directions, respectively. Because of the overall
magnitude of loading, the same nominal detailing of the diaphragm used in the prior
design (1 1/2 inch deep, 22 gauge deck with 60 inches on center side lap fastener
spacing) can be used for the majority of the interior bays of the diaphragm in this
design where the shear is low, but a much tighter (18 inch centers) side lap fastener
spacing must be used in perimeter bays to resist higher shear loads. Similarly, the
size of the perimeter ledger angle is increased in the ASCE/SEI 7-10 design, but the
same bolted shear transfer connection from the 1999 SBC seismic design is adequate.
Additionally, the ASCE/SEI 7-10 design requires changes to details for shear transfer
between the diaphragm and the ledger angle, through use of blocking elements
between joists to directly transfer shear forces, because the capacity of the joist roll-
over mechanism is not sufficient. Along the braced frame line, size increases and
stronger end connections are required for the wide-flange girders because of
increased design force requirements for collector elements in ASCE/SEI 7-10
compared to the 1999 SBC.
For out-of-plane wall anchorage design and detailing, ASCE/SEI 7-10 seismic force
(56 psf) and detailing requirements necessitate the following changes to the 1999
SBC design: (1) increased anchor bolts at wall anchorage connections to OWJs; (2)
increased axial strength of OWJs and joist seats; and (3) increased connection
requirements between OWJs at grid lines and from OWJs to OWGs to create
continuous crossties.
Zipper Columns Where two otherwise identical braces meet, an unbalanced vertical force is created because the buckling capacity of a brace is far less than the tensile yield capacity of a brace. If the girder resists this force in bending, it will deflect downward progressively in each load cycle. This progressive downward movement reduces the stiffness of the overall system. Rather than providing a girder large enough to handle the unbalanced vertical force in bending, a zipper column is placed at the intersection of inverted-V braces to provide a stiffer load path.

GCR 14-917-26 6: Warehouse Building 6-11
Nominal connections along wall bases at the slab-on-grade or foundation satisfy
shear transfer requirements for all design cases. However, the ASCE/SEI 7-10
design requires stronger connections to the foundations to resist higher overturning
forces at some panels and additional dowels between the slab and foundation at other
panels to comply with detailing requirements for positive connections to the
foundation. At braced frames, additional detailing is necessary to effectively transfer
shear from the column-brace interface into the foundation and increased foundations
are required because of increased seismic demand.
6.5 Cost Comparison
The methodology for establishing construction costs is explained in Chapter 9; details
of the cost estimate are included in Appendix C. Even though the lateral forces for
the two seismic designs are larger than those for the wind design, the change in total
construction cost is only a small percentage of the cost of the wind design.
A comparison of costs and relative strengths for each design level is shown in Table
6-1 and Table 6-2. The results in Table 6-1 are shown as ratios relative to the values
of base shear or cost for wind design. For this building, the estimated total
construction cost for the wind design is $63.46 per square foot. Table 6-1 shows that
the total construction cost of the warehouse building increases by 0.4% and 1.4%,
relative to the wind design, when considering 1999 SBC and ASCE/SEI 7-10 seismic
design requirements, respectively. The increase in cost for the 1999 SBC seismic
design relative to the wind design is primarily due to increased forces along the
separation joint, and detailing of the steel braced frame at that location.
Table 6-1 Base Shear and Cost Comparisons between the Warehouse Building Wind and Seismic Designs
Wind
Design Current Local
Seismic Code(1) Current National Seismic Code(1)
Ratio Increase Ratio Increase
Base Shear
North-South Direction
East-West Direction
1.0
1.0
3.33
2.78
-
-
6.27
5.22
-
-
Steel Braced Frames 1.0 3.00 - 7.70 -
Structural Cost 1.0 1.006 0.6% 1.029 2.9%
Total Building Cost 1.0 1.004 0.4% 1.014 1.4%
Notes: (1) Ratios and increases are relative to wind design.
Table 6-2 compares the two seismic designs. Results in Table 6-2 are shown as
ratios relative to the values of base shear or cost for current local seismic code
design. The increase in total construction cost between the 1999 SBC design and the

6-12 6: Warehouse Building GCR 14-917-26
ASCE/SEI 7-10 design is 1.0%. This increase in cost is primarily due to a
combination of higher seismic forces and additional seismic detailing requirements.
Table 6-2 Base Shear and Cost Comparisons between the Warehouse Building Seismic Designs
Current Local Seismic Code
Current National Seismic Code(1)
Ratio Increase
Base Shear
Shear Walls 1.0 1.88 -
Steel Braced Frame 1.0 2.57 -
Structural Cost 1.0 1.022 2.2%
Total Building Cost 1.0 1.010 1.0%
Notes: (1) Ratios and increases are relative to current local seismic code design.
6.6 Benefits Comparison
Benefits are assessed based on relative performance of the designs. Benefits
associated with improved seismic design of the warehouse building were assessed
qualitatively.
6.6.1 Qualitative Comparison
In general, better seismic performance is achieved through increased lateral design
forces (i.e., base shear), and detailing requirements that improve structural
connection strength or structural member behavior in the inelastic range of response.
Requirements for seismic bracing and anchorage of nonstructural components reduce
potential for nonstructural damage and loss of building (or system) functionality.
A comparison of the base shear forces for the warehouse building designs in each
direction is provided in Table 6-1 and Table 6-2. Seismic base shears for the 1999
SBC design are 3.3 times design wind loading in the north-south direction, and 2.8
times design wind loading in the east-west direction. Seismic base shears for the
ASCE/SEI 7-10 design are 6.3 times design wind loading in the north-south
direction, and 5.2 times design wind loading in the east-west direction.
These increases in design base shear are significant. They are an indication that the
seismic designs will perform better in the event of an earthquake, but they are not the
sole determining factor. They are, however, an indication that a building designed
considering wind loading only, will perform significantly worse in the event of an
earthquake.
The performance of tilt-up concrete building structures, especially those with
untopped steel deck diaphragms, is highly dependent on both the in-plane behavior of

GCR 14-917-26 6: Warehouse Building 6-13
the roof deck diaphragms and the out-of-plane behavior of the walls and their
connections. For low-rise buildings with large concrete wall panels, in-plane strength
of walls acting as shear walls usually far exceeds that of the other elements of the
system. Contrary to the assumption inherent in the seismic provisions of building
codes, the dynamic response of the structure as a whole depends on the behavior of
the flexible (and relatively weak) diaphragm.
Tilt-up wall buildings are particularly vulnerable to partial collapse, in which one or
more wall panels separate from the roof and fall away from the building. This can
lead to collapse of an adjacent bay of roof framing. The out-of-plane behavior of
walls is generally considered to be more dependent on the behavior of the
connections and systems (subdiaphragms) at the points of anchorage of panels than
simply on the behavior of the concrete and reinforcing steel within the panels
themselves. For buildings with tilt-up walls anchored to a flexible diaphragm, the
importance of the out-of-plane anchorage is evident in the specific provisions enacted
in newer building codes in response to undesirable performance observed in actual
earthquakes.
The inclusion of a steel braced frame as part of the lateral force-resisting system
requires additional consideration in terms of expected performance. Recent codes
have significantly changed requirements for detailing of braced frames systems to
address past limitations in performance, by including more stringent member
compactness and slenderness requirements to ensure the expected ductility can be
achieved. Although the behavior of the braces tends to get the most consideration,
differences between newer and older codes also focus on the performance of load
paths to the braces. Provisions for connection design are intended to ensure
sufficient strength to deliver maximum expected loads to braces without yielding in
the connections. Provisions for beams within inverted-V shaped frames are meant to
prevent yielding, or possible collapse, of the beam due to unbalanced loads occurring
as a result of brace buckling.
Of the three designs, the building designed for wind loads alone is expected to have
the highest likelihood of experiencing some degree of collapse in a significant
earthquake. The lack of adequate load paths for shear transfer and out-of-plane
anchorage for the wind design and the 1999 SBC design increases the probability of
collapse, damage, and casualties in the event of a moderate to large earthquake, such
as the design ground motion and the MCE ground motion based on ASCE/SEI 7-10.
The highest risk of collapse is likely attributable to the behavior of the out-of-plane
wall anchorage system.
The ASCE/SEI 7-10 design is considered to provide an acceptable level of
performance during a design seismic event and an acceptable level of safety against
collapse during a Maximum Considered Earthquake (MCE).

6-14 6: Warehouse Building GCR 14-917-26
Under ASCE/SEI 7-05 wind design requirements, nonstructural items likely would
not be anchored or detailed to resist seismic forces and deformations. In the 1999
SBC design, nonstructural items would be anchored or braced, but design forces
would be smaller than those required in ASCE/SEI 7-10. Although most
nonstructural items are generally considered noncritical in a warehouse building, lack
of adequate bracing and anchorage could cause the building to become unsuable due
to water damage, lack of water and power supply, and lack of fire suppression
capability. In addition, damage to storage racks due to lack of adequate bracing and
anchorage could result in financial loss (based on the value of the stored inventory),
injury to occupants, and structural damage depending on configuration and size of the
racks.
The increased strength and improved detailing of a seismic system can increase the
resistance of a structure to extreme windstorms, and wind loads in excess of code
design levels. Seismic design, however, will not improve some aspects of wind load
resistance on buildings. Suction can create net uplift on the roof structure, and steel
OWJ systems require specific design and detail features for resistance to uplift that
are not inherent the seismic design. Thus, if the roof configuration is such that uplift
is a controlling failure mode, seismic design will not improve the performance.
Similarly, seismic design will not improve the resistance of nonstructural portions of
the walls (e.g., such as roll-up doors, glass, and aluminum storefronts) to extreme
wind loads or wind-borne debris.
6.7 Conclusions
Implementation of seismic design requirements for warehouse buildings will result in
total construction cost increases of 0.4% for current local seismic code (1999 SBC)
requirements, and 1.4% for current national seismic code (ASCE/SEI 7-10)
requirements, when compared to the wind design.
Qualitatively, the lack of adequate load paths for shear transfer and out-of-plane
anchorage for the wind and 1999 SBC designs increases the probability of collapse,
damage, and casualties in the event of a moderate to large earthquake, such as the
design ground motion and the MCE ground motion based on ASCE/SEI 7-10. The
highest risk of collapse is likely attributable to the behavior of the out-of-plane wall
anchorage system. The ASCE/SEI 7-10 design is considered to provide an
acceptable level of performance during a design seismic event and an acceptable
level of safety against collapse during a Maximum Considered Earthquake (MCE).

GCR 14-917-26 7: Hospital Building 7-1
Chapter 7
Hospital Building
This chapter compares relative construction costs associated with varying levels of
earthquake resistance for differing lateral force-resisting system designs of a patient
room tower of an acute care hospital facility located in Memphis, Tennessee, and
assesses the benefits of improved seismic resistance. To make these comparisons,
three different designs were developed:
1. Wind design according to ASCE/SEI 7-05, Minimum Design Loads for Buildings
and Other Structures (ASCE, 2006),
2. Current local seismic code design according to ASCE/SEI 7-02, Minimum
Design Loads for Buildings and Other Structures (ASCE, 2002), which is the
basis for the 2003 edition of the International Building Code (ICC, 2003), and
3. Current national seismic code design according to ASCE/SEI 7-10, Minimum
Design Loads for Buildings and Other Structures (ASCE, 2010), which is the
basis for the 2012 edition of the International Building Code (ICC, 2012).
The exception in the local code that permits use of the 1999 SBC, Standard Building
Code (SBCCI, 1999) for the seismic design of other buildings, does not apply in the
case of hospitals. This results in local seismic requirements for hospitals that are
essentially consistent with current national seismic requirements.
7.1 Building Description
The building is a six-story hospital facility with a one-story basement. The footprint
of the building is approximately 150 feet by 180 feet, with a regular bay spacing of
30 feet, providing roughly 162,000 square feet of floor area. The building cladding
consists of typical glass and aluminum curtain wall. The elevator, stair, and
mechanical shaft openings are located near the center of the building. Appendix D
provides a list of complete drawings available for this building.
7.1.1 General
Figure 7-1 shows the plan of the building. The typical floor-to-floor height is 14 feet
with the exception of the first floor, which is 20 feet tall, giving an overall building
height of 90 feet above grade.
The primary gravity framing system consists of composite steel framing. Although
the gravity system remains the same in all designs, the required design strength and
Essential Facilities Hospitals with emergency treatment facilities are the prime example of what the structural provisions of the building code describe as essential facilities. More resistance to seismic forces and better resistance to damage of nonstructural components are required in the seismic provisions of ASCE/SEI 7-10.

7-2 7: Hospital Building GCR 14-917-26
detailing of the lateral force-resisting system change among the three designs. The
primary lateral force-resisting system for each of the three designs consists of steel
braced frames.
Figure 7-1 Hospital building foundation plan showing brace layout for wind design.
7.1.2 Foundations
The basement level is surrounded by a 12 inch thick concrete basement retaining
wall. Interior columns are supported on concrete spread footings, while the perimeter
columns are integrated into the basement retaining wall. The basement wall has a
continuous strip footing under it.
7.1.3 Gravity Framing System
The gravity framing system remains the same in all designs and consists of composite
steel framing.

GCR 14-917-26 7: Hospital Building 7-3
The floor and roof slabs consist of a 3 1/4 inch thick lightweight concrete topping
slab over a 3 inch deep, 20 gauge steel deck. Shear studs are provided throughout the
floor area to achieve composite action between the deck and steel beams. The deck
spans 10 feet and is supported by W16x31 steel beams that frame into W21x50 steel
girders. The girders frame into W12 columns.
7.1.4 Lateral Force-Resisting System
The lateral force-resisting system consists of steel concentrically braced frames for
wind design and buckling-restrained braced frames for seismic designs. The seismic
detailing also changes for each of the three designs.
7.2 Wind Design
For wind design, lateral forces are in accordance with ASCE/SEI 7-05. The
following factors were considered in the design:
Occupancy category: IV
Importance factor: I = 1.15
Exposure category: B (an urban or suburban area with numerous closely spaced
obstructions)
Basic wind speed: 90 miles per hour (3-second gust)
Base shear: V = 378 kips (north-south direction) and 454 kips (east-west
direction) factored to the strength design level (1.6W) to facilitate comparison
with the seismic forces in the other designs
The braced frames are laid out between four columns to create a core around the
elevators as shown in Figure 7-1. The braces are designed in accordance with the
Steel Construction Manual 13th Edition (AISC, 2006) to perform elastically for the
wind loading. There are no special detailing requirements related to wind design.
Hollow structural section (HSS) steel tubes are used for the braces, and they are
oriented in an inverted-V, as shown in Figure 7-2. With six bays in the north-south
direction, it is not possible to locate the braced core at the very center of the building.
This is not unusual, but creates some torsion under lateral loading, which, in the case
of wind loading can be resolved through the braced core. As shown, diagonal braces
are carried through the basement level, as is done in the seismic designs, to capture
incidental lateral forces that are not transferred through the basement walls.

7-4 7: Hospital Building GCR 14-917-26
(a) (b)
Figure 7-2 Hospital building braced frame elevations for: (a) wind design; and (b) current local seismic code design.
7.3 Current Local Seismic Code Design
Consistent with current practice in Memphis for essential facilities, the current local
seismic code design utilizes the 2003 IBC, which is based on ASCE/SEI 7-02. As is
common practice for this type of building, the seismic base shear of the building was
evaluated using linear dynamic analysis, or more specifically, Modal Response
Spectrum Analysis, as defined in ASCE/SEI 7-02.
The lateral force-resisting system consists of four bays of buckling-restrained braced
frames in each direction as shown in Figure 7-3. The layout resolves the inherent
torsion that is a characteristic of the design for wind. The 2005 edition of the Seismic
Provisions for Structural Steel Buildings (AISC, 2005) is used to determine detailing
requirements. The 2005 edition was used for this design (rather than the 2002 edition
referenced in ASCE/SEI 7-02) because this is consistent with local practice when a
buckling-restrained braced frame system is selected as the lateral force-resisting
system. The following seismic factors were considered in the design:
Occupancy category: IV
Importance factor: I = 1.5
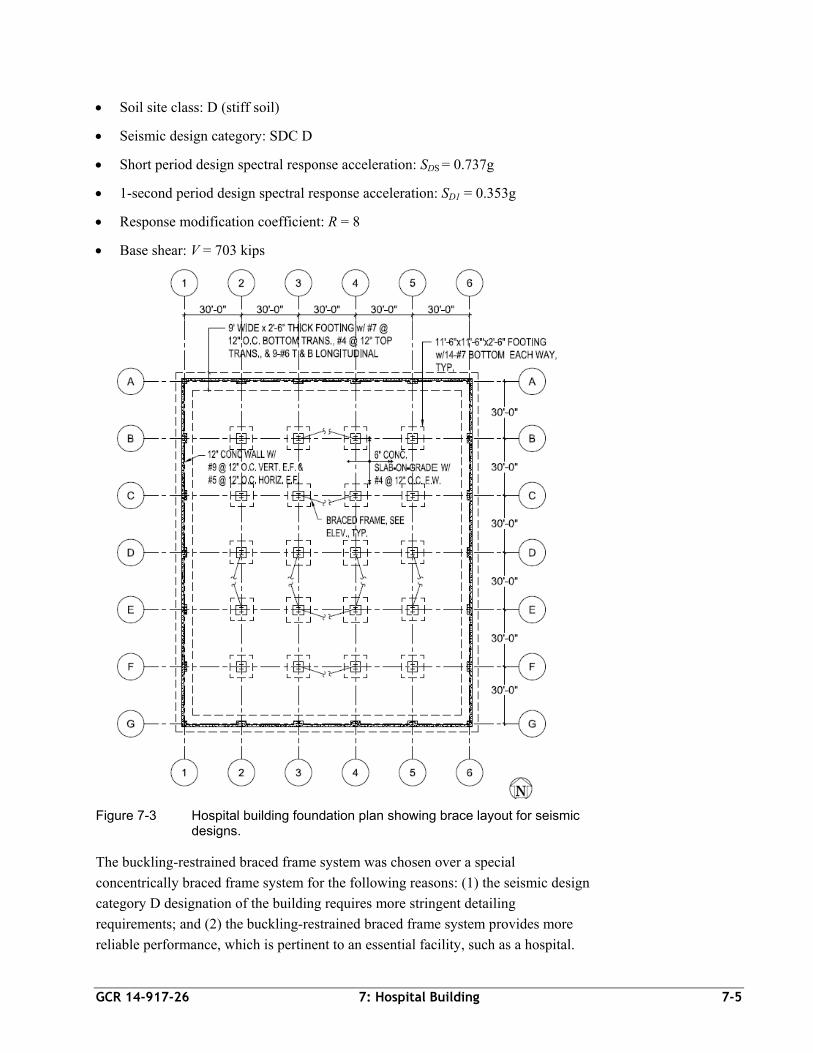
GCR 14-917-26 7: Hospital Building 7-5
Soil site class: D (stiff soil)
Seismic design category: SDC D
Short period design spectral response acceleration: SDS = 0.737g
1-second period design spectral response acceleration: SD1 = 0.353g
Response modification coefficient: R = 8
Base shear: V = 703 kips
Figure 7-3 Hospital building foundation plan showing brace layout for seismic designs.
The buckling-restrained braced frame system was chosen over a special
concentrically braced frame system for the following reasons: (1) the seismic design
category D designation of the building requires more stringent detailing
requirements; and (2) the buckling-restrained braced frame system provides more
reliable performance, which is pertinent to an essential facility, such as a hospital.

7-6 7: Hospital Building GCR 14-917-26
Although buckling-restrained braced frame systems are not explicitly categorized in
ASCE/SEI 7-02, they have been permitted, provided that adequate testing verifying
seismic performance is conducted. All relevant parameters related to the seismic
performance of the buckling-restrained braces have been based on ASCE/SEI 7-10.
Comparison of the current local seismic code design to the wind design shows that
two more bays of braced frames were added in each direction, and column sizes were
increased at locations intersected by the braced frames. Similarly, because of
increased collector demands resulting from capacity design requirements, beam sizes
along braced frame lines were increased and moment-resisting connections were
necessary. Collector elements were sized so that they do not fail or yield before the
primary seismic force-resisting system (i.e., the buckling-restrained braced frame),
which is assumed to be the primary energy dissipation mechanism for the building.
This is accomplished by factoring the calculated seismic demands by the system
overstrength factor, which is specified as 2.5 for buckling-restrained braced frame
systems with moment-resistant beam-column connections. Because of the increased
number of braced bays, the footings at braced frames decreased by 2 feet in length
and width, relative to the wind design.
7.4 Current National Seismic Code Design
The current national seismic code design complies with the ASCE/SEI 7-10 seismic
design provisions, which is the basis for the 2012 IBC. Seismic forces were
calculated using Modal Response Spectrum Analysis. Similar to the current local
seismic code design shown in Figure 7-3, the lateral force-resisting system is
comprised of buckling-restrained braced frames and the detailing requirements are in
accordance with the 2005 Seismic Provisions. The following seismic factors were
considered in the design:
Risk category: IV
Importance factor: I = 1.5
Soil site class: D (stiff soil)
Seismic design category: SDC D
Short period design spectral response acceleration: SDS = 0.609g
1-second period design spectral response acceleration: SD1 = 0.338g
Response modification coefficient: R = 8
Base shear: V = 672 kips
Seismic parameters do not change significantly between the ASCE/SEI 7-02 design
and the ASCE/SEI 7-10 design, except for a reduction in spectral acceleration and
therefore base shear. The small reduction is the combined result of updated
New Systems and Codes The use of new seismic force-resisting systems before their inclusion in the building code requires special approval of the building official. The ongoing use of buckling-restrained braced frame systems in Memphis is an example of this type of innovation. Use of such innovations has been met with success in the Central United States.

GCR 14-917-26 7: Hospital Building 7-7
assessments of the seismic hazard in the region (which raise the hazard level slightly)
and the use of risk-targeted seismic hazard maps (which lower the value used in
design). (Risk targeted maps take into consideration the variation in seismic hazard
over a full spectrum of return intervals, whereas equal hazard maps in prior editions
of ASCE/SEI 7 are based upon the hazard on only one return interval).
Comparison of the ASCE/SEI 7-10 design to the ASCE/SEI 7-02 design shows that
the lateral force-resisting system, and its layout, remains the same. The base shear
was reduced by 4%, so the design changed only nominally. Footing sizes were
decreased by 6 inches in length and width, and brace member sizes were reduced
marginally.
7.5 Cost Comparison
The methodology for establishing construction costs is explained in Chapter 9; details
of the cost estimate are included in Appendix C. Even though the lateral forces for
the two seismic designs are larger than those for the wind design, the change in total
construction cost is only a small percentage of the cost of the wind design.
A comparison of costs and required strengths for each design level is shown in Table
7-1 and Table 7-2. The results in Table 7-1 are shown as ratios relative to the values
of base shear or cost for the wind design. For this building, the estimated total
construction cost for the wind design is $398.37 per square foot. Table 7-1 shows
that the total construction cost of the hospital building increases by 2.5%, relative to
the wind design, when considering ASCE/SEI 7-02 or ASCE/SEI 7-10 seismic
design requirements. The increase in structural costs for the two seismic designs is
largely due to more substantial braced frames, collectors, and foundations in the
structural system. Required bracing and anchorage of nonstructural components and
systems adds to the increase in total construction costs.
Table 7-1 Base Shear and Cost Comparisons between the Hospital Building Wind and Seismic Designs
Wind
Design Current Local
Seismic Code(*) Current National Seismic Code(*)
Ratio Increase Ratio Increase
Base Shear
North-South Direction
East-West Direction
1.0
1.0
1.86
1.55
-
-
1.78
1.58
-
-
Structural Cost 1.0 1.174 17.4% 1.171 17.1%
Total Building Cost 1.0 1.025 2.5% 1.025 2.5%
Notes: (*) Ratios and increases are relative to wind design.

7-8 7: Hospital Building GCR 14-917-26
When expressed as a ratio of total construction costs, the cost increase for seismic
design is nominal. When expressed as a ratio of the structural costs alone, the cost
increase for the hospital building is higher than for most other buildings in this study.
This is because the structural system for this type of construction (i.e., the steel
frame) represents a smaller portion of the overall cost for the building.
The results in Table 7-2 are shown as ratios relative to the values of base shear or
cost for current local seismic code design. There is no cost increase relative to the
2003 IBC design when designing for ASCE/SEI 7-10.
Table 7-2 Base Shear and Cost Comparisons between the Hospital Building Seismic Designs
Current Local Seismic Code
Current National Seismic Code(*)
Ratio Increase
Base Shear 1.0 0.96 -
Structural Cost 1.0 0.998 -0.2%
Total Building Cost 1.0 1.000 0%
Notes: (*) Ratios and increases are relative to current local seismic code design.
7.6 Benefits Comparison
Benefits are assessed based on relative performance of the designs. Benefits
associated with improved seismic design of the hospital building were assessed both
qualitatively and quantitatively.
7.6.1 Qualitative Comparison
In general, better seismic performance is achieved through increased lateral design
forces (i.e., base shear), and detailing requirements that improve structural
connection strength or structural member behavior in the inelastic range of response.
Requirements for seismic bracing and anchorage of nonstructural components reduce
potential for nonstructural damage and loss of building (or system) functionality.
A comparison of the base shear forces for the hospital building designs in each
direction is provided in Table 7-1 and Table 7-2. Seismic base shears for the
ASCE/SEI 7-02 design are 1.9 times design wind loading in the north-south
direction, and 1.6 times design wind loading in the east-west direction. Seismic base
shears for the ASCE/SEI 7-10 design are nearly the same, at 1.8 times design wind
loading in the north-south direction, and 1.6 times design wind loading in the east-
west direction.
These increases in design base shear are significant. They are an indication that the
seismic designs will perform better in the event of an earthquake, but they are not the

GCR 14-917-26 7: Hospital Building 7-9
sole determining factor. They are, however, an indication that a building designed
considering wind loading only, will perform significantly worse in the event of an
earthquake.
In the case of steel braced frame systems, key seismic detailing requirements include
provisions for: (1) brace connections to be designed to resist amplified forces or the
capacity of the braces to avoid premature failure of the connections; (2) member
compactness and slenderness requirements to avoid premature fracture of the braces
due to buckling and low-cycle fatigue; (3) collector design for amplified forces to
deliver seismic forces to the braced frames without premature failure; and (4)
enhanced column design requirements to resist vertical components of braces.
Braced frame systems designed for wind load requirements alone do not have the
ductility inherent in seismic braced frame systems, and therefore, do not have the
ability to perform well in the event of an earthquake. Buckling of braces, which will
occur at relatively low seismic loading, causes brace members to be subject to brittle
fracture, and results in unbalanced forces on beams, leading to downward yielding
cycles that are not reversed. In addition, both connections and columns are subject to
failure because they are not designed to exceed the capacity of the braces.
In comparison to the wind design, the buckling-restrained braces in the seismic
designs are intended to yield, rather than buckle, and are better able to dissipate
energy during an earthquake than a concentrically braced frame system. Buckling-
restrained braces are designed to act as fuses in the building, allowing the columns
and beams to remain essentially elastic while the braces repeatedly yield. This
energy dissipation is generally expected to limit the damage to the rest of the
structure, especially for smaller ground motions. In this system, some yielding of
beams and columns, particularly at lower stories, is possible, though this is not
expected to cause damage to an extent that post-earthquake occupancy is
significantly impacted.
Both the ASCE/SEI 7-02 and the ASCE/SEI 7-10 designs require collectors and
connections be designed for the capacity of the braces. Stronger collectors are
intended to allow the braces to yield without premature failure in the load path, and
stronger connections will prevent premature failure of brace connections before the
capacity of the braces can be realized.
Based on strength and ductility considerations, a hospital building designed to resist
the effects of wind load alone will have a higher potential for damage, a higher
probability of collapse, and a correspondingly higher risk for casualties (fatalities and
injuries).
The wind design does not include bracing of nonstructural elements. Performance in
past earthquakes has shown that even moderate shaking can rupture water piping

7-10 7: Hospital Building GCR 14-917-26
(either domestic water or fire-sprinkler systems), and the resultant flooding and lack
of fire suppression capability can shut down a hospital. Also, some items in hospitals
are cost-prohibitive to replace (e.g., MRI machines and other diagnostic and
treatment equipment). Nonstructural systems and equipment that are not braced, or
otherwise anchored, have the potential to cause loss of critical care functionality in
the event of even a moderate earthquake.
The increased strength and improved detailing of a seismic system can increase the
resistance of a structure to extreme windstorms, and wind loads in excess of code
design levels. Seismic design, however, will not improve the resistance of the
exterior enclosure of the hospital building (i.e., windows and doors) to extreme wind
loads or wind-borne debris.
7.6.2 Quantitative Comparison
The seismic performance of the hospital building was also assessed using the FEMA
P-58-1 methodology (FEMA, 2012a). Using this methodology, performance was
measured in terms of annualized losses (i.e., the average value of loss, per year, over
a period of years) for repair costs, casualties, and probability of collapse. Details of
the quantitative assessment of the hospital building are provided in Appendix E.
Quantitative results are summarized in Figure 7-4.
Figure 7-4 Comparison of annualized losses for the hospital building, as a ratio of annualized losses for the wind design.
0
0.2
0.4
0.6
0.8
1
1.2
Probability of Collapse Fatalities Repair Cost
Ratio of Annualized Losses Relative to W
ind Design Losses
Consequences
Wind Design
Current Local Seismic Code Design
Current National Seismic Code Design

GCR 14-917-26 7: Hospital Building 7-11
In the figure, it can be seen that annualized fatalities and probabilities of collapse for
the hospital building would be reduced by approximately 90% when current local or
current national seismic design provisions are implemented. In terms of annualized
repair cost, losses for the hospital building would be reduced by approximately 10%
when current local or current national seismic design provisions are implemented.
These results are consistent with qualitative expectations for improved performance
based on increased design strength and improved detailing requirements.
7.7 Conclusions
Implementation of seismic design requirements for hospital buildings will result in
total construction cost increases of 2.5% for current local or current national seismic
code requirements, when compared to the wind design.
Qualitatively, a hospital building designed to resist the effects of wind load alone will
have a higher potential for damage, a higher probability of collapse, and a
correspondingly higher risk for casualties than a building designed specifically for
earthquake effects. Quantitatively, annualized fatalities and probabilities of collapse
for a hospital building would be reduced by approximately 90%, and annualized
repair costs would be reduced by approximately 10% when current local or current
national seismic design provisions are implemented (relative to the annualized losses
that would be expected for wind design provisions alone).


GCR 14-917-26 8: School Building 8-1
Chapter 8
School Building
This chapter compares relative construction costs associated with varying levels of
earthquake resistance for differing lateral force-resisting system designs of a school
building located in Desoto County, Mississippi (in the Memphis metropolitan area),
and assesses the benefits of improved seismic resistance. To make these
comparisons, three different designs were developed:
1. Wind design according to ASCE/SEI 7-05, Minimum Design Loads for Buildings
and Other Structures (ASCE, 2006),
2. Current local seismic code design according to the 1999 SBC, Standard Building
Code (SBCCI, 1999), and
3. Current national seismic code design according to ASCE/SEI 7-10, Minimum
Design Loads for Buildings and Other Structures (ASCE, 2010), which is the
basis for the 2012 edition of the International Building Code (ICC, 2012).
8.1 Building Description
The school is a masonry building with a two-story classroom wing and a one-story
wing with a combined auditorium and cafeteria, a kitchen, a mechanical room, and a
gym. The one-story gym is the same height as the two-story classroom wing; other
parts of the one-story wing have lower roof heights. There is a structural joint
between the classroom wing and the one-story wing. The footprint of the classroom
wing is approximately 81 feet across (north-south) by 230 feet long (east-west),
providing roughly 37,250 square feet of floor area. The footprint of the one-story
section is approximately 119 feet across by 127 feet long and provides roughly
13,950 square feet of floor area. The building’s total square footage is 51,200. The
building has two stair wells and an elevator. Appendix D provides a list of complete
drawings for this building.
8.1.1 General
Figure 8-1 shows the general school building configuration. The individual classrooms, offices, and restroom are separated by partitions of gypsum wallboard (GWB) on light gauge steel framing. Although some schools use masonry for all classroom walls, the light partition option was selected to place a higher seismic demand on the remaining masonry walls in the north-south direction. (If all classroom walls were masonry, there would be many more walls in the north-south direction to share the seismic loads.)
Building Selection The school building is one of two buildings in this study that are not driven by private sector economic considerations. The time frame for economic decision evaluation is usually longer for public sector buildings, such as schools, than for the type of private sector buildings also included in this study (life cycle costs are given more weight).

8-2 8: School Building GCR 14-917-26
Figure 8-1 School general building plan.
Floor-to-floor height is about 12 feet 8 inches in the classroom wing and the roof
height in the one-story section varies from 13 feet 4 inches high to 26 feet high. The
roofing is a single-ply membrane over rigid insulation on steel deck. Exterior walls
consist of an 8 inch thick concrete masonry unit (CMU) structural wall and a 4 inch
thick brick veneer with insulation and an air space in the cavity. Interior structural
walls consist of 8 inch thick CMUs. Figure 8-2 shows the longitudinal (south)
elevation of the school building. The school building configuration is the same in all
three designs.
Figure 8-2 South elevation of school building.
8.1.2 Foundations
All three designs have the same foundation system consisting of shallow reinforced
concrete spread footings. The first floor is a 4 inch thick slab-on-grade. The exterior
spread footing and foundation wall are shown in Figure 8-3.
OFF
ICES
︵1st
︶
LIBR
ARY
︵2nd
︶
TEAC
HER
S
︵1st
︶
CO
MPU
TER
S
︵2nd
︶
CLASS ROOMS
CLASS ROOMS
GYM
MUSIC&
STAGE
CAF
ETO
RIU
M
KITCHEN MECHSTRUCTURAL JOINT
TWO STORY BUILDING SINGLE STORY BUILDING
1 152 3 4 5 6 7 8 9 10 11 12 13 14 16
F
E
DC
B
A
F
E
DC
B
A

GCR 14-917-26 8: School Building 8-3
Figure 8-3 Foundation at exterior wall of school building.
8.1.3 Gravity Framing System
The second floor is a 4 inch thick concrete slab on 0.6 inch deep, 24 gauge steel deck.
The slab is supported by steel open web joists (OWJ). The selected slab thickness is
a common solution to control vibration, but the extra mass contributes to making the
seismic requirements more demanding. The floor joists are spaced at 2 feet 6 inch
centers and span to interior and exterior walls of CMU. The roof deck is 1 1/2 inch
deep, 22 gauge, metal type B steel decking spanning 5 feet to steel OWJ. Roof joists
typically span to CMU walls. The gravity systems are the same for the three designs.
8.1.4 Lateral Force-Resisting System
The lateral force-resisting system includes the CMU walls acting as shear walls and
the second floor slab and the roof deck act as horizontal diaphragms. Bond beams in
the CMU walls act as chords for the diaphragms. This configuration is the same in
the three designs, but details vary. The CMU portion of the exterior walls is
reinforced to span vertically for out-of-plane wind forces, with larger bars spaced
more closely at the taller walls. The vertical reinforcement in interior walls is
governed by the minimum requirements in the relevant codes. The walls are grouted
only at the bond beams and at the cells containing vertical reinforcement.
The primary differences among the three designs are the amount of reinforcement in
the masonry walls, the attachment of the steel roof deck to the walls, and the type,
size, and spacing of connections between the walls and the floor and roof
diaphragms. The differences are summarized here, and the design basis for the
differences are explained in the following sections. Figure 8-4 shows #5 dowels that
transfer in- and out-of-plane forces between the floor slab and wall. The spacing of
1'-0
"
VARIES1'-6" TO 2'-8"
2'-0
"
6"
6"
8"4"
BRICKVENEER 8" CMU
STRUCTURALFILL
#4x5'-0" W/6" HOOK @2'-0" O.C.
6 MIL VAPORRETARDER
Grouted Masonry On the West Coast of the United States, hollow unit masonry is usually grouted solid, whereas in the rest of the country the more common practice is to grout only cells with reinforcing bars (also called partially grouted). The masonry industry on the West Coast usually supplies “open end” units to facilitate placement of grout in walls to be grouted solid. Such units are not common elsewhere, but can be obtained upon special order. There is some question concerning the applicability of the code equation used for nominal shear strength of partially grouted masonry, and research is planned.

8-4 8: School Building GCR 14-917-26
the dowels changes from 48 inches for wind design to 24 inches for the current local
seismic code design and to 16 inches for the current national seismic code design.
Figure 8-4 Floor to shear wall connection for school building.
The spacing of the anchor bolts for the angle to CMU wall as shown in Figure 8-5
changes from 72 inches for wind design to 36 inches for the current local seismic
code design and to 24 inches for the current national seismic code design.
Figure 8-5 Roof deck to shear wall connection for school building.
Roof deck welds to supports (edge angles and joists) and fasteners between the deck
sheets differ as shown in Table 8-1.
Table 8-1 Summary of Roof Deck Connectors
Wind Design Current Local
Seismic Code Design Current National
Seismic Code Design
Deck support welds
(4) 5/8 inch diameter puddle welds across the 36 inch deck width
(7) 5/8 inch diameter puddle welds across the 36 inch deck width
(7) 5/8 inch diameter puddle welds across the 36 inch deck width
Side lap fasteners
None (4) #10 TEK screws per 5 feet
(10) #10 TEK screws per 5 feet
Figure 8-6 shows the roof deck and joist bearing details at the CMU shear wall.
Strengthening of several elements of this connection is required for the seismic
designs, as summarized in Table 8-2.
BOND BM
4"
#5 DWL SEE TABLE
8"
CONC FLOOR ON0.6" DECK
BOND BM
PUDDLE WELD

GCR 14-917-26 8: School Building 8-5
Figure 8-6 Joist bearing detail at roof of school building (Bond BM is for bond beam, MTL is for metal).
Table 8-2 Summary of Roof Connectors in Joist Bearing Detail
Wind Design
Current Local Seismic Code Design
Current National Seismic Code Design
Angle None L2x2x3/16 continuous L4x3x5/16 continuous
Angle bolt None None 1/2 inch diameter, 8 inches at 5 feet on center
Angle weld to joists
None 1/8 inch fillet weld, 2 inches
3/16 inch fillet weld, 3 inches
Deck weld to angle
None 5/8 inch puddle weld at 6 inches on center
5/8 inch puddle weld at 6 inches on center
Vertical reinforcement for the CMU shear walls does not change for the exterior
walls in the three designs because out-of-plane bending due to wind pressure controls
the wall design. For the interior CMU shear walls, minimal vertical reinforcement is
provided for wind design with #4 bars at the ends of the walls, at jambs of openings,
and at a spacing of 120 inches. For the seismic designs, vertical reinforcement is
increased to #5 bars at 48 inch spacing. Horizontal reinforcement in the CMU shear
walls changes from 9 gauge joint wires at 16 inch spacing for wind design to bond
beams with #6 bars at 48 inch spacing for the seismic designs.
8.2 Wind Design
For wind design, lateral forces are in accordance with ASCE/SEI 7-05. The following factors were considered in the design:
Occupancy category: III
Importance factor: I = 1.15
Exposure category: C (schools are ordinarily surrounded by play fields and
parking lots)
Basic wind speed: 90 miles per hour (3-second gust)
BOND BM
BRICKVENEER
316
BOND BM
ANGLE PER TABLE
MTL FLASHINGON WOOD CAP
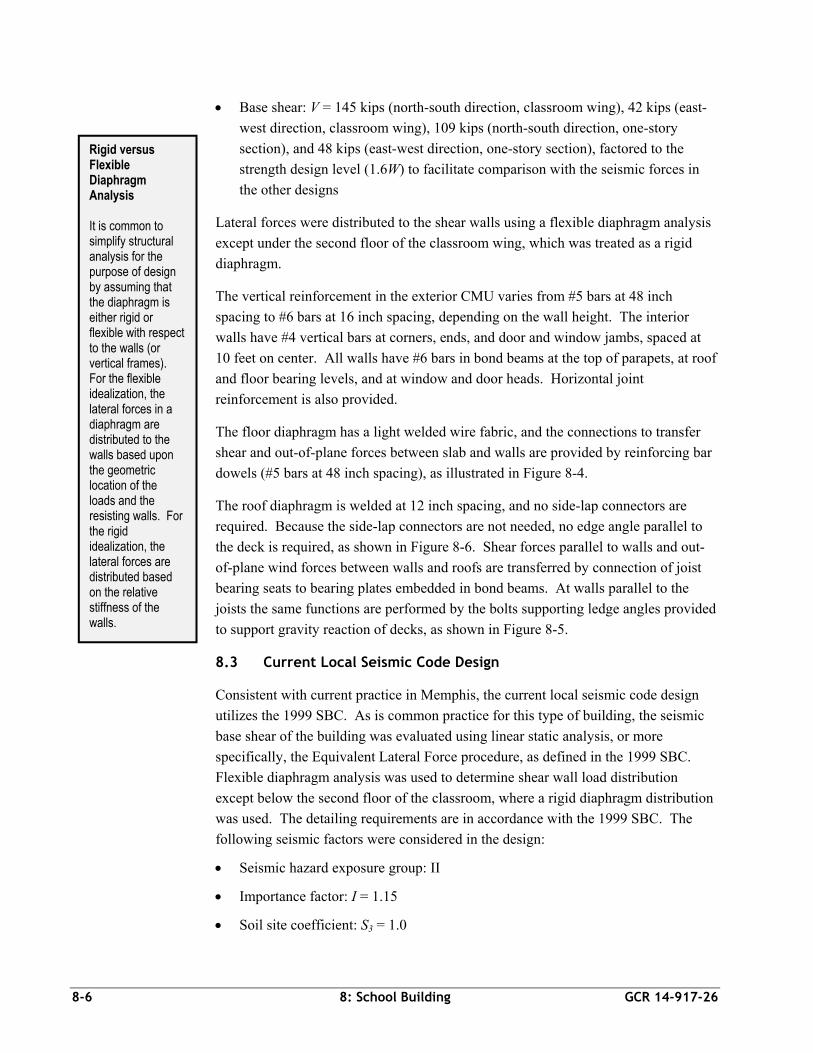
8-6 8: School Building GCR 14-917-26
Base shear: V = 145 kips (north-south direction, classroom wing), 42 kips (east-
west direction, classroom wing), 109 kips (north-south direction, one-story
section), and 48 kips (east-west direction, one-story section), factored to the
strength design level (1.6W) to facilitate comparison with the seismic forces in
the other designs
Lateral forces were distributed to the shear walls using a flexible diaphragm analysis
except under the second floor of the classroom wing, which was treated as a rigid
diaphragm.
The vertical reinforcement in the exterior CMU varies from #5 bars at 48 inch
spacing to #6 bars at 16 inch spacing, depending on the wall height. The interior
walls have #4 vertical bars at corners, ends, and door and window jambs, spaced at
10 feet on center. All walls have #6 bars in bond beams at the top of parapets, at roof
and floor bearing levels, and at window and door heads. Horizontal joint
reinforcement is also provided.
The floor diaphragm has a light welded wire fabric, and the connections to transfer
shear and out-of-plane forces between slab and walls are provided by reinforcing bar
dowels (#5 bars at 48 inch spacing), as illustrated in Figure 8-4.
The roof diaphragm is welded at 12 inch spacing, and no side-lap connectors are
required. Because the side-lap connectors are not needed, no edge angle parallel to
the deck is required, as shown in Figure 8-6. Shear forces parallel to walls and out-
of-plane wind forces between walls and roofs are transferred by connection of joist
bearing seats to bearing plates embedded in bond beams. At walls parallel to the
joists the same functions are performed by the bolts supporting ledge angles provided
to support gravity reaction of decks, as shown in Figure 8-5.
8.3 Current Local Seismic Code Design
Consistent with current practice in Memphis, the current local seismic code design
utilizes the 1999 SBC. As is common practice for this type of building, the seismic
base shear of the building was evaluated using linear static analysis, or more
specifically, the Equivalent Lateral Force procedure, as defined in the 1999 SBC.
Flexible diaphragm analysis was used to determine shear wall load distribution
except below the second floor of the classroom, where a rigid diaphragm distribution
was used. The detailing requirements are in accordance with the 1999 SBC. The
following seismic factors were considered in the design:
Seismic hazard exposure group: II
Importance factor: I = 1.15
Soil site coefficient: S3 = 1.0
Rigid versus Flexible Diaphragm Analysis It is common to simplify structural analysis for the purpose of design by assuming that the diaphragm is either rigid or flexible with respect to the walls (or vertical frames). For the flexible idealization, the lateral forces in a diaphragm are distributed to the walls based upon the geometric location of the loads and the resisting walls. For the rigid idealization, the lateral forces are distributed based on the relative stiffness of the walls.

GCR 14-917-26 8: School Building 8-7
Seismic performance category: D
Effective peak acceleration: Aa = 0.153g
Effective peak velocity-related acceleration: Av = 0.193g
Response modification factor: R = 3.5 (reinforced masonry bearing walls)
Base shear: V = 364 kips (classroom wing) and 106 kips (one-story wing)
The comparison of the current local seismic code design to the wind design shows
that the required seismic base shear forces in the classroom wing are larger by factors
of approximately 2.51 in the north-south direction and about 8.67 in the east-west
direction than the loads required for wind. In the one-story wing the seismic load is
about the same as the wind load in the north-south direction and about 2.2 times
larger than the wind load in the east-west direction.
The code requires this building to meet the requirements for seismic performance
category D, which means that the walls must have enough reinforcement to meet the
code definition of reinforced masonry. There is no change in the vertical
reinforcement of the exterior walls, but all the interior walls require vertical #5 bars
at 48 inch spacing for the seismic design. All walls have horizontal #6 bars at 48
inch spacing, and the joint reinforcement used in the wind design is not required.
The walls are still grouted only in the cells with reinforcement. With these features,
all walls have strength and stiffness values satisfactory for both in-plane and out-of-
plane the seismic forces.
The spacing of the dowels between the second floor slab and the walls is reduced
from 48 inches to 24 inches, but there is no other change in the slab, as shown in
Figure 8-4.
The welding of the roof deck to the supports is changed to 6 inch spacing, and four
screwed side lap fasteners per span are required for the diaphragm shear capacity. A
small angle parallel to the deck is added along the bearing walls to transfer shear
from the deck to the wall, but the angle need not be bolted to the wall because the
joist connection to the wall is still satisfactory for both in-plane shear and out-of-
plane forces, as shown in Figure 8-6. The spacing of bolts for the deck ledge angle
on non-bearing walls is reduced from 72 inches to 36 inches.
In addition, the following architectural components of the building require
earthquake resistant connections:
Interior partitions constructed of light gauge steel framing and GWB require
lateral bracing above the ceiling
T-bar ceiling and light fixtures require lateral bracing
Fire suppression system (piping) requires lateral bracing
Importance Factor The 1999 SBC requires extra stiffness for higher risk occupancies (higher seismic hazard exposure groups), but does not require any extra strength. For inherently stiff structures, the design is not affected by the occupancy type.
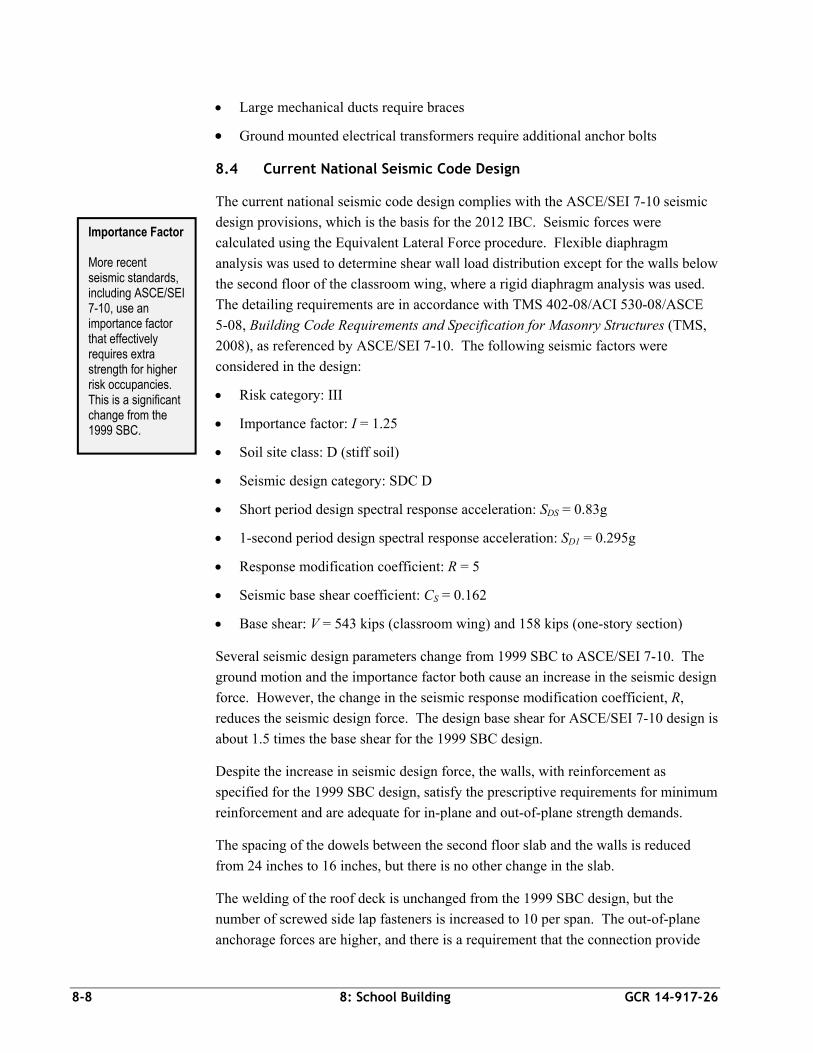
8-8 8: School Building GCR 14-917-26
Large mechanical ducts require braces
Ground mounted electrical transformers require additional anchor bolts
8.4 Current National Seismic Code Design
The current national seismic code design complies with the ASCE/SEI 7-10 seismic
design provisions, which is the basis for the 2012 IBC. Seismic forces were
calculated using the Equivalent Lateral Force procedure. Flexible diaphragm
analysis was used to determine shear wall load distribution except for the walls below
the second floor of the classroom wing, where a rigid diaphragm analysis was used.
The detailing requirements are in accordance with TMS 402-08/ACI 530-08/ASCE
5-08, Building Code Requirements and Specification for Masonry Structures (TMS,
2008), as referenced by ASCE/SEI 7-10. The following seismic factors were
considered in the design:
Risk category: III
Importance factor: I = 1.25
Soil site class: D (stiff soil)
Seismic design category: SDC D
Short period design spectral response acceleration: SDS = 0.83g
1-second period design spectral response acceleration: SD1 = 0.295g
Response modification coefficient: R = 5
Seismic base shear coefficient: CS = 0.162
Base shear: V = 543 kips (classroom wing) and 158 kips (one-story section)
Several seismic design parameters change from 1999 SBC to ASCE/SEI 7-10. The
ground motion and the importance factor both cause an increase in the seismic design
force. However, the change in the seismic response modification coefficient, R,
reduces the seismic design force. The design base shear for ASCE/SEI 7-10 design is
about 1.5 times the base shear for the 1999 SBC design.
Despite the increase in seismic design force, the walls, with reinforcement as
specified for the 1999 SBC design, satisfy the prescriptive requirements for minimum
reinforcement and are adequate for in-plane and out-of-plane strength demands.
The spacing of the dowels between the second floor slab and the walls is reduced
from 24 inches to 16 inches, but there is no other change in the slab.
The welding of the roof deck is unchanged from the 1999 SBC design, but the
number of screwed side lap fasteners is increased to 10 per span. The out-of-plane
anchorage forces are higher, and there is a requirement that the connection provide
Importance Factor More recent seismic standards, including ASCE/SEI 7-10, use an importance factor that effectively requires extra strength for higher risk occupancies. This is a significant change from the 1999 SBC.

GCR 14-917-26 8: School Building 8-9
ductile performance. Thus, the connection at the roof on bearing walls is changed to
include embedded anchor bolts located midway between the joists and a larger angle,
as shown in Figure 8-6. The angle still provides a place for a welded connection for
transfer of shear from the roof deck, but it now spans horizontally between the bolt in
the wall and the joists. The midway location is to keep the bolt away from the
pockets in the masonry for the joist bearing seats and thus increase the breakout
capacity of the masonry holding the bolt. The spacing of bolts for the deck ledge
angle at walls parallel to the joists is further reduced to 24 inches.
Architectural, mechanical, and electrical components of the building requiring
earthquake-resistant connections for ASCE/SEI 7-10 are the same as for the 1999
SBC.
8.5 Cost Comparison
The methodology for establishing construction costs is explained in Chapter 9; details
of the cost estimate are included in Appendix C. Even though the lateral forces for
the two seismic designs are larger than those for the wind design, the change in total
construction cost is only a small percentage of the cost of the wind design.
The list of nonstructural components requiring bracing is essentially the same in the
two seismic designs. The braced items are not massive, and thus nominal braces
suffice for both of the designs. Therefore nonstructural costs were taken to be the
same for the two seismic designs. For this building, nonstructural cost increases are a
small fraction of structural cost increases.
A comparison of costs and required strengths for each design level is shown in Table
8-3 and Table 8-4. The results in Table 8-3 are shown as ratios relative to values of
base shear or cost for the wind design. For this building, the estimated total
construction cost for the wind design is $175.16 per square foot. Table 8-3 shows
that the total construction cost of the school building increases by 1.0% and 1.4%,
relative to the wind design, when considering 1999 SBC and ASCE/SEI 7-10 seismic
design requirements, respectively.
Table 8-4 compares the two seismic designs. Results in in Table 8-4 are shown as
ratios relative to the values of base shear or cost for current local seismic code
design. The increase in total construction cost between the 1999 SBC design and the
ASCE/SEI 7-10 design is 0.4%.
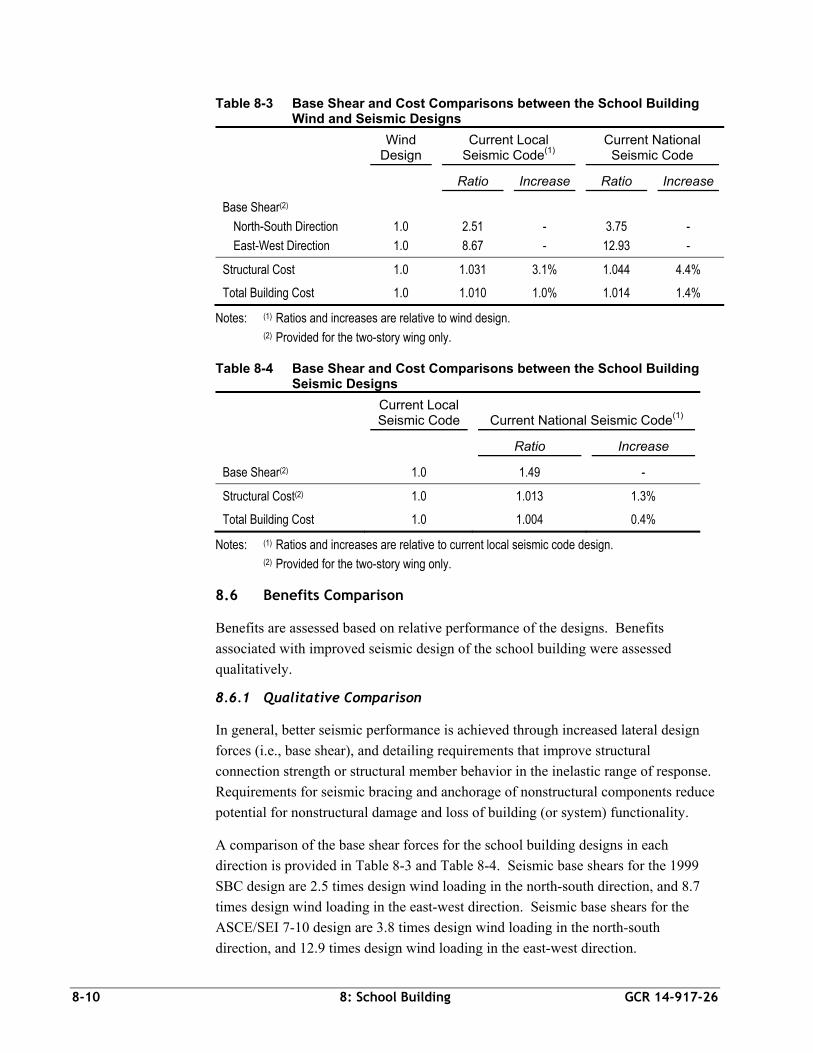
8-10 8: School Building GCR 14-917-26
Table 8-3 Base Shear and Cost Comparisons between the School Building Wind and Seismic Designs
Wind
Design Current Local
Seismic Code(1) Current National
Seismic Code
Ratio Increase Ratio Increase
Base Shear(2)
North-South Direction
East-West Direction
1.0
1.0
2.51
8.67
-
-
3.75
12.93
-
-
Structural Cost 1.0 1.031 3.1% 1.044 4.4%
Total Building Cost 1.0 1.010 1.0% 1.014 1.4%
Notes: (1) Ratios and increases are relative to wind design.
(2) Provided for the two-story wing only.
Table 8-4 Base Shear and Cost Comparisons between the School Building Seismic Designs
Current Local Seismic Code Current National Seismic Code(1)
Ratio Increase
Base Shear(2) 1.0 1.49 -
Structural Cost(2) 1.0 1.013 1.3%
Total Building Cost 1.0 1.004 0.4%
Notes: (1) Ratios and increases are relative to current local seismic code design.
(2) Provided for the two-story wing only.
8.6 Benefits Comparison
Benefits are assessed based on relative performance of the designs. Benefits
associated with improved seismic design of the school building were assessed
qualitatively.
8.6.1 Qualitative Comparison
In general, better seismic performance is achieved through increased lateral design
forces (i.e., base shear), and detailing requirements that improve structural
connection strength or structural member behavior in the inelastic range of response.
Requirements for seismic bracing and anchorage of nonstructural components reduce
potential for nonstructural damage and loss of building (or system) functionality.
A comparison of the base shear forces for the school building designs in each
direction is provided in Table 8-3 and Table 8-4. Seismic base shears for the 1999
SBC design are 2.5 times design wind loading in the north-south direction, and 8.7
times design wind loading in the east-west direction. Seismic base shears for the
ASCE/SEI 7-10 design are 3.8 times design wind loading in the north-south
direction, and 12.9 times design wind loading in the east-west direction.

GCR 14-917-26 8: School Building 8-11
These increases in design base shear are substantial. They are an indication that the
seismic designs will perform better in the event of an earthquake, but they are not the
sole determining factor. They are, however, an indication that a building designed
considering wind loading only, will perform significantly worse in the event of an
earthquake.
The performance of reinforced masonry structures is dependent on the following
primary failure mechanisms:
in-plane shear of the walls,
in-plane flexure of the walls,
out-of-plane flexure of the walls,
in-plane shear of the diaphragm,
in-plane flexure of the diaphragm (failure of the chords), and
failure of the connections between the diaphragms and the walls.
The two-story wing of the building has a strong and stiff second floor diaphragm,
which will behave as one structure even though the roof diaphragm is weak and
flexible compared to the walls. The one-story wing of the building has three separate
roof diaphragms (different elevations); the real behavior will be more complex than
the classroom wing, perhaps acting as three separate cells with some local distress at
the intersecting corners.
The in-plane strengths of nearly all the walls are significantly greater than the
demands from the design forces. The interior walls in the wind design do not have
much reinforcement, but it appears likely that strong ground shaking of the building
designed for wind will first cause failure in a mechanism other than in-plane shear or
overturning. The gymnasium walls are tall enough that the first failure mechanism
may be out of plane, particularly at anchorages of the walls to the roof diaphragm.
Such failures have led to partial collapses in the past. As the connections between
the walls and the roof become stronger, particularly with the ASCE/SEI 7-10 design,
it appears that the tall walls may yield in out-of-plane flexure, but the significant
amount of vertical reinforcement in those walls will permit a ductile yielding. In the
shorter portions of the building, yielding of the steel deck diaphragms at the roof
becomes the most likely mechanism. Based on current knowledge, the ductility of
such diaphragms is limited.
The additional vertical reinforcement provided by the seismic designs in the interior
walls makes the walls more resistant to local damage but may not make significant
difference in in-plane capacity, given the relatively short story height. The biggest
benefit from the vertical reinforcement may be realized if the roof diaphragm of the
two-story wing fails and causes all the second story walls to cantilever from the
Roof Diaphragms Buildings with weak diaphragms supporting heavy walls are common. Due to geographic variation in construction practice across the United States there is more experience with the seismic performance of wood diaphragms than with steel deck diaphragms. Thus the understanding of failure modes for steel deck diaphragms is less thorough and is the subject of ongoing research.
8-12 8: School Building GCR 14-917-26
lower story for out-of-plane action. The added bond beams will substantially
improve the in-plane shear strength of all the walls, but it does not appear likely that
they will be the weakest link in any design.
The largest difference between the seismic designs is the out-of-plane anchorage
required for the walls. Seismic load on the wall itself assumes a ductility, which
means that the design loads are less than what would occur in an undamaged
building, and therefore, wind actually controls the amount of vertical reinforcement
in these designs. The 1999 SBC design has two drivers for seismic anchorage force:
(1) the value computed from out-of-plane load (the parameter Av times the weight of
the wall); and (2) an arbitrary minimum loading (1,000 pounds per lineal foot times
the parameter Av). The anchorage required for wind is larger than either of those.
ASCE/SEI 7-10 design amplifies anchorage forces for flexible diaphragm behavior.
ASCE/SEI 7-10 and the masonry design standard TMS 402-08 also require a further
amplification of 2.5 unless the mode of anchor failure is ductile. Both the strength
and the nature of the connection are controlled by the seismic force for ASCE/SEI
7-10 design. The ASCE/SEI 7-10 connection design reduces the likelihood of an
out-of-plane wall failure.
The added strength of the roof diaphragm for the seismic designs will increase the
resistance of a structure to extreme windstorms, and wind loads in excess of code
design levels. The performance improvement should be proportional to the increased
strength. The stronger roof deck diaphragm is particularly important in the one-story
portions of the building. Seismic design, however, will not improve all aspects of
wind load effects on buildings. The benefit will be limited by the potential for strong
wind to cause an uplift failure in the roof, for which the seismic design does not
specifically provide any increased resistance. The additional reinforcement in the
walls of the seismic designs will provide improved integrity in the event of extreme
load or localized damage.
Although most nonstructural items in a school building are noncritical, damage to
certain key elements, such as water piping and fire sprinkler systems, can cause a
building to become unusable due to water damage, lack of water supply, and lack of
fire suppression capability. Additional limitations in the ability to evacuate or
continue to use a building can arise as a result of damage to stairs and elevators. In
both the 1999 SBC and the ASCE/SEI 7-10 designs, nonstructural bracing for
seismic demands, along with some consideration for story drift, is required to
minimize the potential for damage to nonstructural systems.
8.7 Conclusions
Implementation of seismic design requirements for school buildings will result in
total construction cost increases of 1.0% for current local seismic code (1999 SBC)

GCR 14-917-26 8: School Building 8-13
requirements, and 1.4% for current national seismic code (ASCE/SEI 7-10)
requirements.
Qualitatively, the school building has a structural system and configuration that
inherently possesses significant resistance to lateral forces. Seismic design improves
the expected performance of the building in the event of an earthquake, and to some
extent in the event of extraordinary wind loads. Increases in seismic design strength
are targeted at the inherently weak points in the system, such as the anchors from the
wall to the diaphragm, and the strength of the roof diaphragm. Performance in past
earthquakes has shown that wall anchorage improvement under ASCE/SEI 7-10 will
be particularly beneficial to performance in a future earthquake.


GCR 14-917-26 9: Development of Cost Estimates 9-1
Chapter 9
Development of Cost Estimates
This chapter describes the basis for developing cost models to provide an estimate of
construction cost within the Memphis area. Cost estimates were developed for
designs with varying levels of earthquake resistance for six building types by a
national cost estimate consulting firm, with input from local design and construction
professionals assuming competitively procured prices in the Memphis-area market in
the fourth quarter of 2012.
The cost models consider building construction only, including costs for structural
systems and nonstructural systems, including equipment and architectural finishes
that would be provided as part of the core and shell. Costs related to site
development and utilities, and associated with design, testing, and inspection services
are excluded. Costs related to financing are excluded, but costs were amplified for
overhead, profit, and contingency. Costs for special inspections associated with
seismic design requirements are included. Appendix C provides details of the cost
models.
For each of the six buildings studied, wide ranges of designs and costs are possible.
The selected quantities and materials in the cost model represent an overall mid-level
of quality, consistent with finding an overall average cost impact. However, where
multiple common design alternatives exist for amenities, the study typically selected
the lowest cost option. For example, in the warehouse, the cost model includes batt
insulation placed on the underside of the deck instead of rigid insulation placed
between the deck and the roofing membrane, which would be more costly.
Lower cost alternatives for nonstructural considerations were selected in this study
specifically to reduce the impact on the outcome of the cost comparison among
design levels. Lowering the ratio of nonstructural to structural costs (by providing
lower quality amenities) drives the ratio of structural to nonstructural costs higher,
highlighting (and potentially exaggerating) the percentage changes in structural cost
due to changes in seismic design. For example, a change of $2.00 per square foot is
1% of construction cost on a building with a total construction cost of $200 per
square foot, but only 0.67% on a building with a total construction cost of $300 per
square foot.

9-2 9: Development of Cost Estimates GCR 14-917-26
9.1 Cost Model Basis
9.1.1 Structural Elements
Estimates of the quantities and materials of structural elements are based on
engineered conceptual designs of the buildings described in detail in Chapters 3
through 8 with design drawings provided in Appendix D.
9.1.2 Nonstructural Elements
The types of nonstructural elements selected reflect those typically selected for
construction projects within the Memphis area. Specific system descriptions are
provided in Appendix C for each building type.
Estimates of the quantities for nonstructural elements, such as glazing and cladding,
were initially derived from data provided in Performance Assessment Calculation
Tool (PACT) of FEMA P-58-3, Seismic Performance Assessment of Buildings,
Volume 3 – Supporting Electronic Materials and Background Documentation
(FEMA, 2012c), as normative quantities, that is the quantities of elements likely to be
present in a building of a specific occupancy on a gross square foot basis. This
information was then refined based on the project team’s experience with similar
building types in the Memphis area.
In the case of commercial buildings, estimates exclude costs for items that would
normally be associated with tenant improvements.
9.2 Pricing Basis
Cost estimates were developed by a cost consulting firm using a national database of
construction costs. Cost data are based on competitively procured prices in the
Memphis market during the fourth quarter of 2012. All cost data were finalized
following discussion with local construction professionals familiar with the specific
construction markets for each building type in the Memphis area, and are thus based
on current information.
The estimates include: (1) an allowance for contingencies that might be missed in the
preliminary design of nonstructural aspects of the buildings; (2) an allowance for
general conditions; and (3) a 5% allowance for overhead and profit. The allowance
for general conditions ranges from 0% to 15%, depending on the variability
associated with the cost estimate. Costs for financing are excluded; however, a
working capital cost for the general contractor is included in the cost models,
assuming that payments are made promptly.
The cost models for the apartment, retail, and warehouse buildings are based on
private sector procurement with non-union labor and with negotiated or selected
bidding. The cost models for the hospital and office building are based on private
GCR 14-917-26 9: Development of Cost Estimates 9-3
sector procurement considering competitive bids from union and non-union labor.
The school cost model is based on public sector procurement, with competitive
bidding on a completed design.
The cost estimates reflect construction with no external constraints, such as
congested site conditions, limited access, restricted working hours, and compressed
schedules. Because all enhanced structural designs included in these cost models use
standard construction techniques and have been used in construction in the Memphis
area, the cost estimates are based on work being performed by workers familiar with
the construction techniques and methodologies that are used.
The change in construction cost among the three design levels was computed from
two primary inputs:
Quantitative changes in lateral force-resisting systems were calculated and unit
costs were applied to the new quantities.
Costs were added to cover seismic code requirements for the anchorage and
rating of nonstructural components, including bracing water heaters, heating,
ventilation, and air-conditioning (HVAC) units, piping for fire suppression
systems and electrical transformers, and providing drift-tolerant connections on
the stairs.
Appendix C provides the basis for developing the cost models for each of the
buildings related to building construction and a summary of the cost data developed
for each of the six building types at each of the three design levels.
9.3 Site Preparation Costs
The cost model for each building includes costs for rough grading and site
preparation (e.g., light clearing/grubbing and removal of topsoil) for only the
building footprint. Work beyond the footprint and demolition of any existing
structures or site development are not included in the cost model. These excluded
costs are considered relatively constant for different structural designs. If included,
relative cost differentials for structural systems would be lower among the three
designs.
9.4 Other Costs
9.4.1 Site Utilities
Site utilities and connections are not included in the cost models for any of the
building types.

9-4 9: Development of Cost Estimates GCR 14-917-26
9.4.2 Design, Testing, and Inspection
Design, testing and inspection costs are not included in the cost models for any of the
building types, with the exception of special inspection for any seismic features
incorporated by the study. For example, added welding or nailing inspection to meet
the higher code levels is included within the building estimates.
9.4.3 Fees
Fees, such as those for building permits and utility connections, are not included in
the cost models.

GCR 14-917-26 10: Summary and Conclusions 10-1
Chapter 10
Summary and Conclusions
This chapter summarizes cost comparisons, benefit assessments, and conclusions
across all the buildings in this study.
10.1 Summary of Cost Analyses
Cost estimates for each building at each design level were developed. Table 10-1 and
Table 10-2 summarize construction cost ratios among the three different design
levels. Table 10-1 compares cost estimates for the seismic designs to those for the
wind design, whereas Table 10-2 compares cost estimates for the two seismic
designs.
Table 10-1 Summary of Construction Cost Ratios and Cost Premiums at Three Design Levels
Building Wind(1)
Current Local Seismic Code(2)
Current National Seismic Code(3)
Cost Ratio(4)
Cost Premium
Cost Ratio(4)
Cost Premium
Apartment 1.0 1.003 0.3% 1.012 1.2%
Office 1.0 1.021 2.1% 1.028 2.8%
Retail 1.0 1.003 0.3% 1.005 0.5%
Warehouse 1.0 1.004 0.4% 1.014 1.4%
Hospital 1.0 1.025 2.5% 1.025 2.5%
School 1.0 1.010 1.0% 1.014 1.4%
Notes: (1) Wind-only lateral design for all buildings is conducted according to ASCE/SEI 7-05.
(2) The current local seismic code is the 2003 International Building Code. For most buildings, the local code allows structural design to conform to the 1999 Standard Building Code, which is less demanding and was used for all buildings except the hospital. The local code does not permit the exception for design of hospitals. ASCE/SEI 7-02 was used as the basis for the hospital design.
(3) The current national seismic code design for all buildings is conducted according to the 2012 International Building Code with ASCE/SEI 7-10 used as the basis.
(4) Ratios are total construction costs for seismic design relative to wind design.
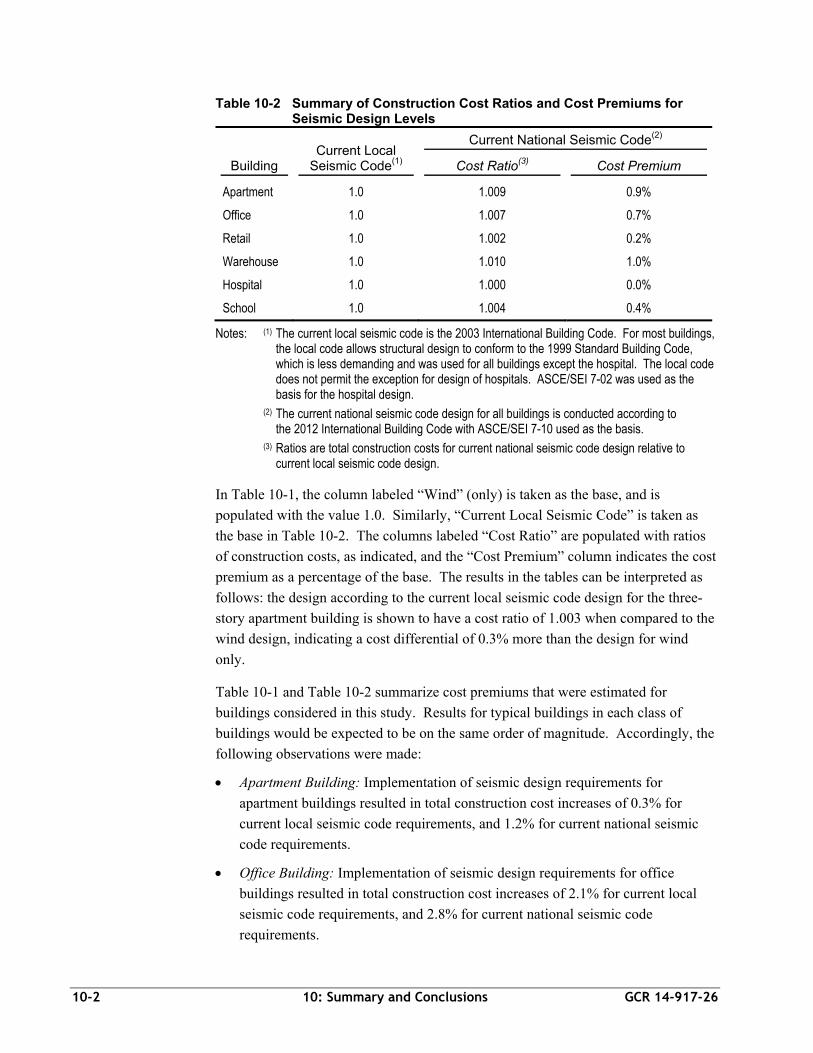
10-2 10: Summary and Conclusions GCR 14-917-26
Table 10-2 Summary of Construction Cost Ratios and Cost Premiums for Seismic Design Levels
Building Current Local
Seismic Code(1)
Current National Seismic Code(2)
Cost Ratio(3) Cost Premium
Apartment 1.0 1.009 0.9%
Office 1.0 1.007 0.7%
Retail 1.0 1.002 0.2%
Warehouse 1.0 1.010 1.0%
Hospital 1.0 1.000 0.0%
School 1.0 1.004 0.4%
Notes: (1) The current local seismic code is the 2003 International Building Code. For most buildings, the local code allows structural design to conform to the 1999 Standard Building Code, which is less demanding and was used for all buildings except the hospital. The local code does not permit the exception for design of hospitals. ASCE/SEI 7-02 was used as the basis for the hospital design.
(2) The current national seismic code design for all buildings is conducted according to the 2012 International Building Code with ASCE/SEI 7-10 used as the basis.
(3) Ratios are total construction costs for current national seismic code design relative to current local seismic code design.
In Table 10-1, the column labeled “Wind” (only) is taken as the base, and is
populated with the value 1.0. Similarly, “Current Local Seismic Code” is taken as
the base in Table 10-2. The columns labeled “Cost Ratio” are populated with ratios
of construction costs, as indicated, and the “Cost Premium” column indicates the cost
premium as a percentage of the base. The results in the tables can be interpreted as
follows: the design according to the current local seismic code design for the three-
story apartment building is shown to have a cost ratio of 1.003 when compared to the
wind design, indicating a cost differential of 0.3% more than the design for wind
only.
Table 10-1 and Table 10-2 summarize cost premiums that were estimated for
buildings considered in this study. Results for typical buildings in each class of
buildings would be expected to be on the same order of magnitude. Accordingly, the
following observations were made:
Apartment Building: Implementation of seismic design requirements for
apartment buildings resulted in total construction cost increases of 0.3% for
current local seismic code requirements, and 1.2% for current national seismic
code requirements.
Office Building: Implementation of seismic design requirements for office
buildings resulted in total construction cost increases of 2.1% for current local
seismic code requirements, and 2.8% for current national seismic code
requirements.

GCR 14-917-26 10: Summary and Conclusions 10-3
Retail Building: Implementation of seismic design requirements for retail
buildings resulted in total construction cost increases of 0.3% for current local
seismic code requirements, and 0.5% for current national seismic code
requirements.
Warehouse Building: Implementation of seismic design requirements for
warehouse buildings resulted in total construction cost increases of 0.4% for
current local seismic code requirements, and 1.4% for current national seismic
code requirements.
Hospital Building: Implementation of seismic design requirements for hospital
buildings resulted in total construction cost increases of 2.5%.
School Building: Implementation of seismic design requirements for the school
building resulted in total construction cost increases of 1.0% for current local
seismic code requirements, and 1.4% for current national seismic code
requirements.
Using the statistics of building construction cited in Chapter 2 and summarized in
Appendix A, the weighted average of cost premiums was calculated across all
building types. The weighted average of the cost premium for current local seismic
code design relative to wind design is 1.65%, and the weighted average of the cost
premium for current national seismic code design relative to current local seismic
code design is 0.53%.
10.2 Summary of Benefits Studies
Benefits were assessed based on relative performance of the designs. Benefits
associated with improved seismic design of the buildings were assessed qualitatively.
In addition, quantitative performance assessments were conducted for three of the
buildings, using the new methodology presented in FEMA P-58-1, Seismic
Performance Assessment of Buildings Volume 1 – Methodology (FEMA, 2012a).
In general, better seismic performance is achieved through increased lateral design
forces (i.e., base shear), and detailing requirements that improve structural
connection strength or structural member behavior in the inelastic range of response.
Requirements for seismic bracing and anchorage of nonstructural components reduce
potential for nonstructural damage and loss of building (or system) functionality.
Based on strength and ductility considerations, buildings designed to resist the effects
of wind load alone will have a higher potential for damage, a higher probability of
collapse, and a correspondingly higher risk for casualties.
A summary of the base shear forces for all six buildings for each design level in each
direction is provided in Table 10-3 and Table 10-4. The results in Table 10-3 are
shown as ratios relative to the values of base shear for the wind design. Table 10-3

10-4 10: Summary and Conclusions GCR 14-917-26
shows that the base shear force for each building increases significantly for seismic
designs compared to wind designs. These increases are an indication that the seismic
designs will perform better in the event of an earthquake, but they are not the sole
determining factor in seismic performance. They are, however, an indication that a
building designed considering wind loading only will perform significantly worse in
the event of an earthquake. Results in Table 10-4 are shown as ratios relative to the
values of base shear for the current local seismic code design.
Table 10-3 Summary of Lateral Force-Resisting System Strength Requirements at Three Design Levels
North-South Direction East-West Direction
Wind(1)
Current Local Seismic
Code(2),(3)
Current National Seismic
Code(3),(4) Wind(1)
Current Local Seismic
Code(2),(3)
Current National Seismic
Code(3),(4)
Apartment 1.0 1.0 1.36 1.0 4.59 6.69
Office 1.0 4.70 5.34 1.0 2.19 2.49
Retail 1.0 1.04 2.00 1.0 1.94 3.75
Warehouse
Walls 1.0 3.33 6.27 1.0 2.78 5.22
Frames - - - 1.0 3.00 7.70
Hospital 1.0 1.86 1.78 1.0 1.55 1.58
School(5) 1.0 2.51 3.75 1.0 8.67 12.93
Notes: (1) Wind-only lateral design for all buildings is conducted according to ASCE/SEI 7-05.
(2) The current local seismic code is the 2003 International Building Code. For most buildings, the local code allows structural design to conform to the 1999 Standard Building Code, which is less demanding and was used for all buildings except the hospital. The local code does not permit the exception for design of hospitals. ASCE/SEI 7-02 was used as the basis for the hospital design.
(3) Ratios are base shear forces for seismic design relative to wind design.
(4) The current national seismic code design for all buildings is conducted according to the 2012 International Building Code with ASCE/SEI 7-10 used as the basis.
(5) Given for the two-story portion of the school building.
Accordingly, the following observations were made:
Apartment Building: Implementation of seismic design requirements for the
apartment building resulted in seismic base shears that were as much as 4.6 times
design wind loading for current local seismic code requirements, and as much as
6.7 times design wind loading for current national seismic code requirements.
Office Building: Implementation of seismic design requirements for the office
building resulted in seismic base shears that were as much as 4.7 times design
wind loading for current local seismic code requirements, and as much as 5.3
times design wind loading for current national seismic code requirements.

GCR 14-917-26 10: Summary and Conclusions 10-5
Table 10-4 Summary of Lateral Force-Resisting System Strength Requirements for Seismic Design Levels
North-South Direction East-West Direction
Current Local Seismic
Code(1),(2)
Current National Seismic
Code(2),(3)
Current Local Seismic
Code(1),(2)
Current National Seismic
Code(2),(3)
Apartment 1.0 1.36 1.0 1.46
Office 1.0 1.14 1.0 1.14
Retail 1.0 1.92 1.0 1.94
Warehouse
Walls 1.0 1.88 1.0 1.88
Frames - - 1.0 2.57
Hospital 1.0 0.96 1.0 0.96
School(4) 1.0 1.49 1.0 1.49
Notes: (1) The current local seismic code is the 2003 International Building Code. For most buildings, the local code allows structural design to conform to the 1999 Standard Building Code, which is less demanding and was used for all buildings except the hospital. The local code does not permit the exception for design of hospitals. ASCE/SEI 7-02 was used as the basis for the hospital design.
(2) Ratios are base shear forces for current national seismic code design relative to current local seismic code design.
(3) The current national seismic code design for all buildings is conducted according to the 2012 International Building Code with ASCE/SEI 7-10 used as the basis.
(4) Given for the two-story portion of the school building.
Retail Building: Implementation of seismic design requirements for the retail
building resulted in seismic base shears that were as much as 1.9 times design
wind loading for current local seismic code requirements, and as much as 3.8
times design wind loading for current national seismic code requirements.
Warehouse Building: Implementation of seismic design requirements for the
warehouse building resulted in seismic base shears that were as much as 3.3
times design wind loading for current local seismic code requirements, and as
much as 6.3 times design wind loading for current national seismic code
requirements.
Hospital Building: Implementation of seismic design requirements for the
hospital building resulted in seismic base shears that were as much as 1.8 times
design wind loading.
School Building: Implementation of seismic design requirements for the school
building resulted in seismic base shears that were as much as 8.7 times design
wind loading for current local seismic code requirements, and as much as 12.9
times design wind loading for current national seismic code requirements.

10-6 10: Summary and Conclusions GCR 14-917-26
Although most nonstructural items in the buildings studied were considered
noncritical, damage to certain key elements can cause the space to become
uninhabitable, even resulting in significant financial loss or potential for injury to
occupants in a moderate to large seismic event. Additional limitations in building
functionality and usability can arise due to damage to stairs and elevators. In seismic
design, nonstructural bracing for seismic demands, along with some consideration for
story drift and relative deformation, is required to minimize the potential for damage
to nonstructural systems. Seismic design of nonstructural systems and equipment
will increase the likelihood that building utilities (e.g., water supply, power supply,
heating and air conditioning systems, and fire sprinkler systems) will remain
functional following an earthquake. In addition, seismic design of stairs and
elevators will increase the likelihood that occupants will be able to safely evacuate a
building (or continue to use a building) following an earthquake.
The increased strength and improved detailing of a seismic system can increase the
resistance of a structure to extreme windstorms, and wind loads in excess of code
design levels. Seismic design, however, will not improve the resistance of roofing
and roof framing to wind-induced uplift, or the exterior enclosure of the building
(i.e., windows and doors) to extreme wind loads or wind-borne debris.
The seismic performance of the apartment building, the office building, and the
hospital was also assessed using the FEMA P-58-1 methodology (FEMA, 2012a).
Using this methodology, performance was quantitatively measured in terms of
annualized losses (i.e., the average value of loss, per year, over a period of years) for
repair costs, casualties, and probability of collapse. Results are summarized in Table
10-5.
Table 10-5 Summary of Annualized Losses at Three Design Levels
Wind
Current Local Seismic Code(1)
Current National Seismic Code(1)
Loss
Prob.of Collapse Fatalities
Repair Cost
Prob. of Collapse Fatalities
Repair Cost
Apartment 1.0 1.0(2) 1.0(2) 1.0(2) 0.46 0.50 0.52
Office 1.0 0.65 0.72 0.47 0.28 0.28 0.24
Hospital 1.0 0.04 0.04 0.88 0.05 0.05 0.92
Notes: (1) Ratios of losses relative to wind design
(2) Losses for the wind design were taken as equivalent to current local seismic code design
Accordingly, the following observations were made:
Apartment Building: Annualized losses, in terms of repair cost, fatalities, and
probability of collapse for the apartment building, were reduced by

GCR 14-917-26 10: Summary and Conclusions 10-7
approximately 50% when current national seismic code provisions were
implemented.
Office Building: Annualized losses, in terms of repair costs, fatalities, and
probabilities of collapse for the office building, were reduced by more than 30%
when current local seismic design provisions are implemented, and by more than
70% when current national seismic design provisions were implemented, relative
to the annualized losses that were expected for wind design provisions, alone.
Hospital Building: Annualized fatalities and probabilities of collapse for the
hospital building were reduced by approximately 90% when current local or
current national seismic design provisions were implemented. In terms of
annualized repair cost, losses for the hospital building were reduced by
approximately 10% when current local or current national seismic design
provisions were implemented.
These results are consistent with qualitative expectations for improved performance
based on increased design strength and improved detailing requirements. Results for
typical buildings in each class of buildings would be expected to be similar.
10.3 Summary of Conclusions
The conclusion of this study is that construction cost premiums associated with
meeting current national standards for seismic resistance are small, generally 3% or
less over design for wind loads, and 1% or less over what is currently required for
seismic design in the Memphis area.
In general, buildings designed to meet current standards for seismic resistance will
have a lower potential for damage, a lower risk of collapse, and a correspondingly
lower risk for casualties than buildings designed to resist the effects of wind load
alone. For the buildings in this study that were assessed quantitatively, annualized
repair costs, probabilities of collapse, and risk of fatalities were all reduced when
seismic design provisions were considered, relative to cases when wind design
provisions alone were considered.


GCR 14-917-26 A: Historical Building Construction Data A-1
Appendix A
Historical Building Construction Data
In order to predict the types of construction expected in the near future in Memphis
and Shelby County, historical building construction data provided by the NIST
Office of Applied Economics was studied. The database originated with work done
by French (2011) for MAE Center (http://mae.cee.illinois.edu/), including data from
tax assessor records. Single- and two-family homes were excluded from the
database.
The original data were arranged into the following categories:
Construction Year: Separated into 1940s and older, 1950s, 1960s, 1970s, 1980s,
1990s, and 2000-2007.
Occupancy Type: 23 categories.
Structure Type: 11 categories.
Number of Stories: Separated into 1-story, 2-story, 3-story, 4- to 9- story, 10-
story and taller buildings.
For this study, the 23 occupancy types were merged into 21 categories by combining
related categories together, and the construction years were merged into two
categories (all years and years since 1990 to understand recent trends). In order to
better understand the data, pie charts were developed by the project team. These
charts are provided in Figures A-1 through A-18 and illustrate the share of occupancy
type, construction type, and number of story categories, in terms of number of
buildings (“count”), total square feet of floor area (“area”), and replacement cost
(“value”) for all years and those years from 1990 to 2007. The data presented form
the basis for Tables 2-1 through 2-3.
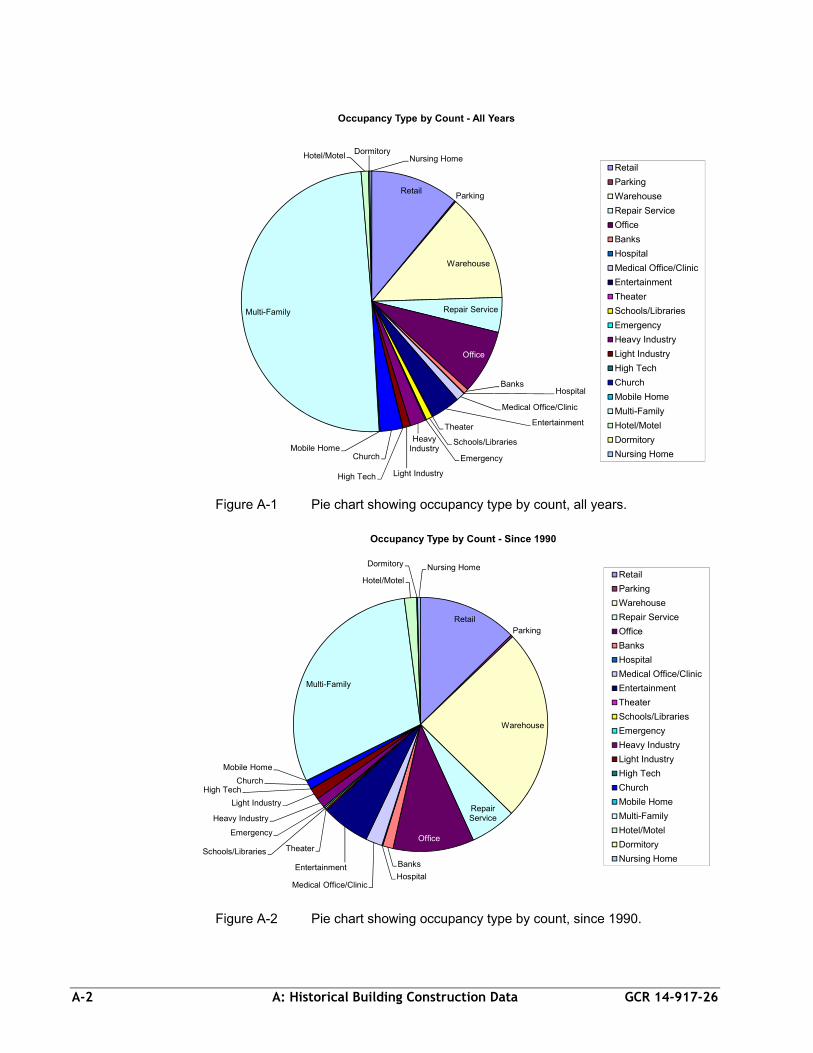
A-2 A: Historical Building Construction Data GCR 14-917-26
Figure A-1 Pie chart showing occupancy type by count, all years.
Figure A-2 Pie chart showing occupancy type by count, since 1990.
RetailParking
Warehouse
Repair Service
Office
BanksHospital
Medical Office/Clinic
EntertainmentTheater
Schools/Libraries
Emergency
Heavy Industry
Light IndustryHigh Tech
ChurchMobile Home
Multi-Family
Hotel/Motel DormitoryNursing Home
Occupancy Type by Count - All Years
Retail
Parking
Warehouse
Repair Service
Office
Banks
Hospital
Medical Office/Clinic
Entertainment
Theater
Schools/Libraries
Emergency
Heavy Industry
Light Industry
High Tech
Church
Mobile Home
Multi-Family
Hotel/Motel
Dormitory
Nursing Home
RetailParking
Warehouse
Repair Service
Office
Banks
HospitalMedical Office/Clinic
Entertainment
TheaterSchools/Libraries
Emergency
Heavy Industry
Light Industry
High TechChurch
Mobile Home
Multi-Family
Hotel/Motel
Dormitory Nursing Home
Occupancy Type by Count - Since 1990
Retail
Parking
Warehouse
Repair Service
Office
Banks
Hospital
Medical Office/Clinic
Entertainment
Theater
Schools/Libraries
Emergency
Heavy Industry
Light Industry
High Tech
Church
Mobile Home
Multi-Family
Hotel/Motel
Dormitory
Nursing Home

GCR 14-917-26 A: Historical Building Construction Data A-3
Figure A-3 Pie chart showing occupancy type by floor area, all years.
Figure A-4 Pie chart showing occupancy type by floor area, since 1990.
Retail Parking
Warehouse
Repair Service
Office
Banks
Hospital
Medical Office/Clinic
Entertainment
Theater
Schools/Libraries
Emergency
Heavy IndustryLight Industry
High Tech
Church
Mobile Home
Multi-Family
Hotel/Motel
Dormitory
Nursing Home
Occupancy Type by Floor Area - All Years
Retail
Parking
Warehouse
Repair Service
Office
Banks
Hospital
Medical Office/Clinic
Entertainment
Theater
Schools/Libraries
Emergency
Heavy Industry
Light Industry
High Tech
Church
Mobile Home
Multi-Family
Hotel/Motel
Dormitory
Nursing Home
Retail
Parking
Warehouse
Repair Service
OfficeBanks
HospitalMedical Office/Clinic
EntertainmentTheater
Schools/LibrariesEmergency
Heavy Industry
Light Industry
High Tech
Church
Mobile Home
Multi-Family
Hotel/Motel
DormitoryNursing Home
Occupancy Type by Floor Area - Since 1990
Retail
Parking
Warehouse
Repair Service
Office
Banks
Hospital
Medical Office/Clinic
Entertainment
Theater
Schools/Libraries
Emergency
Heavy Industry
Light Industry
High Tech
Church
Mobile Home
Multi-Family
Hotel/Motel
Dormitory
Nursing Home

A-4 A: Historical Building Construction Data GCR 14-917-26
Figure A-5 Pie chart showing occupancy type by value, all years.
Figure A-6 Pie chart showing occupancy type by value, since 1990.
RetailParking
Warehouse
Repair Service
Office
Banks
Hospital
Medical Office/Clinic
EntertainmentTheater
Schools/Libraries
Emergency
Heavy Industry
Light IndustryHigh Tech
Church
Mobile Home
Multi-Family
Hotel/Motel
Dormitory
Nursing Home
Occupancy Type by Value - All Years
Retail
Parking
Warehouse
Repair Service
Office
Banks
Hospital
Medical Office/Clinic
Entertainment
Theater
Schools/Libraries
Emergency
Heavy Industry
Light Industry
High Tech
Church
Mobile Home
Multi-Family
Hotel/Motel
Dormitory
Nursing Home
RetailParking
Warehouse
Repair Service
OfficeBanks
Hospital
Medical Office/Clinic
Entertainment
Theater
Schools/LibrariesEmergency
Heavy Industry
Light Industry
High Tech
Church
Mobile Home
Multi-Family
Hotel/Motel
DormitoryNursing Home
Occupancy Type by Value - since 1990
Retail
Parking
Warehouse
Repair Service
Office
Banks
Hospital
Medical Office/Clinic
Entertainment
Theater
Schools/Libraries
Emergency
Heavy Industry
Light Industry
High Tech
Church
Mobile Home
Multi-Family
Hotel/Motel
Dormitory
Nursing Home

GCR 14-917-26 A: Historical Building Construction Data A-5
Figure A-7 Pie chart showing structure type by count, all years.
Figure A-8 Pie chart showing structure type by count, since 1990.
Reinforced Concrete Frame
Reinforced Concrete WallMobile Home
Tilt Up
Precast Frame
Reinforced Masonry
Steel Frame
Light Steel
URMLight Wood
Commercial Wood
Structure Type by Count - All Years
Reinforced Concrete Frame
Reinforced Concrete Wall
Mobile Home
Tilt Up
Precast Frame
Reinforced Masonry
Steel Frame
Light Steel
URM
Light Wood
Commercial Wood
Reinforced Concrete Frame
Reinforced Concrete WallMobile Home
Tilt Up
Precast Frame
Reinforced Masonry
Steel Frame
Light Steel
URM
Light Wood
Commercial Wood
Structure Type by Count - Since 1990
Reinforced Concrete Frame
Reinforced Concrete Wall
Mobile Home
Tilt Up
Precast Frame
Reinforced Masonry
Steel Frame
Light Steel
URM
Light Wood
Commercial Wood

A-6 A: Historical Building Construction Data GCR 14-917-26
Figure A-9 Pie chart showing structure type by floor area, all years.
Figure A-10 Pie chart showing structure type by floor area, since 1990.
Reinforced Concrete Frame Reinforced Concrete Wall
Mobile Home
Tilt Up
Precast Frame
Reinforced Masonry
Steel Frame
Light Steel
URM
Light Wood
Commercial Wood
Structure Type by Floor Area - All Years
Reinforced Concrete Frame
Reinforced Concrete Wall
Mobile Home
Tilt Up
Precast Frame
Reinforced Masonry
Steel Frame
Light Steel
URM
Light Wood
Commercial Wood
Reinforced Concrete Frame Reinforced Concrete Wall
Mobile Home
Tilt Up
Precast Frame
Reinforced Masonry
Steel Frame
Light Steel
URM
Light WoodCommercial Wood
Structure Type by Floor Area - since 1990
Reinforced Concrete Frame
Reinforced Concrete Wall
Mobile Home
Tilt Up
Precast Frame
Reinforced Masonry
Steel Frame
Light Steel
URM
Light Wood
Commercial Wood

GCR 14-917-26 A: Historical Building Construction Data A-7
Figure A-11 Pie chart showing structure type by value, all years.
Figure A-12 Pie chart showing structure type by value, since 1990.
Reinforced Concrete
Frame
Reinforced Concrete Wall
Mobile Home
Tilt Up
Precast Frame
Reinforced Masonry
Steel FrameLight Steel
URM
Light Wood
Commercial Wood
Structure Type by Value - All Years
Reinforced Concrete Frame
Reinforced Concrete Wall
Mobile Home
Tilt Up
Precast Frame
Reinforced Masonry
Steel Frame
Light Steel
URM
Light Wood
Commercial Wood
Reinforced Concrete Frame
Reinforced Concrete Wall
Mobile Home
Tilt Up
Precast Frame
Reinforced Masonry
Steel Frame
Light Steel
URMLight Wood
Commercial Wood
Structure Type by Value - Since 1990
Reinforced Concrete Frame
Reinforced Concrete Wall
Mobile Home
Tilt Up
Precast Frame
Reinforced Masonry
Steel Frame
Light Steel
URM
Light Wood
Commercial Wood
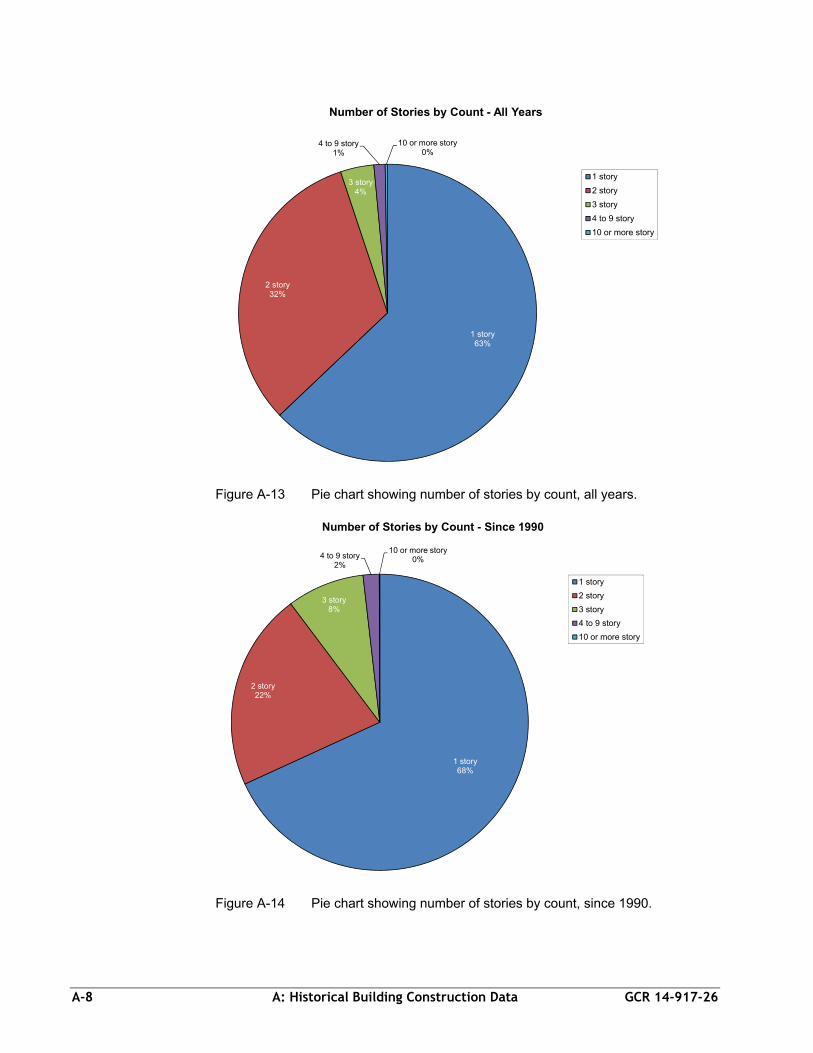
A-8 A: Historical Building Construction Data GCR 14-917-26
Figure A-13 Pie chart showing number of stories by count, all years.
Figure A-14 Pie chart showing number of stories by count, since 1990.
1 story63%
2 story32%
3 story4%
4 to 9 story1%
10 or more story0%
Number of Stories by Count - All Years
1 story
2 story
3 story
4 to 9 story
10 or more story
1 story68%
2 story22%
3 story8%
4 to 9 story2%
10 or more story0%
Number of Stories by Count - Since 1990
1 story
2 story
3 story
4 to 9 story
10 or more story

GCR 14-917-26 A: Historical Building Construction Data A-9
Figure A-15 Pie chart showing number of stories by area, all years.
Figure A-16 Pie chart showing number of stories by area, since 1990.
1 story53%
2 story25%
3 story11%
4 to 9 story7%
10 or more story4%
Number of Stories by Area - All Years
1 story
2 story
3 story
4 to 9 story
10 or more story
1 story68%
2 story14%
3 story10%
4 to 9 story7%
10 or more story1%
Number of Stories by Area - Since 1990
1 story
2 story
3 story
4 to 9 story
10 or more story

A-10 A: Historical Building Construction Data GCR 14-917-26
Figure A-17 Pie chart showing number of stories by value, all years.
Figure A-18 Pie chart showing number of stories by area, since 1990.
1 story43%
2 story30%
3 story13%
4 to 9 story9%
10 or more story5%
Number of Stories by Value - All Years
1 story
2 story
3 story
4 to 9 story
10 or more story
1 story57%
2 story16%
3 story12%
4 to 9 story14%
10 or more story1%
Number of Stories by Value - Since 1990
1 story
2 story
3 story
4 to 9 story
10 or more story

GCR 14-917-26 B: Geotechnical Data for Design B-1
Appendix B
Geotechnical Data for Design
This appendix provides detailed information regarding geology of the general area
and specific building sites used for determining the type of foundation, allowable
bearing pressures, and seismic site class for each building studied.
B.1 General Area Geology
The study area is in southwestern Tennessee and northwestern Mississippi, on the
Gulf Coastal Plain. The Gulf Coastal Plain is characterized by flat to hilly
topography and dissected at many places by rivers and creeks, with the highest
elevation being about 430 feet.
The area is near the north-central part of the Mississippi Embayment, a trough-like
depression that plunges southward along an axis approximating the present course
of the Mississippi River. Sediment depth in the area is approximately 2,700 feet.
The unconsolidated sediments consist of clay, silt (aeolian, alluvial, and marine),
sand, gravel, chalk, and lignite. Except for some local beds of ferruginous and
calcareous sandstone and limestone, there is no well-consolidated rock above the
Paleozoic Formation.
This material is classified in accordance with the Unified Soil Classification System
(USCS) provided in ASTM D2487-11 Standard Practice for Classification of Soils
for Engineering Purposes (ASTM, 2011). The uppermost formation in the area is
Pleistocene epoch loess, which consists of clayey silts and silty clays, and
constitutes the upper formation over most of Shelby and Desoto Counties. Loess
consists predominantly of silt, but it contains varying amounts of clay and is
generally buff colored and uniform in texture. The thickness of the loess is usually
about 20 to 30 feet, but typically is greater than 60 feet along the Mississippi River.
The loess cap thins towards the east, commonly terminating at the Mississippi
Embayment boundary. The next formation is a discontinuous series of alluvial
deposits referred to as the Terrace Deposits. The Terrace Deposits are Tertiary
Period in age (1.6-65 million years old) and thin gradually eastward, and are absent
in many places as a result of erosion or non-deposition. The alluvial deposits are
composed mostly of coarse-grained quartz sand, fine-grained iron-stained quartz,
and chert gravel. Lenses of yellowish-brown clay are frequently present locally in
the lower part of the deposits. These materials are typically red or brown, dense,
and well graded; and the thickness ranges from 0 to 200 feet. They generally occur
35 to 50 feet below the ground surface. Underlying the Terrace Deposits is the
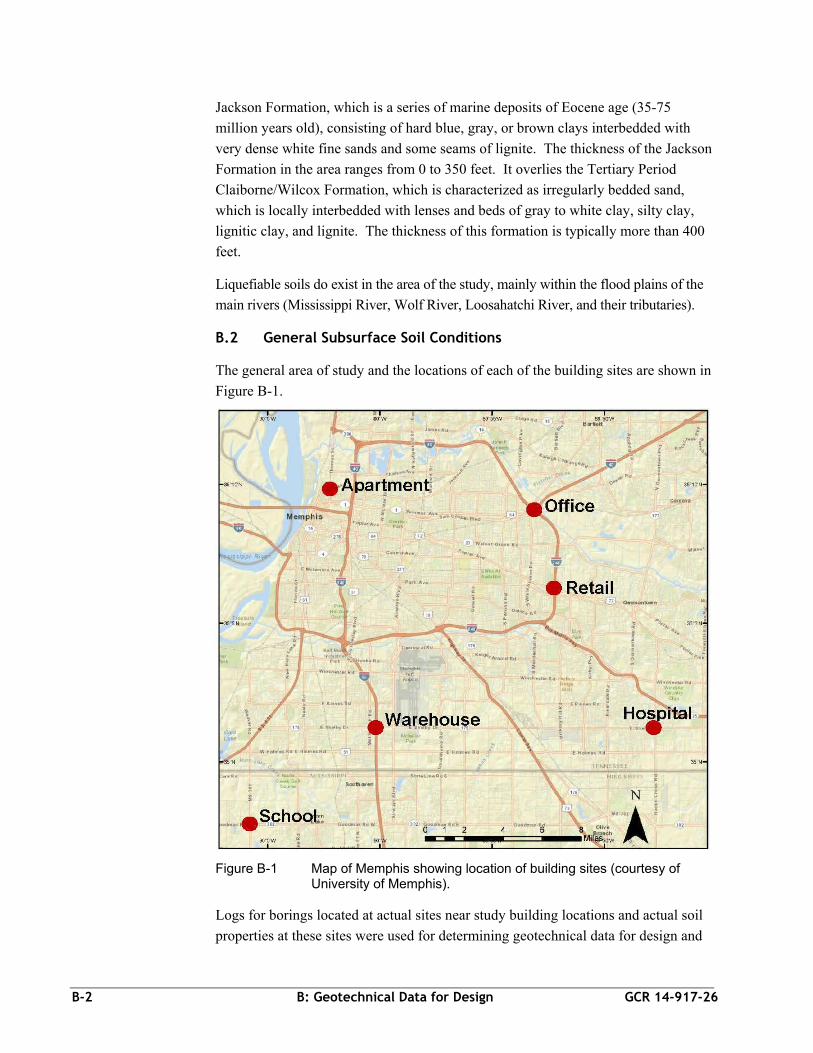
B-2 B: Geotechnical Data for Design GCR 14-917-26
Jackson Formation, which is a series of marine deposits of Eocene age (35-75
million years old), consisting of hard blue, gray, or brown clays interbedded with
very dense white fine sands and some seams of lignite. The thickness of the Jackson
Formation in the area ranges from 0 to 350 feet. It overlies the Tertiary Period
Claiborne/Wilcox Formation, which is characterized as irregularly bedded sand,
which is locally interbedded with lenses and beds of gray to white clay, silty clay,
lignitic clay, and lignite. The thickness of this formation is typically more than 400
feet.
Liquefiable soils do exist in the area of the study, mainly within the flood plains of the
main rivers (Mississippi River, Wolf River, Loosahatchi River, and their tributaries).
B.2 General Subsurface Soil Conditions
The general area of study and the locations of each of the building sites are shown in
Figure B-1.
Figure B-1 Map of Memphis showing location of building sites (courtesy of University of Memphis).
Logs for borings located at actual sites near study building locations and actual soil
properties at these sites were used for determining geotechnical data for design and

GCR 14-917-26 B: Geotechnical Data for Design B-3
discussed in the following sections. Detailed soil profiles are provided for five of
the building locations (except the warehouse building). The soil profiles contain
information including blow counts (N values) from the Standard Penetration Tests
(SPT), moisture content, dry unit weight, and shear strength, as determined by
unconfined compression testing on samples.
B.2.1 Apartment Site
The apartment site is located in the northwestern part of Memphis, to the west of
Interstate 40. A study for a nearby project indicated that the soil to a depth of 25
feet consists of one stratum. The soil profile at this site is provided in Figure B-2.
Uncontrolled fill, debris, and unsuitable materials were encountered within the
upper 1 to 7 feet due to past activities.
The loess material, which constitutes the upper soil stratum, extends to the depth of
boring termination (25 feet). This material was classified as silty clay and clayey
silt. The blow counts in this material varied from 2 to 19, indicating a soft to very
stiff consistency. The moisture content varied from 19% to 36%. The dry unit
weights from samples of this material taken from borings B-1 and B-7 at depths
varying from 6 to 13 feet ranged from 89.4 to 94.0 pounds per cubic foot (pcf). The
shear strength, as determined by unconfined compression testing on the sample from
B-1 was 525 pounds per square foot (psf). The shear strength from the sample from
B-7, as determined by unconsolidated-undrained triaxial compression was 380 psf.
During drilling operations, water was encountered in several borings at depths
varying from 13 to 17 feet. This appears to be perched (or trapped) water. The
depth of the groundwater at the site will experience fluctuations during the year.
Shallow foundations are typically designed using the net allowable bearing pressure
of 2,000 to 2,200 psf. Column loads of more than 150 kips typically require
intermediate foundations to limit anticipated settlements to tolerable limits.

B-4 B: Geotechnical Data for Design GCR 14-917-26
Figure B-2 Soil profile at the site of the apartment building (courtesy of Geotechnology, Inc).
GCR 14-917-26 B: Geotechnical Data for Design B-5
B.2.2 Office Site
The office site is located in eastern Memphis, near the Interstate 40 to Interstate 240
East interchange. A study for a nearby project indicated that the soil to a depth of
100 feet consists of two general formations. Fill was placed in this area during the
construction of the highway bridges. The soil profile at this site is provided in
Figure B-3.
The soil layers encountered near ground surface are of stiff to hard clay, silty clay,
clayey silt or sandy silt in the upper 18 to 20 feet. The upper zone of this layer
includes fill materials. These layers are underlain by layers of medium dense to
very dense sand and silty sand with varying amounts of gravel to a depth of 48 feet.
The lowermost layer consists of stiff to hard clay.
Two piezometers from nearby construction indicated groundwater from 19.1 to 29.4
feet (approximate elevations of 223.00 to 227.00). The existence of perched water
cannot be ignored and should be taken into consideration during construction.
Allowable bearing capacity is typically in the range of 2,400 to 2,700 psf in this
area, based on the assumption that surficial weak soil due to excessive moisture
content is corrected by drying and re-compaction or undercutting and backfilling.

B-6 B: Geotechnical Data for Design GCR 14-917-26
Figure B-3 Soil profile at the site of the office building (courtesy of Geotechnology, Inc).

GCR 14-917-26 B: Geotechnical Data for Design B-7
B.2.3 Retail Site
The retail site is located in eastern Memphis, to the east of Interstate 240. A study
for a nearby project indicated that the soil to a depth of 100 feet consists of two
general formations. The soil profile at this site is provided in Figure B-4. Fill was
noted adjacent to the existing ramp onto Poplar Avenue from Sweetbriar.
The uppermost stratum was classified as silty clay, clay with sand, and silt. The
blow counts from within this stratum varied from 3 to 50, indicating soft to hard
consistencies. The moisture contents ranged from 10% to 28%. The dry unit weight
from a sample of this material from boring B-2 at a depth of 8 feet was 96.4 pcf.
The underlying stratum was classified as silty sand, silty sand with gravel, sand with
silt, and clayey sand with gravel. The materials were also visually classified as sand
and gravelly sand. The blow counts varied from 20 to more than 100, indicating
medium dense to very dense conditions.
The method of drilling (wet rotary) did not allow for accurate groundwater
determination at the locations of the borings but perched water was encountered at a
depth of 5 feet. The depth of groundwater at the area will experience fluctuations
during periods of the year.
Allowable bearing capacity is typically in the range of 2,200 to 2,500 psf in this
area, based on the assumption that surficial weak soil due to excessive moisture
content is corrected by drying and re-compaction or undercutting and backfilling.
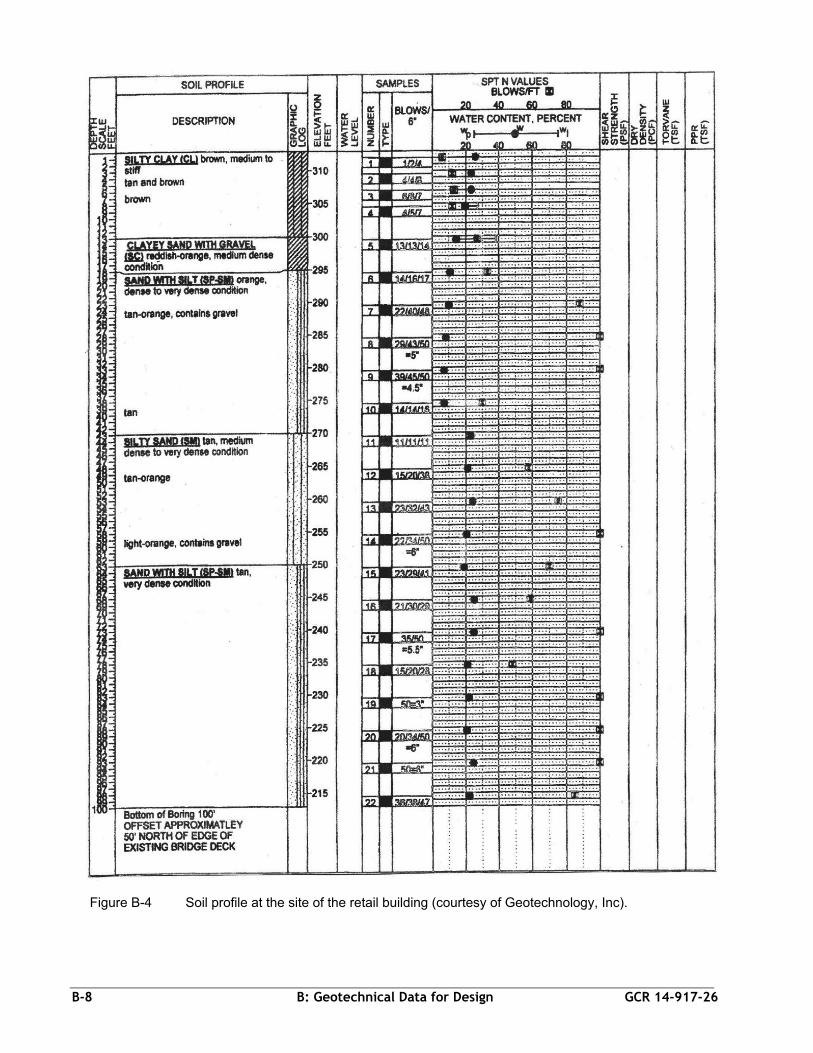
B-8 B: Geotechnical Data for Design GCR 14-917-26
Figure B-4 Soil profile at the site of the retail building (courtesy of Geotechnology, Inc).

GCR 14-917-26 B: Geotechnical Data for Design B-9
B.2.4 Warehouse Site
The warehouse site is located in southern Memphis, to the east of Interstate 55. A
study for a nearby project indicated that the soil to a depth of 200 feet consists of
three formations. It is also typical to encounter fill in this area.
The uppermost stratum extends from the surface to a depth varying from 8 to 18
feet. This material is classified silty clay/clayey silt. The blow counts varied from 3
to 26, indicating a soft to very stiff consistency in a fine-grained soil. Moisture
contents varied from 6 to 28. The dry unit weight of samples taken from a depth of
8 feet varied from 97.5 to 101.9 pcf. The shear strength as determined by
unconfined compressive testing on same samples from borings 1 and 8 were 1,000
and 900 psf respectively.
The underlying material is composed of sandy clay, clayey sand, silty sand and sand
which is typical of the Terrace Deposits. This material exists in substrata, which
vary in thickness from about 3 feet to more than 50 feet. The blow counts in the
predominantly fine-grained materials varied from 7 to 39, indicating a medium to
hard consistency. In the areas dominated by coarse-grained materials, blow counts
varied from 17 to more than 100, indicating a medium to very dense condition in
these soils.
The lowermost stratum at the site is composed of a mixture of fine- and coarse-
grained materials, typical of the Jackson Formation. The Jackson Formation
alternates between zones of material that are predominantly fine- or coarse-grained.
The blow counts in the areas that are fine-grained varied from 32 to 68, indicating a
hard consistency. The blow counts from the areas that are predominantly coarse-
grained varied from 34 to more than 100, indicating a dense to very dense condition.
Groundwater was encountered in borings 1 through 8 at depths varying from 23 to
31 feet.
Shallow foundations are typical for column loads of less than 200 kips. Allowable
bearing capacity is typically in the range of 2,200 to 2,700 psf in this area, based on
the assumption that surficial weak soil due to excessive moisture content is
corrected by drying and re-compaction or undercutting and backfilling. Column
loads exceeding 350 kips are typically supported by deep foundation systems.
B.2.5 Hospital Site
The hospital site is located in the south central part of Shelby County. A study for a
nearby project indicated that the soil to a depth of 40 feet consists of two general
formations. The soil profile at this site is provided in Figure B-5.
The depth of the uppermost loess material varied across the site, where it varies in
depth from approximately 3 to 18 feet. This material was classified as a clayey silt,

B-10 B: Geotechnical Data for Design GCR 14-917-26
silty clay, and clay with sand. The blow counts in this material varied from 1 to
more than 100, indicating a very soft to hard consistency. The moisture contents
varied from 6% to 36%. Atterberg Limit tests from this material indicated values
ranging from 22% to 41% for the liquid limit and 3% to 20% for the plasticity
index. Soft soils were encountered in the borings throughout the area due to
relatively high moisture contents. The dry unit weight from samples of this material
across the site varied from 88.5 to 104.6 pcf. The shear strength as determined by
unconfined compressive testing on some of the samples varied from 515 to 1,590
psf.
Terrace Deposits extend from beneath the loess material to the depth of boring
termination. This material was classified as a silty sand, clayey sand, sand with silt,
and high plasticity clay. The material also contains varying amounts of gravel
throughout. The blow counts in the predominantly coarse-grained material varied
from 11 to more than 100, indicating a medium to very dense condition. The blow
counts in the predominantly fine-grained material varied from 6 to 67, indicating a
medium to hard consistency. The moisture content varied from 5% to 41%.
Groundwater was encountered during the drilling operation across the site at a depth
varying from approximately 1 to 32 feet. The water encountered in the upper fine-
grained material appears to be trapped water.
Allowable bearing capacity is around 2,200 psf in this area, based on the assumption
that surficial weak soil due to excessive moisture content is corrected by drying and
re-compacting or undercutting and backfilling. Engineered fill that was placed at
the site to achieve design grades allowed for bearing capacities of up 3,000 psf and
shallow foundations was consequently used to support column load of
approximately 400 kips.

GCR 14-917-26 B: Geotechnical Data for Design B-11
Figure B-5 Soil profile at the site of the hospital building (courtesy of Geotechnology, Inc).

B-12 B: Geotechnical Data for Design GCR 14-917-26
B.2.6 School Site
The school site is located in the northwestern part of Desoto County, Mississippi, to
the west of Interstate 55. A study for a nearby project indicated that the soil to a
depth of 35 feet consists of two strata. The uppermost stratum is composed of fine-
grained materials, which are typical of loess. The underlying stratum is composed
of both fine and coarse-grained materials, which are typical of alluvial deposits.
The soil profile at this site is provided in Figure B-6.
The uppermost fine-grained soils were classified as silty clay and silt. The materials
were also visually classified as clay and clayey silt. The blow counts within this
stratum varied from 2 to 29, indicating soft to very stiff consistencies. The moisture
contents varied from 10% to 31%. The liquid limits and plasticity indices of the
tested samples ranged from 27.9% to 35.4% and 4.5% to 17.7%, respectively. The
dry unit weight from samples of the material from samples at depths of 3 and 8 feet
ranged from 97.4 to 102.1 pcf. The shear strength of the same samples, as
determined by unconfined compression testing, varied from 720 to 1,300 psf.
The soils in the underlying strata were classified as clayey sand with gravel. The
materials were also visually classified as sandy clay, clayey sand, silty sand and
sand. The blow counts varied from 11 to 100, indicating medium dense to very
dense conditions in the zones dominated by coarse-grained materials, and stiff to
hard in the fine-grained materials.
During the study, groundwater was encountered at depths ranging from 6 to 17 feet.
The depth of the groundwater at the site will experience fluctuations during the year.
Shallow foundations are typical for column load of less than 200 kips. Allowable
bearing capacity is typically in the range of 2,000 to 2,500 psf in this area, based on
the assumption that surficial weak soil due to excessive moisture content is
corrected by drying and re-compaction or undercutting and backfilling. For column
loads exceeding 200 kips, intermediate foundation systems (such as rammed
aggregate piers) have been extensively utilized in the area. Column loads exceeding
350 kips are typically supported by deep foundation systems.

GCR 14-917-26 B: Geotechnical Data for Design B-13
Figure B-6 Soil profile at the site of the school building (courtesy of Geotechnology, Inc).


GCR 14-917-26 C: Cost Data C-1
Appendix C
Cost Data
This appendix provides the basis for developing the cost models for each of the
buildings related to building construction and a summary of the cost data developed
for each of the six building types at each of the three design levels.
C.1 Apartment Building
Building size: The apartment building is three-story tall with a footprint of
approximately 68 feet by 261 feet. Each story is 10.5 feet tall.
Foundation system: The foundation system consists of a four inch thick reinforced
concrete slab, thickened at perimeter and interior load bearing walls. Slab on grade is
four inch thick reinforced concrete.
Framing system: The framing system consists of wood stud framing with oriented
strand board (OSB) sheathing and holdowns. Elevated floor structure consists of
engineered wood trusses or wood joist framing with plywood and gypcrete topping.
Roof system: The roof system consists of sloped engineered wood trusses. Roofing
is profiled steel with batt insulation in the attic.
Exterior cladding: Exterior cladding is cement plaster applied over exterior
sheathing. Windows are aluminum framed nail-on windows with insulated glass.
Interior construction: Interior construction includes build out of nonstructural
partitions. Floors are generally carpet, with sheet vinyl in kitchen and restroom.
Interior finish is gypsum board attached to structural wood studs. Walls are generally
painted and ceilings are generally gypsum board attached to the underside of the
structure.
Built-in equipment: Apartments are fully finished based on standard finishes. Built-
in equipment includes kitchen and bathroom fixtures and cabinetry.
Vertical circulation system: The vertical circulation system consists of stairs and
one hydraulic elevator.
Mechanical system: Mechanical systems consist of individual apartment packaged
units located in the ceiling space of each apartment.

C-2 C: Cost Data GCR 14-917-26
Electrical system: Electrical systems include user convenience power, lighting,
telecommunications, and alarm systems. Lighting generally consists of surface-
mount fluorescent fixtures in public areas, kitchens, and restrooms, and switched
outlets in other areas.
Sprinkler system: The building is fully sprinklered.
Figures C-1 through C-3 provide a summary of the cost data developed for the
apartment building at each of the three design levels.
Figure C-1 Apartment building component cost summary for wind design (ASCE/SEI 7-05).
Gross Area: 54,120 SF
$/SF Total ($x1,000)
1. Foundations 4.11 222 2. Vertical Structure 6.90 373 3. Floor & Roof Structures 13.82 748 4. Exterior Cladding 9.52 515 5. Roofing, Waterproofing, Skylights 6.56 355
Shell (1-5) 40.91 2,214
6. Interior Partitions, Doors, Glazing 12.29 665 7. Floor, Wall, Ceiling Finishes 5.90 319
Interiors (6-7) 18.20 985
8. Function Equipment & Specialties 5.09 276 9. Stairs & Vertical Transportation 1.72 93
Equipment & Vertical Transportation (8-9) 6.81 369
10 Plumbing Systems 8.02 43411 Heating, Ventilating & Air Conditioning 4.00 21612 Electric Lighting, Power, Communications 9.00 48713 Fire Protection Systems 4.00 216
Mechanical & Electrical (10-13) 25.02 1,354
Total Building Construction (1-13) 90.94 4,921
14 Site Preparation & Demolition 0.00 015 Site Paving, Structures & Landscaping 0.00 016 Utilities on Site 0.00 0
Total Site Construction (14-16) 0.00 0
TOTAL BUILDING & SITE (1-16) 90.94 4,921
General Conditions 10.00% 9.09 492Contractor's Overhead & Profit or Fee 5.00% 5.01 271
PLANNED CONSTRUCTION COST October 2012 105.03 5,684
Contingency for Development of Design 15.00% 15.76 853Additional Special Inspections Not required \
RECOMMENDED BUDGET October 2012 120.79 6,537

GCR 14-917-26 C: Cost Data C-3
Figure C-2 Apartment building component cost summary for current local seismic code design (1999 SBC).
Gross Area: 54,120 SF
$/SF Total ($x1,000)
1. Foundations 4.11 222 2. Vertical Structure 7.10 384 3. Floor & Roof Structures 13.82 748 4. Exterior Cladding 9.52 515 5. Roofing, Waterproofing, Skylights 6.56 355
Shell (1-5) 41.11 2,225
6. Interior Partitions, Doors, Glazing 12.29 665 7. Floor, Wall, Ceiling Finishes 5.90 319
Interiors (6-7) 18.20 985
8. Function Equipment & Specialties 5.09 276 9. Stairs & Vertical Transportation 1.72 93
Equipment & Vertical Transportation (8-9) 6.81 369
10. Plumbing Systems 8.05 436 11. Heating, Ventilating & Air Conditioning 4.02 218 12. Electric Lighting, Power, Communications 9.00 487 13. Fire Protection Systems 4.00 216
Mechanical & Electrical (10-13) 25.07 1,357
Total Building Construction (1-13) 91.19 4,935
14. Site Preparation & Demolition 0.00 0 15. Site Paving, Structures & Landscaping 0.00 0 16. Utilities on Site 0.00 0
Total Site Construction (14-16) 0.00 0
TOTAL BUILDING & SITE (1-16) 91.19 4,935
General Conditions 10.00% 9.13 494Contractor's Overhead & Profit or Fee 5.00% 5.01 271
PLANNED CONSTRUCTION COST October 2012 105.32 5,700
Contingency for Development of Design 15.00% 15.80 855Additional Special Inspections Not required
RECOMMENDED BUDGET October 2012 121.12 6,555

C-4 C: Cost Data GCR 14-917-26
Figure C-3 Apartment building component cost summary for current national seismic code design (ASCE/SEI 7-10).
C.2 Office Building
Building size: The office building is four-story tall with a footprint of approximately
115 feet by 214 feet. Each story is 13 feet tall.
Foundation system: The foundation system consists of reinforced concrete spread
footings over rammed aggregate piers (or similar stabilization). The slab on grade is
five inch thick reinforced concrete.
Framing system: The framing system consists of wide-flanged steel framing with
braced frames for the lateral system. The elevated floor structure consists of steel
deck with concrete fill on steel open web joists.
Gross Area: 54,120 SF
$/SF Total ($x1,000)
1. Foundations 4.11 222 2. Vertical Structure 7.91 428 3. Floor & Roof Structures 13.82 748 4. Exterior Cladding 9.52 515 5. Roofing, Waterproofing, Skylights 6.56 355
Shell (1-5) 41.92 2,269
6. Interior Partitions, Doors, Glazing 12.29 665 7. Floor, Wall, Ceiling Finishes 5.90 319
Interiors (6-7) 18.20 985
8. Function Equipment & Specialties 5.09 276 9. Stairs & Vertical Transportation 1.72 93
Equipment & Vertical Transportation (8-9) 6.81 369
10. Plumbing Systems 8.05 436 11. Heating, Ventilating & Air Conditioning 4.02 218 12. Electric Lighting, Power, Communications 9.00 487 13. Fire Protection Systems 4.00 216
Mechanical & Electrical (10-13) 25.07 1,357
Total Building Construction (1-13) 92.00 4,979
14. Site Preparation & Demolition 0.00 0 15. Site Paving, Structures & Landscaping 0.00 0 16. Utilities on Site 0.00 0
Total Site Construction (14-16) 0.00 0
TOTAL BUILDING & SITE (1-16) 92.00 4,979
General Conditions 10.00% 9.20 498Contractor's Overhead & Profit or Fee 5.00% 5.06 274
PLANNED CONSTRUCTION COST October 2012 106.26 5,751
Contingency for Development of Design 15.00% 15.95 863Additional Special Inspections 2
RECOMMENDED BUDGET October 2012 122.24 6,616

GCR 14-917-26 C: Cost Data C-5
Roof system: The roof system consists of untopped steel deck on steel open web
joists. Steel framing is not fireproofed. Roofing is a single-ply membrane on tapered
rigid insulation over the steel deck.
Exterior cladding: Exterior cladding is a combination of a five-foot strip of brick
veneer on metal suds and an eight-foot strip of aluminum framed insulated glazing
units. The interior finish is gypsum board on metal stud framing. Windows are
aluminum framed insulated glazing units.
Interior construction: Interior construction includes full build out of core, shell, and
tenant improvements. Tenant improvements are based on standard office layout with
80% open office area. Tenant workstations are excluded. Floors are generally
carpet, with minor enhancements in the main lobby and elevator core. Walls are
generally painted, with ceramic tile in the restrooms and ceilings are generally lay-in
acoustic tile, with gypsum board in the restrooms.
Built-in equipment: Built-in equipment includes main reception desk, signage, and
directories; toilet partitions and accessories; exterior window treatment; and limited
office cabinetry in break rooms. Moveable furniture, equipment, and workstations
are excluded.
Vertical circulation system: The vertical circulation system includes stairs and two
hydraulic elevators.
Mechanical system: Mechanical systems consist of zoned roof-mounted packaged
units to provide ventilation and temperature control by space.
Electrical system: Electrical systems include user convenience power, lighting,
telecommunications, and alarm systems. Lighting generally consists of lay-in
fluorescent fixtures.
Sprinkler system: The building is fully sprinklered.
Figures C-4 through C-6 provide a summary of the cost data developed for the office
building at each of the three design levels.

C-6 C: Cost Data GCR 14-917-26
Figure C-4 Office building component cost summary for wind design (ASCE/SEI 7-05).
Gross Area: 98,440 SF
$/SF Total ($x1,000)
1. Foundations 3.60 354 2. Vertical Structure 1.73 170 3. Floor & Roof Structures 14.76 1,453 4. Exterior Cladding 28.44 2,800 5. Roofing, Waterproofing, Skylights 5.14 506
Shell (1-5) 53.67 5,283
6. Interior Partitions, Doors, Glazing 12.59 1,240 7. Floor, Wall, Ceiling Finishes 12.12 1,193
Interiors (6-7) 24.71 2,433
8. Function Equipment & Specialties 3.14 309 9. Stairs & Vertical Transportation 4.67 460
Equipment & Vertical Transportation (8-9) 7.81 769
10 Plumbing Systems 4.55 44811 Heating, Ventilating & Air Conditioning 32.00 3,15012 Electric Lighting, Power, Communications 26.00 2,55913 Fire Protection Systems 2.50 246
Mechanical & Electrical (10-13) 65.05 6,403
Total Building Construction (1-13) 151.24 14,888
14 Site Preparation & Demolition 0.00 015 Site Paving, Structures & Landscaping 0.00 016 Utilities on Site 0.00 0
Total Site Construction (14-16) 0.00 0
TOTAL BUILDING & SITE (1-16) 151.24 14,888
General Conditions 10.00% 15.13 1,489Contractor's Overhead & Profit or Fee 5.00% 8.32 819
PLANNED CONSTRUCTION COST October 2012 174.69 17,196
Contingency for Development of Design 10.00% 17.47 1,720Additional Special Inspections Not required \
RECOMMENDED BUDGET October 2012 192.16 18,916

GCR 14-917-26 C: Cost Data C-7
Figure C-5 Office building component cost summary for current local seismic code design (1999 SBC).
Gross Area: 98,440 SF
$/SF Total ($x1,000)
1. Foundations 4.26 420 2. Vertical Structure 3.06 301 3. Floor & Roof Structures 15.66 1,541 4. Exterior Cladding 28.44 2,800 5. Roofing, Waterproofing, Skylights 5.14 506
Shell (1-5) 56.57 5,568
6. Interior Partitions, Doors, Glazing 12.69 1,249 7. Floor, Wall, Ceiling Finishes 12.12 1,193
Interiors (6-7) 24.81 2,442
8. Function Equipment & Specialties 3.14 309 9. Stairs & Vertical Transportation 4.67 460
Equipment & Vertical Transportation (8-9) 7.81 769
10. Plumbing Systems 4.55 448 11. Heating, Ventilating & Air Conditioning 32.10 3,160 12. Electric Lighting, Power, Communications 26.05 2,564 13. Fire Protection Systems 2.55 251
Mechanical & Electrical (10-13) 65.25 6,423
Total Building Construction (1-13) 154.43 15,203
14. Site Preparation & Demolition 0.00 0 15. Site Paving, Structures & Landscaping 0.00 0 16. Utilities on Site 0.00 0
Total Site Construction (14-16) 0.00 0
TOTAL BUILDING & SITE (1-16) 154.43 15,203
General Conditions 10.00% 15.44 1,520Contractor's Overhead & Profit or Fee 5.00% 8.49 836
PLANNED CONSTRUCTION COST October 2012 178.37 17,559
Contingency for Development of Design 10.00% 17.84 1,756Additional Special Inspections Not required
RECOMMENDED BUDGET October 2012 196.21 19,315

C-8 C: Cost Data GCR 14-917-26
Figure C-6 Office building component cost summary for current national seismic code design (ASCE/SEI 7-10).
C.3 Retail Building
Building size: The retail building is single story with a footprint of approximately
160 feet by 240 feet. The building is 29 feet tall.
Foundation system: The foundation system consists of reinforced concrete spread
footings. Slab on grade is five inch thick reinforced concrete, with applied surface
hardener.
Framing system: The perimeter structural frame system consists of tilt-up concrete
walls. The interior structural frame system consist of steel tube columns. The lateral
force-resisting system consists of tilt-up concrete walls.
Gross Area: 98,440 SF
$/SF Total ($x1,000)
1. Foundations 4.67 460 2. Vertical Structure 3.58 352 3. Floor & Roof Structures 15.78 1,553 4. Exterior Cladding 28.44 2,800 5. Roofing, Waterproofing, Skylights 5.14 506
Shell (1-5) 57.62 5,672
6. Interior Partitions, Doors, Glazing 12.69 1,249 7. Floor, Wall, Ceiling Finishes 12.12 1,193
Interiors (6-7) 24.81 2,442
8. Function Equipment & Specialties 3.14 309 9. Stairs & Vertical Transportation 4.67 460
Equipment & Vertical Transportation (8-9) 7.81 769
10. Plumbing Systems 4.55 448 11. Heating, Ventilating & Air Conditioning 32.10 3,160 12. Electric Lighting, Power, Communications 26.05 2,564 13. Fire Protection Systems 2.55 251
Mechanical & Electrical (10-13) 65.25 6,423
Total Building Construction (1-13) 155.49 15,306
14. Site Preparation & Demolition 0.00 0 15. Site Paving, Structures & Landscaping 0.00 0 16. Utilities on Site 0.00 0
Total Site Construction (14-16) 0.00 0
TOTAL BUILDING & SITE (1-16) 155.49 15,306
General Conditions 10.00% 15.55 1,531Contractor's Overhead & Profit or Fee 5.00% 8.55 842
PLANNED CONSTRUCTION COST October 2012 179.59 17,679
Contingency for Development of Design 10.00% 17.96 1,768Additional Special Inspections Not required
RECOMMENDED BUDGET October 2012 197.55 19,447

GCR 14-917-26 C: Cost Data C-9
Roof system: The roof system consists of steel open web joists with untopped steel
deck. Steel framing is not fireproofed. Roofing consists of a single-ply membrane on
protection board over the steel deck. Roof insulation is R30 rigid insulation over the
steel deck. The underside of the steel deck is exposed.
Exterior cladding: Exterior cladding is the tilt-up wall system, with storefront
glazing at the main building entrance. Exterior cladding costs include paint to the
exterior face of the tilt-up panels and insulation and furring to the interior face.
Interior construction: Interior construction includes construction of a single 1,000
square foot office suite, including one restroom core. The floor finish throughout is
vinyl composition tile. Interior finish is generally drywall on metal stud framing with
ceramic tile in the restrooms. The retail area has no ceiling. In the office area,
ceilings are lay-in tile, and restrooms have gypsum board ceilings.
Built-in equipment: Retail fixtures are excluded from the cost model.
Vertical circulation system: None.
Mechanical system: Mechanical systems consist of roof-mounted packaged units to
provide ventilation and temperature control.
Electrical system: Lighting is provided by high bay high-intensity discharge
lighting.
Sprinkler system: The building is fully sprinklered.
Figures C-7 through C-9 provide a summary of the cost data developed for the retail
building at each of the three design levels.

C-10 C: Cost Data GCR 14-917-26
Figure C-7 Retail building component cost summary for wind design (ASCE/SEI 7-05).
Gross Area: 38,400 SF
$/SF Total ($x1,000)
1. Foundations 7.34 282 2. Vertical Structure 8.46 325 3. Floor & Roof Structures 18.86 724 4. Exterior Cladding 5.36 206 5. Roofing, Waterproofing, Skylights 12.93 497
Shell (1-5) 52.94 2,033
6. Interior Partitions, Doors, Glazing 1.48 57 7. Floor, Wall, Ceiling Finishes 5.31 204
Interiors (6-7) 6.79 261
8. Function Equipment & Specialties 1.14 44 9. Stairs & Vertical Transportation 0.13 5
Equipment & Vertical Transportation (8-9) 1.27 49
10 Plumbing Systems 5.10 19611 Heating, Ventilating & Air Conditioning 5.00 19212 Electric Lighting, Power, Communications 6.00 23013 Fire Protection Systems 2.50 96
Mechanical & Electrical (10-13) 18.60 714
Total Building Construction (1-13) 79.61 3,057
14 Site Preparation & Demolition 0.00 015 Site Paving, Structures & Landscaping 0.00 016 Utilities on Site 0.00 0
Total Site Construction (14-16) 0.00 0
TOTAL BUILDING & SITE (1-16) 79.61 3,057
General Conditions 10.00% 7.97 306Contractor's Overhead & Profit or Fee 5.00% 4.38 168
PLANNED CONSTRUCTION COST October 2012 91.95 3,531
Contingency for Development of Design 10.00% 9.19 353Additional Special Inspections Not required \
RECOMMENDED BUDGET October 2012 101.15 3,884

GCR 14-917-26 C: Cost Data C-11
Figure C-8 Retail building component cost summary for current local seismic code design (1999 SBC).
Gross Area: 38,400 SF
$/SF Total ($x1,000)
1. Foundations 7.34 282 2. Vertical Structure 8.43 324 3. Floor & Roof Structures 18.93 727 4. Exterior Cladding 5.36 206 5. Roofing, Waterproofing, Skylights 12.93 497
Shell (1-5) 53.00 2,035
6. Interior Partitions, Doors, Glazing 1.48 57 7. Floor, Wall, Ceiling Finishes 5.31 204
Interiors (6-7) 6.79 261
8. Function Equipment & Specialties 1.14 44 9. Stairs & Vertical Transportation 0.13 5
Equipment & Vertical Transportation (8-9) 1.27 49
10. Plumbing Systems 5.10 196 11. Heating, Ventilating & Air Conditioning 5.00 192 12. Electric Lighting, Power, Communications 6.00 230 13. Fire Protection Systems 2.55 98
Mechanical & Electrical (10-13) 18.65 716
Total Building Construction (1-13) 79.72 3,061
14. Site Preparation & Demolition 0.00 0 15. Site Paving, Structures & Landscaping 0.00 0 16. Utilities on Site 0.00 0
Total Site Construction (14-16) 0.00 0
TOTAL BUILDING & SITE (1-16) 79.72 3,061
General Conditions 10.00% 7.97 306Contractor's Overhead & Profit or Fee 5.00% 4.38 168
PLANNED CONSTRUCTION COST October 2012 92.06 3,535
Contingency for Development of Design 10.00% 9.22 354Additional Special Inspections 5
RECOMMENDED BUDGET October 2012 101.41 3,894
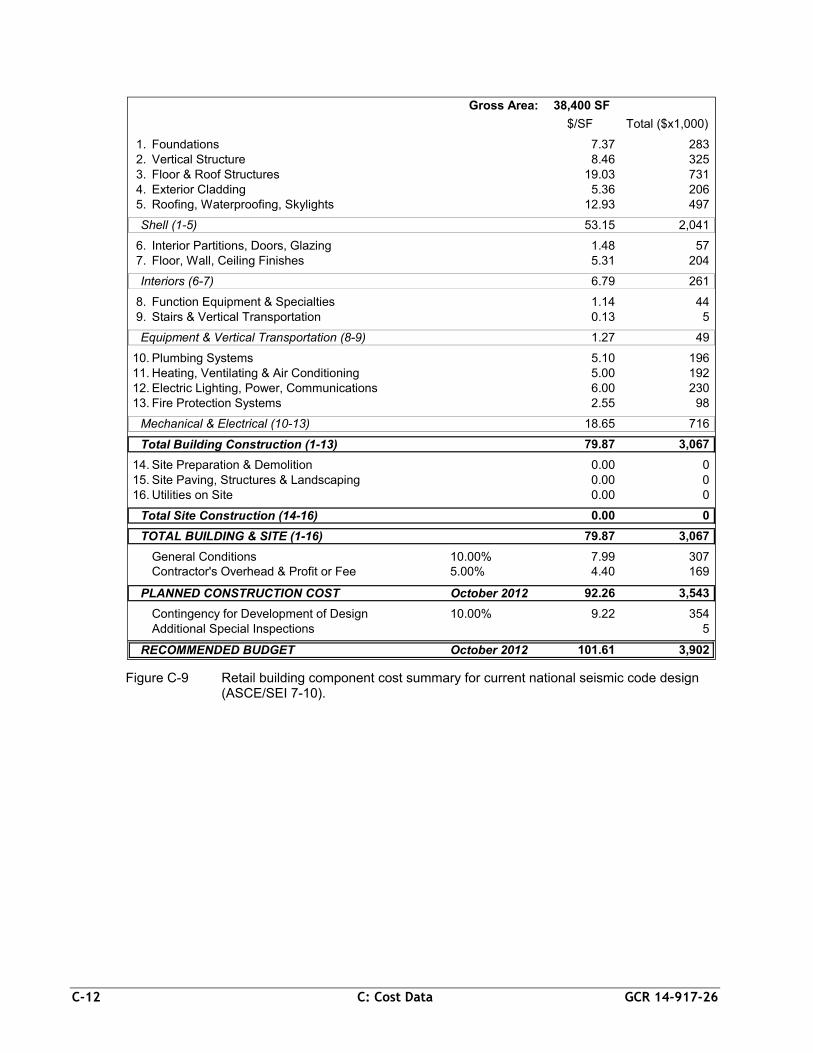
C-12 C: Cost Data GCR 14-917-26
Figure C-9 Retail building component cost summary for current national seismic code design (ASCE/SEI 7-10).
Gross Area: 38,400 SF
$/SF Total ($x1,000)
1. Foundations 7.37 283 2. Vertical Structure 8.46 325 3. Floor & Roof Structures 19.03 731 4. Exterior Cladding 5.36 206 5. Roofing, Waterproofing, Skylights 12.93 497
Shell (1-5) 53.15 2,041
6. Interior Partitions, Doors, Glazing 1.48 57 7. Floor, Wall, Ceiling Finishes 5.31 204
Interiors (6-7) 6.79 261
8. Function Equipment & Specialties 1.14 44 9. Stairs & Vertical Transportation 0.13 5
Equipment & Vertical Transportation (8-9) 1.27 49
10. Plumbing Systems 5.10 196 11. Heating, Ventilating & Air Conditioning 5.00 192 12. Electric Lighting, Power, Communications 6.00 230 13. Fire Protection Systems 2.55 98
Mechanical & Electrical (10-13) 18.65 716
Total Building Construction (1-13) 79.87 3,067
14. Site Preparation & Demolition 0.00 0 15. Site Paving, Structures & Landscaping 0.00 0 16. Utilities on Site 0.00 0
Total Site Construction (14-16) 0.00 0
TOTAL BUILDING & SITE (1-16) 79.87 3,067
General Conditions 10.00% 7.99 307Contractor's Overhead & Profit or Fee 5.00% 4.40 169
PLANNED CONSTRUCTION COST October 2012 92.26 3,543
Contingency for Development of Design 10.00% 9.22 354Additional Special Inspections 5
RECOMMENDED BUDGET October 2012 101.61 3,902

GCR 14-917-26 C: Cost Data C-13
C.4 Warehouse Building
Building size: The warehouse building is single story with a footprint of
approximately 500 feet by 800 feet. The building is 40 feet tall.
Foundation system: The foundation system consists of reinforced concrete spread
footings. Slab on grade is six inch thick unreinforced concrete with applied surface
hardener, over 12 inch thick soil cement subgrade.
Framing system: The building has one seismic joint separating the building into two
400 feet by 500 feet sections. The perimeter framing system consists of tilt-up
concrete walls. The interior structural frame system consists of steel tube columns.
The lateral force-resisting system consists of tilt-up concrete walls and a steel braced
frame.
Roof system: The roof system consists of steel open web joists with untopped steel
deck. Steel framing is not fireproofed. Roofing consists of a single-ply membrane on
protection board over the steel deck. Roof insulation is R30 batt insulation attached
to the underside of the steel deck. Standard skylights are included at 2% of the total
roof area.
Exterior cladding: Exterior cladding consists of tilt-up concrete walls. Exterior
cladding system costs include paint to the exterior face of the tilt-up walls and roll-up
doors with shrouds and levelers for warehouse functions. The exterior wall is
uninsulated, and the interior face of the concrete is unfinished.
Interior construction: Interior construction includes construction of a single 2,000
square foot office suite, including a core containing the restroom.
Built-in equipment: Warehouse rack systems are excluded from the cost model.
Vertical circulation system: None.
Mechanical system: Mechanical systems consists of roof-mounted packaged units to
provide ventilation and minimal temperature control. Lighting is provided by high
bay high-intensity discharge lighting.
Sprinkler system: The building is fully sprinklered.
Figures C-10 through C-12 provide a summary of the cost data developed for the
retail building at each of the three design levels.

C-14 C: Cost Data GCR 14-917-26
Figure C-10 Warehouse building component cost summary for wind design (ASCE/SEI 7-05).
Gross Area: 401,500 SF
$/SF Total ($x1,000)
1. Foundations 3.05 1,224 2. Vertical Structure 5.39 2,165 3. Floor & Roof Structures 16.36 6,568 4. Exterior Cladding 2.36 948 5. Roofing, Waterproofing, Skylights 8.61 3,458
Shell (1-5) 35.77 14,363
6. Interior Partitions, Doors, Glazing 0.59 237 7. Floor, Wall, Ceiling Finishes 1.50 602
Interiors (6-7) 2.09 839
8. Function Equipment & Specialties 2.42 971 9. Stairs & Vertical Transportation 0.01 5
Equipment & Vertical Transportation (8-9) 2.43 976
10 Plumbing Systems 1.15 46211 Heating, Ventilating & Air Conditioning 5.00 2,00812 Electric Lighting, Power, Communications 6.00 2,40913 Fire Protection Systems 2.50 1,004
Mechanical & Electrical (10-13) 14.65 5,882
Total Building Construction (1-13) 54.94 22,060
14 Site Preparation & Demolition 0.00 015 Site Paving, Structures & Landscaping 0.00 016 Utilities on Site 0.00 0
Total Site Construction (14-16) 0.00 0
TOTAL BUILDING & SITE (1-16) 54.94 22,060
General Conditions 10.00% 5.49 2,206Contractor's Overhead & Profit or Fee 5.00% 3.02 1,213
PLANNED CONSTRUCTION COST October 2012 63.46 25,479
Contingency for Development of Design 0.00% 0.00 0Additional Special Inspections Not required \
RECOMMENDED BUDGET October 2012 63.46 25,479

GCR 14-917-26 C: Cost Data C-15
Figure C-11 Warehouse building component cost summary for current local seismic code design (1999 SBC).
Gross Area: 401,500 SF
$/SF Total ($x1,000)
1. Foundations 3.05 1,225 2. Vertical Structure 5.45 2,189 3. Floor & Roof Structures 16.46 6,607 4. Exterior Cladding 2.36 948 5. Roofing, Waterproofing, Skylights 8.65 3,473
Shell (1-5) 35.97 14,443
6. Interior Partitions, Doors, Glazing 0.59 237 7. Floor, Wall, Ceiling Finishes 1.50 602
Interiors (6-7) 2.09 839
8. Function Equipment & Specialties 2.42 971 9. Stairs & Vertical Transportation 0.01 5
Equipment & Vertical Transportation (8-9) 2.43 976
10. Plumbing Systems 1.15 462 11. Heating, Ventilating & Air Conditioning 5.00 2,008 12. Electric Lighting, Power, Communications 6.00 2,409 13. Fire Protection Systems 2.50 1,004
Mechanical & Electrical (10-13) 14.65 5,882
Total Building Construction (1-13) 55.14 22,140
14. Site Preparation & Demolition 0.00 0 15. Site Paving, Structures & Landscaping 0.00 0 16. Utilities on Site 0.00 0
Total Site Construction (14-16) 0.00 0
TOTAL BUILDING & SITE (1-16) 55.14 22,140
General Conditions 10.00% 5.51 2,214Contractor's Overhead & Profit or Fee 5.00% 3.03 1,218
PLANNED CONSTRUCTION COST October 2012 63.69 25,572
Contingency for Development of Design 0.00% 0.00 0Additional Special Inspections Not required
RECOMMENDED BUDGET October 2012 63.69 25,572

C-16 C: Cost Data GCR 14-917-26
Figure C-12 Warehouse building component cost summary for current national seismic code design (ASCE/SEI 7-10).
Gross Area: 401,500 SF
$/SF Total ($x1,000)
1. Foundations 3.11 1,247 2. Vertical Structure 5.79 2,325 3. Floor & Roof Structures 16.62 6,674 4. Exterior Cladding 2.36 948 5. Roofing, Waterproofing, Skylights 8.65 3,473
Shell (1-5) 36.53 14,668
6. Interior Partitions, Doors, Glazing 0.59 237 7. Floor, Wall, Ceiling Finishes 1.50 602
Interiors (6-7) 2.09 839
8. Function Equipment & Specialties 2.42 971 9. Stairs & Vertical Transportation 0.01 5
Equipment & Vertical Transportation (8-9) 2.43 976
10. Plumbing Systems 1.15 462 11. Heating, Ventilating & Air Conditioning 5.00 2,008 12. Electric Lighting, Power, Communications 6.00 2,409 13. Fire Protection Systems 2.50 1,004
Mechanical & Electrical (10-13) 14.65 5,882
Total Building Construction (1-13) 55.70 22,365
14. Site Preparation & Demolition 0.00 0 15. Site Paving, Structures & Landscaping 0.00 0 16. Utilities on Site 0.00 0
Total Site Construction (14-16) 0.00 0
TOTAL BUILDING & SITE (1-16) 55.70 22,365
General Conditions 10.00% 5.57 2,236Contractor's Overhead & Profit or Fee 5.00% 3.06 1,230
PLANNED CONSTRUCTION COST October 2012 64.34 25,831
Contingency for Development of Design 0.00% 0.00 0Additional Special Inspections Not required
RECOMMENDED BUDGET October 2012 64.34 25,831

GCR 14-917-26 C: Cost Data C-17
C.5 Hospital Building
Building size: The hospital building consists of six floors above grade and one
basement level with a footprint of approximately 150 feet by 180 feet. Each story is
approximately 14 feet tall.
Foundation system: The foundation system consists of reinforced concrete spread
footings. Slab on grade is five inch thick reinforced concrete for the wind design,
and six inch thick reinforced concrete for the seismic designs. Basement construction
includes mass excavation with native structural backfill at perimeter. Excavated
material is removed from site to disposal within 5 miles. Retaining walls consist of
12 inch thick reinforced concrete with waterproofing membrane. Shoring and
dewatering costs are excluded from the cost model.
Framing system: The framing system consists of wide-flanged steel framing, with
braced frames for the lateral force-resisting system. Elevated floor and roof
structures consist of steel deck with concrete fill on steel framing. All steel framing
is fireproofed.
Roof system: Roofing is a single-ply membrane on tapered rigid insulation over the
steel deck.
Exterior cladding: Exterior cladding is aluminum framed curtain wall with insulated
spandrel panels.
Interior construction: Interior construction includes full build out of hospital space,
configured primarily as in-patient beds, with limited diagnostic and treatment space.
Floors are generally covered in sheet vinyl. Interior finish is generally painted
gypsum board on metal stud framing with ceramic tile in the restrooms. Ceilings are
generally lay-in acoustic tile, with gypsum board in the restrooms.
Built-in equipment: Built-in equipment includes standard built-in hospital
equipment, such as patient headwall units, patient room cabinetry, nurse stations,
corridor wall guards, signage and directories, toilet partitions and accessories, and
exterior window treatments. Medical equipment and moveable furniture are
excluded.
Vertical circulation system: Vertical circulation consists of stairs and four patient
quality traction elevators.
Mechanical and plumbing system: The mechanical system includes central chillers,
cooling towers, boilers, chilled and heated water pumps and distribution, built-up air
handling units with capacity for 100% outside air, room exhaust, and control systems.
In addition to standard plumbing piping and fixtures, plumbing systems include
medical gas and deionized water distribution to patient rooms.

C-18 C: Cost Data GCR 14-917-26
Electrical system: Electrical systems include user convenience power, lighting,
telecommunications, nurse call, and alarm systems. Lighting is generally provided
by lay-in fluorescent fixtures.
Sprinkler system: The building is fully sprinklered.
Figures C-13 through C-15 provide a summary of the cost data developed for the
hospital building at each of the three design levels.
Figure C-13 Hospital building component cost summary for wind design (ASCE/SEI 7-05).
Gross Area: 189,000 SF
$/SF Total ($x1,000)
1. Foundations 4.94 933 2. Vertical Structure 6.34 1,199 3. Floor & Roof Structures 21.06 3,980 4. Exterior Cladding 34.54 6,528 5. Roofing, Waterproofing, Skylights 5.78 1,093
Shell (1-5) 72.66 13,733
6. Interior Partitions, Doors, Glazing 53.65 10,139 7. Floor, Wall, Ceiling Finishes 25.57 4,832
Interiors (6-7) 79.21 14,971
8. Function Equipment & Specialties 27.05 5,113 9. Stairs & Vertical Transportation 9.63 1,820
Equipment & Vertical Transportation (8-9) 36.68 6,933
10 Plumbing Systems 35.00 6,61511 Heating, Ventilating & Air Conditioning 40.00 7,56012 Electric Lighting, Power, Communications 45.00 8,50513 Fire Protection Systems 5.00 945
Mechanical & Electrical (10-13) 125.00 23,625
Total Building Construction (1-13) 313.56 59,262
14 Site Preparation & Demolition 0.00 015 Site Paving, Structures & Landscaping 0.00 016 Utilities on Site 0.00 0
Total Site Construction (14-16) 0.00 0
TOTAL BUILDING & SITE (1-16) 313.56 59,262
General Conditions 10.00% 31.35 5,926Contractor's Overhead & Profit or Fee 5.00% 17.24 3,259
PLANNED CONSTRUCTION COST October 2012 362.15 68,447
Contingency for Development of Design 10.00% 36.22 6,845Additional Special Inspections Not required \
RECOMMENDED BUDGET October 2012 398.37 75,292

GCR 14-917-26 C: Cost Data C-19
Figure C-14 Hospital building component cost summary for current local seismic code design (2003 IBC).
Gross Area: 189,000 SF
$/SF Total ($x1,000)
1. Foundations 5.03 951 2. Vertical Structure 10.21 1,930 3. Floor & Roof Structures 22.71 4,292 4. Exterior Cladding 34.54 6,528 5. Roofing, Waterproofing, Skylights 5.78 1,093
Shell (1-5) 78.28 14,794
6. Interior Partitions, Doors, Glazing 53.65 10,139 7. Floor, Wall, Ceiling Finishes 25.57 4,832
Interiors (6-7) 79.21 14,971
8. Function Equipment & Specialties 28.05 5,302 9. Stairs & Vertical Transportation 9.63 1,820
Equipment & Vertical Transportation (8-9) 37.68 7,122
10. Plumbing Systems 35.25 6,662 11. Heating, Ventilating & Air Conditioning 40.50 7,655 12. Electric Lighting, Power, Communications 45.30 8,562 13. Fire Protection Systems 5.05 954
Mechanical & Electrical (10-13) 126.10 23,833
Total Building Construction (1-13) 321.27 60,720
14. Site Preparation & Demolition 0.00 0 15. Site Paving, Structures & Landscaping 0.00 0 16. Utilities on Site 0.00 0
Total Site Construction (14-16) 0.00 0
TOTAL BUILDING & SITE (1-16) 321.27 60,720
General Conditions 10.00% 32.13 6,072Contractor's Overhead & Profit or Fee 5.00% 17.67 3,340
PLANNED CONSTRUCTION COST October 2012 371.07 70,132
Contingency for Development of Design 10.00% 37.11 7,013Additional Special Inspections 10
RECOMMENDED BUDGET October 2012 408.23 77,155

C-20 C: Cost Data GCR 14-917-26
Figure C-15 Hospital building component cost summary for current national seismic code design (ASCE/SEI 7-10).
Gross Area: 189,000 SF
$/SF Total ($x1,000)
1. Foundations 5.00 946 2. Vertical Structure 10.15 1,919 3. Floor & Roof Structures 22.71 4,292 4. Exterior Cladding 34.54 6,528 5. Roofing, Waterproofing, Skylights 5.78 1,093
Shell (1-5) 78.19 14,777
6. Interior Partitions, Doors, Glazing 53.65 10,139 7. Floor, Wall, Ceiling Finishes 25.57 4,832
Interiors (6-7) 79.21 14,971
8. Function Equipment & Specialties 28.05 5,302 9. Stairs & Vertical Transportation 9.63 1,820
Equipment & Vertical Transportation (8-9) 37.68 7,122
10. Plumbing Systems 35.25 6,662 11. Heating, Ventilating & Air Conditioning 40.50 7,655 12. Electric Lighting, Power, Communications 45.30 8,562 13. Fire Protection Systems 5.05 954
Mechanical & Electrical (10-13) 126.10 23,833
Total Building Construction (1-13) 321.18 60,703
14. Site Preparation & Demolition 0.00 0 15. Site Paving, Structures & Landscaping 0.00 0 16. Utilities on Site 0.00 0
Total Site Construction (14-16) 0.00 0
TOTAL BUILDING & SITE (1-16) 321.18 60,703
General Conditions 10.00% 32.12 6,070Contractor's Overhead & Profit or Fee 5.00% 17.67 3,339
PLANNED CONSTRUCTION COST October 2012 370.96 70,112
Contingency for Development of Design 10.00% 37.10 7,011Additional Special Inspections 15
RECOMMENDED BUDGET October 2012 408.14 77,138

GCR 14-917-26 C: Cost Data C-21
C.6 School Building
Building size: The school building has one two-story wing with a footprint of 81 feet
by 230 feet and a one-story wing with a footprint of 119 feet by 127 feet. Each story
is approximately 13 feet tall.
Foundation system: The foundation system consists of reinforced concrete spread
footings. Slab on grade is four inch thick reinforced concrete.
Framing system: The structural framing system consists of concrete masonry units
(CMU) with grouting and reinforcing as identified in the structural design section,
and limited tube steel framing. Elevated floor structure is steel deck with concrete
fill on steel open web joists.
Roof system: The roof system consists of steel deck with no fill on steel open web
joists. Steel framing is not fireproofed. Roofing consists of a single-ply membrane
on tapered rigid insulation over the steel deck.
Exterior cladding: Exterior cladding consists of four inch thick brick veneer and
four inch cavity with two inch rigid insulation over the CMU wall. Windows are
aluminum framed and insulated.
Interior construction: Interior construction includes construction of nonstructural
gypsum board partitions, interior doors, and finishes typical of school construction.
Floors are generally vinyl composition tile with wood flooring in the gymnasium and
ceramic tile in restrooms and the kitchen. The interior finish is paint to the exposed
CMU wall. Walls are ceramic tile in the restrooms and kitchen. Ceilings are
generally gypsum board applied to the underside of structure.
Built-in equipment: Built-in equipment includes classroom marker boards and
cabinetry, kitchen and food service equipment, built-in folding cafeteria tables and
benches, signage, window blinds, and other typical built-in equipment. Stage
equipment is excluded. Moveable equipment, such as projectors and computers, is
excluded.
Vertical circulation system: The vertical circulation system includes stairs and a
single hydraulic elevator.
Mechanical system: Mechanical systems are zoned roof-mounted packaged units to
provide ventilation and temperature control by space.
Electrical system: Electrical systems include user convenience power, lighting,
telecommunications, and alarm systems. Lighting is generally surface-mounted
fluorescent fixtures, with high bay lighting in the gymnasium.
Sprinkler system: The building is fully sprinklered.

C-22 C: Cost Data GCR 14-917-26
Figures C-16 through C-18 provide a summary of the cost data developed for the
school building at each of the three design levels.
Figure C-16 School building component cost summary for wind design (ASCE/SEI 7-05).
Gross Area: 51,266 SF
$/SF Total ($x1,000)
1. Foundations 5.89 302 2. Vertical Structure 13.46 690 3. Floor & Roof Structures 17.38 891 4. Exterior Cladding 15.64 802 5. Roofing, Waterproofing, Skylights 9.95 510
Shell (1-5) 62.33 3,195
6. Interior Partitions, Doors, Glazing 5.05 259 7. Floor, Wall, Ceiling Finishes 9.83 504
Interiors (6-7) 14.89 763
8. Function Equipment & Specialties 12.75 654 9. Stairs & Vertical Transportation 1.54 79
Equipment & Vertical Transportation (8-9) 14.30 733
10 Plumbing Systems 3.85 19811 Heating, Ventilating & Air Conditioning 18.00 92312 Electric Lighting, Power, Communications 22.00 1,12813 Fire Protection Systems 2.50 128
Mechanical & Electrical (10-13) 46.35 2,376
Total Building Construction (1-13) 137.86 7,068
14 Site Preparation & Demolition 0.00 015 Site Paving, Structures & Landscaping 0.00 016 Utilities on Site 0.00 0
Total Site Construction (14-16) 0.00 0
TOTAL BUILDING & SITE (1-16) 137.86 7,068
General Conditions 10.00% 13.79 707Contractor's Overhead & Profit or Fee 5.00% 7.59 389
PLANNED CONSTRUCTION COST October 2012 159.24 8,164
Contingency for Development of Design 10.00% 15.92 816Escalation is excluded 0.00% 0.00 0 \
RECOMMENDED BUDGET October 2012 175.16 8,980

GCR 14-917-26 C: Cost Data C-23
Figure C-17 School building component cost summary for current local seismic code design (1999 SBC).
Gross Area: 51,266 SF
$/SF Total ($x1,000)
1. Foundations 5.89 302 2. Vertical Structure 14.05 720 3. Floor & Roof Structures 17.92 919 4. Exterior Cladding 15.64 802 5. Roofing, Waterproofing, Skylights 9.95 510
Shell (1-5) 63.46 3,253
6. Interior Partitions, Doors, Glazing 5.08 260 7. Floor, Wall, Ceiling Finishes 9.83 504
Interiors (6-7) 14.91 765
8. Function Equipment & Specialties 12.75 654 9. Stairs & Vertical Transportation 1.54 79
Equipment & Vertical Transportation (8-9) 14.30 733
10. Plumbing Systems 3.85 198 11. Heating, Ventilating & Air Conditioning 18.10 928 12. Electric Lighting, Power, Communications 22.10 1,133 13. Fire Protection Systems 2.55 131
Mechanical & Electrical (10-13) 46.60 2,389
Total Building Construction (1-13) 139.27 7,140
14. Site Preparation & Demolition 0.00 0 15. Site Paving, Structures & Landscaping 0.00 0 16. Utilities on Site 0.00 0
Total Site Construction (14-16) 0.00 0
TOTAL BUILDING & SITE (1-16) 139.27 7,140
General Conditions 10.00% 13.93 714Contractor's Overhead & Profit or Fee 5.00% 7.67 393
PLANNED CONSTRUCTION COST October 2012 160.86 8,247
Contingency for Development of Design 10.00% 16.09 825Escalation is excluded 0.00% 0.00 0
RECOMMENDED BUDGET October 2012 176.95 9,072

C-24 C: Cost Data GCR 14-917-26
Figure C-18 School building component cost summary for current national seismic code design
(ASCE/SEI 7-10).
Gross Area: 51,266 SF
$/SF Total ($x1,000)
1. Foundations 5.89 302 2. Vertical Structure 14.05 720 3. Floor & Roof Structures 18.42 944 4. Exterior Cladding 15.64 802 5. Roofing, Waterproofing, Skylights 9.95 510
Shell (1-5) 63.95 3,278
6. Interior Partitions, Doors, Glazing 5.08 260 7. Floor, Wall, Ceiling Finishes 9.83 504
Interiors (6-7) 14.91 765
8. Function Equipment & Specialties 12.75 654 9. Stairs & Vertical Transportation 1.54 79
Equipment & Vertical Transportation (8-9) 14.30 733
10. Plumbing Systems 3.85 198 11. Heating, Ventilating & Air Conditioning 18.10 928 12. Electric Lighting, Power, Communications 22.10 1,133 13. Fire Protection Systems 2.55 131
Mechanical & Electrical (10-13) 46.60 2,389
Total Building Construction (1-13) 139.76 7,165
14. Site Preparation & Demolition 0.00 0 15. Site Paving, Structures & Landscaping 0.00 0 16. Utilities on Site 0.00 0
Total Site Construction (14-16) 0.00 0
TOTAL BUILDING & SITE (1-16) 139.76 7,165
General Conditions 10.00% 13.99 717Contractor's Overhead & Profit or Fee 5.00% 7.69 394
PLANNED CONSTRUCTION COST October 2012 161.43 8,276
Contingency for Development of Design 10.00% 16.15 828Escalation is excluded 0.00% 0.00 0
RECOMMENDED BUDGET October 2012 177.59 9,104
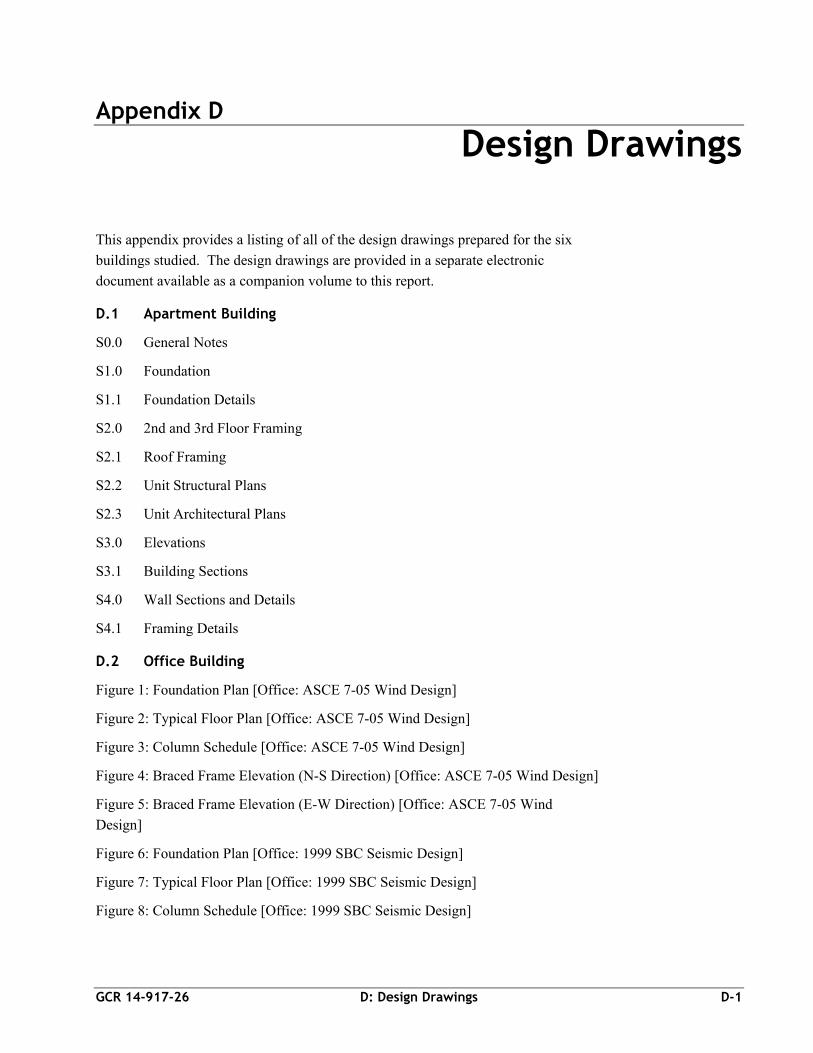
GCR 14-917-26 D: Design Drawings D-1
Appendix D
Design Drawings
This appendix provides a listing of all of the design drawings prepared for the six
buildings studied. The design drawings are provided in a separate electronic
document available as a companion volume to this report.
D.1 Apartment Building
S0.0 General Notes
S1.0 Foundation
S1.1 Foundation Details
S2.0 2nd and 3rd Floor Framing
S2.1 Roof Framing
S2.2 Unit Structural Plans
S2.3 Unit Architectural Plans
S3.0 Elevations
S3.1 Building Sections
S4.0 Wall Sections and Details
S4.1 Framing Details
D.2 Office Building
Figure 1: Foundation Plan [Office: ASCE 7-05 Wind Design]
Figure 2: Typical Floor Plan [Office: ASCE 7-05 Wind Design]
Figure 3: Column Schedule [Office: ASCE 7-05 Wind Design]
Figure 4: Braced Frame Elevation (N-S Direction) [Office: ASCE 7-05 Wind Design]
Figure 5: Braced Frame Elevation (E-W Direction) [Office: ASCE 7-05 Wind
Design]
Figure 6: Foundation Plan [Office: 1999 SBC Seismic Design]
Figure 7: Typical Floor Plan [Office: 1999 SBC Seismic Design]
Figure 8: Column Schedule [Office: 1999 SBC Seismic Design]

D-2 D: Design Drawings GCR 14-917-26
Figure 9: Braced Frame Elevation (N-S Direction) [Office: 1999 SBC Seismic
Design]
Figure 10: Braced Frame Elevation (E-W Direction) [Office: 1999 SBC Seismic
Design]
Figure 11: Foundation Plan [Office: ASCE 7-10 Seismic Design]
Figure 12: Typical Floor Plan [Office: ASCE 7-10 Seismic Design]
Figure 13: Column Schedule [Office: ASCE 7-10 Seismic Design]
Figure 14: Braced Frame Elevation (N-S Direction) [Office: ASCE 7-10 Seismic
Design]
Figure 15: Braced Frame Elevation (E-W Direction) [Office: ASCE 7-10 Seismic
Design]
Figure 16: Brace Connection Detail [Office: 1999 SBC Seismic Design]
Figure 17: Brace Connection Detail [Office: ASCE 7-10 Seismic Design]
Figure 18: Typical Beam Connections all Designs
Figure 19: Typical Collector Beam Moment Connection Detail
D.3 Retail Building
S1.1 General Notes
S.1.2 General Notes
S.1.3 Typical Details
S.1.4 Typical Details
S.2.1 Foundation Plan
S.2.2 Roof Framing Plan
S.4.1 Panel Elevations
S.4.2 Panel Elevations & Sections
S.4.3 Panel Reinforcing Elevations
S.4.4 Panel Details
S.5.1 Details
S.5.2 Details
D.4 Warehouse Building
S1.1 General Notes
S.1.2 General Notes

GCR 14-917-26 D: Design Drawings D-3
S.1.3 Typical Details
S.2.1 Foundation Plan
S.2.2 Roof Framing Plan
S.4.1 Panel Elevations
S.4.2 Panel Elevations
S.4.3 Panel Reinforcing Elevations
S.4.4 Panel Reinforcing Elevations
S.4.5 Panel Details
S.4.6 Braced Frame Elevations & Details
S.4.7 Braced Frame Details
S.5.1 Details
S.5.2 Details
S.5.3 Details
D.5 Hospital Building
Figure 1: Foundation Plan [Hospital: ASCE 7-05 Wind Design]
Figure 2: Typical Floor Plan [Hospital: ASCE 7-05 Wind Design]
Figure 3: Column Schedule [Hospital: ASCE 7-05 Wind Design]
Figure 4: Braced Frame Elevation Lines 3, 4, E & D [Hospital: ASCE 7-05 Wind
Design]
Figure 5: Foundation Plan [Hospital: IBC 2003 (ASCE 7-02) Seismic Design]
Figure 6: Typical Floor Plan [Hospital: IBC 2003 (ASCE 7-02) Seismic Design]
Figure 7: Column Schedule [Hospital: IBC 2003 (ASCE 7-02) Seismic Design]
Figure 8: Braced Frame Elevation [Hospital: IBC 2003 (ASCE 7-02) Seismic
Design]
Figure 9: Foundation Plan [Hospital: ASCE 7-10 Seismic Design]
Figure 10: Typical Floor Plan [Hospital: ASCE 7-10 Seismic Design]
Figure 11: Column Schedule [Hospital: ASCE 7-10 Seismic Design]
Figure 12: Braced Frame Elevation [Hospital: ASCE 7-10 Seismic Design]
Figure 13: BRBF Connection Detail
Figure 14: Collector Beam Connection Detail

D-4 D: Design Drawings GCR 14-917-26
Figure 15: Typical Beam Connections all Designs
Figure 16: BRB Connection at Foundation
D.6 School Building
S0.1 General Notes
S0.2 General Notes
S1 Foundation Plan
S2 Foundation Plan
S3 Foundation Plan
S4 Low Roof Plan
S5 2nd Floor Plan
S6 2nd Floor Plan
S7 Roof Plan
S8 Roof Plan
S9 Roof Plan
S10 Elevations
S11 Elevations
S12 Elevations
S13 Wall Reinforcement and Details
S14 Wall Connection Details
GCR 14-917-26 E: Quantitative Benefits Analysis E-1
Appendix E
Quantitative Benefits Analysis
In this study, benefits are assessed in terms of the relative performance of the three
levels of design for each building. In general, this assessment is performed on a
qualitative basis for each building. The publication of FEMA P-58-1, Seismic
Performance Assessment of Buildings Volume 1 – Methodology (FEMA, 2012a),
however, introduces a new opportunity to assess the performance of individual
buildings on a quantitative, probabilistic basis. As a result, buildings in this study
that fit within the range of applicability of the FEMA P-58-1 methodology have also
been assessed on a quantitative basis. These buildings include the apartment
building, office building, and hospital.
This appendix explains the basis of the FEMA P-58-1 methodology and its companion
products, presents the building-specific information used as inputs to the methodology,
and summarizes results from a quantitative performance assessment of the selected
buildings. Results are presented as annualized values of loss (i.e., the average value of
loss, per year, over a period of years), and relative performance is measured by ratio of
annualized values of loss in terms of repair costs, fatalities, injuries, and probabilities of
collapse among the different designs.
E.1 Quantitative Performance Assessment Using FEMA P-58
In the FEMA P-58-1 methodology, performance is expressed as potential future
losses (i.e., consequences) due to earthquake shaking, measured in terms of repair
costs, repair time, casualties, and unsafe post-earthquake inspection placarding. Use
of this methodology requires quantitative knowledge about the building and its
unique site, structural, nonstructural, and occupancy characteristics. Basic
information necessary for implementation includes: (1) the ground shaking hazard at
the site in the form of a hazard curve; (2) the predicted response of the structure to
ground shaking; (3) the assessed building vulnerability to collapse in terms of a
collapse fragility; (4) an inventory of damageable components and systems in the
building (both structural and nonstructural) and the likely costs to repair damage; and
(5) the population that occupies the building over time. This information must be
characterized by both expected values and uncertainties (or total dispersion) in these
values.
Computations are made using an electronic Performance Assessment Calculation
Tool (PACT), provided in FEMA P-58-3, Seismic Performance Assessment of
Buildings, Methodology and Implementation, Volume 3 – Supporting Electronic

E-2 E: Quantitative Benefits Analysis GCR 14-917-26
Materials and Background Documentation (FEMA, 2012c). PACT includes a
database of fragility and consequence data for selected structural systems and
components, and performs extensive Monte Carlo simulations to arrive at a
probabilistic estimate of future performance in terms of likely values of repair costs,
repair time, casualties, and unsafe post-earthquake inspection placarding.
Fragility and consequence data currently available within PACT cover only some of
the structural and nonstructural systems that are present in the buildings selected for
this study. Such information remains under development for other buildings and
systems at this time. The FEMA P-58 methodology is general enough to accept user-
specified descriptions of fragility and consequence for other structural and
nonstructural systems and components, but development of this type of information
can be difficult and costly, and was beyond the scope of this study. As a result, only
three of the six case study buildings fit within the current range of applicability of the
FEMA P-58 methodology, and only the apartment building, the office building, and
the hospital were assessed using this approach.
The FEMA P-58 methodology can be used to perform three types of assessment:
Intensity-based assessment, which evaluates the probable performance of a
building subjected to a ground motion of a specified intensity.
Scenario-based assessment, which evaluates the probable performance of a
building subjected to a specified magnitude earthquake at a specified location
relative to the building site.
Time-based assessment, which evaluates the probable performance of a building
over a specified period of time, considering all earthquakes that could occur
within that period of time.
Time-based assessments consider uncertainty in the magnitude and location of future
earthquakes, as well as the intensity of motion resulting from these earthquakes, and
are, therefore, most appropriate when considering relative benefits between design
criteria that are applied to a population of buildings. Results can be expressed in
terms of the annual probability that a specified value of loss will be exceeded within
a year, or in terms of the average annual value of loss, per year, over a period of years
(i.e., annualized losses).
In this study, time-based assessments were used, and results are presented in terms of
annualized values of the following loss quantities: repair costs, casualties (fatalities
and injuries), and probability of collapse. Although the methodology will also
calculate losses associated with annualized repair time and probability of unsafe
placarding, these results are not reported here. No attempt has been made to combine
casualty losses with economic losses, nor has any attempt been made to assess

GCR 14-917-26 E: Quantitative Benefits Analysis E-3
indirect costs associated with building downtime (repair time) following an
earthquake.
E.2 Quantitative Assessment of the Apartment Building
The potential seismic performance of the apartment building at each design level was
assessed using the FEMA P-58 methodology and the companion PACT.
Development of apartment building information used as input to PACT is described
in the sections that follow.
Overall, the wind and current local seismic code designs for the apartment building
are very similar (except for seismic bracing and anchorage of certain nonstructural
components required in the current local seismic code design). Because the lateral
force-resisting systems are essentially the same, one quantitative assessment was
used to determine the expected performance of both designs, and the annualized
losses for the wind design were taken as equivalent to the losses for the current local
seismic code design. This assumption under predicts annualized losses for the wind
design because actual losses would be somewhat higher due to the presence of
unbraced nonstructural components. The use of lower predicted values of loss for the
wind design is conservative when making comparisons of relative performance using
wind design losses as a basis.
E.2.1 Hazard Curve
Earthquake shaking hazard in FEMA P-58-1 is characterized as spectral response
acceleration at a given period of structural vibration. Time-based assessments
require a hazard curve, which defines how the intensity of hazard varies with the
annual frequency of exceedance. Because period depends on the mass and stiffness
of a structure, it can be different for each design of a building, and each design can
have a different hazard curve.
Data to construct a hazard curve for each design were obtained from the U.S.
Geological Survey (USGS) Hazard Curve Application, available at http://geohazards
.usgs.gov/hazardtool/, for the latitude and longitude of the site and location of the
apartment building. Data are only provided for site class B in the Tennessee region
(in some West Coast areas, the tool will provide data directly for other site classes).
The website provides hazard curves for peak ground acceleration and for spectral
response accelerations at periods of 0.1, 0.2, 0.3, 0.5, 1.0 and 2.0 seconds.
The periods provided by USGS are not exactly the same as the apartment building
designs being studied, so it was necessary to interpolate between curves obtained
from the website. Once a curve for the correct period was obtained, it was then
adjusted for site class amplification using appropriate interpolated values of site

E-4 E: Quantitative Benefits Analysis GCR 14-917-26
coefficients, Fa or Fv, from Table 11.4-1 and Table 11.4-2 of ASCE/SEI 7-10,
Minimum Design Loads for Buildings and Other Structures (ASCE, 2010).
It should be noted that site class amplification factors in ASCE/SEI 7-10 vary with
amplitude of acceleration in the period range between 0.3 and 1.0 second. It is not
clear whether Fa or Fv is the most appropriate amplifier, because the difference in
period between alternative designs of the same building might push the period from
one range into another. In this study, because a comparison between the designs was
the objective, all values were amplified by Fa to remove the effect of site
amplification from the results.
Once adjusted, the data were plotted with annual frequency of exceedance (in log
scale) on the vertical axis, and acceleration on the horizontal axis (in linear scale).
Following the recommendations in FEMA P-58-2, Seismic Performance Assessment
of Buildings, Volume 2 – Implementation Guide (FEMA, 2012b), a range was defined
by a minimum spectral acceleration set at 0.05g (or 0.05/T for a structure with a
period exceeding 1.0 second), and a maximum spectral acceleration set at the smaller
of:
twice the spectral acceleration corresponding to a mean annual frequency of
exceedance equal to 0.0004 (2,500 year mean return interval), or
twice the median predicted spectral acceleration at collapse.
The hazard curve was then divided into eight segments (i.e., intensity levels) and the
average acceleration for each segment was tabulated along with the annual frequency
of exceedance for the segment. Figure E-1 shows the hazard curve for the apartment
building design with a fundamental period of 0.39 seconds.
In order to generate a single hazard curve for the design of a building with differing
responses in each orthogonal direction, the average of the fundamental periods in the
longitudinal and transverse directions was used, in accordance with FEMA P-58-2.
E.2.2 Characterization of Structural Response
In FEMA P-58-1, response quantities that are used to characterize the behavior of a
structure subjected to ground shaking include drift (or drift ratio) in each story, and
the accelerations and velocities at each floor level, for ground motions scaled to each
of the intensity levels identified on the hazard curve. Also needed is the spectral
acceleration at which collapse is expected to occur.
PACT is configured to accept response quantities that are generated from any type of
structural analysis. FEMA P-58-1 provides guidance on the use of nonlinear
response history analyses and simplified analyses based on a linear static approach.
In general, the simplified analysis procedure was used for the buildings in this study.

GCR 14-917-26 E: Quantitative Benefits Analysis E-5
Figure E-1 Seismic hazard curve for the apartment building with a fundamental period of 0.39 seconds.
In the case of the apartment building, a nonlinear static analysis was used to better
quantify the response of system considering the various sheathing materials that are
present on the walls in the building.
The wood-framed walls of the apartment building are covered with oriented strand
board (OSB) structural wood panels, gypsum wallboard (GWB), and stucco. The
lateral design only considers one type of sheathing on any given wall, and the
ASCE/SEI 7-10 design only considers walls with OSB sheathing. Because the
design analyses ignore many wall elements that provide a real contribution to lateral
resistance, they are not suitable for developing more realistic structural response
quantities (e.g., period, drift, acceleration, and collapse capacity) required for
quantitative assessment using PACT.
The FEMA P-807 report, Seismic Evaluation and Retrofit of Multi-Unit Wood-Frame
Buildings with Weak First Stories (FEMA, 2012d), and ASCE/SEI 41-06, Seismic
Rehabilitation of Existing Buildings (ASCE, 2007), provide information that can be
used to develop a more realistic estimate of the lateral strength and stiffness of the
walls in the apartment building explicitly considering the nonlinear performance of
various materials. FEMA P-807 provides tables and plots of base shear force versus
drift ratio for shear walls with different sheathing, as shown in Figure E-2 and Figure
E-3, and methods to combine different structural and nonstructural materials on the
walls. For walls with combinations of sheathing materials, FEMA P-807
0.000001
0.00001
0.0001
0.001
0.01
0.1
1
0 0.25 0.5 0.75 1 1.25 1.5 1.75 2
Annual Frequency of Exceedan
ce, λ
Spectral Acceleration, Sa
Hazard Curve
Sa for T=0.39s
Sa(0.39) for input
PGA (Sa for T=0)
PGA for input
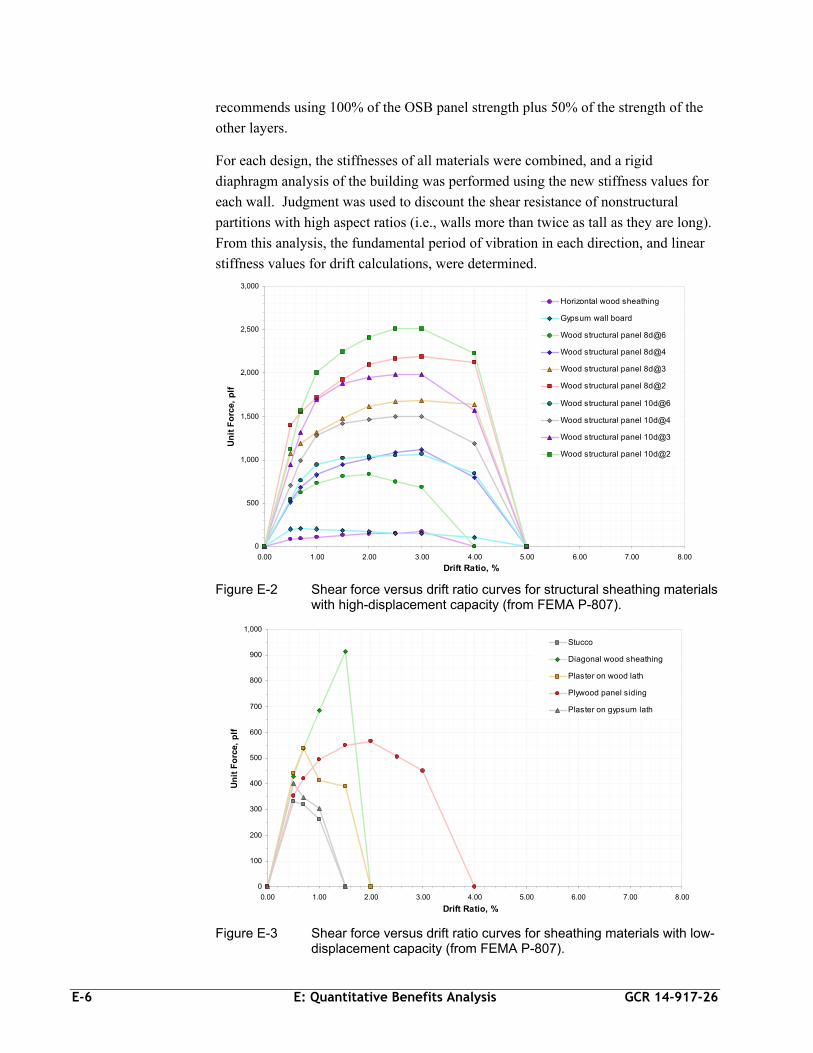
E-6 E: Quantitative Benefits Analysis GCR 14-917-26
recommends using 100% of the OSB panel strength plus 50% of the strength of the
other layers.
For each design, the stiffnesses of all materials were combined, and a rigid
diaphragm analysis of the building was performed using the new stiffness values for
each wall. Judgment was used to discount the shear resistance of nonstructural
partitions with high aspect ratios (i.e., walls more than twice as tall as they are long).
From this analysis, the fundamental period of vibration in each direction, and linear
stiffness values for drift calculations, were determined.
Figure E-2 Shear force versus drift ratio curves for structural sheathing materials
with high-displacement capacity (from FEMA P-807).
Figure E-3 Shear force versus drift ratio curves for sheathing materials with low-
displacement capacity (from FEMA P-807).
0
500
1,000
1,500
2,000
2,500
3,000
0.00 1.00 2.00 3.00 4.00 5.00 6.00 7.00 8.00
Drift Ratio, %
Un
it F
orc
e, p
lf
Horizontal wood sheathing
Gypsum wall board
Wood structural panel 8d@6
Wood structural panel 8d@4
Wood structural panel 8d@3
Wood structural panel 8d@2
Wood structural panel 10d@6
Wood structural panel 10d@4
Wood structural panel 10d@3
Wood structural panel 10d@2
0
100
200
300
400
500
600
700
800
900
1,000
0.00 1.00 2.00 3.00 4.00 5.00 6.00 7.00 8.00
Drift Ratio, %
Un
it F
orc
e, p
lf
Stucco
Diagonal wood sheathing
Plaster on wood lath
Plywood panel siding
Plaster on gypsum lath

GCR 14-917-26 E: Quantitative Benefits Analysis E-7
For the wind design and the current local seismic code design, there was no
difference in the structural system in the transverse (north-south) direction. In the
longitudinal direction, a 1% difference in strength was observed. This difference was
deemed to be insignificant, and the same base shear force versus drift ratio curves
were used for both the wind design and the current local seismic code design.
Using the stiffness and associated mass values for each story, elastic lateral drifts
were computed and fundamental periods of the building were determined from a
Rayleigh analysis. The fundamental periods for the building designed for wind
loading is shown on the second column of Table E-1 and the periods for buildings
designed for seismic codes are shown in the third and fourth columns of Table E-1.
Note these values are higher than the code-based approximate period, Ta, calculated
as 0.02(h)0.75 = 0.28 seconds, where h is the height of the building.
Table E-1 Fundamental Periods of the Apartment Building Used for Performance Assessment
Wind Design
Current Local Seismic Code
Current National Seismic Code
North-South Direction 0.41s 0.41s 0.38s
East-West Direction 0.43s 0.43s 0.40s
Average 0.42s 0.42s 0.39s
PACT input includes story drifts for each story, and velocities and accelerations at
each floor, at each of the eight intensity levels. These values can be obtained from
nonlinear response history analysis directly, or estimated from linear analysis with
corrections for inelastic behavior and higher mode effects. FEMA P-58-1 equations
were used to correct linear elastic response quantities to nonlinear response quantities
for input into PACT.
E.2.3 Collapse Fragility
Building collapse is the principle cause of casualties in earthquakes. In order to
assess potential casualty losses, a collapse fragility is needed to define the probability
of incurring collapse as a function of ground motion intensity. A collapse fragility is
characterized by the median spectral acceleration, and associated dispersion, at which
collapse of the building is expected to occur.
FEMA P-58-1 provides several alternative methods of establishing the collapse
fragility of a building. Because of the participation of many different sheathing
materials in the lateral resistance of the apartment building, a nonlinear static
pushover analysis was conducted to determine the force-displacement behavior of the
building. Results from a static pushover can be used to determine collapse capacity

E-8 E: Quantitative Benefits Analysis GCR 14-917-26
in the Static Pushover to Incremental Dynamic Analysis (SPO2IDA) tool
(Vamvatsikos and Cornell, 2006).
Static pushover curves (i.e., base shear force versus drift ratio) were constructed for
the apartment building designs in each direction using FEMA P-807 data. In wood-
framed construction, shear resistance in the first story dominates the post-yield
behavior, so the first story was used to determine the pushover capacity in each
design. Trilinear shear force versus drift ratio curves were used to approximate the
static pushover curves based on an effective yield point, a point of maximum
resistance, and a point of degraded strength, determined as follows:
The effective yield point was restricted to occur on the extension of the initial
stiffness line, consistent with the fundamental period of vibration.
The maximum shear resistance was taken as equal to the peak of the pushover
curve.
The point of degraded strength was taken as the value on the pushover curve at a
drift ratio of 4%.
The yield force and the drift at maximum resistance were unconstrained, and
values were selected to visually provide a best fit to the pushover curve (with a
slight error on the side of less energy dissipation to be conservative).
Coordinates for effective yield, maximum shear resistance, and degraded strength are
provided in Table E-2. Pushover curves and approximate trilinear curves are shown
in Figures E-4 through E-7.
Table E-2 Coordinates of Static Pushover Curves for the Apartment Building
Wind and Current Local Seismic Code Designs
Current National Seismic Code Design
Drift Shear (kips) Drift Shear (kips)
Shear Yield
North-South Dir. 0.27% 490 0.33% 770
East-West Dir. 0.28% 475 0.31% 630
Maximum Shear
North-South Dir. 1.2% 553 2.5% 856
East-West Dir. 1.4% 532 2.6% 697
Degraded Shear
North-South Dir. 4% 250 4% 614
East-West Dir. 4% 176 4% 330

GCR 14-917-26 E: Quantitative Benefits Analysis E-9
Figure E-4 Pushover curve and trilinear approximation for the apartment building wind and current local seismic code design, north-south direction.
Figure E-5 Pushover curve and trilinear approximation for the apartment building wind and current local seismic code design, east-west direction.
0
490
553
250
0
100
200
300
400
500
600
0 0.5 1 1.5 2 2.5 3 3.5 4 4.5
Base Shear, kips
Interstory Drift Ratio, %
Pushover Analysis, North‐South Direction 1999 SBC Seismic Design
GWB
OSB + Stucco + GWB
Total
Trilinear
475
532
176
0
100
200
300
400
500
600
0 0.5 1 1.5 2 2.5 3 3.5 4 4.5
Base Shear, kips
Interstory Drift Ratio, %
Pushover Analysis, East‐West Direction for 1999 SBC Seismic Design
OSB + Stucco + GWB
Total
Trilinear

E-10 E: Quantitative Benefits Analysis GCR 14-917-26
Figure E-6 Pushover curve and trilinear approximation for the apartment building current national seismic code design, north-south direction.
Figure E-7 Pushover curve and trilinear approximation for the apartment building current national seismic code design, east-west direction.
0
770 856
614
0
100
200
300
400
500
600
700
800
900
0 0.5 1 1.5 2 2.5 3 3.5 4 4.5
Base Shear, kips
Interstory Drift Ratio, %
Pushover Analysis, North‐South Direction ASCE/SEI 7‐10 Seismic Design
Total
Trilinear
630
697
330
399
0
100
200
300
400
500
600
700
800
0 0.5 1 1.5 2 2.5 3 3.5 4 4.5
Base Shear, kips
Interstory Drift Ratio, %
Pushever Analysis, East‐West Direction ASCE/SEI 7‐10 Seismic Design
Total
Trilinear
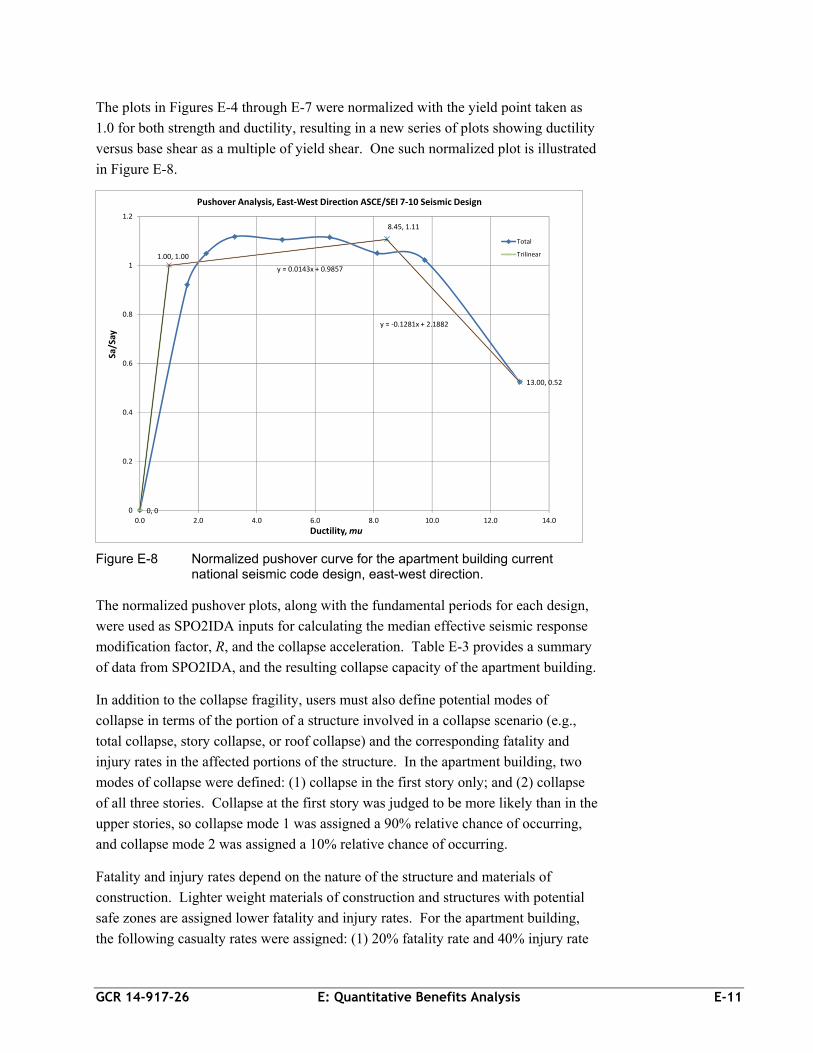
GCR 14-917-26 E: Quantitative Benefits Analysis E-11
The plots in Figures E-4 through E-7 were normalized with the yield point taken as
1.0 for both strength and ductility, resulting in a new series of plots showing ductility
versus base shear as a multiple of yield shear. One such normalized plot is illustrated
in Figure E-8.
Figure E-8 Normalized pushover curve for the apartment building current national seismic code design, east-west direction.
The normalized pushover plots, along with the fundamental periods for each design,
were used as SPO2IDA inputs for calculating the median effective seismic response
modification factor, R, and the collapse acceleration. Table E-3 provides a summary
of data from SPO2IDA, and the resulting collapse capacity of the apartment building.
In addition to the collapse fragility, users must also define potential modes of
collapse in terms of the portion of a structure involved in a collapse scenario (e.g.,
total collapse, story collapse, or roof collapse) and the corresponding fatality and
injury rates in the affected portions of the structure. In the apartment building, two
modes of collapse were defined: (1) collapse in the first story only; and (2) collapse
of all three stories. Collapse at the first story was judged to be more likely than in the
upper stories, so collapse mode 1 was assigned a 90% relative chance of occurring,
and collapse mode 2 was assigned a 10% relative chance of occurring.
Fatality and injury rates depend on the nature of the structure and materials of
construction. Lighter weight materials of construction and structures with potential
safe zones are assigned lower fatality and injury rates. For the apartment building,
the following casualty rates were assigned: (1) 20% fatality rate and 40% injury rate
0, 0
1.00, 1.00
8.45, 1.11
13.00, 0.52
y = 0.0143x + 0.9857
y = ‐0.1281x + 2.1882
0
0.2
0.4
0.6
0.8
1
1.2
0.0 2.0 4.0 6.0 8.0 10.0 12.0 14.0
Sa/Say
Ductility, mu
Pushover Analysis, East‐West Direction ASCE/SEI 7‐10 Seismic Design
Total
Trilinear

E-12 E: Quantitative Benefits Analysis GCR 14-917-26
in the collapsed story (or stories); and (2) 5% fatality rate and 10% injury rate in the
stories that do not collapse. Predictions of fatalities and injuries were assigned a
coefficient of variation (COV) of 0.6. These values were selected based on the
experience and judgment of the building designers, and are conservative relative to
information on wood frame construction collected and summarized in FEMA P-58
Background Document 3.7.8, Casualty Consequence Function and Building
Population Model Development provided in FEMA P-58-3, Seismic Performance
Assessment of Buildings, Methodology and Implementation, Volume 3 – Supporting
Electronic Materials and Background Documentation (FEMA, 2012c).
Table E-3 SPO2IDA Results and Collapse Capacities for the Apartment Building Designs
Wind and Current Local Seismic Code Designs
Current National Seismic Code Design
R factor
North-South Dir. 6.14 6.11
East-West Dir. 5.94 6.15
Yield Acceleration(1)
North-South Dir. 0.259g 0.407g
East-West Dir. 0.251g 0.333g
Collapse Acceleration(2)
North-South Dir. 1.59g 2.49g
East-West Dir. 1.49g 2.05g
Notes: (1) Yield acceleration is the base shear (in kips) at yield of the first story, divided by the building weight (in kips).
(2) Median collapse acceleration is the median R times the yield acceleration.
In addition to collapse, residual drifts can also render a structure unusable following
an earthquake. To assess potential losses resulting from residual drift, FEMA P-58-1
estimates residual drift based on the computed transient inelastic drifts. The default
threshold for residual drift is set at 1%. This default value was modified to 4% (with
a COV of 0.3) for the apartment building, based upon the judgment of the building
designers relying upon their experience in the repair of wood buildings damaged by
earthquakes, wind storms, and expansive soils.
E.2.4 Inventory of Damageable Components and Systems
Losses are computed based on estimated damage, and associated repair costs, that are
expected to occur in building components and systems as a result of the response of
the structure to earthquake shaking. Damage is computed based on component
fragility functions, and losses are computed based on consequence functions
contained within the PACT databases.
In order to compute losses, an inventory of all damageable to components and
systems (both structural and nonstructural) that are present in the building must be

GCR 14-917-26 E: Quantitative Benefits Analysis E-13
entered into PACT, and the associated fragility and consequence data must be
assigned. FEMA P-8-1 provides default (i.e., normative quantity) information on
typical building types and occupancies, to assist in populating a PACT model with
typical building components and systems.
Information for the apartment building designs was developed based on characteristic
values for apartment buildings contained within the PACT database, adjusted for
actual size and quantity, as necessary. Nonstructural components and systems were
assigned fragilities assuming that code-required bracing and anchorage was provided.
E.2.5 Assessment Results
Results from the quantitative assessment of the apartment building are summarized in
Tables E-4 and E-5. Results in Table E-4 are expressed as annualized loss (i.e., the
average value of loss, per year) in terms of repair costs, casualties (fatalities and
injuries), and probability of collapse. In Table E-5, results for each design are
compared as a ratio of the annualized losses for the wind design case. The ratios in
Table E-5 are plotted in Figure E-9.
Table E-4 Apartment Building Annualized Losses
Wind
Design(1) Current Local Seismic Code
Current National Seismic Code
Probability of Collapse (%) 0.041 0.041 0.019
Fatalities 0.0038 0.0038 0.0019
Injuries 0.0087 0.0087 0.0045
Repair Cost ($) 5,539 5,539 2,868
Repair Cost (% of Value) 0.06 0.06 0.03
Notes: (1) Losses for the wind design were taken as equivalent to current local seismic code design.
Table E-5 Comparison of Apartment Building Annualized Losses as a Ratio of Wind Design Losses
Wind
Design(1) Current Local
Seismic Code(2) Current National Seismic Code(2)
Ratio of Probability of Collapse 1.0 1.0 0.46
Ratio of Fatalities 1.0 1.0 0.50
Ratio of Injuries 1.0 1.0 0.52
Ratio of Repair Cost 1.0 1.0 0.52
Notes: (1) Losses for the wind design were taken as equivalent to current local seismic code design.
(2) Ratios of losses relative to wind design.
The currently accepted performance expectation, and the stated basis for the ground
motion hazard maps in the current national seismic code (ASCE/SEI 7-10), is a 1%
chance of collapse in 50 years, which equates to an annual probability of collapse of

E-14 E: Quantitative Benefits Analysis GCR 14-917-26
0.02% per year. Based on the values used in this quantitative assessment, the current
national seismic code design for the apartment building meets this performance
expectation, but the wind design and the current local seismic code designs do not.
Figure E-9 Comparison of annualized losses for the apartment building, as a ratio of annualized losses for the wind design.
Figure E-9 shows that annualized losses, in terms of repair cost, fatalities, and
probability of collapse, are reduced by approximately 50% when the apartment
building is designed using the current national seismic code.
E.3 Quantitative Assessment of the Office Building
The potential seismic performance of the office building at each design level was
assessed using the FEMA P-58-1 methodology and the companion Performance
Assessment Calculation Tool (PACT). Development of office building information
used as input to PACT parallels the development of information for the apartment
building described in the previous sections. Differences are described in the sections
that follow.
E.3.1 Hazard Curve
Hazard curves for the office building site were developed, as described for the
apartment building. The seismic designs of the office building stiffen significantly
because of the additional bays of bracing required in each direction (relative to the
wind design). There is minimal difference in the fundamental period of vibration
between the current local seismic code and the current national seismic code designs,
0
0.2
0.4
0.6
0.8
1
1.2
Probability of Collapse Fatalities Repair Cost
Ratio of Annualized Losses Relative to W
ind Design
Losses
Consequences
Wind Design
Current Local Seismic Code Design
Current National Seismic Code Design

GCR 14-917-26 E: Quantitative Benefits Analysis E-15
so the same hazard curve was used for both designs. As a result, only two hazard
curves were needed for the office building.
E.3.2 Characterization of Structural Response
Structural response of the office building was determined using the simplified
analysis procedure. A model was created using ETABS, Extended Three
Dimensional Analysis of Building Systems (CSI, 2013) for each design. These
models were used to determine the fundamental period of vibration, and the elastic
displacements, drift ratios, accelerations, and velocities at each earthquake intensity
defined on the hazard curves. FEMA P-58-1 equations were used to translate linear
elastic response quantities into nonlinear response quantities for input into PACT.
E.3.3 Collapse Fragility
When using the simplified analysis procedure, FEMA P-58-1 recommends a median
collapse acceleration set at three times the spectral response acceleration used for
design. For buildings designed to the current national seismic code (based on
ASCE/SEI 7-10), this value corresponds to two times the Maximum Considered
Earthquake (MCE) level spectral accelerations. The corresponding recommended
dispersion is set at 80%. The office building has a well-defined lateral force-resisting
system, and the contribution from nonstructural components is not significant,
therefore, the FEMA P-58-1 recommendations for collapse capacity were used
directly. The resulting collapse accelerations for each of the office building designs
are shown in Table E-6.
Table E-6 Office Building Collapse Accelerations
Wind Design
Current Local Seismic Code
Design
Current National Seismic Code
Design
Collapse Acceleration 0.38g 1.29g 1.76g
Two collapse modes were considered for the office building. Because the first story
of the office buildings is taller, and potentially less stiff, than the upper stories, the
first collapse mode was taken as a soft-story collapse at the ground floor with a 75%
relative chance of occurrence. Because of the potential for column splice failures to
occur in the third story, the second collapse mode was taken as a third-story collapse
due to column splice failure, with a 25% relative chance of occurrence.
Considering the weight of the office building construction materials, and the potential
for safe zones to occur between floor and roof framing, the following casualty rates
were assigned: (1) each collapse mode could cause fatalities to 40% of the population
in the affected area; and (2) each collapse mode could injure 40% of the population in
the affected area. Both values were assigned a COV of 0.6. These values were
selected based on the experience and judgment of the building designers, and are

E-16 E: Quantitative Benefits Analysis GCR 14-917-26
conservative relative to information on steel braced frame construction collected and
summarized in FEMA P-58 Background Document 3.7.8, Casualty Consequence
Function and Building Population Model Development provided in FEMA P-58-3,
Seismic Performance Assessment of Buildings, Methodology and Implementation,
Volume 3 – Supporting Electronic Materials and Background Documentation
(FEMA, 2012c).
To assess potential losses resulting from residual drift, the FEMA P-58-1 default
threshold for residual drift of 1% was used for the office building.
E.3.4 Inventory of Damageable Components and Systems
The inventory of damageable components and systems for the office building were
developed based on normative quantity values for office buildings contained within
the PACT database, adjusted for actual size and quantity, as necessary. Because
seismic design standards require nonstructural bracing and anchorage, and the wind
design standard does not, nonstructural components and systems in the seismic
design cases were assigned fragilities assuming that the required bracing was present,
and nonstructural systems in the wind design case were assigned fragilities assuming
bracing was not present.
E.3.5 Assessment Results
Results from the quantitative assessment of the office building are summarized in
Tables E-7 and E-8. Results in Table E-7 are expressed as annualized loss (i.e., the
average value of loss, per year) in terms of repair costs, casualties (fatalities and
injuries), and probability of collapse. Table E-7 Office Building Annualized Losses
Wind Design
Current Local Seismic Code
Current National Seismic Code
Probability of Collapse (%) 0.046 0.030 0.013
Fatalities 0.0046 0.0033 0.0013
Injuries 0.0083 0.012 0.0073
Repair Cost ($) 34,000 16,000 8,100
In Table E-8, results for each design are compared as a ratio of the annualized losses
for the wind design case. The ratios in Table E-8 are plotted in Figure E-10.
Based on the values used in this quantitative assessment, in terms of probability of
collapse, the current national seismic code design for the office building meets the
performance expectation of 1% chance of collapse in 50 years (0.02% annual
probability of collapse). The wind design and the current local seismic code designs
do not meet this performance expectation.

GCR 14-917-26 E: Quantitative Benefits Analysis E-17
Table E-8 Comparison of Office Building Annualized Losses as a Ratio of Wind Design Losses
Wind Design
Current Local Seismic Code(1)
Current National Seismic Code(1)
Ratio of Probability of Collapse 1.0 0.65 0.28
Ratio of Fatalities 1.0 0.72 0.28
Ratio of Injuries 1.0 1.45 0.88
Ratio of Repair Cost 1.0 0.47 0.24
Notes: (1) Ratios of losses relative to wind design.
Figure E-10 shows that annualized losses for the office building, in terms of repair
cost, fatalities, and probability of collapse, are reduced by more than 30% when
current local seismic design provisions are implemented, and by more than 70%
when current national seismic design provisions are implemented, relative to the
annualized losses that are expected when wind design provisions, alone, are
implemented.
Table E-8 appears to show an anomalous result in terms of injuries. The average
annual injury losses predicted for the current local seismic code design are higher
than the average annual injury losses for the wind design (i.e., 1.45 times higher). In
the case of the current national seismic code design, average annual injury losses are
lower than the average annual injury losses for the wind design (as would be
expected).
Figure E-10 Comparison of annualized losses for the office building, as a ratio of
annualized losses for the wind design.
0
0.2
0.4
0.6
0.8
1
1.2
Probability of Collapse Fatalities Repair Cost
Ratio of Annualized Losses Relative to W
ind Design
Losses
Consequences
Wind Design
Current Local Seismic Code Design
Current National Seismic Code Design

E-18 E: Quantitative Benefits Analysis GCR 14-917-26
The reason for this difference is related to how the building design affects the
calculation of fatalities and injuries due to structural and nonstructural components in
the building. As the building design becomes stronger and stiffer, the structural
system becomes more resistant to collapse, and the potential number of fatalities due
to structural collapse is reduced. However, an increase in strength and stiffness can
result in increased floor accelerations, which can increase the potential for damage to
nonstructural components. As nonstructural damage increases, the potential number
of injuries resulting from nonstructural damage increases.
In the case of the current local seismic code design, a parametric study determined
that the ceiling system was sensitive to increased floor accelerations that were
generated by the stiffer structural system. Increased damage to the ceiling system
was generating more potential injuries. For the current national seismic code design,
the structural and nonstructural system designs were improved enough to overcome
this effect, and the average annual injury losses were reduced to less than the wind
design losses (and less than the current local code design losses).
E.4 Quantitative Assessment of the Hospital Building
The potential seismic performance of the hospital building at each design level was
assessed using the FEMA P-58-1 methodology and the companion Performance
Assessment Calculation Tool (PACT). Development of hospital building information
used as input to PACT parallels the development of information for the apartment
and office buildings described in the previous sections. Differences are described in
the sections that follow.
E.4.1 Hazard Curve
Hazard curves for the hospital building site were developed, as described for the
apartment and office buildings. The two seismic designs of the hospital building are
essentially the same, although they are both significantly different from the wind
design because of differences between buckling-restrained and concentrically braced
frame systems. As a result, only two hazard curves were needed for the hospital
building.
E.4.2 Characterization of Structural Response
Structural response of the hospital building was determined using the simplified
analysis procedure. A model was created using ETABS for each design. These
models were used to determine the fundamental period of vibration, and the elastic
displacements, drift ratios, accelerations, and velocities at each earthquake intensity
defined on the hazard curves. FEMA P-58-1 equations were used to translate linear
elastic response quantities into nonlinear response quantities for input into PACT.

GCR 14-917-26 E: Quantitative Benefits Analysis E-19
E.4.3 Collapse Fragility
When using the simplified analysis procedure, FEMA P-58-1 recommends a median
collapse acceleration set at three times the spectral response acceleration used for
design. For buildings designed to the current national seismic code (based on
ASCE/SEI 7-10), this value corresponds to two times the MCE level spectral
accelerations. The corresponding recommended dispersion is set at 80%. The
hospital building has a well-defined lateral force-resisting system, and the
contribution from nonstructural components is not significant, therefore, the FEMA
P-58-1 recommendations for collapse capacity were used directly. The resulting
collapse accelerations for each of the hospital building designs are shown in Table E-
9.
Table E-9 Hospital Building Collapse Accelerations
Wind Design
Current Local Seismic Code
Design
Current National Seismic Code
Design
Collapse Acceleration 0.422g 1.65g 1.58g
Collapse rates for hospitals are expected to be smaller than for other buildings due to
additional strength and stiffness requirements for essential facilities that are caused
by the use of an importance factor on strength and more stringent limits on story
drift. Collapse modes assumed for the hospital building were taken as the same as
the office building, except that the column splices are located in the second story. As
a result, the second collapse mode was assumed to be a story collapse in the second
story due to column splice failure.
To assess potential losses resulting from residual drift, the FEMA P-58-1 default
threshold for residual drift of 1% was used for the hospital building.
E.4.4 Inventory of Damageable Components and Systems
The inventory of damageable components and systems for the hospital building were
developed based on normative quantity values for hospitals contained within the
PACT database, adjusted for actual size and quantity, as necessary. Nonstructural
components and systems in the seismic design cases were assigned fragilities
assuming that the required seismic bracing was present, and nonstructural systems in
the wind design case were assigned fragilities assuming bracing was not present.
E.4.5 Assessment Results
Results from the quantitative assessment of the hospital building are summarized in
Tables E-10 and E-11. Results in Table E-10 are expressed as annualized loss (i.e.,
the average value of loss, per year) in terms of repair costs, casualties (fatalities and
injuries), and probability of collapse.

E-20 E: Quantitative Benefits Analysis GCR 14-917-26
Table E-10 Hospital Building Annualized Losses
Wind Design
Current Local Seismic Code
Current National Seismic Code
Probability of Collapse (%) 0.038 0.0016 0.0018
Fatalities 0.014 0.0006 0.0007
Injuries 0.017 0.0087 0.0092
Repair Cost ($) 51,000 45,000 47,000
In terms of probability of collapse, both the current local seismic code and the current
national seismic code designs for the hospital building meets the performance
expectation of 1% chance of collapse in 50 years (0.02% annual probability of
collapse). The hospital design for wind alone does not meet this performance
expectation.
In Table E-11, results for each design are compared as a ratio of the annualized losses
for the wind design case. The ratios in Table E-11 are plotted in Figure E-11.
Figure E-11 shows that annualized losses for the hospital building, in terms of
fatalities and probability of collapse, are reduced by approximately 95% when
current local or current national seismic design provisions are implemented.
Table E-11 Comparison of Hospital Building Annualized Losses as a Ratio of Wind Design Losses
Wind Design
Current Local Seismic Code(1)
Current National Seismic Code(1)
Ratio of Probability of Collapse 1.0 0.04 0.05
Ratio of Fatalities 1.0 0.04 0.05
Ratio of Injuries 1.0 0.51 0.54
Ratio of Repair Cost 1.0 0.88 0.92
Notes: (1) Ratios of losses relative to wind design.
In terms of repair cost, annualized losses for the hospital building are reduced by
approximately 10% when current local or current national seismic design provisions
are implemented. The smaller reduction observed in repair costs for the hospital
seismic designs could be caused by the large amount of costly and damageable
equipment that is present in a typical hospital building. Damage to high-value
nonstructural components and contents can have a significant impact on total repair
costs, although no supplementary studies of the distribution of repair costs were made
to confirm this as a conclusion for the hospital building designs.

GCR 14-917-26 E: Quantitative Benefits Analysis E-21
Figure E-11 Comparison of annualized losses for the hospital building, as a ratio of annualized losses for the wind design.
0
0.2
0.4
0.6
0.8
1
1.2
Probability of Collapse Fatalities Repair Cost
Ratio of Annualized Losses Relative to W
ind Design Losses
Consequences
Wind Design
Current Local Seismic Code Design
Current National Seismic Code Design


GCR 14-917-26 E: Quantitative Benefits Analysis E-1
Appendix E
Quantitative Benefits Analysis
In this study, benefits are assessed in terms of the relative performance of the three
levels of design for each building. In general, this assessment is performed on a
qualitative basis for each building. The publication of FEMA P-58-1, Seismic
Performance Assessment of Buildings Volume 1 – Methodology (FEMA, 2012a),
however, introduces a new opportunity to assess the performance of individual
buildings on a quantitative, probabilistic basis. As a result, buildings in this study
that fit within the range of applicability of the FEMA P-58-1 methodology have also
been assessed on a quantitative basis. These buildings include the apartment
building, office building, and hospital.
This appendix explains the basis of the FEMA P-58-1 methodology and its companion
products, presents the building-specific information used as inputs to the methodology,
and summarizes results from a quantitative performance assessment of the selected
buildings. Results are presented as annualized values of loss (i.e., the average value of
loss, per year, over a period of years), and relative performance is measured by ratio of
annualized values of loss in terms of repair costs, fatalities, injuries, and probabilities of
collapse among the different designs.
E.1 Quantitative Performance Assessment Using FEMA P-58
In the FEMA P-58-1 methodology, performance is expressed as potential future
losses (i.e., consequences) due to earthquake shaking, measured in terms of repair
costs, repair time, casualties, and unsafe post-earthquake inspection placarding. Use
of this methodology requires quantitative knowledge about the building and its
unique site, structural, nonstructural, and occupancy characteristics. Basic
information necessary for implementation includes: (1) the ground shaking hazard at
the site in the form of a hazard curve; (2) the predicted response of the structure to
ground shaking; (3) the assessed building vulnerability to collapse in terms of a
collapse fragility; (4) an inventory of damageable components and systems in the
building (both structural and nonstructural) and the likely costs to repair damage; and
(5) the population that occupies the building over time. This information must be
characterized by both expected values and uncertainties (or total dispersion) in these
values.
Computations are made using an electronic Performance Assessment Calculation
Tool (PACT), provided in FEMA P-58-3, Seismic Performance Assessment of
Buildings, Methodology and Implementation, Volume 3 – Supporting Electronic

E-2 E: Quantitative Benefits Analysis GCR 14-917-26
Materials and Background Documentation (FEMA, 2012c). PACT includes a
database of fragility and consequence data for selected structural systems and
components, and performs extensive Monte Carlo simulations to arrive at a
probabilistic estimate of future performance in terms of likely values of repair costs,
repair time, casualties, and unsafe post-earthquake inspection placarding.
Fragility and consequence data currently available within PACT cover only some of
the structural and nonstructural systems that are present in the buildings selected for
this study. Such information remains under development for other buildings and
systems at this time. The FEMA P-58 methodology is general enough to accept user-
specified descriptions of fragility and consequence for other structural and
nonstructural systems and components, but development of this type of information
can be difficult and costly, and was beyond the scope of this study. As a result, only
three of the six case study buildings fit within the current range of applicability of the
FEMA P-58 methodology, and only the apartment building, the office building, and
the hospital were assessed using this approach.
The FEMA P-58 methodology can be used to perform three types of assessment:
Intensity-based assessment, which evaluates the probable performance of a
building subjected to a ground motion of a specified intensity.
Scenario-based assessment, which evaluates the probable performance of a
building subjected to a specified magnitude earthquake at a specified location
relative to the building site.
Time-based assessment, which evaluates the probable performance of a building
over a specified period of time, considering all earthquakes that could occur
within that period of time.
Time-based assessments consider uncertainty in the magnitude and location of future
earthquakes, as well as the intensity of motion resulting from these earthquakes, and
are, therefore, most appropriate when considering relative benefits between design
criteria that are applied to a population of buildings. Results can be expressed in
terms of the annual probability that a specified value of loss will be exceeded within
a year, or in terms of the average annual value of loss, per year, over a period of years
(i.e., annualized losses).
In this study, time-based assessments were used, and results are presented in terms of
annualized values of the following loss quantities: repair costs, casualties (fatalities
and injuries), and probability of collapse. Although the methodology will also
calculate losses associated with annualized repair time and probability of unsafe
placarding, these results are not reported here. No attempt has been made to combine
casualty losses with economic losses, nor has any attempt been made to assess

GCR 14-917-26 E: Quantitative Benefits Analysis E-3
indirect costs associated with building downtime (repair time) following an
earthquake.
E.2 Quantitative Assessment of the Apartment Building
The potential seismic performance of the apartment building at each design level was
assessed using the FEMA P-58 methodology and the companion PACT.
Development of apartment building information used as input to PACT is described
in the sections that follow.
Overall, the wind and current local seismic code designs for the apartment building
are very similar (except for seismic bracing and anchorage of certain nonstructural
components required in the current local seismic code design). Because the lateral
force-resisting systems are essentially the same, one quantitative assessment was
used to determine the expected performance of both designs, and the annualized
losses for the wind design were taken as equivalent to the losses for the current local
seismic code design. This assumption under predicts annualized losses for the wind
design because actual losses would be somewhat higher due to the presence of
unbraced nonstructural components. The use of lower predicted values of loss for the
wind design is conservative when making comparisons of relative performance using
wind design losses as a basis.
E.2.1 Hazard Curve
Earthquake shaking hazard in FEMA P-58-1 is characterized as spectral response
acceleration at a given period of structural vibration. Time-based assessments
require a hazard curve, which defines how the intensity of hazard varies with the
annual frequency of exceedance. Because period depends on the mass and stiffness
of a structure, it can be different for each design of a building, and each design can
have a different hazard curve.
Data to construct a hazard curve for each design were obtained from the U.S.
Geological Survey (USGS) Hazard Curve Application, available at http://geohazards
.usgs.gov/hazardtool/, for the latitude and longitude of the site and location of the
apartment building. Data are only provided for site class B in the Tennessee region
(in some West Coast areas, the tool will provide data directly for other site classes).
The website provides hazard curves for peak ground acceleration and for spectral
response accelerations at periods of 0.1, 0.2, 0.3, 0.5, 1.0 and 2.0 seconds.
The periods provided by USGS are not exactly the same as the apartment building
designs being studied, so it was necessary to interpolate between curves obtained
from the website. Once a curve for the correct period was obtained, it was then
adjusted for site class amplification using appropriate interpolated values of site

E-4 E: Quantitative Benefits Analysis GCR 14-917-26
coefficients, Fa or Fv, from Table 11.4-1 and Table 11.4-2 of ASCE/SEI 7-10,
Minimum Design Loads for Buildings and Other Structures (ASCE, 2010).
It should be noted that site class amplification factors in ASCE/SEI 7-10 vary with
amplitude of acceleration in the period range between 0.3 and 1.0 second. It is not
clear whether Fa or Fv is the most appropriate amplifier, because the difference in
period between alternative designs of the same building might push the period from
one range into another. In this study, because a comparison between the designs was
the objective, all values were amplified by Fa to remove the effect of site
amplification from the results.
Once adjusted, the data were plotted with annual frequency of exceedance (in log
scale) on the vertical axis, and acceleration on the horizontal axis (in linear scale).
Following the recommendations in FEMA P-58-2, Seismic Performance Assessment
of Buildings, Volume 2 – Implementation Guide (FEMA, 2012b), a range was defined
by a minimum spectral acceleration set at 0.05g (or 0.05/T for a structure with a
period exceeding 1.0 second), and a maximum spectral acceleration set at the smaller
of:
twice the spectral acceleration corresponding to a mean annual frequency of
exceedance equal to 0.0004 (2,500 year mean return interval), or
twice the median predicted spectral acceleration at collapse.
The hazard curve was then divided into eight segments (i.e., intensity levels) and the
average acceleration for each segment was tabulated along with the annual frequency
of exceedance for the segment. Figure E-1 shows the hazard curve for the apartment
building design with a fundamental period of 0.39 seconds.
In order to generate a single hazard curve for the design of a building with differing
responses in each orthogonal direction, the average of the fundamental periods in the
longitudinal and transverse directions was used, in accordance with FEMA P-58-2.
E.2.2 Characterization of Structural Response
In FEMA P-58-1, response quantities that are used to characterize the behavior of a
structure subjected to ground shaking include drift (or drift ratio) in each story, and
the accelerations and velocities at each floor level, for ground motions scaled to each
of the intensity levels identified on the hazard curve. Also needed is the spectral
acceleration at which collapse is expected to occur.
PACT is configured to accept response quantities that are generated from any type of
structural analysis. FEMA P-58-1 provides guidance on the use of nonlinear
response history analyses and simplified analyses based on a linear static approach.
In general, the simplified analysis procedure was used for the buildings in this study.

GCR 14-917-26 E: Quantitative Benefits Analysis E-5
Figure E-1 Seismic hazard curve for the apartment building with a fundamental period of 0.39 seconds.
In the case of the apartment building, a nonlinear static analysis was used to better
quantify the response of system considering the various sheathing materials that are
present on the walls in the building.
The wood-framed walls of the apartment building are covered with oriented strand
board (OSB) structural wood panels, gypsum wallboard (GWB), and stucco. The
lateral design only considers one type of sheathing on any given wall, and the
ASCE/SEI 7-10 design only considers walls with OSB sheathing. Because the
design analyses ignore many wall elements that provide a real contribution to lateral
resistance, they are not suitable for developing more realistic structural response
quantities (e.g., period, drift, acceleration, and collapse capacity) required for
quantitative assessment using PACT.
The FEMA P-807 report, Seismic Evaluation and Retrofit of Multi-Unit Wood-Frame
Buildings with Weak First Stories (FEMA, 2012d), and ASCE/SEI 41-06, Seismic
Rehabilitation of Existing Buildings (ASCE, 2007), provide information that can be
used to develop a more realistic estimate of the lateral strength and stiffness of the
walls in the apartment building explicitly considering the nonlinear performance of
various materials. FEMA P-807 provides tables and plots of base shear force versus
drift ratio for shear walls with different sheathing, as shown in Figure E-2 and Figure
E-3, and methods to combine different structural and nonstructural materials on the
walls. For walls with combinations of sheathing materials, FEMA P-807
0.000001
0.00001
0.0001
0.001
0.01
0.1
1
0 0.25 0.5 0.75 1 1.25 1.5 1.75 2
An
nu
al F
req
ue
ncy
of
Exce
ed
ance
, λ
Spectral Acceleration, Sa
Hazard Curve
Sa for T=0.39s
Sa(0.39) for input
PGA (Sa for T=0)
PGA for input
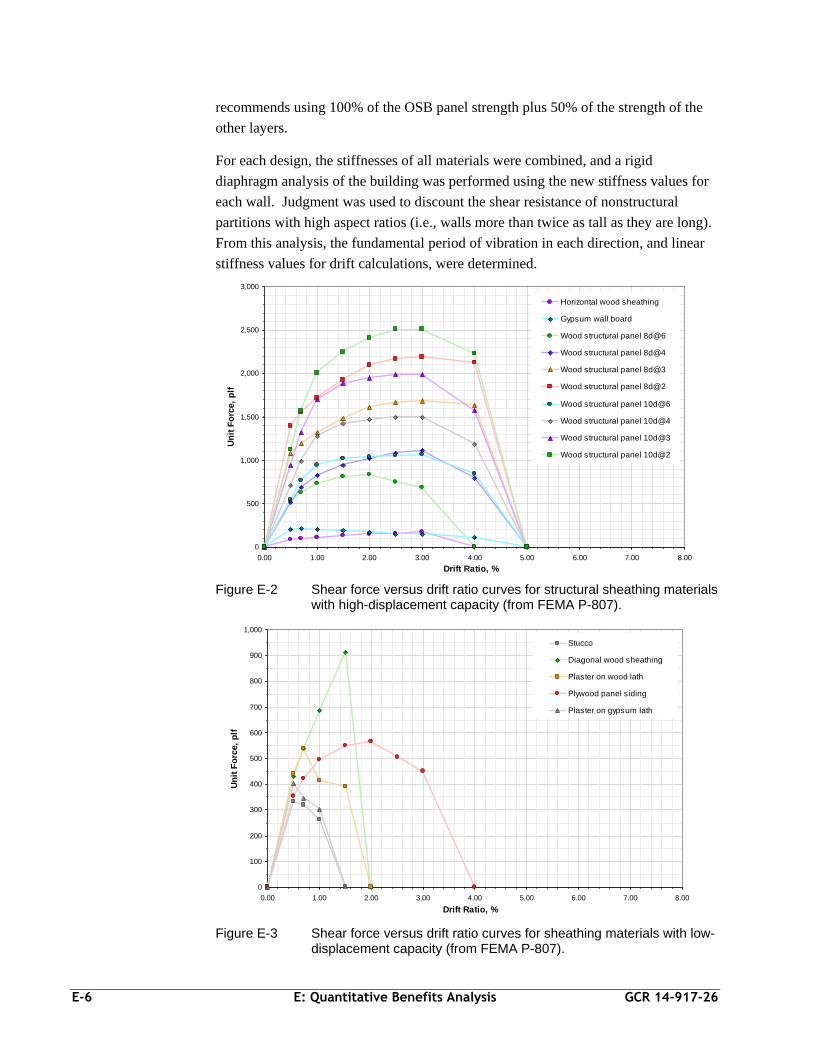
E-6 E: Quantitative Benefits Analysis GCR 14-917-26
recommends using 100% of the OSB panel strength plus 50% of the strength of the
other layers.
For each design, the stiffnesses of all materials were combined, and a rigid
diaphragm analysis of the building was performed using the new stiffness values for
each wall. Judgment was used to discount the shear resistance of nonstructural
partitions with high aspect ratios (i.e., walls more than twice as tall as they are long).
From this analysis, the fundamental period of vibration in each direction, and linear
stiffness values for drift calculations, were determined.
Figure E-2 Shear force versus drift ratio curves for structural sheathing materials with high-displacement capacity (from FEMA P-807).
Figure E-3 Shear force versus drift ratio curves for sheathing materials with low-displacement capacity (from FEMA P-807).
0
500
1,000
1,500
2,000
2,500
3,000
0.00 1.00 2.00 3.00 4.00 5.00 6.00 7.00 8.00
Drift Ratio, %
Un
it F
orc
e,
plf
Horizontal wood sheathing
Gypsum wall board
Wood structural panel 8d@6
Wood structural panel 8d@4
Wood structural panel 8d@3
Wood structural panel 8d@2
Wood structural panel 10d@6
Wood structural panel 10d@4
Wood structural panel 10d@3
Wood structural panel 10d@2
0
100
200
300
400
500
600
700
800
900
1,000
0.00 1.00 2.00 3.00 4.00 5.00 6.00 7.00 8.00
Drift Ratio, %
Un
it F
orc
e,
plf
Stucco
Diagonal wood sheathing
Plaster on wood lath
Plywood panel siding
Plaster on gypsum lath

GCR 14-917-26 E: Quantitative Benefits Analysis E-7
For the wind design and the current local seismic code design, there was no
difference in the structural system in the transverse (north-south) direction. In the
longitudinal direction, a 1% difference in strength was observed. This difference was
deemed to be insignificant, and the same base shear force versus drift ratio curves
were used for both the wind design and the current local seismic code design.
Using the stiffness and associated mass values for each story, elastic lateral drifts
were computed and fundamental periods of the building were determined from a
Rayleigh analysis. The fundamental periods for the building designed for wind
loading is shown on the second column of Table E-1 and the periods for buildings
designed for seismic codes are shown in the third and fourth columns of Table E-1.
Note these values are higher than the code-based approximate period, Ta, calculated
as 0.02(h)0.75 = 0.28 seconds, where h is the height of the building.
Table E-1 Fundamental Periods of the Apartment Building Used for Performance Assessment
Wind Design Current Local Seismic Code
Current National Seismic Code
North-South Direction 0.41s 0.41s 0.38s
East-West Direction 0.43s 0.43s 0.40s
Average 0.42s 0.42s 0.39s
PACT input includes story drifts for each story, and velocities and accelerations at
each floor, at each of the eight intensity levels. These values can be obtained from
nonlinear response history analysis directly, or estimated from linear analysis with
corrections for inelastic behavior and higher mode effects. FEMA P-58-1 equations
were used to correct linear elastic response quantities to nonlinear response quantities
for input into PACT.
E.2.3 Collapse Fragility
Building collapse is the principle cause of casualties in earthquakes. In order to
assess potential casualty losses, a collapse fragility is needed to define the probability
of incurring collapse as a function of ground motion intensity. A collapse fragility is
characterized by the median spectral acceleration, and associated dispersion, at which
collapse of the building is expected to occur.
FEMA P-58-1 provides several alternative methods of establishing the collapse
fragility of a building. Because of the participation of many different sheathing
materials in the lateral resistance of the apartment building, a nonlinear static
pushover analysis was conducted to determine the force-displacement behavior of the
building. Results from a static pushover can be used to determine collapse capacity

E-8 E: Quantitative Benefits Analysis GCR 14-917-26
in the Static Pushover to Incremental Dynamic Analysis (SPO2IDA) tool
(Vamvatsikos and Cornell, 2006).
Static pushover curves (i.e., base shear force versus drift ratio) were constructed for
the apartment building designs in each direction using FEMA P-807 data. In wood-
framed construction, shear resistance in the first story dominates the post-yield
behavior, so the first story was used to determine the pushover capacity in each
design. Trilinear shear force versus drift ratio curves were used to approximate the
static pushover curves based on an effective yield point, a point of maximum
resistance, and a point of degraded strength, determined as follows:
The effective yield point was restricted to occur on the extension of the initial
stiffness line, consistent with the fundamental period of vibration.
The maximum shear resistance was taken as equal to the peak of the pushover
curve.
The point of degraded strength was taken as the value on the pushover curve at a
drift ratio of 4%.
The yield force and the drift at maximum resistance were unconstrained, and
values were selected to visually provide a best fit to the pushover curve (with a
slight error on the side of less energy dissipation to be conservative).
Coordinates for effective yield, maximum shear resistance, and degraded strength are
provided in Table E-2. Pushover curves and approximate trilinear curves are shown
in Figures E-4 through E-7.
Table E-2 Coordinates of Static Pushover Curves for the Apartment Building
Wind and Current Local Seismic Code Designs
Current National Seismic Code Design
Drift Shear (kips) Drift Shear (kips)
Shear Yield
North-South Dir. 0.27% 490 0.33% 770
East-West Dir. 0.28% 475 0.31% 630
Maximum Shear
North-South Dir. 1.2% 553 2.5% 856
East-West Dir. 1.4% 532 2.6% 697
Degraded Shear
North-South Dir. 4% 250 4% 614
East-West Dir. 4% 176 4% 330

GCR 14-917-26 E: Quantitative Benefits Analysis E-9
Figure E-4 Pushover curve and trilinear approximation for the apartment building wind and current local seismic code design, north-south direction.
Figure E-5 Pushover curve and trilinear approximation for the apartment building wind and current local seismic code design, east-west direction.
0
490
553
250
0
100
200
300
400
500
600
0 0.5 1 1.5 2 2.5 3 3.5 4 4.5
Bas
e S
he
ar, k
ips
Interstory Drift Ratio, %
Pushover Analysis, North-South Direction 1999 SBC Seismic Design
GWB
OSB + Stucco + GWB
Total
Trilinear
475
532
176
0
100
200
300
400
500
600
0 0.5 1 1.5 2 2.5 3 3.5 4 4.5
Bas
e S
he
ar, k
ips
Interstory Drift Ratio, %
Pushover Analysis, East-West Direction for 1999 SBC Seismic Design
OSB + Stucco + GWB
Total
Trilinear

E-10 E: Quantitative Benefits Analysis GCR 14-917-26
Figure E-6 Pushover curve and trilinear approximation for the apartment building current national seismic code design, north-south direction.
Figure E-7 Pushover curve and trilinear approximation for the apartment building current national seismic code design, east-west direction.
0
770 856
614
0
100
200
300
400
500
600
700
800
900
0 0.5 1 1.5 2 2.5 3 3.5 4 4.5
Bas
e S
he
ar, k
ips
Interstory Drift Ratio, %
Pushover Analysis, North-South Direction ASCE/SEI 7-10 Seismic Design
Total
Trilinear
630
697
330
399
0
100
200
300
400
500
600
700
800
0 0.5 1 1.5 2 2.5 3 3.5 4 4.5
Bas
e S
he
ar, k
ips
Interstory Drift Ratio, %
Pushever Analysis, East-West Direction ASCE/SEI 7-10 Seismic Design
Total
Trilinear

GCR 14-917-26 E: Quantitative Benefits Analysis E-11
The plots in Figures E-4 through E-7 were normalized with the yield point taken as
1.0 for both strength and ductility, resulting in a new series of plots showing ductility
versus base shear as a multiple of yield shear. One such normalized plot is illustrated
in Figure E-8.
Figure E-8 Normalized pushover curve for the apartment building current national seismic code design, east-west direction.
The normalized pushover plots, along with the fundamental periods for each design,
were used as SPO2IDA inputs for calculating the median effective seismic response
modification factor, R, and the collapse acceleration. Table E-3 provides a summary
of data from SPO2IDA, and the resulting collapse capacity of the apartment building.
In addition to the collapse fragility, users must also define potential modes of
collapse in terms of the portion of a structure involved in a collapse scenario (e.g.,
total collapse, story collapse, or roof collapse) and the corresponding fatality and
injury rates in the affected portions of the structure. In the apartment building, two
modes of collapse were defined: (1) collapse in the first story only; and (2) collapse
of all three stories. Collapse at the first story was judged to be more likely than in the
upper stories, so collapse mode 1 was assigned a 90% relative chance of occurring,
and collapse mode 2 was assigned a 10% relative chance of occurring.
Fatality and injury rates depend on the nature of the structure and materials of
construction. Lighter weight materials of construction and structures with potential
safe zones are assigned lower fatality and injury rates. For the apartment building,
the following casualty rates were assigned: (1) 20% fatality rate and 40% injury rate
0, 0
1.00, 1.00
8.45, 1.11
13.00, 0.52
y = 0.0143x + 0.9857
y = -0.1281x + 2.1882
0
0.2
0.4
0.6
0.8
1
1.2
0.0 2.0 4.0 6.0 8.0 10.0 12.0 14.0
Sa/S
ay
Ductility, mu
Pushover Analysis, East-West Direction ASCE/SEI 7-10 Seismic Design
Total
Trilinear

E-12 E: Quantitative Benefits Analysis GCR 14-917-26
in the collapsed story (or stories); and (2) 5% fatality rate and 10% injury rate in the
stories that do not collapse. Predictions of fatalities and injuries were assigned a
coefficient of variation (COV) of 0.6. These values were selected based on the
experience and judgment of the building designers, and are conservative relative to
information on wood frame construction collected and summarized in FEMA P-58
Background Document 3.7.8, Casualty Consequence Function and Building
Population Model Development provided in FEMA P-58-3, Seismic Performance
Assessment of Buildings, Methodology and Implementation, Volume 3 – Supporting
Electronic Materials and Background Documentation (FEMA, 2012c).
Table E-3 SPO2IDA Results and Collapse Capacities for the Apartment Building Designs
Wind and Current Local Seismic Code Designs
Current National Seismic Code Design
R factor
North-South Dir. 6.14 6.11
East-West Dir. 5.94 6.15
Yield Acceleration(1)
North-South Dir. 0.259g 0.407g
East-West Dir. 0.251g 0.333g
Collapse Acceleration(2)
North-South Dir. 1.59g 2.49g
East-West Dir. 1.49g 2.05g
Notes: (1) Yield acceleration is the base shear (in kips) at yield of the first story, divided by the building weight (in kips).
(2) Median collapse acceleration is the median R times the yield acceleration.
In addition to collapse, residual drifts can also render a structure unusable following
an earthquake. To assess potential losses resulting from residual drift, FEMA P-58-1
estimates residual drift based on the computed transient inelastic drifts. The default
threshold for residual drift is set at 1%. This default value was modified to 4% (with
a COV of 0.3) for the apartment building, based upon the judgment of the building
designers relying upon their experience in the repair of wood buildings damaged by
earthquakes, wind storms, and expansive soils.
E.2.4 Inventory of Damageable Components and Systems
Losses are computed based on estimated damage, and associated repair costs, that are
expected to occur in building components and systems as a result of the response of
the structure to earthquake shaking. Damage is computed based on component
fragility functions, and losses are computed based on consequence functions
contained within the PACT databases.
In order to compute losses, an inventory of all damageable to components and
systems (both structural and nonstructural) that are present in the building must be
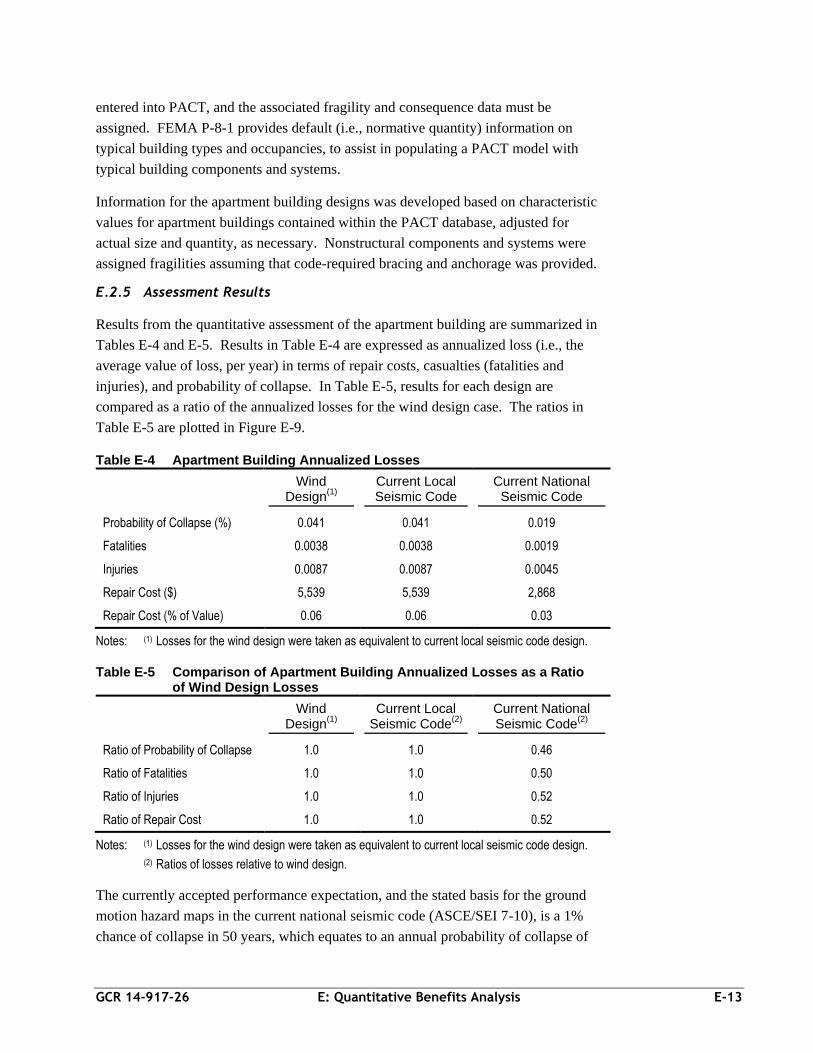
GCR 14-917-26 E: Quantitative Benefits Analysis E-13
entered into PACT, and the associated fragility and consequence data must be
assigned. FEMA P-8-1 provides default (i.e., normative quantity) information on
typical building types and occupancies, to assist in populating a PACT model with
typical building components and systems.
Information for the apartment building designs was developed based on characteristic
values for apartment buildings contained within the PACT database, adjusted for
actual size and quantity, as necessary. Nonstructural components and systems were
assigned fragilities assuming that code-required bracing and anchorage was provided.
E.2.5 Assessment Results
Results from the quantitative assessment of the apartment building are summarized in
Tables E-4 and E-5. Results in Table E-4 are expressed as annualized loss (i.e., the
average value of loss, per year) in terms of repair costs, casualties (fatalities and
injuries), and probability of collapse. In Table E-5, results for each design are
compared as a ratio of the annualized losses for the wind design case. The ratios in
Table E-5 are plotted in Figure E-9.
Table E-4 Apartment Building Annualized Losses
Wind Design
(1)
Current Local Seismic Code
Current National Seismic Code
Probability of Collapse (%) 0.041 0.041 0.019
Fatalities 0.0038 0.0038 0.0019
Injuries 0.0087 0.0087 0.0045
Repair Cost ($) 5,539 5,539 2,868
Repair Cost (% of Value) 0.06 0.06 0.03
Notes: (1) Losses for the wind design were taken as equivalent to current local seismic code design.
Table E-5 Comparison of Apartment Building Annualized Losses as a Ratio of Wind Design Losses
Wind Design
(1)
Current Local Seismic Code
(2)
Current National Seismic Code
(2)
Ratio of Probability of Collapse 1.0 1.0 0.46
Ratio of Fatalities 1.0 1.0 0.50
Ratio of Injuries 1.0 1.0 0.52
Ratio of Repair Cost 1.0 1.0 0.52
Notes: (1) Losses for the wind design were taken as equivalent to current local seismic code design.
(2) Ratios of losses relative to wind design.
The currently accepted performance expectation, and the stated basis for the ground
motion hazard maps in the current national seismic code (ASCE/SEI 7-10), is a 1%
chance of collapse in 50 years, which equates to an annual probability of collapse of

E-14 E: Quantitative Benefits Analysis GCR 14-917-26
0.02% per year. Based on the values used in this quantitative assessment, the current
national seismic code design for the apartment building meets this performance
expectation, but the wind design and the current local seismic code designs do not.
Figure E-9 Comparison of annualized losses for the apartment building, as a ratio of annualized losses for the wind design.
Figure E-9 shows that annualized losses, in terms of repair cost, fatalities, and
probability of collapse, are reduced by approximately 50% when the apartment
building is designed using the current national seismic code.
E.3 Quantitative Assessment of the Office Building
The potential seismic performance of the office building at each design level was
assessed using the FEMA P-58-1 methodology and the companion Performance
Assessment Calculation Tool (PACT). Development of office building information
used as input to PACT parallels the development of information for the apartment
building described in the previous sections. Differences are described in the sections
that follow.
E.3.1 Hazard Curve
Hazard curves for the office building site were developed, as described for the
apartment building. The seismic designs of the office building stiffen significantly
because of the additional bays of bracing required in each direction (relative to the
wind design). There is minimal difference in the fundamental period of vibration
between the current local seismic code and the current national seismic code designs,
0
0.2
0.4
0.6
0.8
1
1.2
Probability of Collapse Fatalities Repair Cost
Rat
io o
f A
nn
ual
ize
d L
oss
es
Re
lati
ve t
o W
ind
De
sign
Lo
sse
s
Consequences
Wind Design
Current Local Seismic Code Design
Current National Seismic Code Design

GCR 14-917-26 E: Quantitative Benefits Analysis E-15
so the same hazard curve was used for both designs. As a result, only two hazard
curves were needed for the office building.
E.3.2 Characterization of Structural Response
Structural response of the office building was determined using the simplified
analysis procedure. A model was created using ETABS, Extended Three
Dimensional Analysis of Building Systems (CSI, 2013) for each design. These
models were used to determine the fundamental period of vibration, and the elastic
displacements, drift ratios, accelerations, and velocities at each earthquake intensity
defined on the hazard curves. FEMA P-58-1 equations were used to translate linear
elastic response quantities into nonlinear response quantities for input into PACT.
E.3.3 Collapse Fragility
When using the simplified analysis procedure, FEMA P-58-1 recommends a median
collapse acceleration set at three times the spectral response acceleration used for
design. For buildings designed to the current national seismic code (based on
ASCE/SEI 7-10), this value corresponds to two times the Maximum Considered
Earthquake (MCE) level spectral accelerations. The corresponding recommended
dispersion is set at 80%. The office building has a well-defined lateral force-resisting
system, and the contribution from nonstructural components is not significant,
therefore, the FEMA P-58-1 recommendations for collapse capacity were used
directly. The resulting collapse accelerations for each of the office building designs
are shown in Table E-6.
Table E-6 Office Building Collapse Accelerations
Wind Design
Current Local Seismic Code
Design
Current National Seismic Code
Design
Collapse Acceleration 0.38g 1.29g 1.76g
Two collapse modes were considered for the office building. Because the first story
of the office buildings is taller, and potentially less stiff, than the upper stories, the
first collapse mode was taken as a soft-story collapse at the ground floor with a 75%
relative chance of occurrence. Because of the potential for column splice failures to
occur in the third story, the second collapse mode was taken as a third-story collapse
due to column splice failure, with a 25% relative chance of occurrence.
Considering the weight of the office building construction materials, and the potential
for safe zones to occur between floor and roof framing, the following casualty rates
were assigned: (1) each collapse mode could cause fatalities to 40% of the population
in the affected area; and (2) each collapse mode could injure 40% of the population in
the affected area. Both values were assigned a COV of 0.6. These values were
selected based on the experience and judgment of the building designers, and are

E-16 E: Quantitative Benefits Analysis GCR 14-917-26
conservative relative to information on steel braced frame construction collected and
summarized in FEMA P-58 Background Document 3.7.8, Casualty Consequence
Function and Building Population Model Development provided in FEMA P-58-3,
Seismic Performance Assessment of Buildings, Methodology and Implementation,
Volume 3 – Supporting Electronic Materials and Background Documentation
(FEMA, 2012c).
To assess potential losses resulting from residual drift, the FEMA P-58-1 default
threshold for residual drift of 1% was used for the office building.
E.3.4 Inventory of Damageable Components and Systems
The inventory of damageable components and systems for the office building were
developed based on normative quantity values for office buildings contained within
the PACT database, adjusted for actual size and quantity, as necessary. Because
seismic design standards require nonstructural bracing and anchorage, and the wind
design standard does not, nonstructural components and systems in the seismic
design cases were assigned fragilities assuming that the required bracing was present,
and nonstructural systems in the wind design case were assigned fragilities assuming
bracing was not present.
E.3.5 Assessment Results
Results from the quantitative assessment of the office building are summarized in
Tables E-7 and E-8. Results in Table E-7 are expressed as annualized loss (i.e., the
average value of loss, per year) in terms of repair costs, casualties (fatalities and
injuries), and probability of collapse. Table E-7 Office Building Annualized Losses
Wind Design
Current Local Seismic Code
Current National Seismic Code
Probability of Collapse (%) 0.046 0.030 0.013
Fatalities 0.0046 0.0033 0.0013
Injuries 0.0083 0.012 0.0073
Repair Cost ($) 34,000 16,000 8,100
In Table E-8, results for each design are compared as a ratio of the annualized losses
for the wind design case. The ratios in Table E-8 are plotted in Figure E-10.
Based on the values used in this quantitative assessment, in terms of probability of
collapse, the current national seismic code design for the office building meets the
performance expectation of 1% chance of collapse in 50 years (0.02% annual
probability of collapse). The wind design and the current local seismic code designs
do not meet this performance expectation.

GCR 14-917-26 E: Quantitative Benefits Analysis E-17
Table E-8 Comparison of Office Building Annualized Losses as a Ratio of Wind Design Losses
Wind Design
Current Local Seismic Code
(1)
Current National Seismic Code
(1)
Ratio of Probability of Collapse 1.0 0.65 0.28
Ratio of Fatalities 1.0 0.72 0.28
Ratio of Injuries 1.0 1.45 0.88
Ratio of Repair Cost 1.0 0.47 0.24
Notes: (1) Ratios of losses relative to wind design.
Figure E-10 shows that annualized losses for the office building, in terms of repair
cost, fatalities, and probability of collapse, are reduced by more than 30% when
current local seismic design provisions are implemented, and by more than 70%
when current national seismic design provisions are implemented, relative to the
annualized losses that are expected when wind design provisions, alone, are
implemented.
Table E-8 appears to show an anomalous result in terms of injuries. The average
annual injury losses predicted for the current local seismic code design are higher
than the average annual injury losses for the wind design (i.e., 1.45 times higher). In
the case of the current national seismic code design, average annual injury losses are
lower than the average annual injury losses for the wind design (as would be
expected).
Figure E-10 Comparison of annualized losses for the office building, as a ratio of annualized losses for the wind design.
0
0.2
0.4
0.6
0.8
1
1.2
Probability of Collapse Fatalities Repair Cost
Rat
io o
f A
nn
ual
ize
d L
oss
es
Re
lati
ve t
o W
ind
De
sign
Lo
sse
s
Consequences
Wind Design
Current Local Seismic Code Design
Current National Seismic Code Design

E-18 E: Quantitative Benefits Analysis GCR 14-917-26
The reason for this difference is related to how the building design affects the
calculation of fatalities and injuries due to structural and nonstructural components in
the building. As the building design becomes stronger and stiffer, the structural
system becomes more resistant to collapse, and the potential number of fatalities due
to structural collapse is reduced. However, an increase in strength and stiffness can
result in increased floor accelerations, which can increase the potential for damage to
nonstructural components. As nonstructural damage increases, the potential number
of injuries resulting from nonstructural damage increases.
In the case of the current local seismic code design, a parametric study determined
that the ceiling system was sensitive to increased floor accelerations that were
generated by the stiffer structural system. Increased damage to the ceiling system
was generating more potential injuries. For the current national seismic code design,
the structural and nonstructural system designs were improved enough to overcome
this effect, and the average annual injury losses were reduced to less than the wind
design losses (and less than the current local code design losses).
E.4 Quantitative Assessment of the Hospital Building
The potential seismic performance of the hospital building at each design level was
assessed using the FEMA P-58-1 methodology and the companion Performance
Assessment Calculation Tool (PACT). Development of hospital building information
used as input to PACT parallels the development of information for the apartment
and office buildings described in the previous sections. Differences are described in
the sections that follow.
E.4.1 Hazard Curve
Hazard curves for the hospital building site were developed, as described for the
apartment and office buildings. The two seismic designs of the hospital building are
essentially the same, although they are both significantly different from the wind
design because of differences between buckling-restrained and concentrically braced
frame systems. As a result, only two hazard curves were needed for the hospital
building.
E.4.2 Characterization of Structural Response
Structural response of the hospital building was determined using the simplified
analysis procedure. A model was created using ETABS for each design. These
models were used to determine the fundamental period of vibration, and the elastic
displacements, drift ratios, accelerations, and velocities at each earthquake intensity
defined on the hazard curves. FEMA P-58-1 equations were used to translate linear
elastic response quantities into nonlinear response quantities for input into PACT.

GCR 14-917-26 E: Quantitative Benefits Analysis E-19
E.4.3 Collapse Fragility
When using the simplified analysis procedure, FEMA P-58-1 recommends a median
collapse acceleration set at three times the spectral response acceleration used for
design. For buildings designed to the current national seismic code (based on
ASCE/SEI 7-10), this value corresponds to two times the MCE level spectral
accelerations. The corresponding recommended dispersion is set at 80%. The
hospital building has a well-defined lateral force-resisting system, and the
contribution from nonstructural components is not significant, therefore, the FEMA
P-58-1 recommendations for collapse capacity were used directly. The resulting
collapse accelerations for each of the hospital building designs are shown in Table E-
9.
Table E-9 Hospital Building Collapse Accelerations
Wind Design
Current Local Seismic Code
Design
Current National Seismic Code
Design
Collapse Acceleration 0.422g 1.65g 1.58g
Collapse rates for hospitals are expected to be smaller than for other buildings due to
additional strength and stiffness requirements for essential facilities that are caused
by the use of an importance factor on strength and more stringent limits on story
drift. Collapse modes assumed for the hospital building were taken as the same as
the office building, except that the column splices are located in the second story. As
a result, the second collapse mode was assumed to be a story collapse in the second
story due to column splice failure.
To assess potential losses resulting from residual drift, the FEMA P-58-1 default
threshold for residual drift of 1% was used for the hospital building.
E.4.4 Inventory of Damageable Components and Systems
The inventory of damageable components and systems for the hospital building were
developed based on normative quantity values for hospitals contained within the
PACT database, adjusted for actual size and quantity, as necessary. Nonstructural
components and systems in the seismic design cases were assigned fragilities
assuming that the required seismic bracing was present, and nonstructural systems in
the wind design case were assigned fragilities assuming bracing was not present.
E.4.5 Assessment Results
Results from the quantitative assessment of the hospital building are summarized in
Tables E-10 and E-11. Results in Table E-10 are expressed as annualized loss (i.e.,
the average value of loss, per year) in terms of repair costs, casualties (fatalities and
injuries), and probability of collapse.

E-20 E: Quantitative Benefits Analysis GCR 14-917-26
Table E-10 Hospital Building Annualized Losses
Wind Design
Current Local Seismic Code
Current National Seismic Code
Probability of Collapse (%) 0.038 0.0016 0.0018
Fatalities 0.014 0.0006 0.0007
Injuries 0.017 0.0087 0.0092
Repair Cost ($) 51,000 45,000 47,000
In terms of probability of collapse, both the current local seismic code and the current
national seismic code designs for the hospital building meets the performance
expectation of 1% chance of collapse in 50 years (0.02% annual probability of
collapse). The hospital design for wind alone does not meet this performance
expectation.
In Table E-11, results for each design are compared as a ratio of the annualized losses
for the wind design case. The ratios in Table E-11 are plotted in Figure E-11.
Figure E-11 shows that annualized losses for the hospital building, in terms of
fatalities and probability of collapse, are reduced by approximately 95% when
current local or current national seismic design provisions are implemented.
Table E-11 Comparison of Hospital Building Annualized Losses as a Ratio of Wind Design Losses
Wind Design
Current Local Seismic Code
(1)
Current National Seismic Code
(1)
Ratio of Probability of Collapse 1.0 0.04 0.05
Ratio of Fatalities 1.0 0.04 0.05
Ratio of Injuries 1.0 0.51 0.54
Ratio of Repair Cost 1.0 0.88 0.92
Notes: (1) Ratios of losses relative to wind design.
In terms of repair cost, annualized losses for the hospital building are reduced by
approximately 10% when current local or current national seismic design provisions
are implemented. The smaller reduction observed in repair costs for the hospital
seismic designs could be caused by the large amount of costly and damageable
equipment that is present in a typical hospital building. Damage to high-value
nonstructural components and contents can have a significant impact on total repair
costs, although no supplementary studies of the distribution of repair costs were made
to confirm this as a conclusion for the hospital building designs.

GCR 14-917-26 E: Quantitative Benefits Analysis E-21
Figure E-11 Comparison of annualized losses for the hospital building, as a ratio of annualized losses for the wind design.
0
0.2
0.4
0.6
0.8
1
1.2
Probability of Collapse Fatalities Repair Cost
Rat
io o
f A
nn
ual
ize
d L
oss
es
Re
lati
ve t
o W
ind
De
sign
Lo
sse
s
Consequences
Wind Design
Current Local Seismic Code Design
Current National Seismic Code Design


GCR 14-917-26 References F-1
References
ACI, 1995, Building Code Requirements for Structural Concrete and Commentary,
ACI 318-95, American Concrete Institute, Farmington Hills, Michigan.
ACI, 2005, Building Code Requirements for Structural Concrete and Commentary,
ACI 318-05, American Concrete Institute, Farmington Hills, Michigan.
ACI, 2008, Building Code Requirements for Structural Concrete and Commentary,
ACI 318-08, American Concrete Institute, Farmington Hills, Michigan.
AF&PA, 2005, Special Design Provisions for Wind and Seismic Standard with
Commentary, ANSI/AF&PA SDPWS-2005, American Forest & Paper
Association, Washington, D.C.
AF&PA, 2009, Special Design Provisions for Wind and Seismic Standard with
Commentary, ANSI/AF&PA SDPWS-2008, American Forest & Paper
Association, Washington, D.C.
AISC, 1997, 2005, Seismic Provisions for Structural Steel Buildings, American
Institute of Steel Construction, Chicago, Illinois.
AISC, 2006, Steel Construction Manual, 13th Edition, American Institute of Steel
Construction, Chicago, Illinois.
ANSI/AISC, 2005, Specification for Structural Steel Buildings, ANSI/AISC 360-05,
American Institute of Steel Construction, Chicago, Illinois.
ASCE, 2002, Minimum Design Loads for Buildings and Other Structures, ASCE/SEI
7-02, American Society of Civil Engineers, Reston, Virginia.
ASCE, 2006, Minimum Design Loads for Buildings and Other Structures, ASCE/SEI
7-05, including Supplement No. 1, American Society of Civil Engineers,
Reston, Virginia.
ASCE, 2007, Seismic Rehabilitation of Existing Buildings, ASCE/SEI 41-06,
American Society of Civil Engineers, Reston, Virginia.
ASCE, 2010, Minimum Design Loads for Buildings and Other Structures, ASCE/SEI
7-10, American Society of Civil Engineers, Reston, Virginia.
ASTM, 2011, Standard Practice for Classification of Soils for Engineering Purposes
(Unified Soil Classification System), ASTM D2487-11, ASTM International,
West Conshohocken, Pennsylvania.

F-2 References GCR 14-917-26
ATC, 1978, Tentative Provisions for the Development of Seismic Regulations for
Buildings, ATC-3-06 Amended, Applied Technology Council, Redwood
City, California.
BSSC, 2000, Seismic Design Comparisons 2000, The 2000 International Building
Code versus Contemporary Model Codes, Volume 1 Executive Summary,
Inc., Volume 2 Steel, Masonry, and Wood Buildings by J. R. Harris &
Company, and Volume 3 Concrete Buildings by S. K. Ghosh Associates
prepared by the Building Seismic Safety Council for the Federal Emergency
Management Agency, Washington, D.C. Out of print.
CSI, 2013a, Extended Three Dimensional Analysis of Building Systems, ETABS,
Computers and Structures, Inc., Berkeley, California, http://www
.csiamerica.com/etabs2013.
FEMA, 2009a, Quantification of Building Seismic Performance Factors, FEMA
P-695, prepared by the Applied Technology Council for the Federal
Emergency Management Agency, Washington, D.C.
FEMA, 2009b, NEHRP Recommended Seismic Provisions for New Buildings and
Other Structures, 2009 Edition, FEMA P-750, prepared by the Building
Seismic Safety Council of the National Institute of Building Sciences for the
Federal Emergency Management Agency, Washington, D.C.
FEMA, 2010, Earthquake-Resistant Design Concepts – An Introduction to the
NEHRP Recommended Seismic Provisions for New Buildings and Other
Structures, FEMA P-749, prepared by the Building Seismic Safety Council
of the National Institute of Building Sciences for the Federal Emergency
Management Agency, Washington, D.C.
FEMA, 2012a, Seismic Performance Assessment of Buildings, Volume 1 –
Methodology, FEMA P-58-1, prepared by the Applied Technology Council
for the Federal Emergency Management Agency, Washington, D.C.
FEMA, 2012b, Seismic Performance Assessment of Buildings, Volume 2 –
Implementation Guide, FEMA P-58-2, prepared by the Applied Technology
Council for the Federal Emergency Management Agency, Washington, D.C.
FEMA, 2012c, Seismic Performance Assessment of Buildings, Volume 3 –
Supporting Electronic Materials and Background Documentation, FEMA
P-58-3, prepared by the Applied Technology Council for the Federal
Emergency Management Agency, Washington, D.C.
FEMA, 2012d, Seismic Evaluation and Retrofit of Multi-Unit Wood-Frame Buildings
with Weak First Stories, FEMA P-807 Report, prepared by the Applied
Technology Council for the Federal Emergency Management Agency,
Washington, D.C.
GCR 14-917-26 References F-3
French, 2011, personal communication with the NIST Office of Applied Economics.
ICC, 2003, 2009, 2012, International Building Code, International Code Council,
Washington, D.C.
NBS, 1982, Plan for a Trial Design Program to Assess Amended ATC 3-06 Tentative
Provisions for the Development of Seismic Regulations for Buildings, NBSIR
82-2589, National Bureau of Standards, Gaithersburg, Maryland.
SBCCI, 1999, Standard Building Code, SBC 1999, Southern Building Code
Congress International Inc., Birmingham, Alabama.
Shelby County Commission and Memphis City Council, 2005, 20012, Memphis and
Shelby County Building Code Local Amendments, adopted by Shelby County
Commission and Memphis City Council. Available at: http://shelbycountytn.
gov/DocumentCenter/View/12154
TMS, 2008, Building Code Requirements and Specification for Masonry Structures,
TMS 402-08/ACI 530-08/ASCE 5-08, developed by the Masonry Standards
Joint Committee of the Masonry Society, Longmont, Colorado.
Vamvatsikos, D., and Cornell, C.A., 2006, “Direct estimation of the seismic demand
and capacity of oscillators with multi-linear static pushovers through IDA,”
Earthquake Engineering and Structural Dynamics, Vol. 35, Issue 9, pp.
1097-1117.
Weber, S.F., 1985, “Cost impact of the NEHRP Recommended Provisions on the
design and construction of buildings,” in FEMA 84, Societal Implications:
Selected Readings, prepared by the Building Seismic Safety Council for the
Federal Emergency Management Agency, Washington, D.C.


GCR 14-917-26 Project Participants G-1
Project Participants
National Institute of Standards and Technology
John (Jack) R. Hayes, Jr. Engineering Laboratory (MS8604) National Institute of Standards and Technology 100 Bureau Drive Gaithersburg, Maryland 20899 www.NEHRP.gov Matthew Speicher Engineering Laboratory (MS8604) National Institute of Standards and Technology 100 Bureau Drive Gaithersburg, Maryland 20899 www.NEHRP.gov
Steven L. McCabe Engineering Laboratory (MS8604) National Institute of Standards and Technology 100 Bureau Drive Gaithersburg, Maryland 20899 www.NEHRP.gov
NEHRP Consultants Joint Venture
APPLIED TECHNOLOGY COUNCIL 201 Redwood Shores Parkway, Suite 240 Redwood City, California 94065 www.ATCouncil.org
CONSORTIUM OF UNIVERSITIES FOR RESEARCH IN EARTHQUAKE ENGINEERING 1301 S. 46th Street, Building 420 Richmond, California 94804 www.CUREE.org
Joint Venture Management Committee
James R. Harris J.R. Harris & Company 1775 Sherman Street, Suite 2000 Denver, Colorado 80203 Robert Reitherman Consortium of Universities for Research in Earthquake Engineering 1301 S. 46th Street, Building 420 Richmond, California 94804
Christopher Rojahn Applied Technology Council 201 Redwood Shores Parkway, Suite 240 Redwood City, California 94065 Andrew Whittaker University at Buffalo Dept. of Civil, Structural, and Environ. Engin. 230 Ketter Hall Buffalo, New York 14260

G-2 Project Participants GCR 14-917-26
Joint Venture Program Committee
Jon A. Heintz (Program Manager) Applied Technology Council 201 Redwood Shores Parkway, Suite 240 Redwood City, California 94065 Michael Constantinou University at Buffalo Dept. of Civil, Structural, and Environ. Engin. 132 Ketter Hall Buffalo, New York 14260 C.B. Crouse URS Corporation 1501 4th Avenue, Suite 1400 Seattle, Washington 98101
William T. Holmes Rutherford + Chekene 55 Second Street, Suite 600 San Francisco, California 94105 Jack P. Moehle University of California, Berkeley Dept. of Civil and Environmental Engineering 325 Davis Hall MC 1792 Berkeley, California 94720 James R. Harris (ex-officio) Andrew Whittaker (ex-officio)
Project Manager
Ayse Hortacsu Applied Technology Council 201 Redwood Shores Parkway, Suite 240 Redwood City, California 94065
Project Technical Committee
James R. Harris (Technical Director) J.R. Harris & Company 1775 Sherman Street, Suite 2000 Denver, Colorado 80203 David Bonneville Degenkolb Engineers 235 Montgomery Street, Suite 500 San Francisco, California 94104 Ryan Kersting Buehler & Buehler Structural Engineers, Inc. 600 Q Street, Suite 200 Sacramento, California 95811
John Lawson California Polytechnic University San Luis Obispo Architectural Engineering Dept. 1 Grand Avenue San Luis Obispo, California 93407 Peter Morris Davis Langdon 1331 Garden Highway, Suite 310 Sacramento, California 95833
Working Group Members
Kevin Cissna Buehler & Buehler Structural Engineers, Inc. 600 Q Street, Suite 200 Sacramento, California 95811 Erica Hays Degenkolb Engineers 235 Montgomery Street, Suite 500 San Francisco, California 94104
Evan Hammel J.R. Harris & Company 1775 Sherman Street, Suite 2000 Denver, Colorado 80203 Guy Mazotta Degenkolb Engineers 235 Montgomery Street, Suite 500 San Francisco, California 94104
GCR 14-917-26 Project Participants G-3
Albert Misajon Davis Langdon 1331 Garden Highway, Suite 310 Sacramento, California 95833 Fred Rutz J.R. Harris & Company 1775 Sherman Street, Suite 2000 Denver, Colorado 80203
Gene Stevens J.R. Harris & Company 1775 Sherman Street, Suite 2000 Denver, Colorado 80203
Project Review Panel
Michael E. Corrin Stanley D. Lindsey & Associates 5500 Maryland Way, Suite 250 Brentwood, Tennessee 37027 Ashraf Elsayed Geotechnology, Inc. 11816 Lackland Road, Suite 150 Saint Louis, Missouri 63146 Julie C. Furr CSA Engineering, Inc. 8370 Highway 51 North Suite 116 Millington, Tennessee 38053 Richard W. Howe P.O. Box 3250 Memphis, Tennessee 38173 Richard T. Meena Montgomery Martin Contractors 8245 Tournament Drive, Suite 300 Memphis, Tennessee 38125
Luke Newman Montgomery Martin Contractors 8245 Tournament Drive, Suite 300 Memphis, Tennessee 38125 Robert Norcross Looney Ricks Kiss 175 Toyota Plaza, Suite 500 Memphis, Tennessee 38103 Robert B. Paullus Paullus Structural Consultants 6315 Goodman Road, Suite 4 Olive Branch, Mississippi 38654 John Walpole Memphis and Shelby County Office of Planning and Development 6465 Mullins Station Road Memphis, Tennessee 38134
FEMA P-58 Consultants
Scott Hagie John A. Martin & Associates, Inc. 950 South Grand Avenue Los Angeles, California 90015
Andrew T. Merovich A. T. Merovich & Associates, Inc. 1950 Addison Street, Suite 205 Berkeley, California 94704