Embed Size (px)
Citation preview
Climate Change, Texas, and
the Limits of Confidence
John Nielsen-Gammon
Dept. of Atmospheric Sciences
Texas A&M University
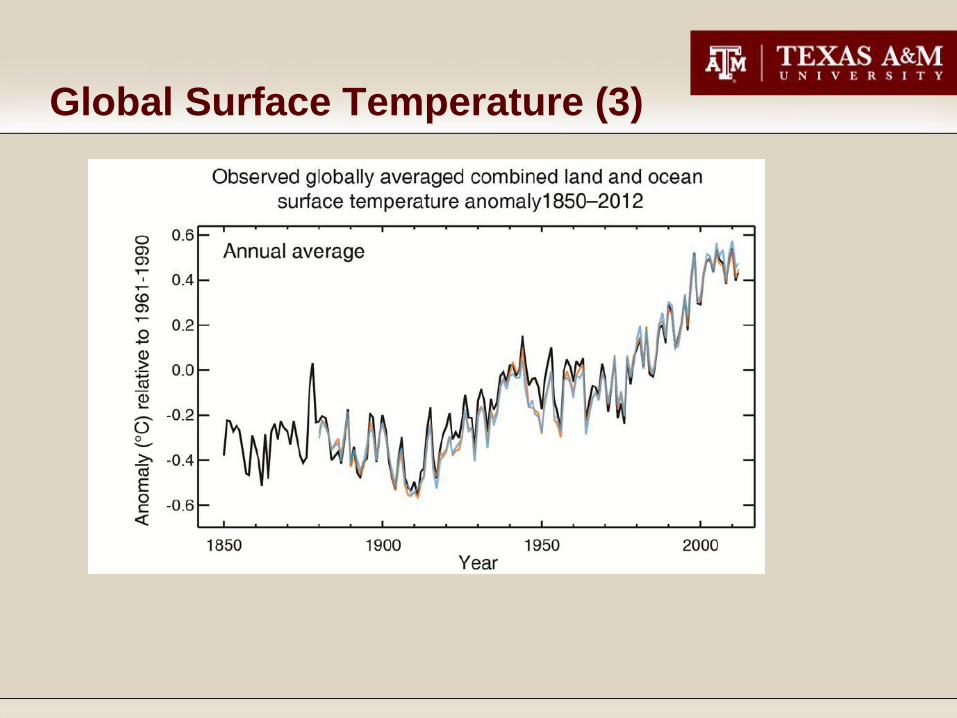
Global Surface Temperature (3)
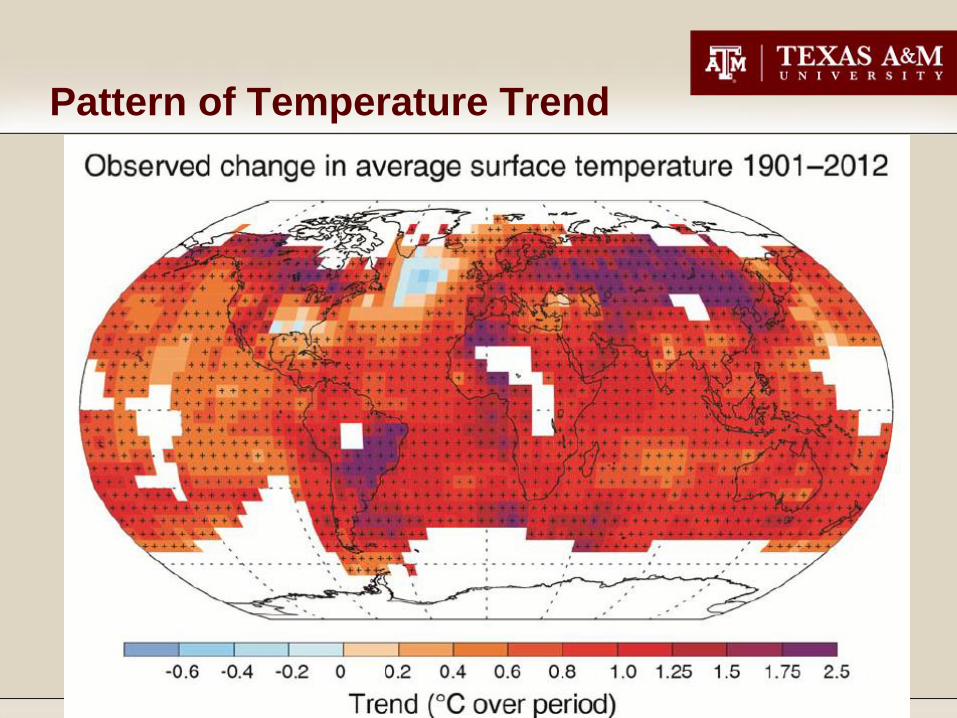
Pattern of Temperature Trend

Regional Temperatures, 1-2000
(PAGES 2013)
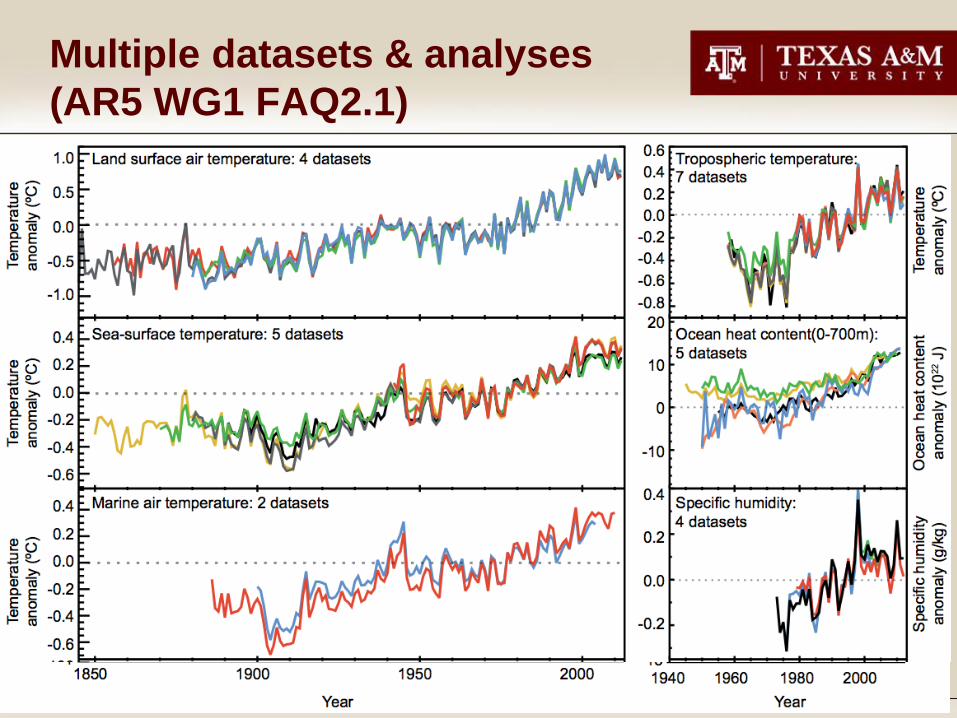
Multiple datasets & analyses
(AR5 WG1 FAQ2.1)

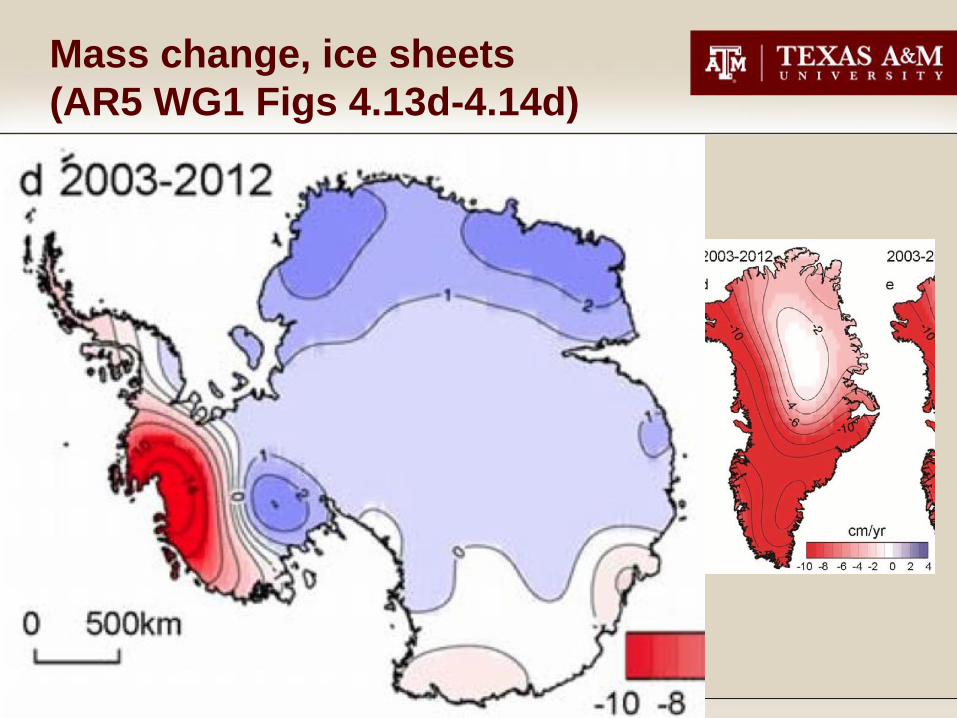
Mass change, ice sheets
(AR5 WG1 Figs 4.13d-4.14d)

Changes in Water and Ice
(AR5 WG1 FAQ2.1)

Global Surface Temperature (3)
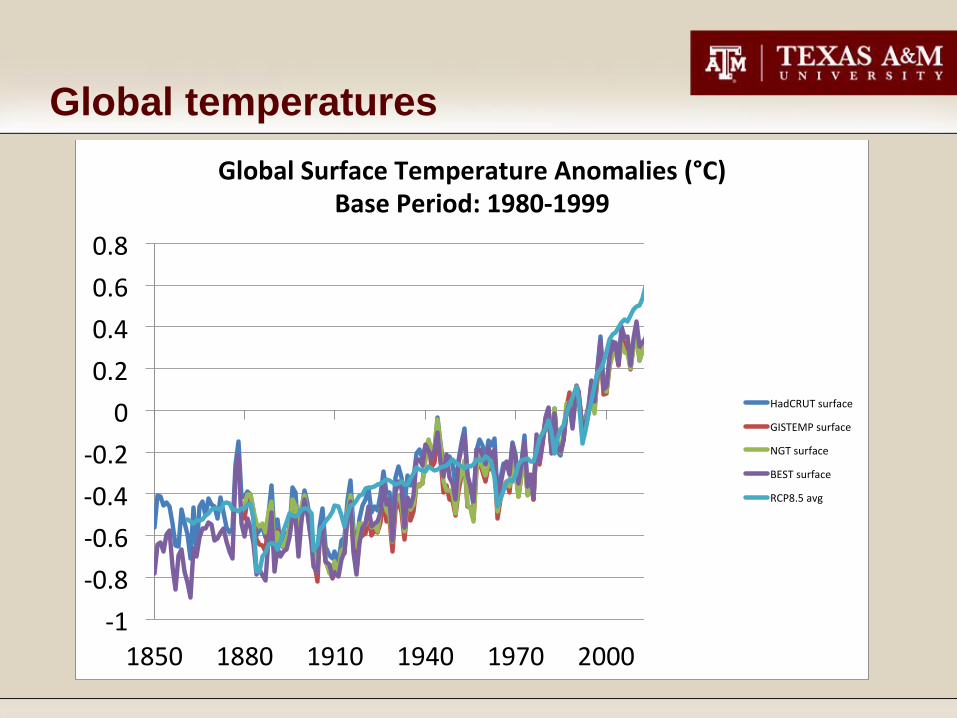
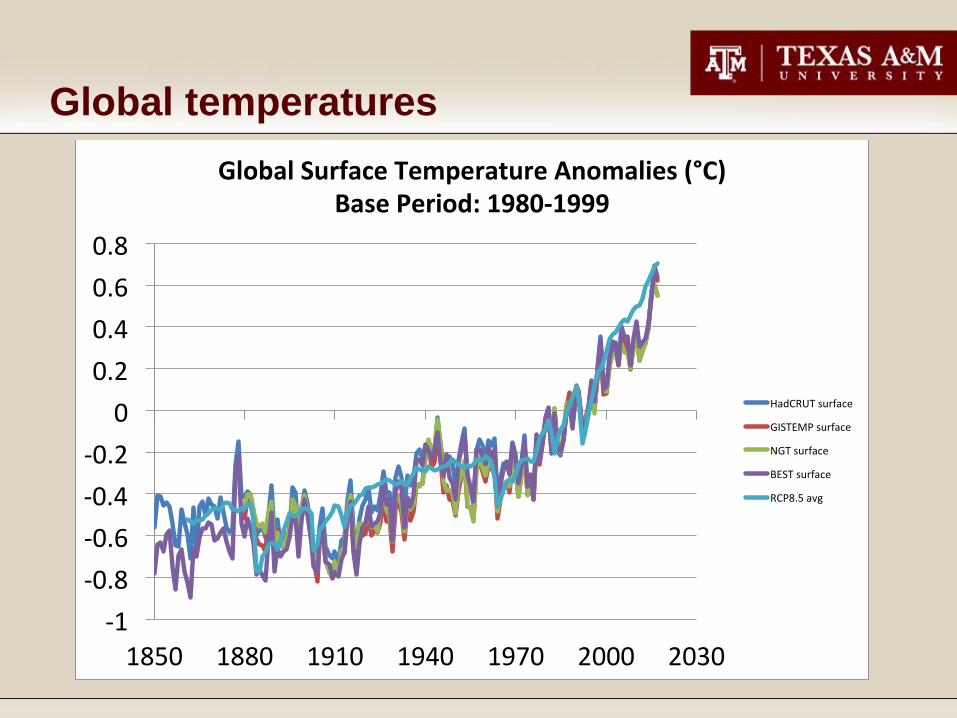
Global temperatures
-1
-0.8
-0.6
-0.4
-0.2
0
0.2
0.4
0.6
0.8
1850 1880 1910 1940 1970 2000 2030
GlobalSurfaceTemperatureAnomalies(°C)BasePeriod:1980-1999
HadCRUTsurface
GISTEMPsurface
NGTsurface
BESTsurface
RCP8.5avg
Global temperatures
-1
-0.8
-0.6
-0.4
-0.2
0
0.2
0.4
0.6
0.8
1850 1880 1910 1940 1970 2000 2030
GlobalSurfaceTemperatureAnomalies(°C)BasePeriod:1980-1999
HadCRUTsurface
GISTEMPsurface
NGTsurface
BESTsurface
RCP8.5avg

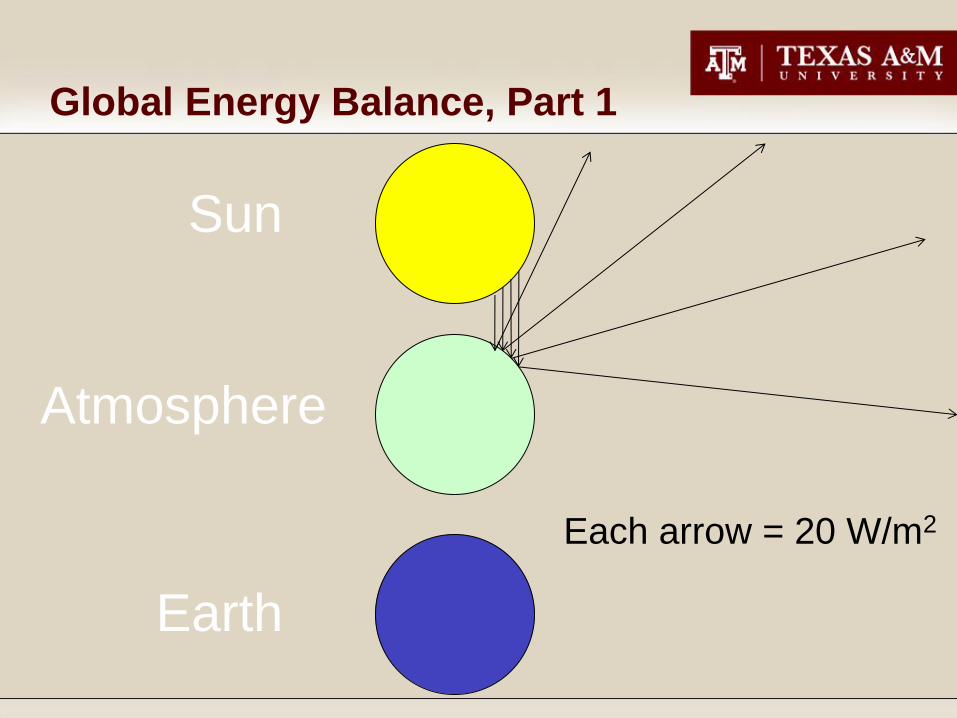
Global Energy Balance, Part 1
Sun
Atmosphere
Each arrow = 20 W/m2
Earth
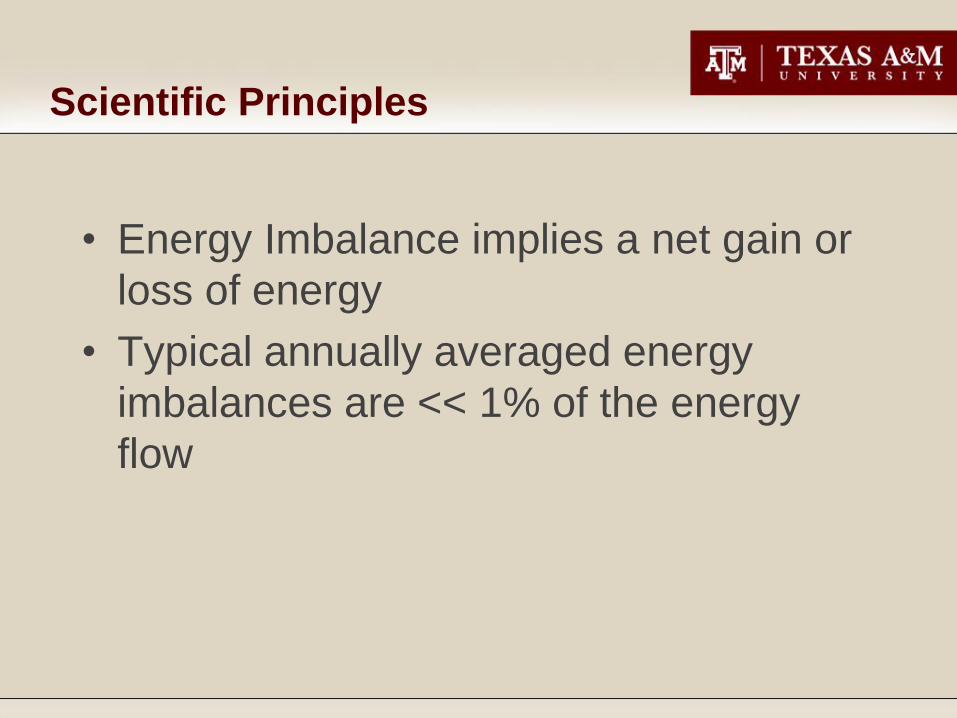
Scientific Principles
• Energy Imbalance implies a net gain or
loss of energy
• Typical annually averaged energy
imbalances are << 1% of the energy
flow

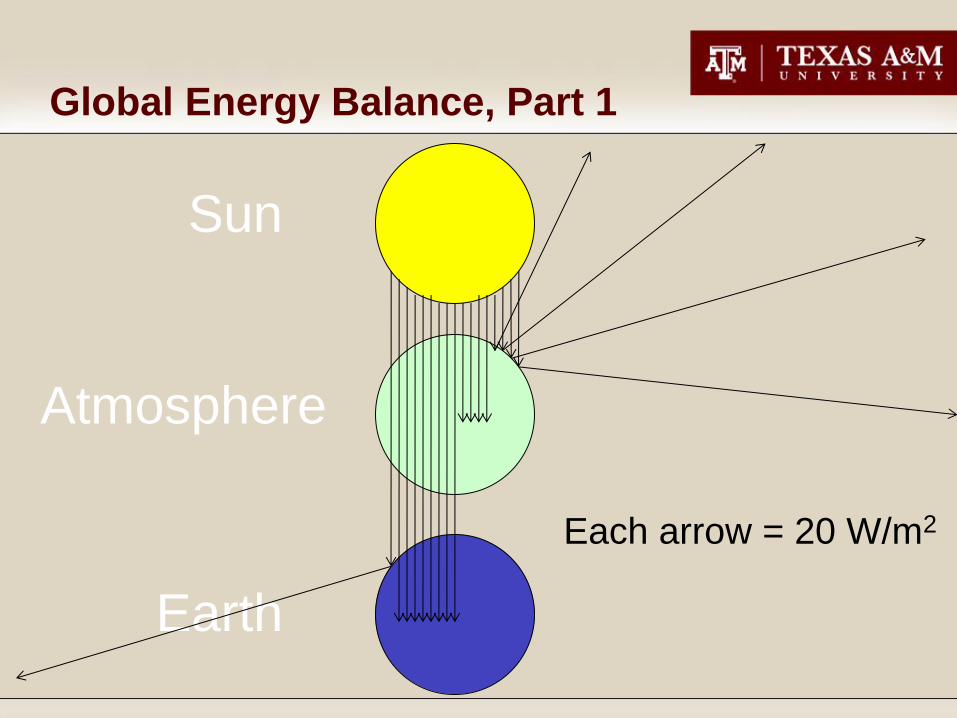
Global Energy Balance, Part 1
Sun
Atmosphere
Each arrow = 20 W/m2
Earth
Global Energy Balance, Part 1
Sun
Atmosphere
Each arrow = 20 W/m2
Earth

Global Energy Balance, Part 1
Sun
Atmosphere
Earth
Each arrow = 20 W/m2

Global Energy Balance, Part 1
Sun
Atmosphere
Earth
Each arrow = 20 W/m2
Global Energy Balance, Part 1
Sun
Atmosphere
Earth
Each arrow = 20 W/m2
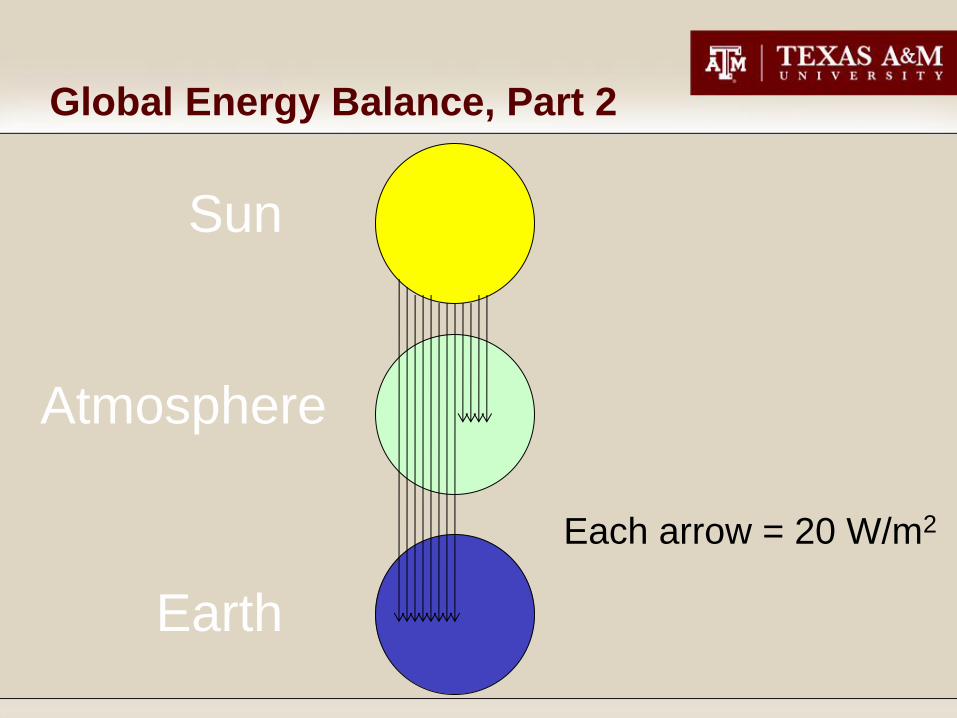
Global Energy Balance, Part 2
Sun
Atmosphere
Earth
Each arrow = 20 W/m2

Global Energy Balance, Part 2
Sun
Atmosphere
Earth
Each arrow = 20 W/m2

Global Energy Balance, Part 2
Sun
Atmosphere
Earth
Each arrow = 20 W/m2

Global Energy Balance, Part 2
Sun
Atmosphere
Earth
Each arrow = 20 W/m2

Global Energy Balance, Part 3
Sun
Atmosphere
Earth
To maintain heat flow
into atmosphere, Earth
must warm too

Detection and Attribution
• Identify trend: detection
• Compare with distinct patterns in space
and time caused by different forcing
agents
• Apportion role of different forcing
agents: attribution

Evolution of Estimated Forcings
(AR5 WG1 Fig. 8.18)


Global temperatures
-1
-0.8
-0.6
-0.4
-0.2
0
0.2
0.4
0.6
0.8
1850 1880 1910 1940 1970 2000 2030
GlobalSurfaceTemperatureAnomalies(°C)BasePeriod:1980-1999
HadCRUTsurface
GISTEMPsurface
NGTsurface
BESTsurface
RCP8.5avg
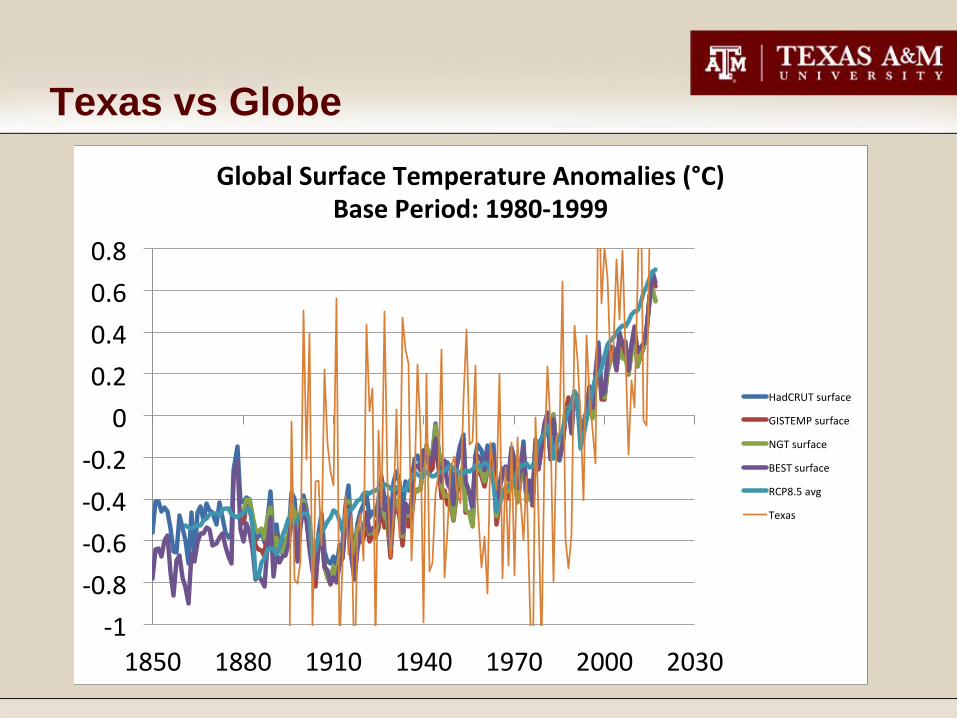
Texas vs Globe
-1
-0.8
-0.6
-0.4
-0.2
0
0.2
0.4
0.6
0.8
1850 1880 1910 1940 1970 2000 2030
GlobalSurfaceTemperatureAnomalies(°C)BasePeriod:1980-1999
HadCRUTsurface
GISTEMPsurface
NGTsurface
BESTsurface
RCP8.5avg
Texas

Texas 5-yr Avg vs Globe
-1
-0.8
-0.6
-0.4
-0.2
0
0.2
0.4
0.6
0.8
1850 1880 1910 1940 1970 2000 2030
GlobalSurfaceTemperatureAnomalies(°C)BasePeriod:1980-1999
HadCRUTsurface
GISTEMPsurface
NGTsurface
BESTsurface
RCP8.5avg
Texas5yr
Extreme Weather
• Short definition: Weather that’s
newsworthy
• Long definition: two kinds
– Weather that’s extremely unlikely
– Weather that’s unhealthy or damaging
– (The same event often fits both definitions)


Melissa Phillip, Houston Chronicle
0
1
2
3
4
5
6
7
8
9
Rainfall(inches)
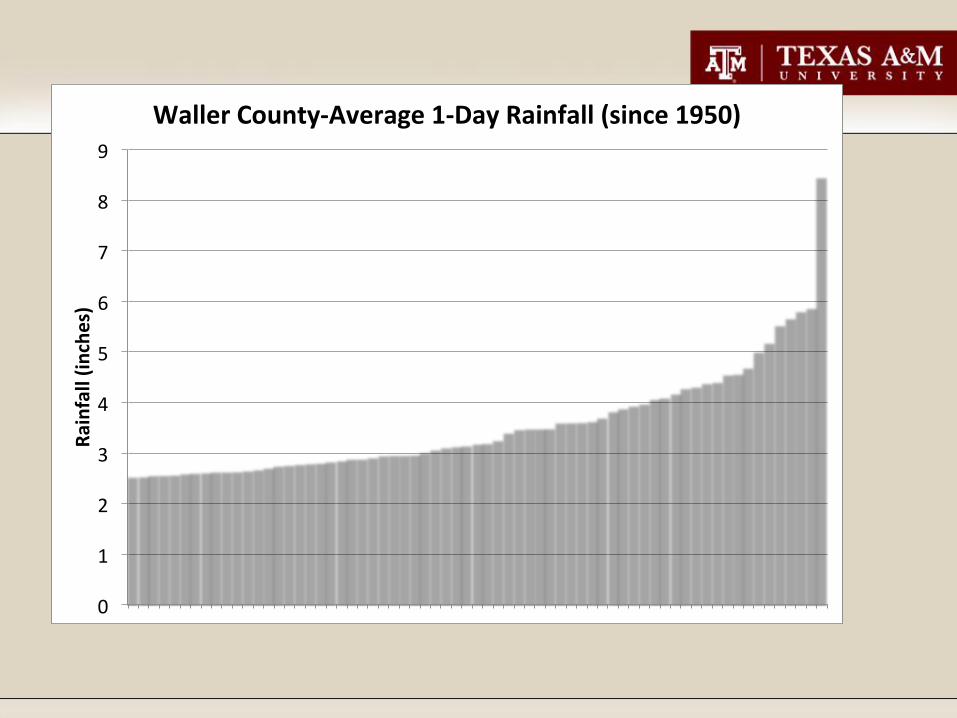
WallerCounty-Average1-DayRainfall(since1950)
0
1
2
3
4
5
6
7
8
9
Rainfall(inches)
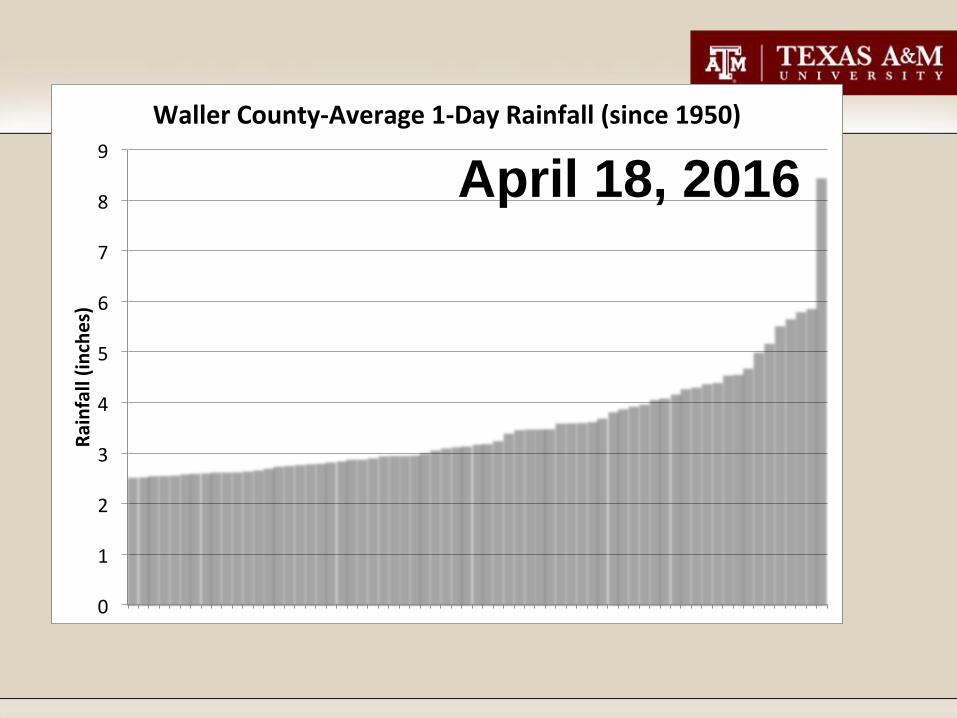
WallerCounty-Average1-DayRainfall(since1950)
April 18, 2016
0
1
2
3
4
5
6
7
8
9
Rainfall(inches)
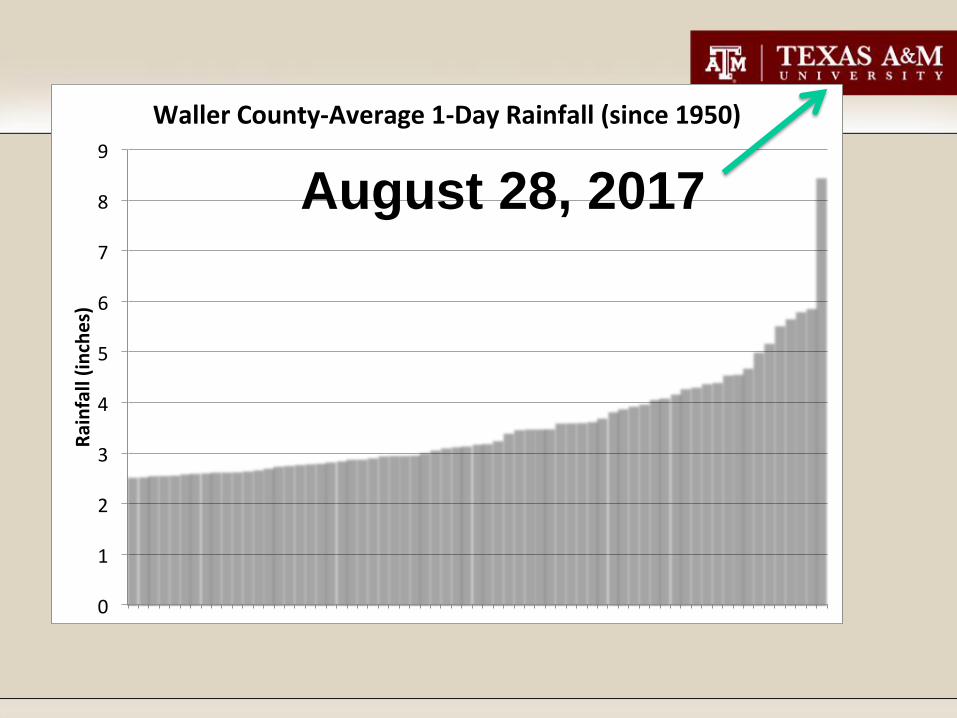
WallerCounty-Average1-DayRainfall(since1950)
August 28, 2017
0
1
2
3
4
5
6
7
8
9
Rainfall(inches)
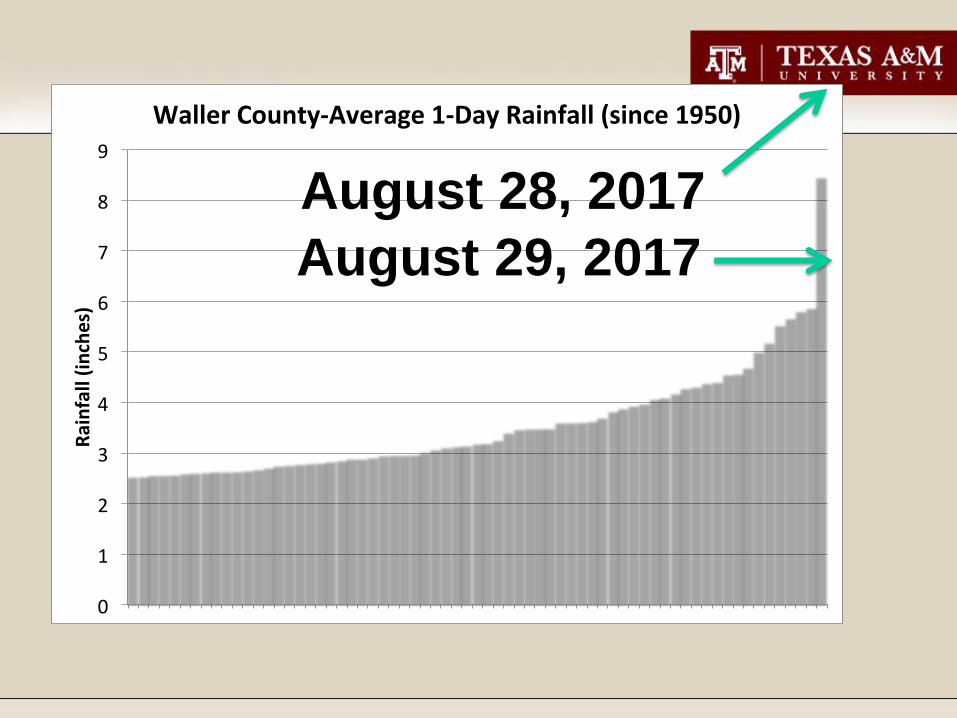
WallerCounty-Average1-DayRainfall(since1950)
August 28, 2017
August 29, 2017
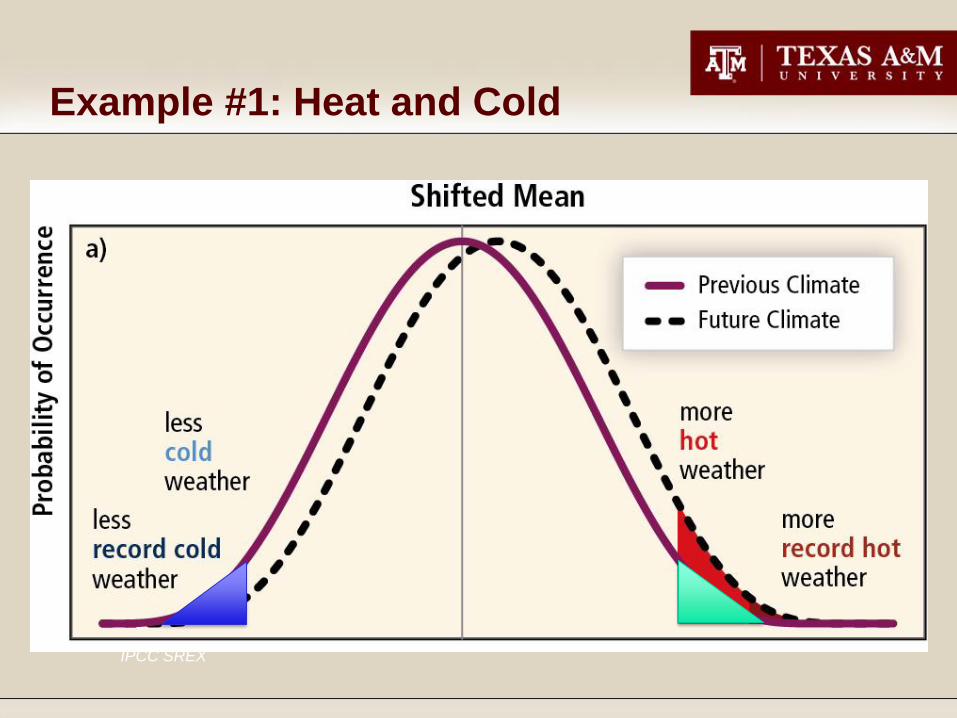
Example #1: Heat and Cold
IPCC SREX

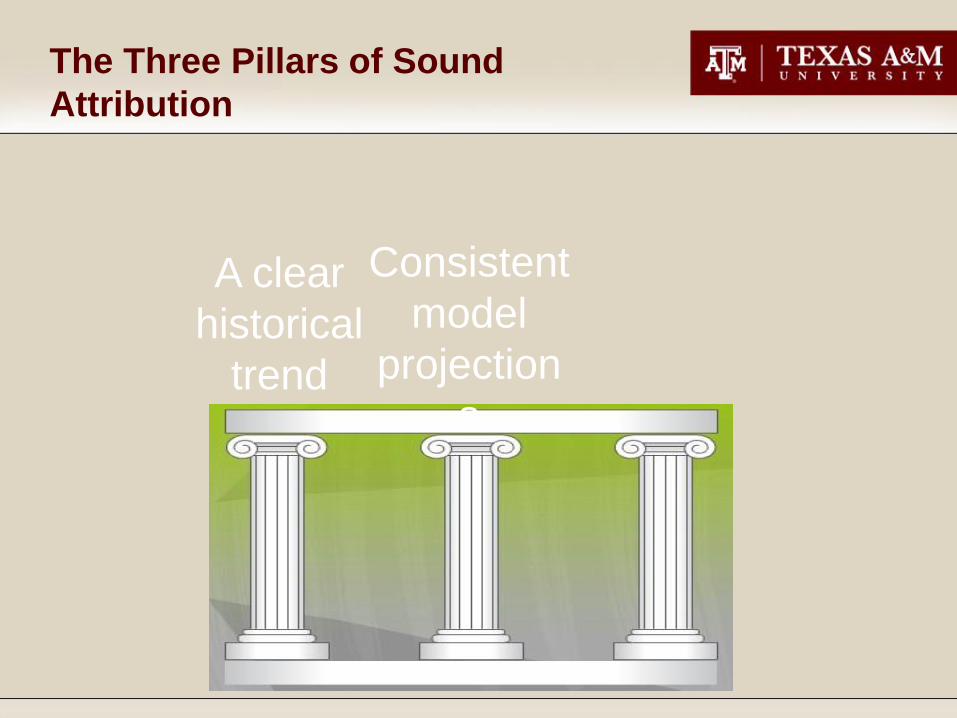
The Three Pillars of Sound
Attribution

The Three Pillars of Sound
Attribution
A clear
historical
trend
The Three Pillars of Sound
Attribution
A clear
historical
trend
Consistent
model
projection
s
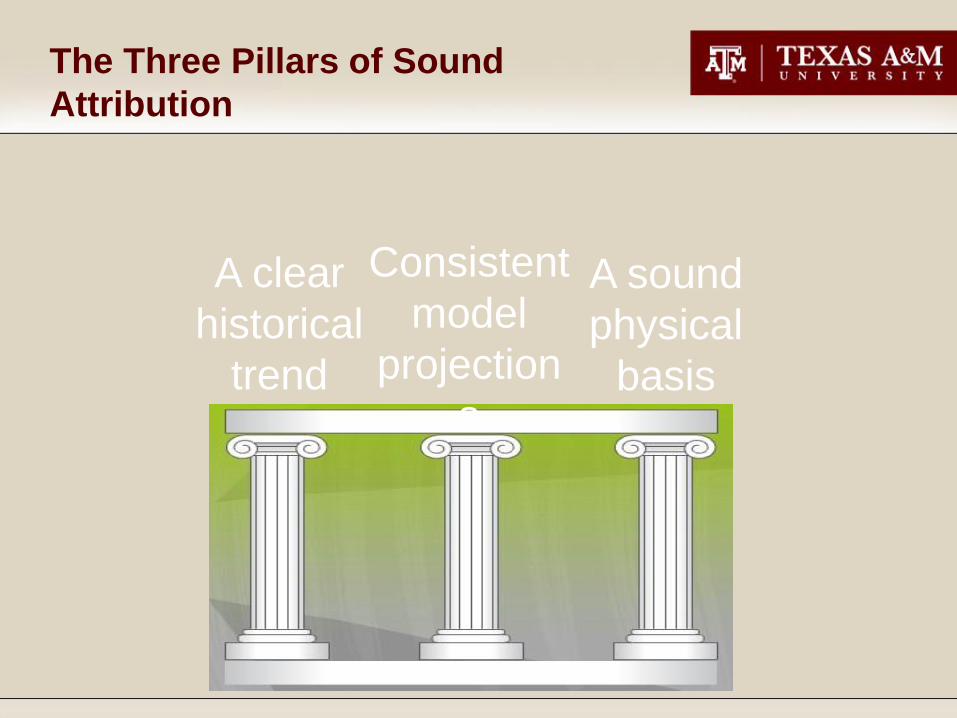
The Three Pillars of Sound
Attribution
A clear
historical
trend
A sound
physical
basis
Consistent
model
projection
s

Example #2: Heavy Rain

The Faucet
• Climate change’s
thermodynamic impact:
the size of the pipe
+ 7% per °C
• Climate change’s
dynamic impact: turning
the handle

The Faucet
• The size of the pipe
matters most when the
faucet is wide open
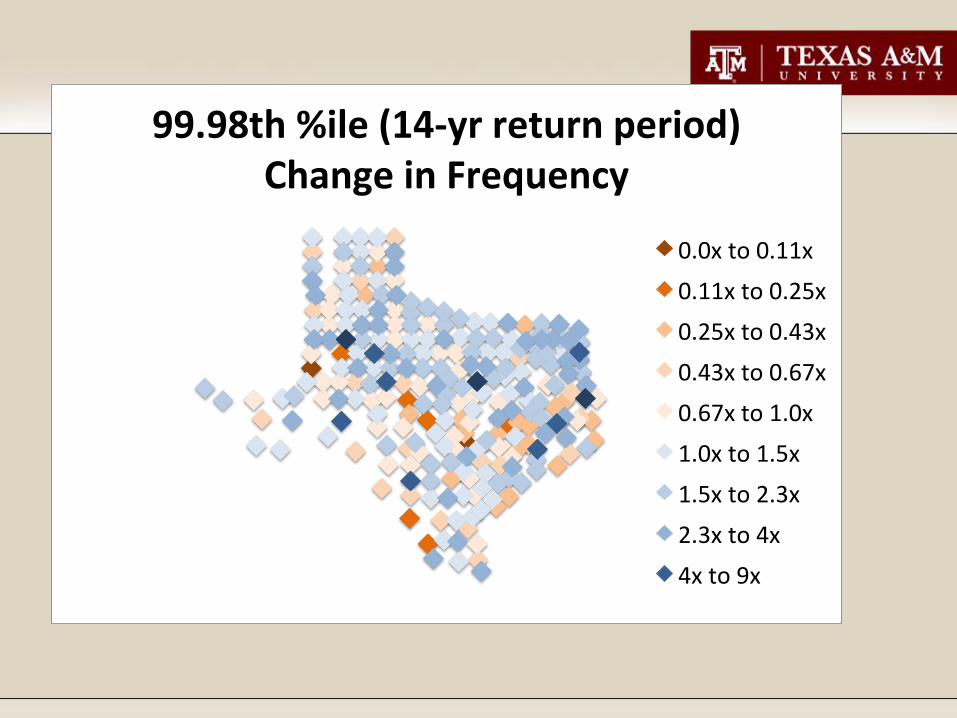
99.98th%ile(14-yrreturnperiod)ChangeinFrequency
0.0xto0.11x
0.11xto0.25x
0.25xto0.43x
0.43xto0.67x
0.67xto1.0x
1.0xto1.5x
1.5xto2.3x
2.3xto4x
4xto9x

95% confidence interval using effective degrees of freedom estimated following D. A. Griffith &
Z. Zhang (1999): Computational Simplifications Needed for Efficient Implementation of Spatial
Statistical Techniques in a GIS, Geographic Information Sciences, 5:2, 97-105, DOI:
10.1080/10824009909480519
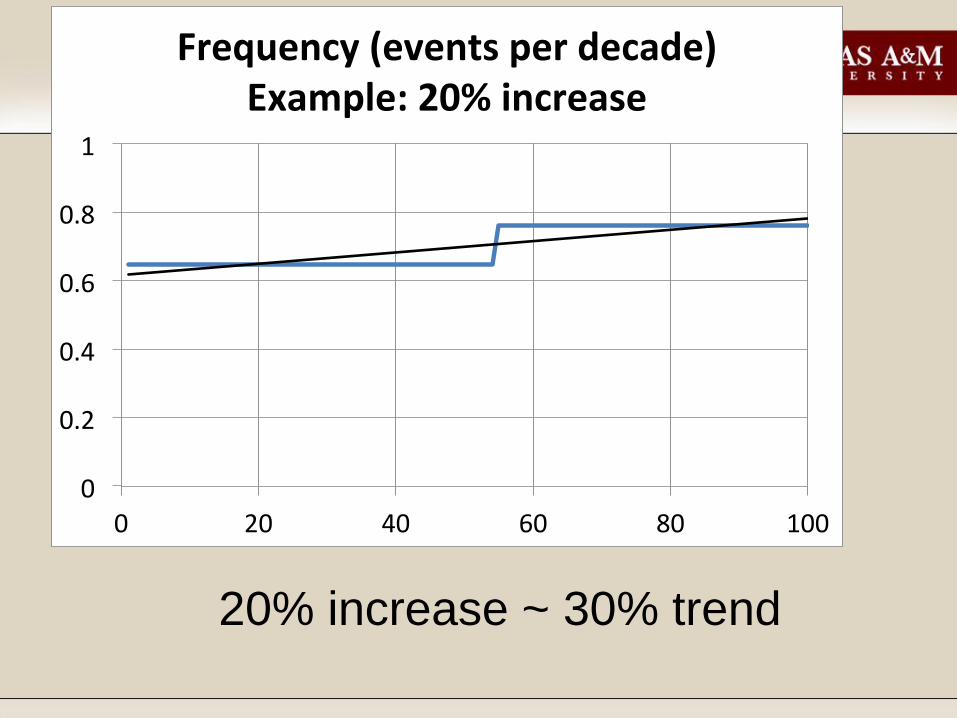
0
0.2
0.4
0.6
0.8
1
0 20 40 60 80 100
Frequency(eventsperdecade)Example:20%increase
20% increase ~ 30% trend

Arid
W
et
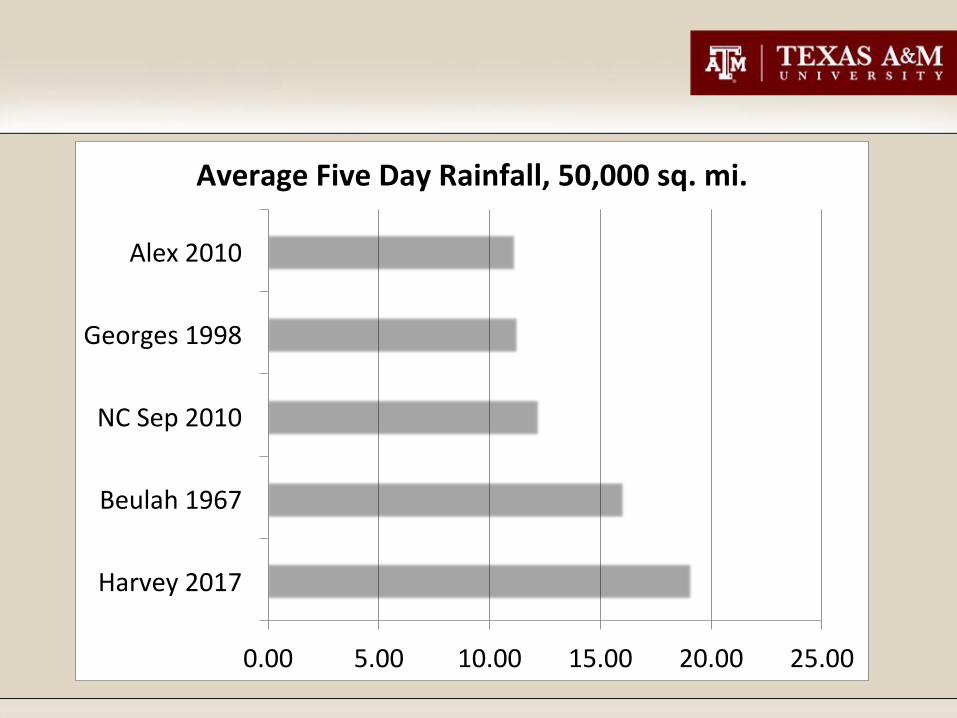
0.00 5.00 10.00 15.00 20.00 25.00
Harvey2017
Beulah1967
NCSep2010
Georges1998
Alex2010
AverageFiveDayRainfall,50,000sq.mi.

0.00 10.00 20.00 30.00 40.00 50.00
Harvey2017
LAAug1940
TXJun1899
Beulah1967
Claude e1979
AverageFiveDayRainfall,2,000sq.mi.

0.00 10.00 20.00 30.00 40.00 50.00
Harvey2017
LAAug1940
TXJun1899
Beulah1967
Claude e1979
AverageFiveDayRainfall,2,000sq.mi.
Harris
Coun
ty: 3
4”

Example #3: Hurricanes

Hurricanes: The Balance of
Evidence
• Increase in peak intensity (1.5 pillars)
• Decrease in frequency (1 pillar)
– …but spatially variable (1.5 pillars)

Did Harvey stall because of
climate change?
20
22
24
26
28
30
32
34
36
38
40
-100 -95 -90 -85 -80 -75
Lat
H4Harvey2017Aug
TSAllison2001Jun
TSAllison1989Jun
TS1908#4Jul
H1Juan1985Oct
2005
TSAlberto1994
H31871#3Aug
1980
1941
1938
1953
H11904#1Oct
Coast
Resources
• IPCC.ch
– Special report on extremes (SREX)
– Fifth assessment report, working group 1
(AR5 WG1)
• National climate assessment
• News items
– AP + USA TODAY + NYTIMES ~ Network
news
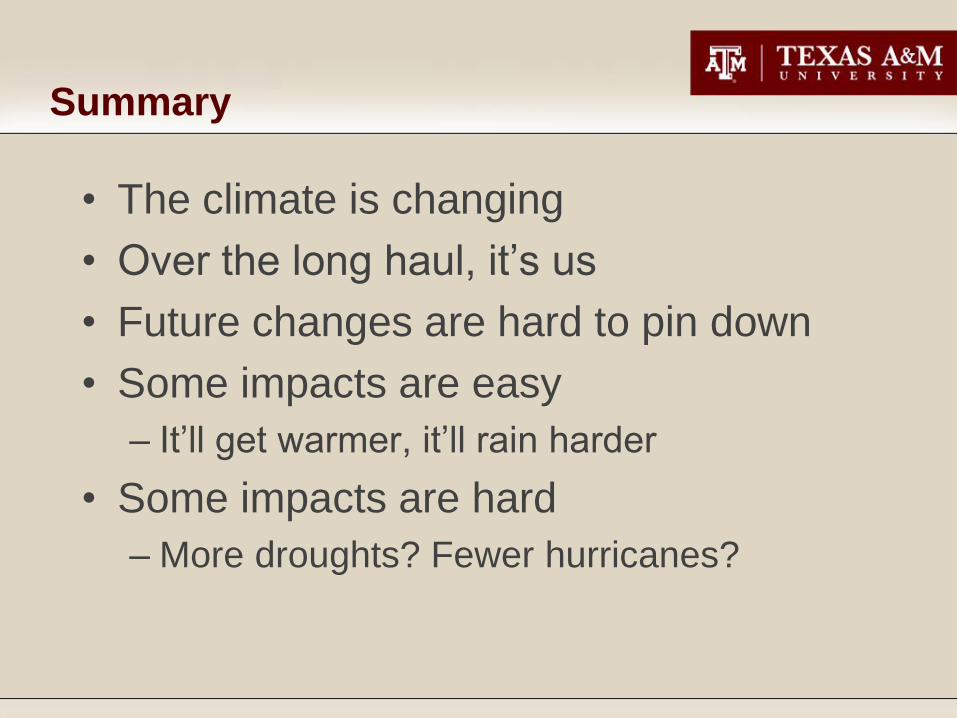
Summary
• The climate is changing
• Over the long haul, it’s us
• Future changes are hard to pin down
• Some impacts are easy
– It’ll get warmer, it’ll rain harder
• Some impacts are hard
– More droughts? Fewer hurricanes?

Contact Information
• John W. Nielsen-Gammon
• 979-862-2248
• http://climatexas.tamu.edu