Embed Size (px)
Citation preview
Statistics Netherlands
Paper Quality and Risk Management (201202)
The Hague/Heerlen, 2012
112Peter van Nederpelt and Piet Daas
49 Factors that Influence the Quality of Secondary Data Sources
Explanation of symbols
. data not available
* provisional � gure
** revised provisional � gure (but not de� nite)
x publication prohibited (con� dential � gure)
– nil
– (between two � gures) inclusive
0 (0.0) less than half of unit concerned
empty cell not applicable
2011–2012 2011 to 2012 inclusive
2011/2012 average for 2011 up to and including 2012
2011/’12 crop year, � nancial year, school year etc. beginning in 2011 and ending in 2012
2009/’10–2011/’12 crop year, � nancial year, etc. 2009/’10 to 2011/’12 inclusive
Due to rounding, some totals may not correspond with the sum of the separate � gures.
PublisherStatistics NetherlandsHenri Faasdreef 3122492 JP The Hague
Prepress Statistics NetherlandsGrafimedia
CoverTeldesign, Rotterdam
InformationTelephone +31 88 570 70 70Telefax +31 70 337 59 94Via contact form: www.cbs.nl/information
Where to orderE-mail: [email protected] +31 45 570 62 68
Internetwww.cbs.nl
ISSN: 1572-0314
© Statistics Netherlands, The Hague/Heerlen, 2012.Reproduction is permitted, provided Statistics Netherlands is quoted as source.
60256201202 X-46
49 FACTORS THAT INFLUENCE THE QUALITY OF SECONDARY DATA
SOURCES
Peter W.M. van Nederpelt and Piet J.H. Daas
Summary: There are many papers which have been published about the quality of secondary data sources. Less is known about factors that influence the quality of secondary data sources. This paper identifies those factors with the use of the concepts of Object-oriented Quality and Risk Management (OQRM) and expert knowledge. It is very essential to know these factors as they can - with some effort - be managed by taking precautionary actions and thereby lead to improved quality of secondary data sources.
Keywords: Quality of secondary data sources, Data supplier, Statistical agency, Object-oriented Quality and Risk Management (OQRM).
1
Content
Content ..............................................................................................................................1
1. Introduction ..............................................................................................................2
1.1. Roles and data flows........................................................................................2
1.2. Process flows ...................................................................................................4
1.3. Factors or focus areas ......................................................................................4
2. Methodology ............................................................................................................5
3. Results ......................................................................................................................6
3.1. Objects and focus areas ...................................................................................6
3.2. Dependencies.................................................................................................15
4. Discussion ..............................................................................................................16
5. Conclusion..............................................................................................................16
References.......................................................................................................................17
Appendix A: Focus areas in other papers........................................................................19
2
1. Introduction
Data quality is important for statistical institutes, not only in relation to the data they produce, but also because they use more and more secondary data sources to produce statistics. Examples of secondary data sources, data produced by others, are administrative data, transactional data and data from the Internet.
In the new version of the Code of Practice (Eurostat, 2011), three indicators are added concerning the quality of administrative data.1 This makes clear that the quality of secondary data is important in the European Statistical System (ESS).
Several papers have been published on the quality of data sources in general and the composition of quality, i.e., its dimensions (appendix A). Therefore, data quality as such will not be discussed in this paper. Less is known about the factors that influence the quality of data sources. This is the focus of the research which is outlined in this paper.
Our research question is:
Which factors influence the quality of secondary data sources?
Target group for this paper is the staff of the data supplier that produces the data for the statistical agency and the staff of the statistical agency that works closely with the data supplier. This paper could improve the discussion about data quality.
1.1. Roles and data flows
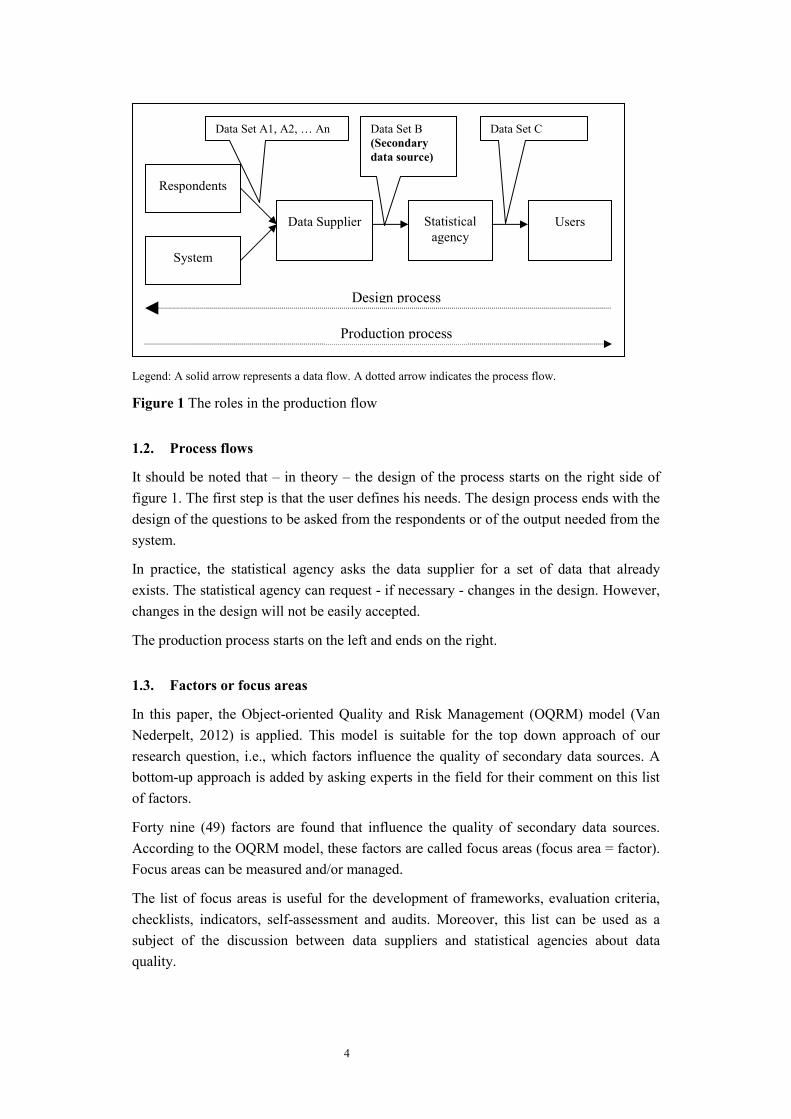
Organizations and systems are involved in the production and processing of data sources. For this study, we distinguish the roles of the respondent, the data supplier, the statistical agency and the user.
Respondents
Respondents are persons or organizations that deliver data sets (i.e., responses, completed forms) to data suppliers (data set A in figure 1). Some of the examples of respondents are tax payers, households and companies.
System
Systems collect data automatically and deliver them to the data supplier (data set A in figure 1). Some of the examples of systems are supermarket’s cash registers, mobile phone networks and Internet robots. A system also includes data communication stretching from the measuring device to the computers of the data suppliers.
1 Indicator 8.7: Statistical authorities are involved in the design of administrative data in order to make administrative data more suitable for statistical purposes. Indicator 8.8: Agreements are made with owners of administrative data which set out their shared commitment to the use of these data for statistical purposes. Indicator 8.9: Statistical authorities cooperate with owners of administrative data in assuring data quality.
3
Data suppliers
Data suppliers collect data from respondents and systems, and they deliver the data to statistical agencies (data set B in figure 1). Some of the examples of data suppliers are tax authorities, municipalities and supermarkets.
Statistical agencies
Statistical agencies aggregate and combine data which results in the production of statistical information (data set C in figure 1). This information is made available to users. Statistical agencies may combine more than one set of data in order to compile statistical information (statistics). Their task is to estimate of a specific phenomenon in society. This may imply the use of statistical methods, such as, weighing, imputation, editing and transforming concepts.
Users
Users need data provided by statistical agencies as a source of information for decision making (data set C in figure 1). Some of the examples of users are ministries, consumer organisations and ordinary people. For example, data about social security is used by the government for distribution of financial resources to municipalities.
The roles in the production and processing of data sources and the data flows are illustrated in figure 1. It shows that the role of a data supplier is different from that of a statistical agency. This is an essential difference and clearly indicates that - in this chain - data is delivered from one entity (i.e., the supplier) to another one (i.e., the statistical agency).
The statistical agency is highly dependent on the quality of the data source produced by the data supplier. Managing the quality of the data source is in particular a responsibility of the data supplier. The responsibility of the statistical agency is to measure the quality of the data source and to come to agreements with the data supplier about the quality of the data.
Sometimes, the statistical agency can guide the data supplier in his responsibility for data quality. For example, Statistics Netherlands maintains specific instructions for municipalities as supplier of data about social security. These instructions contain definitions of variables and code lists.
4
Legend: A solid arrow represents a data flow. A dotted arrow indicates the process flow.
Figure 1 The roles in the production flow
1.2. Process flows
It should be noted that – in theory – the design of the process starts on the right side of figure 1. The first step is that the user defines his needs. The design process ends with the design of the questions to be asked from the respondents or of the output needed from the system.
In practice, the statistical agency asks the data supplier for a set of data that already exists. The statistical agency can request - if necessary - changes in the design. However, changes in the design will not be easily accepted.
The production process starts on the left and ends on the right.
1.3. Factors or focus areas
In this paper, the Object-oriented Quality and Risk Management (OQRM) model (Van Nederpelt, 2012) is applied. This model is suitable for the top down approach of our research question, i.e., which factors influence the quality of secondary data sources. A bottom-up approach is added by asking experts in the field for their comment on this list of factors.
Forty nine (49) factors are found that influence the quality of secondary data sources. According to the OQRM model, these factors are called focus areas (focus area = factor). Focus areas can be measured and/or managed.
The list of focus areas is useful for the development of frameworks, evaluation criteria, checklists, indicators, self-assessment and audits. Moreover, this list can be used as a subject of the discussion between data suppliers and statistical agencies about data quality.
Respondents
Data Supplier Statistical agency
Users
Data Set A1, A2, … An Data Set B (Secondary data source)
Data Set C
System
Design process
Production process
5
2. Methodology
First, in our research, focus areas are identified 2. A focus area is a concept of the Object-oriented Quality and Risk Management (OQRM). These are combinations of an object and an accompanying attribute.3
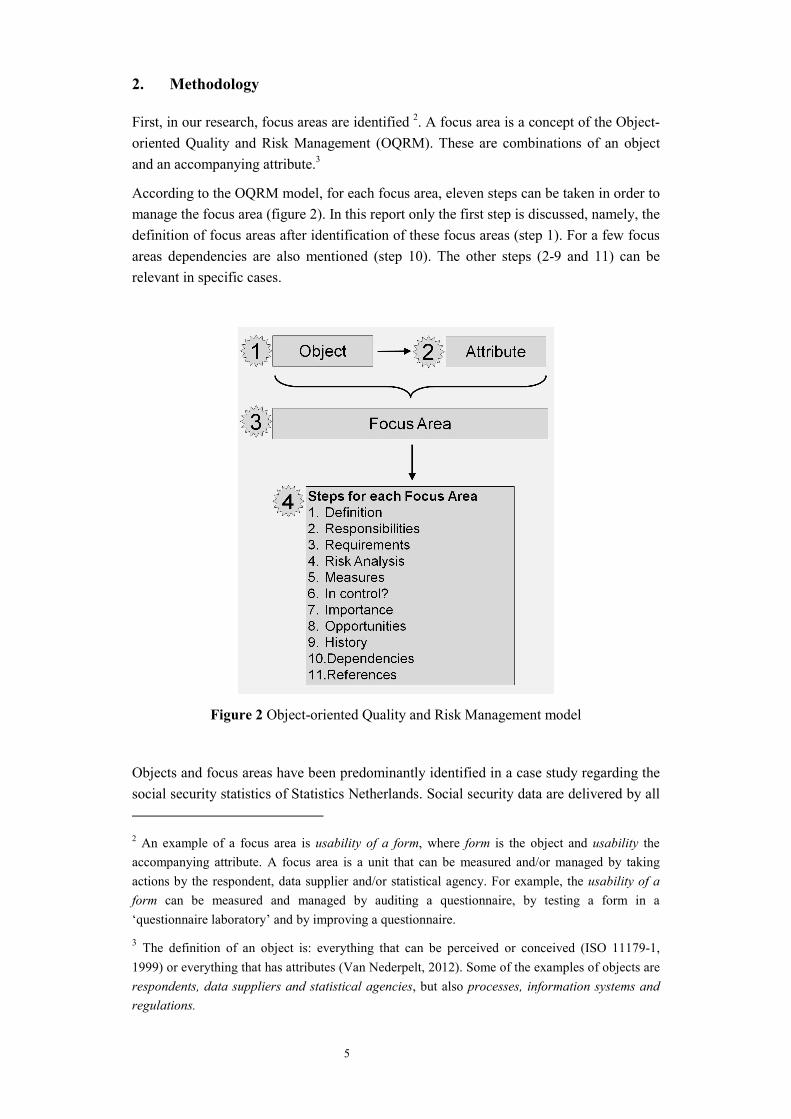
According to the OQRM model, for each focus area, eleven steps can be taken in order to manage the focus area (figure 2). In this report only the first step is discussed, namely, the definition of focus areas after identification of these focus areas (step 1). For a few focus areas dependencies are also mentioned (step 10). The other steps (2-9 and 11) can be relevant in specific cases.
Figure 2 Object-oriented Quality and Risk Management model
Objects and focus areas have been predominantly identified in a case study regarding the social security statistics of Statistics Netherlands. Social security data are delivered by all 2 An example of a focus area is usability of a form, where form is the object and usability the accompanying attribute. A focus area is a unit that can be measured and/or managed by taking actions by the respondent, data supplier and/or statistical agency. For example, the usability of a form can be measured and managed by auditing a questionnaire, by testing a form in a ‘questionnaire laboratory’ and by improving a questionnaire.
3 The definition of an object is: everything that can be perceived or conceived (ISO 11179-1, 1999) or everything that has attributes (Van Nederpelt, 2012). Some of the examples of objects are respondents, data suppliers and statistical agencies, but also processes, information systems and regulations.
6
Dutch municipalities to Statistics Netherlands. In this case, the municipalities are the data suppliers for Statistics Netherlands, which is the statistical agency.
Second, the list of focus areas is complemented by the proficiency of six experts in the field of data sources and its quality.4 These experts have been asked to comment on this paper, including the list of focus areas.
All focus areas are clustered in categories in order to structure the list of focus areas. Clustering criteria used are predominantly based on the relation between the focus areas and the respondent, the system, the data supplier and the statistical agency, respectively. Focus areas that did not conform to these criteria were placed in a rest category, namely, Regulations, agreements and cooperation.
A glossary (SDMX, 2009) is used to search for definitions of objects and attributes. If no defintion was found, the definition was composed by the authors.
3. Results
As a result of the approach described in the previous section a list of 23 objects and 49 focus areas were identified which are presented below. Furthermore, some examples of dependencies are given.
3.1. Objects and focus areas
The 49 focus areas that were found are clustered in the next five categories:
� Respondent (table 1)
� System (table 2)
� Data supplier (table 3)
� Statistical agency (table 4)
� Regulations, agreements and cooperation (table 5)
The focus areas are the factors that influence the quality of data sources. Each object and focus area is defined, when it is not self-evident.
For each category, a table is created. The structure of each table is as follows:
� First level: Object. This level is marked grey. For this a one-digit code is used. For example 3 = Form.
� Second level: Attribute of the accompanying object. For this a two-digit code is used. For example 3.1 = Usability (of the form). The attribute should be read in combination with the object on the first level, e.g., “usability” of the “form”.
4 Frank Pijpers, Egon Gerards, Kees Prins, Jorrit Zwijnenburg, Max Booleman, Douwe Kuurstra. These are all member of the staff of Statistics Netherlands.
7
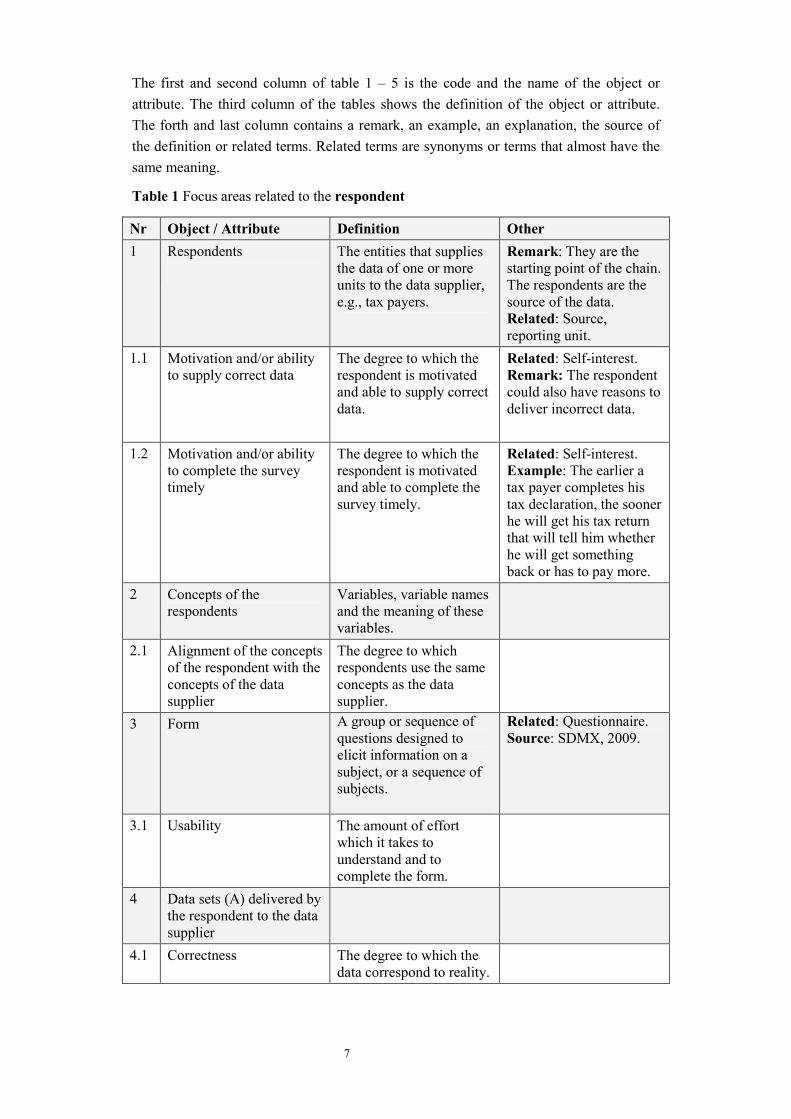
The first and second column of table 1 – 5 is the code and the name of the object or attribute. The third column of the tables shows the definition of the object or attribute. The forth and last column contains a remark, an example, an explanation, the source of the definition or related terms. Related terms are synonyms or terms that almost have the same meaning.
Table 1 Focus areas related to the respondent
Nr Object / Attribute Definition Other 1 Respondents The entities that supplies
the data of one or more units to the data supplier, e.g., tax payers.
Remark: They are the starting point of the chain. The respondents are the source of the data. Related: Source, reporting unit.
1.1 Motivation and/or ability to supply correct data
The degree to which the respondent is motivated and able to supply correct data.
Related: Self-interest. Remark: The respondent could also have reasons to deliver incorrect data.
1.2 Motivation and/or ability to complete the survey timely
The degree to which the respondent is motivated and able to complete the survey timely.
Related: Self-interest. Example: The earlier a tax payer completes his tax declaration, the sooner he will get his tax return that will tell him whether he will get something back or has to pay more.
2 Concepts of the respondents
Variables, variable names and the meaning of these variables.
2.1 Alignment of the concepts of the respondent with the concepts of the data supplier
The degree to which respondents use the same concepts as the data supplier.
3 Form A group or sequence of questions designed to elicit information on a subject, or a sequence of subjects.
Related: Questionnaire. Source: SDMX, 2009.
3.1 Usability The amount of effort which it takes to understand and to complete the form.
4 Data sets (A) delivered by the respondent to the data supplier
4.1 Correctness The degree to which the data correspond to reality.
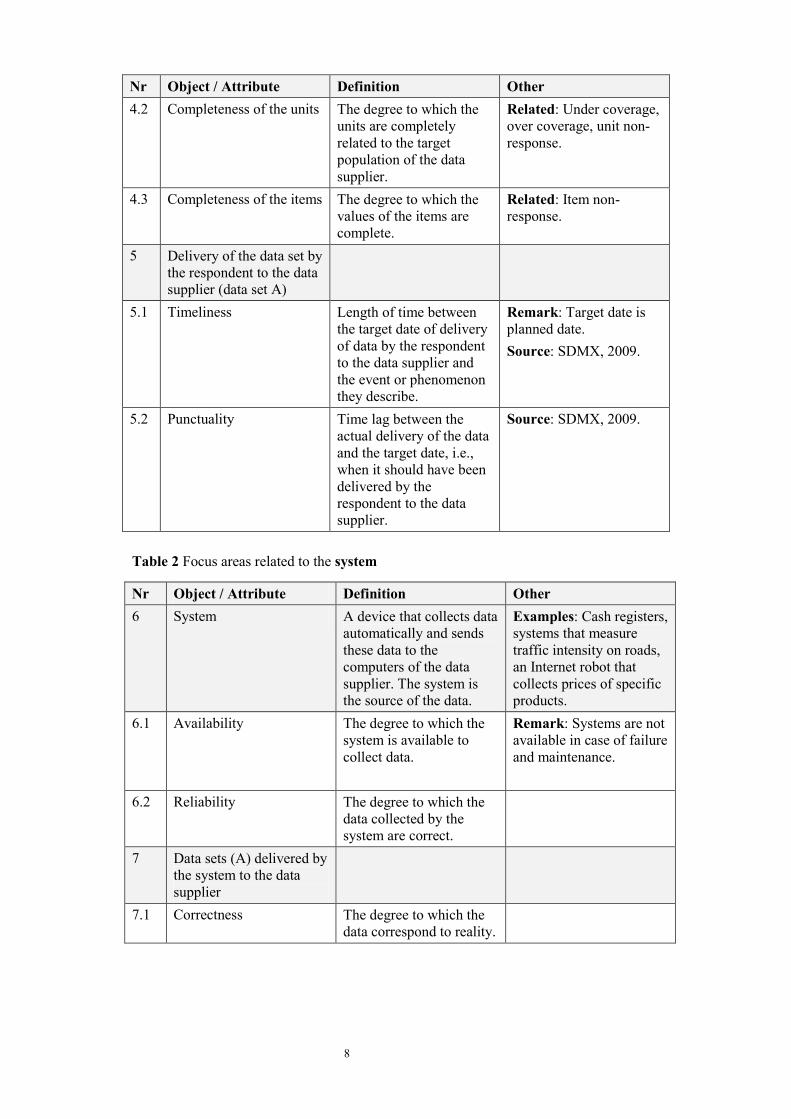
8
Nr Object / Attribute Definition Other 4.2 Completeness of the units The degree to which the
units are completely related to the target population of the data supplier.
Related: Under coverage, over coverage, unit non-response.
4.3 Completeness of the items The degree to which the values of the items are complete.
Related: Item non-response.
5 Delivery of the data set by the respondent to the data supplier (data set A)
5.1 Timeliness Length of time between the target date of delivery of data by the respondent to the data supplier and the event or phenomenon they describe.
Remark: Target date is planned date. Source: SDMX, 2009.
5.2 Punctuality Time lag between the actual delivery of the data and the target date, i.e., when it should have been delivered by the respondent to the data supplier.
Source: SDMX, 2009.
Table 2 Focus areas related to the system
Nr Object / Attribute Definition Other 6 System A device that collects data
automatically and sends these data to the computers of the data supplier. The system is the source of the data.
Examples: Cash registers, systems that measure traffic intensity on roads, an Internet robot that collects prices of specific products.
6.1 Availability The degree to which the system is available to collect data.
Remark: Systems are not available in case of failure and maintenance.
6.2 Reliability The degree to which the data collected by the system are correct.
7 Data sets (A) delivered by the system to the data supplier
7.1 Correctness The degree to which the data correspond to reality.
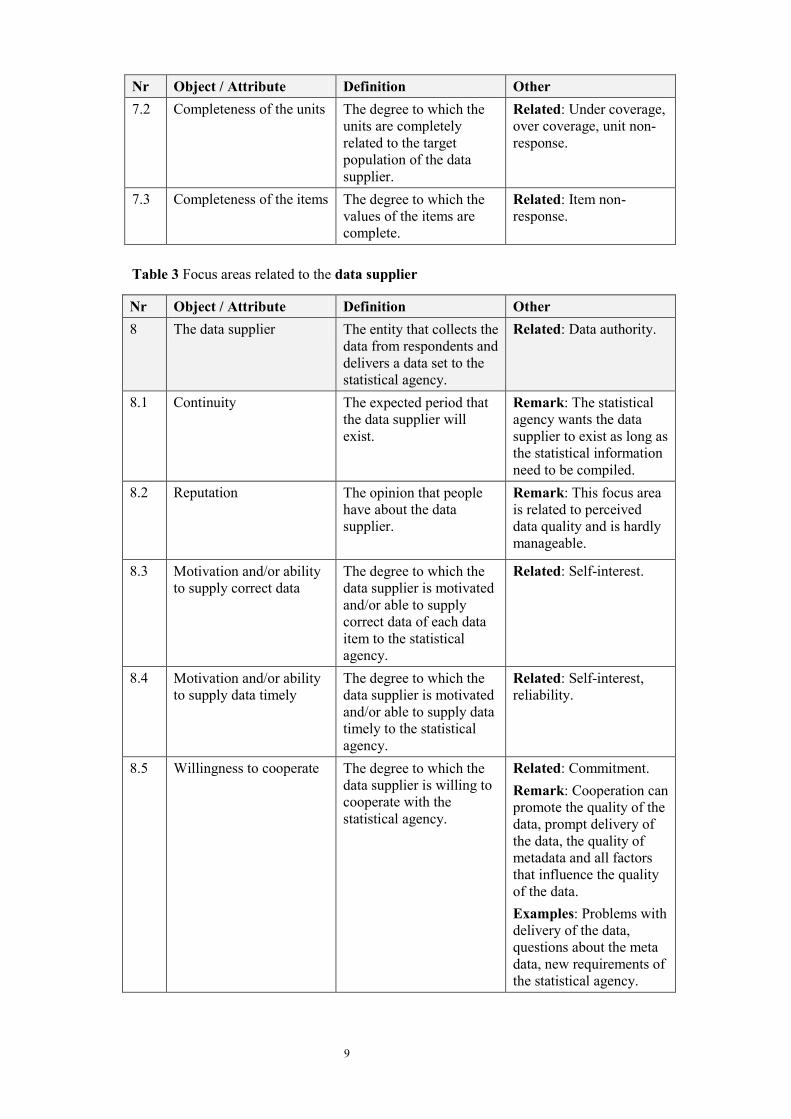
9
Nr Object / Attribute Definition Other 7.2 Completeness of the units The degree to which the
units are completely related to the target population of the data supplier.
Related: Under coverage, over coverage, unit non-response.
7.3 Completeness of the items The degree to which the values of the items are complete.
Related: Item non-response.
Table 3 Focus areas related to the data supplier
Nr Object / Attribute Definition Other 8 The data supplier The entity that collects the
data from respondents and delivers a data set to the statistical agency.
Related: Data authority.
8.1 Continuity The expected period that the data supplier will exist.
Remark: The statistical agency wants the data supplier to exist as long as the statistical information need to be compiled.
8.2 Reputation The opinion that people have about the data supplier.
Remark: This focus area is related to perceived data quality and is hardly manageable.
8.3 Motivation and/or ability to supply correct data
The degree to which the data supplier is motivated and/or able to supply correct data of each data item to the statistical agency.
Related: Self-interest.
8.4 Motivation and/or ability to supply data timely
The degree to which the data supplier is motivated and/or able to supply data timely to the statistical agency.
Related: Self-interest, reliability.
8.5 Willingness to cooperate The degree to which the data supplier is willing to cooperate with the statistical agency.
Related: Commitment. Remark: Cooperation can promote the quality of the data, prompt delivery of the data, the quality of metadata and all factors that influence the quality of the data. Examples: Problems with delivery of the data, questions about the meta data, new requirements of the statistical agency.
10
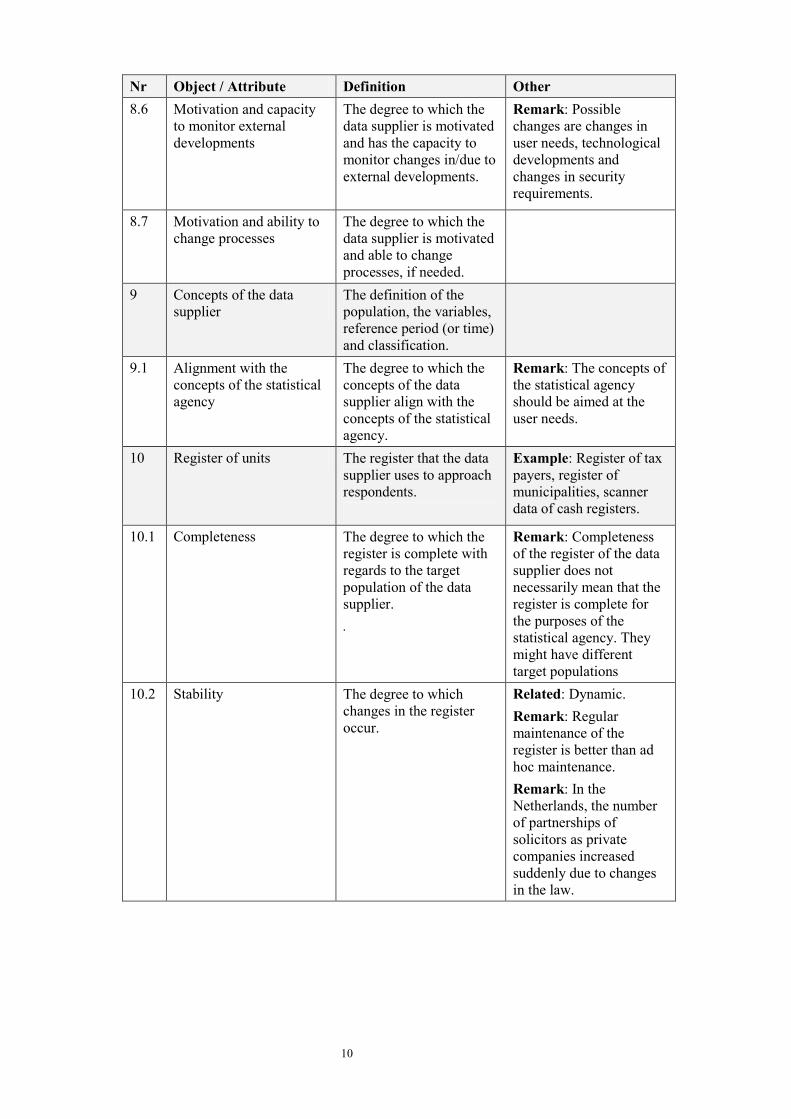
Nr Object / Attribute Definition Other 8.6 Motivation and capacity
to monitor external developments
The degree to which the data supplier is motivated and has the capacity to monitor changes in/due to external developments.
Remark: Possible changes are changes in user needs, technological developments and changes in security requirements.
8.7 Motivation and ability to change processes
The degree to which the data supplier is motivated and able to change processes, if needed.
9 Concepts of the data supplier
The definition of the population, the variables, reference period (or time) and classification.
9.1 Alignment with the concepts of the statistical agency
The degree to which the concepts of the data supplier align with the concepts of the statistical agency.
Remark: The concepts of the statistical agency should be aimed at the user needs.
10 Register of units The register that the data supplier uses to approach respondents.
Example: Register of tax payers, register of municipalities, scanner data of cash registers.
10.1 Completeness The degree to which the register is complete with regards to the target population of the data supplier. .
Remark: Completeness of the register of the data supplier does not necessarily mean that the register is complete for the purposes of the statistical agency. They might have different target populations
10.2 Stability The degree to which changes in the register occur.
Related: Dynamic. Remark: Regular maintenance of the register is better than ad hoc maintenance. Remark: In the Netherlands, the number of partnerships of solicitors as private companies increased suddenly due to changes in the law.
11
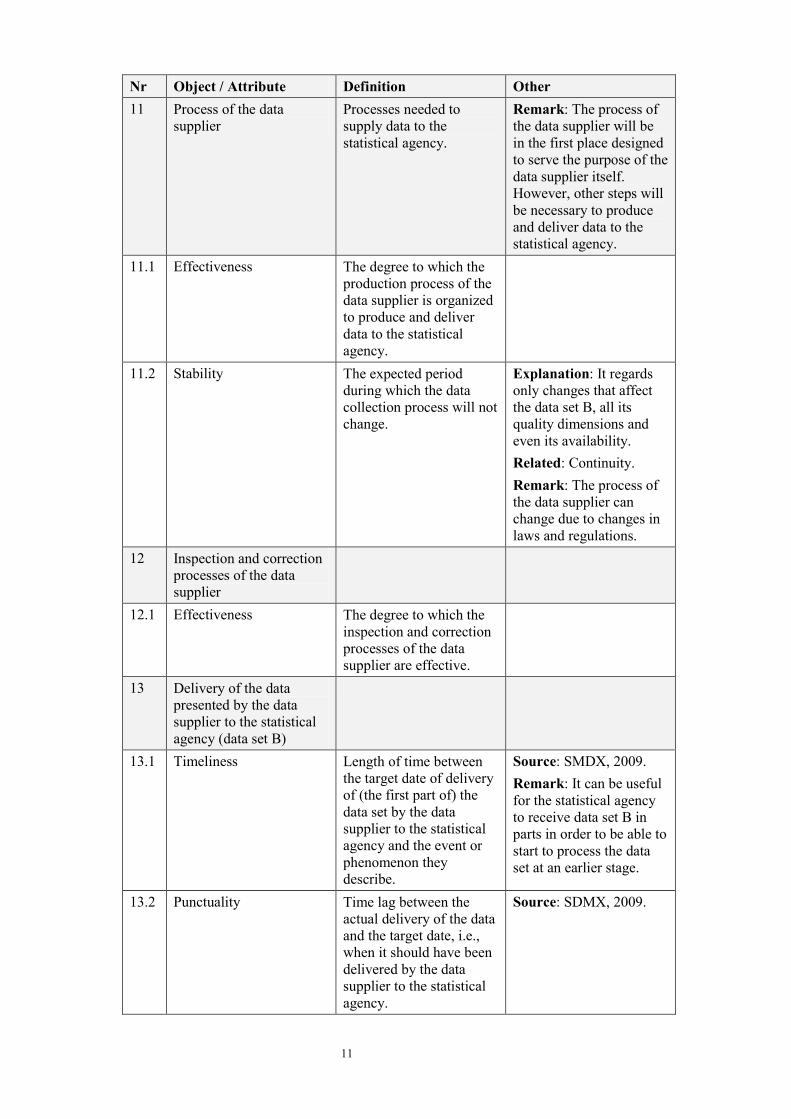
Nr Object / Attribute Definition Other 11 Process of the data
supplier Processes needed to supply data to the statistical agency.
Remark: The process of the data supplier will be in the first place designed to serve the purpose of the data supplier itself. However, other steps will be necessary to produce and deliver data to the statistical agency.
11.1 Effectiveness The degree to which the production process of the data supplier is organized to produce and deliver data to the statistical agency.
11.2 Stability The expected period during which the data collection process will not change.
Explanation: It regards only changes that affect the data set B, all its quality dimensions and even its availability. Related: Continuity. Remark: The process of the data supplier can change due to changes in laws and regulations.
12 Inspection and correction processes of the data supplier
12.1 Effectiveness The degree to which the inspection and correction processes of the data supplier are effective.
13 Delivery of the data presented by the data supplier to the statistical agency (data set B)
13.1 Timeliness Length of time between the target date of delivery of (the first part of) the data set by the data supplier to the statistical agency and the event or phenomenon they describe.
Source: SMDX, 2009. Remark: It can be useful for the statistical agency to receive data set B in parts in order to be able to start to process the data set at an earlier stage.
13.2 Punctuality Time lag between the actual delivery of the data and the target date, i.e., when it should have been delivered by the data supplier to the statistical agency.
Source: SDMX, 2009.
12
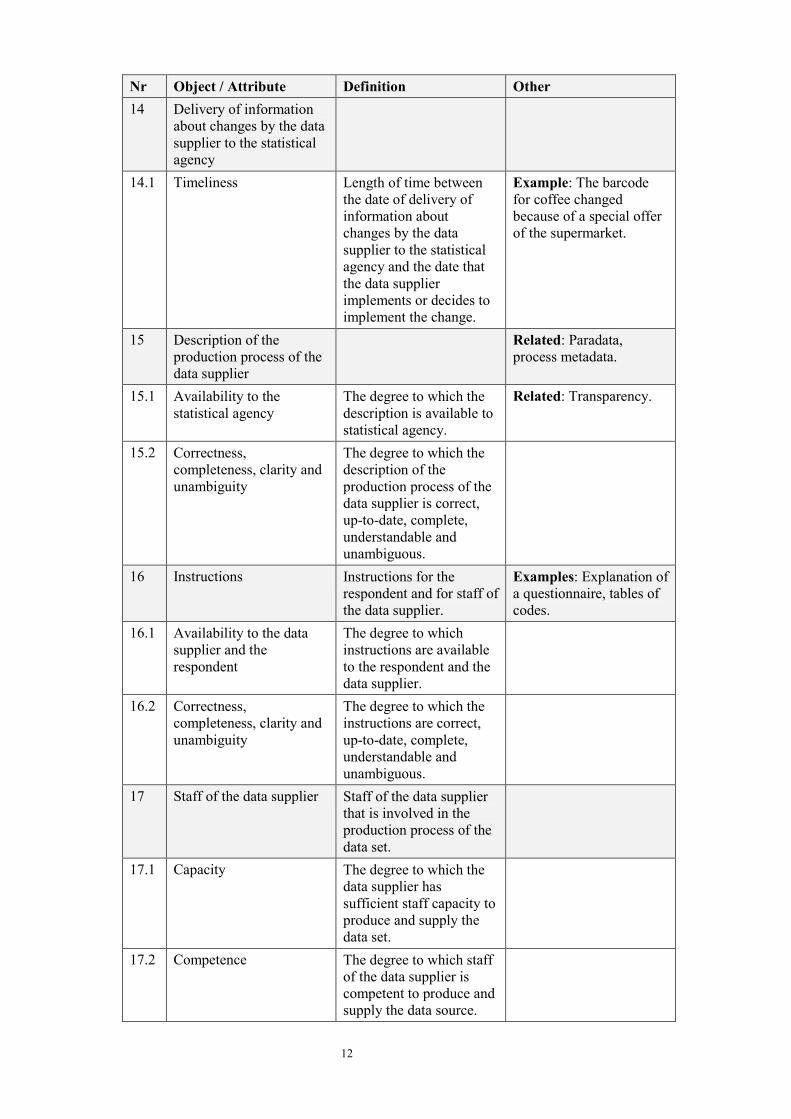
Nr Object / Attribute Definition Other 14 Delivery of information
about changes by the data supplier to the statistical agency
14.1 Timeliness Length of time between the date of delivery of information about changes by the data supplier to the statistical agency and the date that the data supplier implements or decides to implement the change.
Example: The barcode for coffee changed because of a special offer of the supermarket.
15 Description of the production process of the data supplier
Related: Paradata, process metadata.
15.1 Availability to the statistical agency
The degree to which the description is available to statistical agency.
Related: Transparency.
15.2 Correctness, completeness, clarity and unambiguity
The degree to which the description of the production process of the data supplier is correct, up-to-date, complete, understandable and unambiguous.
16 Instructions Instructions for the respondent and for staff of the data supplier.
Examples: Explanation of a questionnaire, tables of codes.
16.1 Availability to the data supplier and the respondent
The degree to which instructions are available to the respondent and the data supplier.
16.2 Correctness, completeness, clarity and unambiguity
The degree to which the instructions are correct, up-to-date, complete, understandable and unambiguous.
17 Staff of the data supplier Staff of the data supplier that is involved in the production process of the data set.
17.1 Capacity The degree to which the data supplier has sufficient staff capacity to produce and supply the data set.
17.2 Competence The degree to which staff of the data supplier is competent to produce and supply the data source.
13
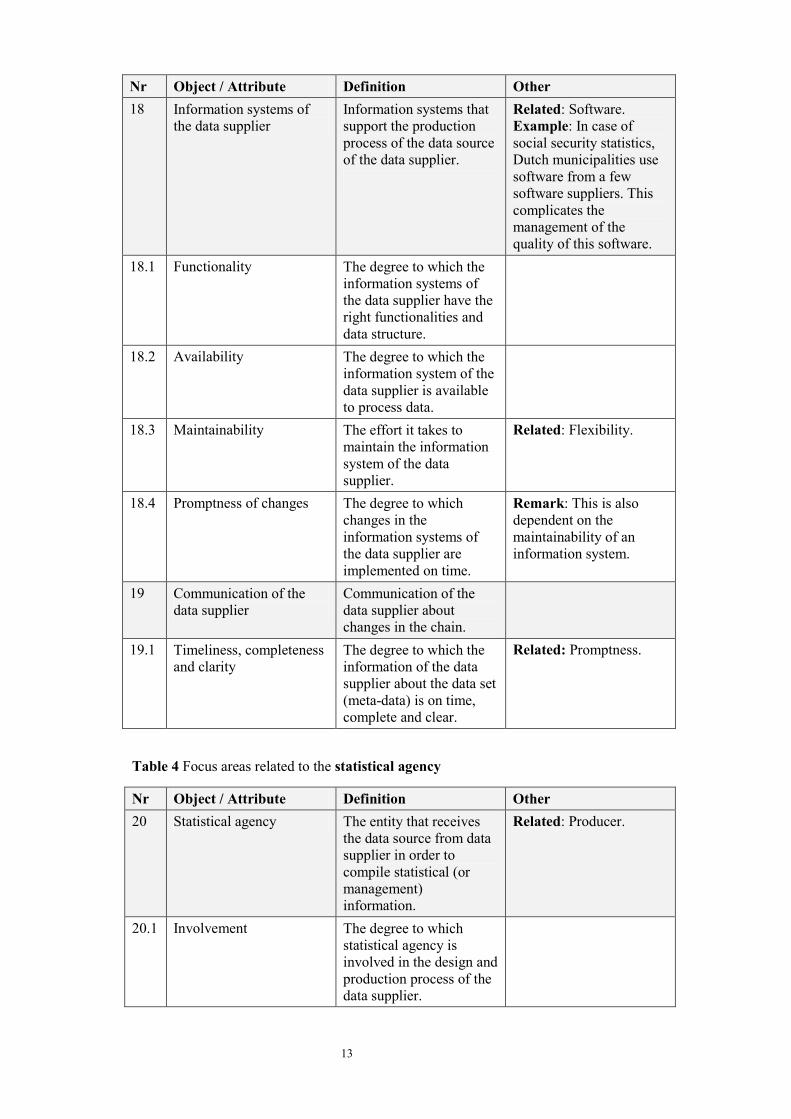
Nr Object / Attribute Definition Other 18 Information systems of
the data supplier Information systems that support the production process of the data source of the data supplier.
Related: Software. Example: In case of social security statistics, Dutch municipalities use software from a few software suppliers. This complicates the management of the quality of this software.
18.1 Functionality The degree to which the information systems of the data supplier have the right functionalities and data structure.
18.2 Availability The degree to which the information system of the data supplier is available to process data.
18.3 Maintainability The effort it takes to maintain the information system of the data supplier.
Related: Flexibility.
18.4 Promptness of changes The degree to which changes in the information systems of the data supplier are implemented on time.
Remark: This is also dependent on the maintainability of an information system.
19 Communication of the data supplier
Communication of the data supplier about changes in the chain.
19.1 Timeliness, completeness and clarity
The degree to which the information of the data supplier about the data set (meta-data) is on time, complete and clear.
Related: Promptness.
Table 4 Focus areas related to the statistical agency
Nr Object / Attribute Definition Other 20 Statistical agency The entity that receives
the data source from data supplier in order to compile statistical (or management) information.
Related: Producer.
20.1 Involvement The degree to which statistical agency is involved in the design and production process of the data supplier.
14
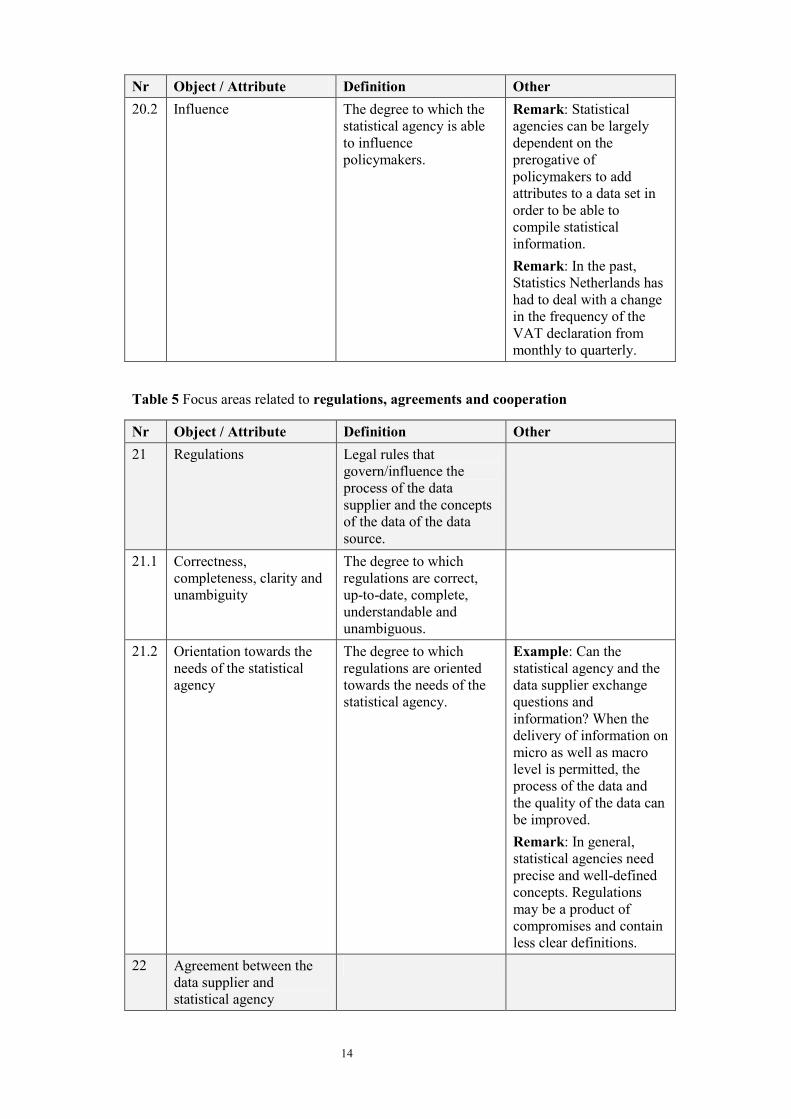
Nr Object / Attribute Definition Other 20.2 Influence The degree to which the
statistical agency is able to influence policymakers.
Remark: Statistical agencies can be largely dependent on the prerogative of policymakers to add attributes to a data set in order to be able to compile statistical information. Remark: In the past, Statistics Netherlands has had to deal with a change in the frequency of the VAT declaration from monthly to quarterly.
Table 5 Focus areas related to regulations, agreements and cooperation
Nr Object / Attribute Definition Other 21 Regulations Legal rules that
govern/influence the process of the data supplier and the concepts of the data of the data source.
21.1 Correctness, completeness, clarity and unambiguity
The degree to which regulations are correct, up-to-date, complete, understandable and unambiguous.
21.2 Orientation towards the needs of the statistical agency
The degree to which regulations are oriented towards the needs of the statistical agency.
Example: Can the statistical agency and the data supplier exchange questions and information? When the delivery of information on micro as well as macro level is permitted, the process of the data and the quality of the data can be improved. Remark: In general, statistical agencies need precise and well-defined concepts. Regulations may be a product of compromises and contain less clear definitions.
22 Agreement between the data supplier and statistical agency
15
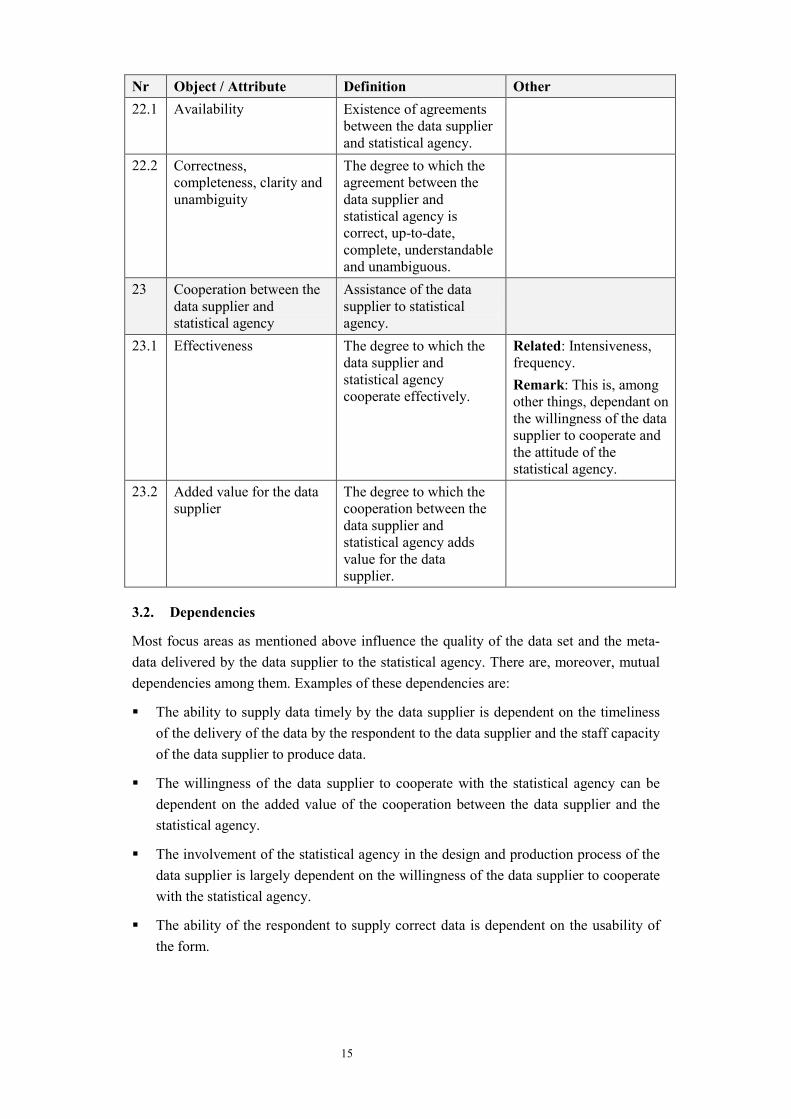
Nr Object / Attribute Definition Other 22.1 Availability Existence of agreements
between the data supplier and statistical agency.
22.2 Correctness, completeness, clarity and unambiguity
The degree to which the agreement between the data supplier and statistical agency is correct, up-to-date, complete, understandable and unambiguous.
23 Cooperation between the data supplier and statistical agency
Assistance of the data supplier to statistical agency.
23.1 Effectiveness The degree to which the data supplier and statistical agency cooperate effectively.
Related: Intensiveness, frequency. Remark: This is, among other things, dependant on the willingness of the data supplier to cooperate and the attitude of the statistical agency.
23.2 Added value for the data supplier
The degree to which the cooperation between the data supplier and statistical agency adds value for the data supplier.
3.2. Dependencies
Most focus areas as mentioned above influence the quality of the data set and the meta-data delivered by the data supplier to the statistical agency. There are, moreover, mutual dependencies among them. Examples of these dependencies are:
� The ability to supply data timely by the data supplier is dependent on the timeliness of the delivery of the data by the respondent to the data supplier and the staff capacity of the data supplier to produce data.
� The willingness of the data supplier to cooperate with the statistical agency can be dependent on the added value of the cooperation between the data supplier and the statistical agency.
� The involvement of the statistical agency in the design and production process of the data supplier is largely dependent on the willingness of the data supplier to cooperate with the statistical agency.
� The ability of the respondent to supply correct data is dependent on the usability of the form.
16
4. Discussion
Although we did our best to identify all focus areas related to the topic under study, the list of focus areas may not be complete. New focus areas could be defined. This report offers a starting point. The user of the list is free to modify the list according to his/her needs.
A logical next step is to define indicators and/or actions for each focus area in order to measure or manage this area (step 5 in figure 2). Implementing these actions could improve the quality of the data sources as delivered by the data supplier to the statistical agency. A prerequisite for this is a good relationship between the statistical agency and the data supplier (focus area 23.1).
According to the OQRM model, more steps can be taken, such as, a risk analysis, i.e., what are the causes and effects or the problems with a focus area (step 4 in figure 2).
Another possible step is to develop a network of dependencies between the quality of the data source and the focus areas as mentioned in the paper (step 10 in figure 2).
The list of focus areas can be used for frameworks, evaluation criteria, checklists, indicators, self-assessment and audits by defining requirements for each focus area (step 3 in figure 2).
It should be noted that not all focus areas are applicable in all cases. For example, regulations often have no bearing on data collection, e.g., in case of cash registers and mobile phone networks.
Furthermore, the list of focus areas has not yet been tested. Tests will certainly improve the list of focus areas.
5. Conclusion
Our research resulted in the construction of a list of focus areas (factors) that influence the quality of secondary data sources. This list is compiled in a systematic way by using the concepts of the OQRM model and expert knowledge. The list is a good starting point and can be modified by the user of the list if needed. It can also be used to measure and manage focus areas by taking actions in order to influence the quality of the data source. Possible tools are for example frameworks, evaluation criteria, checklists, indicators, self-assessment and audits. The list of factor can be used in the discussion about data quality between data suppliers and statistical agencies.
17
References
Booleman, Max (2004). Conceptual metadata and process metadata: key elements to improve the quality of the statistical system. Geneva: Joint UNECE/Eurostat/OECD work session on statistical metadata (METIS).
Daas, P.J.H., Ossen, S.J.L., Vis-Visschers, R.J.W.M., Arend-Toth, J. (2009). Checklist for the Quality Evaluation of Administrative Data Sources. Discussion paper 09042. The Hague/Heerlen: Statistics Netherlands.
Daas, P. J.H., Van Nederpelt, Peter W.M. (2010a). Application of the object oriented quality management model to secondary data sources. Discussion paper 10012. The Hague/Heerlen: Statistics Netherlands.
Daas, P.J.H., Ossen, S.J.L., Tennekes, M. (2010b). The determination of administrative data quality; recent results and new developments. Paper for the European Conference on Quality in Official Statistics 2010, Helsinki, Finland.
Daas, P.J.H., Ossen, S., Tennekes, M., Zhang, L-C., Hendriks, C., Foldal Haugen, K., Cerroni, F., Di Bella, G., Laitila, T., Wallgren, A., Wallgren, B. (2011) Report on methods preferred for the quality indicators of administrative data sources. Second deliverable of workpackage 4 of the BLUE Enterprise and Trade Statistics project, September 28.
ESSnet. MCV Ontology. Deliverable 3. ESSnet on SDMX – Work Package 2. Annex 1. Part 1 – Results. Definitions of concepts in natural and semi-formal (cmaps) language.
Eurostat (2009). Guidelines for assessing statistical processes based on administrative source(s) with the ESPAC Checklist. Version 15.09.09. Document of the Working Group on Quality, 15 June 2010.
Eurostat (2011). European Statistics Code of Practice for the National and Community Statistical Authorities, adopted by het European Statistical System Committee, 28 September 2011.
ISO-11179-1 (2003). Information technology – Metadata registries (MDR)– Part 3: Registry metamodel and basic attributes. ISO/IEC-11179-3. Geneva: ISO Copyright office.
ISO-11179-1 (2004). Information technology – Specification and standardization of data elements – Part 1: Framework for the specification and standardization of data elements. ISO/IEC-1179-1. Geneva: ISO Copyright office.
ISO-11179-2 (2005). Information technology – Specification and standardization of data elements – Part 2: Classification of data elements. ISO/IEC-1179-2. Geneva: ISO Copyright office.
Israëls, Abby; Scholtus, Sander (2010). Methodenreeks: Glossary. The Hague: Statistics Netherlands (unpublished).
18
Karr, Alan F., Sanil, Ashish P., Banks, D.L. (2006). Data quality; A statistical perspective. Statistical Methodology, 3, pp. 137-173.
Nederpelt, Peter W.M. van (2012). Object-oriented Quality and Risk Management. A practical, scalable and generic method to manage quality and risk. The Netherlands, Alphen aan den Rijn: MicroData. www.oqrm.org.
Neuchâtel (2004). Neuchâtel Terminology Model. Classification database object types and their attributes. Version 2.1 d.d., 18 June 2004.
Neuchâtel (2006). Neuchâtel Terminology Model. Part II: Variables and related concepts, object types and their attributes. Version 1.0 d.d. December 2006.
OECD (2007). Glossary of statistical terms. Paris: OECD.
Office of Management and Budget (2002). Guidelines for measuring and maximizing the quality, objectivity, utility, and integrity of information disseminated by federal agencies. Internet www.whitehouse.gov/omb/fedreg/reproducible.html
SDMX (2009). SDMX Content-oriented Guidelines. Annex 4: Metadata Common Vocabulary.
UN (1995). Guidelines for the modelling of statistical data and metadata. Conference of European Statisticians Methodological Material. Geneva: UN.
UN (2000a). Glossary of Terms on Statistical Data Editing. Conference of European Statisticians Methodological Material. Geneva: UN. http://www1.unece.org/stat/platform/display/kbase/Glossary
UN (2000b). Terminology on Statistical Metadata. Conference of European Statisticians Statistical Standards and Studies – No. 53. Geneva: UN.
Unstat (2011). UN Glossary of Classification Terms. Online database. http://unstats.un.org/unsd/class/family/glossary_short.asp
19
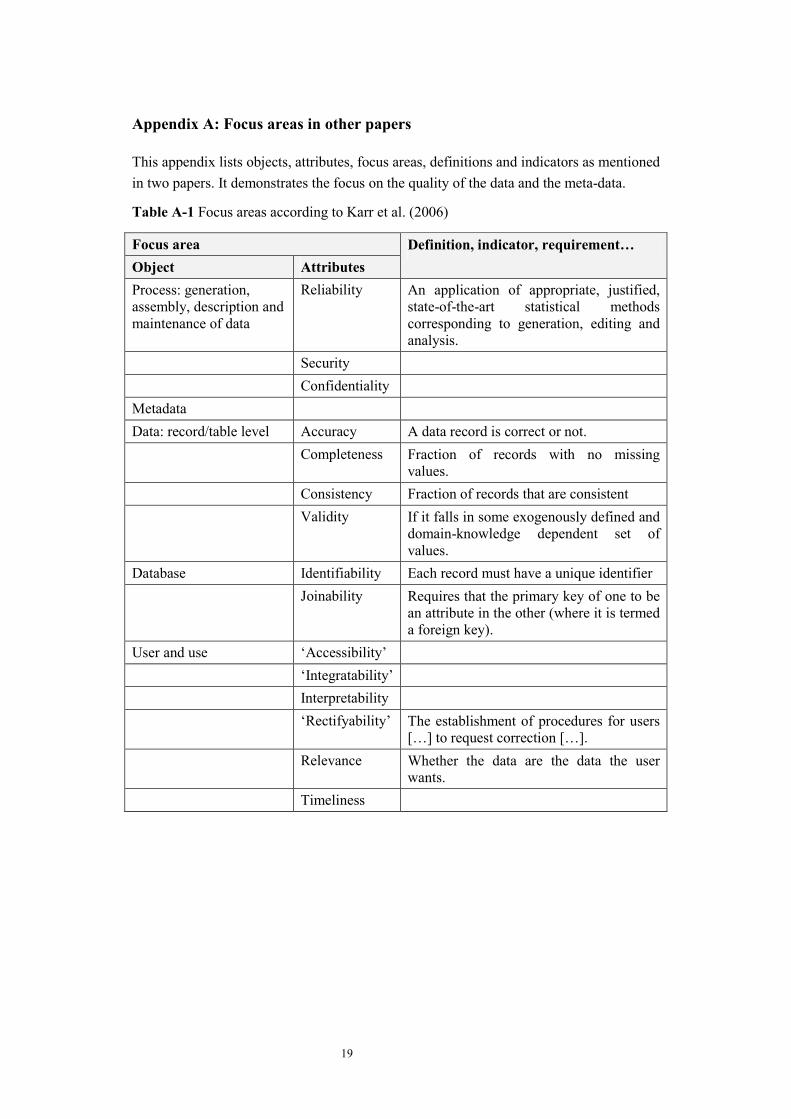
Appendix A: Focus areas in other papers
This appendix lists objects, attributes, focus areas, definitions and indicators as mentioned in two papers. It demonstrates the focus on the quality of the data and the meta-data.
Table A-1 Focus areas according to Karr et al. (2006)
Focus area Object Attributes
Definition, indicator, requirement…
Process: generation, assembly, description and maintenance of data
Reliability
An application of appropriate, justified, state-of-the-art statistical methods corresponding to generation, editing and analysis.
Security Confidentiality
Metadata Data: record/table level Accuracy A data record is correct or not.
Completeness Fraction of records with no missing values.
Consistency Fraction of records that are consistent Validity If it falls in some exogenously defined and
domain-knowledge dependent set of values.
Database Identifiability Each record must have a unique identifier Joinability Requires that the primary key of one to be
an attribute in the other (where it is termed a foreign key).
User and use ‘Accessibility’ ‘Integratability’Interpretability ‘Rectifyability’ The establishment of procedures for users
[…] to request correction […]. Relevance Whether the data are the data the user
wants. Timeliness
20
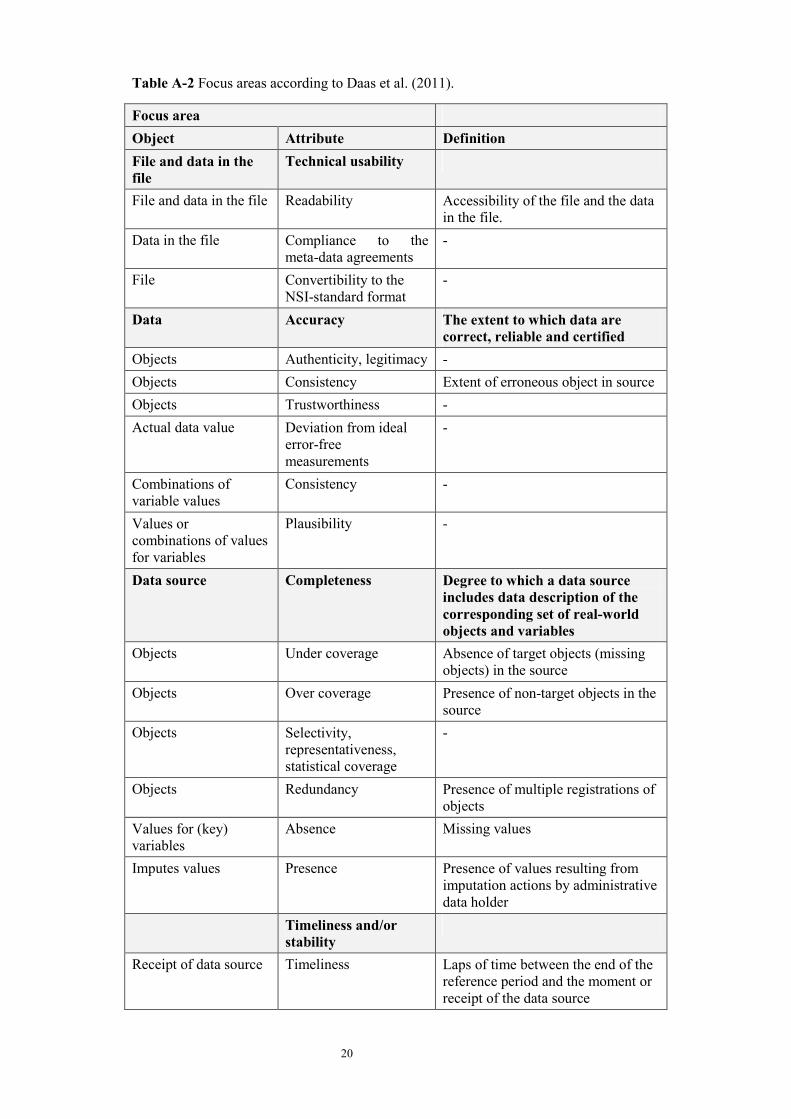
Table A-2 Focus areas according to Daas et al. (2011).
Focus area Object Attribute Definition File and data in the file
Technical usability
File and data in the file Readability Accessibility of the file and the data in the file.
Data in the file Compliance to the meta-data agreements
-
File Convertibility to the NSI-standard format
-
Data Accuracy The extent to which data are correct, reliable and certified
Objects Authenticity, legitimacy - Objects Consistency Extent of erroneous object in source Objects Trustworthiness - Actual data value Deviation from ideal
error-free measurements
-
Combinations of variable values
Consistency -
Values or combinations of values for variables
Plausibility -
Data source Completeness Degree to which a data source includes data description of the corresponding set of real-world objects and variables
Objects Under coverage Absence of target objects (missing objects) in the source
Objects Over coverage Presence of non-target objects in the source
Objects Selectivity, representativeness, statistical coverage
-
Objects Redundancy Presence of multiple registrations of objects
Values for (key) variables
Absence Missing values
Imputes values Presence Presence of values resulting from imputation actions by administrative data holder
Timeliness and/or stability
Receipt of data source Timeliness Laps of time between the end of the reference period and the moment or receipt of the data source
21
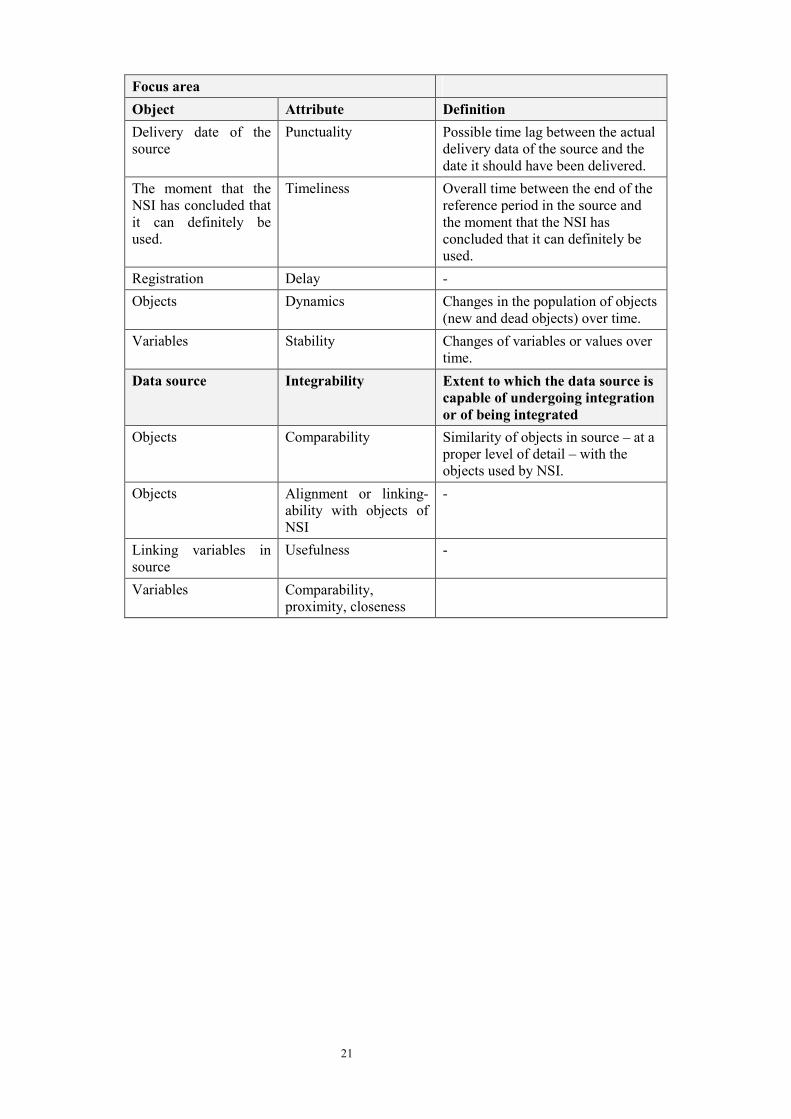
Focus area Object Attribute Definition Delivery date of the source
Punctuality Possible time lag between the actual delivery data of the source and the date it should have been delivered.
The moment that the NSI has concluded that it can definitely be used.
Timeliness Overall time between the end of the reference period in the source and the moment that the NSI has concluded that it can definitely be used.
Registration Delay -Objects Dynamics Changes in the population of objects
(new and dead objects) over time. Variables Stability Changes of variables or values over
time. Data source Integrability Extent to which the data source is
capable of undergoing integration or of being integrated
Objects Comparability Similarity of objects in source – at a proper level of detail – with the objects used by NSI.
Objects Alignment or linking-ability with objects of NSI
-
Linking variables in source
Usefulness -
Variables Comparability, proximity, closeness