Embed Size (px)
Citation preview

Equity research│March 15, 2017
Asia Pacific Daily - 15 March 2017
Equity Research Reports…
▌IDEA OF THE DAY | Thailand Property Development (OVERWEIGHT) - Cherry-picking time | P2 Upgrade to Overweight on better presales and earnings outlook. Current valuations price in market concerns, in our view. We expect condo segment to outperform landed housing. Top 8 developers continue to focus on the mid- to high-end segments. Positive macro factors should improve rejection rates. Our top picks are AP, ANAN and SPALI; SIRI is a trading buy. ——————————————————————————————————————————————————————————————————————————————————————— ▌China/Hong Kong Sunny Optical Technology (Group) (ADD, tp:HK$68.00) - Leading domestic dual-camera… | P3 TK Group (Holdings) Limited (ADD, tp:HK$2.90) - Solid mould to lead earnings growth | P4 Want Want China (HOLD, tp:HK$5.10) - New products to drive dairy growth | P5 ——————————————————————————————————————————————————————————————————————————————————————— ▌India Gas Transmission & Dist (UNDERWEIGHT) - Negative data points for LNG | P6 ——————————————————————————————————————————————————————————————————————————————————————— ▌Indonesia Retail (OVERWEIGHT) - Specialty seems to be the keyword in Valentine month | P7 ——————————————————————————————————————————————————————————————————————————————————————— ▌South Korea Lotte Chemical (ADD, tp:W490,000.00) - Strong 1Q17F earnings to be a near-term catalyst | P8 ——————————————————————————————————————————————————————————————————————————————————————— ▌Malaysia Bermaz Auto Berhad (ADD, tp:RM2.20▼) - Braking harder | P9 Semiconductor (NEUTRAL) - Gearing up for a stronger year | P10 ——————————————————————————————————————————————————————————————————————————————————————— ▌Singapore Del Monte Pacific (HOLD, tp:S$0.35▼) - 3QFY17: DMFI continues to disappoint | P11 Yangzijiang Shipbuilding (ADD, tp:S$1.21▲) - At a discount to peers | P12
Showcasing CIMB Research Ideas
IN: Strategy Note 12/03 BJP wins UP: Expect more schemes to help poor >PDF
———————————————————————————————————————————————————————————————————————————————————
HKG: ASM Pacific Technology Ltd 10/03 Likely winner in smartphone upgrade cycle >PDF
———————————————————————————————————————————————————————————————————————————————————
CHN: Strategy Note-Alpha 10/03 Stock Connect V – deep dive into southbound holding of H-shares >PDF
———————————————————————————————————————————————————————————————————————————————————
MAL: AirAsia Berhad 09/03 Why AAC will be valued at more than US$1bn >PDF
———————————————————————————————————————————————————————————————————————————————————
IN: IT Services 07/03 To come out of cyclical slowdown >PDF
Regional Equity Research Contacts
Michael GREENALL, CFP Regional Head of Research T: (60) 3 2261 9088 E: [email protected]
———————————————————————————————————————————————————————————————————————————————————
Show Style "View Doc Map"
CIMB Conference / Events |
CIMB Malaysia Small/Mid Cap Corporate Access Day 16 March 2017 – Malaysia – Kuala Lumpur CIMB Malaysia Small/Mid Cap Corporate Access Day 20 March 2017 – Malaysia – Singapore CIMB 11th Annual Indonesia Conference 3 - 5 May 2017 – Indonesia - Bali & Jakarta (Site Tour) SGX-CIMB Disruptors' Day 2017 26 May 2017 – Technology - Singapore
IMPORTANT DISCLOSURES, INCLUDING ANY REQUIRED RESEARCH CERTIFICATIONS, ARE PROVIDED AT THE END OF THIS REPORT. IF THIS REPORT IS DISTRIBUTED IN THE UNITED STATES IT IS DISTRIBUTED BY CIMB SECURITIES (USA), INC. AND IS CONSIDERED THIRD-PARTY AFFILIATED RESEARCH.
Powered by the EFA Platform

Property│Thailand│Equity research│March 14, 2017
Sector Note │ Alpha series
IMPORTANT DISCLOSURES, INCLUDING ANY REQUIRED RESEARCH CERTIFICATIONS, ARE PROVIDED AT THE END OF THIS REPORT. IF THIS REPORT IS DISTRIBUTED IN THE UNITED STATES IT IS DISTRIBUTED BY CIMB SECURITIES (USA), INC. AND IS CONSIDERED THIRD-PARTY AFFILIATED RESEARCH.
Powered by the EFA Platform
Property Development Cherry-picking time
■ Upgrade to Overweight on better presales and earnings outlook. Current valuations price in market concerns, in our view.
■ We expect condo segment to outperform landed housing. ■ Top 8 developers continue to focus on the mid- to high-end segments. ■ Positive macro factors should improve rejection rates. ■ Our top picks are AP, ANAN and SPALI; SIRI is a trading buy.
Upgrade to Overweight from Neutral We upgrade the sector weighting to Overweight from Neutral as we see room for re-rating in the residential property sector in view of a recovery in presales growth, rejection rate stabilisation, supportive government policy and better sector earnings growth. Top picks are AP, ANAN and SPALI on outstanding presales growth, promising earnings outlook with high visibility and market-leading positions in the mid- to high-end segment.
Driver #1: Condo market poised for recovery We expect aggregate presales of the top eight developers in our coverage to jump 12.4% yoy to THB220.7bn in 2017F from a recovery in condo presales. Condo presales are likely to outperform low-rise housing presales due to a low-base effect, pent-up demand for condos from 4Q16, rising demand from foreign buyers and more new launches of condos that are mostly in good locations with demand potential.
Driver #2: In favour of mid- to high-end developers We estimate the total value of new launches from the top eight developers to rise by 28% yoy to THB265.9bn in 2017F mainly due to a surge in new condo launches (+41.4% yoy) resulting from the postponement of certain projects in 4Q16. Meanwhile, we believe the value of new launches for low-rise housing is likely to increase at a lower rate of 15.7% yoy. Our top 8 developers continue to focus on the mid- to high-end segments given the more favourable demand-and-supply situation.
Driver #3: Rejection rates likely to stabilise We believe rejection rates peaked in 4Q16. Positive macroeconomic factors in 2017F, i.e. 1) improvement in farm income, 2) the expiry of the first-time car buyer scheme, and 3) the new personal income tax structure effective from 2017F, which lowers the income tax burden, should reduce bank concerns and increase homebuyers’ accessibility to mortgages. We expect the rejection rates to stabilise in 1H17F and start to fall in 2H17F.
Driver #4: Government policy is supportive of property sector We have seen good progress in the East Orange, Pink and Yellow Lines, which are expected to start construction in 2H17F. Another 7 mass transit projects worth THB298bn are likely to be submitted for the cabinet’s approval in 2017F (according to Mass Rapid Transit Authority of Thailand). Other sector catalysts are a new round of property stimulus measures and banks relaxing their mortgage criteria.
Driver #5: Better earnings growth outlook in 2017-18F We expect core net profit growth of the top eight developers under our coverage to accelerate to 11.3% in 2017F and 9.3% in 2018F vs. 2.3% in 2016, supported by higher residential revenue as well as an increase in share of profit from JVs and affiliates. Total backlog as at end-2016 is estimated to secure 38.4% and 26.5% of our revenue and JV transfer estimates in 2017-18F, respectively. [ X ]
Figure 1: Core net profit and growth of top eight developers
Note: Core net profit excludes one-off items i.e. gain from sale of investment. SOURCES: CIMB RESEARCH, COMPANY
▎Thailand
Overweight (previously Neutral) Highlighted companies
Ananda Development ADD, TP THB5.82, THB4.82 close
ANAN is one of our top picks for its outstanding presales growth given its leading position in condos located along the mass transit network and strong earnings outlook with high visibility through its JV partnership with Mitsui Fudosan. We estimate its core net profit to post 19.9% CAGR in 2017-19F, driven by rising contributions from the JV, which is likely to account for more than half of ANAN’s core net profit.
AP (Thailand) PCL ADD, TP THB8.65, THB7.20 close
We like AP’s balanced portfolio of low-rise housing and condos with strong positioning in the mid-priced segment. Its core net profit growth outlook is promising, with CAGR of 17.5% in 2017-18F due to higher contribution from JV projects and attractive valuations. A potential re-rating catalyst is the successful re-launch of Vittorio, a pre-built luxury condo project, in 2Q17F, in our view.
Supalai PCL ADD, TP THB28.50, THB24.60 close
SPALI is a likely beneficiary of an upturn in farm income given its large exposure to provincial markets. We also like SPALI for its large backlog, efficient cost control and promising growth prospects. The current backlog is estimated to secure 54.5% and 37.5% of our revenue forecasts in 2017 and 2018, respectively.
Summary valuation metrics
Analyst(s)
Pornthipa RAYABSANGDUAN
T (66) 2 657 9229 E [email protected]
18.4%
2.6%2.3%
11.3%
9.3%8.8%
0.0%
2.0%
4.0%
6.0%
8.0%
10.0%
12.0%
14.0%
16.0%
18.0%
20.0%
-
5,000
10,000
15,000
20,000
25,000
30,000
35,000
40,000
45,000
2014 2015 2016 2017F 2018F 2019F
AP LH LPN PSH QH SPALI SIRI ANAN % yoy growth
(THBm)
P/E (x) Dec-17F Dec-18F Dec-19F
AP (Thailand) PCL 7.40 6.44 6.13 Sansiri 7.85 7.75 7.12 Supalai PCL 7.87 7.03 6.48
P/BV (x) Dec-17F Dec-18F Dec-19F
AP (Thailand) PCL 1.08 0.97 0.88 Sansiri 0.96 0.91 0.85 Supalai PCL 1.62 1.41 1.24
Dividend Yield Dec-17F Dec-18F Dec-19F
AP (Thailand) PCL 4.86% 5.59% 6.03%Sansiri 6.50% 6.58% 7.16%Supalai PCL 4.83% 5.41% 6.17%
2
Technology Components│Hong Kong│March 14, 2017
Company Note
IMPORTANT DISCLOSURES, INCLUDING ANY REQUIRED RESEARCH CERTIFICATIONS, ARE PROVIDED AT THE END OF THIS REPORT. IF THIS REPORT IS DISTRIBUTED IN THE UNITED STATES IT IS DISTRIBUTED BY CIMB SECURITIES (USA), INC. AND IS CONSIDERED THIRD-PARTY AFFILIATED RESEARCH.
Powered by the EFA Platform
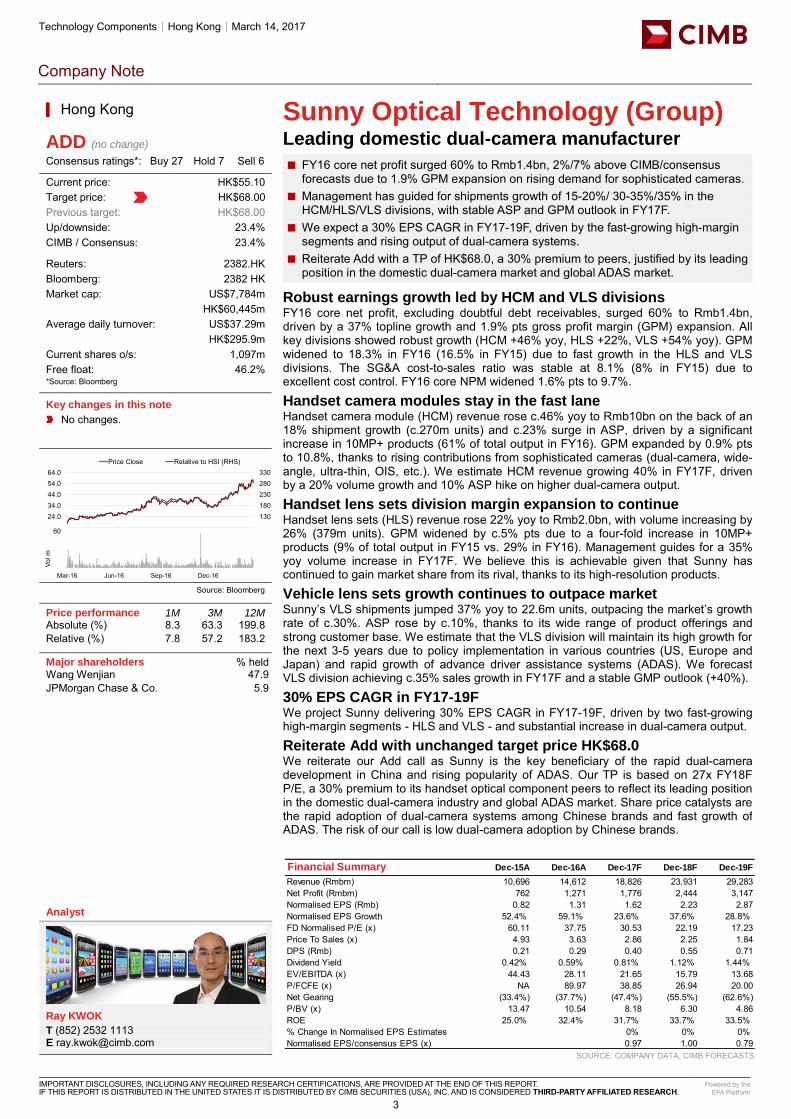
Sunny Optical Technology (Group) Leading domestic dual-camera manufacturer
FY16 core net profit surged 60% to Rmb1.4bn, 2%/7% above CIMB/consensus ■forecasts due to 1.9% GPM expansion on rising demand for sophisticated cameras.
Management has guided for shipments growth of 15-20%/ 30-35%/35% in the ■HCM/HLS/VLS divisions, with stable ASP and GPM outlook in FY17F.
We expect a 30% EPS CAGR in FY17-19F, driven by the fast-growing high-margin ■segments and rising output of dual-camera systems.
Reiterate Add with a TP of HK$68.0, a 30% premium to peers, justified by its leading ■position in the domestic dual-camera market and global ADAS market.
Robust earnings growth led by HCM and VLS divisions FY16 core net profit, excluding doubtful debt receivables, surged 60% to Rmb1.4bn, driven by a 37% topline growth and 1.9% pts gross profit margin (GPM) expansion. All key divisions showed robust growth (HCM +46% yoy, HLS +22%, VLS +54% yoy). GPM widened to 18.3% in FY16 (16.5% in FY15) due to fast growth in the HLS and VLS divisions. The SG&A cost-to-sales ratio was stable at 8.1% (8% in FY15) due to excellent cost control. FY16 core NPM widened 1.6% pts to 9.7%.
Handset camera modules stay in the fast lane Handset camera module (HCM) revenue rose c.46% yoy to Rmb10bn on the back of an 18% shipment growth (c.270m units) and c.23% surge in ASP, driven by a significant increase in 10MP+ products (61% of total output in FY16). GPM expanded by 0.9% pts to 10.8%, thanks to rising contributions from sophisticated cameras (dual-camera, wide-angle, ultra-thin, OIS, etc.). We estimate HCM revenue growing 40% in FY17F, driven by a 20% volume growth and 10% ASP hike on higher dual-camera output.
Handset lens sets division margin expansion to continue Handset lens sets (HLS) revenue rose 22% yoy to Rmb2.0bn, with volume increasing by 26% (379m units). GPM widened by c.5% pts due to a four-fold increase in 10MP+ products (9% of total output in FY15 vs. 29% in FY16). Management guides for a 35% yoy volume increase in FY17F. We believe this is achievable given that Sunny has continued to gain market share from its rival, thanks to its high-resolution products.
Vehicle lens sets growth continues to outpace market Sunny’s VLS shipments jumped 37% yoy to 22.6m units, outpacing the market’s growth rate of c.30%. ASP rose by c.10%, thanks to its wide range of product offerings and strong customer base. We estimate that the VLS division will maintain its high growth for the next 3-5 years due to policy implementation in various countries (US, Europe and Japan) and rapid growth of advance driver assistance systems (ADAS). We forecast VLS division achieving c.35% sales growth in FY17F and a stable GMP outlook (+40%).
30% EPS CAGR in FY17-19F We project Sunny delivering 30% EPS CAGR in FY17-19F, driven by two fast-growing high-margin segments - HLS and VLS - and substantial increase in dual-camera output.
Reiterate Add with unchanged target price HK$68.0 We reiterate our Add call as Sunny is the key beneficiary of the rapid dual-camera development in China and rising popularity of ADAS. Our TP is based on 27x FY18F P/E, a 30% premium to its handset optical component peers to reflect its leading position in the domestic dual-camera industry and global ADAS market. Share price catalysts are the rapid adoption of dual-camera systems among Chinese brands and fast growth of ADAS. The risk of our call is low dual-camera adoption by Chinese brands.
▎Hong Kong
ADD (no change) Consensus ratings*: Buy 27 Hold 7 Sell 6
Current price: HK$55.10 Target price: HK$68.00 Previous target: HK$68.00
Up/downside: 23.4% CIMB / Consensus: 23.4%
Reuters: 2382.HK Bloomberg: 2382 HK Market cap: US$7,784m HK$60,445m Average daily turnover: US$37.29m HK$295.9m Current shares o/s: 1,097m Free float: 46.2% *Source: Bloomberg Key changes in this note
No changes.
Source: Bloomberg
Price performance 1M 3M 12M Absolute (%) 8.3 63.3 199.8 Relative (%) 7.8 57.2 183.2
Major shareholders % held Wang Wenjian 47.9 JPMorgan Chase & Co. 5.9
Analyst
Ray KWOK
T (852) 2532 1113 E [email protected]
SOURCE: COMPANY DATA, CIMB FORECASTS
Financial Summary Dec-15A Dec-16A Dec-17F Dec-18F Dec-19F
Revenue (Rmbm) 10,696 14,612 18,826 23,931 29,283Net Profit (Rmbm) 762 1,271 1,776 2,444 3,147Normalised EPS (Rmb) 0.82 1.31 1.62 2.23 2.87Normalised EPS Growth 52.4% 59.1% 23.6% 37.6% 28.8%FD Normalised P/E (x) 60.11 37.75 30.53 22.19 17.23Price To Sales (x) 4.93 3.63 2.86 2.25 1.84DPS (Rmb) 0.21 0.29 0.40 0.55 0.71Dividend Yield 0.42% 0.59% 0.81% 1.12% 1.44%EV/EBITDA (x) 44.43 28.11 21.65 15.79 13.68P/FCFE (x) NA 89.97 38.85 26.94 20.00Net Gearing (33.4%) (37.7%) (47.4%) (55.5%) (62.6%)P/BV (x) 13.47 10.54 8.18 6.30 4.86ROE 25.0% 32.4% 31.7% 33.7% 33.5%% Change In Normalised EPS Estimates 0% 0% 0%Normalised EPS/consensus EPS (x) 0.97 1.00 0.79
80130180230280330
14.024.034.044.054.064.0
Price Close Relative to HSI (RHS)
20
40
60
Mar-16 Jun-16 Sep-16 Dec-16
Vol m
3

Ind Goods & Services│Hong Kong│March 14, 2017
Company Note
IMPORTANT DISCLOSURES, INCLUDING ANY REQUIRED RESEARCH CERTIFICATIONS, ARE PROVIDED AT THE END OF THIS REPORT. IF THIS REPORT IS DISTRIBUTED IN THE UNITED STATES IT IS DISTRIBUTED BY CIMB SECURITIES (USA), INC. AND IS CONSIDERED THIRD-PARTY AFFILIATED RESEARCH.
Powered by the EFA Platform
TK Group (Holdings) Limited Solid mould to lead earnings growth
FY16 net profit grew 10% yoy to HK$206m, just 2% below our forecast but 1% ■above consensus. The discrepancy was due to lower-than-expected sales growth.
The 2% gross profit margin expansion was due to higher automation and ■depreciation of the Rmb.
We forecast TK Group to post solid 20% net profit growth in FY17-19F. ■ Strong balance sheet to support a sustainable generous dividend policy. ■ Maintain Add due to its attractive valuation of 8x FY17F P/E and 7% dividend yield. ■
Sales growth resumed in 2HFY16 TK Group’s net profit grew by 10% yoy to HK$206m in FY16 while revenue growth was up only 1% to HK$1.6bn, thanks to a 2% pts gross profit margin (GPM) expansion. The mold fabrication segment grew 7% yoy, driven by a strong performance in the automotive division (+28% yoy) while plastic component manufacturing fell by 2% yoy due to a weak performance in mobile phones & wearable devices (-11% yoy). The group increased its dividend payout ratio to 56% (44% in FY15); FY16 DPS was at HK$0.14.
Steady sales growth in plastic component manufacturing We believe that TK Group’s plastic component manufacturing segment could post c.12% sales growth p.a. in FY17-18F, driven by a sales recovery in the mobile phones & wearable devices division due to a new customer (Otter) and a new item (AirPod) win in iPhones and strong growth in smart homes with the launch of a new product.
Sales growth in mould fabrication to accelerate to 16% in FY17-18F We expect the mould fabrication segment to post around 16% growth p.a. in FY17-18F due to the US market expansion in the automotive division and increased orders from the European market. TK Group set up a sales office in the US last year and secured new orders from Ford, and actively negotiates with potential new customers. In order to meet strong customer demand, it plans to increase mould fabrication capacity by c.15%.
Gross margin expansion to continue GPM in the mould fabrication segment widened by 3% pts to 28.4% due to an improved utilisation rate by adding a new German automobile customer. Plastic component manufacturing segmental GPM improved by 1.4% pts to 27.8%, thanks to an increase in automation. We believe its GPM could expand slightly by 0.2% to 28.3% in FY17F, driven by continual enhancement in automation.
Solid 20% net profit CAGR in FY17-19F We estimate the TK Group’s net profit to grow by 20% to HK$247m in FY17F, driven by solid 16% growth in its topline and a stable margin outlook. We forecast net profit CAGR of 20% in FY17-19F on the back of continual new customer gains and sustainable gross margin improvement. We expect the group’s net profit margin to expand from 12.6% in FY16 to 14.0% in FY19F (+1.4% pts), supported by a 0.5% pts improvement in GPM and 0.9% pts decline in the SG&A costs to sales ratio.
Maintain Add We maintain our positive view on TK Group as it is well diversified and has a strong customer base. With an unchanged target price, we maintain Add in view of its solid earnings growth and attractive valuation (8x FY17F P/E and 7% dividend yield in FY17F). Our target price is based on 8x FY18F P/E, on par with its peers. Share price catalysts include sustainable GPM expansion and a higher dividend payout ratio. Risks to our call are weaker-than-expected sales growth for its customers.
\▎Hong Kong
ADD (no change) Consensus ratings*: Buy 7 Hold 0 Sell 0
Current price: HK$2.40 Target price: HK$2.90 Previous target: HK$2.90
Up/downside: 20.8% CIMB / Consensus: 5.0%
Reuters: 2283.HK Bloomberg: 2283 HK Market cap: US$255.5m HK$1,984m Average daily turnover: US$0.07m HK$0.56m Current shares o/s: 826.6m Free float: 25.79% *Source: Bloomberg Key changes in this note
No change.
Source: Bloomberg
Price performance 1M 3M 12M Absolute (%) 6.7 14.3 32.6 Relative (%) 6.2 8.1 14.6
Major shareholders % held LI Pui Leung (Chairman) and senior management 74.21 Value Partners 7.96
Analyst
Ray KWOK
T (852) 2532 1113 E [email protected]
SOURCE: COMPANY DATA, CIMB FORECASTS
Financial Summary Dec-15A Dec-16A Dec-17F Dec-18F Dec-19F
Revenue (HK$m) 1,606 1,627 1,893 2,175 2,508Operating EBITDA (HK$m) 253.4 264.0 353.8 417.6 475.3Net Profit (HK$m) 187.1 205.7 247.4 300.1 350.8Normalised EPS (HK$) 0.23 0.25 0.30 0.36 0.42Normalised EPS Growth 23.5% 8.5% 20.3% 21.3% 16.9%FD Normalised P/E (x) 10.46 9.64 8.02 6.61 5.66DPS (HK$) 0.10 0.14 0.16 0.20 0.23Dividend Yield 4.17% 5.83% 6.86% 8.32% 9.72%EV/EBITDA (x) 6.96 6.38 4.45 3.42 2.64P/FCFE (x) 8.47 11.09 8.54 6.60 5.57Net Gearing (36.3%) (43.7%) (48.8%) (55.5%) (61.2%)P/BV (x) 3.28 2.90 2.37 1.98 1.67ROE 33.5% 31.9% 32.5% 32.7% 32.0%% Change In Normalised EPS Estimates 0.000% 0.016%Normalised EPS/consensus EPS (x) 1.04 1.12
91.0
98.5
106.0
113.5
121.0
1.70
1.90
2.10
2.30
2.50Price Close Relative to HSI (RHS)
1234
Mar-16 Jun-16 Sep-16 Dec-16
Vol m
4

Food & Beverages│Hong Kong│March 14, 2017
Company Note
IMPORTANT DISCLOSURES, INCLUDING ANY REQUIRED RESEARCH CERTIFICATIONS, ARE PROVIDED AT THE END OF THIS REPORT. IF THIS REPORT IS DISTRIBUTED IN THE UNITED STATES IT IS DISTRIBUTED BY CIMB SECURITIES (USA), INC. AND IS CONSIDERED THIRD-PARTY AFFILIATED RESEARCH.
Powered by the EFA Platform
Want Want China New products to drive dairy growth
Despite revenue falling 7.9% yoy, Want Want’s net profit rose 4% yoy in FY16, in ■line with both our and market expectations.
We expect new products to drive dairy growth in FY17; however, rice cracker sales ■may suffer from the timing of Chinese New Year.
We expect higher raw material prices to negatively impact GPM, but this should be ■partially offset by a higher utilisation rate.
We fine-tune our FY17-FY18 earnings forecasts by 0.5-0.8%. Maintain Hold. ■
FY16 results in line with our expectation Due to 7.1% growth in rice cracker sales and a narrowing decline in dairy sales to -5.8% in 2H16, Want Want’s topline decline narrowed to 2.4% yoy (1H16: -12.8%). Aided by lower raw material prices, GPM was boosted by 2.3% pts yoy to 47.8% in 2H16. Net profit grew by 8% yoy in 2H16, bringing FY16 net profit growth to 4.0% yoy, in line with both our and market consensus and forming 99% of our forecast.
New products to drive up dairy growth We turn more positive on Want Want’s dairy segment, as it recorded qoq growth from Dec 16 to Feb 17. We forecast the dairy segment to return to positive growth of 2.1% yoy in FY17, given that dairy promotional levels normalised in Jan/Feb 2017. Management has seen good traction for its room temperature yoghurt launched in 3Q16, and will further expand its new high-end UHT milk product to the national market in 2Q17. We expect new dairy products to contribute 3% of its dairy sales in FY17.
While rice cracker sales may suffer from the timing of CNY We expect Want Want’s rice cracker sales to fall 1.9% yoy in FY17, due to the earlier timing of Chinese New Year (CNY), but partially offset by continued penetration into modern channels and e-commerce. Want Want’s rice cracker segment achieved double-digit sales growth through the modern channel in FY16, while e-commerce and the modern channel contributed 3% and 12%, respectively, of Want Want’s total revenue. Overall, we expect the company to achieve 1.8% yoy revenue growth in FY17.
GPM concerns overblown… We raise our GPM forecasts for FY17 by 0.5% pts to 47.0% (FY16: 47.8%). While the latest international milk powder prices saw a 41% yoy jump, management said that its existing inventory is sufficient for 1H17, and milk prices procured YTD have not shown a substantial increase. Hence, we now only factor in 5% growth in Want Want’s FY17 milk powder price. Meanwhile, other raw material prices that have shown an uptrend, including PET, sugar and paper boxes, only account for less than 10% of its COGS.
…But FY17 a year of advertising and promotions We forecast the distribution expenses ratio to rise to 14.1% in FY17 (FY16: 13.9%) as management plans to hire an additional 1,000 to 2,000 sales personnel and step up advertising and promotions for new dairy products to drive sales growth.
Maintain Hold with DCF-based TP of HK$5.10 (WACC: 8.6%) We maintain our Hold rating. Although Want Want’s valuation is not demanding, in our view, we still want to see if the company is able to successfully reverse the sales decline of its key product, Hot Kid milk. Upside risks include stronger-than-expected contributions from new products and better-than-expected dairy industry recovery; downside risks include higher-than-expected raw material prices and intensifying promotions in the dairy industry.
SOURCE: COMPANY DATA, CIMB FORECASTS
Financial Summary Dec-15A Dec-16A Dec-17F Dec-18F Dec-19F
Revenue (Rmbm) 21,389 19,710 20,071 21,245 22,518Operating EBITDA (Rmbm) 5,412 5,719 5,753 6,012 6,346Net Profit (Rmbm) 3,414 3,519 3,581 3,802 4,027Core EPS (Rmb) 0.26 0.28 0.28 0.30 0.32Core EPS Growth (9.99%) 6.27% 1.74% 6.18% 5.93%FD Core P/E (x) 17.35 16.33 16.05 15.11 14.27DPS (Rmb) 0.12 0.12 0.12 0.13 0.14Dividend Yield 2.61% 2.65% 2.73% 2.85% 3.02%EV/EBITDA (x) 10.66 9.70 9.15 8.38 7.56P/FCFE (x) 34.90 16.61 15.39 14.80 13.94Net Gearing (10.0%) (13.4%) (27.2%) (36.3%) (44.1%)P/BV (x) 4.89 4.68 3.53 3.13 2.80ROE 27.6% 28.9% 25.1% 22.0% 20.7%% Change In Core EPS Estimates (0.82%) (0.47%)CIMB/consensus EPS (x) 1.04 1.08
▎ Hong Kong
HOLD (no change) Consensus ratings*: Buy 3 Hold 15 Sell 8
Current price: HK$5.08 Target price: HK$5.10 Previous target: HK$5.10
Up/downside: 0.4% CIMB / Consensus: 6.2%
Reuters: 0151.HK Bloomberg: 151 HK Market cap: US$8,186m HK$63,572m Average daily turnover: US$9.70m HK$76.21m Current shares o/s: 12,706m Free float: 48.5% *Source: Bloomberg Key changes in this note
FY17F EPS decreased by 0.8%. FY18F EPS decreased by 0.5%.
Source: Bloomberg
Price performance 1M 3M 12M Absolute (%) -7.3 3.9 -10.6 Relative (%) -7.8 -2.2 -27.2
Major shareholders % held Tsai Eng Meng 48.0 Wen Hsien Cheng 3.5
Analyst(s)
Lei YANG, CFA
T (86) 21 5047 1771 x108 E [email protected] ONG Khang Chuen T (852) 2539 1326 E [email protected]
64.076.088.0100.0112.0124.0
4.404.905.405.906.406.90
Price Close Relative to HSI (RHS)
20
40
60
Mar-16 Jun-16 Sep-16 Dec-16
Vol m
5

Utilities│India│Equity research│March 14, 2017
Sector Note
IMPORTANT DISCLOSURES, INCLUDING ANY REQUIRED RESEARCH CERTIFICATIONS, ARE PROVIDED AT THE END OF THIS REPORT. IF THIS REPORT IS DISTRIBUTED IN THE UNITED STATES IT IS DISTRIBUTED BY CIMB SECURITIES (USA), INC. AND IS CONSIDERED THIRD-PARTY AFFILIATED RESEARCH.
Powered by the EFA Platform
Gas Transmission & Dist Negative data points for LNG
Asia spot LNG prices have dropped sharply from 2 Jan-6 Mar 17, increasing the risk ■to GAIL’s US contracts.
India LNG imports dropped to a 20-month low in Jan 17. ■ The government of India’s scheme for gas-based power plants may not continue ■after Mar 17.
Maintain sector Underweight and Reduce rating on GAIL and Petronet LNG. ■
US LNG contract liability is main risk GAIL has sourced 5.8mt of LNG from the US and supply will start in 1QCY18. This gas is unlikely to be competitively priced in the US or Europe, given the fixed fee structure (US$3/mmbtu). A total of 68mmt of liquefaction capacity will come online in the US by 2020, of which only 9mmt is currently operational. We believe GAIL (and other contract holders) will try to recover as much of the fixed fee as possible by transporting gas. That physical flow alone will reduce the arbitrage opportunity, in our view.
Risk to GAIL’s US contracts have increased Asia spot LNG prices have dropped by US$4/mmbtu to US$5.95/mmbtu from 2 Jan-6 Mar 17 as prices have corrected with the onset of warmer weather. US Henry Hub (HH) price has corrected only US$1/mmbtu, indicating possible loss on GAIL’s US contracts. Recent pricing trends, with the pricing hubs contracting (lower loss/profit for GAIL) in winter months but remaining wide for rest of the year, are probably the shape of things to come. Recent weakening in oil prices, if sustained, would be negative for GAIL.
Some positive news on offloading of US contracts…. In CY16, GAIL disclosed the offloading of 0.5mmt of US LNG (to Shell as per news reports). In Feb 17, it disclosed that an additional 0.5mmt was sold. News reports in early Mar 17 stated GAIL executed a swap deal with trader Gunvor, under which GAIL will purchase 15 cargoes (0.8mmt) in Apr-Dec 17 at oil-linked prices and sell 10 cargoes (0.6mmt) from its US contract at HH-linked pricing.
…but opacity around contract risk mitigation will increase For the 1mmt US LNG sold, GAIL has yet to disclose the applicable time period (whether it matches the 20-year purchase liability) or pricing terms (whether full risk is passed to buyer irrespective of global pricing trend). The Gunvor contract implies clear sale of US LNG but could involve GAIL taking on pricing risk for the purchase contract (if spot prices drop below purchase price). It is going to be increasingly difficult to work out implications of such deals and we rely on underlying market prices to evaluate the risks.
Drop in Jan 17 LNG imports was a surprise While LNG import volumes declined marginally over Oct-Dec 16, they dropped sharply by 15% yoy in Jan 17 to a 20-month low. It is likely that the prevailing spot prices would have negative impact on near-term contract prices i.e. pricing for volumes delivered in Jan 17 was influenced by high spot pricing in 4QCY16. Furthermore, the absence of any announcements indicates that the government scheme to support gas-based power plants is likely to be discontinued after Mar 17.
Maintain Reduce on GAIL and Petronet LNG We maintain Reduce rating on GAIL, given the risk to its US LNG contracts. Near-term profitability may be hit by the close to 1-month shutdown of its new petrochemical cracker in Jan 17. For Petronet, we believe share re-rating is only justified if it exceeds its annual contract volume which we believe is unlikely. Likely discontinuation of the scheme to support gas-based power plants (contributes 5mmscmd in FY17F as per GAIL) and the drop in Jan 17 LNG volumes are negative data points for both stocks.
Figure 1: Gas pricing trend (US$/mmbtu)
0.00
2.00
4.00
6.00
8.00
10.00
12.00
Asia Spot LNG US Henry Hub
▎ India
Underweight (no change) Highlighted companies
GAIL India REDUCE, TP Rs282.0, Rs378.3 close
We believe that GAIL’s valuations should be at a discount to its reported ROE, given the risk of LNG contract liability, huge earnings volatility from LPG/petrochemical and its opaque gas-trading profits
Petronet LNG REDUCE, TP Rs280.0, Rs378.5 close
Re-rating of PLNG’s stock would only be justified if it exceeds its annual contract volume targets, which we believe is unlikely. With rising cash balances, clarity on use of cash could emerge as a key stock price driver.
Summary valuation metrics
Analyst(s)
Avadhoot SABNIS
T (91) 22 6602 5151 E [email protected]
P/E (x) Dec-16F Dec-17F Dec-18F
GAIL India 17.34 14.12 13.69 Petronet LNG 20.13 17.07 15.48
P/BV (x) Dec-16F Dec-17F Dec-18F
GAIL India 1.72 1.57 1.41 Petronet LNG 4.06 3.52 3.08
Dividend Yield Dec-16F Dec-17F Dec-18F
GAIL India 1.85% 1.98% 1.98%Petronet LNG 1.32% 1.73% 1.99%
6

Consumer Discretionary│Indonesia│Equity research│March 14, 2017
Sector Note
IMPORTANT DISCLOSURES, INCLUDING ANY REQUIRED RESEARCH CERTIFICATIONS, ARE PROVIDED AT THE END OF THIS REPORT. IF THIS REPORT IS DISTRIBUTED IN THE UNITED STATES IT IS DISTRIBUTED BY CIMB SECURITIES (USA), INC. AND IS CONSIDERED THIRD-PARTY AFFILIATED RESEARCH.
Powered by the EFA Platform
Retail Specialty seems to be the keyword in Valentine month ■ Feb CCI registered an uptick of 1.6% mom after three months of relatively flat data. ■ Jan RSI (Retail Sales Index) rose 6.3% yoy, slower than pundits’ expectation as
consumers recover from year-end festive hangover. ■ ACES recorded strong Feb sales in contrast with its peers, likely due to its niche
products offering. ■ RALS Feb sales disappointed as its target market fretted the possibility of fuel price
hikes. ■ Maintain Overweight sector rating, with RALS as our top pick.
Uptick in Feb 2017 CCI Consumer confidence index (CCI) finally registered an uptick of 1.6% mom in Feb to 117 after three months staying relatively flat at 115. A more optimistic outlook on jobs availability seemed to be the cause for cheers. Further scrutiny on the CCI reveals that consumers with monthly disposable income of more than Rp5m were the most confident while those on the other end of the spectrum were the most pessimistic. Concerns on possible fuel price hikes might have tampered with the confidence of the less well-to-do.
Retail sales in Jan 2017 - festive hangover A separate set of data released by the Central Bank showed that retail sales rose 6.3% in Jan 2017, lower than the pundits’ expectations of 9.4%. Spending in Jan 2017 slowed in almost every segment vs. the month before as Indonesian consumers recovered from the year-end festive hangover. Auto parts and accessories, together with information and communication goods, continue to be the top two fastest-growing segments.
Ace Hardware (ACES): Feb 2017 sales ACES’s Feb 2017 sales jumped 12.1% yoy to Rp390bn on the back of 5.8% SSSG. This was the highest SSSG ACES has recorded since its trough in Nov 2016. Discussions with management reveal that the increase in Feb SSSG was mainly volume-driven as the company has not made any substantial price adjustments. It seems that retailers with niche products outperformed retailers with generalised merchandise in Feb 2017.
Ramayana Lestari (RALS): Feb 2017 sales Feb sales declined 7.1% yoy to Rp421bn, 12.2% lower than its monthly target. 2M17 sales accounted for 11.2% of our FY17 forecast, and slightly behind its 3-year historical achievement of 12.4% for the first two months of the year. Its direct purchase (DP) unit seemed to be the drag, with a 2M17 sales decline of 4% yoy. This might be due to the company's shift in focus to consignment products, which saw 2M17 sales rise 2.5% yoy. Strong sales during the Eid holiday should determine RALS's FY17F sales achievement.
Maintain Overweight on the sector Retailers underperformed the JCI by 6-25% YTD. This reflects the uncertainties on the 1H16 sales of most retailers in Indonesia as consumption seemed to have languished following the government's tax amnesty (TA). Rise in electricity prices and concerns of possible future fuel price hikes did not inspire the confidence of Indonesian consumers. 2Q17 sales should be the pivot for FY17F should the consumers regain their confidence and willingness to spend during the Eid seasonal sales and back-to-school period.
Figure 1: CCI vs. RSI
SOURCES: CIMB RESEARCH, COMPANY
50
60
70
80
90
100
110
120
130
-30.0%
-20.0%
-10.0%
0.0%
10.0%
20.0%
30.0%
40.0%
RSI YoY (LHS) CCI (RHS)
▎ Indonesia
Overweight (no change) Highlighted companies
Ace Hardware Indonesia ADD, TP Rp1,050, Rp800 close
ACES is the pioneer home improvement retailer in Indonesia. In spite of new contenders such as Ikea and Courts, we think ACES will retain its market and mind shares in the home specialist category.
Ramayana Lestari ADD, TP Rp1,900, Rp1,175 close
RALS is a mass market retailer with more than 1m sq m of retail space under management. Turnaround of its supermarket business is a potential re-rating catalyst.
Summary valuation metrics
Analyst(s)
Linda LAUWIRA
T (62) 21 3006 1734 E [email protected] Kevie ADITYA T (62) 21 3006 E [email protected]
P/E (x) Dec-17F Dec-18F Dec-19F
Ace Hardware Indonesia 18.48 16.15 Ramayana Lestari 17.92 16.21
P/BV (x) Dec-17F Dec-18F Dec-19F
Ace Hardware Indonesia 3.98 3.46 Ramayana Lestari 2.22 2.09
Dividend Yield Dec-17F Dec-18F Dec-19F
Ace Hardware Indonesia 2.02% 2.44%Ramayana Lestari 2.99% 3.38%
7

Petrochemical│South Korea│March 14, 2017
Company Note
IMPORTANT DISCLOSURES, INCLUDING ANY REQUIRED RESEARCH CERTIFICATIONS, ARE PROVIDED AT THE END OF THIS REPORT. IF THIS REPORT IS DISTRIBUTED IN THE UNITED STATES IT IS DISTRIBUTED BY CIMB SECURITIES (USA), INC. AND IS CONSIDERED THIRD-PARTY AFFILIATED RESEARCH.
Powered by the EFA Platform
Lotte Chemical Strong 1Q17F earnings to be a near-term catalyst
We now expect 1Q17F operating profit (OP) to come in 11% higher than 4Q16 OP ■of W737bn (22% higher than our previous estimate).
Chemical spread movement has been mixed, as QTD PE/PP spread has narrowed ■slightly vs. 4Q16 average, while MEG/BD spread has widened significantly.
We raise FY17F EPS by 6% to reflect firmer 1Q17F earnings outlook; However, we ■maintain our view that Lotte’s earnings will decelerate in 2H17F.
We maintain our Add rating and GGM-based target price of W490,000. ■
Positive earnings momentum to continue in 1Q17F Given that QTD spreads for monoethylene glycol (MEG) and butadiene (BD) have risen by ~US$100/t and ~US$1,000/t qoq, we believe Lotte’s 1Q17F OP will be much higher than we had anticipated earlier. We now forecast 1Q17F OP to rise to W820bn (up 11% qoq and 73% yoy), 22% higher than our previous estimate. Despite the strong near-term earnings outlook, however, we maintain our view that the chemical cycle will face downturn from 2H17F due to new capacities starting up.
Robust chemical spreads prevailed in Jan/Feb… Chemical spreads were fairly robust in Jan and Feb, thanks to strong restocking demand before/after the Chinese New Year holidays in late-Jan/early-Feb. In particular, BD-naphtha spreads continued to increase from US$1,478/t in Dec-16 to US$2,300-2,500/t in Jan/Feb. Tight supply, along with speculative demand for natural rubber, positively influenced BD prices. MEG-naphtha spreads were also firm in the early part of the quarter, partly thanks to pockets of maintenance shutdown in Taiwan/Japan.
…but sharp contraction observed in early-Mar With restocking demand all but gone, chemical demand in Asia started to moderate in early-Mar. This, coupled with softening oil prices, caused chemical prices to weaken over the past few weeks. BD prices plunged US$800/t last week (spread down to ~US$1,600/t), while MEG and polyethylene (PE) prices declined by ~US$100/t to ~US$800/t and ~US$60/t to ~US$1,150/t, respectively, from their Feb peaks. The recent softness could have material impact on 2Q17F earnings, given the 1-month time lag.
FY17F OP raised 6% but FY18F OP maintained Based on the latest spread trends, we raise Lotte’s FY17F OP by 6%. The higher annual OP forecast is driven by the stronger 1Q17F outlook, as we largely maintain our forecasts for 2Q17F onwards. We reiterate our view that chemical earnings will peak in 1H17F, as ~8mt of new ethylene capacity is slated to come on stream this year (probably with some delays) compared to ~4mt in 2016. We forecast FY18F OP to decline 23% yoy to W2.0tr.
Maintain Add call as strong earnings should catalyse the stock We believe Lotte offers the best risk-return profile in the chemical space, given its strong near-term earnings prospects and attractive valuations (FY17F P/BV of 1.1x vs. FY17/18F ROE of 20.7%/13.9%). Lotte continues to seek opportunities to expand operations (now bidding for Jurong Aromatics’ assets) and address the long-term growth concerns. Maintain Add with GGM-based TP of W490,000, based on 1.5x FY17F P/BV (vs. 13.9% FY18F ROE). A key risk is faster downturn in the petrochemical cycle.
SOURCE: COMPANY DATA, CIMB FORECASTS
Financial Summary Dec-15A Dec-16A Dec-17F Dec-18F Dec-19F
Revenue (Wb) 11,713 13,223 14,128 13,037 12,993Operating EBITDA (Wb) 2,096 3,182 3,339 2,912 2,719Net Profit (Wb) 992 1,805 2,064 1,622 1,363Normalised EPS (W) 28,957 52,650 60,223 47,316 39,757Normalised EPS Growth 576% 82% 14% (21%) (16%)FD Normalised P/E (x) 12.48 6.87 6.00 7.64 9.09DPS (W) 2,500 4,000 4,000 4,000 4,000Dividend Yield 0.69% 1.11% 1.11% 1.11% 1.11%EV/EBITDA (x) 4.94 3.94 3.62 4.00 4.03P/FCFE (x) 6.70 NA 10.53 9.36 6.78Net Gearing (5.6%) 24.5% 17.6% 13.7% 8.9%P/BV (x) 1.65 1.37 1.13 1.00 0.91ROE 14.2% 21.8% 20.7% 13.9% 10.4%% Change In Normalised EPS Estimates 6.12% (0.43%)Normalised EPS/consensus EPS (x) 1.00 0.82 0.59
▎ South Korea
ADD (no change) Consensus ratings*: Buy 23 Hold 6 Sell 1
Current price: W361,500 Target price: W490,000 Previous target: W490,000
Up/downside: 35.5% CIMB / Consensus: 1.7%
Reuters: 011170.KS Bloomberg: 011170 KS Market cap: US$10,829m W12,390,564m Average daily turnover: US$34.96m W40,619m Current shares o/s: 34.28m Free float: 44.8% *Source: Bloomberg Key changes in this note
1Q17F EPS increased 21% FY17F EPS increased by 6%.
Source: Bloomberg
Price performance 1M 3M 12M Absolute (%) -10.8 0.8 14.6 Relative (%) -12.7 -3.2 7.2
Major shareholders % held Lotte Corp 31.3 Hotel Lotte 12.7 Lotte Holding 9.3
Analyst(s)
Peter K. LEE
T (82) 2 6730 6122 E [email protected] John PK PARK T (82) 2 6730 6125 E [email protected]
73.0
85.5
98.0
110.5
123.0
230,000
280,000
330,000
380,000
430,000Price Close Relative to KOSPI (RHS)
200
400
600
Mar-16 Jun-16 Sep-16 Dec-16
Vol t
h
8

Autos│Malaysia│March 14, 2017 Shariah Compliant
Company Note
IMPORTANT DISCLOSURES, INCLUDING ANY REQUIRED RESEARCH CERTIFICATIONS, ARE PROVIDED AT THE END OF THIS REPORT. IF THIS REPORT IS DISTRIBUTED IN THE UNITED STATES IT IS DISTRIBUTED BY CIMB SECURITIES (USA), INC. AND IS CONSIDERED THIRD-PARTY AFFILIATED RESEARCH.
Powered by the EFA Platform
Bermaz Auto Berhad Braking harder
9MFY4/17 core net profit was below expectations at 59%/60% of our/consensus ■FY17 forecasts due to lower-than-expected sales volume and negative forex impact.
Third interim dividend of 2.75 sen per share declared, in line with expectations. ■ Bermaz has received shareholders’ approval to proceed with BAP’s IPO in 2Q17. ■ We cut our FY17-19F EPS by 11-15% to account for lower volume growth and ■higher operating cost due to the strengthening yen against the ringgit.
Maintain Add with a lower target price of RM2.20, still based on 12.5x CY18F P/E. ■
Lower sales volume in Malaysia and the Philippines Revenue in 9MFY4/17 fell by 17% yoy due to lower sales volumes in both the Malaysia and Philippine markets, which dropped by 27% and 12%, respectively. Management attributed the lower sales volume to softer consumer demand in Malaysia, and intense competition and supply constraints for certain models in the Philippines. Overall, core net profit in 9MFY17 dropped 33% to RM99.8m, from RM149m a year ago, partly due to margin compression from currency weakness.
EBITDA margin improvement from shift in product mix 3QFY4/17 revenue dropped by 28% qoq and 35% yoy on the back of lower sales volume across the board. In spite of the lower sales, group EBITDA margin improved by 2.5% pts qoq and 2.2% pts yoy due to cost-saving initiatives. For example, Bermaz decided to lower sales volumes of its entry model vehicles, such as Mazda 2, which had become loss-making after the yen strengthened against the RM. The sales reduction in these loss-making models helped to offset the earnings weakness.
Bermaz Auto Philippines (BAP) IPO still on track for 2Q2017 Bermaz has received shareholders’ approval during its recent EGM to proceed with the listing of its BAP subsidiary in 2Q2017. It plans to sell 32.57m of its shares in BAP, which will reduce its stake from 60.4% to 52% post-listing. The net proceeds are expected to be utilised for the construction of a new operational and training facility in the Philippines. We think the listing exercise will unlock the value in BAP.
FY17-19F EPS forecasts cut by 11-15% We cut our FY17-19F EPS forecasts by 11-15% to account for lower volume growth in FY17F given persistently weak consumer sentiment and stronger yen vs. ringgit. We now project a 16% volume drop for FY17F (vs. 5% growth previously) and 10% volume growth in FY18F on new model launches. Nonetheless, we are still optimistic of stronger earnings growth in FY18F and beyond, with the introduction of new models like the new CX-5 and CX-9 CKD units, and stronger contributions from the Philippines operations.
Dividend still the bright spot Despite the lower earnings recorded in 9MFY4/17F, the company raised its dividend payout to 98% compared to 53% in 9MFY4/16. Bermaz declared its third interim dividend of 2.75 sen in 3QFY4/17, raising the total dividend declared to 8.5 sen in 9MFY4/17, up 23% yoy. The stock offers attractive FY17F/18F yields of 6.9%/7.4%.
Maintain Add with a lower target price We maintain Add with a lower RM2.20 target price, based on 12.5x CY18F P/E (3-year historical mean). Successful new model launches, higher dividend payouts and listing of BAP are rerating catalysts. Key risks to our call are delays in BAP’s IPO, further strengthening of the yen vs ringgit, and persistent weakness in consumer sentiment.
SOURCE: COMPANY DATA, CIMB FORECASTS
Financial Summary Apr-15A Apr-16A Apr-17F Apr-18F Apr-19F
Revenue (RMm) 1,830 2,095 1,798 2,126 2,383Operating EBITDA (RMm) 296.7 272.6 208.5 255.8 292.9Net Profit (RMm) 212.4 197.6 143.8 182.8 214.3Normalised EPS (RM) 0.19 0.17 0.13 0.16 0.19Normalised EPS Growth 52.4% (7.5%) (27.2%) 27.1% 17.3%FD Normalised P/E (x) 11.03 11.91 16.35 12.87 10.97DPS (RM) 0.14 0.17 0.14 0.15 0.17Dividend Yield 6.67% 8.28% 6.86% 7.35% 8.33%EV/EBITDA (x) 6.64 6.94 9.20 7.48 6.51P/FCFE (x) 12.72 10.89 15.99 13.09 11.49Net Gearing (57.0%) (65.1%) (63.1%) (61.4%) (58.9%)P/BV (x) 4.91 4.38 4.57 4.44 4.27ROE 52.0% 39.3% 27.6% 35.4% 40.1%% Change In Normalised EPS Estimates (14.7%) (11.6%) (11.0%)Normalised EPS/consensus EPS (x) 0.88 0.87 0.90
▎ Malaysia
ADD (no change) Consensus ratings*: Buy 9 Hold 3 Sell 0
Current price: RM2.04 Target price: RM2.20 Previous target: RM2.48
Up/downside: 7.9% CIMB / Consensus: -7.1%
Reuters: BERA.KL Bloomberg: BAUTO MK Market cap: US$528.3m RM2,349m Average daily turnover: US$0.56m RM2.53m Current shares o/s: 1,139m Free float: 38.6% *Source: Bloomberg Key changes in this note
FY17-19F Revenue decreased by 12-13%. FY17-19F EPS decreased by 11-15%.
Source: Bloomberg
Price performance 1M 3M 12M Absolute (%) -1 0.5 -5.6 Relative (%) -1.8 -4.3 -6.9
Major shareholders % held Dynamic Milestone 34.2 Berjaya Group 17.1 Employees Provident Fund 10.1
Analyst(s)
Mohd Shanaz NOOR AZAM
T (60) 3 2261 9078 E [email protected]
88.0
98.0
108.0
118.0
1.900
2.100
2.300
2.500Price Close Relative to FBMKLCI (RHS)
5
10
15
Mar-16 Jun-16 Sep-16 Dec-16
Vol m
9

Technology│Malaysia│Equity research│March 14, 2017
Sector Note
IMPORTANT DISCLOSURES, INCLUDING ANY REQUIRED RESEARCH CERTIFICATIONS, ARE PROVIDED AT THE END OF THIS REPORT. IF THIS REPORT IS DISTRIBUTED IN THE UNITED STATES IT IS DISTRIBUTED BY CIMB SECURITIES (USA), INC. AND IS CONSIDERED THIRD-PARTY AFFILIATED RESEARCH.
Powered by the EFA Platform
Semiconductor Gearing up for a stronger year ■ 4Q16 sector sales grew 8% qoq, driven by higher volume shipment and favourable
currency movement. This was in line with Malaysian E&E 4Q16 export value. ■ Key global semiconductor players expect 8% qoq sales drop in 1Q17 due to
seasonal demand weakness and shorter operating period. ■ We expect stronger sector earnings growth of 15% in 2017, driven by demand pick-
up in automotive and communication segments, led by Inari and MPI. ■ Maintain Neutral rating. We believe the stronger earnings outlook is priced in, as the
sector currently trades at 16x CY17F P/E, 1 s.d. above historical mean. ■ Inari is our sector top pick due to its robust earnings and strong key-client backing.
Boost in demand raised 4Q16 sector revenue Malaysian semiconductor sector revenue rose 8% qoq and 1.4% yoy in 4Q16, ahead of expectation due to higher utilisation on the back of demand recovery and favourable currency movements. This was broadly in line with global semiconductor sales which rose 5.4% qoq, driven by recovery in industry demand following inventory adjustments in 1H16. Key global semiconductor players are projecting 8% qoq sales drop in 1Q17, in line with seasonal demand weakness and a shorter operating period in the quarter.
Faster industry growth in 2017F Most independent industry research groups see stronger global semiconductor demand growth of 6% in 2017 (vs. 1.1% in 2016), driven by inventory replenishment from 2Q17, better ASPs and higher content application on the back of global economic recovery. Market research group WSTS expects North America to grow fastest at 4.7%, followed by Asia Pacific at 3.3% on the back strong demand for memory. Independent industry research firm Gartner projects a minimal 2.9% yoy capital spending growth in 2017.
Still riding the smartphone RF content growth We expect radio-frequency (RF) components demand to outgrow smartphone demand due to growing requirements for more frequency bands, especially with ongoing network modernisation. This bodes well for Inari, MPI and Unisem - as contract manufacturers for Broadcom, Qorvo and Skyworks (direct IP owners), they benefit from the surge in RF chip demand. However, we are wary of excess capacity from the slowdown in inventory replenishment given the spike in smartphone makers' inventory days since 2Q16.
Automotive poised to be the next sales growth driver We see automotive as the next sales growth driver due to rising adoption of electronics in vehicles for infotainment, safety features and connectivity. IC Insights forecasts 4.9% sales CAGR in 2015-2020 for automotive electronics, with rising integrated circuit (IC) content in new cars, from luxury to base models. We see MPI as an exciting proxy for automotive growth given its long experience and leading position in the segment. Sector net profit growth of 15% in 2017F We forecast sector net profit growth of 15% in 2017 (vs. 9% in 2016), driven by strong earnings growth by Inari and MPI. Inari is on track to add new RF tester capacity and receive maiden contributions from its new divisions in 2017. Meanwhile, we expect MPI to benefit from the ramping up of its new automotive sensor line from 2QCY17 onwards. Maintain Neutral. We think the sector's strong earnings growth outlook is fairly valued given that it now trades at 16x CY17F P/E, 1 s.d. above historical mean of 13x.
Figure 1: Malaysian semiconductor industry: historical core net profit and forecasts for 2017-18
SOURCES: CIMB, COMPANY
5920
88
276
443484
560596
0
100
200
300
400
500
600
700
2011 2012 2013 2014 2015 2016 2017F 2018F
RM m
Sector core net profit
▎ Malaysia
Neutral (no change) Highlighted companies
Inari-Amertron Bhd ADD, TP RM2.20, RM1.94 close
Inari plans to expand its RF tester capacity by c.10% from 700 to 780 RF testers by Mar 17 to fulfil demand from its key customer. We are also positive on the setting up its new division called Inari Optical Technology for the assembly and packaging of iris scanners for mobile applications.
Malaysian Pacific Industries
ADD, TP RM11.00, RM9.98 close
Aims to outperform the tepid 3-4% industry sales growth in 2017 (WSTS forecast), driven by the shift in product portfolio towards automotive and industrial segments. We expect FY16-19F EPS CAGR of 6%, driven by higher sales of newer and more advanced packages, as well as better operating efficiency.
Summary valuation metrics
Analyst(s)
Mohd Shanaz NOOR AZAM
T (60) 3 2261 9078 E [email protected]
P/E (x) Dec-17F Dec-18F Dec-19F
Inari-Amertron Bhd 16.57 13.80 Malaysian Pacific Industries 12.41 11.91
P/BV (x) Dec-17F Dec-18F Dec-19F
Inari-Amertron Bhd 4.76 4.09 Malaysian Pacific Industries 1.80 1.64
Dividend Yield Dec-17F Dec-18F Dec-19F
Inari-Amertron Bhd 3.30% 3.81%Malaysian Pacific Industries 2.53% 2.73%
10

Food & Beverages│Singapore│March 14, 2017
Company Note
IMPORTANT DISCLOSURES, INCLUDING ANY REQUIRED RESEARCH CERTIFICATIONS, ARE PROVIDED AT THE END OF THIS REPORT. IF THIS REPORT IS DISTRIBUTED IN THE UNITED STATES IT IS DISTRIBUTED BY CIMB SECURITIES (USA), INC. AND IS CONSIDERED THIRD-PARTY AFFILIATED RESEARCH.
Powered by the EFA Platform
Del Monte Pacific 3QFY17: DMFI continues to disappoint
9MFY17 reported net profit was below expectations at 59% of our FY4/17 forecast ■due to sales decline in the US and higher-than-expected interest expense.
Gross margin contracted to 14.7% in 3QFY17 due to lower pricing in non-retail ■channels. DMFI incurred net loss of US$14.6m in 3QFY17 (3Q16: US$17.3m profit).
However, DMPL continued to gain strength with 3QFY17 net profit of US$21.2m, an ■81% yoy gain.
Preference share issuance has been postponed again. We estimate the earliest that ■the issuance will take place is 2QCY17.
Maintain Hold with lower target price of S$0.35. ■
9MFY17 earnings below expectations 9MFY17 reported net profit was below expectations at 59% of our full-year forecast. During the quarter, the company incurred one-off expenses of US$12.4m (on pretax basis) related to DMFI.
Del Monte’s US business (DMFI) DMFI accounted for 75% of group revenue in 3QFY17. Sales declined 2.3% yoy in 3QFY17 due to continued weakness in the canned fruit industry and lower sales to private labels. Gross margin was also lower at 14.7% in 3QFY17 versus 15.5% in 3QFY16. In 3QFY17, DMFI retained its number one position in terms of market share for packaged vegetables and packaged fruit.
Del Monte’s Philippines business (DMPL) DMPL’s business is still in the pink of health, registering sales growth of 3.2% yoy in 3QFY17. S&W continued to make inroads with double-digit sales growth in the Asia Pacific region, driven by fresh pineapple and packaged products. The Asia Pacific region (DMPL + S&W brand) achieved gross margin of 33% in 3QFY17.
Update on debt situation Del Monte’s proposed preference share issuance of up to US$360m has been postponed again to 2QCY17. Depending on demand, management guided for an initial tranche of US$250m, with the balance issuable within the following three years. We deem the coupon cost that the group could be comfortable with at 6.5-7.0%. Net gearing fell to 5.48x at end-3QFY17 (2QFY17: 6.05x, 1QFY17: 5.32x).
Challenging outlook DMFI continues to present challenges to the group due to the ongoing industry contraction, changing consumer preferences and excess capacity in the industry. We believe that the group will have a clearer strategy in FY18F as the consultants would have presented their findings by then. We still expect the US business to incur one-off expenses in FY18F. The Del Monte brand still has strong presence in the US and we believe the group will focus on increasing sales of higher-margin branded products.
Maintain Hold We cut FY17-19F core EPS by 3-6% as we factor in the delay of preference share issuance to FY18F. We assume that the preference shares will be issued in an initial tranche of US$250m in FY18F, followed by two tranches of US$40m each in FY19-20F. Still based on P/E multiple of 11.3x (1 s.d. below the historical average of US peers), our target price is S$0.35. Upside risk is lower-than expected one-off expenses incurred by DMFI, while downside risks are deterioration in US sales and larger one-off expenses.
Financial Summary Apr-15A Apr-16A Apr-17F Apr-18F Apr-19F
Revenue (US$m) 2,187 2,268 2,237 2,322 2,413Operating EBITDA (US$m) 77.1 204.8 188.1 214.8 242.9Net Profit (US$m) (43.17) 51.53 31.07 29.97 47.41Core EPS (US$) (0.027) 0.027 0.016 0.015 0.024Core EPS Growth 7.2% (39.7%) (3.5%) 58.2%FD Core P/E (x) NA 9.20 15.25 15.80 9.99DPS (US$) - 0.013 - - - Dividend Yield 0.00% 5.45% 0.00% 0.00% 0.00%EV/EBITDA (x) 27.72 11.39 12.07 10.50 9.14P/FCFE (x) NA 4.81 3.10 NA 3.53Net Gearing 519% 493% 442% 179% 165%P/BV (x) 1.79 1.56 1.42 0.66 0.62ROE (19.2%) 18.1% 9.8% 8.6% 12.2%% Change In Core EPS Estimates (6.32%) (2.77%) (3.06%)CIMB/consensus EPS (x) 0.84 0.70 0.76
▎ Singapore
HOLD (no change) Consensus ratings*: Buy 0 Hold 3 Sell 0
Current price: S$0.35 Target price: S$0.35 Previous target: S$0.36
Up/downside: 0.4% CIMB / Consensus: -3.8%
Reuters: DMPL.SI Bloomberg: DELM SP Market cap: US$474.1m S$670.4m Average daily turnover: US$0.08m S$0.11m Current shares o/s: 1,944m Free float: 26.5% *Source: Bloomberg Key changes in this note
FY17F EPS decreased by 6.3%. FY18F EPS decreased by 2.8%. FY19F EPS decreased by 3.1%.
Source: Bloomberg
Price performance 1M 3M 12M Absolute (%) -1.4 3 -12.7 Relative (%) -2.5 -3.5 -24
Major shareholders % held NutriAsia Pacific Ltd 59.4 Bluebell Group Holdings 7.6 Lee Pineapple Co 5.5
Analyst(s)
William TNG, CFA
T (65) 6210 8676 E [email protected]
88.0
103.0
118.0
0.280
0.330
0.380Price Close Relative to FSSTI (RHS)
5101520
Mar-16 Jun-16 Sep-16 Dec-16
Vol m
11
Offshore & Marine│Singapore│March 14, 2017
Company Note
IMPORTANT DISCLOSURES, INCLUDING ANY REQUIRED RESEARCH CERTIFICATIONS, ARE PROVIDED AT THE END OF THIS REPORT. IF THIS REPORT IS DISTRIBUTED IN THE UNITED STATES IT IS DISTRIBUTED BY CIMB SECURITIES (USA), INC. AND IS CONSIDERED THIRD-PARTY AFFILIATED RESEARCH.
Powered by the EFA Platform
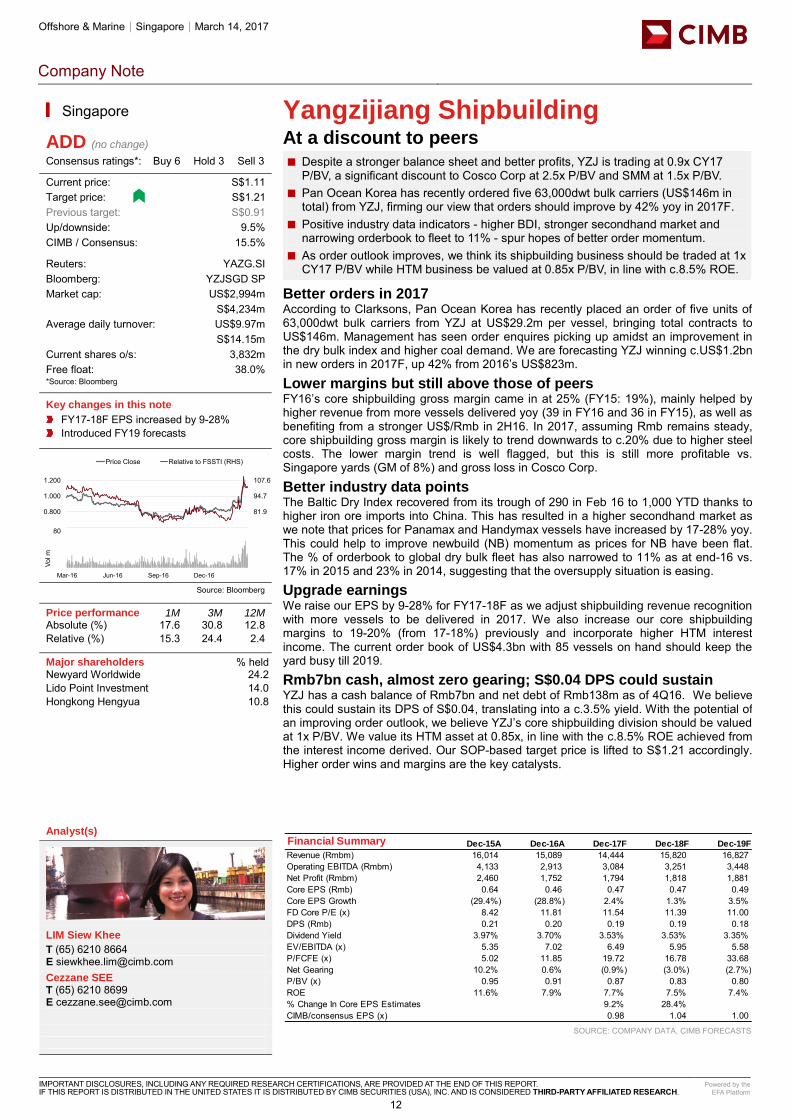
Yangzijiang Shipbuilding At a discount to peers
Despite a stronger balance sheet and better profits, YZJ is trading at 0.9x CY17 ■P/BV, a significant discount to Cosco Corp at 2.5x P/BV and SMM at 1.5x P/BV.
Pan Ocean Korea has recently ordered five 63,000dwt bulk carriers (US$146m in ■total) from YZJ, firming our view that orders should improve by 42% yoy in 2017F.
Positive industry data indicators - higher BDI, stronger secondhand market and ■narrowing orderbook to fleet to 11% - spur hopes of better order momentum.
As order outlook improves, we think its shipbuilding business should be traded at 1x ■CY17 P/BV while HTM business be valued at 0.85x P/BV, in line with c.8.5% ROE.
Better orders in 2017 According to Clarksons, Pan Ocean Korea has recently placed an order of five units of 63,000dwt bulk carriers from YZJ at US$29.2m per vessel, bringing total contracts to US$146m. Management has seen order enquires picking up amidst an improvement in the dry bulk index and higher coal demand. We are forecasting YZJ winning c.US$1.2bn in new orders in 2017F, up 42% from 2016’s US$823m.
Lower margins but still above those of peers FY16’s core shipbuilding gross margin came in at 25% (FY15: 19%), mainly helped by higher revenue from more vessels delivered yoy (39 in FY16 and 36 in FY15), as well as benefiting from a stronger US$/Rmb in 2H16. In 2017, assuming Rmb remains steady, core shipbuilding gross margin is likely to trend downwards to c.20% due to higher steel costs. The lower margin trend is well flagged, but this is still more profitable vs. Singapore yards (GM of 8%) and gross loss in Cosco Corp.
Better industry data points The Baltic Dry Index recovered from its trough of 290 in Feb 16 to 1,000 YTD thanks to higher iron ore imports into China. This has resulted in a higher secondhand market as we note that prices for Panamax and Handymax vessels have increased by 17-28% yoy. This could help to improve newbuild (NB) momentum as prices for NB have been flat. The % of orderbook to global dry bulk fleet has also narrowed to 11% as at end-16 vs. 17% in 2015 and 23% in 2014, suggesting that the oversupply situation is easing.
Upgrade earnings We raise our EPS by 9-28% for FY17-18F as we adjust shipbuilding revenue recognition with more vessels to be delivered in 2017. We also increase our core shipbuilding margins to 19-20% (from 17-18%) previously and incorporate higher HTM interest income. The current order book of US$4.3bn with 85 vessels on hand should keep the yard busy till 2019.
Rmb7bn cash, almost zero gearing; S$0.04 DPS could sustain YZJ has a cash balance of Rmb7bn and net debt of Rmb138m as of 4Q16. We believe this could sustain its DPS of S$0.04, translating into a c.3.5% yield. With the potential of an improving order outlook, we believe YZJ’s core shipbuilding division should be valued at 1x P/BV. We value its HTM asset at 0.85x, in line with the c.8.5% ROE achieved from the interest income derived. Our SOP-based target price is lifted to S$1.21 accordingly. Higher order wins and margins are the key catalysts.
SOURCE: COMPANY DATA, CIMB FORECASTS
Financial Summary Dec-15A Dec-16A Dec-17F Dec-18F Dec-19F
Revenue (Rmbm) 16,014 15,089 14,444 15,820 16,827Operating EBITDA (Rmbm) 4,133 2,913 3,084 3,251 3,448Net Profit (Rmbm) 2,460 1,752 1,794 1,818 1,881Core EPS (Rmb) 0.64 0.46 0.47 0.47 0.49Core EPS Growth (29.4%) (28.8%) 2.4% 1.3% 3.5%FD Core P/E (x) 8.42 11.81 11.54 11.39 11.00DPS (Rmb) 0.21 0.20 0.19 0.19 0.18Dividend Yield 3.97% 3.70% 3.53% 3.53% 3.35%EV/EBITDA (x) 5.35 7.02 6.49 5.95 5.58P/FCFE (x) 5.02 11.85 19.72 16.78 33.68Net Gearing 10.2% 0.6% (0.9%) (3.0%) (2.7%)P/BV (x) 0.95 0.91 0.87 0.83 0.80ROE 11.6% 7.9% 7.7% 7.5% 7.4%% Change In Core EPS Estimates 9.2% 28.4%CIMB/consensus EPS (x) 0.98 1.04 1.00
▎ Singapore
ADD (no change) Consensus ratings*: Buy 6 Hold 3 Sell 3
Current price: S$1.11 Target price: S$1.21 Previous target: S$0.91
Up/downside: 9.5% CIMB / Consensus: 15.5%
Reuters: YAZG.SI Bloomberg: YZJSGD SP Market cap: US$2,994m S$4,234m Average daily turnover: US$9.97m S$14.15m Current shares o/s: 3,832m Free float: 38.0% *Source: Bloomberg Key changes in this note
FY17-18F EPS increased by 9-28% Introduced FY19 forecasts
Source: Bloomberg
Price performance 1M 3M 12M Absolute (%) 17.6 30.8 12.8 Relative (%) 15.3 24.4 2.4
Major shareholders % held Newyard Worldwide 24.2 Lido Point Investment 14.0 Hongkong Hengyua 10.8
Analyst(s)
LIM Siew Khee
T (65) 6210 8664 E [email protected] Cezzane SEE T (65) 6210 8699 E [email protected]
69.0
81.9
94.7
107.6
0.600
0.800
1.000
1.200
Price Close Relative to FSSTI (RHS)
20406080
Mar-16 Jun-16 Sep-16 Dec-16
Vol m
12
Asia Pacific Daily│Equity research│March 15, 2017
REGIONAL HEAD
Michael William GREENALL Regional Head of Research +60 (3) 2261 9088 [email protected]
COUNTRY HEADS OF RESEARCH
Ivy NG, CFA Siew Khee. LIM Erwan TEGUH Kasem PRUNRATANAMALA, CFA Michael KOKALARI, CFA Malaysia Singapore Indonesia Thailand Vietnam +60 (3) 2261 9073 +65 6210 8664 +62 (21) 3006 1720 +66 (2) 657 9221 +84 907 974408 [email protected] [email protected] [email protected] [email protected] [email protected] Bertram LAI Dohoon LEE Eric LIN Pramod AMTHE Joyce Anne, RAMOS Hong Kong/China South Korea Taiwan India Philippines +852 2532 1111 +82 (2) 6730 6121 +886 (2) 8729 8380 +91 (22) 6602-5167 +63 (2) 888 7293 [email protected] [email protected] [email protected] [email protected] [email protected] Coverage via partnership arrangement with Yolan SEIMON SB Equities Sri Lanka +94 (11) 2306273 [email protected] Coverage via partnership arrangement with John Keells Stock Brokers
REGIONAL SECTOR HEADS
KJ KWANG Ivy NG, CFA Raymond YAP, CFA Offshore & Marine Plantations Transportation +82 (2) 6730 6123 +60 (3) 2261 9073 +60 (3) 2261 9072 [email protected] [email protected] [email protected]
7
13

Asia Pacific Daily│Equity research│March 15, 2017
DISCLAIMER WJV#05 The content of this report (including the views and opinions expressed therein, and the information comprised therein) has been prepared by and belongs to CIMB save that (i) if it is a report written by the analyst(s) of John Keells Stock Brokers (“John Keells”), it belongs to John Keells; (ii) if it is a report written by the analyst(s) of SB Equities Inc (“SBE”), it belongs to SBE; and (iii) if it is a report written by the analyst(s) of Morgans Financial Limited (“Morgans”), it belongs to Morgans. This report is distributed by CIMB and in respect of sections of the report relating to (i), (ii) and/or (iii) aforesaid, it is distributed pursuant to an arrangement between John Keells, SBE and Morgans respectively and none of the aforesaid parties is an affiliate of CIMB. This report is not directed to, or intended for distribution to or use by, any person or entity who is a citizen or resident of or located in any locality, state, country or other jurisdiction where such distribution, publication, availability or use would be contrary to law or regulation. By accepting this report, the recipient hereof represents and warrants that he is entitled to receive such report in accordance with the restrictions set forth below and agrees to be bound by the limitations contained herein (including the “Restrictions on Distributions” set out below). Any failure to comply with these limitations may constitute a violation of law. This publication is being supplied to you strictly on the basis that it will remain confidential. No part of this report may be (i) copied, photocopied, duplicated, stored or reproduced in any form by any means or (ii) redistributed or passed on, directly or indirectly, to any other person in whole or in part, for any purpose without the prior written consent of CIMB. The information contained in this research report is prepared from data believed to be correct and reliable at the time of issue of this report. CIMB, John Keells, SBE and/or Morgans, as the case may be, may or may not issue regular reports on the subject matter of this report at any frequency and may cease to do so or change the periodicity of reports at any time. None of CIMB, John Keells, SBE or Morgans is under any obligation to update this report in the event of a material change to the information contained in this report. None of CIMB, John Keells, SBE or Morgans has any and none of them will accept any, obligation to (i) check or ensure that the contents of this report remain current, reliable or relevant, (ii) ensure that the content of this report constitutes all the information a prospective investor may require, (iii) ensure the adequacy, accuracy, completeness, reliability or fairness of any views, opinions and information, and accordingly, CIMB, John Keells, SBE and Morgans and their respective affiliates and related persons (and their respective directors, associates, connected persons and/or employees) shall not be liable in any manner whatsoever for any consequences (including but not limited to any direct, indirect or consequential losses, loss of profits and damages) of any reliance thereon or usage thereof. In particular, CIMB, John Keells, SBE and Morgans disclaim all responsibility and liability for the views and opinions set out in this report. Unless otherwise specified, this report is based upon reasonable sources. Such sources will, unless otherwise specified, for market data, be market data and prices available from the main stock exchange or market where the relevant security is listed, or, where appropriate, any other market. Information on the accounts and business of company(ies) will generally be based on published statements of the company(ies), information disseminated by regulatory information services, other publicly available information and information resulting from our research. Whilst every effort is made to ensure that statements of facts made in this report are accurate, all estimates, projections, forecasts, expressions of opinion and other subjective judgments contained in this report are based on assumptions considered to be reasonable as of the date of the document in which they are contained and must not be construed as a representation that the matters referred to therein will occur. Past performance is not a reliable indicator of future performance. The value of investments may go down as well as up and those investing may, depending on the investments in question, lose more than the initial investment. No report shall constitute an offer or an invitation by or on behalf of CIMB, John Keells, SBE or Morgans or their respective affiliates to any person to buy or sell any investments. CIMB, John Keells, SBE and/or Morgans and/or their respective affiliates and related companies, their directors, associates, connected parties and/or employees may own or have positions in securities of the company(ies) covered in this research report or any securities related thereto and may from time to time add to or dispose of, or may be materially interested in, any such securities. Further, CIMB, John Keells, SBE and/or Morgans and/or their respective affiliates and related companies do and seek to do business with the company(ies) covered in this research report and may from time to time act as market maker or have assumed an underwriting commitment in securities of such company(ies), may sell them to or buy them from customers on a principal basis and may also perform or seek to perform significant investment banking, advisory, underwriting or placement services for or relating to such company(ies) as well as solicit such investment, advisory or other services from any entity mentioned in this report. CIMB, John Keells, SBE and/or Morgans and/or their respective affiliates may enter into an agreement with the company(ies) covered in this report relating to the production of research reports. CIMB, John Keells, SBE and/or Morgans may disclose the contents of this report to the company(ies) covered by it and may have amended the contents of this report following such disclosure. The analyst responsible for the production of this report hereby certifies that the views expressed herein accurately and exclusively reflect his or her personal views and opinions about any and all of the issuers or securities analysed in this report and were prepared independently and autonomously. No part of the compensation of the analyst(s) was, is, or will be directly or indirectly related to the inclusion of specific recommendations(s) or view(s) in this report. The analyst(s) who prepared this research report are prohibited from receiving any compensation, incentive or bonus based on specific investment banking transactions or for providing a specific recommendation for, or view of, a particular company. Information barriers and other arrangements may be established where necessary to prevent conflicts of interests arising. However, the analyst(s) may receive compensation that is based on his/their coverage of company(ies) in the performance of his/their duties or the performance of his/their recommendations and the research personnel involved in the preparation of this report may also participate in the solicitation of the businesses as described above. In reviewing this research report, an investor should be aware that any or all of the foregoing, among other things, may give rise to real or potential conflicts of interest. Additional information is, subject to the duties of confidentiality, available on request. The term “John Keells Stock Brokers” shall, unless the context otherwise requires, mean each of John Keells Stock Brokers and its affiliates, subsidiaries and related companies. The term “SB Equities Inc.” shall, unless the context otherwise requires, mean each of SB Equities Inc. and its affiliates, subsidiaries and related companies. The term “Morgans Financial Limited” shall, unless the context otherwise requires, mean each of Morgans Financial Limited and its affiliates, subsidiaries and related companies. The term “CIMB” shall denote, where appropriate, the relevant entity distributing or disseminating the report in the particular jurisdiction referenced below, or, in every other case, CIMB Group Holdings Berhad ("CIMBGH") and its affiliates, subsidiaries and related companies.
8
14

Asia Pacific Daily│Equity research│March 15, 2017
Country CIMB Entity Regulated by Hong Kong CIMB Securities Limited Securities and Futures Commission Hong Kong India CIMB Securities (India) Private Limited Securities and Exchange Board of India (SEBI) Indonesia PT CIMB Securities Indonesia Financial Services Authority of Indonesia Malaysia CIMB Investment Bank Berhad Securities Commission Malaysia Singapore CIMB Research Pte. Ltd. Monetary Authority of Singapore South Korea CIMB Securities Limited, Korea Branch Financial Services Commission and Financial Supervisory Service Taiwan CIMB Securities Limited, Taiwan Branch Financial Supervisory Commission Thailand CIMB Securities (Thailand) Co. Ltd. Securities and Exchange Commission Thailand
Information in this report is a summary derived from individual research reports. As such, readers are directed to the individual research report or note to review the individual Research Analyst’s full analysis of the subject company. Important disclosures relating to the companies that are the subject of research reports published by CIMB, John Keells, SBE or Morgans, as the case may be, and the proprietary position by each of them and shareholdings of its Research Analysts’ who prepared the report in the securities of the company(s) are available in the individual research report. This report does not purport to contain all the information that a prospective investor may require. CIMB, John Keells, SBE and Morgans and their respective affiliates do not make any guarantee, representation or warranty, express or implied, as to the adequacy, accuracy, completeness, reliability or fairness of any such information and opinion contained in this report. None of CIMB, John Keells, SBE, Morgans and their respective affiliates and related persons shall be liable in any manner whatsoever for any consequences (including but not limited to any direct, indirect or consequential losses, loss of profits and damages) of any reliance thereon or usage thereof. This report is general in nature and has been prepared for information purposes only. It is intended for circulation amongst CIMB and its affiliates’ clients generally and does not have regard to the specific investment objectives, financial situation and the particular needs of any specific person who may receive this report. The information and opinions in this report are not and should not be construed or considered as an offer, recommendation or solicitation to buy or sell the subject securities, related investments or other financial instruments or any derivative instrument, or any rights pertaining thereto. Investors are advised to make their own independent evaluation of the information contained in this research report, consider their own individual investment objectives, financial situation and particular needs and consult their own professional and financial advisers as to the legal, business, financial, tax and other aspects before participating in any transaction in respect of the securities of company(ies) covered in this research report. The securities of such company(ies) may not be eligible for sale in all jurisdictions or to all categories of investors. Australia : The distribution of this report is not an offer to buy or sell to any person within or outside Australia or a solicitation to any person within or outside of Australia to buy or sell any instrument described herein. This report is being issued outside Australia to a limited number of institutional investors and may not be provided to any person other than the original recipient and may not be reproduced or used for any other purposes. Canada: This research report has not been prepared in accordance with the disclosure requirements of Dealer Member Rule 3400 – Research Restrictions and Disclosure Requirements of the Investment Industry Regulatory Organization of Canada. For any research report distributed by CIBC, further disclosures related to CIBC conflicts of interest can be found at https://researchcentral.cibcwm.com . China: For the purpose of this report, the People’s Republic of China (“PRC”) does not include the Hong Kong Special Administrative Region, the Macau Special Administrative Region or Taiwan. The distributor of this report has not been approved or licensed by the China Securities Regulatory Commission or any other relevant regulatory authority or governmental agency in the PRC. This report contains only marketing information. The distribution of this report is not an offer to buy or sell to any person within or outside PRC or a solicitation to any person within or outside of PRC to buy or sell any instruments described herein. This report is being issued outside the PRC to a limited number of institutional investors and may not be provided to any person other than the original recipient and may not be reproduced or used for any other purpose. France: Only qualified investors within the meaning of French law shall have access to this report. This report shall not be considered as an offer to subscribe to, or used in connection with, any offer for subscription or sale or marketing or direct or indirect distribution of financial instruments and it is not intended as a solicitation for the purchase of any financial instrument. Germany: This report is only directed at persons who are professional investors as defined in sec 31a(2) of the German Securities Trading Act (WpHG). This publication constitutes research of a non-binding nature on the market situation and the investment instruments cited here at the time of the publication of the information. The current prices/yields in this issue are based upon closing prices from Bloomberg as of the day preceding publication. Please note that neither the German Federal Financial Supervisory Agency (BaFin), nor any other supervisory authority exercises any control over the content of this report. Hong Kong: This report is issued and distributed in Hong Kong by CIMB Securities Limited (“CHK”) which is licensed in Hong Kong by the Securities and Futures Commission for Type 1 (dealing in securities), Type 4 (advising on securities) and Type 6 (advising on corporate finance) activities. Any investors wishing to purchase or otherwise deal in the securities covered in this report should contact the Head of Sales at CIMB Securities Limited. The views and opinions in this research report are of CIMB, John Keells, SBE or Morgans, as the case may be, as of the date hereof and are subject to change. If the Financial Services and Markets Act of the United Kingdom or the rules of the Financial Conduct Authority apply to a recipient, our obligations owed to such recipient therein are unaffected. CHK has no obligation to update its opinion or the information in this research report. This publication is strictly confidential and is for private circulation only to clients of CHK. India: This report is issued and distributed in India by CIMB Securities (India) Private Limited (”CIMB India") which is registered with SEBI as a stock-broker under the Securities and Exchange Board of India (Stock Brokers and Sub-Brokers) Regulations, 1992, the Securities and Exchange Board of India (Research Analyst) Regulations, 2014 (SEBI Registration Number INH000000669) and in accordance with the provisions of Regulation 4 (g) of the Securities and Exchange Board of India (Investment Advisers) Regulations, 2013, CIMB India is not required to seek registration with SEBI as an Investment Adviser.
9
15

Asia Pacific Daily│Equity research│March 15, 2017
The research analysts, strategists or economists principally responsible for the preparation of this research report are segregated from equity stock broking and merchant banking of CIMB India and they have received compensation based upon various factors, including quality, accuracy and value of research, firm profitability or revenues, client feedback and competitive factors. Research analysts', strategists' or economists' compensation is not linked to investment banking or capital markets transactions performed or proposed to be performed by CIMB India or its affiliates.” Indonesia: This report is issued and distributed by PT CIMB Securities Indonesia (“CIMBI”). The views and opinions in this research report are our own as of the date hereof and are subject to change. If the Financial Services and Markets Act of the United Kingdom or the rules of the Financial Conduct Authority apply to a recipient, our obligations owed to such recipient therein are unaffected. CIMBI has no obligation to update its opinion or the information in this research report. Neither this report nor any copy hereof may be distributed in Indonesia or to any Indonesian citizens wherever they are domiciled or to Indonesian residents except in compliance with applicable Indonesian capital market laws and regulations. This research report is not an offer of securities in Indonesia. The securities referred to in this research report have not been registered with the Financial Services Authority (Otoritas Jasa Keuangan) pursuant to relevant capital market laws and regulations, and may not be offered or sold within the territory of the Republic of Indonesia or to Indonesian citizens through a public offering or in circumstances which constitute an offer within the meaning of the Indonesian capital market law and regulations. Ireland: CIMB is not an investment firm authorised in the Republic of Ireland and no part of this document should be construed as CIMB acting as, or otherwise claiming or representing to be, an investment firm authorised in the Republic of Ireland. Malaysia: This report is issued and distributed by CIMB Investment Bank Berhad (“CIMB”) solely for the benefit of and for the exclusive use of our clients. If the Financial Services and Markets Act of the United Kingdom or the rules of the Financial Conduct Authority apply to a recipient, our obligations owed to such recipient therein are unaffected. CIMB has no obligation to update, revise or reaffirm its opinion or the information in this research reports after the date of this report. New Zealand: In New Zealand, this report is for distribution only to persons who are wholesale clients pursuant to section 5C of the Financial Advisers Act 2008. Singapore: This report is issued and distributed by CIMB Research Pte Ltd (“CIMBR”). CIMBR is a financial adviser licensed under the Financial Advisers Act, Cap 110 (“FAA”) for advising on investment products, by issuing or promulgating research analyses or research reports, whether in electronic, print or other form. Accordingly CIMBR is a subject to the applicable rules under the FAA unless it is able to avail itself to any prescribed exemptions. Recipients of this report are to contact CIMB Research Pte Ltd, 50 Raffles Place, #19-00 Singapore Land Tower, Singapore in respect of any matters arising from, or in connection with this report. CIMBR has no obligation to update its opinion or the information in this research report. This publication is strictly confidential and is for private circulation only. If you have not been sent this report by CIMBR directly, you may not rely, use or disclose to anyone else this report or its contents. If the recipient of this research report is not an accredited investor, expert investor or institutional investor, CIMBR accepts legal responsibility for the contents of the report without any disclaimer limiting or otherwise curtailing such legal responsibility. If the recipient is an accredited investor, expert investor or institutional investor, the recipient is deemed to acknowledge that CIMBR is exempt from certain requirements under the FAA and its attendant regulations, and as such, is exempt from complying with the following : (a) Section 25 of the FAA (obligation to disclose product information); (b) Section 27 (duty not to make recommendation with respect to any investment product without having a reasonable basis where you may be reasonably expected to rely on the recommendation) of the FAA; (c) MAS Notice on Information to Clients and Product Information Disclosure [Notice No. FAA-N03]; (d) MAS Notice on Recommendation on Investment Products [Notice No. FAA-N16]; (e) Section 36 (obligation on disclosure of interest in securities), and (f) any other laws, regulations, notices, directive, guidelines, circulars and practice notes which are relates to the above, to the extent permitted by applicable laws, as may be amended from time to time, and any other laws, regulations, notices, directive, guidelines, circulars, and practice notes as we may notify you from time to time. In addition, the recipient who is an accredited investor, expert investor or institutional investor acknowledges that a CIMBR is exempt from Section 27 of the FAA, the recipient will also not be able to file a civil claim against CIMBR for any loss or damage arising from the recipient’s reliance on any recommendation made by CIMBR which would otherwise be a right that is available to the recipient under Section 27 of the FAA, the recipient will also not be able to file a civil claim against CIMBR for any loss or damage arising from the recipient’s reliance on any recommendation made by CIMBR which would otherwise be a right that is available to the recipient under Section 27 of the FAA. South Korea: This report is issued and distributed in South Korea by CIMB Securities Limited, Korea Branch (“CIMB Korea”) which is licensed as a cash equity broker, and regulated by the Financial Services Commission and Financial Supervisory Service of Korea. In South Korea, this report is for distribution only to professional investors under Article 9(5) of the Financial Investment Services and Capital Market Act of Korea (“FSCMA”). Spain: This document is a research report and it is addressed to institutional investors only. The research report is of a general nature and not personalised and does not constitute investment advice so, as the case may be, the recipient must seek proper advice before adopting any investment decision. This document does not constitute a public offering of securities. CIMB is not registered with the Spanish Comision Nacional del Mercado de Valores to provide investment services. Sweden: This report contains only marketing information and has not been approved by the Swedish Financial Supervisory Authority. The distribution of this report is not an offer to sell to any person in Sweden or a solicitation to any person in Sweden to buy any instruments described herein and may not be forwarded to the public in Sweden. Switzerland: This report has not been prepared in accordance with the recognized self-regulatory minimal standards for research reports of banks issued by the Swiss Bankers’ Association (Directives on the Independence of Financial Research). Taiwan: This research report is not an offer or marketing of foreign securities in Taiwan. The securities as referred to in this research report have
10
16
Asia Pacific Daily│Equity research│March 15, 2017
not been and will not be registered with the Financial Supervisory Commission of the Republic of China pursuant to relevant securities laws and regulations and may not be offered or sold within the Republic of China through a public offering or in circumstances which constitutes an offer or a placement within the meaning of the Securities and Exchange Law of the Republic of China that requires a registration or approval of the Financial Supervisory Commission of the Republic of China. Thailand: This report is issued and distributed by CIMB Securities (Thailand) Company Limited (“CIMBS”) based upon sources believed to be reliable (but their accuracy, completeness or correctness is not guaranteed). The statements or expressions of opinion herein were arrived at after due and careful consideration for use as information for investment. Such opinions are subject to change without notice and CIMBS has no obligation to update its opinion or the information in this research report. If the Financial Services and Markets Act of the United Kingdom or the rules of the Financial Conduct Authority apply to a recipient, our obligations owed to such recipient are unaffected. CIMB Securities (Thailand) Co., Ltd. may act or acts as Market Maker, and issuer and offerer of Derivative Warrants and Structured Note which may have the following securities as its underlying securities. Investors should carefully read and study the details of the derivative warrants in the prospectus before making investment decisions. AAV, ADVANC, AMATA, AOT, AP, BA, BANPU, BBL, BCH, BCP, BDMS, BEAUTY, BEC, BEM, BH, BIG, BLA, BLAND, BTS, CBG, CENTEL, CHG, CK, CKP, COM7, CPALL, CPF, CPN, DELTA, DTAC, EGCO, EPG, GLOBAL, GLOW, GPSC, GUNKUL, HANA, HMPRO, ICHI, IFEC, INTUCH, IRPC, ITD, IVL, KAMART, KBANK, KCE, KKP, KTB, KTC, LH, LHBANK, LPN, MAJOR, MINT, MTLS, PLANB, PSH, PTG, PTT, PTTEP, PTTGC, QH, ROBINS, RS, S, SAMART, SAWAD, SCB, SCC, SCN, SGP, SIRI, SPALI, SPCG, SPRC, STEC, STPI, SUPER, TASCO, TCAP, THAI, THANI, THCOM, TISCO, TKN, TMB, TOP, TPIPL, TRUE, TTA, TTCL, TTW, TU, TVO, UNIQ, VGI, VIBHA, VNG, WHA.
Corporate Governance Report: The disclosure of the survey result of the Thai Institute of Directors Association (“IOD”) regarding corporate governance is made pursuant to the policy of the Office of the Securities and Exchange Commission. The survey of the IOD is based on the information of a company listed on the Stock Exchange of Thailand and the Market for Alternative Investment disclosed to the public and able to be accessed by a general public investor. The result, therefore, is from the perspective of a third party. It is not an evaluation of operation and is not based on inside information. The survey result is as of the date appearing in the Corporate Governance Report of Thai Listed Companies. As a result, the survey result may be changed after that date. CIMBS does not confirm nor certify the accuracy of such survey result.
Score Range: 90 - 100 80 - 89 70 - 79 Below 70 or No Survey Result Description: Excellent Very Good Good N/A
United Arab Emirates: The distributor of this report has not been approved or licensed by the UAE Central Bank or any other relevant licensing authorities or governmental agencies in the United Arab Emirates. This report is strictly private and confidential and has not been reviewed by, deposited or registered with UAE Central Bank or any other licensing authority or governmental agencies in the United Arab Emirates. This report is being issued outside the United Arab Emirates to a limited number of institutional investors and must not be provided to any person other than the original recipient and may not be reproduced or used for any other purpose. Further, the information contained in this report is not intended to lead to the sale of investments under any subscription agreement or the conclusion of any other contract of whatsoever nature within the territory of the United Arab Emirates. United Kingdom: In the United Kingdom and European Economic Area, this report is being disseminated by CIMB Securities (UK) Limited (“CIMB UK”). CIMB UK is authorized and regulated by the Financial Conduct Authority and its registered office is at 27 Knightsbridge, London, SW1X7YB. Unless specified to the contrary, this report has been issued and approved for distribution in the U.K. and the EEA by CIMB UK. Investment research issued by CIMB UK has been prepared in accordance with CIMB Group’s policies for managing conflicts of interest arising as a result of publication and distribution of investment research. This report is for distribution only to, and is solely directed at, selected persons on the basis that those persons: (a) are eligible counterparties and professional clients of CIMB UK; (b) have professional experience in matters relating to investments falling within Article 19(5) of the Financial Services and Markets Act 2000 (Financial Promotion) Order 2005 (as amended, the “Order”), (c) fall within Article 49(2)(a) to (d) (“high net worth companies, unincorporated associations etc”) of the Order; (d) are outside the United Kingdom subject to relevant regulation in each jurisdiction, or (e) are persons to whom an invitation or inducement to engage in investment activity (within the meaning of section 21 of the Financial Services and Markets Act 2000) in connection with any investments to which this report relates may otherwise lawfully be communicated or caused to be communicated (all such persons together being referred to as “relevant persons”). This report is directed only at relevant persons and must not be acted on or relied on by persons who are not relevant persons. Any investment or investment activity to which this report relates is available only to relevant persons and will be engaged in only with relevant persons. Where this report is labelled as non-independent, it does not provide an impartial or objective assessment of the subject matter and does not constitute independent “investment research” under the applicable rules of the Financial Conduct Authority in the UK. Consequently, any such non-independent report will not have been prepared in accordance with legal requirements designed to promote the independence of investment research and will not subject to any prohibition on dealing ahead of the dissemination of investment research. Any such non-independent report must be considered as a marketing communication. United States: This research report is distributed in the United States of America by CIMB Securities (USA) Inc, a U.S. registered broker-dealer and a related company of CIMB Research Pte Ltd, CIMB Investment Bank Berhad, PT CIMB Securities Indonesia, CIMB Securities (Thailand) Co. Ltd, CIMB Securities Limited, CIMB Securities (India) Private Limited, and is distributed solely to persons who qualify as “U.S. Institutional Investors” as defined in Rule 15a-6 under the Securities and Exchange Act of 1934. This communication is only for Institutional Investors whose ordinary business activities involve investing in shares, bonds, and associated securities and/or derivative securities and who have professional experience in such investments. Any person who is not a U.S. Institutional Investor or Major Institutional Investor must not rely on this communication. The delivery of this research report to any person in the United States of America is not a recommendation to effect any transactions in the securities discussed herein, or an endorsement of any opinion expressed herein. CIMB Securities (USA) Inc, is a FINRA/SIPC member and takes responsibility for the content of this report. For further information or to place an order in any of the above-mentioned
11
17

Asia Pacific Daily│Equity research│March 15, 2017
securities please contact a registered representative of CIMB Securities (USA) Inc. Other jurisdictions: In any other jurisdictions, except if otherwise restricted by laws or regulations, this report is only for distribution to professional, institutional or sophisticated investors as defined in the laws and regulations of such jurisdictions.
Corporate Governance Report of Thai Listed Companies (CGR). CG Rating by the Thai Institute of Directors Association (Thai IOD) in 2016, Anti-Corruption 2016. AAV – Very Good, n/a, ADVANC – Very Good, Certified, AEONTS – Good, n/a, AMATA – Excellent, Declared, ANAN – Very Good, Declared, AOT – Excellent, Declared, AP – Very Good, Declared, ASK – Very Good, Declared, ASP – Very Good, Certified, BANPU – Very Good, Certified, BAY – Excellent, Certified, BBL – Very Good, Certified, BCH – not available, Declared, BCP - Excellent, Certified, BEM – Very Good, n/a, BDMS – Very Good, n/a, BEAUTY – Good, Declared, BEC - Good, n/a, BH - Good, Declared, BIGC - Excellent, Declared, BJC – Good, n/a, BLA – Very Good, Certified, BPP – not available, n/a, BTS - Excellent, Certified, CBG – Good, n/a, CCET – not available, n/a, CENTEL – Very Good, Certified, CHG – Very Good, n/a, CK – Excellent, n/a, COL – Very Good, Declared, CPALL – not available, Declared, CPF – Excellent, Declared, CPN - Excellent, Certified, DELTA - Excellent, Declared, DEMCO – Excellent, Certified, DTAC – Excellent, Certified, EA – Very Good, Declared, ECL – Good, Certified, EGCO - Excellent, Certified, EPG – Good, n/a, GFPT - Excellent, Declared, GLOBAL – Very Good, Declared, GLOW – Very Good, Certified, GPSC – Excellent, Declared, GRAMMY - Excellent, n/a, GUNKUL – Very Good, Declared, HANA - Excellent, Certified, HMPRO - Excellent, Declared, ICHI – Very Good, Declared, INTUCH - Excellent, Certified, ITD – Good, n/a, IVL - Excellent, Certified, JAS – not available, Declared, JASIF – not available, n/a, JUBILE – Good, Declared, KAMART – not available, n/a, KBANK - Excellent, Certified, KCE - Excellent, Certified, KGI – Good, Certified, KKP – Excellent, Certified, KSL – Very Good, Declared, KTB - Excellent, Certified, KTC – Excellent, Certified, LH - Very Good, n/a, LPN – Excellent, Declared, M – Very Good, Declared, MAJOR - Good, n/a, MAKRO – Good, Declared, MALEE – Very Good, Declared, MBKET – Very Good, Certified, MC – Very Good, Declared, MCOT – Excellent, Declared, MEGA – Very Good, Declared, MINT - Excellent, Certified, MTLS – Very Good, Declared, NYT – Excellent, n/a, OISHI – Very Good, n/a, PLANB – Very Good, Declared, PSH – not available, n/a, PSL - Excellent, Certified, PTT - Excellent, Certified, PTTEP - Excellent, Certified, PTTGC - Excellent, Certified, QH – Excellent, Declared, RATCH – Excellent, Certified, ROBINS – Very Good, Declared, RS – Very Good, n/a, SAMART - Excellent, n/a, SAPPE - Good, n/a, SAT – Excellent, Certified, SAWAD – Good, n/a, SC – Excellent, Declared, SCB - Excellent, Certified, SCBLIF – not available, n/a, SCC – Excellent, Certified, SCN – Good, Declared, SCCC - Excellent, Declared, SIM - Excellent, n/a, SIRI - Good, n/a, SPALI - Excellent, Declared, SPRC – Very Good, Declared, STA – Very Good, Declared, STEC – Excellent, n/a, SVI – Excellent, Certified, TASCO – Very Good, Declared, TCAP – Excellent, Certified, THAI – Very Good, Declared, THANI – Very Good, Certified, THCOM – Excellent, Certified, THRE – Very Good, Certified, THREL – Very Good, Certified, TICON – Very Good, Declared, TISCO - Excellent, Certified, TK – Very Good, n/a, TKN – Good, n/a, TMB - Excellent, Certified, TOP - Excellent, Certified, TPCH – Good, n/a, TPIPP – not available, n/a, TRUE – Very Good, Declared, TTW – Very Good, Declared, TU – Excellent, Declared, UNIQ – not available, Declared, VGI – Excellent, Declared, WHA – not available, Declared, WHART – not available, n/a, WORK – not available, n/a.
Companies participating in Thailand’s Private Sector Collective Action Coalition Against Corruption programme (Thai CAC) under Thai Institute of Directors (as of October 28, 2016) are categorized into: - Companies that have declared their intention to join CAC, and - Companies certified by CAC
CIMB Recommendation Framework Stock Ratings Definition: Add The stock’s total return is expected to exceed 10% over the next 12 months. Hold The stock’s total return is expected to be between 0% and positive 10% over the next 12 months. Reduce The stock’s total return is expected to fall below 0% or more over the next 12 months. The total expected return of a stock is defined as the sum of the: (i) percentage difference between the target price and the current price and (ii) the forward net dividend yields of the stock. Stock price targets have an investment horizon of 12 months.
Sector Ratings Definition: Overweight An Overweight rating means stocks in the sector have, on a market cap-weighted basis, a positive absolute recommendation. Neutral A Neutral rating means stocks in the sector have, on a market cap-weighted basis, a neutral absolute recommendation. Underweight An Underweight rating means stocks in the sector have, on a market cap-weighted basis, a negative absolute recommendation.
Country Ratings Definition: Overweight An Overweight rating means investors should be positioned with an above-market weight in this country relative to benchmark. Neutral A Neutral rating means investors should be positioned with a neutral weight in this country relative to benchmark. Underweight An Underweight rating means investors should be positioned with a below-market weight in this country relative to benchmark.
12
18