Embed Size (px)
Citation preview

China‘s New Trade Issues
in The Post-WTO Accession Era
Poverty Reduction and Economic Management Unit
East Asia and Pacific Region
World Bank
Pub
lic D
iscl
osur
e A
utho
rized
Pub
lic D
iscl
osur
e A
utho
rized
Pub
lic D
iscl
osur
e A
utho
rized
Pub
lic D
iscl
osur
e A
utho
rized

Table of Contents
Foreword i Acknowledgments ii Glossary of Abbreviations and Acronyms iii
Introduction and Overview 1
Part I Guideline to Free Trade Agreement Negotiation 11 1 Status Quo of The Development of China‘s FTAs 11 2 Market Access Provisions 19 3 Rules of Origin 25 4 Disputes Settlement in Free Trade Agreements 32 5 Managing Multiple Trade Negotiations in Services 39 6 FTAs in Services—Positive vs Negative List Approach 44 7 Labor Mobility Provisions in FTAs: Lessons for China 52 8 Competition Provisions in FTAs: Lessons for China 67 9 Environment Provisions in FTAs: Lessons for China 76
Part II China Options in The Post-WTO Accession Era 88 10 Tariff Policy for Cotton Imports in China 88 11 Rethinking Trade and Poverty Linkages: Implications of the Doha Round Negotiations for
China‘s Agriculture 97 12 Trade and the Environmental Debate 114
Part III Promoting Trade in Services 127 13 Trade in Services Overview 127 14 Lessons From Leaders In Services Trade 132
Korea 132 India 136 European Union 140 United States 144 Japan 150 China, Hong Kong Special Administrative Region 156
15 Promoting Trade in Services: Case Studies 166 Information technology services 167 Transport 179 Animation 192

Tables:
Table 1.1 Status of China‘s regional trade agreements by end-October, 2008 ................. 18 Table 3 A.1 Rules of Origin in East Asian FTAs ............................................................. 31
Table 4.1 Key Elements to be Considered while Designing Dispute Settlement Provisions
of RTAs ............................................................................................................................. 37 Table 4.2 Choice of Forum Clauses in RTAs ................................................................... 38 Table 6.1 Scheduling approaches in East Asian FTAs ..................................................... 46 Table 10.1 Key statistics on cotton production and trade in China, marketing years....... 88
Table 10.2 Applied over-quota tariff generated by the 2007 formula .............................. 90 Table 10.3 China‘s Net Exports of Processed Cotton, 2006............................................. 91 Table 10.4 China: Cotton Production, Trade and Disappearance ..................................... 91 Table 10.5 Tariff bindings on selected cotton products and substitutes ........................... 93
Table 11.1 Comparisons between China‘s import tariff and external tariffs in 2006 ...... 98 Table 11.2 Proposed tariff reductions of agricultural commodities ................................ 99
Table 11.3 Comparisons of USA, G20 and EU proposals on agricultural domestic support
policy............................................................................................................................... 100
Table 11.4 The macro impacts on China under EU, G20 and USA proposals in 2015 .. 102 Table 11.5 Impacts on China‘s import of major agricultural commodities .................... 103 Table 11.6 Impacts on China‘s export of major agricultural commodities .................... 104
Table 11.7 The impacts on production in China under different scenarios in 2015 ....... 106 Table 11.8 The impacts on per capita agricultural income in rural area by income groups
......................................................................................................................................... 108 Table 11.9 Shares of output values for competitive and noncompetitive agricultural
products for different groups of farmers under baseline in 2015.................................... 109
Table 11.10 Impacts on per capita agricultural income of different farmers by province
......................................................................................................................................... 111 Table 12.1 Top Chinese ―Climate-Friendly‖ Exports..................................................... 119 Table 12.2 Impact of a US trade-related climate measure on Chinese exports .............. 121
Table 13.1 Examples of Restrictions on Trade in Services ............................................ 129 Table 14.1 Leading Exporters of Other Commercial Services for 2006 ........................ 132
Table 14.2 Korea's Focus on Transparency in the Marketplace ..................................... 134 Table 14.3 Korea's Focus on Competition Policy ........................................................... 135
Table 14.4 Examples of Korean Service Industry Policy Tools ..................................... 136 Table 14.5 Impact of Poor Regulatory & Administrative Quality on Service Firms ..... 139 Table 14.6 Leading Exporters of Trav., Transport., Other Commercial Services 2006 . 143 Table 14.7 Gross Value Added Growth and Contributions ............................................ 145 Table 14.8 Capital Inputs to the Knowledge Economy .................................................. 145
Table 14.9 US Commercial Service Activities ............................................................... 147 Table 14.10 Examples of Singapore Service Industry Policy Tools .............................. 150
Table 14.11 Policies to Address Service Industries Weaknesses ................................... 153 Table 14.12 Competition in Wholesale & Retail ............................................................ 153 Table 14.13 Primary Practices for Service Export Success ............................................ 154 Table 14.14 Examples of Japan Service Industry Policy Tools...................................... 155 Table 14.15 Hong Kong SAR Services % of GDP ......................................................... 157 Table 14.16 Trade Barriers to Environmental Service Industries................................... 158

Table 14.17 Examples of HKSAR Service Industry Policy Tools ................................. 160
Table 15.1 Sample Factors Influencing Export of Computer and Information Services 168 Table 15.2 Average Annual IT Salary in Dollars for Selected Countries, 2006 ............ 171 Table 15.3 Favorable Labor Pool Attributes for IT firms ............................................... 172
Table 15.4 The Philippines BPO Industry Overview 2005/2006 ................................... 176 Table 15.5 Percentage of Total Software Revenues Spent on Pirated Software, 2006 .. 179 Table 15.6 Sample Industry Value Chain ....................................................................... 195 Table 15.7 Sample Internet Interests of Conglomerates ................................................. 196 Table 15.8 Sample Animated Feature Filmsure Films ................................................... 196
Figures:
Figure 2.1 Distribution of Liberalization by RTA ............................................................ 23 Figure 2.2 Distribution of Liberalization by RTA Parties in Chapters, Year 10 .............. 23
Figure 2.3 Coverage of Agricultural Provisions in Selected RTAs .................................. 24
Figure 2.4 Coverage of Textile Provisions in Selected RTAs .......................................... 24 Figure 3.1 ROOs are not cheap! ....................................................................................... 28
Figure 3.2 Trade impact of preference margins ................................................................ 28 Figure 4.1 Main Steps in Dispute Settlement ................................................................... 34 Figure 12.1 Comparison of Import/Export Ratios in Climate Friendly Technologies ... 118
Figure 13.1 Services Value Added (% of GDP) ............................................................. 127 Figure 13.2 Services Policy Dialogue in a Supportive Environment ............................. 131 Figure 14.1 Korea % Value Added by Activity .............................................................. 133
Figure 14.2 2006 Commercial Services Exports ............................................................ 140 Figure 14.3 Service Industry Clusters ............................................................................. 148
Figure 14.4 Magnets to Attract Service Industry Talent ................................................. 149
Figure 14.5 Services Productivity and Enabling Environment ....................................... 151
Figure 15.1 Major Exporters & Importers of Cmp. & Inf. Services, 2005 ..................... 168 Figure 15.2 Worldwide Services Spending by Foundation Market ................................ 172
Figure 15.3 Worldwide Services Spending by Foundation Market ................................ 173 Figure 15.4 Worldwide IT Spending by Vertical Market ............................................... 173 Figure 15.5 Structure of Transportation Services Exports Extra-EU (25), 2005............ 181
Figure 15.6 Structure of Transportation Services Exports United States, 2005 ............. 181 Figure 15.7 Trade in Transportation Services with China in 2005 ................................. 182
Figure 15.8 Development of Intl. Seaborne Trade, Selected Years ................................ 183 Figure 15.9 Destination of 05‘ US Exports of Audiovisual & Related Services ............ 193
Boxes:
Box 8.1 Models of Competition Regimes in RTAs .......................................................... 70
Box 9.1 Provisions on Environment in U.S. RTAs .......................................................... 82 Box 9.2 Environment Related Rights and Obligations under EU RTAs .......................... 85 Box 12.1 Chinese Submission to the WTO on ‗Common‘ and ‗Development‘ Lists .... 117

i
Foreword
The past eight years witnessed China‘s phenomenal growth and integration into the world
economy, expedited by its accession to the WTO in 2001. The accession greatly accelerated
China‘s domestic reforms. By the end of 2007, China was ranked the second largest exporter
and third largest trader in the world after its exports grew at over 20 percent per year for the
sixth year in a row. The increasing competitiveness of China has been driving the efficiency of
production, innovation and growth of global exports to new heights. Regional production
networks in East Asia grew substantially in the past few years and were largely centered on
China.
From China‘s perspective, accession to the WTO means more than the secure and
nondiscriminatory access to the world market and gains in export. The accession provides
China the platform and incentives to make more decisive strides in its already progressive
reform. It lays a single multilateral basis for the country to develop trade relationships with its
partners where openness can go further. It also puts the country at an international level to
fulfill its legal and regulatory commitments, among others, in a transparent and rule-based
global trading system.
As China continues its trade reform process, its focus has shifted to the ―second generation‖
issues that are now emerging. Like other countries, China has embarked on a series of Free
Trade Agreements negotiations, including with Chile, Singapore, Australia, New Zealand,
Norway, and Peru. China is also gearing up towards expanding its services trade, which now
account for about 20 per cent of global trade. Environmental protection are high on China‘s
agenda, especially in the context of the WTO where issues such as environmental products are
being negotiated.
This volume aims to help guide policymakers in assessing the second generation trade issues
and their development impact on China by presenting lessons from other countries and policy
options. Trade is a strategic area in which the World Bank has been working closely with
China with the aim to promote the country‘s participation in the multinational economic
institutions, to reduce its barriers to trade and investment, and to involve it more in global
development and cross-border learning initiatives. This volume would not have been possible
without collaboration with the Chinese Ministries of Finance, Commerce, and Agriculture. It
has also incorporated valuable contributions from Chinese researchers in the trade area. Studies
in this collection have been disseminated in a series of workshops and learning events co-
organized by the World Bank and the Chinese counterparts in Beijing, which served as a forum
for policy dialogue among the Chinese policy makers, trade negotiators, and scholars from
development and international perspectives. We sincerely hope that the publishing of this
collection in Chinese will extend this forum as it reaches a wider Chinese audience.
James W. Adams
Vice President
The World Bank

ii
Acknowledgments
This book of selected papers is based on a series of workshops held during 2006-2009 in
Beijing. These workshops were co-organized by the Ministry of Commerce and the World
Bank to discuss the preliminary findings of the studies undertaken under the Trade and Poverty
Project. The project was supervised by a core team led by Min Zhao (Task Team Leader) and
including Mona Haddad and William Martin. Throughout the implementation of the project,
we cooperated with the U.K. Department for International Development (DFID), which
generously supported the research and other activities financially and intellectually.
It would not have been possible without the work and contributions of a large number of
friends and colleagues. We would like to thank the speakers and authors, who gave their time
and energy to prepare their papers: Frederick Abbott (Florida State University College of Law),
Guobin Cui (Tsinghua University School of Law), Kamala Dawar (independent consultant),
Henry Gao (University of Hong Kong), Gary Hufbauer (Peterson Institute for International
Economics), Jinkun Huang (Center for Chinese Agriculture Policy), Martin Molinuevo (World
Trade Institute), Linda Schmid (independent consultant), Anuradha R.V. (independent
consultant), Gregory Sergi (Duke University School of Law), Lanye Zhu (East China
University of Politics and Law), as well as Silja Baller, Olivier Cattaneo, Jean-Pieer Chauffour,
Carsten Fink, Muthukumara Mani, and Constantinos Stephanou from the World Bank. This
book was prepared under the overall guidance from Bert Hofman (ex-Lead Economist) and
Ardo Hansson (Lead Economist). David Dollar (Country Director) and Vikram Nehru (Sector
Director) provided oversight.
We would like to thank the Ministry of Commerce, People‘s Republic of China, in particular,
Vice Minister Yi Xiaozhun and Deputy Director-General Zhu Hong, for their guidance,
support and cooperation during the implementation of the project, and the more than 200
participants in these workshops whose lively engagement prompted challenging discussions
and offered comments and suggestions. Finally, we deeply appreciate the cheerful and
dedicated assistance of Jianqing Chen and Zijing Niu of the World Bank Beijing Office for
their excellent support.
The findings, interpretations and conclusions expressed herein are those of the author(s) and do
not necessarily reflect the views of the Board of Executive Directors of the World Bank or the
governments they represent, or of the UK Department for International Development.

iii
Glossary of Abbreviations and Acronyms
ACFTA ASEAN-China FTA
ADR American Depository Receipt
AEO Authorized Economic Operator
AFTA ASEAN Free Trade Area
AKFTA ASEAN-Korea FTA
ANZCEFTA Australia New Zealand Closer Economic Relations Trade Agreement
ASEAN Association of South East Asian Nations
BEA Bilateral Emergency Actions
BIS Bank for International Settlements
BPO Business Process Outsourcing
CACM Central American Common Market CBD Convention on Biological Diversity
CEPA Closer Economic Partnership Arrangement
CGI Computer Generated Imagery
COMESA Common Market for Eastern and Southern Africa
CPRC Competition Policy Review Committee
CTC Change in Tariff Classification
CTE Committee on Trade and Environment
C-TPAT Customs-Trade Partnership Against Terrorism
DDA Doha Development Agenda
DDR Doha Development Round
DFID U.K. Department for International Development
DSB Dispute Settlement Body
EBS Equitable Benefit Sharing
EFTA European Free Trade Association
EGS Environmental Goods and Services
EPA Economic Partnership Agreement
EPPs Environmentally Preferable Products
ERC Economic Review Committee
EU European Union
FDI Foreign Direct Investment
FTAs Free-Trade Agreements
GAQSIQ General Administration for Quality Supervision, Inspection and
Quarantine
GATS General Agreement on Trade in Services
GATT General Agreement on Tariffs and Trade
GCC Gulf Cooperation Council
GDP Gross Domestic Product
GHG Greenhouse Gas GI Geographical Indication
GLCs Government Linked Companies
IP Intellectual Property

iv
H5N1 Avian Flu Virus
IAIS International Association of Insurance Supervisors
ICAC International Cotton Advisory Committee
ICT Information Communication Technology
ICTSD International Centre for Trade and Sustainable Development
ILO International Labor Organization
IMF International Monetary Fund
IMHGR Interim Measures on Human Genetic Resources
IMO International Maritime Organization
IOSCO International Organization of Securities Commissions
IPR Intellectual Property Rights
ISM Code International Safety Management Code
ISPS International Ship and Port Security Code
JETRO Japan External Trade Organization
JFTC Japan Fair Trade Commission
JMEPA Japan- Malaysia Economic Partnership Agreement
JSEPA Japan-Singapore Economic Partnership Agreement
KFTC Korea Fair Trade Commission
KSFTA Korea-Singapore FTA
LDCs Least Developed Countries
MEAs Multinational Environmental Agreements
MERCOSUR Southern Common Market
METI Ministry of Economy, Trade and Industry
MFN Most-Favored-Nations
MNP Movement of Natural Persons
MSC Maritime Safety Committee
NAFTA North American Free Trade Agreement
NGO Nongovernmental Organization
NRA Nominal Rate of Assistance
NTM Non-tariff Measures
OECD Organisation for Economic Co-operation and Development
PIC Prior Informed Consent
PPM Processes and Production Methods
PTA Preferential Trade Agreement
R&D Research and Development
RFID Radio Frequency Identification
ROO Rules of Origin
RTAs Regional Trade Agreements
RVC Regional Value Content
SAAS Software as a Service
SACU Southern African Customs Union
SAFTA Singapore-Australia FTA
SAIC State Administration for Industry and Commerce
SMEs Medium-sized Enterprises
SOLAS Safety of Life at Sea
SPARTECA South Pacific Regional Trade and Economic Cooperation Agreement

v
SSGs Special Safeguards
SSM Special Safeguards Mechanism
TAFTA Thailand-Australia
TCM Traditional Chinese Medicine
TEUs Twenty-Foot Equivalent Units (intermodal shipping container)
TFP Total Factor Productivity
TK Traditional Knowledge
TNZCEP Thailand-NZ
TR Technical Requirement
TRANSEP Trans-Pacific
TRIPS Trade-Related Aspects of Intellectual Property Rights
TPLs Tariff Preference Levels
TRQs Tariff Rate Quotas
UNCTAD United Nations Conference on Trade and Development
UNCLOS UN Convention on the Law of the Sea
UNFCCC United Nations Framework Convention on Climate Change
US-CAFTA-D R Central America-Dominican Republic-United States FTA
VC Value Content
WCO World Customs Organization
WIPO World Intellectual Property Organization
VP Value of Parts
WTO World Trade Organization

1
Introduction and Overview
Min Zhao
China‘s successful economic development has rested on expanding external trade. After
nearly 30 years of economic reform, China‘s external trade grew rapidly and accelerated
following its accession to the WTO in 2001. By 2008, China‘s annual goods exports and
imports had reached US$1429 billion and US$1133 billion, respectively, making China
the second largest exporter and the third largest importer in the world. China‘s total trade
volume is now sixty-seven times that of 19801, and the trade surplus amounted to
US$295.5 billion in 2008. The liberalization brought about by WTO accession was
substantial. The average tariff rate dropped from 43.2% in 1992 to around 9.8% in 2008.
Trade openness, as measured by the ratio of goods trade to GDP, is nearly 60%. China
also made unprecedented commitments in service trade liberalization in the WTO‘s
General Agreement on Trade in Services (GATS). The ambition of China‘s liberalization
program in services manifests itself especially in commercial presence.
Clearly, external trade has contributed to China‘s economic development by enhancing
the efficiency of resource allocation, expanding the supply of some natural resources
needed for production, and transferring technological know-how via imports of capital
goods. And trade liberalization has catalyzed China‘s economic reform. As a result,
China was able to maintain a record-high average GDP growth rate of 9.5 percent during
1980-2006. The growth in trade has contributed strongly to the creation of non-farm jobs,
rural economic development, and rural poverty reduction. China‘s experience
demonstrates the importance of trade liberalization in facilitating the change in economic
structure toward more competitive sectors. It also validates the significance of trade for
growth and development.
So Why Is Trade Policy Still Important for China?
With China‘s adoption of an open trade regime, one could argue that there is limited
room to further cut tariffs or remove barriers to service trade. If so, why do we still need
to be concerned about trade policy? We argue that trade policy is still important because
of the Doha Round of multilateral negotiations at the WTO and because of the multiple
Free Trade Agreements (FTAs2) that China is negotiating.
To begin with, China‘s WTO accession was mainly a unilateral liberalization; in contrast,
the trade liberalization in the post-WTO accession era is multilateral in the case of Doha
Round or bilateral and regional in the case of China‘s FTA negotiations. While China‘s
average tariff is low, China may still gain from dismantling of trade barriers in other
economies. For instance, Huang et. al. find that China would gain from agricultural trade
1 Data source: CEIC
2 Free Trade Agreements are used interchangeably with Regional Trade Agreements in this book.

2
liberalization in the Doha Round. Also, Mani finds that China stands to gain from less
stringent trade policies on environmental products as an emerging exporter.
Moreover, its growing reliance on international trade gives China an interest in
international trading rules. In many ways, the content of trade liberalization has shifted
from reduction in tariffs to many aspects of trade supervision. One notable extension of
the content is the increasing inclusion of regulatory issues, concerning areas as varied as
intellectual property rights, competition, investment, environment, and labor. This is not
only reflected in the WTO Doha Round, but also in most FTA negotiations. 1
Finally, China can gain from further increases in services trade. Despite rapid growth,
there is still much room for expansion. Services now consist of 20 percent of global trade,
but only account for 11 percent in China‘s external trade. The expansion of services
trade may well serve the change in China‘s development agenda by diversifying its
export base and providing producers with necessary service imports, especially in
backbone services.
China‘s New Trade Objectives in The Post-WTO Accession Era
As China‘s development objectives change, so must its objectives for the trade agenda.
A country with a savings ratio as high as China‘s does not need a large trade surplus to
support its balance of payments. The domestic savings rate topped 51.2 percent of GDP
2007, whereas investment reached 42.3 percent of GDP—a level that was only exceeded
by Singapore in its rapid growth phase in the 1970s and 1980s.2 China has used exports
to drive growth, but this strategy has its price in terms of environmental sustainability as
well as its limitations in terms of growth. An export-oriented growth strategy for a large
country like China can create trade tensions going forward. Moreover, in the long run,
China‘s exports will only be able to grow with the expansion of world trade. Finally,
China could face the unattractive prospects of permanently declining terms of trade, as it
tries to sell more goods on the international market. A key implication of the changing
development objectives is to narrow the trade surplus.
But China would face a short-term problem going down this path: a decline in the trade
surplus may lead to less non-farm job creation and lower economic growth with falling
external demand. There are two solutions to this problem. First, China‘s growth could
rely more on services, which are generally more labor intensive and can generate more
jobs than export industries, cater to domestic demand, and require less capital investment.
Second, China‘s growth could rely more on productivity increases rather than capital
inputs as it has done in the past. China can learn lessons from its own success in
promoting industrial growth. Trade liberalization in services could bring benefits in
1 These Issues except trade facilitation were later dropped from the Doha negotiations.
2 Indeed, the large balance of payments surpluses resulting from high trade surplus has become an emerging issue for
macroeconomic management: trade surplus together with capital inflows have led to a rapid build-up of foreign exchange reserve, which has complicated monetary policy. By end-2008, China’s foreign exchange reserves stood at US$1946 billion, equivalent to 19 months of imports of goods and services.

3
several ways: it would induce more investment in this sector; it would encourage
innovation and technological improvement among service providers; it would dismantle
the uncompetitive firms, and it would allow more competition in sectors previously
closed for entry. The challenge for the authorities is to create a regulatory environment
that is conducive to investment and operation of the services sectors.
A second implication of China‘s emerging development goals for trade policy relates to
inequalities.1 China‘s income inequality as measured by the Gini coefficient has been
rising rapidly since the mid-1980s. From being one of the more equal countries in the
world in the early 1980s, China has become one of the more unequal ones. While trade
liberalization is often welfare improving, benefits may not be evenly distributed and
some may even incur a loss. A solution to this uneven distributional impact of some
trade measures is not to defer the needed reform, but rather to complement trade policy
with social protection measures. The changing development objectives require a rigorous
pre-assessment of trade policies on income distribution so as to target the groups that
could suffer.
A third implication of China‘s emerging development goals for trade policy relates to the
environment. Air quality, water sanitation and land degradation have become an
emerging concern for people. China‘s exports have been relatively energy-intensive and
pollution intensive. About 40 percent of China‘s gross consumption of energy is directly
or indirectly used for the purpose of export production. However, there is no easy
solution. While shifting exports from industrial goods to services reduces China‘s energy
consumption and emissions among other pollutants, the production of energy and
pollutant intensive goods may simply be transferred to other countries, and most likely to
countries which have lower energy efficiency and low capacity of pollutant treatment.
Thus any trade measures that have environmental consequences should be assessed in the
global context.
Over the 11th Five Year Plan (FYP) and beyond, China will focus on a more balanced
development, as captured in the ―Five Balances‖ emphasized since the 3rd CPC Plenary
Session of the 16th Party Congress in October 2003. The ―Five Balances‖ call for growth
that is more focused on domestic development, that is more evenly shared, and that is
more environmentally friendly. The challenge for policy makers is to align external trade
with these government-wide objectives. For China‘s trade policies, this would imply that
greater attention should be given to a more balanced growth in exports and imports, to the
expansion of trade in services as a vehicle to promote the development in the services
sector, and to the assessment of the poverty and environmental impact of trade policies.
1 Inequality can affect growth and development through various channels: (i) high inequality in income can lead to
inequitable access to public services, and production inputs such as credits. In turn this may lead to inefficient growth—the smarter kids do not go to school, and the more capable entrepreneur does not get resources to grow. Second, those that have benefited from growth in the past may capture the political process to protect their privileges, which could also lead to lower growth. Third, large inequalities could lead to social unrest that may affect growth. At the same time, too much focus on growth could lead to inefficient policies that could undermine growth—for instance highly redistributive taxes, or subsidies for agricultural production, which increase taxes on the rest of the economy.

4
China‘s New Trade Policy Tool in the Post-WTO Era
While trade liberalization has been widely recognized in the global development agenda,
it takes long and arduous negotiations to reach a multilateral agreement. The Doha
Round has progressed very slowly. The impasse in the Doha Development Agenda
(DDA) negotiations has led to a flurry of new initiatives for Regional Trade Agreements
(RTAs). Regional trade agreements are fundamentally altering the world trade landscape.
The number of agreements in force by end August 2008 was 213, rising six fold in just
two decades. Today, more than one-third of global trade takes place between countries
that have some form of reciprocal RTA.
As the surge in RTAs is fast reshaping the architecture of the world trading system and
the trading environment of developing countries, China has made RTAs a policy tool to
pursue its trade liberalization agenda further. China proposed its first regional trade
agreement with ASEAN in November 2001. In the subsequent eight years, China has
launched a flurry of RTA negotiations that – counting those completed or in the process
of negotiation – cover trade with more than 30 economies, accounting for about one-
fourth of its trade. In October 2007, China announced a strategy to promote the
establishment of free trade areas and to further promote trade liberalization and economic
development.
What Questions Are Addressed in This Study
As China continues its trade reform process, its focus has shifted to the emerging ―second
generation‖ issues. Like other countries, China has embarked on a series of Free Trade
Agreements negotiations, including with Chile, Singapore, Australia, New Zealand,
Norway, and Peru. China is also gearing up towards expanding its services trade, which
now accounts for about 20 percent of global trade. In the context of a changing
international trade landscape and development agenda for China, the World Bank and
China‘s Ministry of Commerce jointly carried out a series of studies on leading issues of
trade during 2006-2009. During the course of the studies, we devoted ourselves to
exploring answers to the following questions:
How to design the architecture of FTAs and how to manage multiple FTA
negotiations?
What are the economic and development implications of some key provisions in
FTAs?
How to assess the impact of tariff cut with the binding constraints of trade
obligations early committed in China‘s WTO accession and concluded FTAs?
What are China‘s interests in the Doha Round in agriculture, non-agriculture market
access, geographic indication, bio-diversity and environment? What is the overall
economic impact, and what are the impacts on poverty among other development
objectives?

5
What can we learn from other leading economies on how to promote the expansion
of trade in services?
What Have We Learned—Key Findings and Policy Implications
It is in China‘s interest to actively participate in multilateral and regional
trade negotiations and further promote trade liberalization. While China‘s
trade regime is already quite open and enhances efficiency in resource
allocation, China can still gain from improving access to other economies‘
markets and from a better trade environment with stringent international
rules.
The trade agenda in the post-WTO accession era should be realigned with
China‘s development agenda, including the building of a harmonious
society. While China generally benefits from trade liberalization, benefits
are not distributed evenly among different income groups and regions.
Impact assessments of trade policies should take into account binding
obligations and should go beyond the effects on the macroeconomy.
FTAs have become an important trade policy tool for China in pursuing
trade liberalization. The significance of this phenomenon should not be
overlooked since it will ultimately influence the nature of international trade
relations and the policy choices and behavior of the operating actors. China
needs to build up a coherent strategy to coordinate the multiple FTA
negotiations so as to maximize the benefits.
Using trade barriers to serve some other policy objectives (poverty reduction
or environment protection) may not be desirable. Policies that address these
problems directly, by improving productivity in agriculture, or reducing the
barriers to mobility out of agriculture are much more likely to be successful
in dealing with such problems.
Lessons from leading economies in services trade are consistent with
lessons from China its own success in promoting industrial goods exports.
The key for promoting services trade is a more attractive environment for
service industry investment and innovation, including improved competition
policy, enhanced intellectual property protection, open market access, a
transparent regulatory regime and sufficient supply of skill labors.
What the Subsequent Chapters Contribute
These findings and policy implications are described more fully in the following chapters.
Those chapters are grouped under three themes— (i) regional trade negotiations, (ii)

6
multilateral trade issues, and (iii) policy options for promotion of services trade. A brief
description of key aspects of each chapter‘s analysis is given here.
Guidance to FTA Negotiation
Part I, collecting eight policy notes, deals with issues emerging from China‘s regional
trade negotiations. It provides an overview and suggestions on selected essential
provisions in FTAs ranging from market access provisions, rules of origin, and dispute
settlement mechanisms, to key considerations in managing multiple service trade
negotiations, positive and negative lists as architectural choices, and labor mobility.
Chapter 1 provides an overview of China‘s development in FTAs. It shows that China
has actively pursued regional trade agreements in recent years, with some success. FTAs
have been good complements to multilateral trade arrangements, have covered a
substantial share of China‘s external trade, and have made great contributions to
expanding China‘s external trade.
Chapter 2 summarizes the key features of market access provisions based on a survey of
20 RTAs. The chapter on market access is central to RTAs. The coverage and schedule
for tariff liberalization programs vary across RTAs, and Agreements also differ in the
trajectories of tariff reductions. While RTAs are aligned with WTO standards and many
are WTO+, many RTAs also contain provisions that could be labeled as ―other restrictive
regulations of commerce‖ such as TRQs, special safeguards, and stringent rules of origin.
Market access has to be evaluated according to product coverage, the pace and extent of
tariff reductions, and parties‘ trade policies with respect to third parties.
Chapter 3 analyzes the pros and cons of different rules of origin (ROO) contained in
FTAs. While ROO are necessary to avoid trade diversion associated with preferential
trade liberalization, FTAs with considerably different or overly restrictive rules of origin
are likely to increase administrative costs for traders as well production costs for firms,
thus reducing their competitiveness. The costs of rules of origin are likely to be higher for
small producers than for large producers. Policymakers should ensure that rules of origin
are simple and extend the same commutation and origin determination across FTAs.
Large countries like China bear a particular influence and responsibility with regard to
the rules of origin, especially in a region with substantial differences in country size and
incomes.
Chapter 4 deals with dispute settlement in regional trade agreements. Dispute settlement
mechanisms play an important role in the effective implementation of international
commitments, including in the context of global and regional trade integration. Many
RTAs include provisions on dispute settlement. There is no single model of dispute
settlement mechanism; sophistication can vary with different factors, such as the
scope/level of trade integration or the number of contracting parties. This chapter
provides a comprehensive summary of key features of disputes settlement mechanisms
and points out key issues policy makers should pay attention in designing such
mechanisms in RTAs.

7
Chapter 5 analyzes the implication of interrelationships between different agreements in
trade in services and provides suggestions on how to manage multiple trade negotiations.
Many countries—including China—are engaged in multiple trade negotiations in services.
The true extent of trade preferences created by FTA commitments depends crucially on
the rules of origin and the so called non-party MFN clause that requires automatic
extension of benefits granted to non-parties. Liberal rules of origin reduce the
preferential nature of FTA commitments, and thus may undermine some of the
bargaining advantages of FTA negotiations. The inclusion of non-party MFN clauses in
FTAs will, on balance, strengthen incentives to negotiate at the WTO. It is important that
governments develop a coherent negotiating strategy that enables them to strike the best
bargains.
Chapter 6 compares the positive list approach and negative list approach in service FTAs.
The study shows that negative lists and positive lists can achieve similar openness
outcomes depending on how the agreements are actually written. However, a negative
list approach typically entails more transparency and credibility, while a positive list
approach may provide more flexibility to accommodate political economy constraints.
Chapter 7 assesses the potential of RTAs in promoting labor mobility. Trade agreements
increasingly seek to promote the mobility of labor. The note shows that while the world
economy stands to gain massively from liberalization in the mobility of labor, adverse
popular reaction to the economic and social impacts of immigrants has kept progress in
enhancing global labor mobility well below progress in trade and capital liberalization.
Addressing cross-border labor mobility in the context of RTAs has recently emerged as a
promising avenue. Given the limited commitments made under GATS, developing
countries such as China, which want to expand openness to include semi-skilled workers
and movement unrelated to a specific commercial presence, may find that broader RTA
provisions are of interest. Win-win results can be achieved if China focuses on areas of
employment shortage in the other countries.
Chapter 8 review the international experience with competition provisions in RTAs with
a view to drawing some possible lessons for China as it pursues its regional trade strategy.
Competition laws and policies are increasingly being established at the regional level, as
they could be instrumental in supporting the benefits of trade and investment
liberalization. Competition laws in RTAs fall in the 4 models, ranging from fully
centralized to fully decentralized. Their impacts have been mixed, because of
institutional and behavioral reasons, relating to lack of competition culture or political
will to promote implementation domestically. So far RTAs in China have not included
competition policy. Competition policy could be included in China's future RTAs, but
through the decentralized model, with a focus on cooperation. China may want to use the
opportunity of these negotiations to (1) further discipline its state-owned enterprises; (2)
carefully consider the possible role of antidumping policies; and (3) promote and lock-in
domestic reforms aimed at improving its domestic competition policies.
Chapter 9 reviews the experience of advanced economies in the treatment of
environmental provisions in the context of RTA negotiations. A key question is whether

8
trade agreements should address environmental issues or whether they should stay
separate. International experience shows that what matters is how these agreements are
written. Notwithstanding the political sensitivity of the trade-environment nexus,
integrating environmental concerns into the trading system seems now an almost
irreversible trend. With a shift of the development agenda from primarily pursuing
growth to achieving a more balanced and sustainable development and taking into
account China‘s high reliance on trade, it may be increasingly in China‘s interest to pro-
actively engage its partners on environmental issues in its regional trade agreement (RTA)
negotiations. In its future RTA negotiations on environment policy, China may take into
account its level of development and enforcement capacity. To facilitate the policy
making process, China could consider conducting a comprehensive pre-RTA assessment,
and one of the key components is environmental impact assessment. China could
probably take a pragmatic approach—being flexible towards different negotiating
partners, and a phased-in approach in dispute settlement mechanism.
Trade Policy Options in the Post-WTO Accession Era
Part II collects three papers. These papers assess the impact of some key multilateral
trade issues China faces in post-WTO era, in particular those emerging from the Doha
Development Round negotiations (DDR) of the WTO.
Chapter 10 assesses the impact and effectiveness of raising the cotton import tariff on its
domestic price and cotton producers‘ income. Intuitively, a higher domestic cotton price
would benefit cotton producers in China. A policy option of raising tariffs on cotton
imports thus arises against the backdrop of the government‘s allowance of imports at a
rate well below the bound tariff rate despite the fact that imports substantially exceed the
quota. Under WTO rules, China would be permitted to impose a tariff of up to 40 percent
on over-quota imports. The study however finds two fundamental problems arise with
raising this tariff. First, China remains a net exporter of cotton when exports of cotton in
the form of fibers, yarns, textiles and apparel are compared with imports of cotton in all
forms. Second, whether or not China remains a net importer of cotton, the ability to
import cotton products at low duties, such as 5 percent for yarns, means that the tariff on
cotton is unable to have more than a small impact on the domestic price of cotton.
Moreover, the combination of a high tariff on cotton and a low tariff on yarn would have
a sharply adverse impact on early stage processing activities such as spinning of cotton
yarn, for which raw cotton inputs account for a large share of total costs (reportedly 70
percent of the cost of yarn production).
Chapter 11 analyzes the potential impacts of the Doha trade proposals (those of the USA,
EU and G20) on agricultural production and incomes of China‘s farmers by region and
income group. This study suggests that China‘s economy will benefit from the Doha
Round—though overall the impacts are small—since it is mainly focused on the
agricultural sector. A more liberalized trade reform proposal would bring more gains to
China, although the impacts do not differ significantly among the three proposals.
Importantly, China‘s food security improves under the Doha proposals. Although
farmers as a class will benefit, the gains among farmers vary largely by income group,
province and the type of crops which they produce. Some, such as farmers in Guangxi

9
and Yunnan, may even suffer due to the large negative effects on sugar. Therefore, policy
makers should be concerned about the poverty and equity effects.
Chapter 12 focuses on the current state of debate surrounding environmental goods
negotiations under the WTO in the context of Chinese exports and imports. The trade
and the environment debate which has been mainly focused on the impact of trade on
local pollution and on cross-border measures to address transboundary pollution has
resurfaced again--this time strongly in the climate change arena. Global climate change
awareness and discussions surrounding clean energy technologies offer an economic
opportunity as China is emerging as a major producer and exporter of these technologies.
Any efforts to liberalize trade in these technologies would give a further boost to Chinese
exports. It thus becomes important that China closely participates in the WTO and other
forums such as UNFCCC where these issues are being debated to ensure that its interests
are taken into account.
Chapter 12 also looks at some recent proposals (in the US and EU) which call for
increased trade barriers against imports from countries which have less stringent carbon
policies and then draws implications for China. While developed countries remain the
largest per capita emitters of greenhouse gases today, the growth of carbon emissions in
the next decades will come primarily from developing countries, which are following the
same energy- and carbon-intensive development path as did their rich counterparts.
Among the developing countries, the main growth in carbon emissions will emanate from
China and India because of their size and growth rates.1 Strong economic growth and
heavy dependence on coal in industry and power generation contribute to this trend.
There will be thus increasing pressure on the trade front to redress any competitiveness
pressures. While it is debatable as to what extent these measures are WTO compatible,
China should be prepared to deal with the issue both within and outside the country as the
economic and regional impacts could not be understated.
Promoting Services Trade
In light of China‘s opening up of its services sector, Part III of the book addresses
policies and issues that are key to services trade expansion. The overview chapter
(Chapter 13) explains the role of services in an economy, how firms trade, and common
capacity issues faced by services firms when expanding internationally. It details the
fundamental policy environment that enables growth in trade in services. Many
governments improved competition policy and intellectual property protection to create a
more attractive environment for service industry investment and innovation. They
focused on financial sector reform to increase access to finance and venture capital. They
used export and incentive programs to support entry into new markets. China can use a
combination of such policy tools to improve the quality, cost, and scope of services in the
economy and to enable firms to compete internationally.
1 More than 70 percent of the world emissions increase from 2020–30 according to the International Energy Agency is
projected to come from non-Annex I (developing) countries. China alone will contribute about a quarter of the increase in CO2 emissions, or 3.8 Gt, reaching 7.1 Gt in 2030. Its emissions will overtake those of the United States by 2010.
10
Chapter 14 explores how a variety of governments use different policy tools to improve
productivity and trade in services. It examines how countries have succeeded in
developing their services trade, identifying common and unique measures they use in
enabling firms to compete in the global services economy and growing export of services.
Korea offers lessons in reenergizing growth with a revised market access stance,
improved regulatory transparency, and refined competition policy. India's exceptional
success in the export of business services demonstrates the return on investment in
tertiary education as well as the effect of lifting traditional industrial restrictions. The EU
offers practical approaches to minimize regulatory and administrative process barriers to
trade within an economic entity. Examining services trade between the European Union
and the United States identifies regulatory cooperation as a means to facilitate trade and
growth. The United States demonstrates how widely available market information and a
constellation of other factors foster service industry innovation. Singapore demonstrates
the value of efficient government, industry clusters, and means to attract service
professionals. Japan provides insight into boosting productivity in services with
investment in human resources, improvements to the business environment, and
recognition of successful service exporters. Hong Kong SAR shows the value of an open
foreign direct investment regime to service industries. The establishment of the Closer
Economic Partnership Arrangement confirms the parties' recognition of the key tenets of
services trade policy.
.
Chapter 15 provides trend analysis of developments in global services trade and country
competition in the transportation, software, and animation industries. These are sectors of
special export interest for China. For each sector, leading exporters are identified,
industry trends are explored, and strategies China can use to improve market conditions
are suggested. China has significant competitors operating globally in each industry.
Chinese policymakers and industry leaders can improve prospects for Chinese firms with
attention to particular factors influencing global competition in each sector.
Although information technology, transport, and animation are very different industries
they share common industry trends. Each is experiencing exceptional trade growth and
emerging markets are significant providers in each sector. Deployment of technological
innovation can be a competitive advantage for firms operating in each industry.
Management's ability to respond to competition, orchestrate strategic alliances, and
anticipate challenges and opportunities on the horizon is also a determinant of export
success. Information technology and animation firms are particularly reliant on a vibrant
venture capital market and robust protection of intellectual property. Changing
regulations in transport require astute engagement by Chinese policymakers and
proactive leadership from industry captains. Firms from each sector also gain from
accessing quality and skilled professionals from around the world.

11
Part I Guideline to Free Trade Agreement Negotiation
1 Status Quo of The Development of China‘s FTAs
Department of International Economic and Trade Relations,
Ministry of Commerce,
People‘s Republic of China
In recent years, along with the deepening development of economic globalization,
regional economic integration has witnessed tremendous development, with regional
trade arrangements predominantly in the form of FTAs emerging one after another.
Major economies and regional groupings around the world have both sped up their
development of FTAs and ushered in a new wave of free trade worldwide. Following
this new trend, China has also made new headway in its efforts to promote the
negotiation and establishment of FTAs. In October 2007, for the first time, the 17th
National Congress of the Communist Party of China expressly made clear the need to
―implement the FTA strategy‖. Establishing FTAs has become a new platform and mode
for China‘s efforts to promote reform and development through reform since its accession
to the WTO.
In recent years, with the deepening development of economic globalization, regional
economic integration has witnessed tremendous development. By the end of August,
2008, regional trade arrangements notified to the WTO, still in force and dominated by
FTAs had already reached 213 in number, accounting for over half of global trade in
goods. Under the leadership and deployment of the CPC Central Committee and the
State Council, China has proactively flowed with the tide of regional economic
integration and steadily moved ahead with its efforts to establish FTAs. At present, FTAs
have become a new form and mode of China‘s reform and opening-up drive since its
accession to the WTO and a new channel and platform for mutually-beneficial and win-
win cooperation with other countries.
Overview of FTAs
A free trade area is defined as a ―specific area‖ formed through an agreement that is
signed between two or more countries or territories, in which members further open up
their markets to each other on the basis of most-favored nation treatment, phase out the
vast majority of tariff and non-tariff barriers to trade in goods and improve market access
conditions in the services field, as a result of which trade and investment liberalization is
achieved and all the customs territories of all the members are covered. It is
fundamentally different from a specific zone that a certain city or region establishes by
setting aside a piece of land for purposes of implementing preferential economic and

12
trade policies such as an economic development zone, export processing zone or bonded
zone.
An FTA, as an arrangement, is an exception to WTO rules (WTO plus). WTO rules
permit members of an FTA to accord to each other more preferential treatment without
according it to other WTO members. It is both in-depth opening that goes beyond WTO
rules and a supplement to the WTO-based free trade regime. It both follows the basic
principles of the multilateral trading regime and provides freer economic and trade space
for mutually-beneficial cooperation between and among partner countries. Take Mexico
as an example. In the wake of the establishment of the North American Free Trade Area
(NAFTA), Mexico‘s global export ranking rose to No. 13 in 2005, up from No. 21 in
1996, replacing Japan as the second largest exporter to the United States and replacing
China as the largest textiles exporter to the United States. There is one saying in South
Korean media to the effect that, in response to the global trade warfare without gunshots,
the only way to survive is to sign free trade agreements.
Global Development Trends of FTAs
By the end of August, 2008, regional trade arrangements notified to the WTO, still in
effect and dominated by FTAs had reached 213 in number. WTO experts estimate that
over half of global trade at present occurs among various kinds of regional groupings and
under terms and conditions more preferential than the most-favored nation treatment as
provided for by the WTO. In particular, at a time when the Doha Round of WTO talks is
not progressing smoothly, many countries have shifted the focus of their economic and
trade policies away from the WTO to FTAs. Since the year 2007, a host of
―heavyweight‖ free trade agreements and ideas have sprung into existence, such as the
Free Trade Agreement between the United States and South Korea, the Economic
Partnership Agreement between Japan and the ASEAN, and the Transatlantic Free Trade
Area (EU-North American Single Market) initiative.
The tremendous development of FTAs around the globe has generated a profound impact
upon the present pattern of the world economy. According to USTR statistics, as a
totality, the countries with which the United States has signed, or is in the process of
signing, a free trade agreement have become the world‘s third largest economy,
occupying 14% of global GDP excluding that of the United States, absorbing 42% of U.S.
exports, with U.S. exports to these countries growing at a speed twice that of exports to
other countries. In 2007, intra-NAFTA trade represented 60%, intra-EU trade stood as
high as 70%, and trade among East Asia, as a percentage, also jumped above 50% in
2007, up from 43% in 1990.
New Progress in China‘s Efforts to Establish FTAs
Since the year 2003, China started from scratch in its efforts to establish FTAs and laid
down a good foundation. Up to now, China has established 14 FTAs with 31 countries
and territories in Asia, Oceania, Latin America, Europe and Africa, covering one-fourth
of China‘s total trade volume in the year 2008. The following is a description of the main
developments:

13
Closer Economic Partnership Arrangement (CEPA) as well as its supplementary
agreements between the Mainland and Hong Kong and between the Mainland and
Macao. Following the signing of the CEPA in 2003, four supplementary
agreements were signed and implemented. In July 2008, the Mainland signed the
fifth supplementary agreement with Hong Kong and Macao respectively. In
connection with trade in goods, as of January 2006, the Mainland has accorded
zero tariff treatment to all goods originating from Hong Kong and Macao. In
terms of trade in services, the Mainland has further relaxed market access
restrictions on Hong Kong and Macao in 40 sectors such as legal and accounting
services. Cooperation has been conducted in nine fields such as trade and
investment promotion and customs clearance facilitation. The implementation of
the CEPA and its supplementary agreements has promoted stable economic
growth in Hong Kong and Macao.
China-ASEAN FTA Series Agreements. In November 2002, at the 6th China-
ASEAN Leaders‘ Meeting, leaders from China and ten ASEAN countries signed
the Framework Agreement on Comprehensive Economic Cooperation between
China and the ASEAN. In November 2004, jointly witnessed by Premier Wen
Jiabao and leaders from ten ASEAN countries, China and the ASEAN signed the
Agreement on Trade in Goods, the implementation of which started in July 2005,
leading to the gradual reduction and elimination of tariffs on over 7,000 tariff
items. By the year 2010, the tariffs of the vast majority of goods among China
and six old ASEAN members will be eliminated, and four new ASEAN members
will basically eliminate their tariffs by the year 2015. Since the reduction of
tariffs, trade between China and the ASEAN has been booming in terms of both
imports and exports, and trade and economic cooperation has been developing
rapidly. In 2007, the two sides became each other‘s fourth largest trading partner,
with bilateral trade going beyond US$ 200 billion for the first time in history.
In January 2007, the two sides signed the Agreement on Trade in Services, with
commitments of further liberalization made in 67 sub-sectors in 12 services
sectors in ten ASEAN countries and 26 sub-sectors in 5 sectors in China and
implementation scheduled for July in the same year. Premier Wen Jiabao pointed
out that ―[t]he signing of this agreement is another major outcome between China
and the ASEAN in the field of trade and economic cooperation, a symbol of a
crucial step ahead made by the China-ASEAN FTA, and the groundwork laid
down for the establishment of the FTA according to schedule.‖ At present, the
two sides are continuing to move ahead with negotiations in the field of
investment.
China-Chile Free Trade Agreement: In November 2005, President Hu and former
Chilean President Lagos jointly witnessed the signing of the China-Chile Free
Trade Agreement, the implementation of which started in October 2006.
According to the agreement, the tariffs of products accounting for 97% of all the
tariff items will be reduced to zero by phases within 10 years‘ time. The two

14
countries also further intensified exchanges and cooperation in the fields of
economy, SMEs, culture, education, science and technology, environment and so
on. Up to now, China and Chile have implemented three rounds of tariff
reductions. China has reduced or eliminated tariffs on 7,336 kinds of products
that account for 97.2% of China‘s total tariff items, among which tariffs on 4,795
kinds of products have been reduced to zero. Chile has also reduced or eliminated
tariffs on 7,750 kinds of products that account for 98.1% of Chile‘s total tariff
items, among which tariffs on 5,891 kinds of products have been reduced to zero.
By the year 2015, China and Chile will complete the process of tariff reduction.
Over the past two years since the comprehensive reduction of tariffs between
China and Chile, bilateral trade has been booming in terms of both imports and
exports and, in 2007, met the target of US$ ―10 billion‖ ahead of schedule. In the
first year (October 2006 to September 2007) and the second year (October 2007
to September 2008) of the implementation of the Agreement, bilateral trade
amounted to US$ 13.2 billion and US$ 17.6 billion respectively, rising by 59%
and 33% year on year respectively. In a breakdown, China‘s imports from Chile
amounted to US$ 9.2 billion and US$ 11.6 billion respectively, increasing by 68%
and 26% year on year respectively, and China‘s exports to Chile rose to US$ 4
billion and US$ 6 billion respectively, up by 41% and 49% year on year
respectively. Over the past two years, China‘s exports of mechanical and
electronic products to Chile registered tremendous growth. Cars were first
exported in 2007, and by now seven Chinese car brand names have made their
way into the Chilean market. In the first nine months of this year, 9,138 cars
worth US$ 48.38 million have been exported, jumping by 369% and 335% year
on year respectively; electrical appliances and electronic products worth US$ 720
million have been exported, a rise of 51%; and exports of machinery and
equipment amounted to US$ 500 million, an increase of 40%. Chilean
agricultural products such as salmon and fruits have entered the Chinese market
for the first time since the implementation of the agreement. At the same time,
Chinese imports from Chile of copper, copper ore, pulp, iron ore, fish meal, wine
and other primary processed products rose to record highs too. During the first
year of the agreement‘s implementation, copper imports rose by 83% year on year
to US$ 700,000 tons; wine imports amounted to US$ 49.51 million, rocketing by
307%. According to Chilean statistics, China has now replaced the United States
as Chile‘s biggest trading partner.
Enterprises in the two countries have all along paid attention to the Agreement,
are enthusiastic about making use of preferences, and have reaped a lot of benefits
from therein. Over the past two years, China has in total signed and issued
196,000 rules of origin certificates in regard to preferences under the Agreement,
and US$ 8.4 billion worth of exports have benefited from such preferences.
Exports by Chinese enterprises benefiting from preferences have accounted for
90% of exports to Chile. In 2007, bilateral trade stood at US$ 14.7 billion, rising
by 65% year on year. In a breakdown, Chinese imports from and exports to Chile
amounted to US$ 10.3 billion and US$ 4.4 billion, up by 79% and 42%

15
respectively. China has replaced the United States as Chile‘s largest export
partner.
In addition, China and Chile signed in April 2008 the Supplementary Agreement
on Trade in Services for the Free Trade Agreement between China and Chile. On
the basis of gradual liberalization of trade in goods between the two countries, this
agreement will provide enterprises from the two countries with more trade and
investment opportunities, reduce transaction costs and expand revenues on the
part of enterprises.
China-Pakistan Free Trade Agreement: In April 2005, during Premier Wen‘s visit
to Pakistan, the two sides announced the launch of negotiations. In November
2006, the two countries signed the free trade agreement as a major outcome of
President Hu‘s visit to Pakistan. According to the agreement, the two sides will
implement tariff reductions on all the products in two phases. In the first phase,
within five years after the entry into force of the agreement, the two sides will
reduce tariffs by different margins on 85% of each other‘s tariff items. The
second phase starts from the 6th year after the entry into force of the agreement,
with the objective of tariff-free products representing 90% of each other‘s tariff
items and also bilateral trade. In addition, the agreement incorporated provisions
in regard to investment promotion and protection. Since its entry into force in
July 2007, various quarters of society have responded positively, and the outcome
of implementation has been good. President Hu indicated that ―[t]he agreement
will surely raise the level of Sino-Pakistan trade and economic cooperation and
create conditions for more Pakistan commodities to make their way into the
Chinese market.‖ At present, the two sides are moving ahead with the
negotiations on trade in services.
China-New Zealand Free Trade Agreement: On April 7th, 2008, jointly witnessed
by Premier Wen and New Zealand Prime Minister Clark, the Free Trade
Agreement between the Government of the People‘s Republic of China and the
Government of New Zealand was signed in Beijing and scheduled to enter into
force on October 1st, 2008. The Agreement is a comprehensive free trade
agreement that encompasses trade in goods, trade in services and investment and
also the first free trade agreement signed by China with a developed country. In
addition to its possible, direct economic interests, the inspiring role in China‘s
further opening up also deserves attention. The signing of the agreement has
attracted wide-ranging attention from international media, with various
mainstream media reporting it as breaking news. The Forbes magazine ran an
editorial in which it stated that China and New Zealand had reached a milestone
trade agreement, which enabled China to win its first important individual gold
medal in the Olympics of free trade, and that China was catching up with the
United States by establishing a club with its own trading partners.
China-Singapore Free Trade Agreement: On October 23, 2008, jointly witnessed
by Premier Wen Jiabao and Singaporean Prime Minister Lee Hsien Loong, the

16
Free Trade Agreement between the Government of the People‘s Republic of
China and the Government of the Republic of Singapore was signed in Beijing.
The negotiations started in August 2006 and, after eight rounds of hard but frank
consultations, the two sides successfully completed negotiations in September
2008. Encompassing a host of fields such as trade in goods, trade in services,
movement of personnel and customs procedures, the Agreement is a free trade
agreement comprehensive in coverage. On the basis of the China-ASEAN free
trade area, the two sides further accelerated the pace of trade liberalization and
extended the depth and width of the bilateral free trade relationship and trade and
economic cooperation. According to the Agreement, the Singaporean side
pledges to eliminate tariffs on all the products imported from China before
January 1, 2009, and the Chinese side pledges to offer tariff-free treatment to
97.1% of products imported from Singapore before January 1st, 2010. The two
sides made WTO plus commitments in the field of trade in services such as
healthcare, education and accounting.
China-Peru Free Trade Area: On April 28th, 2009, jointly witnessed by Vice
President Xi Jinping and Peruvian Vice President Luis Giampietri Rojas, the Free
Trade Agreement between China and Peru was signed in Beijing. The China-
Peru FTA is the first package free trade agreement between China and a Latin
American country and a new milestone in the development of the bilateral
relationship. The China-Peru free trade agreement is wide-ranging in coverage
and high in the level of openness. In relation to trade in goods, China and Peru
will offer tariff-free treatment by phases to over 90% of each other‘s products. A
vast array of Chinese products such as light industry, electronics, household
electrical appliances, machinery, automobiles, chemicals, vegetables and fruits
and Peruvian products such as fish meal, mineral products, fruits and fish
products will all benefit from tariff reduction arrangements. In connection with
trade in services, the two sides will, on the basis of each other‘s WTO
commitments, further open up services sectors to each other. In respect of
investment, the two sides will offer each other‘s investors and investment post-
establishment national treatment, most-favored nation treatment and fair and
equitable treatment, encourage cross investment and provide facilitation. At the
same time, the two sides have reached wide-ranging consensus on a large number
of fields such as intellectual property rights, trade remedies, rules of origin,
customs procedures, TBT and SPS measures.
Meanwhile, China is moving ahead with negotiations to varying degrees with Australia,
the Gulf Cooperation Council (including Saudi Arabia, Kuwait, United Arab Emirates,
Oman, Qatar and Bahrain), Iceland, Norway, Costa Rica and Southern African Customs
Union, and conducting FTA joint feasibility studies with India and the Republic Korea,
with positive progress recorded.
Practice has borne out that China‘s efforts to establish FTAs have generated good
economic and political impacts at home and abroad and should become an important
aspect of China‘s bid to implement a mutually-beneficial and win-win opening up

17
strategy and to build a harmonious world. In the days to come, China will continue to
proactively make use of the new platform of FTAs, constantly raise the level of opening
up, push ahead with reform and development, and promote the building of a harmonious
world.

18
Table 1.1 Status of China‘s regional trade agreements by end-October, 2008
RTA Negotiations Initiated Current Status
Implemented
CEPA Mainland –
Hong Kong
June 29, 2003 CEPA III came into full implementation on January 1,
2006
CEPA Mainland -
Macau
October 17, 2003 CEPA III came into full implementation on January 1,
2006
China-ASEAN November 1, 2002 Agreement on Trade in Goods effected in July 2005
Agreement on Trade in Services effected in July 2007.
Agreement on Investment under negotiation.
China-Chile November 18, 2004 Agreement on Trade in Goods came into full
implementation on October 1, 2006
Agreement on Trade in Services signed on Apr 13, 2008
Free Trade Agreement (goods) came into full
implementation in July 2007.
Free Trade Agreement in Services signed in Febrary 2009. China-Pakistan April 1, 2005
China-New Zealand November 22, 2004 Agreement on Trade effected on Oct 1, 2008
China-Singapore August 25, 2006 A full-fledged Free Trade Agreement was signed on Oct
23, 2008
China-Peru September 7, 2007 Agreement on Trade in Goods signed in April 2009
Under
negotiation
China-Iceland July 10, 2006 4th round negotiation closed on Apr 30, 2008
Agreement of Trade in Goods agreed;
Agreement of Trade in Services under negotiation China-GCC July 1, 2004
China-SACU June 2004 Under negotiation
China-Australia April 18, 2005 12th round negotiation closed on Sept 26, 2008
China-Norway September 18, 2008 First round negotiation closed on 2008.
Prospective
partners
China-India Feasibility study completed in Oct, 2007
China-South Korea Feasibility study started in early 2007
China-Costarica Feasibility study completed in July 2008

19
2 Market Access Provisions
Silja Baller1
The chapter on market access is central to RTAs. Market access is evaluated according to
product coverage (comprehensiveness), pace and extent of tariff reductions (depth), and
parties‘ trade policies with respect to third parties (to provide an indication of the actual
preferences granted).
WTO Disciplines
The market access provisions in RTAs are closely governed by WTO disciplines. RTAs
between two developing countries are subjected to slightly less stringent criteria in that
partial liberalization is allowed under the 1979 WTO Enabling Clause. Art XXIV GATT
prescribes three key conditions for trade liberalization in RTAs:
The liberalization effort must cover ―substantially all trade‖. A number of
definitions of what ―substantially all trade‖ have been used, including:
percentage of trade between the parties, commonly 90, 85 and 80%; no (major)
sector must be excluded from liberalization; percentage of tariff lines being
liberalized as a benchmark (generally 95% of all HS tariff lines at the 6-digit
level).
Liberalization must take place within a ―reasonable length of time‖. The
1994 Understanding on the Interpretation of Article XXIV states that the
length of time in question should exceed 10 years only in ―exceptional cases‖,
while there is no guidance, however, on what constitutes an exceptional case.
There are no conditions on the trajectory of liberalization, i.e. liberalization
could be linear or concentrated around certain points during the transition
period.
Besides tariffs, RTAs should eliminate ―other restrictive regulations of
commerce‖ on ―substantially all trade‖. The debate turns around which
trade policy instruments should be regarded as restrictive regulations. These
could include tariff rate quotas (TRQs), special safeguards (SSGs), non-tariff
measures (NTM) and rules of origin (ROO).
1 Source: This note was prepared by Silja Baller based on an IDB report

20
Market Access Features of RTAs
Market access features in a sample of about 20 RTAs show the following:1
The coverage and schedule for tariff liberalization programs vary across RTAs. Agreements differ in the number of product groups subjected to liberalization, as well as
the years to full liberalization: in some cases all tariffs are eliminated upon the entry into
force of the agreement (e.g. agreements involving Singapore), while in others, transition
periods stretch over a 20-year horizon, with some concessions withheld in perpetuity.
Agreements differ in the trajectories of tariff reductions. Some parties use a linear
trajectory, while others employ a non-linear trajectory that often involves back-loading,
i.e. larger reductions are left to the latter part of the transition period (e.g. EU Agreements
with South Africa, Morocco and Lithuania). In some cases, a grace period of up to 10
years before reductions begin is granted as in the case of the EU-South Africa RTA for
example.
Most RTAs respect GATT Art XXIV guidelines. They commit to liberalization of 90%
of tariff lines by year 10 into the agreement. Coverage of products tends to become
homogenous towards the end of the 10 years. There are exceptions in the case of
developing countries and sensitive products (agriculture, textiles and apparel, and
footwear). On a chapter level, parties liberalize more than 80% of tariff lines by year 5
and more than 90% by year 10 for the bulk of chapters. The fastest and deepest
liberalization takes place in non-sensitive products such as ores (ch.26), fertilizers (ch.31),
pulp of wood (ch.47) and some base metals (ch.81).
The extent of liberalization is not undermined on a trade-weighted basis. Bottom-line
results remain if the tariff line indicator is replaced by a trade-weighted tariff line
measure: most RTA partners still liberalize 90% or more by year 10.
Most RTAs are aligned with WTO standards and many are WTO+. Many RTAs,
and increasingly so, incorporate a larger number and/or more specific provisions than are
currently in force under the WTO. However, many RTAs also contain provisions that
could be labeled as ―other restrictive regulations of commerce‖ such as TRQs, special
safeguards, and stringent rules of origin.
Measures Accompanying Tariff Liberalization
Restrictive measures
Beyond the exclusion of few items from the general liberalization schedule, RTAs have
relied on provisions for Bilateral Emergency Actions (BEA), Special Safeguards
Mechanisms (SSG), and Tariff Rate Quotas (TRQs) to provide additional protection.
1 The sample includes: Australia-Thailand, China-Hong Kong (China), Japan-Singapore, New Zealand-
Singapore, Singapore-Australia, Chile-Korea, Mexico-Japan, US-Singapore, US-Chile, Chile-Mexico,
CAFTA (Central-America FTA), Canada-Chile, Canada-Costa Rica, US-Jordan, US-Morocco, EFTA-
Mexico, EC-South Africa, EC-Lithuania, EC-Morocco.

21
Both BEA and SSG are safeguards mechanisms. BEA requires demonstration of
significant injury to domestic industry; while SSG simply operates on the basis of a price
or quantity trigger. BEAs generally remain available after full liberalization has been
reached, while SSGs cease to apply after the phase-in period (such as in the case of
Thailand-Australia and Thailand-New Zealand RTAs). In the case of US-Australia, the
SSG mechanism remains in force for beef and certain other agricultural products even
after the end of the phase-in period. Japan-Singapore is an exception in that both types of
emergency measures are available only during the implementation period.
Tariff liberalization is often accompanied by quantitative restrictions in the form of tariff
rate quotas. TRQs are used to give a certain degree of tariff concessions, while at the
same time retaining control over quantities. The quotas within which tariff concessions
apply are generally expanded during the transition period and cease to exist once phase-in
is completed. An exception is the US-Australia agreement where Australian dairy
products remain subject to TRQs in the indefinite future.
Liberalizing measures
Provisions that are more liberalizing include Tariff Preference Levels (TPLs) which
provide access at preferential rates for specified quantities of non-originating products
that fail to meet rules of origin criteria. They are found for example in the Canada-Chile
and Canada-Costa Rica agreements regarding textile and clothing products.
Restrictions and extended phase-in periods as substitutes
Countries generally use various restrictions and extended phase-in periods as substitutes
for one another. For example, EU-Morocco, EU-Czech Republic and EU-Lithuania all
have phase-in periods of less than 10 years, but exclude large parts of the agricultural
sector from complete tariff elimination. Singapore-Japan phases in almost all
commitments immediately, but has an overall exclusion rate of more than 5% of tariff
lines due to Japan‘s exclusion of almost 10% of their products. No permanent exclusions
are contained in the Australia-Thailand, New Zealand-Thailand, and US-Chile
agreements; however, the percentage of trade subject to TRQs, special safeguards or
bilateral emergency measures is significant. Canadian RTAs (with Chile and Costa-Rica)
also use a mix of prolonged phase-in periods with TRQs and BEAs applicable during the
transition period.
RTA Market Access ―Families‖
RTAs cluster into families by world region (Asia, Europe, the Americas) and trade hubs
(US, EU, Singapore) when it comes to coverage of main market access disciplines.
In US RTAs, all products are assigned into a set of distinct categories for the purpose of
tariff elimination, with a time-frame and trajectory toward complete elimination (rather

22
than just fixing an end-point). These categories include TRQs (typically in the appendix)
as well as exceptions to preferential treatment.
In EU RTAs, all industrial products are subjected to a general tariff elimination schedule.
Agricultural and/or fish and/or processed agricultural products are governed by a separate
list of exceptions and separate annexes or protocols; protocols tend to be quite complex,
featuring different types of regimes such as end-point preference margins (a preference
tariff defined in relation to the MFN tariff rather than in absolute terms), TRQs, reference
quantities, and a phased reduction of tariffs to a final level (often non-zero). EFTA
agreements follow the EU model in having separate schedules for fish and agriculture
next to the general tariff elimination schedule.
The EU-Chile agreement is a move away from the typical EU model in that it establishes
a single schedule for each party which contains all products. However, some of the
complexity remains in that the schedule still contains measures such as TRQs, the
elimination of only the ad-valorem component of a mixed duty; and cases where no
liberalization takes place.
Special Products: Agriculture and Textiles
Tariff treatment
The sectors subject to the greatest numbers of exceptions are agricultural and fisheries
products as well as textiles and apparel. Only about 10% of RTAs have sectoral measures
besides agriculture and textiles.
Agricultural chapters (1-8) generally see the least liberalization on average and have the
highest dispersion of liberalization across RTAs.
Liberalization is particularly slow in dairy produce (ch.4), sugars (ch.17), cocoa (ch.18),
cereals (ch.19), and footwear (ch.64).
Countries liberalize 60% or less of tariff lines by the fifth year and 65% or less by the
tenth year after entry into force of the RTA.
There is considerable movement in the textile chapters between the 5- and 10-year
benchmarks, while dairy and sugar see little additional liberalization.
Differences across parties in agriculture, textiles, and apparel largely disappear 10 years
after entry into force of the agreement.

23
Figure 2.1 Distribution of Liberalization by RTA
Parties in Chapters, Year 5
The observed persistent variation in agriculture is due mostly to the EU Agreements
where liberalization is postponed—sometimes to perpetuity, as for example for certain
live animals, meat, dairy and sugar products originating in South Africa in the EU-South
Africa RTA.
Agriculture was a major issue in the Australia-US RTA. Both countries had already
committed to substantial liberalizations under the WTO, such that further concessions
were difficult to come by. On the US side, the most sensitive product, sugar was
completely excluded from the agreement, while two others, beef and dairy products, will
be subject to TRQs for a period of 18 and 17 years, respectively. Further, beef will
benefit from special safeguards even beyond the transition period. Australia‘s sensitive
goods, on the other hand will not benefit from any exclusions, and only a small
percentage of other goods qualify for bilateral emergency actions.
Special Provisions
The coverage of special provisions for agriculture and textiles is high: of the 42 RTAs in
the sample, 32 have special provisions on agriculture and 16 on textiles.
While RTAs in the Americas tend to include many special provisions for agriculture, EU
agreements contain fewer, but importantly have separate tariff liberalization protocols for
agricultural goods. Except for the EU agreements, most RTAs contain prohibitions on
agricultural export subsidies. Asia-Pacific agreements tend to have less special
disciplines on agriculture, generally containing only a provision (often a prohibition) on
export subsidies as well as stipulations on cooperation among the parties. Domestic
support is covered in Mexico‘s RTAs only, mostly requiring adherence to WTO rules on
agricultural subsidies.
Figure 2.2 Distribution of Liberalization by
RTA Parties in Chapters, Year 10
Source: IDB (2006)
Ch 97
Ch 96
Ch 95
Ch 94
Ch 93
Ch 92
Ch 91
Ch 90
Ch 89
Ch 88
Ch 87
Ch 86
Ch 85
Ch 84
Ch 83
Ch 82
Ch 81
Ch 80Ch 79
Ch 78
Ch 76
Ch 75
Ch 74
Ch 73
Ch 72
Ch 71
Ch 70
Ch 69
Ch 68
Ch 67Ch 66
Ch 65
Ch 64Ch 63
Ch 62Ch 61Ch 60
Ch 59
Ch 58
Ch 57
Ch 56
Ch 55Ch 54
Ch 53
Ch 52
Ch 51
Ch 50
Ch 49
Ch 48
Ch 47
Ch 46
Ch 45
Ch 44
Ch 43
Ch 42
Ch 41Ch 40
Ch 39
Ch 38Ch 37Ch 36
Ch 35
Ch 34
Ch 33
Ch 32
Ch 31
Ch 30
Ch 29Ch 28
Ch 27
Ch 26
Ch 25
Ch 24
Ch 23
Ch 22
Ch 21
Ch 20Ch 19
Ch 18Ch 17
Ch 16
Ch 15
Ch 14Ch 13
Ch 12
Ch 11
Ch 10 Ch 09
Ch 08Ch 07Ch 06
Ch 05
Ch 04
Ch 03
Ch 02
Ch 01
0
0.05
0.1
0.15
0.2
0.25
0.3
0.35
0.4
0.45
0.5
0.4 0.5 0.6 0.7 0.8 0.9 1 1.1
Average of Agreements
StD
ev
of A
gre
em
en
ts
Ch 97
Ch 96Ch 95
Ch 94
Ch 93
Ch 92
Ch 91
Ch 90
Ch 89
Ch 88
Ch 87
Ch 86
Ch 85
Ch 84
Ch 83
Ch 82
Ch 81
Ch 80
Ch 79
Ch 78
Ch 76
Ch 75
Ch 74
Ch 73Ch 72
Ch 71
Ch 70
Ch 69
Ch 68
Ch 67Ch 66
Ch 65
Ch 64
Ch 63Ch 62Ch 61
Ch 60
Ch 59
Ch 58
Ch 57
Ch 56
Ch 55Ch 54
Ch 53
Ch 52
Ch 51Ch 50
Ch 49
Ch 48
Ch 47
Ch 46
Ch 45
Ch 44
Ch 43
Ch 42
Ch 41Ch 40
Ch 39
Ch 38Ch 37
Ch 36
Ch 35
Ch 34
Ch 33
Ch 32
Ch 31
Ch 30
Ch 29Ch 28
Ch 27
Ch 26
Ch 25
Ch 24
Ch 23Ch 22
Ch 21
Ch 20
Ch 19
Ch 18Ch 17
Ch 16
Ch 15
Ch 14Ch 13
Ch 12
Ch 11
Ch 10
Ch 09
Ch 08Ch 07
Ch 06
Ch 05
Ch 04
Ch 03
Ch 02
Ch 01
0
0.05
0.1
0.15
0.2
0.25
0.3
0.35
0.4
0.45
0.5
0.4 0.5 0.6 0.7 0.8 0.9 1 1.1
Average of Agreements
StD
ev o
f A
greem
en
ts
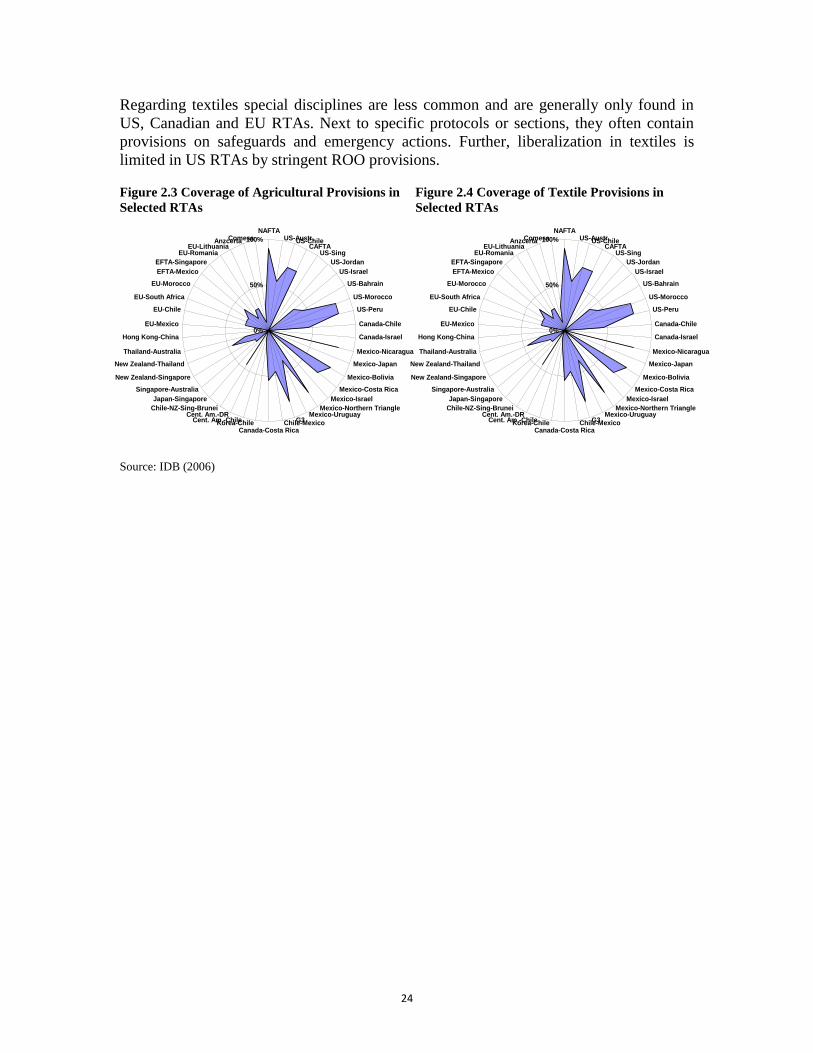
24
Regarding textiles special disciplines are less common and are generally only found in
US, Canadian and EU RTAs. Next to specific protocols or sections, they often contain
provisions on safeguards and emergency actions. Further, liberalization in textiles is
limited in US RTAs by stringent ROO provisions.
Figure 2.3 Coverage of Agricultural Provisions in
Selected RTAs
Figure 2.4 Coverage of Textile Provisions in
Selected RTAs
Source: IDB (2006)
0%
50%
100%
NAFTAUS-Austr.US-Chile
CAFTAUS-Sing
US-Jordan
US-Israel
US-Bahrain
US-Morocco
US-Peru
Canada-Chile
Canada-Israel
Mexico-Nicaragua
Mexico-Japan
Mexico-Bolivia
Mexico-Costa Rica
Mexico-Israel
Mexico-Northern TriangleMexico-Uruguay
G3Chile-MexicoCanada-Costa Rica
Korea-ChileCent. Am.-ChileCent. Am.-DR
Chile-NZ-Sing-Brunei
Japan-Singapore
Singapore-Australia
New Zealand-Singapore
New Zealand-Thailand
Thailand-Australia
Hong Kong-China
EU-Mexico
EU-Chile
EU-South Africa
EU-Morocco
EFTA-Mexico
EFTA-Singapore
EU-RomaniaEU-Lithuania
AnzcertaComesa

25
3 Rules of Origin
Mona Haddad
1
The proliferation of preferential trade agreements in East Asia containing different rules
of origin has important implications for economic integration in the region and for trade
between the region and the rest of the world. Free Trade Agreements with considerably
different rules of origin or with overly restrictive rules of origin are likely to increase
administrative costs for traders as well production costs for firms, thus compromising
their competitiveness. The costs of rules of origin are likely to be higher for small
producers than for large producers. Policymakers should ensure that rules of origin are
simple and extend the same cumulation and origin determination across FTAs.
Rules of origin (ROO) are necessary to avoid trade deflection associated with preferential
trade liberalization. Without ROO third countries outside an FTA could avoid the country
with higher outside tariffs by trans-shipping its goods through the country with the lower
tariff (this does not concern customs unions as they have a common outside tariff). If the
rules are too stringent or complex, however, the resulting compliance costs can neutralize
any preference margin granted and lead to low utilization of tariff preferences.
Types of Rules of Origin
Preferential rules of origin can either apply to a trade regime as a whole (―regime-specific
ROO‖) or to an individual product (―product-specific ROO‖). Product specific rules
define origin according to one of two broad criteria. In order to qualify for origin status,
products must either:
be wholly obtained or produced, i.e. they do not contain any second-country
components or materials.
have gone through a substantial transformation. This has to involve at least
one of four main components, i.e. these components can be used as stand-
alone or in combination with each other:
Change in tariff classification (CTC): this requires the product to alter its
chapter (corresponds to 2 digits in the HS classification), heading (4
digits), sub-heading (6 digits) or item (8 digits) in the exporting country.
Value content (VC): this requires that the product acquire a certain
minimum local value in the exporting country (regional value content –
RVC); alternatively, it is sometimes also defined as remaining below a
1Source: Note prepared by Mona Haddad based on Silia Baller, ―A Negotiator‘s Guide to FTAs‖, 2007;
and Miriam Manchin and Annette Pelkmans-Balaoing, ―Rules of Origin and the Web of East Asian FTAs‖,
2007 (background papers)

26
ceiling value of inputs from non-member countries (import content – MC)
or a ceiling value of parts (VP).
Technical requirement (TR): this requires a product to undergo certain
manufacturing operations in the originating country and is often used for
apparel products and chemicals. It has been shown that the TR criterion
generally has the highest cost of compliance compared to VC and CTC.
In addition to product-specific criteria, rules of origin can contain two types of regime-
wide provisions (i) leniency provisions; and (ii) provisions that make the agreement more
stringent.
There are three types of leniency provisions:
De minimis or tolerance principle: a maximum percentage of non-
originating inputs which can be used without affecting origin is determined,
thereby inserting leniency into origin determination that uses the CTC or TR
criteria. The tolerance rule under NAFTA allows non-originating inputs to be
used even if the rule on sufficient processing is not satisfied provided their
value does not exceed 7 percent. All EU FTAs contain de minimis rules, at 10
percent for most agreements. MERCOSUR and the African and Asian FTAs
generally do not include a de minimis provision.
Roll-up/absorption principle: materials, which have acquired origin by
meeting specific processing requirements, will be considered as originating
when used as an input in a subsequent transformation. Therefore, non-
originating materials are no longer taken into account in the calculation of the
value-added of the subsequent transformation. Roll-up is used across all FTAs.
Cumulation principle: producers of one FTA member are allowed to use
materials from another FTA member as if they were their own, thereby
preserving the preferential status of the final product. The cumulation
principle can be applied in three ways:
Bilateral cumulation: permits two FTA partners to use inputs originating
in the other partner as if they were their own.
Diagonal cumulation: permits countries tied by the same set of
preferential origin rules to use materials originating in any part of the area
as if they were their own. Diagonal cumulation is generally only found in
EU-FTAs.
Full cumulation: an extension of diagonal cumulation, full cumulation
permits countries tied by the same preferential rules of origin to use
materials even in advanced stages of processing, from any part of the area
even if these were not originating. While other forms of cumulation

27
require that the goods be originating before being exported from one party
to another for further working or processing, this is not the case with full
cumulation. Full cumulation simply demands that all the working or
processing in the list rules must be carried out on non-originating
materials in order for the final product to obtain origin. The EEA
Agreement, EU-South Africa, AFTA and ANZCEFTA allow for full
cumulation, while Canada-Israel allows for cumulation with the US.
Regime-specific criteria that increase the stringency of a given rules of origin regime
include:
A separate list specifying operations that are considered insufficient to confer
origin.
A prohibition of duty drawback, i.e. tariffs on non-originating inputs that are
subsequently included in a final product exported to a FTA partner market
cannot be refunded. EU FTAs and FTAs in the Americas in most cases
explicitly exclude drawback, though some allow for a transition period. AFTA,
ANZCEFTA, SPARTECA, US-Israel, CACM and MERCOSUR on the other
hand, explicitly permit drawback.
Compliance and Administrative Costs, and Their Impact on Utilization of
Preferences
Firms need to overcome several hurdles in order to be able to benefit from preferences.
First, firms need to satisfy the rules of origin in terms of meeting the technical
requirements. Given the complexities of ROO, satisfying origin requirements could
involve important production costs. In the globalized world economy it is important that
firms have access to the most appropriate inputs at world prices. The rules of origin will
be restrictive if they limit the choices of firms in sourcing inputs. Firms that are forced by
the rules of origin to use higher cost local or regional inputs will find it more difficult to
compete and may lose the opportunity to exploit scale economies if they have to produce
essentially different products for the global and for the FTA partners market.
Second, actually proving origin compounds these costs and involves maintaining systems
that accurately account for imported inputs from different sources to prove consistency
with the technical rules. The ability to prove origin may require the use of sophisticated
and expensive accounting procedures (by the standard of small firms in developing
countries).
Third, following specific administrative procedures are required to provide the necessary
documentation. Administrative costs can vary with different documentation and
certification methods. Depending on the provisions in the agreement, certification can
either take the form of self-certification by exporters—the least stringent method—or be
done by an industry umbrella group, or by the exporting country government. The EU

28
requires a ―movement certificate‖ issued by the exporting government, but allows an
alternative certification method—the invoice declaration—for ―approved‖ frequent
exporters. NAFTA, FTAs in the Americas and Chile-Korea allow self-certification,
while all others require certification by a public body or a private organization approved
by the government.
Empirical assessment of the potential impact of preferences on trade flows under the
Asean Free Trade Agreement (AFTA) shows that preferential tariffs are typically
exploited when the preference margins (the difference between MFN and preferential
tariffs) are higher than 10-25%. Below that level, the costs involved in obtaining the
preference—such as administrative costs and the costs of complying with the rules of
origin requirements of the preferences—are higher than the benefits from obtaining
preferential treatment. Moreover, preference margins above 80% also have a significant
negative effect on trade flows. This is due to the larger incidence of non-tariff measures
(NTMs) in these products that have a high preference margin.
Choosing Between Basic Regimes: RVC vs. CTC
In the past, the value-added approach enjoyed great popularity, mainly due to its:
simplicity (the same rule can be applied to all traded products)
neutrality (the rule is not affected by the sensitivity of the products in
question and is not subject to political concerns over specific industry
policies).
Although seemingly simple, the value added criterion has proven burdensome in practice.
The calculation of costs is time-consuming and administratively onerous in many cases.
Manufacturers must maintain records of all production activity and costs. Disagreements
often arise over what are allowable costs and how they should be distributed across
traded and non-traded goods. Shifts in exchange rates and fluctuations in international
Figure 3.1 ROOs are not cheap!
0 2 4 6 8
EFTA t o EU(administ rat ive)
Mexico t o US(compliance)
NAFTA(compliance)
NAFTA(administ rat ive)
PANEURO(compliance)
PANEURO(administ rat ive)
ACP(administ rat ive)
administ rat ive or compliance cost s of ROO as percent of value
Source: Cadot, et.al. 2007
Figure 3.2 Trade impact of preference margins
-0.4
-0.2
0
0.2
0.4
0.6
0.8
1
1.2
0 5 10 15 20 25 30 35 40 45 50 55 60
preference margin (%)
trade impact of preference margin (%)

29
prices of materials can significantly affect an exporter‘s costs, causing uncertainty as to
whether a given product will qualify as originating under the value added approach.
Almost all FTAs being negotiated by the US adopt the product-specific CTC
methodology and this approach is increasingly being passed on to other countries in the
Asia-Pacific region. The main benefits of the CTC approach are:
objectivity: there is a single, clear rule for each tariff line. Thus, uncertainty
with respect to exchange rates and fluctuating world prices as well as debates
at customs over allowable and non-allowable costs, price mark-ups or
allocation of operating overheads across production is avoided
ease of managing for small and medium-sized enterprises (SMEs): The CTC
approach requires less record keeping and calculations.
In cases where the CTC may not be sufficient to confer origin, it is usually supplemented
with a value added criterion or the requirement of a specific manufacturing operation.
However, a CTC criterion with product-specific supplement conditions becomes
receptive to industry pressures (e.g. as has happened with yarn and textiles in US FTAs).
Allowing producers to choose between alternative criteria (CTC and RVC) for the same
product could be a good solution.
Ways of Simplifying ROO Regimes: Harmonization and Cumulation
The current tangle of different, overlapping ROO regimes that came in the wake of the
proliferation of preferential trade agreements imposes many costs on trading partners,
including administrative costs to producers, inefficiencies in sourcing, and increased
lobby activity. Harmonization among preferential ROO regimes would avoid the
spaghetti bowl effect. Maximizing consistency in the ROO used in FTAs would reduce
costs in several ways:
for firms in organizing their production processes to meet the ROO
requirements under the different FTAs
for all involved in the trade process in familiarizing themselves with the ROO
requirements in different FTAs
for exporters in requiring the establishment of only one set of administrative
procedures of ROO compliance (e.g. record keeping and verification
processes)
for producers and manufacturers in allowing them to take advantage of
economies of scale by being able to more easily supply a range of FTA
partners

30
In order for future preference schemes in the region to deliver improved market access
and regional integration a careful design of rules of origin aiming at less restrictive rules
would be essential.
A number of factors could lessen the negative effects of restrictive rules of origin
schemes:
reviewing rules of origin requirements in terms of substantial transformation
to make them less restrictive (for example, can a value-added requirement be
reduced without compromising trade deflection) and to ensure they are
consistent with the new global economy and development objectives (for
example, do they facilitate production sharing networks in East Asia)
allowing firms flexibility by specifying a choice of regime-wide rules of
origin (for example, satisfying either a value-added requirement or change of
tariff heading)
allowing for common cumulation rules across agreements (such as diagonal or
full cumulation)
allowing more trader ‗friendly‘ approaches, such as using self-certification
methods, to reduce administrative costs.
The Role of China
Large countries like China bear a particular influence and responsibility with regard to
the rules of origin, especially in a region with substantial differences in country size and
incomes. In an era of rising FTAs, restrictive ROO can lead to particularly damaging
effect.
First, restrictive rules of origin with limited opportunities for cumulation may reinforce a
hub and spoke pattern in which activity becomes more focused on the hub (China) with
little interaction between the various spokes.
Second, small low income countries may become increasingly marginalized in the world
economy as large countries seek improved market access to each others‘ markets through
FTAs.
Third, FTAs may not only divert trade away from excluded countries but also undermine
intra-regional trade flows if they include restrictive rules of origin.
China has a particular opportunity, through its size and economic importance, to ensure
that other countries in the region, especially the low-income partners, are not
disadvantaged by the FTAs it signs. This can be pursued through common rules of origin
across different agreements, realistic processing requirements, and full cumulation
amongst all partners to existing trade agreements.

31
Table 3 A.1 Rules of Origin in East Asian FTAs
Change of Tariff
Classification
Value-added
Domestic or Import Content
Specific Manufacturing
Process
Cumulation
Tolerance
ASEAN FTA (AFTA) Yes Regional (40%) full 10%
ASEAN-China
(ACFTA)
Yes Regional (40%) full 10%
ASEAN-Korea
(AKFTA)
Yes Regional (40%) full 10%
Singapore-Japan
(JSEPA)
Yes Domestic (60%) Yes Bilateral Product specific
Singapore-New
Zealand (ANZSCEP)
Domestic 40% Bilateral
10%
Singapore-Australia
(SAFTA)
Domestic 50% (30% for some
products)
3%
Singapore-Korea
(KSFTA)
Yes 45-55% Bilateral 10%
Thailand-Australia
(TAFTA)
Yes 40-45% Yes Bilateral 10%
Thailand-NZ
TNZCEP
Yes, product
specific
Yes Bilateral 10%
Malaysia-Japan
(JMEPA)
Yes, product
specific
Domestic 40% (product specific) Bilateral Only from ASEAN
(product specific)
Trans-Pacific
TRANSEP
Yes 45-50% Yes Diagonal 10%
Australia-NZ
(ANZCER)
50% Bilateral 2%

32
4 Disputes Settlement in Free Trade Agreements
Mona Haddad & Olivier Cattaneo 1
Dispute settlement mechanisms help ensure an effective implementation of international
commitments. Dispute settlement mechanisms in RTAs do not follow a single model, and
many are inspired by that of the GATT/WTO. The WTO has remained the main forum
to settle trade-related disputes. However, the evolving nature of RTAs—which
increasingly include WTO+ provisions—reinforces the need for dedicated dispute
settlement mechanisms. Recent RTAs have also tended to bolster their dispute settlement
mechanisms with tougher measures such a shorter delays and monetary compensation.
Dispute settlement mechanisms play an important role in the effective implementation of
international commitments, including in the context of global and regional trade
integration. The success of the GATT and the WTO could be partially explained by its
dispute settlement mechanism that made trade sanctions credible and reinforced the
security and predictability of trade transactions.
Many regional trade agreements (RTAs) include provisions on dispute settlement that are
inspired by the GATT/WTO. There is no single model of dispute settlement mechanism;
sophistication can vary with different factors, such as the scope/level of trade integration
or the number of contracting parties. Some agreements—like the European Union (EU),
the Common Market for Eastern and Southern Africa (COMESA), the Southern African
Customs Union (SACU), and the Andean Community—have dedicated tribunals/courts.
Most bilateral free-trade agreements (FTAs) provide for the use of non-jurisdictional
procedures and ad hoc panels.
The settlement of disputes is narrowly defined as the settlement of disputes between
states. However, some RTAs—unlike the WTO—authorize private parties to file claims
against governments (e.g., Chile-Korea FTA) and/or other private parties, for some part
or all of the disciplines covered by the agreement. For example, Chapter 20 of NAFTA
only applies to intergovernmental disputes, but investors may submit claims to arbitration
under Chapter 11.
These disparities in scope and realm—for both the dispute settlement provisions and the
RTAs themselves—explain the uneven use of dispute settlement mechanisms in RTAs.
For example, the ASEAN dispute settlement mechanism has yet to hear its first case.
Indeed, the WTO has remained the prime place to settle trade-related disputes. However,
the evolving nature of RTAs—to include more WTO+ provisions—reinforces the need
for dedicated dispute settlement mechanisms.
1 Source: Note prepared by Mona Haddad and Olivier Cattaneo based on Gregory Sergi, A Negotiating
Guide for Regional Trade Agreements: The Legal Aspects, Background paper, 2007; comments were
provided by Daria Goldstein.

33
The GATT/WTO and RTAs provide for dispute settlement mechanisms that combine
both non-jurisdictional (e.g., mediation, conciliation) and jurisdictional (e.g., panel
procedure) features. The balance of these ―diplomatic‖ and ―legal‖ features varies from
agreement to agreement. Recent RTAs have tended to reinforce the ―teeth‖ of their
dispute settlement mechanisms (e.g., shorter delays, introduction of monetary
compensation).
Survey of dispute settlement provisions in some recent bilateral FTAs. This note
presents some of the key features of dispute settlement mechanisms included in recent
bilateral trade agreements in East Asia and other parts of the world. While not fully
representative of RTAs, this sample survey gives a brief overview of issues related to
dispute settlement mechanisms and provides some guidance to governments negotiating
new agreements. It focuses on three main aspects of dispute settlement:
scope;
procedures and enforcement;
choice of forum.
Scope of Dispute Settlement
The scope of dispute settlement is defined both by (i) the RTA obligations subject to
dispute settlement, and (ii) the type of cases that may be brought to dispute settlement.
FTAs can exclude certain sections of the agreement from dispute settlement. This is
common for:
issues the parties agree to resolve through the WTO—e.g., anti-dumping and
countervailing duty actions in the Chile-China and many US agreements;
commitments to cooperate in areas such as education, environment, or labor
standards;
topics that are somewhat novel and untested in international trade law, or
relate to a state‘s enforcement of its own laws and raise serious sovereignty
issues—e.g., commitments in the field of competition policy in the Australia-
Thailand FTA.
FTAs can specify whether a complainant may challenge ―proposed‖ as well as
―actual‖ measures and whether ―non-violation‖ complaints are allowed:
in some rare instances, FTAs (e.g., US-Colombia) allow challenges of
government measures that have not yet come into force. Aimed at preventing
damage and promoting ex ante consultations, this process could be unduly
time-consuming and burdensome, with increased risk of premature and
unjustified cases. Non-contentious procedures (e.g., judicial review or

34
consultations, like in Chile-EC) could achieve the same end at a lower
―political‖ cost;
some FTAs allow ―non-violation‖ complaints,1 often for a limited number of
specific provisions (e.g., goods, rules of origin, cross-border services trade in
Korea-Singapore or Chile-Korea; the same plus textiles, government
procurement, and intellectual property in US-Colombia). Similarly allowed in
the GATT/WTO, these complaints have remained, however, very rare,
controversial, and never successful. Therefore, many recent RTAs, including
those of China and Japan, excluded ―non-violation‖ complaints.
Procedural Aspects in the Main Phases of Dispute Settlement
In line with public international law practice, most RTAs offer a choice, or a sequence, of
non-jurisdictional and jurisdictional dispute settlement procedures. Often inspired by the
GATT/WTO, and sometimes by commercial arbitration, RTAs usually distinguish the
following main steps in dispute settlement:
consultation (and sometimes mediation) phase;
establishment of a panel;
panel proceedings;
enforcement of decision.
Figure 4.1 Main Steps in Dispute Settlement
The Consultation (and Mediation) Phase:
1 Non-violation cases allege a benefit the complainant reasonably expected to receive from the agreement is
being nullified through some action of the respondent that is not inconsistent with any specific obligation in
the RTA. For example, tariff concessions could be easily frustrated by measures that the trade agreement
did not regulate, such as domestic taxes, subsidies and product regulations serving legitimate public policy
goals.
Types of Dispute Settlement Tracks
Consultations
Panel
Association
Committee
Panel
Consultations
Joint Committee
Panel
Consultations
Commission
Panel
Consultations
Panel
Appellate
Body
Japan - SingaporeEU - ChileAustralia - USChina - ChileWTO

35
Initiation of consultations. Most RTAs require that, before resorting to further action,
parties enter in good faith into formal consultations with a view to reaching a mutually
satisfactory solution. In the WTO, about one half of the disputes are settled at this stage.
Some RTAs include more precise obligations with regard to provision of information or
confidentiality.
Minimum time for consultations. RTAs typically set a minimum time for consultations.
Most often, this period is of 60 days (like at the WTO), but has tended to be shortened in
some recent RTAs (e.g., 45 days in Chile-Korea). Also, shorter delays were authorized in
matters regarding perishable goods.
Alternative dispute resolution mechanisms. The WTO and most RTAs allow parties to
request good offices, conciliation, or mediation (e.g., of the WTO Director General or an
RTA‘s administrative body) that may begin and be terminated at any time, without
prejudice to the rights of parties for further proceedings under the regular dispute
settlement mechanism. In some instances, like Chile-EC, the mediation of an RTA‘s
administrative body shall precede any panel procedure.
Establishment of a Panel:
If consultations fail, parties typically have the right to request the establishment of a(n)
(arbitral) panel which comprises three or five (e.g., in NAFTA, Canada-Chile) members.
RTAs provide further guidance with respect to:
the choice of panelists;
the ways to avoid that a party blocks the procedure;
the compliance with a certain timeframe.
Choice of panelists. Like the WTO, most RTAs establish an indicative roster of
individuals nominated by their government, willing and able (qualification requirements
apply) to serve as panelists. In the WTO, panelists are chosen by the Secretariat among
nationals of members with no interest in the dispute; this method cannot apply where all
the parties to an agreement (obviously always the case for bilateral FTAs) have an
interest in the dispute. When it comes to choosing one of their own national expert,
governments usually prefer not to delegate this task (there are some exceptions, like in
Chile-EC, where an institutional body of the agreement selects the panelists by lot from a
pre-established list). In other terms, RTAs usually allow each party to choose an equal
number of panelists (one or two), and the third (or fifth) panelist (the chairperson in most
cases) is selected either by agreement of the parties or by the first two or four panelists.
Avoiding deadlocks. In order to avoid that one party totally blocks the establishment of a
panel, for instance by refusing to nominate a panelist or to establish a contingent list, or
by failing to agree on the nomination of the chair, some RTAs have designed contingency
procedures. For instance, Chile-China and Japan-Malaysia provide for the WTO Director
General to appoint the chair where other methods have failed. In Japan-Singapore,
panelists could ultimately be chosen among members of an institutional body
(Consultation Committee) of the agreement, and the chair person by random drawing.
36
Timeframe. Similarly, to avoid unreasonable procedural delays, RTAs commonly
require panelists to be appointed in a specified timeframe. In the WTO, panelists shall be
appointed within 10 days (up to 30 days if the parties did not agree on the composition of
the panel). By contrast, the timeframe specified in RTAs varies from 3 days in Chile-EC
to 90 days in Australia-Thailand.
Panel Proceedings:
RTAs typically contain some description of the procedures to be followed by a panel.
Frequently, however, it refers to more detailed rules of procedures to be separately
negotiated.
Procedural issues that sometime appear in RTAs‘ dispute settlement provisions include:
Interim report. While at the WTO panels issue a preliminary report and parties
are given an opportunity to submit comments, some RTAs – inspired by
commercial arbitration – have suppressed this procedural step. Others, e.g.,
US-Colombia, Canada-Chile, or Chile-Korea, maintained interim reports.
Amicus curiae briefs. Like the WTO, most RTAs are silent as to unsolicited
amicus curiae briefs, but allow the panels to seek information or technical
advice from experts. Some agreements, however, explicitly allow panels to
consider requests from NGOs to provide written views regarding the dispute,
e.g. Korea-Singapore, or US-CAFTA-DR.
Publicity of the proceedings. While the WTO is moving toward more
transparency, trade disputes remain largely confidential: only two proceedings
(in 2005 and 2007) have so far been opened to the public upon the parties‘
request. RTAs are no exception to the rule, and provide for the confidentiality
of the panel proceedings, although some recent US FTAs require that each
party‘s submissions, statements, and responses to the panel be made public.
Time to issue a report. In most RTAs, panels are given a specific timeframe to
issue their ruling to the parties – usually between 120 and 150 days (compared
to 180 days in the WTO). Some RTAs dramatically reduced this timeframe –
e.g., to 60 days in India-Singapore. Additional provisions can address the case
of perishable goods or other urgent cases to be settled more rapidly.
Enforcement of the decision:
The WTO has experienced a high rate of voluntary compliance with decisions of its
Dispute Settlement Body (DSB). However, a reluctant respondent can use several
procedures to prolong noncompliance, including arbitrations with regard the length of the
implementation period, the satisfaction of the DSB‘s recommendations, or the level of
suspended concessions – some of which can be appealed. Given that retaliation is always

37
forward-looking, and that the complainant is not entitled to retroactive damages, a
reluctant respondent has an incentive to fully utilize each of the steps in this process.
Many RTAs have adopted similar provisions. However, some RTAs allow that the
original panel makes more precise recommendations (including on the manner and the
timeframe for implementing its recommendations, e.g., Chile-Korea), and makes findings
as to the degree of adverse trade effects of any measure found in violation of the
agreement (e.g., Canada-Chile).
In line with the GATT/WTO, RTAs allow retaliation where a party has not satisfactorily
implemented a panel‘s recommendations. Retaliation consists of the suspension of
benefits to the level of the prejudice (either mutually agreed or determined by arbitration).
The effectiveness of this threat depends, however, on the relative size of the two parties.
Some RTAs have introduced the possibility of paying an annual monetary assessment in
lieu of the suspension of concessions (e.g., US-Colombia).
Table 4.1 Key Elements to be Considered while Designing Dispute Settlement Provisions of RTAs
Pre-panel phase
Time allowed for consultations
Role of mediation and other alternative dispute settlement mechanisms
Establishment of a panel
Timeframe for selection of panelists
Use of a panelist roster/indicative list
Selection process for panelists and panel‘s chairperson
Contingency options for panelist selection if parties do not agree
The panel proceedings
Timeline for panel‘s report
Requirement for an initial and final report
Consideration of amicus curiae submissions
Transparency (panel proceedings and parties‘ submissions)
The post-panel
(compliance) phase
Temporary suspension of benefits or monetary compensation
Recommendations by the original panel on the manner and timeframe for
implementation
Findings by the original panel on the level of adverse trade effects
Choice of Forum
Because of substantial overlap between RTA and WTO obligations, countries may have a
choice of two or more forums that have subject matter jurisdiction over a dispute. This
could open the door to a sort of ―forum shopping‖, with the following risks:
creating a ―dispute in the dispute‖ with regard the choice of forum;
running two parallel (or successive) disputes – with the risk of duplication,
conflicting rulings, and exhaustion of the resources (human and monetary) of
the poorest party.
With a view to avoid these problems, most RTAs contain a ―choice of forum‖ clause, that
either:

38
allows the complainant to select the forum in which to settle the dispute, but
once that choice is made, excludes the possibility to later resorting to another
forum to settle the same dispute (e.g., Chile-China); or
requires that the complainant uses the WTO system to seek redress of a
violation of an obligation that is equivalent in substance in the WTO and the
regional agreements (e.g., Chile-EC); or
requires that the complainant uses the RTA system to settle disputes arising
under certain provisions of the RTA – often because it is considered that these
provisions are substantially different from others found in the WTO
agreements (e.g., NAFTA, Japan-Singapore)
Some RTAs, e.g., Australia-Thailand, extend the scope of this clause to possible choice
of forum conflicts with international agreements other than the WTO.
These clauses are essential, although they do not fully suppress the risk of a ―dispute in
the dispute‖ on the choice of forum, e.g., when parties cannot agree on whether an RTA
obligation is substantially equivalent to another obligation in the WTO. The WTO does
not object to the settlement of trade disputes in other forums, to the extent it is a mutually
agreed solution. Absent such agreement, the WTO would ultimately have to decide.
Table 4.2 Choice of Forum Clauses in RTAs
1. Chile–China: Where a dispute regarding any matter arises under this Agreement and under another free
trade agreement to which both Parties are parties or the WTO Agreement, the complaining Party may select
the forum in which to settle the dispute. Once the complaining Party has requested a panel under an
agreement . . . the forum selected shall be used to the exclusion of the others.
2. NAFTA: In any dispute… that arises under (the articles or chapters on environment, SPS measures,
standards-related measures)… the complaining party may, in respect of that matter, thereafter have recourse
to dispute settlement procedures solely under this Agreement.
3. Japan-Singapore: However, this does not apply if substantially separate and distinct rights or obligations
under different international agreements are in dispute.
4. Chile–EC:
a) When a Party seeks redress of a violation of an obligation under the WTO Agreement, it shall
have recourse to the relevant rules and procedures of the WTO Agreement, which apply notwithstanding the
provisions of this Agreement.
b) When a Party seeks redress of a violation of an obligation under this Part of the Agreement, it
shall have recourse to the rules and procedures of this Title.
c) Unless the Parties otherwise agree, when a Party seeks redress of a violation of an obligation
under this Part of the Agreement which is equivalent in substance to an obligation under the WTO, it shall
have recourse to the relevant rules and procedures of the WTO Agreement, which apply notwithstanding the
provisions of this Agreement.
d) (d) Once dispute settlement procedures have been initiated, the forum selected, if it has not
declined its jurisdiction, shall be used to the exclusion of the other.
5. Australia–Thailand: Once a dispute settlement procedure has been initiated between the Parties with
respect to a particular dispute under this Chapter or under any other international agreement to which the
Parties are parties, that procedure shall be used to the exclusion of any other procedure for that particular
dispute. This paragraph does not apply if substantially separate and distinct rights or obligations under
different international agreements are in dispute.

39
5 Managing Multiple Trade Negotiations in Services
Carsten Fink
Many countries—including China—are engaged in multiple trade negotiations in services.
All members of the World Trade Organization (WTO) participate in the services
negotiations of the Doha Development Agenda (DDA). In addition, many countries have
embarked on the negotiation of bilateral and regional free trade agreements (FTAs)
covering services. The latter have increased rapidly over the past decade and it is not rare
to find governments negotiating five or even more FTAs in parallel.
Often different agreements are negotiated by different negotiating teams. At the same
time, there are important interrelationships between different agreements, which
governments need to take into account in their overall trade negotiating strategy. This
note seeks to highlight several of these interrelationships and suggests ways in which
governments can promote greater coherence from the top.
What are trade negotiations all about?
Trade negotiations are mercantilist in nature. Governments exchange concessions,
whereby own market opening is sold for improved market access abroad. Mercantilism
has little economic rationale. As Paul Krugman (1997) famously pointed out, the
economist‘s case for open markets is essentially a unilateral case. If trade liberalization
brings about economic benefits and governments are convinced of these benefits, market
opening should be pursued regardless of what other countries may do.
However, mercantilism serves a useful political economy purpose. Suppose that a
government is convinced that certain liberalization measures will generate overall
economic benefits, but those measures are opposed by vested interests that stand to lose
from foreign competition. Negotiated as part of a package of trade commitments, a
government may be in a better position to proceed with market opening, because it can
muster support from those constituents that stand to gain from improved market access
abroad.
Regardless of the forum, trade negotiations in services almost always proceed on a
request and offer basis. In other words, country A submits a wish list of market opening
it would like country B to undertake, on the basis of which country B considers making
an offer. The final negotiating outcome then depends on the overall balance of
commitments—not just within services but across all areas negotiated in a given forum.
Even though the modalities are largely the same, there is a key difference between WTO
negotiations and FTA negotiations. Multilateral services liberalization under the WTO‘s
General Agreement on Trade in Services (GATS) takes place on non-discriminatory
terms. The Agreement‘s most-favored-nations (MFN) principle requires members of the
multilateral trade body to extend any trade benefit immediately to all other members. By

40
contrast, FTAs seek the liberalization of trade in services among a small number of
countries—often only two trading partners. FTAs are thus preferential in nature. Only
parties to an agreement benefit from the trade commitments negotiated under an FTA.
Service suppliers from non-parties are discriminated against.
This difference carries an important implication. The WTO now has 150 members (and
the few large economies that are still not members are in the process of acceding to the
organization). Most FTAs that are being negotiated involve existing or prospective WTO
members. Thus, for a bilateral or regional FTA to be meaningful, its parties need to
commit to additional market opening beyond their liberalization undertakings under the
GATS.
Bargaining considerations
Multilateral negotiations offer the benefit of large country coverage. At the end of the
negotiations, each member will experience improved market access in up to 149
economies. At the same time, bargaining may actually be more effective in FTAs. At
the WTO, requests and offers are exchanged on a bilateral basis, but eventual
commitments are made on an MFN basis. Thus, even though one WTO member may be
interested in improved market access in another member, it may be reluctant to engage in
reciprocal bargaining if there are third members interested in the same market access.
The end result may be a less ambitious negotiating outcome. In principle, FTAs offer a
way out, as the smaller number of players reduces the scope for free-riding on the
bargaining efforts of others.
There is an additional reason why bargaining may be more productive in FTAs. Under
preferential liberalization, domestic service providers exporting or investing in the FTA
partner country would not face any competition from service suppliers outside the FTA
area. In other words, the value of an FTA partner‘s market opening may be higher if it is
done on a preferential rather than non-discriminatory basis. In the end, governments may
be willing to pay more for preferential market access abroad, leading to deeper exchanges
of market opening commitments.
However, the story is more complicated than that, for two reasons. First the true extent
of trade preferences created by FTA commitments depends crucially on the rules of
origin adopted by an FTA. Second, many of the recently negotiated FTAs feature so-
called non-party MFN clauses that ratchet up an FTA commitment to the highest level of
market opening ever granted. We will discuss the influence of these two factors in turn.
Rules of origin
FTAs extend trade benefits to signatory parties only. Yet what exactly constitutes trade
between parties that is eligible for preferential treatment? Suppose countries A and B
take part in an FTA to which country C is not a member. Suppose further that a service
provider from country C has established a commercial presence in country B. Under

41
which circumstances, if any, would this service provider be allowed to export services to
country A? That question is resolved through so-called rules of origin.
In a nutshell, the vast majority of FTAs have adopted a liberal rule of origin, extending
benefits to non-party service suppliers established in one of the FTA parties and showing
substantive business operations there. Only few agreements—notably Australia-Thailand
and India-Singapore—have opted for a more restrictive rule of origin, limiting FTA
benefits to domestically owned and controlled service suppliers.1
The choice of rule of origin has important bargaining implications. Returning to the
above example, suppose that country A also negotiates an FTA with country C, after the
conclusion of the FTA between A and B. If rules of origin in the latter agreement are
liberal, country A may not be able to sell the same market opening measure to country C.
Since country C service suppliers are already able to access country A through their
established affiliates in country B, the government of C may not be willing to pay the full
mercantilist price for making the same commitment. (The same is true for negotiations
between A and C at the WTO, after the conclusion of an FTA between A and B).
In reality, country C will still have an interest in country A committing the market
opening measure in question in its own FTA with A, for three reasons. First, it may be
costlier for a country C service supplier to enter the market in A through country B rather
than directly from its home base in country C. Second, small and medium-sized service
suppliers may not have a presence in country B and they would benefit from accessing
country A‘s market directly. Third, unless the market opening measure is committed in
the FTA between A and C, the government of C will not be able to challenge country A‘s
actions pertaining to the market opening measure through the FTA‘s dispute settlement
mechanism.
However, the basic point remains. Liberal rules of origin reduce the preferential nature
of FTA commitments. Even though they are desirable from an economic perspective,
they undermine some of the bargaining advantages of FTA negotiations outlined above.
At the extreme, if FTA commitments do not grant any real trade preferences, why
negotiate FTAs in the first place and not confine services trade negotiations to the
multilateral level?
Non-party MFN clauses
Many of the recently negotiated FTAs in services feature provisions that require the
automatic extension of benefits granted to non-parties. For example, the MFN obligation
of the Japan-Malaysia Economic Partnership Agreement reads:
1 For a more detailed discussion of the rules of origin provisions in East Asian FTAs see Fink and
Molinuevo (2007).

42
―Each Country shall accord to services and service suppliers of the other
Country treatment no less favourable than that it accords to like services and
service suppliers of any third State.‖1
What are the bargaining implications of such an obligation? To begin with, for any given
FTA, each country has an incentive to ask its trading partner for MFN treatment, as it
ensures that domestic service providers benefit from current and future trade preferences
extended to non-parties. However, a country bound by many non-party MFN obligations
faces a less favorable bargaining situation in future FTAs. A new FTA partner knows
that any negotiated preference will be extended automatically to others. Thus, service
exporters and investors from that partner will not have exclusive access to the domestic
market, reducing the value of a future FTA commitment. Consequently, the willingness
of a new FTA partner to pay for additional market opening may be reduced.
In addition, to the extent that FTA negotiations run in parallel, the free-rider problem
described above for WTO negotiations re-emerges. If country C knows that any FTA
preference granted by country A to country B will be automatically extended to C
through a non-party MFN clause, C may hold back from paying for the same negotiated
commitment in its own FTA negotiations with A.
Overall, a country that has concluded FTAs with non-party MFN clauses covering all its
major trading partners will find itself in a situation where the difference between a new
FTA commitments and a WTO commitment is minor. To put it differently, the inclusion
of non-party MFN clauses in FTAs will, on balance, strengthen incentives to negotiate at
the WTO.
Multiple trade negotiations: key considerations for governments
From a trade ministry‘s perspective, managing multiple FTA negotiations is a
challenging task. The sequence of trade negotiations and the choice of FTA partners are
influenced by a variety of factors, not just mercantilist priorities. Trade negotiations in
services require careful coordination among different ministries and regulatory agencies.
Multiple negotiations make the coordination task even more complex. Notwithstanding
these challenges, there are a number of guiding principles that emerge from the
interrelationship of different trade negotiations:
The desirability of including a non-party MFN provision in an FTA depends,
in part, on the balance of offensive versus defensive negotiating interests.
Countries with liberal services policies and substantial export and investment
interests in the FTA partner are likely to gain from a non-party MFN clause.
The reverse holds for countries that maintain important trade barriers in
1 See Article 101 of the Japan-Malaysia Economic Partnership Agreement. In the East Asia region, twelve
out of twenty-five services FTAs feature a non-party MFN clause (see Fink and Molinuevo, 2007). In
addition to FTAs, many bilateral investment treaties provide for non-party MFN, with equivalent effects to
the ones described here.

43
services and wish to sell them for market opening in future FTA or WTO
negotiations.
In evaluating the mercantilist bargain entailed in a particular FTA, a
government needs to take into account the implications of that FTA for
parallel and future trade negotiations. If rules of origin are liberal, certain
non-party service suppliers may be granted access to the domestic service
market. That possibility may impact on the mercantilist equilibrium in other
FTA negotiations or at the WTO.
A government needs to study the identity of service suppliers present in the
market of an FTA partner. Are these suppliers ultimately owned and
controlled by domestic persons or third parties? Similarly, a government
needs to study whether domestic service suppliers can already take advantage
of trade preferences that an FTA partner has with a third country. If so, would
domestic service suppliers still value having the partner‘s preferences
extended, so that they can directly access the partner‘s market?
As pointed out above, these bargaining considerations are not rooted in an economic
logic. However, if mercantilism is to serve its political economy function to the fullest,
it‘s important that governments develop a coherent negotiating strategy that enables them
to strike the best bargains.

44
6 FTAs in Services—Positive vs Negative List Approach
Mona Haddad1
A negative list approach typically entails more transparency and credibility than a
positive list approach in services Free Trade Agreements (FTAs). A positive list
approach may replicate most of the openness benefits of a negative list approach. In
addition, a positive list approach may provide more flexibility to accommodate political
economy constraints.
Trade agreements promote international commerce in three ways: by reducing barriers to
foreign participation, by making trade policies more transparent, and by enhancing the
credibility of the trade regime. Architectural choices can make an important difference in
this respect. A critical question in the design of an FTA is how exemptions and
limitations to liberalization are inscribed into an agreement.
Most FTAs allow for sectoral carve-outs that exempt one or more activities from the
scope of the agreement. Activities falling under such an exemption are not subject to any
of the disciplines established in the agreement. The most frequently encountered carve-
outs pertain to air transport, cabotage in maritime transport, and financial services
The liberalization content of services FTAs is detailed in country-specific schedules
which involve two dimensions:
listing of service activities subject to liberalization commitments
listing of levels of openness
Lists can be done:
on a positive basis: identifying what is covered or allowed
on a negative basis: identifying what is not covered or not allowed
through mixed (hybrid) approaches
In practice, the possible combinations of lists are as follows:
1 Source: Carsten Fink and Martin Molinuevo, 2007, Background Paper for EASPR.
Openness Sectors
Positive list
Negative list
Positive list
Hybrid list
Negative list

45
Agreements with positive list of sectors
In a positive list approach, only the sectors that parties have expressly identified are
subject to market opening undertakings. Countries are free to maintain or impose trade-
restrictive measures in all non-scheduled sectors, although those measures may still be
subject to an agreement‘s general disciplines (such as on transparency).
Once a sector is scheduled, the next step is to set the level of openness in that sector.
This is done through pure positive lists (which are rarely used)1 or GATS-style hybrid
lists.
Under a GATS-style hybrid list, parties are free to describe either how trade is restricted
or what typeof services transactions are allowed in a listed sector. In a GATS schedule,
an entry that takes the form ―None, except …‖ signifies a negative list of trade-restrictive
measures, whereas an entry that takes the form ―Unbound, expect …‖ signifies a positive
list of market-opening concessions.2
Key features of GATS-style hybrid list approach:
First, schedules of commitments specify: market access ―terms, limitations and
conditions‖; and national treatment ―conditions and qualifications‖.
Second, commitments in each listed sector are made with respect to four different modes
of supply: cross-border trade (mode 1), consumption abroad (mode 2), commercial
presence (mode 3), and movement of natural persons (mode 4).3
Eleven of the twelve East Asian hybrid list FTAs follow the structure of the GATS by
distinguishing between four modes of supply and between market access and national
treatment measures. The only exception is the Australia-Thailand FTA where
commitments neither distinguish between modes of supply nor between market access
and national treatment measures. To which mode and to which class of measures a
particular commitment applies is determined by the nature of the scheduled entry.
Compared to the GATS, this scheduling approach appears to reduce difficulties in
scheduling measures that may be inconsistent with both market access and national
treatment obligations.4
1 Under a pure positive list, parties to an agreement specify for each listed service sector the level (and type)
of foreign participation that is allowed. Only two East Asian FTAs follow this approach: the Mainland-
Hong Kong and the Mainland-Macao CEPAs. 2 A negative list of trade-restrictive measures also prevails, when a scheduling member does not explicitly
indicate ―None, except …‖, but inscribes one or more limitations applying to a listed sector. For further
details on the scheduling of GATS commitments, see WTO document S/CSC/W/19. 3 In actual GATS schedules, most entries for modes 1, 2, and 3 set the level of openness on a negative list
basis, whereas the great majority of entries for mode 4 are made on a positive list basis. 4 The relationship between the GATS market access and national treatment disciplines has been subject to
conflicting legal interpretations. See Mattoo (1997).

46
Third, several GATS-style hybrid list agreements adopt an MFN obligation which is
subject to the scheduling of reservations. MFN reservations are always inscribed on a
negative list basis in relation to both service activities and trade openness measures.
Fourth, GATS-style schedules allow for horizontal commitments. Measures scheduled
in these horizontal commitments apply to all listed service sectors, unless the wording of
a sectoral commitment unambiguously indicates otherwise.
In assessing the level of openness of specific service sectors, it is therefore critical to take
these horizontal commitments into account. Sometimes they can be far-reaching—for
example, a joint venture requirement with foreign equity participation limited to 49
percent, or an entry that limits the movement of individual service providers to specific
types of intra-corporate transferees. In such cases, they effectively fix a low level of
openness across all sectors. Some East Asian countries have reduced horizontal
limitations in their FTA schedules relative to the GATS, whereas others have reproduced
entirely what they committed horizontally under the GATS.
Table 6.1 Scheduling approaches in East Asian FTAs
Agreement(s) sectors openness
1. Lao PDR-US BTA P n.a.
2. Mainland-Hong Kong CEPA
3. Mainland-Macao CEPA
P
P
P
P
4. ASEAN Framework
5. Agreement on Services
6. ASEAN-China FTA
7. Australia-Thailand FTA
8. India-Singapore ECA
9. Japan-Malaysia EPA
10. Japan-Philippines EPA
11. Japan-Singapore EPA
12. EFTA-Korea FTA
13. EFTA-Singapore FTA
14. Jordan-Singapore FTA
15. New Zealand-Singapore FTA
16. Vietnam-US BTA
P
P
P
P
P
P
P
P
P
P
P
P
P
H
H
H
H
H
H
H
H
H
H
H
H
H
17. Australia-Singapore FTA
18. Chile-Korea FTA
19. Guatemala-Taiwan (China) FTA
20. Japan-Mexico EPA
21. Trans-Pacific EPA
22. Panama-Taiwan (China) FTA
N
N
N
N
N
N
N
N
N
N
N
N
23. Nicaragua-Taiwan (China) FTA
24. Singapore-Panama FTA
25. Singapore-US FTA
N1
N1
N1
N
N
N
256. Korea-Singapore FTA N2 N3
P=positive list; N=negative list; H=hybrid list
1/ except for cross border trade in financial services for which a positive list is
adopted; 2/ except for financial services for which a positive list is adopted; 3/
except for financial services for which a hybrid list is adopted; n.a.= not applicable
(as no trade-restrictive measures are scheduled)

47
Fifth, GATS-style hybrid list agreements typically do not require signatories to make
bindings at the level of actual openness. A gap between bound and actual policies—a so-
called binding overhang—may introduce uncertainty, because governments at any point
can restrict foreign participation in their domestic service markets, as long as they stay
within their trade commitments.
The East Asian hybrid-list FTAs similarly do not impose any requirement to bind at the
actual level of actual openness. To reduce the uncertainty associated with a binding
overhang, the Japan-Malaysia EPA offers parties the possibility to identify in their
schedules those service sectors in which a party agrees to bind status quo policies. In
addition, the identified service sectors are subject to upward ratcheting: once a party
eliminates a trade-restrictive measure, policy will automatically be bound at the more
liberal level.1
Negative list agreements
Negative listing generally applies to both sectors and openness measures: trade is
unrestricted across all service activities (except where a sectoral carve-out applies),
unless scheduled limitations indicate otherwise.
The 1994 North American Free Trade Agreement (NAFTA) was one of the first to adopt
the negative list. In East Asia, Singapore was the first country to adopt a negative list
agreement in its FTA with the United States in 2003. Singapore has since pursued the
negative list model in four other agreements, including its FTA with Korea. Japan
adopted a negative list in the Japan-Mexico EPA in 2003. Korea‘s first negative list
agreement was concluded with Chile in 2004—after Chile had concluded a negative list
FTA with the United States in 2003. Countries that conclude one negative list agreement
typically seek to promote this model in subsequent agreements.
Key features of negative list agreements:
First, these agreements typically establish separate disciplines for cross-border trade and
investment in services. Cross-border trade in services in the negative list model covers
the GATS equivalent of modes 1, 2, and 4, although commitments do not formally
distinguish between these three modes of supply. The GATS equivalent of mode 3 is
covered by a horizontal investment chapter that applies to both goods and services,
though the typical investment disciplines go beyond those established by the GATS.
Second, trade in financial services receives separate treatment in several of the negative
list FTAs. The Nicaragua-Taiwan (China) FTA, the Panama-Singapore FTA, and the
1 Article 99.3 of the Japan-Malaysia EPA provides that ―[w]ith respect to sectors or sub-sectors where the
specific commitments are undertaken […] and which are indicated with ―SS‖, any terms, limitations,
conditions and qualifications […] other than those based on measures pursuant to immigration laws and
regulations, shall be limited to those based on non-conforming measures, which are in effect on the date of
entry into force of this Agreement.‖

48
Singapore-US FTA adopt a positive list of sub-sectors for cross-border trade in financial
services, but trade openness measures continue to be scheduled on a negative list basis.
The Korea-Singapore FTA extends the positive list of sub-sectors to investment in
financial services and allows parties to determine the level of openness in each sub-sector
through a hybrid list approach. Four negative list FTAs—the Guatemala-Taiwan (China)
FTA, the Japan-Mexico EPA, the Korea-Chile FTA, and the Trans-Pacific EPA—carve
out trade in financial services entirely from the scope of the agreement, leaving the
Australia-Singapore FTA and the Panama-Taiwan (China) FTA as the only agreements
for which the negative list applies, in principle, to financial services.1
Third, negative list agreements establish additional classes of openness measures for the
scheduling of specific commitments (beyond national treatment limitations and market
access obligations). New classes of measures in East Asian FTAs include:
For cross-border trade in services: local presence requirements.2
For investment: performance requirements and limitations on the nationality
or residency of senior managers and boards of directors.
For financial services: scheduling of limitations on cross-border purchases of
financial services (Singapore‘s FTAs with Panama and the United States).
Fourth, negative list agreements require binding the existing policies at the status quo
level (existing non-conforming measures), with possible exceptions (future measures).
Existing non-conforming measures include all current laws and regulations that a country
seeks to maintain. Moreover, FTAs provide for an upward ratcheting mechanism of
policy bindings: once a trade-restrictive measures identified in this category is eliminated
(on a unilateral basis), the new measure is automatically bound at the more liberal level
(in the FTA). In East Asia, all seven FTAs provide for upward ratcheting of policy
bindings.
Future measures are reservations that allow exceptions to the status quo binding of
current policies. They do not necessarily relate to existing laws and regulations, and they
allow a country to introduce new measures in the relevant sectors at any point after an
agreement enters into effect. The scope of future measures is defined through their
sectoral coverage and the description outlining the reserved policy actions. Broad future
measures can de facto exclude full sectors from an agreement‘s market opening
obligations—equivalent to not listing a sector or inscribing ‗unbound‘ for one or more
modes of supply under a positive list scheduling approach. Under the Korea-Singapore
FTA, for instance, Korea scheduled a future measure under which the government
reserves ―the right to adopt or maintain any measure with respect to (a) broadcasting
services […] (b) foreign investment in the broadcasting services sector‖.
1 However, under the Australia-Singapore FTA, Singapore scheduled several broad future measures in
financial services, substantially limiting the scope and depth of its liberalization undertaking. 2 This additional class of measure is due to negative list agreements not separately identifying the GATS
equivalent of mode 1.

49
Positive or negative list?
A negative list approach may provide greater transparency and credibility to services
trade policies than a positive list approach.
Knowing what is not allowed—rather than what is allowed—may help service providers
better understand how they can do business in a foreign country.
Because non-conforming measures reflect status quo policies, businesses are better
informed about the actual level of openness in an FTA partner and are directly pointed to
the laws and regulations affecting their ability to contest the FTA partner‘s market.
Status quo bindings also maximize the credibility value of trade commitments, as foreign
service suppliers are assured that current policies will not become more restrictive.
A negative list approach may be more pro-liberalization. Governments need to reveal
existing non-conforming measures in the course of FTA negotiations and, if they wish to
maintain those restrictions, defend their rationale. This process may create greater
incentives for eliminating unwarranted restrictions.
Negative list agreements apply to future service activities. New service activities may
emerge from technological progress or new ways of organizing business and an
automatic commitment to free trade may pre-empt protectionist pressures.
Liberalization benefits of negative list agreements depend crucially on the nature of non-
confirming and future measures scheduled.
Reservations that exempt a broad range of measures can seriously reduce the
liberalization content of trade commitments.
In the Singapore-US FTA, the United States scheduled a non-conforming measure that
effectively exempts ―[a]ll existing non-conforming measures of all states of the United
States, the District of Columbia, and Puerto Rico.‖ No state law or regulation is
explicitly listed under this reservation, making it difficult for a Singaporean service
provider to assess possible US trade barriers at the state level.1
In the same FTA, the United States scheduled a non-conforming measure under which it
―[…] reserves the right to adopt or maintain any measure that is not inconsistent with the
United States’ obligations under Article XVI of the General Agreement on Trade in
Services.‖2 This limitation appears to nullify all market access concessions that the US
1 The Japan-Mexico EPA recognizes the burden of collecting information on all trade-restrictive measures
applied at the sub-federal level. But instead of scheduling a single reservation like the one for the US,
Mexico committed to list all non-conforming measures applied by Mexican states within one year after
entry into force of the FTA. 2 See Annex 8A of the Singapore-US FTA.

50
offered to Singapore and that go beyond the US GATS commitment.1 The possibility of
scheduling future measures opens the door for excluding certain service activities from
liberalization undertakings and binding policy above status quo levels in negative list
agreements—diluting the difference between hybrid list and negative list agreements.
In the Japan-Mexico EPA, Mexico scheduled a future measure under which it ―[…]
reserves the right to adopt or maintain any measure relating to the supply of services in
any mode of supply in which those services were not technically feasible at the time of
entry of force of this Agreement.‖ This reservation effectively denies the application of
the agreement to future service activities—one of the supposed benefits of negative
listings.
A positive list approach may replicate much of the benefits of a negative list approach.
It is in principle possible to replicate every negative list schedule with a positive list
schedule. In addition, GATS-style hybrid list agreements allow for the scheduling of
measures on a negative list basis, preserving possible transparency benefits associated
with negative listing.2
The benefits associated with status quo bindings are not necessarily limited to negative
list agreements. In the Japan-Malaysia EPA a requirement to schedule at the level of
existing policies was incorporated into a positive list agreement.
Three of the East Asian negative list FTAs have partially or fully reverted to a positive
list in scheduling commitments for financial services—a sector where regulatory
sensitivities towards foreign participation are common. Three of the remaining four
negative list FTAs have carved out the financial service sector altogether, leaving the
Australia-Singapore FTA as the only agreement in which the negative list applies to
financial services.3
A positive list approach may provide more flexibility to governments and may be more
conducive to market opening of sensitive sectors.
A positive list of sectors combined with the possibility of binding above status quo
policies may provide important breathing room to governments. Such breathing room
1 The transparency of the US commitment in the Singapore-US FTA is reduced by another provision of this
agreement. Schedules of non-conforming measures contain both a description of the relevant measures and
a reference to the relevant laws and regulations. Article 2(g) of Annex 8 of the Singapore-US FTA provides
that ―description, for Singapore, sets out the non-conforming aspects of the measure for which the entry is
made; and description, for the United States, provides a general, non-binding, description of the measures‖. 2 In principle, a positive list of sectors can even apply to future service activities by covering residual
service sectors, such as ‗other business services,‘ ‗other financial services,‘ or ‗other services not included
elsewhere.‘ 3 However, Singapore scheduled several broad future measures under this FTA, preserving its freedom to
maintain or impose restrictions on the supply of financial services by Australian institutions. For example,
one such future measure reserves Singapore‘s right ―[…]to adopt or maintain any measure affecting the
supply of services by foreign full banks or in relation to Qualifying Full Bank licenses.‖

51
may be needed in cases where governments have limited administrative capacity to
compile an inventory of all trade-restrictive measures, including at the sub-federal level,
or in sectors where there are sensitivities towards foreign participation.
Positive list agreements seem to afford governments the ability to tailor commitments to
political economy constraints. They may thus give governments the confidence to
embark on some liberalization rather than fully excluding sensitive sectors.
In sum, negative lists generally bring about greater transparency than positive lists.
Negative lists and positive lists can achieve similar openness outcomes depending on how
the agreements are actually written.

52
7 Labor Mobility Provisions in FTAs: Lessons for China
Min Zhao & Jean-Pierre Chauffour
Labor mobility issues are more contentious than either trade or capital
liberalization. Large wage differences between countries give rise to ―pauper labor‖
fears – the apprehension that immigration from poor countries will sharply drive down
wage levels and create unemployment in the destination country. During the previous era
of globalization in the late 19th century, visas and work permits were not required for
people to move between countries. At its historic peak, migration accounted for about
70% of the observed international convergence of the ratio between the real wage level
and the rental value of capital. Today, adverse popular reaction to the economic and
social impacts of immigrants has kept progress toward global labor mobility well below
progress toward trade and capital liberalization. In 2000, only 3% of the world‘s
population (175 million persons) lived outside their country of birth, but global exports of
goods and services represent more than one third of world GDP, and the ratio of the stock
of world foreign direct investment stock to world GDP is almost as large.
Both developed and developing countries stand to gain from liberalization in the
mobility of labor. The OECD estimates that further liberalization, to the extent of 3% of
the workforce of OECD countries, could result in significant global welfare gains of up to
$156 billion per year. 1 Other estimates indicate that a complete liberalization of Mode 4
would lead to gains ranging from nearly 10% to 67% of world GDP. 2 Interestingly, 70%
of the potential gains from further labor liberalization are attributed to the possibility of
greater mobility for unskilled workers (worth an estimated $110 billion annually).
Despite the size of potential gains, as estimated by economists, most countries are
wary of liberalizing labor mobility. Unlike free movement of goods, services and
capital, which have been promoted by trade agreements, meaningful provisions on labor
mobility are hardly found in those same agreements, and very few such international
accords exist. In most countries, the movement of labor remains the subject of national
determination and falls within the jurisdiction of the immigration authority, whose main
concern can be to regulate and restrict, not promote.
Services liberalization has not made much progress at the multilateral level, but the
members of some of the recent regional trade agreements (RTAs) have accepted
greater labor mobility at the regional level. While the WTO GATS does not define
specific categories of labor, WTO members have accepted four widely used categories of
1 See OECD (2004), and Strutt, Poot and Dubbeldam (2008). In this paper, the OECD assesses the gains from complete
liberalization of merchandise trade at $104 billion per year. However, this OECD estimate of gains from trade liberalization is far smaller than the estimate made by the Peterson Institute. According to Bradford, Grieco and Hufbauer, the US economy was approximately $1 trillion richer in 2003 due to past globalization – the payoff both from technological innovation and from policy liberalization – and could gain another $500 billion annually from future policy liberalization. See Bradford, Grieco and Hufbauer (2005). 2 See Hufbauer and Stephenson (2009).

53
skilled professionals for the purpose of inscribing commitments under Mode 4, both in
the GATS and in regional trade agreements (RTAs). 1 Given the impasse in the Doha
Round and the lack of any progress on services in the multilateral negotiations for the
past several years, it is hard to expect great progress on the labor mobility through WTO
negotiations. A large number of RTAs, however, have incorporated Mode 4 as part of the
package, and interesting initiatives have been taken. Several free trade agreements have
been entered into by developing countries in the Americas and in Asia containing
provisions that facilitate procedures for temporary labor movement and open up market
access opportunities. Some agreements include guaranteed numerical quotas for certain
categories of skilled labor.
Given the limited commitments made under GATS, developing countries such as
China, which want to expand openness to include semi-skilled workers and
movement unrelated to a specific commercial presence, may find that broader FTA
provisions are of interest.
International experience
In international services trade, labor mobility is conceptualized as the temporary
movement of natural persons or Mode 4. The WTO GATS defines it as the supply of
a service ―by a service supplier of one Member, through presence of natural persons of a
Member in the territory of any other Member.‖ The four traditional Mode 4 categories
are (1) Business visitors and salespersons (BVs); (2) Intra-corporate transferees (ICTs);
(3) Independent professionals (IPs) and (4) Contractual services suppliers (CSSs). 2
WTO agreements have no general provisions for labor mobility. Since 2000,
however, the temporary movement of certain types of workers – namely, service
suppliers – has been negotiated to a very limited extent under WTO GATS Mode 4.
Mode 4 is designed to facilitate the movement of people in a way analogous to the
movement of goods and capital. Movement associated with Mode 4, however, covers a
very small share of annual cross-border movements of people and accounts for less than
2% of the total value of services trade. In particular, Mode 4 narrowly targets highly
skilled workers that are often subject to an economic needs test on the part of the
employer, intra-corporate transferees and business visitors, and specialized labor for
which it is hard to find substitutes (e.g., medical and construction services). Other
limitations of Mode 4 liberalization include: general reluctance by governments to make
international commitments that limit their sovereign right to control immigration and
determine labor market conditions; commitments that require openness to all countries on
a most-favored-nation (MFN) basis that would undermine preferential migration schemes
1 All WTO members are signatories to GATS, which does not cover permanent migration. GATS is based on four key
elements, identified as Modes 1 to 4: Mode 1 relates to cross-border supply; Mode 2 focuses consumption of services abroad; Mode 3 covers the commercial presence of foreign firms; and Mode 4 deals with the movement of natural persons. The WTO approach is limited to the temporary movement of workers, as opposed to permanent emigration 2 Mode 4 of GATS is defined as the “supply of a service… by a service supplier of one Member, through presence of
natural persons of a Member in the territory of another Member". This includes independent service suppliers and the self-employed, as well as foreign employees of foreign companies established in the territory of a Member. See World Bank Global Economic Prospects (2004).

54
negotiated at the bilateral and regional levels; and the exclusion from Mode 4 of labor
provisions related to permanent employment, citizenship or residency.
Given the restricted scope of Mode 4 in GATS, most countries adopt labor
provisions in their bilateral and regional RTAs. A collateral benefit is that the RTA
may also include labor mobility provisions beyond what is covered by GATS, such as the
right of establishment and full national treatment (non-discrimination) for service
suppliers based in the partner country; commitments on visas; and chapters that spell out
the rights of investors.
A comparison of labor provisions reveals other common characteristics: (1) labor
mobility does not typically replace general migration legislation; (2) a right of labor
mobility does not automatically entail the right to practice a certain profession as national
regulations for licensing and qualifications usually apply; (3) some agreements are
limited to specific sectors (e.g. manufacturing); and (4) some agreements move beyond
the WTO General Agreement on Trade in Services (GATS) to cover intra-corporate
transferees and investors in a separate chapter on general movement of natural persons.
While most RTAs focus almost exclusively on professional service providers, distinct
progress has been made with respect to professional services. Many go beyond the
WTO GATS in providing access for a greater number of categories of professional
services, either with expanded numbers of covered categories or in providing unlimited
access. For example, in some RTAs, the coverage of labor categories is expanded to
include technicians, trainees, nurses, caregivers, installers, spouses and dependents.
Differences between developed countries‘ approach to Mode 4 liberalization are striking:
time limits, numerical limits, range of professionals, and their imagination in creating
innovative categories. They also often offer the possibility of long-term visa renewals
once professionals are settled in the country.
Very recent development shows a few developed countries have been willing to go
beyond the expansion of access for professional service providers. This includes
notably Canada, in the two recent FTAs negotiated with Colombia and Peru: the FTAs
extend access to the Canadian market to 50 categories of technicians. The innovative
category also includes the EPA of the EU with CARIFORUM that has extended market
access to contractual service suppliers and independent professionals (for 6 months) and
to graduate trainees (for 1 year). Japan has moved to liberalize access to its labor market
for the categories of nurses and care workers in its recent EPAs with Indonesia and the
Philippines. Finally, both Australia and New Zealand have expanded the categories of
labor in their RTAs to include both contractual service suppliers and ―installers‖ (for
New Zealand) in their recent agreement with ASEAN members and in the New Zealand
RTA with China. The New Zealand RTA with China also has novel provisions for
artisans that are proficient in Chinese cultural occupations, such as theater, language, and
medicine. Australia has innovated in its very recent RTA with Chile to cover the spouses
and dependents for ICTs and CSSs residing in the country longer than one year. Thus
Trade agreements have moved over the past two years beyond the purely professional

55
categories of labor to include CSSs, semi-professionals and technicians, nurses, care
workers – and even spouses and dependents – within their scope.
The trading partners that have been the most willing to open their markets wider
for foreign workers from developing RTA partners have been countries that face
considerable labor shortages. Canada has shown itself the most generous in this respect,
with Japan being selective and sector-specific in responding to its labor market needs.
Australia has been willing to consider family dependents as part of the labor categories
defined under its most recent RTA. The United States and the European Union who have
both faced heavy inward migration flows – both documented and undocumented – from
Latin America (in the United States) case and from North Africa and Eastern Europe (in
the EU case), are less willing to contractually bind greater market openness for foreign
workers in their RTAs.1 Nonetheless, the European Union did expand its coverage of
labor categories in the recent EPA with CARIFORUM members. However, in the United
States official and public attitudes have turned sour, and no agreements have been
negotiated with Mode 4 coverage since 2002.
Against this background, there is scope for further expanding opportunities in
RTAs. The story of labor mobility within trade agreements continues to evolve.
Developing countries who are able to pro-actively define and push their interests with
developed-country trading partners should find opportunities that did not exist in the past.
To this end, developing countries need a well-designed strategy. It would be advisable to
develop local training programs for the specific skills required in the target market.
Bilateral labor agreements (BLAs) are alternative instruments to the more legalistic
and rigid RTAs, in particular in promoting mobility of semi-skilled and unskilled
labors. The first and foremost advantage of BLAs or Temporary Worker Programs is
that they provide considerably more flexibility with respect to the management of the
labor market by the countries involved. Such agreements can be negotiated in response
to the economic cycles of the market. Importantly, monitoring of such agreements can be
carried out on both sides as a joint responsibility, rather than putting the burden entirely
on the destination country to determine the legality of the worker. Guarantees can be
designed and written into the agreements in the form of bonds or fines for non-
compliance, to encourage the respect for the provisions by private parties. Of course the
disadvantage of bilateral labor agreements is that they are single-issue instruments, unlike
RTAs. This limitation means that developing country partners do not have the scope,
within a BLA, to trade off their ―offensive‖ interests in labor mobility for the ―offensive‖
interests of their developed country trading partners.
Possible lessons for China
1 Indeed, a very recent RTA between the EFTA members and Colombia, signed on November 25, 2008, does not even
include an Annex on Professional Service Suppliers and contains no mention of the movement of natural persons other
than their definition as Mode 4 in the body of the agreement. The EFTA members – Iceland, Liechtenstein, Norway
and Switzerland – are not facing labor shortages, and in the current hostile economic climate did not feel any pressure
to include liberalization of labor mobility as part of their agreement with Colombia. See www.sice.oas.org.
56
Given that low-skilled workers account for the majority of Chinese seeking
employment abroad (estimated about 75% of total labor exports in 2004), the
prospects for liberalizing labor mobility along the outlines of GATS Mode 4 may not
resonate strongly with Chinese RTA interests. Liberalization under Mode 4 is
oriented to highly skilled service suppliers, as well as executives, managers, and other
intra-corporate transferees. Like most developing countries, such as Thailand and
Philippines, China has expressed its interest in better opportunities abroad for middle-
skill groups, including semi-skilled and even unskilled workers.1
So far, China has only reached agreement on limited labor mobility and some
facilitation. Until recently, China addressed labor mobility through stand-alone bilateral
cooperation agreements or MOUs rather than in PTAs.2 In 2008, one of the more
ambitious and comprehensive labor agreements was reached with New Zealand.
Annexes 10 to 12 of the China-New Zealand PTA permit temporary labor mobility,
including unique bilateral commitments to allow up to 800 skilled workers from China in
specific ―cultural‖ sectors (e.g., Chinese medicine, martial arts) and a maximum of 1,000
skilled workers for up to three years in specified occupations where New Zealand faces a
shortage of skills. Facilitation clauses call for improved processing and transparency of
visa requirements, and extended work permits for senior and intra-corporate transferees.
Following the framework used with New Zealand, labor mobility for business visitors
and intra-corporate transferees were also included in recent Chinese trade agreements
with Singapore and Peru.3
When China is interested in pursuing bilateral trade agreements with the major
developed trading partners (other than the United States at the present), there is a
chance to obtain an expanded market access. Labor markets worth exploring are
opportunities for firms and individuals that bring unique cultural talents or specialized
skills, some independent professionals, and niches of the industrialized developed
economies with labor shortages – geographic locations or particular occupations. If
developing countries such as China wish to promote exports of service providers in the
health services, this is certainly an area that offers a large potential for expansion. For
this market, it might be advisable to develop local training programs for the specific skills
required in the target market, in the way that the Philippines has done and Indonesia is
currently doing. In the case of workers with lower skill levels and less formal
educational training, the best vehicle for promoting greater labor mobility is not that of
formal RTAs, but rather the more flexible instrument of temporary worker programs
(TWPs).
1 China is also interested in labor mobility under Mode 4, including under the categories of intra-corporate transferees
and business visitors because China has become a platform for many multinational companies. Relative to its
population size, Chinese labor migration is small, contributing about 540,000 compared with 9 million from the
Philippines. See Shin-yi Peng, (2006), Hufbauer and Stephenson (2009), and Gao (2009), 2 China has signed 10 bilateral labor cooperation agreements with 10 countries, including the UK, Russia,
Jordan, Malaysia, Korea, Mauritius, Saipan, Bahrain, Australia and UAE. See Gao (2009) 3 The China-Singapore PTA also included labor mobility for contractual service suppliers. While the
China-Chile PTA includes an annex on temporary movement of business persons, it does not contain
substantive commitments. See Gao (2009).

57
Nevertheless, given the super political sensitivity of labor mobility, labor mobility
negotiations will be a long, persistent, and patient search for niches in the labor
markets of development countries where greater entry of migrants is not only
tolerated but welcomed. To better serve the negotiations, policy makers and negotiators
may bear the following six precepts in mind:
Negotiators should approach the discussions of labor mobility with a
positive attitude and emphasize gains to the destination country. The
economic gains are invariably large, and the political costs are often
exaggerated, but it is helpful when negotiators from developing countries
can research particular labor markets and lay the facts on the table.
To better serve their negotiators, government should conduct in-depth
research on the labor markets of potential destination countries. The goal
is to discover promising niches. This will require specialized officers or
contractors working in the destination countries.
Likewise, country specialists should work with educational and
credentialing authorities in the developed countries to lay the groundwork
for mutual recognition agreements for the benefit of their independent
professionals and other highly skilled workers. Also, China could push
for the formulation of international standards based on its own domestic
standards in sectors in which China has special advantage, such as TCM,
Chinese chef, Mandarin language teacher, martial arts instructors, etc.
When Chinese firms are seeking to expand their operations abroad,
whether in a developed or developing country, government negotiators
should team up with the firm to ensure agreement on the requisite number
of visas for ICTs and CSSs to support the new operation. This needs to be
done whether or not an RTA is in place.
Negotiators should seek agreement on the status of Mode 4 workers,
meaning their rights as to visas, working conditions, social security
contributions, unemployment compensation, and ability to remit funds.
For example, quota designations for certain ―cultural‖ occupations, and
artisans and workers in short supply, may be feasible, especially if there is
some provision for flexibly adjusting the quotas on an annual or biennial
basis to reflect labor market conditions.
Above all, senior officials must mind the ―image‖ of their migrants abroad
– doing whatever is possible to ensure that their migrants are seen as hard-
working, law-abiding, respectful people. When adverse incidents happen,
as they will, the government should cooperate as appropriate, including
revocation of visas and other measures.

58
References
Gary Hufbauer and Sherry Stephenson (2009) Increasing Labour Mobility: Options for
Developing Countries, background paper
Gary Hufbauer and Yee Wong (2009) China‘s Trade Agreements: Lessons from Other
Countries, background paper
Henry Gao (2009) Supporting China‘s Regional Trade Agenda: China‘s Strategies on
Negotiating Competition, Environment, and Mode 4 Provisions in its RTAs, background
paper

59
Annex 7.1
Comparison between WTO and RTA Provisions
This annex will provide a brief overview of the nature and type of provisions for labor
mobility in developed countries‘ RTAs as they are compared with WTO GATS Mode 4.
United States
NAFTA predated and informed the development of GATS by providing the language for
temporary labor mobility, defined as the temporary movement of business persons
―without the intent to establish permanent residence.‖ Under NAFTA, a separate side
agreement for labor, the North American Agreement on Labor Cooperation (NAALC)
emphasized that each Party had a commitment to enforce its domestic labor laws but also
addressed questions beyond the standards articulated in conventions of the International
Labor Organization (ILO).110
The inclusion of ―internationally recognized labor rights,‖
especially minimum wage provisions that potentially have the greatest impact on trade,
goes beyond core ILO standards; this has become standard fare in nearly all US RTAs.2
Specifically, the NAALC adopted clauses to prevent occupational injuries and illnesses;
to provide compensation in cases of occupational injuries and illnesses; to protect migrant
workers; and to ensure labor rights related to minimum wages.
In NAFTA, labor mobility provisions were limited to higher skilled workers in four
business categories: business visitors, professionals, intra-company transferees; and
traders or investors (including those in the agriculture and manufacturing sectors). To
facilitate temporary labor mobility, Chapter 16 of NAFTA also allowed renewable Trade
NAFTA (TN) visas for professionals that lasted up to one year and are now uncapped for
both Canadians and Mexicans.
Besides NAFTA, agreements with Chile and Singapore expanded labor mobility for
professional workers, and created a path for H-1B1 visa that included the possibility of
unlimited extensions. Unfortunately, these provisions sparked a strong backlash from the
US Congress, which objected to trade agreements that seemed to infringe on immigration
policy. Since 2002, no trade agreements have included a chapter on temporary entry.
Instead, RTAs with Morocco, DR-CAFTA and Peru, include an Annex on Professionals
with similar objectives as the NAFTA Annex.
While NAFTA provides the most comprehensive example of US legal provisions for
labor in a RTA context, all US RTAs include at least one reference to labor standards in
1 It is important to emphasize, however, that NAFTA does not embrace ILO conventions, since few of them have been
accepted by the United States. 10
It is important to emphasize, however, that NAFTA does not embrace ILO conventions, since few of them have been accepted by the United States. 2 These international labor standards reflect domestic US concerns about trade policy and they include: the right of
association; the right to organize and bargain collectively; prohibition of forced or compulsory labor; minimum age for employment of children; and acceptable conditions of work with respect to minimum wages, hours of work and occupational safety and health. See Grynberg and Qalo (2007).

60
the preamble. Examples of stronger labor clauses include the US-Jordan, US-Chile and
US-Peru RTAs, which emphasize commitments to international labor standards and
domestic labor laws, and encourage cooperation to improve basic worker‘s rights. In
particular, the US-Jordan RTA goes a step further to ensure that parties meet obligations
on labor standards, subjects not included under NAFTA. The US-Jordan RTA stipulates
that each ―Party shall not fail to effectively enforce its domestic labor laws in a manner
affecting trade between the Parties.‖ Labor standards were mentioned in RTAs with
Australia and Singapore, but negotiations leading to the US-Peru RTA provided a new
template, in accordance with a US Congressional mandate for language on ―fundamental
labor rights‖. This template has now been applied to recent RTAs with Colombia,
Panama, Peru and South Korea. In particular, the Peru RTA forbids governments from
waiving or otherwise derogating from ―fundamental labor rights‖ (a term that was not
further defined).1 As a result, the United States is now an advocate for stronger set of
international legal responsibilities, such as the obligation to ―adopt and maintain‖ labor
rights.
European Union
Except for the founding European agreement, the Treaty of Rome (ratified in 1957) and
non-reciprocal RTAs with African and Caribbean countries, the EU has shown less
appetite for including labor standards in bilateral and regional association agreements.
Under Article 18 of the Treaty of Rome, Europe took a very liberal approach to labor
mobility that extended to all categories of citizens and includes immigration rights.
However, this ―single country‖ approach only applies to the core EU 15 members; free
immigration from the newer 10 members, admitted in 2004 is supposed to be a reality by
2011.
European RTAs with non-member countries are more restrictive, partly because the
European Commission does not yet have negotiating authority from EU member states in
all of the service areas. Accordingly the RTAs reserve to each party the discretion to
grant, refuse and administer residence permits or visas. The Euro-Mediterranean
agreements explicitly state that labor mobility provisions cannot be used to challenge an
immigration decision that refuses entry.
Unlike US RTAs, European labor provisions are not collected in a single chapter or
article, but instead are referenced in other provisions. For example, the EC-Chile RTA
addresses labor standards in Article 44, within the context of a general provision on
social cooperation that mentions a commitment to relevant ILO conventions. Other trade
agreements, such as the Euro-Mediterranean RTAs with Morocco and Tunisia, stipulate
non-discriminatory conditions for workers beyond service suppliers.
1 See Article 17.1 of the US-Peru RTA, available at:
http://www.ustr.gov/Trade_Agreements/Bilateral/Peru_TPA/Section_Index.html. The interpretations of other key provisions, such as “freedom of association” and “collective bargaining,” are likewise undefined. The United States has not ratified the ILO convention on freedom of association, which dates to 1949. As a result, the US government has adopted labor provisions in its RTAs that go beyond its acceptance of ILO declarations, opening the possibility that US federal and state labor laws will need to be changed or be subject to trade sanctions. See Charnovitz (2008).

61
Japan and New Zealand
Japanese and New Zealand RTAs do not explicitly address labor provisions.1 Instead, in
cases where RTAs do not contain labor-related provisions, Japan or New Zealand is
expected to observe the fundamental principles stated in the ILO Declaration on
Fundamental Principles and Rights at Work (1998). Key ILO labor rights enumerated in
the Declaration and other conventions include: freedom of association, right to organize
and bargain collectively, non-discrimination, freedom from forced labor, minimum age of
employment for children, and elimination of the worst forms of child labor.
In some cases, Japanese RTAs outline a narrow application of labor standards. For
example, Article 103 of the Japan-Philippines RTA emphasizes that both parties should
not weaken domestic labor laws to attract investment: ―Parties recognize that it is
inappropriate to encourage investment by weakening or reducing the protections afforded
in domestic labor laws.‖2
1 The same practice is followed in RTAs negotiated by EFTA.
2 Bourgeois, Dawar and Evenett (2007).

62
Annex 7.2
Scope of Labor Mobility in RTAs
Countries in geographic proximity to one another and with similar levels of economic
development – such as within the European Union or the Australia-New Zealand Trans-
Tasman Travel Arrangement (TTTA) – are likely to follow a more liberal approach to
labor mobility.
United States
NAFTA is the only US RTA that offers full mobility of labor in designated categories,
albeit temporary, and in the case of Mexico with numerical limits (since relaxed). All
other trade agreements start with the GATS framework (constructed after NAFTA had
been signed), and then add additional elements. The US-Jordan RTA, for example,
extends GATS labor mobility by specifying visa commitments for both independent
traders and persons linked to investment beyond service suppliers.
European Union
Under the Treaty of Rome, the original European Community guaranteed comprehensive
rights of labor mobility, allowing every EC citizen the fundamental right to move freely
between the territories of member states. This, of course, is the general practice within
single nations. No visas or work permits were necessary to move from one EC member
state to another, although sometimes residence permits were required.
Despite this liberal foundation, progress still remains to be made in relaxing restrictions
on movement of labor within the enlarged European Union. Workers in the new Central
and Eastern Europe (CEE) member states are not yet able to move freely. For example,
CEE workers face sectoral exclusions and a horizontal transition period of ten years.
When the European Union expanded from 15 to 25 member countries in 2004, only the
United Kingdom, Ireland and Sweden waived the opportunity to impose immigration
restrictions lasting up to seven years. But the United Kingdom allowed unskilled workers
from Bulgaria and Romania in just two sectors: food processing and agriculture.
Bilateral European RTAs have very limited labor mobility provisions, based primarily on
the GATS framework with specific carve-outs. For example, the EU-Mexico RTA only
provides labor mobility through trade in services, and specifies a ten-year transition
period. Under the Mexico trade agreement, certain sectors are excluded (e.g., audio-
visual, air transport) and both parties can regulate the entry and stay of individuals. The
EU-Chile RTA, however, is broader in scope and covers Mode 4 as well as 33 categories
of professional service providers that it accepts from Chile without numerical limit.
Similarly, the EU-CARIFORUM Economic Partnership Agreement expanded the
coverage of workers to include contractual service suppliers, independent professionals
and graduate trainees.

63
Japan
Despite its tradition of a highly restrictive policy towards foreign labor, Japan is one of
the few Asian countries that made large commitments under GATS. In particular, as part
of its Mode 4 negotiations, Japan offered to increase market access for natural persons
that are not related to establishing a commercial presence under Mode 3; moreover, Japan
offered a generous time limit of three years for most categories. While none of the
Japanese RTAs provide full labor mobility, some include provisions on the ability of
companies to bring key personnel under the investment chapter. For example, Chapter 9
of the Japan-Singapore RTA includes specific commitments for movement of persons
related to business purposes and investment that outlines short-term visitors and intra-
corporate transfers. There are also provisions and a joint committee devoted to mutual
recognition of professional qualifications.
Two recent RTAs moved beyond the Singapore RTA and indicate an innovative
approach that has not yet been seen in other trade agreements. Agreements with
Indonesia and the Philippines, for example, are unique in covering specific categories of
nurses and care workers with annual quotas and training requirements.
New Zealand
The combination of the Australia-New Zealand CER and the Trans-Tasman Travel
Arrangement (TTTA) allows for full market access, mobility and national treatment for
all service suppliers. First established in 1923 and formally codified in 1973, the TTTA
was developed through a series of immigration accords between the two countries.
Although some sectors under the CER are excluded (e.g. air services, broadcasting, postal
services), the TTTA provided complete labor mobility by allowing a person to register an
occupation and practice that profession if he is so registered in his home country.1
After the CER, the second most comprehensive labor provisions are articulated in
Chapter 11 of the New Zealand-Singapore RTA. Both parties agree to review
commitments every two years and expand on initial commitments to meet the APEC
objective of free and open trade in services by 2010. While the trade agreement largely
mirrors the GATS framework, there are a few features that go beyond GATS: service
exporters from New Zealand will have better access to the Singapore market in specific
areas such as architecture, engineering, telecommunications, finance, education and
environmental services. In addition, business and intra-corporate transferees can enter
both countries more freely (up to one month with a possible extension for another two
months).
Besides the CER and the Singapore RTA, other New Zealand trade agreements, such as
the New Zealand-Trans Pacific Strategic Economic Partnership and the Thailand RTA,
narrowly focus on steps that will facilitate labor mobility. Examples of labor facilitation
include streamlined immigration clearance procedures, increased recognition of
qualifications and registration systems for certain professions, and work permits and
temporary entry for intra-corporate transferees or senior managers. By contrast, more
1 In 2001, Australia modified the agreement by excluding social security eligibility from New Zealanders who are not
permanent residents.

64
substantive commitments under the ASEAN-Australia-New Zealand RTA include a
chapter on temporary entry that allows New Zealand managers one of the longest time
stays for intra-corporate transferees (3 or 4 years). Recent RTAs with both ASEAN
members and China suggest that New Zealand is moving beyond the expansion of access
for professional service providers to include both contractual service suppliers and
―installers.‖

65
Annex 7.3
Institutions and Enforcement of Labor Provisions in RTAs
Most RTAs do not establish a separate institution to enforce national labor laws and
regulation commitments. European RTAs, for example, do not create institutions to
manage implementation of labor standards. A few US trade agreements create
institutions, but and they are usually subsumed within a general institutional structure
spelled out in the RTA.
Labor provisions are also rarely enforced with a formal dispute settlement mechanism.
Instead, most RTA partners agree to hortatory commitments with few enforcement
mechanisms, beyond encouraging both parties to comply with their own domestic labor
laws. In some trade agreements, such as the Euro-Mediterranean Association
Agreements, dispute settlement procedures are simple and vague. The Euro-Med RTAs
allow both parties to use Joint Committees to arbitrate any disputes and take any
measures deemed ―appropriate‖ if either signatory fails to fulfill its obligations. These
decisions are made on a consultative basis, are non-binding and have no provisions for
trade sanctions. Within NAFTA, the United States created a complex consultation
mechanism, deliberately designed not to lead to binding arbitration. The Peru RTA
establishes a Labor Affairs Council and formal dispute settlement procedures to ensure
that both parties effectively enforce their own domestic labor laws; penalties are possible,
but as a last resort. Japan established an arbitration panel covering labor issues in just
one of its RTAs. Under the Japan-Philippines RTA, labor provisions are addressed in the
investment section, and any disputes can be brought to a general dispute settlement
mechanism. To forestall a race to the bottom in labor standards (which in any event is
unlikely), if one party considers that another has weakened domestic labor laws to
encourage investment, it can request consultations with the other party.
United States
NAFTA, US-Chile, US-Peru and US-CAFTA-DR RTAs are the few trade agreements
that established labor-specific regulatory authority to monitor implementation of labor
provisions. Under NAFTA, the NAALC cannot enforce labor laws in the territory of a
party but it does provide the equivalent of a supranational labor affairs council. Under
Article 4, any entity with a legally recognized interest can access NAALC tribunals for
evaluating the enforcement of a party‘s domestic labor laws. NAALC is unique in being
the first regional labor side agreement containing economic sanctions for labor rights
violations, following an arbitration process. In theory, fines can be levied to redress
persistent non-enforcement, and if fines are not paid the other NAFTA parties can then
impose trade sanctions. However, these measures have never been invoked.
The NAALC framework has several limitations. For example, although NAALC
emphasizes signatories commit to enforce their own national labor laws, NAFTA parties
are not committed to observe the ILO Declaration on Fundamental Principles and Rights

66
at Work. The dispute settlement mechanism is cumbersome, and the lengthy process for
issuing reports averages more than 30 months.
Since 2002, the United States has amplified the possibility of enforcing labor standards in
its bilateral RTAs. Some recent RTAs, such as US-Australia and US-Morocco, explicitly
include the option of WTO dispute resolution on labor standards issues. The US-Peru
RTA strengthens labor provisions by mandating both parties to enforce domestic labor
laws through a mechanism that includes monetary penalties, transparent domestic legal
procedures and openness (e.g., a public hearing). The Peru RTA also creates a labor
cooperation and capacity building mechanism to promote cooperation on labor-related
issues such as fundamental rights to work, the worst forms of child labor, and
occupational safety.1 Besides NAALC and the Labor Council under the Peru RTA, a few
other US RTAs incorporated labor-related institutions under the umbrella of Joint
Committees that oversee the general implementation of the trade agreement. For
example, the US-Jordan RTA allows the possibility for an independent supranational
dispute settlement mechanism and grants non-binding dispute panel proceedings for the
violation of labor provisions.2 However, there is a high threshold to meet before initiating
a review of labor rights issues. Unlike the NAFTA, the parties to the US- Jordan RTA
agreed in an exchange of letters not to impose trade sanctions for labor disputes. By
contrast, sanctions under RTA with Chile, Peru and Singapore are allowed, though the
possibility is remote and a cap of $15 million annually is imposed.
The weakest institutional mechanism to oversee labor provisions is the voluntary option,
where both parties designate a domestic representative at the national level within the
labor ministry to consult on labor affairs. For example, the US-Morocco RTA only
encourages parties to commit to provisions and, if necessary, convene a national labor
advisory committee or publish any relevant reports.
1 See Villarreal and Bolle (2006); and Everett Eissenstat, Assistant USTR, Testimony before House Committee on Ways
and Means, July 12, 2006. 2 By contrast, NAFTA only allowed complaints to be submitted on three key labor provisions: child labor, minimum
wage and technical labor standards, and occupational safety and health.

67
8 Competition Provisions in FTAs: Lessons for China
Jean-Pierre Chauffour
The costs imposed by anti-competitive practices were recognized by Adam Smith
more than two hundred years ago. Today, countries widely appreciate Smith‘s insights
and the potential for anti-competitive practices to undermine the benefits of trade
liberalization. Even though the Doha round negotiators under WTO auspices have no
mandate to negotiate a multilateral framework on competition policy, individual
countries have signed rules on competition policy in at least one quarter of all bilateral
and regional trade agreements (RTAs) in force or under negotiation. The inclusion of
competition-related policies are part of the growing agenda on ―behind the border‖
measures, – the effort to deepen trade agreements to cover liberalization in services,
investment and labor markets, government procurement, monetary and financial
integration, and environmental issues.
Competition policies may play a significant role in supporting the benefits of trade
and investment liberalization. They prevent the economic and consumer welfare gains
anticipated from liberalizing markets from being undermined by cross-border
anticompetitive practices (e.g., cross-border mergers and acquisitions that could
monopolize the domestic market). Competition provisions also tend to reduce collateral
distortions from other policies, for example anti-dumping measures implemented with
price or volume undertakings. They support region-wide competition policy institutions,
and ensure that foreign firms can access open and competitive markets.
Competition provisions could be particularly useful for dynamic emerging countries
such as China. Commitment to sound competition policies can help developing
countries overcome powerful domestic constituencies that would otherwise block the
reform process and carry on their cartel practices. Recent empirical evidence suggests
that competition provisions are welfare enhancing in the long-term; the research takes
issue with the view raised by some countries that competition provisions will
compromise their development efforts. The main challenge facing developing countries
such as China seems to be the cost to effectively enforce competition-related policies.
Among China‘s existing RTAs, none includes special chapters or side agreements on
competition. To the extent that some of China‘s RTAs contain isolated provisions
addressing competition policy, they are usually rather general and do not create specific
legal obligations. Moreover, they often do not go beyond the existing WTO provisions.
For example, Articles 69 and 70 of China‘s RTA with Singapore address monopolies and
exclusive service suppliers and restrictive business practices, respectively. However,
closer examination reveals that the two articles simply copied the language of Articles
VIII and IX of the GATS without adding anything new.1
1 Similarly, the language on the rejection of practices abusing intellectual property rights in Article 111.1(e) of the RTA
with Chile simply reiterates the principles in Article 8 of the TRIPS.

68
The scarcity of competition provisions in China‘s existing RTAs does not necessarily
mean that China is reluctant to engage in international cooperation on competition
policy. Instead, during both the drafting and the enforcement of the Anti-Monopoly Law
(AML), China has been cooperating with foreign competition authorities at both the
formal and informal levels. This implies some interest by China to consider competition
policy in its future RTAs. Several countries, such as Australia, New Zealand and Iceland,
have made demands to China on competition provisions in their RTA negotiations.
This policy note will review the international experience with competition provisions in
RTAs with a view to drawing some possible lessons for China as it pursues its regional
trade strategy.
International experience
The scope of the competition provisions in existing RTAs around the world range
from a comprehensive regional competition law to a minimal regime encouraging
cooperation in preventing anti-competitive practices. A comprehensive regional law
would usually address issues related to cartels and abuse of dominance, state aid and
inter-agency cooperation, as well as procedural and transparency requirements. Some
regional competition regimes incorporate consumer law to address cross-border
consumer protection issues. This can complement competition policies‘ economic
efficiency and social welfare objectives. However, the application of binding judicial
dispute settlement mechanisms to support the implementation of competition law and
policy is uncommon.
With or without a regional competition regime, provisions with competition
objectives are often introduced in RTAs without negotiating a competition chapter. These provisions include the principles of non-discrimination and national treatment as
well as competition related provisions in other areas, such as intellectual property and
services. Nevertheless, these provisions do not present a comprehensive commitment
from the parties to create an independent framework to tackle harmful cross-border
restrictive business practices or to enable private parties to seek redress against such
practices.
A useful taxonomy to understand the scope of competition provisions in RTAs
would differentiate between substantive and procedural provisions, and between
cooperative versus unification models. The cooperative model would promote separate,
independent laws with information exchange, while the unification model would tend to
harmonize the parties‘ substantive rules and institutions.
Using this taxonomy, one could distinguish between four basic models of
competition law, ranging from a fully centralized regional competition law, to the
fully decentralized model (see Box 1). Both developed and developing countries have
experienced all four models, with varying degrees of success. However, due to the
relative immaturity of these regimes, there is still little evidence available on the impact
of these provisions to make definitive conclusions about their effects.

69
While most RTA competition regimes focus on the supply side behavior of firms, it
is also important to consider the possible demand-side market imperfections. Preventing barriers to market entry, cartels, monopolies, and other restrictive business
practices works to protect both consumers and firms. Yet, dealing with these barriers
does not directly address demand-side market imperfections caused, for instance, by lack
of consumer information or the inability to switch suppliers. Enhancing notification,
information sharing, and investigative assistance among the Member States can work to
protect foreign consumers from domestic anti-competitive businesses practices and to
protect domestic consumers from foreign anti-competitive business. It can also help to
prevent inappropriate consumer policies becoming unnecessary barriers to trade. A
number of RTAs have explicitly mainstreamed their consumer law provisions within or
alongside the competition regimes to address the legislative and enforcement gaps in
cross-border trade relating to consumer welfare. For instance, the Australian regional
competition agreements with the United States, South Korea and Papua New Guinea
incorporate consumer policy provisions. The COMESA treaty also addresses consumer
welfare from within its competition regime.
While including competition provisions in a RTA makes sense in theory,
implementation based on limited evidence from US and EU experience has proven
difficult. One feature that clouds an evaluation is that the level of ambition of
competition policies varies depending on the level of economic development among the
signatories and the extent that its regulatory structure is shaped by the rule of law. The
United States and the European Union have been most active in advocating ambitious
models for competition provisions; Japan and New Zealand have taken a less
comprehensive approach.
Implementation records have been particularly poor in developing countries. Lack
of effective implementation and enforcement is more common for RTA members that did
not possess a national competition law prior to accepting regional commitments; or in
those RTAs with members at very different stages of competition regime development.
This is partly due to lack of knowledge and experience of competition policies. But
without an effective domestic law in all the member states of an agreement, there can be
no legal basis for a member to take any action against practices organized in another
member state in respect of the effects upon its own territory. And where regional regimes
establish measures such as cooperation, notification, consultations to generate regional
benefits, they are of little use nationally without the human resources and expertise to
absorb or respond to the information.

70
The reasons for the poor implementation of regional competition provisions are
both structural/institutional, and behavioral, relating to lack of competition culture
or political will to promote implementation domestically. Relying on bottom-up
implementation initiatives in south-south agreements is less appropriate when both a
competition culture and buttressing regional laws and institutions are absent. A well
designed regional competition agreement needs to takes account of these local
circumstances and act as a policy tool to create the national structural and behavioral
environment necessary to benefit from regional competition provisions.
Box 8.1 Models of Competition Regimes in RTAs
Full Centralization. The most comprehensive regional competition regime consists of
a supra-national law with a distinct regional jurisdiction. While the regional and
domestic laws can overlap, the regional laws only address competitive practices taking
place in the regional territory that is beyond the jurisdictional boundaries of just one
member of the RTA. These competition laws are directly applicable within the territory
of a Member and superior to any national law or judgment that is inconsistent with the
regional law. Regional competition laws may also have ‗direct effect‘ in the Members‘
jurisdictions, providing firms or citizens the right to invoke the regional law in the
domestic courts of the member countries. To fully centralize the regional competition
law, a complementary regional institutional mechanism is established to conduct
investigations, enforce actions and assess and levy penalties. Examples of this model
include the competition laws established in the EC Treaty, the COMESA, UEMOA and
the Andean Pact.
Partial Centralization. The less centralized competition model establishes a regional
competition law, but supports this with only a partially centralized agency. As with the
fully centralized regional regime, the independent regional law has direct applicability
and superiority over inconsistent national laws. However, although the central agency
has the mandate to receive complaints and initiate independent investigations, it must
work with the Member State competition agencies and national courts to process case
actions leading to enforcement and remedies. Examples of this model include
ANZCERTA and CARICOM.
Partial Decentralization. Further down the scale of centralization are regional regimes
which are not buttressed by a regional authority. While a regional law is established,
different means of intergovernmental cooperation are responsible for promoting the
regional law. There is no independent regional body with powers of investigation and
enforcement. Thus, the application of the law is left entirely to the Members States.
National competition authorities have the jurisdiction to bring cases and they are also
the recipients of complaints addressed at any violation of the regional competition law.
Mercosur is an example of this model.
Fully Decentralized. The least centralized regional regime identified in a regional
competition regime exists where the Members do not create a regional law but rather set
out the necessary criteria for national law and cooperation principles to address anti-
competitive practices that are detrimental to the functioning of the RTA. These
provisions require the members to adopt or maintain measures to proscribe
anticompetitive business conduct and to take appropriate action, but do not set out any
more specific competition rules. The provisions formalize consultation and co-operation
between the parties on the enforcement of those laws via mutual legal assistance,
notification, consultation and the exchange of information. Examples of this model
include NAFTA Chapter 15, Canada-Chile, Canada-Costa Rica and SACU.

71
North-south agreements have better implementation records when the more
developed party offers appropriate technical assistance, capacity building and
ability to the less developed regional partner. For those members with nascent or non-
existent competition regimes, technical assistance provisions should be designed to
impart the necessary expertise and experience over the long term. This will assist in
inculcating the necessary behavioral reforms. While RTA competition provisions can
offer the legislative push and policy lock-in necessary for sustained reform, initially a
more appropriate key objective may be to focus on establishing a culture that values
competition at the national or sub regional level in the region.
In RTAs involving members with no or little experience of applying competition
policy, the provisions should focus primarily on the exchange of information,
technical assistance and capacity building. Subsequent negotiations can expand the
agreement. More general commitments should only be implemented after the necessary
expertise and cooperation mechanisms have been developed. Provisions could be
included that oblige members, over a specified period of time, to adopt competition laws
that can address the full range of private and government sanctioned anti-competitive
practices and outcomes. Regional laws can also act as a temporary alternative to the
expense of establishing and implementing domestic competition laws.
Soft law can be more appropriate if governments are uncertain of the underlying
technical issues and judicial consequences of the provisions. If competition regimes
are at an early stage of implementation, other non-judicial mechanisms may also be more
appropriate, including voluntary peer review, consultations on implementation issues and
informal diplomatic methods. These can subsequently be complemented by a non-
binding competition policy review mechanism and non-binding consultations, promoting
voluntary implementation of competition policy obligations and ultimately harmonization.
Mainstreaming consumer law within competition regimes can help to address the
legislative and enforcement gaps in cross-border trade relating to consumer
protection. This complements and advances the economic and social welfare objectives
of competition policy.
Transition economies and other countries with a legacy of heavily state-led
economies may find it more beneficial to include effective regulation on state aid
and antidumping policy to address government created trade distorting practices. Also, in highly centralized regimes that establish a regional authority to assist
implementation, the authority must be endowed with strong investigative powers,
adequate resources and expertise, cease and desist orders, as well as the power to collect
fines if it is to avoid becoming a paper tiger.
Possible lessons for China
As China becomes more integrated, cross-border market failures can emerge to
undermine the benefits of its increased liberalization. These could include regional
cartels, cross-border predatory pricing, restrictive vertical marketing agreements

72
establishing price discrimination, and mergers designed to create regionally dominant
positions. Unilateral competition measures undertaken by national governments cannot
address such negative cross-border anti-competitive practices adequately unless there is
some mechanism to promote inter-governmental cooperation.
In principle, implementing effective regional competition law and policy can be used
to address these negative practices and generate more efficient markets offering
better quality goods for cheaper prices, and encourage investment. Further benefits
may also be achieved from mainstreaming consumer policy into regional competition
laws to develop the effective demand for competition. The option for cooperation to deal
with cross-border consumer protection issues complements both economic and social
development objectives.
China can draw on the international experience to maximize the benefits of
negotiating competition provisions in its future RTAs. While more cost-benefit
analyses of the different regimes and provisions discussed above are required to craft
appropriate regional competition regimes addressing both the institutional and behavioral
factors obstructing successful implementation, a number of preliminary conclusions can
be drawn as below.
Negotiating appropriate competition provisions in an RTA necessarily need to take
account of the local institutional and developmental context. Given China‘s
development status, the rest of this policy note will review possible avenues for China in
its future negotiations of competition provisions in RTAs, before providing some possible
recommendations to further improve its domestic competition law regime.
First, with regard to the overall structure of the competition policy provisions in
RTAs, as the competition regime of China is still very young, it is probably better to
start with isolated competition provisions for selected sectors (such as services or
IPR) and gradually move to broader chapter or side-agreement on general
competition issues later. In this regard, China might want to start including such
provisions in its RTAs with partners with similar background and experiences (e.g.,
Singapore) or those with higher integration levels (e.g., Hong Kong), then move on with
other partners as it has built up sufficient experience.
Second, China could carefully balance its defensive and offensive interests on
competition policy. On the one hand, as the ―factory of the world‖, China wields
considerable influence on the prices of industrial and consumer products. While such
market power generally means more profits, it can also raise concerns from third
countries‘ competition authorities.1 On the other hand, due to the growing importance of
its domestic market, many multinational corporations (MNCs) are interested in increasing
their market shares in China, at times using their dominance in the international market to
gain ―unfair‖ advantage in the Chinese market either by dumping their products at
extremely low prices or by raising their prices to generate large profits. Therefore, for the
dual purposes of protecting the legitimate interests of Chinese firms in the foreign market
1 As illustrated by the recent cases of antitrust actions against Chinese Vitamin C manufacturers and magnesite
producers, compliance with foreign competition regulations have become a major challenge for some Chinese firms.

73
and ensuring effective enforcement of China‘s own competition laws in the domestic
market, China might consider including provisions on notification, negative comity,
positive comity, coordination, and joint investigation in its RTAs.
Third, in its future RTA negotiations, China could usefully put the focus on the
procedural provisions such as cooperation, consultation and information exchange,
rather than substantive provisions that aim to harmonize or coordinate competition
standards or rules. Due to its unique historical experience, the challenges facing the
competition regime in China are rather different from those in other countries. At one end
of the spectrum, because many sectors are still in early stages of development and the
entry barriers are very low, these sectors are highly fragmented and even the market
leaders only have very small market shares. Thus, the regulators have historically been
focusing on the unfair competitive behaviors of small players and lack experience in
dealing with monopolies. At the other end of the spectrum, administrative monopolies
pose real problems in the Chinese market. Because these administrative monopolies are
typically affiliated with government ministries and regulated by special laws and
regulations, the reach of the AML is greatly limited. As the main reason for both
problems is the legacy of planned economy in China, there is limited relevant
international experience on how to handle these problems.
Fourth, China may want to use the opportunity of its future RTA negotiations to
further discipline its state-owned enterprises (SOEs). Because of the dominance of
SOEs in certain sectors, foreign negotiating partners might request China to include in
future RTAs special provisions on SOEs, monopolies and enterprises with special and
exclusive rights. While China might be reluctant to agree to such provisions in the short
term, including these provisions is in China‘s long-term interest as competition from
foreign firms is usually the only way the SOEs could be made to follow competition
disciplines in practice.
Fifth, in a similar vein, China may want to consider the strategic use of antidumping
measures for its own benefit. For a long time, Chinese firms have been the prime targets
of antidumping actions. Indeed, some commentators even argue that, in some cases, the
main reason that the Chinese firms form cartels to fix prices is to avoid accusations of
dumping. While RTA provisions prohibiting the application of antidumping measures
seem to be in the short-term interest of Chinese firms, it is unclear whether such
provisions serve its long-term interest as China itself has been increasingly resorting to
antidumping investigations and measures. In this regard, further study and better
coordination between the antidumping and competition authorities in China would help
formulate and establish a common position. As China has adopted a rather critical
approach to the existing antidumping regime in the Doha negotiations, China should also
coordinate its negotiating positions in both regional and multilateral settings if it decides
to adopt a different approach on antidumping measures in future RTA negotiations.
Sixth, as the competition issues facing developed and developing countries are
rather different, China might consider taking different approaches in RTA
negotiations with different countries. Generally speaking, the competition laws and
regulations in developing countries are less developed. Thus, in RTAs with developing
countries, China might focus on information exchange or joint studies on issues such as

74
the relationship between industrial policy and competition rules, regulations of SOEs, or
unfair competition among smaller firms. Moreover, depending on the willingness of the
other country, there might not be any competition provision at all in the RTA. In RTAs
with developed countries, especially when the other country demands the inclusion of
competition policy in the negotiations, China might consider requesting for transition
periods, technical assistance, or even exemptions from particular obligations to soften the
impact of over-ambitious competition provisions.
Finally, competition provisions in RTAs also provide the opportunity to promote
and lock-in domestic reforms aimed at improving competition policies domestically. To reap the maximum benefits from the market access opportunities created by RTAs,
China might wish to consider further improving its competition law regime as follows:
Better coordinating China‘s industrial, competition, and trade policies. Industrial policy typically involves fostering a few national champions in a sector
to the detriment of the interests of other firms. For competition policy, the
interests of consumers are the main concern. For trade policy, the interests of
exporting firms and import companies usually take priority. Because of their
different focus, these policies might well run into conflicts. For example, when
the state decides to merge several firms together to promote the development of
certain industry, such action might run afoul to the competition obligations in
RTAs. Similarly, when several exporters decide to raise prices together to deal
with anti-dumping investigations, they might violate the anti-trust laws of the
importing countries. Coordination among various ministries involved in
competition is important but not always easy; similarly for coordination between
central government and local government; and among local governments
themselves. One way to mitigate the problem is to have joint meetings between
the different agencies at regular intervals, or at least require an agency to notify
and consult the other agencies when it makes changes to its policies.
Further improving the legislative framework. While the enactment of the AML
is a great achievement, further improvement can be made to make it more
effective. Clarification is needed on what industries include in the Article 7,
which stipulates that the state protects the lawful operations of industries ―which
are crucial to the well-being of the national economy and dominated by SOEs‖.
The ambiguity may lead to the abuse of this clause. For instance, as many
commentators argue, while the telecommunication sector should be included, it is
doubtful that value-added telecom services should be accorded the same
importance as basic telecom services. Moreover, China may consider enhancing
the effectiveness of the AML and furthering empowering the competition
authorities to allow them to effectively deal with administrative monopolies.
Article 51 states that, when dealing with administrative monopolies, the anti-
monopoly enforcement agencies do not have power to sanction the administrative
bodies directly. Instead, they may only make recommendations to the relevant
bodies at a higher level. Doubt casts on the willingness of the supervising bodies
to punish their subordinates. The same article also provides that, in the case that
any other relevant laws and regulations have different provisions on

75
administrative monopolies, the provisions in those laws should prevail over the
AML. Again, this greatly reduces the effectiveness of the AML.
Streamline the competition enforcement process by further delineating the
jurisdictions among different competition authorities. In the existing
competition regime in China, the enforcement power is shared by several agencies
with potentially over-lapping jurisdictions. While this could be justified by the
need to develop expertise between agencies, the current practice of giving the
jurisdiction to a case to the agency that first gets its hands on the case does not
take the relative expertise of the agencies into consideration. In this regard, one
possibility is to specify a clear job division and have a one agency in charge of
certain subject matters.
References
Gary Hufbauer and Yee Wong (2009) China‘s Trade Agreements: Lessons from Other Countries,
background paper
Henry Gao (2009) Supporting China‘s Regional Trade Agenda: China‘s Strategies on Negotiating
Competition, Environment, and Mode 4 Provisions in its RTAs, background paper
Kamala Dawar (2009) Competition Provisions in Regional Trading Agreements, background
paper

76
9 Environment Provisions in FTAs: Lessons for China
Jean-Pierre Chauffour & Min Zhao
The trade and environment linkage is a sensitive and controversial issue for many
countries. While it is true that trade, like any other economic activity, has environmental
implications, there are no unanimous views on whether trade as a policy instrument
should address environmental concerns. Putting aside the debate about whether
environmental issues should be addressed in trade agreements or in stand-alone
environmental agreements, the purpose of this policy note is to identify the main contours
of the trade and environment debate in the context of Regional Trade Agreements
(RTAs).
At the multilateral level, international trade law and international environmental
law have traditionally been viewed as independent disciplines, and have been dealt
with under different international instruments. The agreements of the World Trade
Organization (WTO) recognize certain broad principles relating to the environment. The
Doha Declaration also mandates countries to examine this linkage closely. WTO‘s
jurisprudence on the subject of trade and environment recognizes that WTO law does not
exist in clinical isolation of international law and developments, including environmental
concerns. However, it emphasizes that environmental measures to restrict trade can be
adopted only under certain strict conditions.
As the Doha round stalls, trade-related environmental concerns are increasingly
being integrated in trade deals at the bilateral and regional levels. Three key reasons
for adding environmental provisions in RTAs include: (1) enthusiasm for sustainable
development; (2) worries that weak environmental enforcement can create unfair
competitive advantages; and (3) efforts to advance the international environmental
agenda by using sanctions that are not agreed on a multilateral basis.
While most countries recite environmental cooperation among the goals of their
RTAs, the scope of environmental provisions in RTAs varies significantly, even
among developed countries. While RTAs signed by the United States, the European
Union and New Zealand contain some of the most comprehensive environment
provisions, Japan has taken a less ambitious approach.
Overall, there has been an increased awareness of the possible benefits of
environmental provisions in RTAs. The widespread worry that stricter implementation
of environmental rules would undermine national competitiveness in the context of free
trade has proven to be unfounded. Empirical research suggests that the costs of
compliance with environmental regulations have had little or no impact on the overall
competitiveness of countries. In fact, some economists advance a ―trading up‖
hypothesis of liberalization, the idea that trade leads to upward convergence towards
more stringent environmental policies. However, it remains to be seen whether the
―trading up‖ hypothesis will apply to climate change measures, which are likely to be far
more costly than past efforts to better the environment.

77
As China shifts its development agenda from primarily pursuing growth to
achieving a more balanced and sustainable development, the experience of advanced
economies in the treatment of environmental provisions in the context of RTA
negotiations could provide valuable insights and lessons.
International experience
Developed economies such as the United States, Canada, the European Union and
New Zealand, have been using progressively elaborate environmental provisions in
their recent RTA negotiations. However, the approach of each country is different, and
the depth and scope of RTAs entered into by them varies. RTAs entered into by the
United States have the most elaborate and sophisticated provisions on environment so far,
most of which are worded as legally binding provisions. The EU RTAs with Chile and
the Mediterranean countries concluded in the early 2000s did not have elaborate
provisions on environment. The European Union, however, seems to be approaching far
more complex provisions since its agreement with the Cariforum countries in 2008, and
in its current negotiations with ACP countries.
Among other developed countries, the approach taken by Japan and Australia is
less ambitious. Environmental considerations are mentioned in all Japanese trade
agreements and Japan discourages investments that waive or relax environmental
standards. However, its emphasis has been on principles of cooperation to achieve
certain environmental objectives. Australia has not been a proponent of environmental
provisions in RTAs. Its 2004 agreement with the United States reflects environmental
provisions to the extent that they reflect the approach taken by the United States in its
RTA negotiations. Australia has however not replicated such provisions in any of the
other RTAs entered into by it.
A strong political commitment, reflected in parliamentary resolutions, legislative
mandates, or declared trade strategies seems to be a critical precursor for including
environmental provisions in trade agreements. Environmental mandates were
legislated under the US Trade Act (2002), in the context of trade negotiating objectives
laid down by the US Congress. Specifically, the Congress declared that trade agreements
should strengthen the capacity of trading partners to protect the environment through the
promotion of sustainable development; should provide market access for US
environmental technologies, goods and services; and should ensure that environmental
policies abroad do not discriminate against US exports or serve as disguised barriers to
trade. In 2001, the New Zealand government adopted a Cabinet mandate for
harmonizing trade policy objectives with environmental goals. Under the ―Framework
for Integrating Environment Standards and Trade Agreements,‖ New Zealand
emphasized that environmental provisions should not be ―misused for protectionist
reasons‖ nor should they lower environmental standards. In contrast, Japanese
government does not have a mandate to advance environmental goals in RTA
negotiations.
A number of important considerations can be drawn from international experience
in terms of environmental provisions. They include the role of pre-RTA environmental

78
impact assessments, the location of the provisions in a side agreement or in the main text
of the agreement, and the exact nature of environmental provisions.
Pre-RTA Environmental Impact Assessments are required in some countries. The
United States, Canada, the European Union and New Zealand regularly conduct impact
assessments of the RTAs they are negotiating on the environment. The focus of such
assessments by the United States, Canada and New Zealand is on the impact on the
environment within their countries, although a few recent U.S. RTAs have reflected on
potential impact in the trading partner as well. The European Union‘s approach is to
conduct ‗Sustainability Impact Assessments‘ that focus on the economic, social and
environmental assessments in both the European Union and the trading partner.
Environmental Provisions can be incorporated in Side Agreements to RTAs or in
Main Text of RTAs. Neither approach is necessarily superior to the other, since the
legal implications of the approaches depend first and foremost on the nature of the
provisions that they reflect. Side agreements do not necessarily imply that environment is
only an incidental issue. Some of the strongest provisions on environment are reflected in
North American Agreement on Environmental Cooperation, which was concluded
between the United States, Canada and Mexico as a ‗side agreement‘ to the North
American Free Trade Agreement (NAFTA).
RTAs commonly include environmental provisions in the body of the agreement,
but the level of commitment varies depending on several key factors. These include
whether environment is only recited in the preamble or separately detailed in a chapter on
the environment; the types of institutions, including dispute settlement mechanisms,
created to facilitate cooperation and monitor enforcement of environmental laws; and the
types of capacity building and technical cooperation offered. Once provisions are written
into the text, perhaps the most important step is to agree on effective enforcement
mechanisms. So far, no RTA has adopted an enforcement mechanism for environmental
issues that has the same ―bite‖ as, for example, enforcement of tariff bindings.
Nature of Environmental Provisions in RTAs: Environmental provisions used
in U.S. and EU RTAs typically reflect a blend of legally binding and non-binding
provisions. Environmental provisions in RTAs entered into by Japan have so far
reflected mainly non-binding principles. Several of the binding obligations pertain
to the high standards that a party is required to ensure in its domestic
environmental laws. The terminology used in most U.S. and EU RTAs tries to
achieve a balance between sovereign decision-making in enacting suitable
provisions, and a commitment to exercise such decision-making in a manner
consistent with achieving high environmental standards. Environmental
provisions in RTAs entered into by several countries also focus on specific areas
for cooperation between the parties to achieve environmental objectives.
Technical Assistance and Capacity Building: The need for technical assistance
and capacity building is recognized in most RTAs that incorporate environmental
provisions, in respect of compliance with environmental requirements and
standards. In addition, incorporation of environmental standards in product
standards aimed at sanitary and phytosanitary requirements, and technical

79
regulations, are also areas where technical assistance and capacity building is
often required for developing countries, in order to ensure adequate market access
for their exports. However technical assistance and capacity building are not
worded in legally binding terms. Several important initiatives have been
undertaken under both U.S. and EU RTAs towards fulfilling the obligations of
technical assistance and capacity building. Elements of cooperation to achieve
specific environmental objectives are also enumerated in RTAs entered into by
the United States, the European Union, and Japan.
Dispute Settlement and Remedies: Dispute settlement provisions in RTAs
typically consist of consultations, followed by formal dispute settlement. Most
U.S. RTAs prescribe remedies in the form of monetary compensation for non-
compliance with environmental provisions. In the event such compensation is not
paid by a party, then as a last resort, there can be tariff suspensions. EU RTAs
leave open the issue of ‗compliance measures‘ to the judicial mechanism hearing
the dispute, which may include monetary compensation, but not suspension of
concessions. However, since environmental provisions in RTAs are of fairly
recent origin, there is little jurisprudence currently to assess the impact of such
provisions, since no formal state-to-state disputes have been raised as yet under
existing RTAs. A few RTAs also comprise provisions on ‗public submissions‘ to
the Environmental Committee constituted under the RTA. Such submissions
result in ‗fact-finding‘ reports, but do not result in any binding conclusions.
Possible lessons for China
While China has shifted its development objectives from primarily focusing on
growth to pursuing a more balanced and sustainable development, environmental
concerns have not, so far, been a high priority on the Chinese RTA agenda. China
has acceded to more than 50 international conventions on environmental protection,
including two landmark accords, the Kyoto Protocol and the Montreal Protocol. Most of
China RTAs contains clauses on environmental cooperation. However, in China‘s
existing RTAs, environmental provisions are typically limited to the mentioning of the
principle of ―sustainable development‖ in the preamble, the recognition of the possibility
to use environmental measures as an exception to the general trade obligations, and
general language on environmental cooperation among the parties. In addition, some
RTAs include liberalizations on environmental goods and services in the respective
schedules. For example, in the RTA with Chile, China agreed to partially liberalize the
environmental services sector.
In some of the most recent RTAs, however, China seems to lean toward a more
active approach to environmental considerations. This is consistent with the shift of
China‘s development objective. For example, in the RTA with Singapore, China agreed
to cooperate with Singapore on the Tianjin Eco-city project and enhance cooperation on
environmental protection and energy and resource conservation. Another example is the
RTA with New Zealand, which includes a side agreement on environmental cooperation.
This agreement uses only best-endeavor language and does not create any binding

80
obligations. The RTA with Chile also mentions a possible side environmental
cooperation agreement.
It may be increasingly in China‘s interest to address more provisions on
environment in RTA negotiations. The inclusion of more environmental provisions in
RTAs and the resulting pressure from foreign governments and firms will provide China
with the necessary impetus to carry out domestic environment policy reforms. As most
of the environmental provisions in the existing RTAs focus on information exchange,
cooperation and dialogue, it is unlikely that binding environmental obligations will be
included in China‘s RTAs for the foreseeable future. Yet, environmental provisions could
usefully help trigger domestic reforms to enhance the institutional capacity of the
environmental protection agencies, revamp the existing legislative framework, and
strengthen the enforcement mechanism in China. From this perspective, China may wish
to consider having a governmental mandate to explicitly address environmental issues in
its PTA negotiations.
Nevertheless, negotiating appropriate environment provisions in an RTA
necessarily needs to take account of the local institutional and developmental
context. The agenda on environment by a developing country like China needs not to be
‗reactive‘ in all cases. China should carefully consider its interests, which include both
offensive and defensive interests. Examples of offensive interests include limitations on
―green barriers‖ such as trade-protectionist measures disguised as environmental
protection measures. Defensive interests, on the other hand, include the affirmation of
China‘s right to set and maintain any WTO-consistent environmental protection measures
that corresponds to the level of economic development. China might also be interested in
making explicit climate change commitments that could mitigate potential carbon tariffs
imposed by its trading partners.
An appropriate environment policy cannot be made without a comprehensive pre-
RTA assessment. The pre-RTA assessment often include the following elements: 1)
environmental assessment of RTA; 2) economic Costs assessment of Environmental
Provisions, which is required to understand the actual economic costs of implementing
the contemplated environmental provisions; 3) regulatory inventory through which
identifying legislative changes at the domestic level required by proposed provisions; and
4) capacity assessment of local institutions which can be adapted so as to ensure
compliance with the proposed environmental provisions. Based on the assessment results,
policy makers can align the environment provisions in RTAs with China‘s overall
development strategy.
In terms of the negotiating strategy, China might wish to take a pragmatic
approach—being flexible towards different negotiating partners. When negotiating
with countries with similar levels of economic development and environmental protection,
China might wish to include clauses on joint study, joint action, or even harmonize
environmental standards, laws and regulations in particular areas of mutual interest. The
harmonized standards and rules are particularly important as they not only address
problems in the region, but also may form the basis of global rules that could be used as
an alternative to those reflecting mainly developed country interests. If carefully
coordinated, the rules and standards developed at the regional setting can also be used to

81
buttress China‘s position on the relevant issues in other international organizations, such
as the WTO.
When negotiating with the other countries at different stages of economic
development, China might wish to include more provisions on technical assistance,
cooperation or technology transfer. In the case where pre-RTA environmental
assessment is requested, technical assistance and capacity building from the party that has
more experience in the matter could be a part of the RTA process. Technical assistance
and capacity building may also be required if the RTA requires adherence to specific
environmental regulatory norms. Take an example of SPS-TBT Standards. Adequate
information and dissemination systems should be built into RTAs in respect of SPS &
TBT requirements in the export market, e.g., measures such as eco-labeling, packaging
and recycling requirements for achieving environmental objectives, and SPS
requirements in relation to plants, plant products, and food products. Adequate provisions
for technical and financial assistance for compliance with such measures should also be
built into the RTA. Specific obligations on enacting and maintaining environmental
regulations could even be made conditional on actual development assistance and
capacity building.
Benchmarking and monitoring provisions relating to cooperation, technical and
financial assistance and capacity building is often a means to maximize the benefits
of such cooperation. Provisions requiring cooperation to reach certain environmental
goals should be built into the RTA as essential conditions. Clear benchmarks for
monitoring implementation of such provisions are necessary. Specific areas in which
cooperation, technical assistance and capacity building is required should be prioritized
and work programs around these need to be monitored.
As including environment provision in RTAs is still new, China may consider a
phased-in approach in dispute settlement mechanism. In the initial few years, dispute
settlement mechanisms emphasizing consultation and cooperation may be a better option
than binding dispute settlement and sanctions resulting from non-compliance with
environmental requirements. When China gains more experience with environmental
provisions under the RTAs and builds a strong enforcement capacity, dispute settlement
with stronger remedies, such as monetary compensation or trade sanctions, could be
considered.
References
Anuradha R.V. (2009) Environmental Provisions In Regional Trading Agreements: Overview of
RTAs entered into by US, EC, Japan and Australia, background paper
Gary Hufbauer and Yee Wong (2009) China‘s Trade Agreements: Lessons from Other Countries,
background paper
Henry Gao (2009) Supporting China‘s Regional Trade Agenda: China‘s Strategies on Negotiating
Competition, Environment, and Mode 4 Provisions in its RTAs, background paper

82
Annex 9. 1
Environment in RTAs by U.S., EC, Japan and Australia
This annex will provide a brief overview of the nature and type of environmental
provisions in different RTAs.
United States
NAFTA, entered into between the U.S., Canada and Mexico in 1994, was the first RTA
to reflect environmental provisions. A side agreement to NAFTA- the North American
Agreement on Environmental Cooperation (NAAEC) provided for several innovative
features, such as a separate Commission for Environmental Cooperation, public
consultation and enforcement mechanisms for environmental provisions. US RTAs since
1994 have consistently reflected several environmental provisions, either in an
independent chapter devoted to ‗Environment‘, or in a side agreement on environment.
The range of environmental provisions and practices in the context of RTAs entered into
by the U.S. can be summarized as follows:
1. Environmental Review of RTAs: Environmental Reviews are mandated under
U.S. laws, as a necessary pre-condition prior to conclusion of any RTA. Such
reviews predominantly focus on environmental impact of any proposed RTA on
the economy and the environment in the U.S. However, some Environmental
Reviews, such as those of U.S.-Colombia and U.S.-Morocco, have also
highlighted environmental impacts in the trading partners.
2. Provisions in the Preamble: The Preamble emphasizes principles of
environmental protection and sustainable development.
3. ‗Environment‘ is dealt with either in a chapter under the RTA, or under a side
agreement,1 or both. The Chapter or side agreement, as the case may be, typically
include the following provisions:
Box 9.1 Provisions on Environment in U.S. RTAs
A. General Principles
Obligation of both parties to cooperate in the field of environment.
Obligation to ensure that trade and environmental policies are mutually supportive of each other.
B. Right to Establish Levels of Environmental Protection
Right of each party to establish its levels of environmental protection and environment
development policies.
1 Apart from the NAAEC, other side agreements on the environment entered into by the U.S. include
Environmental Cooperation Agreements with Chile and Korea. A Joint Statement on Environment Cooperation accompanies the RTA between U.S. and Australia, and U.S. and Singapore RTA has a Memorandum of Intent on the Environment.

83
C. Provisions with respect to Domestic Environmental Laws
Obligation on each party to strive to ensure that its laws and policies provide for and
encourage high levels of environment protection.
Right of each party to retain discretion with respect to investigatory, prosecutorial,
regulatory, and compliance matters and to make decisions regarding the allocation of
resources to enforcement with respect to other environmental matters determined to have
higher priorities.1
Commitment by each party to strive to ensure that, in the process of encouraging trade and
investment, it does not waive or derogate from its environmental laws in a manner that
weakens or reduces the protections afforded in those laws.
Obligation to ensure availability of judicial, quasi-judicial, or administrative proceedings for
the enforcement of its environmental laws are fair, equitable, transparent, and provide for
appropriate administrative and procedural protections in accordance with its law.
The RTAs with Chile and Korea clarify that the Chapter on Environment shall not be
construed to empower a Party’s authorities to undertake environmental law enforcement
activities in the territory of the other Party. The RTA with Peru allows for such enforcement
only in the context of the Annex on Forest Governance.
D. Environmental Cooperation, Technical Assistance, Capacity Building: US RTAs differ in terms
of the scope and content of provisions dealing with environmental cooperation.
Environmental cooperation typically pertains to provisions for technical assistance and
capacity building in relation to environmental standards. Provisions on environment
cooperation in NAFTA’s side agreement on environment- the North American Agreement on
Environment Cooperation (NAAEC), for instance, focuses on environmental impacts on trade,
and labeling, financing, purchasing of environmentally friendly products, etc. Provisions on
Environmental Cooperation under U.S.-Peru pertains to protection of biological diversity and
indigenous knowledge.
Provisions on Environment Cooperation under U.S.-Chile RTA highlights the following areas in which the U.S. is committed to cooperate with Chile:
Develop a Pollutant Release and Transfer Register (PRTR) in Chile which is a publicly available
database of chemicals that have been released to air, water and land or transferred off-site
for further waste management.
Reducing Mining Pollution in Chile.
Improving Environment Enforcement and Compliance through training and exchange of
information.
Training to help reduce pollution from agricultural practices in Chile.
Cooperation to reduce methyl-bromide emissions.
Improving wildlife protection and management in Chile. E. TBT & SPS- Product Standards Most U.S. RTAs contain provisions relating to formation of a specific committee to oversee
implementation of SPS and TBT standards, and assist in trade facilitation.
CAFTA-DR and the RTAs with Panama and Peru also comprise provisions on the responsibility
of the committee to make recommendations for trade capacity building and designing
1 This discretion however is not unfettered. It is circumscribed by words to the effect that a party is in
compliance with this provision provided the exercise of discretion is “reasonable” or the exercise of discretion results from “a bona fide decision regarding allocation of resources.”

84
programmes for technical assistance, in relation adherence to SPS and TBT standards. There
are however no references to financial assistance in such provisions.
U.S.-Korea RTA has a separate provision dealing with automotive standards and regulations
which may be adopted, inter alia, for environmental reasons.
F. Public Participation: Most U.S. RTAs also have fairly detailed provisions on ‘public participation’. These can range from obligatory provisions to those requiring ‘best efforts’. For example, U.S.-CAFTA-DR mandates each Party to provide for the receipt and consideration of public communications on matters related to the Chapter on Environment. Each Party is also required to convene a national consultative or advisory committee, comprising members of its public, to provide views on matters related to the implementation. On the other hand, U.S.-Morocco, and U.S.-Singapore refer to a lesser onerous obligation for putting in place ‘procedures’ for dialogue with the public, and make ‘best efforts’ to respond to requests by members of public with regard to implementation of environmental provisions.
G. Institutional arrangements: All U.S. RTAs have a separate committee, such as a Joint Committee or an Environmental Affairs Council, responsible for overseeing implementation of the provisions of the agreement, and provide recommendations for implementation
H. Dispute Resolution:
State-to-State Consultations: All U.S. RTAs, except for U.S.-Jordan RTA, provide for a separate dispute resolution mechanism with regard to enforcement of provisions regarding domestic environmental laws in each Party to the RTA. If consultations between the parties fail, the RTAs provide for engagement of experts to advice on the matter. If this cannot lead to resolution of the dispute, formal dispute settlement proceedings under the RTA can be commenced. Remedies for non-compliance with domestic environmental obligations can include monetary compensation which is required to be deposited in a fund for environmental initiatives. If the losing Party does not provide such compensation, then as a matter of last resort, the other Party can suspend tariff concessions. Such provisions have not been resorted to under any of the U.S. RTAs. There is as yet no experience with the possible outcome of these provisions.
Public Submission Process: NAFTA, CAFTA-DR, US-Panama and US-Peru have detailed
provisions allowing for submissions by members of the public to the Environmental
Commission or Secretariat, with a complaint on non-compliance with environmental
obligations. The Commission/Secretariat is required to prepare a factual record and provide
this to the Environment Affairs Council (EAC) constituted under the RTA. The EAC can make
recommendations. These are however not binding on the state Parties to the RTA.
European Union
EU‘s approach towards environmental provisions in RTAs is part of its broader agenda
towards ‗sustainable development‘. It mandates as a necessary pre-condition, ‗Trade
Sustainability Impact Assessments‘ of the parties involved in the RTA, which highlight,
among other aspects, environmental impacts of the proposed RTA on the environment of
both the EU and the trading partner. The RTAs attempt to address the issues raised in the
SIA primarily through provisions dealing with principles of environmental cooperation.
EU RTAs also typically emphasize on technical and financial assistance to developing
country partners in relation to the environmental provisions of the RTAs.1
1 See for example, EU-Chile, EU-Cariforum and EU-Mexico.

85
EU‘s approach in most of its RTAs has been one that incorporates elements of broad
cooperation. Its recent Economic Partnership Agreement (EPA) with Cariforum countries
contains the most elaborate chapter on environment so far that it has incorporated in any
RTA. The scope and depth of the provisions of this chapter, while similar to the
provisions in U.S. RTAs, are not as elaborate as the provisions used in U.S. RTAs. Early
RTAs entered into by the EC, such as EC-Chile and EC-Mexico, have limited provisions
on environment. The EU-Cariforum Economic Partnership Agreement (EPA) has more
detailed provisions. Some key features of the EU-Cariforum EPA are summarized below.
Box 9.2 Environment Related Rights and Obligations under EU RTAs
Some Key Provisions of the EU-Cariforum EPA include the following:
A. General Principles Emphasis on the Objectives of Sustainable Development and protection of the Environment.
B. Provisions with respect to Domestic Environmental Laws
Right of the Parties to regulate in order to achieve their own level of domestic environmental and public health protection and their own sustainable development priorities, and to adopt or modify accordingly their environmental laws and policies.
Obligation on Parties to seek to ensure that its own environmental and public health laws and policies provide for and encourage high levels of environmental and public health protection and shall strive to continue to improve those laws and policies.
Recognition of the “the special needs and requirements of CARIFORUM States shall be taken into account in the design and implementation of measures aimed at protecting environment and public health that affect trade between the Parties”.
Obligation not to encourage trade or foreign direct investment to enhance or maintain a competitive advantage by: (a) lowering the level of protection provided by domestic environmental and public health legislation; and (b) derogating from, or failing to apply such legislation.
C. Obligations for Technical Assistance and Capacity Building
The EU-Cariforum EPA as well as EU’s Agreements with Chile and Mexico, have provisions on efforts towards cooperation and ensuring technical assistance for implementation of the provisions of the agreement, including the provisions relating to environmental obligations. The EU-Chile agreement also emphasizes on cooperation in relation to projects to reinforce Chile’s environmental structures and policies.
The EU-Cariforum’s provisions are the most detailed in this regard. Some examples include:
- Capacity building for environmental management in tourism areas at the regional and local level; - Technical assistance to producers in meeting relevant product and other standards applicable in
markets of the EC Party - Technical assistance and capacity building, in particular to the public sector, in the
implementation and enforcement of multilateral environmental agreements. - Facilitation of trade between the Parties in natural resources, including timber and wood
products, from legal and sustainable sources - Assistance to producers to develop and/or improve production of goods and services, which the
Parties consider to be beneficial to the environment; and - Promotion and facilitation of public awareness and education programmes in respect of
environmental goods and services in order to foster trade in such products between the Parties.

86
D. TBT & SPS- Product Standards - EU’s RTAs with Chile, Mexico and the recently with the Cariforum countries, include provisions for
technical assistance for producers in meeting relevant product and other standards. - The EU-Cariforum Agreement has detailed provisions with specific relevance for environmental
standards. (a) Technical assistance to producers in meeting relevant product and other standards applicable in markets of the EC Party; (b) Promotion and facilitation of private and public voluntary and market-based schemes including relevant labelling and accreditation schemes
E. Dispute Resolution
- EU RTAs emphasize on Consultation and Cooperation in Environmental Matters - The Cariforum EPA provides for Consultations. - If consultations fail, the matter can be referred to a Committee of Experts formed under the EPA - Findings of Committee will be provided to Consultative Committee responsible for Implementing
EPA. - There are no provisions for fines or suspension of tariff concessions in the event of non-
compliance
Japan
RTAs entered into by Japan have recently started reflecting environmental provisions. All
RTAs entered into by Japan emphasize commitment not to lower environmental
standards to attract investment. Provisions on environmental cooperation are included in
Japan‘s RTAs with Mexico, Malaysia, Thailand, Philippines. The Japan-Philippines RTA
specifically refers to cooperation on compliance with ‗Environmental Standards‘ for
exports.
Japan‘s agreements with Switzerland and Mexico have two distinct environmental
provisions, worded as soft law obligations to achieve certain specific environmental
objectives. This approach is noteworthy because it seems to provide room for specific
action points based on a country‘s requirements.
Under the Japan-Switzerland agreement: Parties agree to encourage trade and
dissemination of environmental products and environment-related services in
order to facilitate access to technologies and products that support environmental
protection and development goals.
Under the Japan-Mexico agreement: Parties agree to cooperate in the field of
environment with a view to ensure environmental preservation and improvement
to promote sound and sustainable development, shall cooperate in the field of
environment.
Australia
Australia has consistently emphasized on principles of sustainable development and
environmental protection in international negotiations. However, it has not taken

87
initiatives to link trade and environmental provisions in any substantive way. Australia‘s
agreement with Chile has a provision in the Preamble which states that implementation of
the agreement will be done consistent with environmental protection and sustainable
development. Environmental objectives are also referred to only in the chapter on
Technical Barriers to Trade and Sanitary and Phytosanitary Measures, in the agreements
that Australia has entered into with ASEAN and Singapore. The text however does not
add anything further to the WTO obligations. Australia‘s agreement with Thailand refers
to the parties‘ commitment to international environmental and conservation agreements.
Australia‘s RTA with the U.S. however incorporates environmental provisions similar to
the ones summarized in Box 1 above. These provisions do not find reflection in other
Australian RTAs.

88
Part II China Options in The Post-WTO Accession Era
10 Tariff Policy for Cotton Imports in China
William Martin
A key challenge in China, as it has been in other rapidly developing economies, is a
substantial gap in incomes between urban and rural areas, and between farm and non-
farm families. This problem, often called the ―farm problem‖ is frequently used to justify
protection to import-competing farming activities. China is currently a large importer of
cotton, which it imports under a tariff-quota regime. Despite the fact that imports
substantially exceed the quota, the government has continued to allow imports at a rate
well below the bound tariff rate. Under WTO rules, China would be permitted to impose
a tariff of up to 40 percent on over-quota imports. Given the large gap between incomes
in urban and rural China, the question of whether tariffs on over-quota cotton imports
should be raised nearer to the out-of-quota tariff has been asked. The purpose of this note
is to take cotton trade as an example and to assess the effectiveness of trade protection
policy in raising the income of poor farmers.
Developments in China‘s Cotton Production and Trade
China is an extremely important participant in world raw cotton production, utilization
and trade. China alone produces around a quarter of world cotton, much more than any
other country. Table 10.1 presents some key figures on China‘s production, mill
consumption and trade in cotton since marketing year 1980-1. A key feature of the table
is that production has grown quite strongly over the period, a period that corresponds
roughly with the reform period in China.
Despite strong growth of cotton production, China‘s net trade position in raw cotton has
turned to deficit since 1998-99, driven largely by rapid growth in mill consumption of
cotton. Cotton mill consumption had been relatively stable in the 15 years leading up to
1999, at around its 1999 level of 4.3 million tonnes. Since then, however, mill
consumption of cotton in China has more than doubled, rising to 9.6 million tones in
2005-6, probably as a consequence of expansion in textile production following the
abolition of the export quotas on textiles and clothing formerly imposed under the
Agreement on Textiles and Clothing. The impact on China‘s trade position in cotton has
been quite dramatic, turning China from a net exporter in the three years to 2000/01 into
a large net importer of raw cotton.
Table 10.1 Key statistics on cotton production and trade in China, marketing years.
Area Yield Prodn Imports Mill
Consumption Exports
000 Ha Kgs/Ha 000 Metric Tons

89
1980/81 4,921 550 2,707 773 3,300 1
1981/82 5,187 572 2,969 478 3,546 0
1982/83 5,828 618 3,601 236 3,641 16
1983/84 6,076 764 4,640 145 3,421 165
1984/85 6,921 904 6,260 18 3,484 214
1985/86 5,140 807 4,146 0 4,117 607
1986/87 4,305 823 3,542 3 4,567 690
1987/88 4,843 877 4,246 19 4,369 506
1988/89 5,534 750 4,148 315 4,376 356
1989/90 5,203 728 3,789 408 4,150 188
1990/91 5,588 807 4,508 480 4,225 202
1991/92 6,540 867 5,672 355 4,250 131
1992/93 6,837 660 4,510 53 4,600 149
1993/94 4,985 750 3,739 176 4,600 166
1994/95 5,528 785 4,342 884 4,400 40
1995/96 5,422 879 4,768 663 4,350 5
1996/97 4,722 890 4,203 787 4,450 2
1997/98 4,500 1,023 4,602 402 4,350 6
1998/99 4,250 1,059 4,501 78 4,300 148
1999/00 3,726 1,028 3,829 30 4,834 370
2000/01 4,041 1,093 4,417 52 5,259 97
2001/02 4,810 1,107 5,324 98 5,869 74
2002/03 4,184 1,175 4,916 682 6,602 164
2003/04 5,109 954 4,871 1,929 7,224 38
2004/05 5,693 1,111 6,324 1,394 8,239 7
2005/06,
est. 5,062 1,129 5,714 4,200 9,617 8
Source: International Cotton Advisory Committee (ICAC).
Applied Tariff Policy for Cotton in China
As part of her WTO commitments, China agreed to a Tariff Rate Quota on raw cotton of
894 thousand tonnes. Imports under the quota are subject to a 1 percent tariff, while
over-quota imports are subject to a bound tariff of 40 percent.
China‘s actual tariff policy in recent years has been consistent with, but quite distinct
from tariff bindings. In December 2006, the Ministry of Finance announced a sliding
scale of the cotton import duty for over-quota cotton (Cotlook, 2006). This import duty is
determined by the formula:
Ri = INT(Pt/(Pi*E)) +a*Pi*E -1)*1000 +0.5)/1000
where Ri is the duty rate, with a maximum of 40 percent; Pt is a constant 8.8 yuan per kilo;
Pi is the cif price in US$ per kilo; E is the exchange rate relative to the US$; and a is a
constant of 2.526 percent. If the cif price is at or above a reference price of 11.397 yuan
per kilo (around 66 cents per lb), the tariff is 6 percent. As the cif price falls below the
reference price, the tariff rises to a maximum of 40 percent. Examination of the cif import

90
values for China‘s cotton imports reveals that the price of imported cotton rarely fell
below the reference price on a country-wide basis during the period 1995 to 2005.
Had the tariff formula in equation (1) applied during the past decade, and had imports
exceeded the quota in all of those years, the tariffs that would have been generated by
equation (1) are given in Table 10.2. From the table, it is clear that the minimum out-of-
quota tariff of 6 percent would have applied in eight of the 11 years considered. In the
lower priced years of 1999, 2001 and 2002, a higher tariff would have applied.
Table 10.2 Applied over-quota tariff generated by the 2007 formula
Import Unit
Value Exchange Rate Tariff
US/kg Y/US$ %
1995 1.86 8.35 6.0
1996 1.84 8.31 6.0
1997 1.77 8.29 6.0
1998 1.66 8.28 6.0
1999 1.34 8.28 7.4
2000 1.48 8.28 6.0
2001 1.26 8.28 10.5
2002 1.22 8.28 12.8
2003 1.67 8.28 6.0
2004 1.63 8.28 6.0
2005 1.50 8.19 6.0
Sources: Cotton unit values (Huang, Liu, Martin and Rozelle (2007)
Whether to raise the tariff?
Since 2004, China‘s imports of cotton have substantially exceeded the quota level,
permitting China to impose a tariff of up to 40 percent. It is clear that the applied tariff
rate on cotton imports can be raised by a big margin. Whether to raise the tariff depends
on the impact of a higher tariff on households and particularly on the income of poor
households. The usual approach would be to assess the impact of the tariff on the
domestic price, and then to assess the impact of the higher cotton price on households.
The cash-crop nature of cotton implies that an increase in the price of cotton translates
directly into an increase in the incomes of cotton farmers—an increase of ten percent in
the price of cotton increases cotton farmers‘ revenues by ten percent. Moreover, cotton
makes up a relatively small share of the spending of the poor in China, so there would be
few direct adverse impacts on the incomes of the poor. Therefore, a key question that
needs to be addressed is how effective a higher tariff on cotton would actually be in
raising the price of raw cotton in China.
Two fundamental problems arise. One of the constraints on using tariffs to redistribute
income is that they can only be effective in raising the prices of imported goods. If a

91
standardized commodity like cotton is an exportable, then a tariff is unlikely to be
successful in raising its domestic price since prices paid for an exportable good are
determined by returns in export markets, rather than by the cost of imported goods.
Another constraint on the effectiveness of tariff policy is the possibility that tariff
increases on one product will cause importers to substitute away from the product with
the increased tariff, towards imports of related goods. These might be goods that are
substitutes in consumption, such as synthetic fibers, or goods that are closely linked
through vertical production linkages—such as cotton yarns and fabrics.
Although China is a net importer of raw cotton, China remains a net exporter of cotton
when net exports of cotton in the form of textiles and clothing are factored in.
MacDonald (2007) estimates that net exports of cotton were roughly 15 million bales of
cotton out of total mill use of 55 million bales in 2006. As is evident from Table 10.3,
most of the exports of processed cotton are in the form of apparel.
Table 10.3 China‘s Net Exports of Processed Cotton, 2006, million bales
Exports Imports Net Exports
Yarn 3 4 -2
Fabric 11 3 8
Clothing 27 1 26
Total 41 8 32
Source: MacDonald (2007).
More detailed data on production and net trade in cotton for the August-July marketing
years from 1995/96 to 2005/06 further confirm China is a net exporter of cotton. The
cotton contained in textile and apparel exports from China1, presented in Table 10.4, is
estimated based on the data on the cotton equivalents of imported and exported textiles
and clothing. These numbers show a dramatic increase in China‘s net imports of raw
cotton since 2004-05 consistent with the ICAC numbers presented in Table 10.1. In
addition, they show a quadrupling of China‘s exports of cotton in the form of textiles
(including garments) during the decade. The final column of the table indicates that net
exports of cotton in raw and processed form have risen quite substantially. Except in
2005/06, the data in Table 10.4 suggest that exports of cotton in all forms were
substantially greater than domestic final consumption.
Table 10.4 China: Cotton Production, Trade and Disappearance, '000 tonnes
Mkt yrs Prodn Net Exports Dom Disappearance Net Exports
Aug-July As Cotton As Textiles w/- Stock Change all forms
1995/96 4,768 -629 1,752 2,347 1,123
1996/97 4,202 -758 1,857 2,351 1,099
1997/98 4,594 -370 1,915 2,102 1,545
1998/99 4,507 75 1,915 1,998 1,990
1999/00 3,832 343 2,481 1,999 2,824
2000/01 4,420 46 2,628 2,314 2,674
1 Macdonald (2007) provides an example of women‘s sweaters classified as ―other fibers‖ containing a total
of 0.4kg of fiber, of which he assumes 45 percent is cotton. After allowing for waste, he assumes that such
sweaters (HS 6110909026) contain 0.22 kg of cotton.

92
Table 10.4 China: Cotton Production, Trade and Disappearance, '000 tonnes
Mkt yrs Prodn Net Exports Dom Disappearance Net Exports
Aug-July As Cotton As Textiles w/- Stock Change all forms
2001/02 5,312 -23 3,187 2,327 3,164
2002/03 4,921 -517 4,218 2,080 3,701
2003/04 4,855 -1885 4,763 1,986 2,878
2004/05 6,314 -1384 5,599 2,511 4,215
2005/06 5,704 -4191 6,461 2,575 2,270
2006/07 6,700
Source: Cotton-USDA PSD Online; Textiles-Scott MacDonald, personal communication. 2006/07 estimate
from NBS, China.
If correct, these numbers would have important implications for the effectiveness of tariff
policy for cotton in China. As long as China remains a net exporter of cotton, including
processed cotton, the effectiveness of a tariff on cotton in raising domestic prices is likely
to be subject to serious question. If a tariff were imposed on imports of cotton destined
for domestic final consumption, processors would substitute domestic cotton for imported
cotton in these uses. However, in this situation, the domestic market would not be large
enough to absorb all production of cotton. Under these circumstances, the price of cotton
would be determined not by the tariff-inclusive price of cotton, but by the returns
obtainable on export markets. Attempts to sell cotton at a price based on the tariff-
inclusive price of imported cotton would encounter the fundamental problem that it
would not be possible to sell all of the domestically-produced cotton in the domestic
market at this price.
The trade impact of a higher tariff also depends on whether the tariff applied to cotton
destined for the export market. China‘s duty exemptions for inputs used in the production
of exports have typically accounted for approximately half of China‘s total imports,
including raw materials, intermediates and final goods. For a good like cotton, which is
rarely consumed as a final good, one might expect a higher than average fraction to be
imported for use in exports. China customs data show that the fraction of China‘s cotton
imports entering China under processing trade arrangements has been around 75 percent
in most years since 1997. Because domestic production of cotton exceeds domestic final
demand, some domestic cotton would have to be used for export production. Domestic
prices would need to remain at a low level to allow domestic cotton to be competitive
with zero-duty imported cotton in the production of exports. Under these circumstances,
an increase in the tariff on cotton is unlikely to be successful in substantially raising the
price of domestic cotton.
If the usual duty exemption arrangements did not apply for cotton, the situation would be
slightly different. Processors would still substitute domestic cotton for imported cotton in
goods destined for the domestic market. Assuming the domestic market does not absorb
all domestically-produced cotton, however, some would need to be sold through
incorporation in exported products, and the need to allow these exports to be profitable
would drive domestic cotton prices down to something close to the levels obtainable from
export markets.

93
Even if China may become a net importer of cotton at some point with the rapid increase
in domestic consumption, the ability to import cotton products at low duties, such as 5
percent for yarns, under a duty bound at the WTO, means that the tariff on cotton is
unable to have more than a small impact on the domestic price of cotton. The applied
tariffs and the tariff bindings applying on some key cotton-containing products, and
competing products, are given in Table 10.5. The combination of a high tariff on cotton
and a low tariff on yarn would, however, have a sharply adverse impact on early stage
processing activities such as spinning of cotton yarn, for which raw cotton inputs account
for about 70 percent of total costs (China Cotton Textile Association 2007). This adverse
impact arises with any duty over 5 percent, and would increase sharply, reducing output
and employment in early-stage cotton processing in China. The binding of 5 percent on
cotton yarn also insulates the downstream textile and clothing industry from any changes
in the price of cotton. As long as these producers can access cotton yarn internationally at
a 5 percent tariff, they are not affected by higher prices for imported cotton. This policy
approach would appear to be a serious risk of destroying the cotton spinning industry at
the expense of cotton yarn imports, without significantly improving the well being of
cotton farmers.
Table 10.5 Tariff bindings on selected cotton products and substitutes, %
Cotton, not carded or combed 40.0
Cotton, carded or combed 40.0
Uncombed single cotton yarn 5.0
Yarn of other vegetable textile fibres 6.0
Filament yarn of polyesters 5.0
Unbleached woven cotton fabrics 10.0
Bleached plain cotton weave 14.0
Unbleached woven fabric, <85% polyester staple 16.0
Men's or boys' shirts of cotton, knitted or crocheted 16.0
Women's or girls' blouses of cotton 16.0
Men's or boys' trousers of cotton 16.0
Conclusions
The concerns that rural people are falling behind urban people are real and important, and
policy action is needed to address them. However, it is generally the case that trade
policy measures are not the best for addressing problems of the distribution of income1.
As we have seen, tariff policy measures have difficulty assisting export oriented sectors
such as cotton production, even if these are the ones in which the income gap is most
serious. And protection, or other price policies, in one industry have adverse impacts on
other sectors by pulling resources away from the unprotected sectors, and raising the
costs of the unassisted sectors. In the case of cotton, such a policy is made more difficult
by the adverse impacts of such a policy on the processing sector.
1 Most other market failures, such as externalities in production or consumption, are related to levels of
output or consumption, or the use of particular inputs, rather than to the level of trade. In these cases also,
policy measures that directly target the source of the problem are likely to be superior to trade measures.

94
Another commodity price policy option that might have been considered as a means to
raise the price of cotton is something like the US Step 2 program (see OXFAM 2002),
officially described as a domestic support measure, under which a subsidy is paid both on
exports and on domestic consumption of cotton in an attempt to offset the cost-raising
impact of the export subsidy on domestic users of cotton.. A key difficulty with this
approach is that it would be extremely costly in budgetary terms, because it involves
payment on all cotton, not just on the export component. Further, the recent Brazilian
cotton case has resulted in it being found to contravene WTO rules.
A wide range of other policies, that address income distribution problem directly, appear
to be both strongly welfare increasing and consistent with WTO commitments and of
high rates of return. These include research and development, which is typically under-
provided by private markets; improvements in transport, electrification and other
infrastructure in rural areas; improving the availability and lowering the cost of education
in rural areas. Many of these investments have been shown to have extremely high rates
of return in rural areas (World Bank 2008). The marginal return on rural research and
development appears to be extremely high1, with benefit cost ratios frequently exceeding
10, while subsidies for output have benefit cost ratios well below unity. Other measures
include increase investments in public goods in rural areas, including in infrastructure,
rural education and health services, and removal of barriers for the mobility of farm labor
into non-farm activities. These direct policies are much more likely to be successful than
policies that attempt to work indirectly through the prices of particular commodities, such
as cotton.
1 Alston et al (2000) examine well over a thousand studies of the benefits from rural research, and find an
average rate of return of 81 percent per year.

95
References
Alston, J., Chang-Kang, C., Marra, M., Pardey, P., and Wyatt, T. (2000), A Meta-Analysis of
Returns to Agricultural R&D: Ex Pede Herculem, IFPRI Research Report 113, International Food
Policy Research Institute, Washington DC.
Baffes, J. (2003), ‗Cotton and developing countries: a case study in policy incoherence‘, World
Bank Trade Note 10, Washington DC. www.worldbank.org/trade
China Cotton Textile Association (2007), Analytical Report on Industry Performance in 2007,
China Cotton Textile Association.
Cranfield, J., Preckel, P. and Hertel, T. (2007) Poverty analysis using an international cross-
country demand system, Policy Research Working Paper, World Bank, forthcoming.
Cotlook (2006) China announces the new formula for import duty Cotton Outlook, 29th Dec,
2006. www.cotlook.com
Huang, J., Liu, Yu, Martin, W. and Rozelle, S. (2007) ‗Distortions to agricultural incentives in
China‘ Mimeo, World Bank.
Huang, J., Liu, Yu, Martin, W. and Rozelle, S. (2008) Agricultural Trade Reform and Rural
Prosperity: Lessons from China, NBER Working Paper, National Bureau of Economic Research,
Boston.
Lin, J. Y. (1992) ‗Rural Reforms and Agricultural Growth in China‘ American Economic Review
82(1):34-51, March.
MacDonald, S. (2007), ‗Progress and problems estimating China‘s cotton supply and demand‘
USDA Outlook Forum 2007, Washington DC.
MacDonald, S. and Vollrath, T. (2005), ‗The forces shaping world cotton consumption after the
Multifiber Arrangement‘ Electronic Outlook Report from the Economic Research Service, USDA,
CWS-05c-01, Washington DC.
Minot, N. and Daniels, L. (2002), ‗Impact of global cotton markets on rural poverty in Benin‘,
IFPRI, Washington DC.
Oxfam. (2002) ‗Cultivating Poverty: The Impact of US Cotton Subsidies on Africa‘ Briefing
Paper No. 30. OXFAM, London.
People‘s Daily (2008), China's textile industry plagued by slim profits, People’s Daily Online,
March 27. http://english.peopledaily.com.cn/90001/90776/90884/6382179.html
Ravallion, M. and Chen, S. (2004), China‘s (Uneven) progress against poverty, Policy Research
Working Paper 3408, World Bank. Forthcoming Journal of Development Economics.
Shi Jianwei, (2007), ‗CCA: 2006 China cotton production underestimated‘,
http://www.cncotton.com/encotton/News/CottonNews/200709/t20070906_144663.html

96
Sicular, T., Yue, Ximing, Gustafsson, B. and Li, Shi (2006), ‗The Urban-Rural Income Gap and
Inequality in China‘ Research Paper No. 2006/135, UN-WIDER, Helsinki.
World Bank (2004), Implications for Pakistan of abolishing textile and clothing export quotas,
Policy Note, World Bank Resident Mission, Islamabad, April 30.
World Bank (2008), World Development Report 2008, World Bank, Washington DC.
WTO (1995), The Results of the Uruguay Round of Multilateral Trade Negotiations: the Legal
Texts. World Trade Organization, Geneva.
Zhao, Y. (1999), ‗Leaving the countryside: rural--to-urban migration decisions in China‘
American Economic Review 89(2):281-86.
Zhai, Fan and Hertel, T. (2006) ‗Labor market distortions, rural-urban inequality and the opening
of China‘s economy‘ Mimeo, www.gtap.org

97
11 Rethinking Trade and Poverty Linkages: Implications of the Doha Round
Negotiations for China‘s Agriculture1
Jikun Huanga2
, Jun Yanga, Ninghui Li
b, Scott Rozelle
c, Will Martin
d
While the overall effects of trade liberalization often were generally expected to be
positive, there is still concern about the impacts that additional trade
liberalization—such as, the new round of the Doha negotiations—might have on
China‘s agricultural production and rural poverty. Specifically, since households in
most parts of China are fairly well integrated into national markets, the effects of trade
liberalization that start at China‘s ports—both those that raise and lower domestic
prices—are transmitted rapidly throughout the economy (Huang et al., 2003b). Hence,
while producers of exportable commodities will gain if trade volume rises due to a new
trade agreement, if a group of farmers is producing a product that is imported in greater
quantities due to trade liberalization, the price that the farmers would receive would have
been higher had there been no trade liberalization. It is important, then, to identify those
groups of farmers that gain and those that lose from trade liberalization—at least in the
short run.
A careful analysis of the trade impacts on poverty is particularly needed in the light
of the ongoing Doha negotiations. The overall goal of this paper is to improve our
understanding of how policies, especially moves toward trade liberalization, affect
China‘s agricultural development. More specifically, in this paper we seek to examine the
impacts of Doha Round negotiations on the income of farmers, and particularly the
income of the poor, in different regions of China.
China‘s agricultural trade policies
Since its accession to the WTO, the agricultural trade regime has become relatively
open. For key products, such as rice, wheat and maize, the assessed tariffs have been low
because the in-quota tariff rates have generally been the ones that have applied (Table
9.1). For many other products, such as fish products, oilseeds, pork, poultry, sugar and
dairy products, protection rates are relatively low and higher out-of-quota rates are not
applicable.
1 This note is edited by Ms. Min Zhao based on Huang etal. (2009)‘s background paper.
2 a Center for Chinese Agricultural Policy, Institute of Geographical Sciences and Natural Resource
Research, Chinese Academy of Sciences, Jia 11 Datun Road, Anwai, Beijing 100101, China
b Institute of Agricultural Economics and Development, Chinese Academy of Agricultural Sciences,
Beijing, China
c Freeman Spogli Institute for International Studies, Stanford University, USA
d Development Research Group, World Bank, USA

98
While China‘s own agricultural trade barriers are relatively low, it faces relatively
high barriers in export markets. Table 11.1 presents estimates of the tariffs levied by
China on a range of products, particularly agricultural products, world average tariffs for
those products and the tariff rates applied against China‘s exports. The tariffs imposed on
imports are in some cases above world average tariff rates and in others below them. As
noted above, the tariffs listed for China on key products such as wheat and rice are in-
quota rates, and higher tariffs can be levied if imports exceed quota levels. While this is a
fairly well known story, perhaps the most striking fact that can be seen from the numbers
in the table is that the tariffs on exports from China (that is, the rates imposed on China‘s
food exporters) are above the world average rates. This pattern of distortions—that is
unfavorable to China—may mean that China can most likely best address this set of
systematic inequalities through negotiations under the WTO.
Table 11.1 Comparisons between China‘s import tariff and external tariffs in 2006 (%)
China's import
Tariff
World average
Tariff
Import tariff levied on
China's commodities
Rice 1 8.7 131.09
Wheat 1 4.3 3.89
Coarse grain 2.94 8.2 190.85
Vegetable & fruit 6.54 3.0 22.55
Oilseeds 2.88 3.4 50.28
Sugar 12.74 9.3 36.21
Plant fiber 1(5)a 0.8 6.44
Other crop 3.34 2.3 8.31
Cattle &mutton 9.65 3.6 4.25
Pork & poultry 7.72 3.7 9.35
Milk 8.66 3.3 3.23
Fish 7.48 1.0 6.11
Processed food 8.77 3.1 10.03
Natural resources 0.27 0.7 1.98
Textile & apparel 8.96 3.4 11.23
Resources industries 5.88 1.6 3.33
Metal & machinery 5.41 1.5 2.82
Transport equipments 8.09 1.6 3.63
Electronic products 2.31 0.8 1.14
Manufactures 14.46 1.8 2.68
Source: estimation based on China‘s WTO commitment, GTAP tariff database, China and ASEAN free trade
agreement, EU enlargement etc. a China adopts TRQ management on import of Cotton. The in-quota tariff is only 1%; the out-of-quota tariff is 40% in
2006. However, China took a much low sliding tariff (beginning around 5 percent, shown in bracket) instead of a
prohibitive out-of-quota tariff.
Main proposals in the Doha Round Negotiations
The WTO negotiations under the Doha agenda will not reduce agricultural
protection to zero; rather, what is envisaged is reduction in tariff rates using a so-
called tiered-formula approach that makes larger cuts in higher tariffs. The specific
approach to be used has been the subject of great disagreement, with a wide range of
proposals advanced as the negotiations have continued. One relatively early point of

99
agreement, however, was that the all proposals for negotiation would use four ―tiers.‖ For
the industrial countries, some of the key proposals have included those offered by the
USA and the EU. The proposal that is supposed to reflect more of the developing
countries point of view is the one developed by the G-20. Building on the G-20 proposal,
Falconer (2007) subsequently suggested a range of possibilities for cuts in each tier. Each
of these proposals is set out in Table 11.21.
Table 11.2 Proposed tariff reductions of agricultural commodities (%)
EU proposal G20 proposal US proposal Falconer
Tiers Cut Tiers Cut Tiers Cut Tiers Cut
For industrial countries
1 <30 35 <20 45 0<20 65 < 20 48 to 52
2 30-60 45 20-50 55 20-40 75 20-50 55 to 60
3 60-90 50 50-70 65 40-60 85 50-75 62 to 65
4 >90 60 >70 75 >60 90 >75 66 to 73
Cap 100 100 75 No Cap
For developing countries
1 <20 37 to 43 <30 25 <30 25(1-40) <30 32 to 34.6
2 20-40 43 to 50 30-80 30 30-80 30 30-80 36.6 to 40
3 40-60 50 to 57 80-130 35 80-130 35 80-130 41.3 to 43.3
4 >60 57 to 60 >130 40 >130 40 >130 44 to 48.6
Cap 112 150 150 No Cap
Source: Hanrahan and Schnepf (2005), Sharma (2007) and Falconer (2007).
The US proposal was by far the most ambitious, with a ceiling tariff after cutting of 75
percent, and cuts of 90 percent in tariffs above 60 percent. The G-20 proposal, which has
been the basis for most of the discussion in recent years, involved a tariff cap of 100
percent, and cuts of 75 percent in tariffs above 75 percent. The most recent proposal, by
Crawford Falconer, the chairman of the agricultural negotiations, removes the explicit
cap on tariffs, and lowers the cuts in the highest tariffs, while raising the cuts in the
lowest tariffs. Since the G-20 proposal captures the broad nature of the policy changes
involved in the subsequent proposal, and because the Falconer proposal provides only
ranges (and these ranges seem likely to change in the future), we focus primarily on the
G-20 proposal in our analysis.
As is clear from Table 11.2, the proposed tiers for developing countries are wider
than those for the industrial countries. This means that in the case of developing
countries, the stiffest tariff cuts do not apply except for the higher rates of tariffs (when
compared to the case of industrial countries). For example, under the G-20 formula, the
largest cuts are in tariffs above 130 percent for developing countries, rather than those
above 75 percent for the industrialized countries. In addition, the largest cuts only reach
1 There are many explanations of why the proposals are different. One explanation is that the fundamental
differences among the proposals reflect the differences of the interests in the agricultural sectors of the
various countries. Each country is trying to maximize its gain or minimize the loss of producers and
consumers in their own food economies.

100
40 percent for these tariffs (in the case of developing countries), rather than 75 percent as
in the case of industrialized countries. The Falconer proposal also eliminates the tariff cap.
For developing countries, it raises the tariff cuts on both the lowest and the highest tariffs
relative to the G-20 formula. The formulas applicable to developing countries are
important, both because they will influence the adjustments that China needs to make in
its own tariff bindings, and because these tariff formulas are applicable in export markets,
such as that in the Republic of Korea, which are eligible for developing-country treatment
under WTO rules.
Since these tariff formulas are to be applied to bound, rather than applied tariffs,
their ultimate effect on applied rates will depend upon the gap between bound and
applied tariff rates. It will also depend upon the extent to which some countries are
excluded from the formula cuts, and particular products are selected for more flexible
treatment than is allowed under the formula. In this stage of our analysis, we focus on the
impacts of formula cuts to provide a benchmark against which these questions of flexible
treatment can be addressed in future research.
Table 11.3 Comparisons of USA, G20 and EU proposals on agricultural domestic support policy
Highest Tier 2nd Tier 3rd Tier
USA proposal EU, Japan U.S. Other Developed
Amber Box Cuts 80% 60% 37%
De Minimis cuts Bound at 2.5% of TVP Bound at 2.5% of TVP Bound at 2.5% of TVP
Blue Box Ceiling Bound at 2.5% of TVP Bound at 2.5% of TVP Bound at 2.5% of TVP
G20 proposal EU, Japan U.S. Other Developed
Amber Box Cuts 80% 70% 60%
EU proposal EU, Japan U.S. (or Japan+) Other Developed
Amber Box Cuts 70% 60% 50%
De Minimis cuts Bound at 1% of TVP Bound at 1% of TVP Bound at 1% of TVP
Blue Box Ceiling Bound at 5% of TVP Bound at 5% of TVP Bound at 5% of TVP
Source: Hanrahan and Schnepf (2005)
Besides the market accession negotiations, export competition and domestic support
are other two important aspects in the Doha trade negotiations. Correspondingly, the
three proposals (USA, EU and G20) also include sets of criteria on these two issues. In
addressing the issue of export subsidies, the three proposals commit all WTO members to
eliminating all forms of agricultural export subsidies. Although there was relative
consensus on export subsidies, the negotiations are more complicated when discussing
issues of the reduction of domestic support. As shown in Table 11.3, the reductions are
measured by the rate by which aggregate measures of support (AMS) are cut.1 Domestic
support calculations also include bounding levels of De minimis support and Blue Box
payments. Although all proposals agree on the fact that for the reductions of AMS must
be greatest for those countries with higher levels of AMS, the exact schedule of cuts
differs among the proposals. The G20 proposal is most aggressive when addressing AMS
cuts. It suggests that the EU and Japan must reduce the AMS by 80%. The G-20 proposal
1 ―Amber box‖ supports include domestic programs that do impact on production and trade, as defined by
the Aggregate Measure of Support (AMS), such as the output price support and input subsidy.

101
also asks the USA to cut domestic support by 70% as well as requesting that other
developed countries make reductions of 60%. As to the De minimis and Blue Box
payments, the USA proposal suggests that the bounding levels of the two items be
restricted to no more than 2.5% of the total value of agricultural production. In contrast,
the EU proposes that De minimis and Blue Box payment are bounded at 1% and 5%
respectively.
Methodology and Scenarios
To understand the impacts of different proposals for trade liberalization in the Doha
Round WTO negotiations, we use two models, the Global Trade Analysis Project (GTAP)
and the Chinese Agricultural Policy Simulation and Projection Model (CAPSiM). The
national-level economic impacts of Doha are assessed with the GTAP model. The
simulated price changes of international agricultural products are then fed into CAPSiM
in order to analyze the potential impacts of a Doha agreement on China‘s agricultural
production. A module embedded in CAPSiM then allows us to study the effects of trade
policy changes on the incomes of farmers and other households by region and by income
group.
In this study, four scenarios are considered in assessing the impacts of Doha on China‘s
agriculture at the national, regional and household levels. The four scenarios include one
baseline scenario and 3 alternative Doha policy scenarios. The Doha policy scenarios
include one to simulate the USA proposal; one to simulate the EU proposal; and one to
simulate the G20 proposal. In the analysis we are going to assume that all of the parts of
the Doha agreement are realized by 2015. As such, we estimate the impact of Doha by
comparing the baseline results with those under Doha policy scenarios in 2015.
Baseline scenario. In the baseline scenario, there are several key assumptions. First, we
assume that there is no Doha agreement. Instead, every country will continue operating
under their existing policies. If there are major trade agreements that affect agriculture,
they are not due to the Doha Round. Therefore, our scenario embodies the effects of
important known policies related to international trade, such as the continued
implementation of the Uruguay Round commitments, China's WTO accession promises
(which continue to take effect through 2010), the phase-out the Multi-fiber Agreement
(MFA—by January 2005) and the implementation of the Agreement of Free Trade Areas
between China and ASEAN member countries.
Doha policy scenarios. Doha negotiations mainly focus on three so-called pillars (i.e.,
market access, export competition (subsidies) and domestic support). If a Doha
agreement is reached, there is a consensus that it will include elimination of export
subsidies. However, the proposed reductions in import tariff and domestic support vary
significantly between the EU, G20 and USA proposals. The major proposed policy
commitments that are parts of the EU, G20 and USA proposals are summarized in Table
11.2 and Table 11.3. In short, the policy shifts described in these tables constitute the
major inputs into the scenario formulations.

102
In the process of modeling the proposed provisions, as only the applied tariffs are
available in GTAP database, the tariff cuts in our research are based on the applied tariffs.
Using applied tariffs, however, implies that the estimated impacts that are simulated in
this study should be considered as upper bounds. In other words, if we had used bound
tariffs, we would have found lower estimated impacts—and probably substantially
smaller impacts given the large degree of binding overhang in many markets. To
simplify our analysis, we will also assume that countries only must cut their Amber Box
support. Their initial levels of De minimis and Blue Box support remain unchanged. In
order to simulate the reduction of Amber Box subsidies, we cut down the output
subsidies and intermediate subsidies in GTAP according to the ratios presented in Table
11.3.
Potential Impacts of the Doha Round Negotiations
Macro and Sector-wide Impacts
Table 11.4 The macro impacts on China under EU, G20 and USA proposals in 2015
EU Proposal G20 Proposal USA Proposal
EV(million USD) 3479 3361 3413
Real GDP growth (%) 0.05 0.05 0.05
GDP price index (%) 0.99 0.98 0.97
Total income (%) 1.08 1.07 1.06
Term of trade (%) 0.46 0.43 0.44
Total export (%) 3.89 3.92 4.01
Total import (%) 5.56 5.60 5.70
Trade balance(million USD) 2293 2286 2492
Agricultural income (%) 2.04 2.05 2.24
Agricultural export (%) 10.31 10.99 19.89
Agricultural import (%) 6.83 7.41 9.08
Source: GTAP simulation results
Regardless of which of the three scenarios that is simulated, a Doha agreement
would improve China‘s economic welfare and stimulate domestic economic
growth—although the impacts would not be large. According to our analysis, if any of
these three agreements were implemented, China‘s welfare would increase by about 3.4
billion US$ (Table 11.4). Real gross domestic production would rise by 0.05% when
comparing the results of the scenario analyses to the baseline1 (Table 11.4). At the same
time, international trade would also expand—including both imports and exports. Since
the export price rises higher than the import price, China‘s terms of trade would improve.
While the overall impacts are minor, individuals associated with China‘s
agricultural sectors would benefit from the adoption and extension of the proposed
trade liberalization changes being discussed under the Doha negotiations. As shown
in Table 9.3, the rise in income in agriculture is about two times that of the national
1 It is common to get quite small effects on real gross domestic production (GDP) using GTAP model to
analyze the trade policy change, as the change just captures the improvements of allocation efficiency of
primary factors.

103
average. Similarly, the increases of agricultural exports and imports are also larger than
those of the national average. Moreover, the growth of agricultural exports is higher than
that of imports (Table 11.4). This relatively higher rate of rise in exports implies that the
agricultural sector as a whole will enjoy more trade benefits from Doha trade
liberalization.
The relatively minor variations among the results of the different scenarios (that is,
the EU versus the G20 versus the US proposal) are explained by two factors. First,
all of the proposals largely limit the Doha proposals to the agricultural sector; there are
few significant policy differences in non-agricultural sectors (NAMA) among three
proposals. Since, agriculture is a relatively small sector of the economy, its overall impact
is relatively small (and differences among the proposal are even smaller). Second, prior
to the Doha round (that is, after the accession of China to the WTO), China‘s agriculture
was already largely liberalized.
The Impact on China’s International Prices and Trade
Doha Round liberalization would have larger impacts on the international prices
faced by China and international trade of agricultural commodities (and these
impacts will vary significantly among commodities). China‘s imports of grains and
soybean will fall, while its exports will increase and China will gain in net export of these
crops in Doha Round. The nature of impacts is the result of how China‘s trade responds
to the changes in the international prices of these commodities due to trade policy
changes.
Table 11.5 Impacts on China‘s import of major agricultural commodities
Baseline
(thousand
ton)
Impacts under difference scenarios
EU Proposal G20 Proposal USA Proposal
Quantity
(%)
Price
(%) Quantity (%)
Price
(%)
Quantity
(%)
Price
(%)
Milled Rice 995 -0.1 1.5 -0.9 1.9 -1.2 2.1
Wheat 1096 -25.0 3.2 -26.8 3.6 -27.4 3.8
Maize 1813 -26.7 6.0 -26.8 6.1 -26.4 5.6
Other Grain 3099 -8.5 6.0 -8.5 6.1 -7.8 5.6
Soybean 41271 -0.7 1.4 -1.0 1.8 -0.6 1.2
Cotton 7490 17.6 3.8 17.4 4.0 17.2 3.9
Oil Crop 6744 -0.9 1.4 -1.3 1.8 -0.8 1.2
Sugar Crop 3286 15.6 -2.9 17.2 -3.7 20.6 -5.7
Vegetable 406 31.5 -0.8 34.3 -1.3 42.0 -2.5
Fruit 2878 20.4 -0.8 22.9 -1.3 30.0 -2.5
Pork 839 3.2 -1.6 4.3 -2.3 6.7 -3.9
Beef 378 65.3 -0.8 68.0 -1.5 72.6 -2.9
Mutton 199 55.7 -0.8 58.2 -1.5 63.1 -2.9
Poultry 505 0.6 -1.6 1.6 -2.3 3.9 -3.9
Milk 5847 -1.7 1.9 -0.8 1.2 0.3 0.6
Fish 3289 7.4 -2.2 8.6 -2.9 11.4 -4.4
Source: CAPSiM simulation results

104
Table 11.6 Impacts on China‘s export of major agricultural commodities
Baseline
(thousand
ton)
Impacts under different scenarios
EU Proposal G20 Proposal USA Proposal
Quantity
(%)
Price
(%)
Quantity
(%)
Price
(%)
Quantity
(%)
Price
(%)
Milled Rice 1873 47.7 12.1 57.5 14.5 72.6 18.1
Wheat 594 8.2 -6.3 6.7 -6.6 5.5 -7.0
Maize 81 34.9 11.4 55.8 17.2 88.4 25.7
Other Grain 48 21.4 11.4 42.9 17.2 71.4 25.7
Soybean 1042 36.0 18.2 27.4 15.1 38.6 19.0
Cotton 11 -23.1 4.8 -23.1 5.6 -15.4 7.0
Oil Crop 21 42.9 18.2 35.7 15.1 50.0 19.0
Sugar Crop 163 21.1 1.5 22.7 1.5 27.3 1.4
Vegetable 8957 22.3 5.4 28.1 6.6 50.2 11.1
Fruit 5324 27.2 5.4 32.2 6.6 51.2 11.1
Pork 977 0.6 0.2 -0.9 -0.3 -2.3 -0.8
Beef 29 11.5 2.5 11.5 2.1 11.5 2.0
Mutton 4 33.3 2.5 33.3 2.1 33.3 2.0
Poultry 1146 0.8 0.2 1.1 0.3 2.8 0.8
Milk 157 9.4 4.4 11.6 4.8 13.8 5.5
Fish 4601 10.7 1.2 11.8 1.5 13.7 1.9
Source: CAPSiM simulation results
For the three scenarios simulated, compared to the baseline in 2015, the Doha
Round will raise China‘s import price of grain by about 2 percent for rice, 3-4
percent for wheat, about 6 percent for maize and other coarse grains, and 1-2
percent for soybean (Table 11.5). Rising import prices will lead to corresponding
declines in the imports of these commodities. The largest declines in imports, about 25-
27 percent, will occur in the case of wheat and maize (Table 11.5). On the other hand, all
export prices of grain and soybean will rise. The rise in these export prices will range
from 6-7 percent for wheat, to 12-17 percent for rice, and to 15-19 percent for soybean (
Table 11.6). With the negative impacts on imports and positive impacts on exports of
grain and soybean, China‘s trade balance (or net exports) of these commodities would
rise by about 500 thousand tons for rice, more than 400 thousand tons for wheat and
about 500-700 thousand tons for soybean and maize. The Doha development agenda
tends to improve China‘s food security.
In contrast, the situations will be different for the cases of sugar and cotton.
Compared with the baseline in 2015, China‘s imports of sugar will rise by about 15-20
percent (Table 11.5). Although China‘s export of sugar will also increase, exports will be
minimal and China‘s net import will increase by about 400-500 thousand tons because of
much higher volume of imports in the baseline scenario. The Doha round trade
liberalization shifts will further raise this expected volume of imported cotton by about
1.3 million tons (or about 17 percent, Table 11.5). Moreover, the findings also differ
between these two commodities. Although China‘s agriculture has been largely
liberalized, sugar is still relatively heavily protected by the nation‘s border policies. The
average import tariff on sugar in 2006 was about 12.7 percent, which is higher than the
worlds‘ average tariff, 9.3 percent (Table 11.5). Although Doha trade liberalization will
105
raise the world price of sugar, China‘s sugar import price is expected to fall by 2.9-5.7
percent (under the different scenarios). This fall will occur because the tariff reduction in
China is scheduled to be more than the increase in the world price of sugar. Impacts on
the cotton sector are interesting because a large part of the impacts are not due to changes
in the international price of cotton, but are due to the booming demand for cotton from
factories in the textile and apparel industries. Therefore, there is supposed to be raising
relative prices of domestic and imported cotton.
Both the import and export of vegetables and fruit will expand in China, however,
the positive impact on China‘s horticulture product exports under the Doha Round
proposal will be more than its impacts on import‘s increase; this shift, of course, means
that China‘s trade surplus in the vegetable and fruit sub-sectors will rise (Table 11.5, and
Table 11.6). China has a strong comparative advantage in the production of vegetables
and fruit since this is one of China‘s more labor-intensive cropping sub-sector. Moreover,
China‘s vegetables and fruit have great potential to expand if the Doha Round (or future
rounds of trade liberalization) talks can reduce the high import tariffs levied by other
countries on China‘s horticultural exports.
The exports of many livestock products will rise with Doha Round (Table 11.6).
However, China has also imposed relative higher tariffs on livestock imports, especially
beef, mutton and milk (Table 11.6). Rising imports in the case of most livestock products
will be more than the rise in their exports under all scenarios (Table 11.5 and Table 11.6).
The Impacts on Agricultural Production in China
The impacts of the Doha Round on the domestic production inside China are fully
consistent with the impacts of the Doha Round on trade. First, the production of many
grains (e.g., rice, wheat, maize, potato and other coarse grains) will increase (Table 9.7).
Because sweet potato is mainly used for feed, its demand will decrease with the moderate
decline in animal production. Moreover, the growth rates of milled rice, wheat, potato
and other coarse grains will rise in the more liberalized proposals. Taking milled rice as
an example, its output will rise by 0.07%, 0.12% and 0.20% respectively according to the
EU, G20 and US proposals (Table 9.7). However, the growth of maize is different from
the case of other grain commodities. The ranking of it growth will be the opposite,
increasing by 0.05%, 0.02% in the EU and G20 proposals and decreasing by 0.03% in US
proposal. The reason for this reverse is mainly due to the fact that in the more liberalized
proposal (i.e., the US one) the production of animal products gradually decreases. Since
most of China‘s domestically produced maize is used for feed, the drop in the demand for
feed will dominate and maize production will decrease slightly under the US proposal.

106
Table 11.7 The impacts on production in China under different scenarios in 2015
Baseline
(thousand
ton)
Impacts under difference scenarios
EU proposal G20 proposal USA proposal
(thousand
ton) %
(thousand
ton) %
(thousand
ton) %
Milled Rice 123130 82 0.07 149 0.12 248 0.20
Wheat 98643 79 0.08 88 0.09 84 0.09
Maize 181251 88 0.05 32 0.02 -54 -0.03
Sweet potato 22596 -48 -0.21 -53 -0.23 -58 -0.26
Potato 19084 44 0.23 46 0.24 53 0.28
Other Grain 15735 248 1.58 248 1.58 228 1.45
Soybean 20396 382 1.87 408 2.00 366 1.79
Cotton 9144 153 1.67 156 1.71 155 1.70
Oil Crop 9658 26 0.27 36 0.37 20 0.21
Sugar Crop 11909 -289 -2.43 -318 -2.67 -370 -3.11
Vegetable 464688 128 0.03 384 0.08 1490 0.32
Fruit 153826 86 0.06 172 0.11 569 0.37
Pork 58465 -204 -0.35 -220 -0.38 -240 -0.41
Beef 5905 -82 -1.39 -85 -1.44 -90 -1.52
Mutton 3481 -40 -1.15 -41 -1.18 -45 -1.29
Poultry 19292 -30 -0.16 -42 -0.22 -55 -0.29
Egg 23707 -88 -0.37 -90 -0.38 -93 -0.39
Milk 45709 51 0.11 25 0.05 5 0.01
Fish 33815 65 0.19 69 0.20 66 0.20
Source: CAPSiM simulation results
The production of other land-intensive commodities, such as soybean, oil crops and
cotton, will also increase. The growth rates of soybean and cotton are the highest among
all the crops. The production of soybeans will increase by 1.9%, 2.0% and 1.8%
respectively in the EU, G20 and US proposals (Table 11.7). At the same time, the output
of cotton will rise by about 1.7% in all three proposals. The higher growth indicates the
farmers that plant these corps will gain under the Doha trade liberalization scenarios.
Horticultural farmers should gain from trade liberalization. According to our model,
the output of labor-intensive vegetables and fruit will increase. This is especially true in
the more liberal US proposal. The production of vegetables are projected to rise by 0.03%,
0.08% and 0.32% respectively under the EU, G20 and US proposals (Table 11.7).
Correspondingly, the output of fruit also will rise—by 0.06%, 0.11% and 0.37%. Since
the tariffs of vegetables and fruit decrease sharply in US proposal, if that proposal were to
be realized, China would be able to further exploit its comparative advantage in labor-
intensive vegetables and fruit.
China‘s production of many animal products (i.e., beef, mutton, pork, poultry and
eggs) will fall under the Doha trade scenarios. This is especially true for beef and
mutton. Although the output of these animal products will decrease relatively more in the
liberalized proposals, the differences among the three proposals are trivial (Table 11.7).
The production of beef and mutton will drop from between 1.2% to 1.4%. This level is

107
much larger than the projected falls for pork, poultry and eggs. China‘s production of
pork, poultry and eggs will drop by 0.4%, 0.2% and 0.4% respectively. Since pork
dominates China‘s livestock industry in terms of quantity of production, under the Doha
round, the reduction of production in absolute value terms (about 0.2 million tons) is the
largest of all livestock commodities.
In summary, then, the impacts of the Doha trade liberalization scenarios have a number
of regular characteristics. First, the production of grains will increase. This means that,
ceteris paribus, under trade liberalization, self-sufficiency in grains actually will improve.
Second, the output of soybeans and cotton also will rise. In fact, although these are land
intensive commodities, their growth rates are the highest among all the crops. Third, the
projected fall in China‘s production of sugar under Doha Round compared with the
production under baseline scenario is the greatest challenge to China‘s producers. Its
production is shown to be projected to decrease in all, and especially in the more
liberalized proposals. Fourth, trade liberalization, as might be expected, will promote
China‘s production of vegetables and fruit. This result is most obvious in the US proposal.
When other nations liberalize their horticultural sectors, China gains and it is able to
further exploit its comparative advantage in labor-intensive products. Fifth, China‘s
production of beef, mutton, pork, poultry and egg will decrease. This is especially true in
the case of the production of mutton and beef. They drop significantly in terms of
percentage change. Sixth and finally, the production of fish will increase.
The Impacts on Farmer Agricultural Income in China
Doha trade liberalization will help China‘s farmers increase their income. The
contribution to income growth, however, will be limited. As shown in Table 11.8, the per
capita income of farmers, on average (for the nation), will rise by 1.07% (or about 22
yuan), 1.12% (about 23 yuan) and 1.17% (about 24 yuan), respectively, in the EU, G20
and US proposals. The results also indicate that the gains of farmers will increase under
the more liberalized proposals.

108
Table 11.8 The impacts on per capita agricultural income in rural area by income groups
Absolute change (yuan) Relative change (%)
EU
proposal
G20
proposal
USA
proposal
EU
proposal
G20
proposal
USA
proposal
National average 22.06 23.05 24.02 1.07 1.12 1.17
Under poverty 8.29 8.72 9.21 1.00 1.06 1.11
Income group 1 15.41 16.06 17.19 1.11 1.16 1.24
Income group 2 23.45 24.19 25.47 1.28 1.32 1.39
Income group 3 38.45 39.76 41.30 1.62 1.68 1.74
Income group 4 54.15 55.73 56.51 1.77 1.82 1.85
Income group 5 69.55 71.38 71.62 1.64 1.68 1.68
Farmers in plain area 33.72 34.99 35.68 1.38 1.43 1.46
Farmers in hill area 18.74 19.93 21.45 0.98 1.05 1.13
Farmers in mountain area 9.32 9.59 10.07 0.59 0.61 0.64
Farmers: Han 22.30 23.32 24.37 1.08 1.13 1.18
Farmers: Minority 8.40 7.48 3.71 0.44 0.39 0.20
Note: The group under poverty includes all households with per capita income of less than 872 yuan in 2001, which
accounted for about 10% of rural population. Per capita income of groups 2, 3, 4, 5 and 6 were in the ranges of 872-
1300, 1300-1700, 1700-2300, 2300-3300 and above 3300 yuan, respectively. The groups 2, 3, 4, 5 and 6 accounted for
about 15%, 15%, 20%, 20% and 20% of rural population in 2001.
Source: CAPSiM simulation results.
While the gains are positive (albeit small), on average, they vary by income groups,
topography and by minority status. Although per capita incomes in all income groups
will be improved, the benefits increase gradually from the lowest to the highest income
groups. As the shown in Table 11.8, the per capita income of those farmers under poverty
will increase by 1.00% (or 8.3 yuan), 1.06% (8.7 yuan) and 1.11% (9.2 yuan) in the EU,
G20 and US proposals. Correspondingly, the increase in per capita agricultural income of
those farmers in the top income group (i.e., income group 5 in Table 11.8) will rise by
1.64% (or 69.6 yuan), 1.68% (71.4 yuan) and 1.68% (71.6 yuan). This rate is higher than
that of the group farmers that earn incomes under the poverty line. In this way, we can
not say the trade liberalization is progressive.
Like the differences among income groups, income improvements also differ among
households that live in villages that have different topography. In short, farmers
living in plains areas will gain more. The average per capita income of farmers that live
in villages that are located on a plain will rise by 1.38% (33.7 yuan), 1.43% (35.0 yuan)
and 1.46% (35.7 yuan) in the EU, G20 and US proposals (Table 11.8). However, income
increases by only 0.59% (9.3 yuan), 0.61% (9.6 yuan) and 0.64% (10.1 yuan) when
farmers live in mountainous villages (Table 11.8).
Our results also indicate ethnicity matters. The per capita income of Han farmers is
shown to rise more than that of those that live in minority villages. The average per capita
income of Han farmers will rise by 1.08% (22.3 yuan), 1.13% (23.2 yuan) and 1.18%
(24.4 yuan) in the EU, G20 and USA proposal (Table 11.8). Correspondingly, the income

109
growth of minority farmers is much lower. In fact, under the most liberal proposals (the
US), the increase will reduce a little bit.
Table 11.9 Shares of output values for competitive and noncompetitive agricultural products for
different groups of farmers under baseline in 2015
Share of competitive
agricultural products
(those that benefited
from Doha)
Share of non-
competitive
agricultural products
(those that lost from
Doha)
Share of neutral
agricultural products
(those that did not
gain nor lose from
Doha)
(1) (2) (3)
National average 62 11 27
Under poverty 53 10 37
Income group 1 58 12 30
Income group 2 60 13 27
Income group 3 61 12 27
Income group 4 63 11 26
Income group 5 67 11 22
Farmers in plain area 61 8 31
Farmers in hill area 68 15 17
Farmers in mountain area 57 18 25
Farmers: Han 63 12 25
Farmers: Minority 46 24 30
Note: Based on the analysis of the impacts on trade and production, the potential benefit agricultural products under
column 1 include rice, wheat, soybean, cotton, oil crops, vegetables, fruits and fish; the potential lost products under
column 2 include sugar, beef, mutton, pork and poultry; the neutral products include maize, milk, potato and some
minor crops (e.g. other grains).
There are many factors leading to the different gains among groups. However,
among all of the differences, the most important is the differences among the groups
in terms of their farming structure. In other words, richer Han farmers living in plains
village benefit more because of the nature of the crops and livestock that they are
producing. In order to clearly show the difference in farming structure among the groups,
we classify agricultural commodities into three groups based on our analysis of
production and trade. The first group is composed by those commodities that are
discovered by our analysis to produce benefits for farmers. The set of goods include rice,
wheat, soybean, cotton, oil crops, vegetables, fruit and fish. We call these benefiting
commodities. The second group includes those that when produced under the Doha round
proposals will lead farmers to incur a loss (relative to the baseline). These activities
include sweet potato, sugar, beef, mutton, pork and poultry. We call these non-benefiting
commodities. The remaining agricultural commodities are not affected significantly.
These activities include maize, milk, potato and some minor crops (e.g., other grain). We
call these neutral commodities. Through the comparison of farming structures—
benefiting versus non-benefiting—we seek to explain the reason why different groups
enjoy/suffer different impacts.
The farming structures of different groups help explain the nature of their benefits. As shown in column 1 of Table 11.9, the different income groups that gained the most

110
from the Doha round also produced more benefiting commodities. Specifically, farmers
that were under the poverty line only had 53% of their output from benefiting
commodities. In contrast, those in the top decile had 67% of their output in benefiting
commodities. Although the share of the non-benefiting commodities to total production
was almost the same (there is a difference in products that are neutral), the difference
between the propensity of higher income groups to produce relatively more benefiting
commodities explains a great deal of our results among income groups.
The same is true when explaining the differences between the groups based on the
topography and ethnicity. As seen in Table 11.9, the larger share of benefiting
commodities (the smaller share of non-benefiting commodities), the farmers will gain
(lose) more. These farmers that live in villages that are located on plains and farmers that
live in Han villages gain more since they have more of their output in benefiting
commodities.
The Impacts on Farmers’ Agricultural Income by Province
Although we show that at the national level households in all income groupings gain
from trade liberalization, this result does not hold for every province (Table 11.10).
At the national (aggregated) level, the overall impact on farmer‘s per capita income is
small. The main reason is that there are offsetting effects among provinces. But from
Table 6 it can be seen that the impacts differ significantly across provinces even for the
farmers in the same income categories.
Because trade impacts are more commodity-specific, and because farmers in
different income groups in different provinces grow different sets of commodities,
we can see that there actually are much sharper regional and income class-specific
impacts (Table 11.10). It also means that such impacts may have implications for equity.
In the case of China, while nearly all farmers in all provinces, except Guangxi and
Yunnan, can be seen to benefit from trade reform, liberalization generally hurts producers
in Guangxi and Yunnan provinces. The reason, of course, is clear when we consider that
farmers in Guangxi and Yunnan provinces are primarily producing sugar, which is the
commodity most hurt by Doha trade liberalization.

111
Table 11.10 Impacts on per capita agricultural income of different farmers by province
(yuan/person)
Average farmers Farmers under poverty
in 2001
The richest (top 20%) of
farmers in 2001
EU G20 USA EU G20 USA EU G20 USA
Beijing 17.9 19.7 25.9 0.0 0.0 0.0 30.8 30.6 29.4
Tianjin 22.4 22.9 25.4 3.4 3.3 2.8 74.4 70.9 60.0
Hebei 30.7 31.9 33.8 8.5 8.7 8.6 81.2 78.5 67.9
Shanxi 15.4 16.2 18.1 7.7 7.8 7.9 37.5 35.9 31.0
Inner Mongolia 27.8 27.9 19.5 11.6 11.4 9.3 172.5 166.2 152.7
Liaoning 36.6 37.4 38.3 12.4 12.4 12.1 198.3 193.0 169.6
Jilin 80.4 80.7 77.2 15.6 15.5 14.6 374.2 365.0 326.1
Heilongjiang 65.5 67.3 60.9 13.1 12.8 11.4 144.1 136.6 126.6
Shanghai 19.1 20.9 24.0 5.3 5.7 5.7 14.0 14.5 17.5
Jiangsu 32.0 34.2 35.9 10.0 10.5 11.2 35.7 34.9 33.0
Zhejiang 23.4 25.9 33.7 0.5 0.5 0.7 26.3 29.1 40.0
Anhui 28.9 30.9 30.7 14.1 14.8 14.6 41.0 39.7 37.1
Fujian 22.3 24.3 31.0 2.3 2.5 3.2 46.1 50.1 65.3
Jiangxi 23.8 25.6 27.8 10.0 10.7 12.0 45.8 48.7 57.9
Shangdong 37.1 38.7 41.0 25.7 26.1 25.7 86.1 84.2 75.8
Henan 39.4 41.1 40.7 16.9 17.5 17.8 80.8 77.6 67.3
Hubei 44.6 48.0 50.4 13.3 14.0 14.5 82.3 85.6 93.5
Hunan 21.9 23.6 27.0 8.5 9.3 11.3 18.0 18.1 21.1
Guangdong 21.4 22.5 25.4 4.8 5.0 5.1 43.8 46.9 58.3
Guangxi -13.6 -16.6 -24.5 -24.5 -26.7 -33.0 44.2 47.5 55.3
Hainan 22.8 24.6 28.9 9.3 9.9 11.4 45.2 49.3 68.0
Chongqing 20.0 21.5 26.1 9.3 10.0 12.3 48.6 47.9 45.8
Sichuan 17.4 18.6 22.1 8.9 9.4 11.1 45.3 45.0 44.4
Guizhou 12.0 12.5 13.6 6.5 6.5 6.9 76.1 74.4 67.5
Yunnan -3.1 -4.7 -8.4 -16.7 -17.7 -20.0 24.7 28.0 34.9
Tibei 38.5 38.5 33.9 32.9 32.9 29.5 34.7 30.0 18.6
Shaanxi 15.1 15.9 17.8 8.6 9.0 10.1 49.2 48.3 48.3
Gansu 36.0 36.8 36.4 11.4 11.7 11.4 199.1 200.2 188.5
Qinghai 9.4 9.5 6.4 12.1 13.2 13.2 -8.7 -10.9 -15.8
Ningxia 16.1 15.6 15.0 4.5 4.5 4.1 85.9 81.2 66.7
Xinjiang 74.9 75.8 70.6 48.3 49.4 47.5 224.1 234.9 254.2
Source: CAPSiM simulation results
Interestingly, not all the poor will gain or lose in terms of production with trade
liberalization. Our analysis shows that the poor (and more significantly for richer
farmers) in the poor provinces (in the western and northern provinces) gain more from
trade liberalization, while the poor (and richer farmers) in the eastern and southern
provinces gain relatively less or are hurt (Table 11.10). Therefore, according to these
results, Doha trade reform will contribute to poverty alleviation in some parts of China.
However, at the same time it may lead to greater poverty and worsening income
distribution problems in other regions.

112
The other important finding is that the poor in all provinces, except Qinhai and
Tibet1, will gain less (or lose absolutely more) than the rich in each sector. This
results occurs because, despite the differences in planting structure (of benefiting versus
non-benefitting commodities), the quality of land in poorer areas means that the poor
produce less (or are less productive) than farmers in the richer categories. While, in fact,
it is unclear if the lower productivity is due to lower quality of land or inability to apply
sufficient inputs (or both), it is clear that there is a role of the government in improving
the ability of the poor to increase productivity (through more R&D extension, investment
and credit).
It also is worthy to note that farmer incomes in some regions may become worse
under the more liberalized proposals. As shown in Table 11.10 farmer per capita
incomes, on average (at the national level), will increase under the more liberalized
proposals. However, it is not always true when looking at the differences among farmers
in different provinces. Our results show that per capita incomes in Guangxi and Yunnan
fall gradually from 13.6 yuan and 3.1 yuan under the EU proposal, to 16.6 yuan and 4.7
yuan under the G20 proposal, to 24.5 and 8.4 under the US proposal (Table 11.10).
Therefore, one implication of this finding is that the national government needs to put
effort into designing a way to compensate farmers that suffer relatively more pain (in
certain types of villages in certain provinces) than those in others (that gain).
Concluding Remarks
After nearly 30 years of economic reform, China‘s agriculture has grown rapidly and has
been gradually liberalized. Today, China has become home to one of the most liberalized
agricultural economies in the world. The growth in agricultural output has contributed
strongly to rural poverty reduction. China‘s experience also demonstrates the importance
of trade liberalization in agricultural development and in facilitating its agricultural
structure‘s change toward more competitive sectors.
This study shows that China‘s economy will benefit from the Doha Round—though
overall the impacts are minor—since the Doha Round is mainly focused on the
agricultural sector. Therefore, in percentage changes, the gains in agriculture would be
greater than gains to the rest of economy (and, agriculture is making up an increasingly
smaller part of China‘s overall economy). We also found that a more liberalized trade
reform proposal would bring more gains to China, although the impacts, in fact, do not
differ significantly among three proposals (USA, EU and G20).
In analyzing the impacts of the Doha Round on China‘s agriculture and poverty, we
conclude that the positive impacts are more than the negative ones, though most of the
impacts will be small in terms of their share of domestic production. Although other
1 It is mainly caused by the differences of income structures among income groups. Taking Qinghai for
example, the share of potential benefit agricultural commodities by top income group is 43% with the share
of potential loss agricultural commodities of 20%. Contrarily, the share of the potential benefit by farmers
under poverty is 60% with the share of the potential loss only 7%. Therefore, the farmers under poverty in
Qinhai will gain, with the farmer in the top income groups hurt.

113
effects on the rural economy from other subsectors may be equally large or even larger,
this study‘s focus on the agricultural sector shows that there will be an impact and the net
impacts are positive for the average farmer in China. This implies that China may want to
take a more active role in pushing forward the Doha Round negotiations, reducing high
tariffs imposed on China‘s products in the rest of world.
The results of this study also show that the impacts of a Doha Round will differ
significantly from the impacts of China‘s WTO accession. The Doha Round is an
exercise in multilateral trade liberalization; in contrast, China‘s WTO accession was
mainly a unilateral liberalization. Because of this the set of benefiting commodities may
not exactly correspond to the set of commodities in China‘s global competitive sector.
Whether or not farmers that are engaged in agricultural production are gainers or losers
due to the Doha Round will highly depend on the relative changes in China versus the
changes of trade policies in other countries. Our findings have important implications not
only to China‘s position in Doha negotiation, but also for its domestic grain security.
Importantly, China‘s food security improves under the Doha proposals.
We demonstrate that although the absolute effects of trade liberalization will not be very
large, policy makers should be concerned about the poverty and equity effects. We show
this through several findings. First, according to the analysis, while most farmers will
gain from the Doha Round, the degree of the gain will differ largely among farmers with
different levels of incomes and among farmers living in different locations (e.g., on the
plain versus in mountainous areas). Second, although on the average farmer at the
national level will benefit from the Doha Round, this finding does not hold for all
provinces. The typical farmer in some provinces, such as Guangxi and Yunan, will not
gain from the Doha Round mainly due to the large negative effects on sugar. While the
average farmer does gain in other provinces, those that are producing benefiting
commodities will gain more than those producing non-benefiting commodities.
As a consequence of these equity issues, policy makers need to take several actions. First,
officials need to try to encourage farmers in poorer areas to shift their production
decisions (where appropriate) to more competitive and benefiting products that will gain
from Doha Round. Second, officials may also need to take other, non-trade actions to
increase the livelihood of farmers in these areas. In many areas, farmers do not have an
advantage in any farming activity. In such areas rural education, better communications
and other policies that might facilitate their shift into the non-farm sector may be the
most beneficial policy. Third, there is a role for government for improving agricultural
productivity through more research, R&D extension and agricultural infrastructure
investment, particularly in poor areas. Last, but not least, there is also a role of
government to make effort in compensate farmers that suffer relatively more lose or less
gains than those in others.

114
12 Trade and the Environmental Debate
Muthukumara Mani
Background
There has been much debate over the last two decades on the role international trade
plays in determining environmental outcomes. This has led to both theoretical work
identifying a series of hypotheses linking openness to trade and environmental quality,
and empirical work trying to disentangle some of the suggested linkages using cross-
country or within-country data. Much of the focus, has been on looking at how changes
in production and trade flows have altered the pollution intensity of production
(composition effect) in both developed and developing countries, and/or how trade flows
may themselves be affected by the level of abatement costs or strictness of pollution
regulation in the trading partner countries.1
In the policy arena, the importance of establishing coherent relationships between the
trade obligations set out in various bilateral/multilateral trade agreements and
environmental policies of countries is now well-recognized. Environmental provisions
under the WTO‘s General Agreement on Tariffs and Trade (GATT) allow adoption of
product-related measures in certain situations if they are ―necessary to protect human,
animal or plant life or health,‖ or ―relate to the conservation of exhaustible natural
resources.‖ In addition, other trade agreements—such as NAFTA, CAFTA and
MERCOSUR—include provisions that directly address environmental concerns.
The Doha round of the WTO also provided the scope for expanding environmental
provisions in the context of the WTO negotiations. Specific issues currently tabled
relate to:
The relationship between existing WTO rules and specific trade obligations
set out in multinational environmental agreements (MEAs).
The reduction or, as appropriate, elimination of tariff and non-tariff barriers to
environmental goods and services (EGS).
Clarification and improvement of WTO disciplines on fisheries subsidies,
taking into account the importance of this sector to developing countries.
Clarification of environmental labeling (including ecolabeling) policies.
While reasonable progress has been made on a number of fronts, the EGS mandate and
proposals, which call for the "reduction or, as appropriate, elimination of tariff and non-
1 The issue of trade and the environment has surfaced at the Bank from time to time. There were two edited
volumes (1992, 1999) focusing on issues such as pollution havens, race to the bottom, FDI inflows, etc.
These were quite useful in informing the broader discussion in the area at that time.

115
tariff barriers to environmental goods and services", has received relatively greater
attention recently leading up to the recent UN Conference on Climate Change in Bali.
This policy note focuses on the current state of debate surrounding environmental goods
negotiations under the WTO in the context of Chinese exports and imports.1 The note
also looks at some recent proposals (in US and EU) which call for increased trade
barriers against imports from countries which have less stringent carbon policies and then
draws implications for china.
Environmental goods negotiations—what are the pros and cons?
Proponents of the negotiations to liberalize trade in certain environmentally-friendly
technologies believe that increasing access to and use of these technologies can
contribute to improving environmental quality and pollution abatement in both developed
and developing countries. This has now been extended to address climate change
concerns given the general global urgency surrounding the issue. Trade in these sectors
is also seen as a potentially powerful tool for economic development by generating
economic growth and employment and enabling the transfer of valuable skills,
technology and know-how. On the other hand, the negative impacts of liberalization on
vulnerable industries in developing countries -- in particular fledgling small and medium-
sized enterprises, have often been cited. This has led to calls among some stakeholders
that liberalization should be gradual or carefully qualified and in certain cases that
countries should be able to stop or roll back liberalization that may have these negative
impacts.
What are environmental goods?
There is no broadly agreed definition of environmental goods. But environmental goods
have been conceptualized in two ways. The first is the narrow, conventional view that
focuses on treating a specific environmental problem through the end-use of a particular
good. This includes goods such as wastewater treatment or air pollution control
equipment. The second is a broader view and includes environmentally preferable
products (EPPs). In this case, the primary purpose of the product is not to remedy an
environmental problem but environmental benefits may arise from the production method,
during the course of its use, or during the disposal stage of the product. A wide array of
products—ranging from hybrid cars to energy-efficient light bulbs—could all
conceivably be classified as EPPs. Most WTO Members, however, have sought to avoid
including products that were deemed ―environmentally preferable‖ based on their process
and production methods (PPMs).2
1 The trade issues concerning environmental services are of a different nature and often involve domestic
regulatory issues as well. The note therefore focuses only on environmental goods. 2 Differentiating goods on the basis of production would also potentially throw up challenges with regard to
classification of products for the purpose of trade under the existing Harmonized Commodity Coding and
Description System (HS), as well as require labeling or certification introducing additional complexities of
standard-setting, recognition, and acceptance.

116
Approaches taken for the negotiations in the WTO
The approaches taken to liberalizing environmental goods under the Committee on Trade
and Environment (CTE) has especially proved a major cause of deadlock in the WTO
negotiations. Some countries (mostly developed) have proposed a ‗list approach‘ to
negotiations similar to that adopted for industrial goods; that is, focusing on identifying
and submitting specific lists of goods and then negotiating the elimination or reduction of
bound tariffs (and nontariff barriers) permanently and on a most-favored-nation (MFN)
basis. A number of developing countries, however, are concerned about the impact of
liberalization on existing domestic industries and in some cases on tariff revenue.
As an alternative, some developing countries (e.g., India, Argentina) have proposed a
project approach to liberalization. Under this approach the liberalization of any good or
service (including ‗dual-use‘ ones) would be linked to specific environmental projects
approved by a designated national authority. According to some WTO members, the
project approach has two drawbacks: (a) it lacks binding and predictable market access
offered on a permanent basis; and (b) is inconsistent with WTO rules. Concerns have
also been raised regarding the time taken to develop multilateral criteria, as well as
dispute-settlement proceedings relative to the duration of a project.
China in its submission proposed a ―common‖ list that would include environmental
goods of export and import interest to developing countries and a ―development list‖ that
would be derived from the common list and comprise goods eligible for special and
differential treatment in the form of lower levels of reduction commitments for
developing countries (see Box 12.1). No formal list, however, was submitted by China
for discussions.

117
Box 12.1 Chinese Submission to the WTO on ‗Common‘ and ‗Development‘ Lists
China in its submission (TN/TE/W/42) to the WTO Committee on Trade and Environment recognized that
special and differential treatment to the developing and least-developed Members is a must in the process
of liberalizing trade on environmental goods. It therefore proposed a two pronged approached consisting
of liberalizing on the basis of a:
Common List for which comprises specific product lines on which there is consensus that they constitute
environmental goods. The products included in this list should reflect the interests of both developed and
developing Members. Priorities should be given to products of export interest of developing and least-
developed Members in order to enhance the export capacity building on environmental goods in real terms.
For the products in the common list, Members are committed to reduce or eliminate tariff and non-tariff
barriers. The specific modality of trade liberalization on environmental goods shall be developed by the
NAMA negotiating group according to the Doha mandate.
Development List is a list for special and differentiated treatment born from the common list, which
comprises those products selected by developing and least-developed Members from the common list for
exemption or a lower level of reduction commitment, with a view to reflecting the principle of less than full
reciprocity, taking into consideration the needs of their economic development and the vulnerability of their
relevant domestic industries in the area of environmental goods.
China also stressed the need and importance of facilitation of technology transfer to the developing and
least-developed Members when working on trade liberalization on environmental goods.
Consolidated list of Submissions
In all nine members tabled submissions containing their lists of environmental goods (see
Annex-Table 12A.1 for a list of submissions) for consideration. This included
submissions from Canada, the European Communities, Japan, Korea, New Zealand,
Qatar, Switzerland, Chinese Taipei and the United States. To facilitate broader
discussions, the CTE in 2005 created a consolidated common list from these submissions.
The list contained 480 products covering areas of waste water management, solid and
hazardous waste management and renewable energy plant.
Potential convergence set
Owing to a general lack of traction within the EGS negotiations, in May 2007, a group of
9 countries (comprising Canada, the EU, Japan, Korea, New Zealand, Norway, the
separate customs territory of Taiwan, Penghu, Kinmen and Matsu, Switzerland and the
United States of America) proposed a list of 153 goods with a view to provide a more
focused engagement in a fewer goods (within CTE) and to spur some momentum in the
negotiations. The cosponsors of this ―potential convergence set‖ suggested that this list
by taking into account discussions in CTE surrounding the bigger list including and
addressing concerns of some developing countries offers potential for a high degree of
convergence among members.
The US-EU Proposal

118
A recent US-EU proposal made at the WTO a few days prior to the crucial Bali climate
change meetings suggests that the WTO Members agree to eliminate tariffs and identified
non-tariff barriers to trade in 43 climate friendly products, building on the analysis done
earlier by the World Bank (see Annex-Table 12A. 2). The proposal is open to special and
differential treatment for developing country Members, including longer phase-in periods.
The objective is to have a zero tariff world for climate friendly goods in the near future
and no later than 2013. Except for opposition from countries like Brazil (for not
including ethanol) and India, the proposal has received support from a number of
countries. The US expects to pursue this further in the next meeting of the leading
greenhouse gas emitting countries to be held in Hawaii in February 2008.
Chinese trade in ―climate-friendly technologies‖
When we look at the Chinese exports in this list of proposed ―climate-friendly‖
technologies, we find that it has increased multi-fold in the last five years—from $2.2
billion in 2002 to almost $10 billon in 2006. On the other hand, imports also continue to
increase but at a much slower rate—imports almost doubled in the last five years. When
we compare similar numbers for both the US and EU we get somewhat striking results
for China. While the import/export ratios for these technologies remains more or less
constant in the US and EU, it is declining steadily in China suggesting that China is
exporting more than it is importing and emerging as major exporter in this area (Figure
12.1). Any efforts to liberalize trade in these technologies would give further boost to
Chinese exports.
Figure 12.1 Comparison of Import/Export Ratios in Climate Friendly Technologies
In terms of bilateral trade flows, both the US and EU are increasingly becoming major
importers of these technologies from China. For the US, the imports have gone from $0.4
billion in 2002 to $1.4 billion in 2006 and for the EU the imports have gone from $0.3 to
almost $3 billion during the last five years. The US is in fact become a net importer of
these technologies from China. Analysis undertaken for this paper suggests that
liberalization of trade as per the WTO proposal would increase the Chinese exports of
climate friendly technologies to the US by about 8.4 percent. This only takes trade
creation effects into account. The net impact of trade creation and trade diversion from
other producers could be much higher. Table 12.1 gives the top Chinese exports in this
area by HS code and volume of exports.
0.0
0.5
1.0
1.5
2.0
2.5
3.0
2002 2003 2004 2005 2006
China
US
EU

119
Table 12.1 Top Chinese ―Climate-Friendly‖ Exports
HS
Code
Description Net
Exports
($millions)
732111 Solar driven stoves, ranges, grates, cookers (including those with subsidiary
boilers for central heating), barbecues, braziers, gas-rings, plate warmers and
similar non-electric domestic appliances, and parts thereof, of iron or steel.
579
732190 Stoves, ranges, grates, cookers (including those with subsidiary boilers for central
heating), barbecues, braziers, gas-rings, plate warmers and similar non-electric
domestic appliances, and parts thereof, of iron or steel. - Parts.
266
841581 Compression type refrigerating, freezing equipment incorporating a valve for
reversal of cooling/heating cycles (reverse heat pumps)
302
841861 Compression type refrigerating, freezing equipment incorporating a valve for
reversal of cooling/heating cycles (reverse heat pumps)
919
848340 Gears and gearing and other speed changers (specifically for wind turbines) 340
850720 Other leadacid accumulators 935
853710 Photovoltaic system controller 738
854140 Photosensitive semiconductor devices, including photovoltaic cells whether or
not assembled in modules or made up into panels; light emitting diodes
2460
900190 Mirrors of other than glass (specifically for solar concentrator systems) 659
900290 Mirrors of glass (specifically for solar concentrator systems) 441
Source: WITS database
Use of trade restrictive measures for environmental purposes
Countries vary with respect to their vulnerability to climate change and their willingness
to pay to avoid any future damage. Because of the difficulties associated with attaining
the international cooperation that will be needed for effective policies to address climate
change, there is a widespread concern that countries might start using unilateral measures
to address differential attitudes, perceptions, and policy standards. Such unilateral
measures may take the shape of ―trade measures,” such as tariffs or quotas against
countries that do not adhere to similar standards.
Under the WTO, members can adopt measures to protect the environment and human
health and life as long as such measures comply with GATT rules. Articles XX(b) and (g)
allow WTO members to justify trade measures if these are either necessary to protect
human, animal or plant life or health, or if the measures relate to the conservation of
exhaustible natural resources, respectively. Moreover, the chapeau of Article XX
requires that these measures not arbitrarily or unjustifiably discriminate between
countries where the same conditions prevail, nor constitute a disguised barrier to trade.
While no such measures are in place anywhere in the world, two such proposals are
already getting lot of traction and attention both in the EU and the US.
The recent European Commission‘s plans to tighten Europe's greenhouse gas reduction
regime, also recognizes the risk that new legislation could put European companies at a

120
competitive disadvantage compared to countries with less stringent climate protection
laws, such as the US, China and India. According to the Commission, this situation
could cause large "carbon leakages", whereby companies move their activities to other
regions of the world in order to keep costs down. To address this threat, the draft
legislation includes proposals to impose restrictions on imports unless an international
agreement subjecting all industrialized countries to similar climate change mitigation
measures is reached. According to the proposal, such a "carbon equalization system"
could take the form of an obligation for foreign companies doing business in Europe to
obtain emissions permits alongside European competitors.
There are similar proposals in the U.S. Congress attached to future GHG emissions cap-
and-trade legislative proposals.1 If passed in their current form, these bills would require
purchases of greenhouse gas emission allowances in order for imported goods to be
allowed to enter the U.S. from countries that are not making satisfactory efforts to
mitigate greenhouse gas emissions. The requirement for such purchases would be an
alternative to offsetting border measures in the form of tariffs.
In both the US bills, the proposal is to require U.S. importers in some circumstances to
purchase GHG emission allowances. Such a measure could be less vulnerable than a
tariff to challenge in the WTO, because it could more clearly be considered an
environmental measure that would qualify as an exception under GATT Article XX(g),
which allows measures ―relating to the conservation of exhaustible natural resources.‖
The offsetting border provisions in both bills have been carefully crafted to avoid - or
survive if necessary - any challenges in the WTO dispute settlement process.2 There are
provisions, for instance, that would require the U.S. government to enter into negotiations
with foreign governments in an effort to resolve international competitiveness issues and
in advance of any actual imposition of the allowance purchasing requirement.
Legal experts remain divided on whether the EU or the US proposed measures would be
compatible with international trade regulations, as the WTO has no clear provisions on
the subject. On the one hand, border adjustment measures could be considered to
contravene WTO rules prohibiting discrimination between countries or between "like
products." A particularly thorny issue in assessing the compatibility of trade measures
with climate change policy may arise with the application of PPM (Processes and
Production Methods)-based measures. These are measures that may be targeted at the
way products are produced, as opposed to the inherent qualities of the product itself.
Since most climate change measures do not directly target any particular products, but
rather focus on the method by which greenhouse gases may be implicated related to
production, PPM issues are critical for the compatibility analysis. However, the recent
experience of the Shrimp-Turtle dispute suggests that the WTO Dispute Panel and the
1 Two of the many legislative proposals introduced during 2007 are relevant. One is Senate bill 1766,
introduced by Senators Bingaman and Specter; the other is Senate bill 2191, introduced by Senators
Lieberman and Warner. 2 Brewer (2008). Climate Change Policies and Trade Policies: The New Joint Agenda. Georgetown
University. Draft.

121
Appellate Body may have opened the doors to the permissibility of trade measures based
on PPMs.
Nonetheless, both the EU and the US proposals could have significant implications for
China‘s manufacturing trade—especially what can be classified as energy intensive. If
we look at Chinese trade in some of the mostly commonly identifiable energy-intensive
industries— pulp and paper, industrial chemicals, iron and steel, nonmetallic mineral
products, and nonferrous metals—we find that both the imports and exports have
increased considerably over the last ten years and especially in the last five years. While
imports have increased from $65 billion in 2002 to $142 billion in 2006, exports have
increased from $22 billion to $101 billion. While both reflect China‘s status as one of the
fastest growing manufacturing economies during the last decade, the import-export ratio
is rapidly declining suggesting that China is now exporting more than it is importing. It
also suggests the possibility that some industries may have relocated to China from
countries with more stringent climate policies.
The ratio is still, however, less than 1 which suggests that it continues to be a net
importer. This could change as countries in the EU ratchet up their carbon standards to
comply with or in anticipation of any post-Kyoto deal. In terms of bilateral trade the US
and EU account for a large share—the US accounting for a 13 percent of Chinese exports
and EU accounts for 15 percent of its energy intensive exports.
For this report, we did some rough calculations on the impact of the proposed US
measure on Chinese exports. If we assume that proposed measure which requires US
importers to purchase carbon offsets translates into ―tariff equivalents‖ it will roughly be
a function of the global price of carbon. Assuming a 10, 20, and 30 percent tariff
equivalent (based on $per ton carbon) of the proposed measures we estimate the impact
on both Chinese exports and exports of energy intensive commodities. We find that such
a measure could significantly impact China‘s exports in energy intensive sector from 10-
30 percent. While this may deliver some local environmental benefits, the impact on
labor, ancillary industries and regional development could not be understated. For
example, this could impact adversely major steel producing provinces such as Sichuan,
Hebei, and Liaoning.
The calculation does not take into account the trade diversion effects and the impact of a
similar EU measures. Hence the net impact on Chinese exports could be much higher
than projected here.
Table 12.2 Impact of a US trade-related climate measure on Chinese exports
Tariff Equivalent 10% 20% 30%
Energy Intensive
Exports (% loss)
9.9 22.8 31.7
Total Exports (%
loss)
0.4 1.0 1.4

122
Way forward
The trade and the environment debate which has been mainly focused on the impact of
trade on local pollution and on cross-border measures to address transboundary pollution
has resurfaced again--this time strongly in the climate change arena. This is mainly in
the context of trade in clean energy technologies and on the use of trade measures to
combat competitive pressures in developed country industries.
The recent proposals that have surfaced in the European Parliament and the US Congress
are a sign that the issue will remain alive in the global discussions surrounding any future
climate regime. While developed countries remain the largest per capita emitters of
greenhouse gases today, the growth of carbon emissions in the next decades will come
primarily from developing countries, which are following the same energy- and carbon-
intensive development path as did their rich counterparts. Among the developing
countries, the main growth in carbon emissions will emanate from China and India
because of their size and growth.1 Strong economic growth and heavy dependence on
coal in industry and power generation contribute to this trend. There will be thus
increasing pressure on the trade front to redress any competitiveness pressures.
While it is debatable as to what extent these measures are WTO compatible, China
should be prepared to deal with the issue both within and outside the country as the
economic and regional impacts could not be understated.
At the same time, the global climate change awareness and discussions surrounding clean
energy technologies also offer an incredible economic opportunity as China is emerging
as a major producer and exporter of these technologies. It thus becomes important that
China closely participates in the WTO and other forums such as UNFCCC where these
issues are being debated to ensure that its interests are not compromised.
1 More than 70 percent of the world emissions increase from 2020–30 according to the International Energy
Agency is projected to come from non-Annex I (developing) countries. China alone will contribute about a
quarter of the increase in CO2 emissions, or 3.8 Gt, reaching 7.1 Gt in 2030. Its emissions will overtake
those of the United States by 2010.

123
Annexes:
Table 12A.1 List of Submissions to the WTO Environmental Goods and Services Negotiations
Symbol Date Subject/Title Member
TN/TE/W/6 6 June 2002 Environmental Goods New Zealand
TN/TE/W/8 9 July 2002 Negotiations on Environmental
Goods United States
TN/TE/W/14 9 October
2002 Environmental Goods Qatar
TN/TE/W/17 (and
Corr.1)
20 November
2002
Market Access for Non-Agricultural
Products Japan
TN/TE/W/19 –
TN/MA/W/24 (and
Corr.1)
28 January
2003
Negotiations on Environmental
Goods: Efficient, Lower-Carbon
and Pollutant-Emitting Fuels and
Technologies
Qatar
TN/TE/W/27 –
TN/MA/W/33 25 April 2003
Harmonized System (HS)
Classification Codes of Gas-Related
Goods
Qatar
TN/TE/W/34 –
TN/MA/W/18/Add.
4
19 June 2003
Liberalizing Environmental Goods
in the WTO: Approaching the
Definition Issue
United States
TN/TE/W/38 –
TN/MA/W/18/Add.
5
7 July 2003 Contribution on an Environmental
Goods Modality United States
TN/TE/W/42 6 July 2004 Statement on Environmental Goods
at the CTESS Meeting of 22 June
2004
China
TN/TE/W/44 (and
Corr.1)
7 October
2004
Proposed Initial List of
Environmental Goods Chinese Taipei
TN/TE/W/46 10 February
2005 Environmental Goods New Zealand
TN/TE/W/47 17 February
2005
Market Access for Environmental
Goods European Communities
TN/TE/W/47/Add.1 27 June 2005 Market Access for Environmental
Goods - Addendum European Communities
TN/TE/W/48 18 February
2005
Initial List of Environmental Goods
Proposed Republic of Korea
TN/TE/W/49 26 May 2005 Environmental Goods New Zealand
TN/TE/W/49/Suppl.
1 16 June 2005
Environmental Goods, Statement at
the CTESS Informal Meeting of 10
June 2005 - Supplement
New Zealand
TN/TE/W/50 2 June 2005 Canada's Initial List of
Environmental Goods Canada
TN/TE/W/50/Suppl.
1 1 July 2005
Canada's Initial List of
Environmental Goods - Supplement Canada
TN/TE/W/51 3 June 2005
An Alternative Approach for
Negotiations under
Paragraph 31(iii)
India
TN/TE/W/52 1 July 2005 Initial List of Environmental Goods United States

124
Symbol Date Subject/Title Member
TN/TE/W/54 4 July 2005 Structural Dimensions of the
Environmental Project Approach India
TN/TE/W/55 5 July 2005 Environmental Goods Cuba
TN/TE/W/56 5 July 2005 EC Submission on Environmental
Goods European Communities
TN/TE/W/57 6 July 2005 Environmental Goods Switzerland
TN/TE/W/59 8 July 2005 Environmental Goods for
Development Brazil
TN/TE/W/57/Corr.1 14 September
2005 Environmental Goods Switzerland
TN/TE/W/60 19 September
2005
Procedural and Technical Aspects
of the Environmental Project
Approach
India
TN/TE/W/49/Rev.1 12 October
2005
Revised New Zealand Provisional
List of Environmental Goods New Zealand
TN/TE/W/62 14 October
2005
Integrated Proposal on
Environmental Goods for
Development
Argentina
TN/TE/W/64 20 February
2006
Continued Work Under Paragraph
31(iii) of the Doha Declaration United States
TN/TE/W/67 13 June 2006 Environmental Project Approach -
Compatibility and Criteria India
TN/TE/W/69 30 June 2006
The Development Dimension as an
Integral Part of the Negotiations On
Environmental Goods: The
Principle of Special and Differential
Treatment
Cuba
TN/TE/W/49/Rev.2 30 June 2006 Market Access for Environmental
Goods: Revised New Zealand List New Zealand
TN/TE/W/50/Rev.1 4 July2 006 Canada's Revised List of
Environmental Goods Canada
JOB (07)/54 27 April 2007 Continued Work Under Para 31 (iii)
of the Doha Ministerial Declaration
Canada, the European
Communities, Japan,
Korea, New Zealand,
Norway, the Separate
Customs Territory of
Taiwan, Penghu, Kinmen
and Matsu, Switzerland
and the United States of
America
JOB (07)/146 1 October
2007
Environmental Goods for
Development-Paragraph 31 (iii) Brazil
JOB(07)/161 30 October
2007
Environmental Goods and Services
for Development Peru

125
Symbol Date Subject/Title Member
JOB(07)/193 30 November
2007
Proposal for a Result Under
Paragraph 31 (iii) of the Doha
Ministerial Declaration
United States and the
European Communities
Table 12A.2 List of Climate-Friendly Technologies
HS Code Product Description
392010 PVC or polyethylene plastic membrane systems to provide an impermeable
base for landfill sites and protect soil under gas stations, oil refineries, etc.
from infiltration by pollutants and for reinforcement of soil
560314 Non-wovens, whether or not impregnated, coated, covered or laminated: of
manmade filaments; weighing more than 150 g/m2 for filtering wastewater
701931 Thin sheets (voiles), webs, mats, mattresses, boards, and similar nonwoven
products
730820 Towers and lattice masts for wind turbine
730900 Containers of any material, of any form, for liquid or solid waste, including for
municipal or dangerous waste.
732111 Solar driven stoves, ranges, grates, cookers (including those with subsidiary
boilers for central heating), barbecues, braziers, gas-rings, plate warmers and
similar non-electric domestic appliances, and parts thereof, of iron or steel
732190 Stoves, ranges, grates, cookers (including those with subsidiary boilers for
central heating), barbecues, braziers, gas-rings, plate warmers and similar non-
electric domestic appliances, and parts thereof, of iron or steel—Parts
732490 Water saving shower.
761100 Aluminium reservoirs, tanks, vats and similar containers for any material
(specifically tanks or vats for anaerobic digesters for biomass gasification)
761290 Containers of any material, of any form, for liquid or solid waste, including for
municipal or dangerous waste
840219 Vapor generating boilers, not elsewhere specified or included hybrid
840290 Super-heated water boilers and parts of steam generating boilers
840410 Auxiliary plant for steam, water, and central boiler
840490 Parts for auxiliary plant for boilers, condensers for steam, vapor power unit
840510 Producer gas or water gas generators, with or without purifiers
840681 Turbines, steam and other vapor, over 40 MW, not elsewhere specified or
included
841011 Hydraulic turbines and water wheels of a power not exceeding 1,000 kW
841090 Hydraulic turbines and water wheels; parts, including regulators
841181 Gas turbines of a power not exceeding 5,000 kW
841182 Gas turbines of a power exceeding 5,000 kW
841581 Compression type refrigerating, freezing equipment incorporating a valve for
reversal of cooling/heating cycles (reverse heat pumps)

126
841861 Compression type refrigerating, freezing equipment incorporating a valve for
reversal of cooling/heating cycles (reverse heat pumps)
841869 Compression type refrigerating, freezing equipment incorporating a valve for
reversal of cooling/heating cycles (reverse heat pumps)
841919 Solar boiler (water heater)
841940 Distilling or rectifying plant
841950 Solar collector and solar system controller, heat exchanger
841989 Machinery, plant or laboratory equipment whether or not electrically heated
(excluding furnaces, ovens etc.) for treatment of materials by a process
involving a change of temperature such a heating, cooking, roasting, distilling,
rectifying, sterilizing, steaming, drying, evaporating, vaporizing, condensing or
cooling.
841990 Medical, surgical or laboratory stabilizers
848340 Gears and gearing and other speed changers (specifically for wind turbines)
848360 Clutches and universal joints (specifically for wind turbines)
850161 AC generators not exceeding 75 kVA (specifically for all electricity generating
renewable energy plants)
850162 AC generators exceeding 75 kVA but not 375 kVA (specifically for all
electricity generating renewable energy plants)
850163 AC generators not exceeding 375 kVA but not 750 kVA (specifically for all
electricity generating renewable energy plants)
850164 AC generators exceeding 750 kVA (specifically for all electricity generating
renewable energy plants)
850231 Electric generating sets and rotary converters; wind-powered
850680 Fuel cells use hydrogen or hydrogen-containing fuels such as methane to
produce an electric current, through a electrochemical process rather than
combustion
850720 Other lead acid accumulators
853710 Photovoltaic system controller
854140 Photosensitive semiconductor devices, including photovoltaic cells whether or
not assembled in modules or made up into panels; light emitting diodes
900190 Mirrors of other than glass (specifically for solar concentrator systems)
900290 Mirrors of glass (specifically for solar concentrator systems)
903210 Thermostats
903220 Manostats

127
Part III Promoting Trade in Services
Linda Schmid1
13 Trade in Services Overview
Services industries are an increasingly important component of domestic economic
development and international trade. In developed and developing economies, services
represent, on average, a substantial proportion of employment and GDP as illustrated in
Figure 13.1. As incomes rise and basic needs are met, individuals generally spend a
greater amount of their income on services. In addition, the division of economic
production processes into discrete activities has given rise to specialized intermediate
services that represent crucial inputs to agricultural and manufacturing as well as services
production. The cost and quality of services influence the productivity of all sectors of
the economy including the efficacy of the public sector as a significant user of services.
Figure 13.1 Services Value Added (% of GDP)
Source: World Bank world development indicators database
http://www.worldbank.org
Increasing international trade in services
Services have become a valuable component of international trade consistently
representing approximately 1/5 of world trade. In 2006, world commercial services
exports including transportation, travel and other commercial services totaled $2.7 trillion
with other commercial services representing almost 50% of the total.2 Technological
1 Linda Schmid is an independent consultant on international trade policy and development. She served as
the Trade in Services Officer, International Trade Centre, Geneva. She acted as Trade Director, Caribbean
Trade and Competitiveness Program, Barbados. She is a contributing author to Managing the Challenges
of WTO Participation, Cambridge University Press 2005. E-mail: [email protected]. 2 Other commercial services encompass communications, construction, insurance, financial, computer and
information, royalties and license fees, other business services and personal, cultural, and recreational

128
progress has boosted trade in communication, construction, insurance, financial,
computer, business, and personal services. The advent of the Internet, lower costs of
travel, and more open investment regimes have allowed commercial service firms to find,
market and serve clients around the world. This is reflected in the services proportion of
global foreign direct investment (FDI) stock, which stood at 61% in 2005 with inward
flows focused on finance, business activities, and trade.1
Means of trading services
A commercially valuable means of trading services is via establishment.2 According to
the WTO, trade in commercial services provided through establishment surpasses all
other modes of supply.3 In part, this is due to the nature of services and the importance of
language in services development and delivery, "geographic and linguistic proximity are
key determinants of the level of services trade between two countries."4 The business
return on familiarity with clients draws firms close to their customer base. "Customers
constitute the single most important source of information for innovative ideas"
according to representatives from communications, financial, and technical business
service firms.5 Services are also generally considered ―intangible‖ and difficult to
evaluate before their delivery. As a consequence, successful service providers work hard
to establish their credibility, build their reputation, and effectively communicate with
clients. Establishing in a market of export interest is a practical means of deepening
commercial relationships with clients.
The business case for establishing locally is also a reflection of remaining constraints to
trade in services. Legislation, government rules, and administrative procedures remain
the most significant barriers to trade in services and establishing a local office is a viable
way to manage regulatory requirements. Those sectors that are heavily regulated, for
example, banking, insurance, securities, telecommunications, and professional services
may earn a greater return from familiarity with local laws and administrative procedures.
Local qualification requirements, joint venture rules, and residency stipulations also
propel local establishment. Pragmatic service firms recognize these obstacles and many
work through them by establishing a local office, in conjunction with providing services
online, via consumption abroad, and through temporary movement of people.
State of the art services firms employ all modes of supply in the intricate value chain of
developing, marketing, and delivering services. For example, outsourcing firms may use
services reflecting IMF Balance of Payments categorization. World Trade Organization (2007)
International Trade Statistics 1 United Nations Conference on Trade and Development (2007) World Investment Report
2 The 4 modes of supply of services include: mode 1: cross-border, mode 2: consumption abroad, mode 3:
commercial presence also known as establishment, and mode 4: movement of natural persons. For a
comprehensive explanation see World Trade Organization (2005) A Handbook on the GATS Agreement 3 World Trade Organization (2007)
4 Janet Ceglowski (2006) "Does Gravity Matter in a Service Economy?" Review of World Economics
Vol.142, No. 2, p 307-329 5 Guy Gellatly, Valerie Peeters (1999) Understanding the Innovation Process: Innovation and Dynamic
Service Industries Statistics Canada

129
an online presence to market to clients, provide services, and deliver after sales service.
They will also invite clients to visit services facilities and monitor operations over the life
of the contract. As another example, educational providers and tourism establishments
will attract customers to university and hotel locations, and use other modes to initially
reach clients, provide information, and obtain payment. Engineers and accountants may
travel abroad to meet clients and deliver services electronically. Policymakers interested
in expanding service exports can work to reduce trade restrictions in export markets of
interest in all modes of supply. Examples of common restrictions are presented in table
13.1.
Table 13.1 Examples of Restrictions on Trade in Services
Administrative rules and procedures that are difficult to obtain and understand
Limitations on the geographic scope of operations of the firm
Limitations on the percentage of foreign ownership of the firm
Restrictions on the availability of foreign currency to purchase services abroad
Requirements for the formation of a joint venture or specific corporate structure
Limitations on firm's ability to use its company name
Requirements that local marketing and advertising firms be used
Prohibitions on the provision of a service by a foreign firm
Restrictions on foreign participation in government procurement processes
Unduly burdensome limitations on movement of natural persons across borders
Source: World Trade Organization (2005) A Handbook on the GATS Agreement
Key factor inputs to services production
Service industries are reliant on key inputs that public policy can foster. In general terms,
labor, technology, finance, and energy are critical factors of production in service
industries. In high-growth value added services the level of education and expertise of
employees is a significant input needed to deliver professional, medical, and research
services, for example. The scope and quality of primary, secondary and tertiary education
is therefore important to producing a pool of well-qualified individuals capable of
working in a variety of services fields. Furthermore, the ability to provide adult
education to enhance skills and provide retraining in support of labor flexibility also
accommodates the comparatively rapid business life cycles of service industries where
employee turnover and dislocation is prevalent. Related to the importance of education is
the ability to attract and facilitate the movement of service industry experts across
borders, particularly in those service sectors where a domestic competence does not exist
or would take many years to develop.
A supportive policy environment can facilitate trade in key inputs to ensure quality and
competitively priced technology products, communications, energy, and financial
services. Service firms use technology to produce and deliver services. As a
consequence, service firms require access to economically priced and high-quality
information technology products as well as robust communications infrastructure.1
1 The General Agreement on Trade in Services (GATS), under the WTO, recognizes telecommunications as
a conduit for international services and as an important service. WTO members‘ commitments in the

130
Given their reliance on technology and dependence on communications, service firms
need consistent and economically priced energy services. In terms of finance, service
firms in emerging markets consistently bemoan the inability of financial institutions to
understand their business model and offer financial products that do not rely solely on the
possession of physical assets. Service firms require appropriate financing that values
forward contracts and unique methods of services production. Economies that facilitate
trade in service inputs can help eliminate potential constraints to service industry
expansion. The condition of domestic institutions also influences the scope and depth of
the services economy.
Fundamental policy environment
There is a fundamental policy environment that supports the development of service
industries. Its foundation is a functioning judicial infrastructure that enforces the validity
of contracts and fair play in the marketplace. Regulatory institutions sit on top of this
foundation. Whether regulatory institutions are sector specific or provide supervision
across services sectors, they are critical for market oversight, to protect against market
failures, ensure corporate behavior, and achieve societal objectives. Regulatory
institutions must also be free from undue political interference that would prejudice their
treatment of firms in the marketplace. Their integrity and ability to carry out their duties
efficiently and without favoritism toward one firm or another provides predictability and
confidence in market operations for service industry investors and users. The ability of
regulatory institutions to oversee a market with transparency and restraint will also
influence the fluidity and ease of doing business in the services economy.
Regulatory institutions must also keep pace with the constant evolution of service
industries, increased international trade, and changing market dynamics. Regulatory
institutions require staff with industry expertise, adequate financing to carry out
regulatory duties, and appropriate enforcement powers to discipline actors in the
marketplace. Globalization is propelling regulatory institutions to cooperate across
borders and work together in international forums to keep pace with ever evolving rules.
Developed and emerging economies must also guard against capture of regulatory
institutions by industry interests. For example, the recent fallout in the sub-prime lending
market, in the United States, due to lax state and federal oversight of lending standards,
risk assessment, and securitization processes exemplifies the constant struggle to
maintain expert and vigilant regulatory institutions even in developed economies.
Transparency, competition, & innovation
Judicial and regulatory institutions are responsible for creating an environment that is
conducive to service industry development. This environment is defined by transparency
and crafted with policies that support investment, competition, and innovation.
Transparency in the development and implementation of rules helps service firms to
GATS, Annex on Financial Services, and Annex on Telecommunications, as well as support of the
Information Technology Agreement facilitate trade in service industry inputs.

131
understand and plan for government measures that will bear on operations. The provision
of information about laws, regulations, and procedures directly affecting service
industries reduces uncertainty, risk, and lowers investment costs. Transparency extends
to information about market participants and disclosure requirements reflect the value
information holds for entities operating in the marketplace. Coupled with comprehensive
and quality economic data, market information contributes to stability and service
industry growth. Service firms thrive when they understand rules, their position in the
marketplace vis-à-vis other firms, and the economic variables in the market.
Governments use a variety of means to promote transparency including legislating and
implementing administrative procedures that ensure that information is available to
market participants and that their service industry knowledge is integrated into the
formulation of rules governing the sector. Governments publish notices of rule makings,
formally request public input, and hold hearings, for example, to gather information, and
make informed policy decisions. Governments maintain and enforce disclosure
requirements and support comprehensive and quality economic data collection. They
facilitate a robust services policy dialogue by providing transparent rulemaking procedures,
mandating corporate disclosure, and supporting the collection of comprehensive and quality data
and its timely release.
Services policy dialogue
Services policy dialogue and information flow contribute to the development of rules for
a variety of service industry sectors. The rapid development of service industry products
makes it difficult for regulators to understand the nuances of service industry production
and delivery and the consequent implications for public policy. For example, information
technology services exemplify a rapidly developing sector with domestic and
international policy implications in many cases uniquely identifiable by information
technology providers. As participants in the market, information technology providers
can identify production constraints, business models, and delivery systems, for example,
important to policymakers. Consistent and comprehensive services policy dialogue, as
illustrated in Figure 13.2, enables the government to stay abreast of evolving service
industries.
Figure 13.2 Services Policy Dialogue in a Supportive Environment

132
14 Lessons From Leaders In Services Trade
The leaders in trade in services offer insight into the development and oversight of
services economies. Trade in communication, construction, insurance, financial,
computer, business, and personal services is led by selected economies. For example in
2006, as illustrated in table 14.1, the European Union (25) exported the greatest share of
other commercial services at 49.6%, followed by the United States at 15.4%, Japan at 5%,
India at 4.2%, and Hong Kong at 2.8 %. Singapore exported a share of 2.3% and the
Republic of Korea exported a share of 1.4%. Each economy offers important insight into
the development of their services economy, important policy trends, and lessons to learn.
Table 14.1 Leading Exporters of Other Commercial Services for 2006
(billion dollars and percentage) Value Share
2006 2000 2006
European Union (25) 683.7 45.7 49.6
United States 211.9 19.5 15.4
Japan 69.0 5.9 5.0
India 58.3 4.2
Hong Kong, China 39.0 3.3 2.8
China 36.5 1.5 2.6
Switzerland 34.0 2.4 2.5
Canada 32.4 3.1 2.3
Singapore 31 1.7 2.3
Korea, Republic of 19.2 1.4 1.4
Source: WTO1
Korea
Korea offers lessons in how an economy that experienced exceptional success in export
manufacturing revisits its policy environment to re-energize growth through the
correction of weaknesses in its services economy. Despite its manufacturing prowess,
Korea has a low productivity rate in services relative to other developed economies.
Korea implemented a strategy to open the economy to attract service industry expertise,
improve the regulatory environment, and increase competition in the domestic market.
The government created targeted incentive programs to strengthen tourism, logistics,
engineering, and manufacturing assisting services. Korea is also poised to reformulate its
approach to financial services regulation to broaden and deepen its capital markets.
These measures indicate that government can work on a variety of fronts to develop
services market.
1 World Trade Organization (2007)

133
Korea has historically had relatively low productivity in the services sector compared to
other economies of its stature due to several factors. In contrast to many OECD countries,
Korea had low labor productivity in services, less service exports, and negative to
minimal total factor productivity growth in certain service sectors due to the regulatory
environment.1 Starting a business in Korea took time and administrative dexterity,
which increases the cost of investment and administrative overhead.2 A variety of
government supports delayed closure of unprofitable firms, which reduced competitive
pressure to improve processes and use of resources. 3
Government measures also limited
competition in the domestic market by favoring national champions and restricting
foreign providers.4 In addition, in Korea, services represent a low percentage of total
value-added as exhibited in Figure 14.1. These challenges in the domestic market inhibit
the ability of service firms to achieve a competitive posture necessary for export growth.
Figure 14.1 Korea % Value Added by Activity
Source: OECD country statistical profiles 2007 http://stats.oecd.org
Market access stance
To attract service industry expertise, lower costs, and improve efficiency, Korea is using
trade arrangements to signal to investors that expanded investment in a wide variety of
services is welcome. For example, Korea's Revised Offer on Services conveyed to WTO
members in May of 2005 proposes to eliminate substantial limitations on market access
and national treatment and provides additional commitments in a wide array of service
sectors. Korea's proposed removal of equity limitations across sectors, additional
commitments on legal, accountancy, and architectural services, and new bindings in
research and development attest to Korea's willingness to lift barriers that inhibited
investment and movement of people in the services sector.5 Korea is also using bilateral
1 International Monetary Fund (2006) ―Korea's Transition to a Knowledge-Based Economy: Prospects and
Challenges Ahead‖ Republic of Korea: Selected Issues 2 International Monetary Fund (2006)
3 International Monetary Fund (2006)
4 International Monetary Fund (2006)
5 World Trade Organization (2005) Republic of Korea Revised Offer on Services
0
5
10
15
20
25
2001 2002 2003 2004 2005
construction
transport, trade,
hotels and
restaurants
banks, insurance,
real estate, other
business services
government, health,
education, and other
personal services

134
arrangements to affirm its resolve to provide transparency in the development and
implementation of government measures that influence service industries.1
Regulatory reform
Korea simplified administrative procedures and increased transparency to improve the
environment for service industries. Korea established a Regulatory Reform Committee,
which cut regulations in half and refined the remaining rules in 1998.2 Korea now uses
the Internet to make regulations available and speed application processes.3 Table 14.2
identifies how Korea improved transparency. Korea's exceptional broadband
deployment4 and its electronic government initiative will reduce administrative and
transaction costs for service firms.
Table 14.2 Korea's Focus on Transparency in the Marketplace
Refined rules
Increased availability of rules
Established electronic processes to easily adhere to rules
Expanded corporate disclosure requirements
Expanded consultation with market participants
Strengthened independence of auditors
Source: OECD5
Competition policy
Korea refined competition policy to curb anti-competitive practices and improve the cost
and quality of services. Korea amended the 1980 Monopoly Regulation and Fair Trade
Act in 20026 prohibiting collusive fee setting arrangements in nine professional service
sectors, reduced the market position of "Chaebols", and expanded investigatory and
enforcement authority of the Korea Fair Trade Commission (KFTC). 7
With the 2002
amended Act, competition oversight activities have included examination of specific
service sectors, for example, construction, media, education, banking, insurance, and real
estate. 8
These changes illustrated in table 14.3 helped create a more competitive
environment for service industries. According to the World Economic Forum's Global
Competitiveness Index, Korea's 2007/2008 ranking rose to 11 from a previous rank of 23.
1 Korea US Free Trade Agreement (2007) ―Chapter 12 Cross-Border Trade in Services‖
http://www.ustr.gov 2 Organization of Economic Cooperation and Development (2007) Korea: Progress in Implementing
Regulatory Reform. 3 Organization of Economic Cooperation and Development (2007)
4 The ITU ranks the Republic of Korea just behind Denmark, the Netherlands, Iceland, and Switzerland in
broadband penetration at 29.27%. International Telecommunication Union Economies by Broadband
Penetration 2006 http://www.itu.int 5 Organization of Economic Cooperation and Development (2007)
6 World Trade Organization (2004) Trade Policy Review Republic of Korea Report by the Secretariat
7 World Trade Organization (2004)
8 World Trade Organization (2004)

135
Table 14.3 Korea's Focus on Competition Policy
Reassessed structures and activities of conglomerates*
Prohibited specific cartels in services*
Increased penalties for anti-competitive practices*
Clearly defined and expanded business misconduct*
Strengthened oversight of mergers and acquisitions*
Expanded authority of KFTC to investigate, penalize, and refer for criminal prosecution*
Organized KFTC by investigative function*
KFTC regularly hosts academic and business sectors to study competition issues+
KFTC regularly cross trains officials through "case study presentations" to expand
competence across the Commission+
KFTC regularly works with international counterparts in developed economies+
Source: *WTO1 & +International Competition Network2
Incentives
Korea maintains targeted incentive measures to boost productivity in service sectors.
These are primarily tax incentives and lower minimal investment levels for greenfield
investments in tourism, logistics, and engineering services. 3
Korea also offers incentives
to attract experts from abroad. In the past, Korea worked to attract service industry
expertise in telecommunications. A retired AT&T executive related the experience of
Korean telecom officials visiting the US and meeting with telecommunications
technicians who were Korean expatriates. The Korean officials offered the expatriates
attractive incentives to return home to help build Korea's telecommunications
infrastructure.4 In 2003 and 2004, Korea established free economic zones to welcome
foreigners with specialized skills with comfortable living conditions in Incheon as well as
the Busan and Gwangyang ports.5
Finance
Korean firms have had difficulty accessing finance given strict collateral requirements
and limited availability of venture capital, which constrained the growth of service firms
and the creation of new service enterprises. 6
Financing constraints also limited
investment in technology important to service sector efficiency. 7
To alleviate these
constraints, Korea is emulating London's deregulation of its financial sector with the
Korean Capital Markets Integration Act. The Act will change Korea's supervisory
approach from a prescriptive to a more principles-based system. The purpose of the
restructuring is to help raise the standards of the capital market and expand the types of
financial services products available to investors and service industries. The Act is also
intended to better position Korea as a regional financial services hub and propel its
1 World Trade Organization (2004)
2 International Competition Network (2003) Capacity Building and Technical Assistance: Building
Credible Competition Authorities in Developing and Transition Economies 3 World Trade Organization (2004)
4 Interview (February, 2008) Retired AT&T Executive
5 World Trade Organization (2004)
6 International Monetary Fund (2006)
7 International Monetary Fund (2006)

136
economy into higher value-added services.1 Table 14.4 captures tools to improve the
services economy and trade.
Table 14.4 Examples of Korean Service Industry Policy Tools
Korea,
Republic of
Domestic
Capacity
Competition
policy & IPR
Investment
Environmrnt
Service sectors Trade promotion Regulation Trade
arrangements
Services are a
rising share of
employment
at 72.1% in
03'
Preeminent
in
broadband
deployment
Privatizing
&
unbundling,
energy
sector
Significant
reform in
the banking
sector
Legislation
amended 02'
Limiting
position of
"Chaebols"
The Korea Fair
Trade
Commission -
staff structure
adjusted for
new priorities
Lowering FDI
restrictions to
increase
competition and
boost domestic
productivity in
services
Historically low
productivity in
services due to
market entry
barriers, slow
corporate exit
from markets ,
limited
competition
(OECD)
Tax, credit &
equity support
Working to attract
service industry
experts from
abroad
Established
Regulatory
Reform
Committee to
reduce
unnecessary
regulation
Revised
administrativ
e rules to
increase
transparency
Affirmative
market access
stance
Proposed
multilateral
bindings
Services
provisions in
bilaterals
Source: WTO2
India
India maintains a global footprint in information and business processing outsourcing,
however, bottlenecks in infrastructure services create constraints across agriculture,
manufacturing, and service industries. India's dramatic emergence in the global
information technology services market highlights the benefit of investment in education
as a fundamental element of trade capacity building. In 2005, behind the European
Union, India was the largest exporter of computer and information services valued at
$16,091 million.3 At the same time, the stark differences in the development of India's
service sectors and their impact on the larger economy illustrate the importance of
attending to growth in all services. Furthermore service firms expend excessive
resources working to navigate regulatory procedures and corruption. Weaknesses in
service infrastructure and poor performance in the public sector has left many Indian
citizens behind economically, "India still has the highest concentration of poor people in
the world."4
The boom in India's information technology service sector is attributed to high returns on
educational investment in tertiary education. India's establishment of institutes of
1 Anna Fifield, ―Seoul looks to echo London 'big bang'‖ Financial Times London (UK): 26 June, 2007 p.
10. . 2 World Trade Organization (2004)
3 World Trade Organization (2007) International Trade Statistics
4 International Monetary Fund (2008) ―Inclusive Growth‖ India: Selected Issues

137
technology focused on engineering and science created a large pool of technical workers
prepared for the dynamic growth in services outsourcing and off-shoring. English
language capability was particularly beneficial in tapping into the global market. "India
boasts the largest pool of English-speaking knowledge workers in the world after the
USA."1 Enterprise zones at the state level lifted the traditional Indian industrial "license,
permit, quota" regime that had severely depressed economic productivity in the past.2 In
1991, India also reduced trade barriers, lowered tax rates, lifted many investment
restrictions and liberalized currency controls to engage internationally.3 Investment in
submarine cables for digital transmission of data helped position India for service
outsourcing. All of these factors enabled Indian information-technology firms to take
advantage of the business opportunity offered by Y2K adjustments to computer systems
around the world. Indian entrepreneurs successfully executed Y2K modifications for
multinationals and established a reputation in business process outsourcing.4
Education
Despite this success in computer and information services, severe shortcomings in service
infrastructure leave many behind. Recent studies identified educational attainment,
access to infrastructure, and financial sector development as influential in creating
inclusive growth.5 In the education sector, India invested heavily in tertiary educational
institutions. The initial Indian Institute of Technology was established in 1950 in West
Bengal, eight years later a second was established in Bombay, other institutes followed in
Madras (1959), Kanpur (1960), Delhi (1961), and Guwahati (1995).6 Yet dismal delivery
of primary and secondary education limited educational attainment for many. The
illiteracy rate in India stands at just under 40%7 making it difficult for these individuals to
move into jobs in industry or services. Although the government is working to improve
delivery of educational services and public expenditure on education represents 3.8% of
GDP, the combined gross enrollment ratio for primary, secondary, and tertiary education
stands at a comparatively low 63.8%.8 Furthermore, press reports suggest that education
reform remains stymied by discriminatory attitudes.9
Infrastructure bottlenecks
India has used a spectrum of approaches to improve service infrastructure. A more open
investment environment in telecommunications and air transport has decidedly improved
quality, cost, and scope in both sectors. In 1994, India ended the state monopoly in air
1 Sanjay M. Nadkarni, (June 2005) "The Knowledge Economy in India" Asian Business & Management
Vol. 4, Iss. 2; p. 213 2 Gurcharan Das, July/August (2006) ―The India Model‖ Foreign Affairs
3 Das, (2006)
4 Interview (January, 2008) Representative US India Business Council
5 International Monetary Fund (2008) ―Inclusive Growth‖ India: Selected Issues
6 Indian Institutes of Technology Alumni ITT History http://www.iit.org
7United Nations (2008) UN Human Development Report 2007/2008
8 United Nations (2008)
9 Somini Sengupta, (17 January, 2008) ―Education Push Yields Little for India's Poor‖ The New York
Times

138
transport services, opened it to competition, and lowered explicit market entry restrictions
and pricing controls. 1
These reforms effectively reduced costs and increased penetration
rates in air transport.2
With a similar approach, India experienced dramatic
improvements in telecommunications infrastructure.3
India's "telecommunications
network has become the third largest in the world;" with greater competition, penetration
of broadband could expand.4
India is working to reduce bottlenecks in road, rail, and maritime with public private
partnerships. "The lack of adequate ports, roads and power supplies are one of the main
obstacles hindering India's economic development."5 The government promotes private-
public partnerships to leverage investment in road transport using a build, operate,
transfer format.6 In railway, the government maintains a monopoly, however, welcomes
public private partnerships in ancillary freight operations.7 In shipping, India allows
100% foreign investment, yet restrictions remain on carriage of public cargo. 8
The
government is also using public private partnerships to upgrade port facilities and
operations. 9
Public private partnerships are enmeshed with the traditional Indian
regulatory regime and implementation hurdles include overlapping regulatory mandates,
convoluted approval processes, and opaque government procurement processes. 10
Financial infrastructure
India's government is committed to building on the substantial expansion of the financial
sector in the last decade. In 2006, public-sector banks controlled 72% of total assets and
the government maintains lending requirements for agriculture and small-scale
industries.11
Micro-credit is also widely available for production including retail.12
Private and foreign banks are present in the market and bank credit grew at a 31% rate in
2005/06.13
Although the government recognizes that the corporate debt and bond market
are underdeveloped, "little progress has been made because of the multiplicity of
agencies that need to agree to move the market forward."14
In addition, although
disclosure requirements are substantial, data is sometimes difficult to obtain. India
marginally lifted foreign investment restrictions in banking and is working to improve
1 World Trade Organization (2007) Trade Policy Review Report by the Secretariat India
2 World Trade Organization (2007) Trade Policy Review Report by the Secretariat India
3 Asia-Pacific Telecommunity Yearbook 2006
4 Organization for Economic Cooperation and Development (2007) Economic Survey of India 2007:
Removing Infrastructure Bottlenecks 5 ―India Turns a Corner‖ Trade Finance January (2007)
6 World Trade Organization (2007) Trade Policy Review Report by the Secretariat India
7 World Trade Organization (2007) Trade Policy Review Report by the Secretariat India
8 World Trade Organization (2007) Trade Policy Review Report by the Secretariat India
9 World Trade Organization (2007) Trade Policy Review Report by the Secretariat India
10 Organization for Economic Cooperation and Development (2007)
11 World Trade Organization (2007) Trade Policy Review Report by the Secretariat India
12 Palaniappan Chidambaram, Finance Minister of India, (September 25, 2007) Remarks on India's
Economic Growth and Outlook before the Peterson Institute for International Economics 13
World Trade Organization (2007) Trade Policy Review Report by the Secretariat India 14
Geraldine Lamb, (January 1, 2008) ―Davos: Indian Capital Markets‖ The Banker

139
corporate governance and transparency. The Government is amending prudential
requirements in view of international standards to strengthen the sector.1
Regulatory environment
Regulatory oversight and administration remain problematic in India. For example in
2007, India ranked 48.3 on a scale of zero to 100 in regulatory quality according to
Governance Indicators of the World Bank.2
India scored 3.5 on Transparency
International's Corruption Perceptions Index on a scale of one to 10 signifying a low level
of confidence in the public sector.3
For service industries, the practical effect of poor regulatory and administrative quality is
the use of service industry resources for opaque and questionable compliance
requirements rather than service industry production. This opportunity cost is at the
expense of investment in new product development or technology, for example.
Furthermore, service firms competing internationally are at a disadvantage, when their
domestic regulatory environment remains at a sub optimum level. Table 14.5 indicates
the effects of an opaque regulatory environment.
Table 14.5 Impact of Poor Regulatory & Administrative Quality on Service Firms
Unnecessarily absorbs service industry productive resources
time
capital
management expertise
Raises costs of market entry to new firms
subdues competition
slows rate of innovation
Deters new or additional investment
raises initial capital investment required due to excessive compliance
activities above the norm of gathering data, record-keeping, supplying information
to authorities
Depresses total factor productivity growth
Source: Regulation and Productivity Performance 20064
India's ability to free computer and information services from the historically burdensome
Indian regulatory regime has made service exports an engine of growth and catalyst for
reform. Indian service firms expanding capabilities into different services sectors also
provide returns. For example, Reliance Industries is using its business acumen gained in
telecommunications and financial services and applying it to energy services.5 Indian
services firms are also using overseas expansion to acquire new skills and reach more
clients. Within the private sector, India maintains the expertise to rapidly institute
electronic government to ease the process of doing business across the rest of the
1 World Trade Organization (2007) Trade Policy Review Report by the Secretariat India
2 World Bank (2007) Governance Indicators Regulatory Quality
3 Transparency International (2007) Corruption Perceptions Index http://www.transparency.org
4 Nicholas Crafts, (2006) ―Regulation and Productivity Performance‖ Oxford Review of Economic Policy
Vol. 22 No.2 5 Sundeep Tucker, (13 January, 2008) ―Reliance Can Do No Wrong in the Eyes of Indians‖ Financial Times

140
economy. India's exceptional success in export of computer and information services has
delivered employment, growth in associated sectors, and a rationale for the government
to reassess its handling of infrastructure and regulatory oversight.
European Union
The EU offers practical approaches to minimize obstacles to growth in trade in services
within an economic entity, which are possibly applicable to potential constraints to trade
in services among provinces in China. The European Union taken as a block of 25
members represents the largest services exporter in the world as illustrated in Figure 14.2.
The variation in government policies among the 25 members and the EU's continued
drive towards integration offers practical approaches to strengthening services trade
within an economic entity and with the rest of the world. The scope of the EUs Services
Directive is particularly instructive in identifying important issues originating from
services trade. Furthermore, the scope and depth of the EUs services trade with the
United States and the efforts they are now making to integrate their services economies
exemplifies the key issues facing the growth of developed services economies.
Figure 14.2 2006 Commercial Services Exports (Million US$)
Source: WTO1
Process barriers
The EU is using a Services Directive to ameliorate barriers to services trade through
pragmatic and practical means in professional, business, distribution, tourism,
construction, education, and real estate services. The European Union identified
obstacles that are impeding service firms within the 25 member countries from trading
with each other. For example, in some cases, companies wait months or years to obtain
the licenses and permits required to open a new office. Companies who submit such
1 World Trade Organization (2007) International Trade Statistics
0
100,000
200,000
300,000
400,000
500,000
600,000
China EU (25) Hong Kong
SAR
India Japan Korea,
Republic of
Singapore United
States
Transportation Travel Other Commercial Services

141
applications may never receive any response from officials. Service firms are sometimes
subject to "economic needs tests" to demonstrate their business will not upset local
competitors. The EU recognizes that such tests enable government officials to make
arbitrary perhaps discriminatory decisions and noted that a single firm seeking to enter 22
EU services markets spent €5.9 million in application fees. As another example of the
obstacles inhibiting services trade, the EU identified inadequate cooperation among
regulatory authorities, with regard to sharing basic corporate registration information.1
These examples demonstrate the importance of working with regulatory and
administrative authorities to reduce "process" barriers.
Regulatory barriers
In the case of cross-border trade, the EU found that firms had spent as much as "3% of
annual turnover" examining the scope of legal stipulations of two countries of export
market interest. Firms from the EU found other EU markets maintained capital adequacy
requirements in combination with stipulations for personal guarantees so excessive that
the companies decided to enter non-EU markets. Recreational access fees were also
discriminatory to EU citizens from different countries. The EU also assessed the cost of
determining the "legal and administrative formalities" in one market from €80,000 to
€160,000. These examples illustrate the need to review specific rules to determine their
purpose, if they are achieving that purpose, and if a less trade restrictive rule could be
used.
Practical tools
The Services Directive uses practical tools to streamline regulatory processes and reduce
barriers. To track implementation, the EU will use "implementation tables" identifying
specific objectives public officials must achieve by a designated time. For example, by a
certain time public officials are responsible for establishing "points of single contact"
which are web enabled, for service industry providers to determine in one location all of
the requirements for establishing an office and for requirements through the life of the
service firm. To ensure objectives are achieved, the EU has also identified "follow-up
measures", for example, a requirement that public officials explicitly "notify" and post
changes to service industry rules and regulations through the points of single contact.
Simplifying administrative procedures
The Services Directive will help simplify administrative procedures. A program to
review procedures and requirements governing service sectors will be undertaken to
eliminate those procedures and requirements that are not necessary and simplify those
that are unduly complex. This review extends to all administrative procedures and
requirements that are imposed across the life of a service industry, for example, reporting
requirements. EU efforts will focus on simplifying administrative procedures to make
information available to service firms and service users, aggregate all requirements in one
1 European Commission (2005) Examples of Problems the Services Directive Would Help Solve.
http://ec.europa.eu

142
place, and enable applicants to fulfill administrative requirements online. The EU will
use electronic government to reduce time, and administrative overhead required for
registering and carrying out service industry activities.
Helping public officials to work together to facilitate services trade
The Services Directive will help public officials in different markets work together to
improve the services environment. The initiative will require different agencies to
cooperate to reduce the burden of multiple applications with the same information.
Officials will also have to accept documents from other officials which contain the same
material. The initiative will eliminate duplicative procedures, lower the cost of
requirements and improve the "clarity and accessibility" of such processes. Under the
initiative, officials are also obligated to help service firms by proactively informing them
of all the steps necessary to complete procedures. Officials must also be communicative
about the processing of applications and other requirements. The Directive also requires
that "conditions for granting authorizations be clear and unambiguous, objective,
transparent and accessible, and made public in advance."1
The Services Directive will help service firms outside of the EU access the EU market.
Under the Directive, administrative processes for service industries should be the same
for domestic and foreign firms. The initiative will require review and assessment of
"authorization schemes" or the systems by which a public official determines and grants
qualifications and licenses to ensure they are nondiscriminatory. The Services Directive
is instructive because of its practical approach to facilitating services trade within the EU
and with foreign service providers.
EU US regulatory cooperation to facilitate trade in services
Examining services trade between the European Union and the United States pinpoints
the services trade issues at the forefront of concern in developed economies. The scope
of the EU US services trade, the shape of that trade, and how the EU and the US are
working together to facilitate trade provides insight into developed services economies.
In 2006, the European Union (25) was the world's leading exporter of travel,
transportation, and other commercial services followed by the US as illustrated in table
14.6.
1 Commission of the European Communities (2007) Handbook on Implementation of the Services
Directive

143
Table 14.6 Leading Exporters of Trav., Transport., Other Commercial Services 2006
(Billion dollars & percentage)
Travel Value Share
European Union (25) 312.5 41.8
United States 106.7 14.3
Transportation Value Share
European Union (25) 280.5 44.4
United States 70.3 11.1
Other commercial services Value Share
European Union (25) 683.7 49.6
United States 211.9 15.4
Source: WTO1
Foreign Direct Investment through the establishment of affiliates is a significant conduit
for services trade between the EU and the US. The largest proportion of the EU US
services trade is conducted by EU service firms established in the US and US firms
established in the EU. For example in 2004, European sales through affiliates to the
United States represented well over $250 billion, almost double EU cross-border trade to
the United States. Similarly in the same year, US services sales through affiliates to
Europe represented well over $250 billion, almost double US cross-border trade to
Europe.2 The volume of transatlantic trade in services demonstrates the practical results
of establishing in export markets of interest.
At the same time, European and US regulators work closely to improve trade and service
industries across all modes of supply. They use practical cooperative methods to ease
regulatory burdens. Regulatory counterparts review regulatory approaches including
governance and specific rules and regulations.3 They identify conflicts in approach,
principles, or implementation and seek to reduce frictions that result from different
practices. EU US regulators consider respective legislative and regulatory developments
and establish systems to facilitate mutual recognition of regulatory criteria. They may
exchange experts, create tools to ease review of foreign investors, and share application
data. Regulators share information on new developments in the markets related to new
products or corporate and consumer behavior, for example. They also compare the
implementation of international standards within their respective markets.4 Through
dialogue and consistent engagement EU and US regulators improve transatlantic services
trade.
The EU and the US are very active in international bodies that influence standards for
service industries. For example, the EU and the US support the participation of their
regulators in entities such as The Bank for International Settlements (BIS),5
the
1 World Trade Organization (2007) International Trade Statistics
2 US Bureau of Economic Analysis (2006) US International Services Cross-Border Trade in 2005 and Sales
through Affiliates in 2004 3 European Commission. (2005) Commission Non Paper for the FSC-Meeting
http://ec.europa.eu/internal_market 4 Office of United States Trade Representative (2004) EU US Financial Markets Regulatory Dialogue
http://www.USTR.gov 5 http://www.bis.org/

144
International Organization of Securities Commissions (IOSCO),1 and the International
Association of Insurance Supervisors (IAIS).2 These and other service industry bodies
facilitate exchanges between regulators around the world and shape international
regulatory standards. In the face of globalization, the EU and the US are taking an active
role in formulating the global regulatory environment for trade in services.
United States
Behind the European Union, the United States is the largest service exporter in the world
and has experienced exceptional productivity growth in service industries in the last
decade. The vibrancy of the United States services economy reflects a constellation of
factors that create innovation and enable US firms to leverage traditional and "intangible"
factors of production. The United States puts a heavy emphasis on the quality and
availability of market information to investors, citizens, and the government. This
extends to requirements for financial reporting and public sector collection of data on
economic activity. As such, the US is a leader in the collection of trade in services data
at the international, national, and state level. This information is critical to inform
policymaking and drives the market access stance of the United States. The United
States also has a well-developed export promotion regime that supports its services
industries. US export promotion methods offer insight into tools the public sector can use
to improve services trade.
Productivity growth in service industries
The US has experienced exceptional productivity growth in a scope of service industries
due to the value-added contribution of labor, Information Communication Technology
(ICT) capital, non-ICT capital, and multi-factor productivity from 1995 to 2004.3 During
this time, the largest contributor to productivity in financial and business services was a
combination of labor composition and hours worked. In these sectors, investment in ICT
capital or computer hardware, telecommunications infrastructure, and software
contributed 1.2% of value-added growth. Overall multifactor productivity
contributed .9% of value-added growth as illustrated in table 14.7. Non-ICT capital
contributed .7% of value-added growth. Thus investment in human resources and ICT
capital along with overall multifactor productivity were significant in improving
productivity in the financial and business sectors.
1 http://www.iosco.org/
2 http://www.iaisweb.org/
3 van Ark, O'Mahony, Ypma, (2007) The EU KLEMS Productivity Report: An Overview of Results from
the EU KLEMS Growth and Productivity Accounts for the European Union, EU Member States and Major
Other Countries in the World

145
Table 14.7 Gross Value Added Growth and Contributions
(annual average volume growth rates, in %)
Source: van Ark, O'Mahony, Ypma, (2007) EU KLEMS Productivity Report
In distribution services, multi-factor productivity played a particularly important role in
growth from 1995 to 2004. Productivity growth in wholesale, retail, transportation, and
warehousing services was largely due to expansion of multi-factor productivity, which
contributed 2.8% of value-added growth.
US service industries have been particularly adept at leveraging the traditional and
"intangible" factors related to a knowledge-based economy.1
While multifactor
productivity captures the productivity of traditional inputs of labor, ICT capital, and non-
ICT capital, it also absorbs, to some degree, "intangible" factors related to a knowledge-
based economy. Table 14.8 identifies inputs to the knowledge economy and their
subsidiary components, which are all important to service industries. Table 14.8 Capital Inputs to the Knowledge Economy
ICT capital Human
capital
Knowledge
capital
Organizational
capital
Customer
capital
Social capital
Hardware Formal
education
Research &
development &
patents
Engineering design Marketing Language
Telecommunications
infrastructure
Company
training
Licenses, brands,
and copyrights
Organizational
design
Relationships Ability to create
new relationships
Software Experience Other
technological
innovation
Structure in
database and its use
Product feedback
& specialization
Reputation
Remuneration of
innovative ideas
1 van Ark, O'Mahony, Ypma, (2007)
Gross
value
added
growth
Contribution
of labor input
growth
Contributio
n of total
hours
worked
Contributio
n of labor
composition
Contributio
n of capital
input
growth
Contributio
n of ICT
capital
Contributio
n of non-
ICT capital
Contributio
n of multi-
factor
productivit
y growth
(1) = (2)
+(5) +(8)
(2) = (3) +(4) (3) (4) (5) = (6)
+(7)
(6) (7) (8)
1995-2004
Distribution
services
4.7 .5 .2 .3 1.4 1 .4 2.8
Finance &
business
services
4.9 2 1.6 .4 2 1.2 .7 .9
Personal &
social
services
2.6 1.7 1.4 .2 1 .4 .6 .0

146
Source: van Ark (2004)1
The Knowledge Economy
The ability to create an innovative environment where elements of ICT, human,
knowledge, organizational, customer, and social capital are effectively put to use depends
on a wide variety of variables. To some degree these are captured in indexes of
competitiveness. For example, in 2007, the World Economic Forum's Global
Competitiveness Report rated the United States as the most competitive economy
according to a number of measures. Although facing significant macroeconomic
challenges, the US maintains its position due to "an excellent university system that
works closely with business, a very flexible labor market, a unique ability to attract talent
and a financial sector that supplies the needed capital for risky innovation ventures." 2
Service industries gain from the intangible aspects of the knowledge economy including
those elements that facilitate exchange of ideas and innovation.
Market information
The United States puts a heavy emphasis on the quality and availability of market
information to investors, citizens, and the government. For example, legislation requires
that government rulemaking is undertaken in an environment of transparency,
participation, and analysis. Information about the content and structure of rules is
circulated through formal procedures for public notice, public comment, regulatory
analysis and interagency coordination.3 Quality and availability of market information
extends to disclosure requirements for corporate and public entities involved in market
activities. US service firms trading internationally are also required to report on trading
activities under the International Investment and Trade in Services Survey Act to
facilitate the collection of trade in services data at the international, national, and state
level.4
In the US, the media also plays an important role in providing commercial information to
actors in the marketplace, policy makers, and the public at large. The media in many
instances propels public policy discussions on the fine points of services industry policy
including competition and investment policy as well as trade policy, for example.
Reported corporate and product market information and regular data releases of
economic conditions shape public discussion as well as regulatory oversight. For
example, public information on costs of services products, quality of telecommunications,
1 van Ark, (2004) ―The Measurement of Productivity: What Do the Numbers Mean?‖ in G. Gelauff, L.
Klomp, S. Raes, T. Roelandt Fostering Productivity. Patterns, Determinants and Policy Implications,
Contributions to Economic Analysis 2 Blanke, (November 6, 2007) ―The Factors That Put the US on Top of the World Letter to the Editor‖
Financial Times . Page 10. 3 S.P. Wood, (June 2005) ―United States Government Rulemaking Transparency, Participation, Analysis,
and Accountability‖ at
http://www.ustr.gov/assets/World_Regions/Europe_Middle_East/Europe/US_EU_Regulatory_Cooperation/
asset_upload_file76_7145.pdf 4 Bureau of Economic Analysis (2000) United States Statistics on Trade in Services

147
financial, and transport services drive investment and use as well as government
oversight. Market information and comprehensive and quality economic data are
valuable components of a knowledge economy. They are commercially meaningful for
industries operating in the services sector and critical to responsive policy making.
Export promotion
The US employs an expansive export promotion program to support service industry
exports. The US Commercial Service of the International Trade Administration is adept
in its use of electronic government to assist service exporters. The Commercial Service
has a wide variety of online means to help service exporters. These electronic offerings
are supported by a network of commercial service officers at the state, federal and
international level. Their ability to provide market analysis and specialized assistance
helps service firms establish and operate in foreign markets. Table 14.9 highlights export
support activities for service firms.
Table 14.9 US Commercial Service Activities
Advocacy US officials posted abroad can help firms navigate
regulatory requirements
Buyer, partner, agent,
distributor matching
US officials can help identify joint venture
partners and distributors in foreign markets
Corporate profiles US officials can help with credit checks and due
diligence on foreign customers
Counseling US officials can help develop effective export
strategy and evaluate competitors
Finance USG offers a variety of financial assistance
through supporting agencies
Market research Overviews of 120 markets and updates on new
regulations
Trade fairs & missions Assists firms with exhibitions abroad and
orchestrates trade missions to meet qualified
foreign firms
Source: United States Commercial Service, International Trade Administration.
http://www.ita.doc.gov.
The US is also unique in the degree to which government agencies cooperate with each
other, academia, and trade associations on international commercial policy issues. For
example, agency consultation on trade obstacles in conjunction with trade advisory
committees of service stakeholders improves the overseas investment environment for
US service exporters. Such institutionalized services trade policy dialogue helps to
effectively address issues in services markets at home and abroad as service industries
evolve.
Singapore
Although Singapore is a small city state it offers important practical approaches to
developing a world-class services economy. Singapore maintains a receptive FDI
environment, highly efficient regulatory institutions, and a well organized trade
promotion authority. Of particular interest to China are Singapore's pragmatic efforts to
attract service industry professionals from around the world. Singapore has also worked

148
to develop a broad scope of services industries that go beyond a narrow focus on
information technology and back-office services. Singapore has also recently made
important changes to its policy environment including with regard to Government Linked
Companies (GLCs).
Creating service industry clusters
In the face of increased competition in manufacturing, Singapore's Economic Review
Committee (ERC) established initiatives to strengthen the services sector using
investment in human resources, increased labor flexibility, competition policy, and
R&D.1 Singapore endeavored to create an educational industry to attract the best and the
brightest from abroad and serve its own citizens. At the same time, Singapore has
allowed for increased labor flexibility, while sustaining the standard of living with public
support of housing and education.2 Singapore also introduced a competition law to
effectively lower domestic input costs. The island nation promoted collaboration among
research institutes, universities, and industry to foster service industry clusters.3 Such
clusters create a network effect and contribute to innovation through information sharing
and a concentration of expertise as illustrated in Figure 14.3.
Figure 14.3 Service Industry Clusters
Attracting service industry professionals
Singapore welcomes foreign professionals and emigrants and has intentionally created an
environment that will attract service industry expertise. Dynamic cities such as Hong
Kong, London, and Singapore compete to attract professionals. London, for example,
attracts international talent due to the scope and reputation of the firms already
1 International Monetary Fund (2006) "Trends and Variation in Domestic Competition and Markup Costs"
Singapore: Selected Issues 2 The Economist (25 October, 2007) "High-flyer"
3 Caroline Long (2006) "Singapore in Transition: from Technology to Culture Hub" Journal of Knowledge
Management Vol. 10, Iss. 5; p.79
Tourism
Financial
services
Marine
engineering
Educational
services
Biosciences
Singapore
service
industries

149
established, international accessibility, and regulatory environment.1 Singapore has put
in place those elements that attract knowledge workers. For example, the government
"articulated the need for a culturally vibrant Singapore to attract global creative talents,"
funds were set aside to invest in the arts sector over the next five years.2. Singapore
views this investment strategically as a means to attract talent and also as a way to
stimulate growth in creative industries. Singapore established a constellation of magnets
to attract knowledge workers from around the world as illustrated in Figure 14.4.
Figure 14.4 Magnets to Attract Service Industry Talent
Competition policy
Singapore used competition policy to strengthen service industries. Singapore assessed
its services markets and recognized that an absence of competition initially in
telecommunications, media, and energy were holding back the economy. Consequently it
instituted privatization, established sector specific regulators, with specific authority to
address anti-competitive practices. Subsequently, at the urging of the Economic Review
Committee, Singapore enacted the 2004 Competition Act. The Act supports previous
sector specific provisions and addresses the dominant position of resource-rich
Government-Linked Companies (GLCs) and their ability to impede the development and
growth of small and medium-size enterprises. The Act prohibits "any conduct on the part
of one or more undertakings which amount to the abuse of the dominant position in any
market in Singapore."3 Singapore's relatively recent return to competition policy as a tool
to strengthen the services economy demonstrates the importance of acting to prevent anti-
competitive practices that inhibit service industry establishment and growth. Table 14.10
captures tools to improve the services economy and trade.
1 Bridget Rosewell, Consultant Chief Economist, GLA Economics (2007) "London As a World Services
Center: Factors for Success" 2 Long (2006)
3 Burton Ong (2006) "The Origins, Objectives and Structure of Competition Law in Singapore" World
Competition 29(2):p. 269-284
R&D
facilities
Ease of doing
business
Transport &
ICT
infrastructure
Cultural and
artistic
institutions
Quality
educational
institutions
Service
industry firms
Service industry
experts

150
Table 14.10 Examples of Singapore Service Industry Policy Tools
Singapore
Domestic
capacity
Competition
policy & IPR
Investment
environmrnt
Service
sectors
Trade
promotion
Regulation
Services
represent
rising share
of
employme
nt at 75.6%
in 03'
Deregulatio
n &
liberalizatio
n of utilities
Limiting
position of
GLCs
Introduction of
overarching
competition
law 2004
Competition
Act
Wave of
liberalization in
99' -- 02': in
banking,
insurance,
securities, and
telecom
Important
supplier of
seaport,
airport,
trading
services
(entrepot)
Increasing
exports of
business
services 99' -
03'
Attraction of
Service industry
professionals
Focus on value-
added services
Increasing
public
consultation
Source: WTO1
Japan
As a long-standing developed economy in the region and East Asia's largest commercial
services trader,2 Japan offers valuable insight into methods to boost productivity in the
services sector. Japan evaluated its services economy and took steps to improve key
aspects of service industry productivity including: "labor market flexibility, ICT use,
competition, entrepreneurship, and the framework for innovation."3 Japan is enhancing
its investment in human resources, applying manufacturing expertise to service industries,
and increasing exchange of information among academia, industry, and the public sector.
Japan also revisited fundamental aspects of its governance of foreign direct investment to
increase competition and absorb innovative service industry practices.
Services assessment
Japan's Ministry of Economy, Trade and Industry (METI) recently assessed the
productivity of Japan's services sector. METI found that Japanese services firms had
lower labor productivity and lower investment in information technology software
compared to the EU and the US.4
The Ministry associated these factors with a
comparatively lower propensity to expand abroad. The Ministry also found that the rate
of establishment of new services firms in Japan was on average 50% lower than in the
United States from 2001 to 2005. 5
METI attributed this difference to the scope of
Japanese regulations required to establish a business in the services sector. Compared to
the US and Europe, Japan also experienced a lower ratio of foreign direct investment in
1 World Trade Organization (2004) Trade Policy Review Singapore Report by the Secretariat
2 World Trade Organization (2007) World Trade Report
3 International Monetary Fund (2007) Japan: Selected Issues
4 Ministry of Economy, Trade and Industry (2007) White Paper on International Economy and Trade
Japan's Trade Strategy on Improving Industrial Productivity and Accelerating Economic Growth. 5 Ministry of Economy, Trade and Industry (2007).

151
services to nominal GDP at 1.3%, compared to 8% in the US and 20.3% in the UK,1
which suggests a low level of competition from foreign service suppliers.
In the light of these findings, Japan has leveraged a variety of policy tools to strengthen
the productivity of service industries based on a model2 that illustrates intangible aspects
of service industry productivity.
Figure 14.5 Services Productivity and Enabling Environment
Create environment of quality & trust facilitated by information flow
↓
↑ Value added + ↑ New business ← Develop human resources
Services productivity = ↑ Efficiency
↑
Apply scientific & engineering approaches to services
Source: METI3
Development of human resources
A primary government initiative to improve service industry productivity is to deepen
human capital. The government is taking a pragmatic approach in conjunction with
industry and academia to identify "needs of service industries for human resources, what
kind of people are required (knowledge, skills, technologies, etc.) and career paths and
companies,"4 and developing university curricula to address these needs.
The government is also working to facilitate labor mobility. Through corporate hearings,
the government found ongoing service industry employment trends in Japan's services
economy, for example, employees experience a greater degree of turnover, firms
increasingly use independent contractors, and firms more frequently engage part-time
workers.5 To facilitate labor flexibility in the services economy, the government will
increase "security and reemployment support"6 to workers who have lost their jobs.
1 Ministry of Economy, Trade and Industry (2007).
2 Ministry of Economy, Trade and Industry (2007) Towards Innovation and Productivity Improvement in
Service Industries 3 Ministry of Economy, Trade and Industry (2007) Towards Innovation and Productivity Improvement in
Service Industries 4 Ministry of Economy, Trade and Industry (2007) Towards Innovation and Productivity Improvement in
Service Industries 5 Ministry of Economy, Trade and Industry (2002) Toward the Establishment of a Diversified, Creative
Work System Conforming to the Trend Toward a Service Economy 6 Ministry of Economy, Trade and Industry (2002)

152
Application of manufacturing approaches to service industries
Japan established the Service Industry Productivity Council to draw industry, academia,
and government together to study and advance programs to improve the service sector.
As a result, Japan has an initiative to apply its manufacturing expertise to service
industries. For example, in the area of health services, a hospital applied Toyota's "just-
in-time" production method to minimize wait times for patients. In the past, doctors
would see patients with and without appointments. After the application of
manufacturing processes to health services, wait times were reduced when certain doctors
only saw patients with appointments and other doctors only saw patients without
appointments.1 Japan's focus on improving the competence of domestic service firms
will help prepare them to compete internationally.
Creating a business environment of quality & trust
Japan is working to improve the environment for intangible aspects of service industries.
METI attributes the exchange of information between supplier and consumer as a driver
of quality improvement. The Productivity Council will facilitate communication and
information exchange in the market. The government has also taken positive steps to
improve transparency in the marketplace which facilitates the flow of market information.
For example, regulatory agencies now make available online inspection manuals,
supervisory guidelines and interpretation of rules.2
Japan attracts investment interests due to "it's mature business climate and well-
developed legal system.3 Japan improved "the climate for entrepreneurs and start ups, for
example by offering more favorable tax treatment for venture capital investments,
reducing the minimum capital requirement for new businessmen to yen 1, and making it
easier for startups to issue share options to staff."4 Japan is also undertaking financial
sector reform to improve the efficiency of the capital market and make financing more
available to new service firms. The Ministry recognizes that creating a business
atmosphere that fosters innovation will promote value-added services.5
1 Ministry of Economy, Trade and Industry (2007) Towards Innovation and Productivity Improvement in
Service Industries 2 Andrew Morse, (10 December, 2007) ―Japan Moves to Improve Market Climate‖ Wall Street Journal
3 Kelly Holman, (26 November, 2007) "Japan Holding Fast" Investment Dealers Digest: IDD New York
4 "Not Invented Here" (1 December, 2007) The Economist Vol. 385, Iss. 8557; p. 14
5 Ministry of Economy, Trade and Industry (2007) Towards Innovation and Productivity Improvement in
Service Industries

153
Table 14.11 Policies to Address Service Industries Weaknesses
Service Industry
Weakness
Policy Response
low labor productivity investment in human capital
improved academic programs
increased unemployment and reemployment support
Source: METI
low level of new
business regulatory reform to streamline rules and increase
transparency
financial sector reform to increase transparency and
competition to facilitate a more efficient capital market
Source: METI
low foreign direct
investment in services unilateral policy reform to facilitate trade in services
for example:
o allowing filings in English
o mechanisms to handle regulatory queries
o allowance for broader scope of services
products
positive engagement in negotiations on services
Source: WTO
Competition policy
Japan is using competition policy to improve productivity in different service sectors.
Japan is increasing competition to lower market entry barriers to domestic and
international firms by strengthening investigatory and prosecutorial powers of the
competition authority. For example, in the wholesale and retail sector, restrictions on
market access inhibited competition indicated by comparatively high prices.1 In 2006 the
Anti-Monopoly Act was amended to strengthen the powers of the Japan Fair Trade
Commission (JFTC) enhancing its ability to investigate and strengthening prohibitions
against collusion in government procurement. The JFTC is now actively monitoring
telecommunications, operating software, railway, wholesale, and medical administrative
services, for example.2
Table 14.12 Competition in Wholesale & Retail
Sector Policy Weakness Indicators
Wholesale & retail Minimal competitive pressures High prices
high concentration ratios
constancy of market share
restrictive regulations
low ICT capital accumulation
Source: IMF3
1 International Monetary Fund (2007) Japan: Selected Issues
2 World Trade Organization (2007) Trade Policy Review Report by the Secretariat Japan
3 International Monetary Fund (2007)

154
Identifying service industry expertise
The government recognizes Japanese services firms that have successfully created unique
service industry models they were able to replicate successfully in foreign markets.1
Business case studies of domestic firms are useful in targeting those unique aspects of
service industry operations that contribute to market success. As another example,
Australia's Trade Commission "Austrade" facilitated case studies of successful service
exporters concentrated in professional and business services.2 The studies identified
practices that contributed to profitable export ventures from Australia into Asia.
Table 14.13 Primary Practices for Service Export Success
Long term commitment Establishing a local office, providing training, upgrading service
offerings, and consistent promotional activities contributed to success.
Relationship & network
building
Establishing relationships that facilitate distribution, help identify joint
venture partners, identify clients, and navigate local regulations ease
trade. Local relationships should also help the firm understand how
different bureaucracies function.
Success at home Although the Internet and national diasporas allow service firms to more
easily export, those in the study experienced success at home in advance
of exporting.
Patience Export success took as much as a few years. In some cases, success also
followed initial failures.
Entrepreneurship Export professionals in the firm were working to carve out a niche,
moving into "new" markets, and searching for unique returns.
Source: Center for Applied Marketing, University of New South Wales for the Australian Trade Commission Austrade,
March 2002
Japan is implementing a number of government measures to improve services
productivity. Japan is promoting regulatory reform in medical, education, construction,
legal, financial, energy, and transport sectors and working to build service industry
clusters in healthcare.3 In addition, Japan's Revised Offer on Services conveyed to WTO
members in June of 2005 proposes to eliminate certain market access limitations on legal,
courier, insurance, and maritime services4 this mature economy is refining its approach
to foreign direct investment to boost productivity of service industries. Table 14.14
captures tools to improve the services economy and trade.
1 Ministry of Economy, Trade and Industry (2007) Towards Innovation and Productivity Improvement in
Service Industries 2 Center for Applied Marketing, University of New South Wales for the Australian Trade Commission
Austrade (2002)"Exporting Australian Services: Case Studies of 17 Service Exporters". 3 World Trade Organization (2007) Trade Policy Review Report by the Secretariat Japan
4 World Trade Organization (2005) Japan Revised Offer

155
Table 14.14 Examples of Japan Service Industry Policy Tools
Source: WTO1
1 World Trade Organization (2007) Trade Policy Review Report by the Secretariat Japan
Japan
Domestic
capacity
Competition policy
& IPR
Investment
environment
Service sectors Trade promotion Regulation Trade
arrangements
Services
represent rising
share of
employment at
69.8% in 03'
Building human
resource
capacity with a
focus on
academia
Privatizing
Japan Post
Accelerating
deregulation of
financial,
energy, & legal
services
2005 Amendment of
the Anti-Monopoly
Act
New authority to
Japan Fair Trade
Commission in
criminal
investigations
Engagement
internationally to
strengthen and
harmonize IPR
protections
Adjusting FDI
regime
Unilateral actions
to lower market
access barriers
created by
administrative
rules and
regulations
Comparatively low
level of service
industry
productivity vis-à-
vis EU & US
Increasing
transparency in the
governance and
disclosure
requirements of
financial services
Japan External Trade
Organization (JETRO)
Special Zone for Structural
Reform Act permits
retirement of specific
regulations in geographic
areas
Example: extension of
temporary residency for
foreign service
professionals
New 2006
Program for
Promoting
Regulatory
Reform
concentrating on
medical,
education,
construction,
legal, financial,
energy, transport
sectors
Established new
corporate code of
conduct
Proposed new
bindings in services
under GATS
negotiations
Japan-ASEAN
Comprehensive
Economic
Partnership
EPAs w/ Singapore,
Mexico, Malaysia
cover investment &
services

156
China, Hong Kong Special Administrative Region
China, Hong Kong SAR's success as a services economy and its relationship with China
offers lessons in regulatory approaches that improve service industry performance. Hong
Kong SAR is recognized for its formulation and implementation of government measures,
regulations and administrative rules and their positive influence on industry, which is
dominated by services at 90% of GDP. Hong Kong SAR's open investment environment,
increasing attention to intellectual property protection, and its use of incentive programs
demonstrate how a successful services economy works to maintain its position in the
global economy. In addition, the establishment of the Closer Economic Partnership
Arrangement (CEPA) confirms key tenets of services trade policy and the value of
market access to service suppliers and service users.
Governance
Hong Kong SAR's has a reputation as an open and transparent economy, which is
reflected in established competitiveness indexes1 that measure the efficiency of public
institutions, educational institutions, regulatory transparency, and ease of establishing a
business. For example in 2007, Hong Kong SAR ranked at the highest level in regulatory
quality under Governance Indicators of the World Bank as a result of surveys focused on
regulations.2 Hong Kong SAR's highly rated regulatory approach includes, for example,
a disclosure based regulatory regime that requires corporate entities to provide timely and
accurate information including quantitative and qualitative data.3
FDI environment
Hong Kong SAR has experienced comparatively strong productivity growth in trade and
tourism, transport, and financial services, which is largely attributed to total factor
productivity (TFP).4 TFP is a "measure of gains in the efficiency with which inputs are
used, including technical progress."5 Hong Kong SAR's service firms are effectively
leveraging technology in this environment and creating innovative services across a
swath of service industries. Hong Kong SAR's population of service industry
professionals, open investment regime, and quality regulatory environment enables firms
to access service industry expertise, venture-capital, as well as market information. Table
1 International Monetary Fund (2007) "Competitiveness: Trends and Prospects" People's Republic of
China-Hong Kong Special Administrative Region: Selected Issues Synthesis of competitiveness indexes:
Global Country Forecast by the Economic Intelligence Unit, Competitiveness Report by the World
Economic Forum, Doing Business Survey by the World Bank 2 D. Kaufmann, A. Kraay, M. Mastruzzi, (2007) Governance Matters Romans VI: Governance Indicators
for 1996-2006 The World Bank 3 Paul Chow (2004) Implementation and Enforcement in Corporate Governance the Case of Hong Kong
OECD-6th
Asian Roundtable on Corporate Governance http://www.oecd.org 4 International Monetary Fund (2007) HKSAR
5 Barry Bosworth, Susan M. Collins, (2007) Accounting for Growth: Comparing China and India National
Bureau of Economic Research

157
14.15 shows growth as a percentage of GDP of individual service sectors from 2000 to
2004.
Table 14.15 Hong Kong SAR Services % of GDP
Share of service sectors in current GDP 2000 2001 2002 2003 2004
Services 86.6 87.5 88.4 89.3 90.0
Wholesale and retail trades 3.2 3.3 3.1 2.9 3.5
Import/export trade 18.5 19 19.6 20.6 21.3
Restaurants and hotels 2.9 2.7 2.4 2.1 2.6
Transport, storage, and communications 9.5 9.4 9.9 9.8 10.1
Transport and storage 7.4 7.2 7.6 7.6 8.3
Communications 2.1 2.2 2.3 2.2 1.8
Financing and insurance 11.9 11.3 11.5 12.3 12.2
Real estate 5.1 4.6 4.3 4.0 4.2
Business services 4.4 4.3 4.3 4.5 4.9
Community, social, and personal services 19.9 21.1 21.5 21.8 21.0
Ownership of premises 11.3 11.8 11.8 11.2 10.2
Source: WTO1
Intellectual property rights (IPR) protection
Government measures can support industry innovation and knowledge development by
protecting knowledge investments. In communications, financial, and technical business
services, "innovators stressed the use of copyrights and trademark."2 Since 2000, Hong
Kong SAR has strengthened its intellectual property rights regime extending protection
and improving administration. For example, the Copyright Ordinance strengthens
protection of copyright works and expands electronic administrative procedures for
filings.3 The Trade Marks Ordinance strengthens prohibitions against misuse and also
eases registration. Hong Kong SAR's expansion of IPR protection and improvement in
the government's ability to manage the IPR regime can benefit service industry
innovation.
Recently Hong Kong SAR slipped in competition rankings due to perceptions about
public institutions with regard to judicial independence, property rights, and government
impartiality. Market concentration in domestic service industries as well as
comparatively low enrollment in tertiary institutions also caused downgrades.4
Sustaining institutional quality is a universal challenge, while addressing market
concentration in the service sector requires pragmatic implementation of policies that
prevent anti-competitive behavior and reduce market entry and market exit barriers.
Hong Kong SAR's Competition Policy Review Committee has urged greater attention to
anti-competitive conduct. With regard to education, Hong Kong SAR spends 4.2% of
GDP on education but has a comparatively low combined gross enrollment ratio for
1 World Trade Organization (2007) Trade Policy Review Report by the Secretariat Hong Kong, China
2 Guy Gellatly, Valery Peeters (1999) Understanding the Innovation Process: Innovation and Dynamic
Service Industries Statistics Canada 3 World Trade Organization (2007) Trade Policy Review Report by the Secretariat Hong Kong, China
4 International Monetary Fund (2007) ―Competitiveness: Trends and Prospects‖ People's Republic of
China-Hong Kong Special Administrative Region: Selected Issues.

158
primary, secondary, and tertiary education at 76.3%.1 Hong Kong SAR is more recently
focusing on retraining and skills upgrading programs for workers.
Air quality detriment to services industries
Poor air quality is influencing the ability of services firms in Hong Kong SAR to attract
service industry expertise. In 2006, one forth of companies in Hong Kong SAR reported
challenges attracting staff.2
Since 2002, Hong Kong SAR has strengthened
environmental protection of air to reduce pollution. For example, Air Pollution Control
Regulations governing fuel, vehicles, and admissions have been tightened.3
Strengthening regulations can have a potential knock on effect of improving the
environmental services industry as a whole.
Environmental services industry growth is driven in part by government regulations and
their consistent enforcement to protect air, water, and land. Environmental service
industries face the same trade barriers as traditional service firms. Thus the removal of
restrictions on environmental service providers can help improve the provision of
environmental services. Table 14.16 identifies common barriers that inhibit
environmental service firms from exporting.
Table 14.16 Trade Barriers to Environmental Service Industries
Restrictions on participating in government procurement processes
Prescribed forms of commercial organization
Ownership restrictions
Joint venture requirements
Foreign remittance constraints
Prohibitions on service provision to the public sector
Exceptions for provision to certain sectors
Professional licensing quotas
Ambiguous or unreasonable licensing requirements
Nationality limitations on professional service providers
Limitations on advertising, public relations, communications
Incentive programs
Hong Kong SAR actively supports the service sector with tax, financing, and R & D
incentive programs. The Hong Kong Science and Technology Parks Corporation offers
incentives for investors in a group of service industries including information technology,
telecom, and biotechnology.4 The "DesignsSmart" program fosters development of
design incubation, design education, and design networking with a "one-stop shop".5
Research and development support extends to technology for logistics, ICT, and
1 United Nations (2008) UN Human Development Report
2 International Monetary Fund (2007) HKSAR
3 World Trade Organization (2007) Trade Policy Review Report by the Secretariat Hong Kong, China
4 World Trade Organization (2007) Trade Policy Review Report by the Secretariat Hong Kong, China
5 World Trade Organization (2007) Trade Policy Review Report by the Secretariat Hong Kong, China

159
nanotechnology. 1
The large majority of service firms in Hong Kong SAR have less than
50 employees, consequently, Hong Kong offers financing for SMEs to "enter new
markets, upgrade human resources, and enhance competitiveness." 2
The SME
Development Fund also supports trade organizations, professional groups, and think
tanks to strengthen SMEs. 3
Closer Economic Partnership Arrangement (CEPA)
The establishment of the CEPA confirms the parties‘ recognition of the key tenets of
services trade policy and the value of market access to service suppliers and service users.
The expressed purpose of the Arrangement between mainland China and the Hong Kong
Special Administrative Region is to promote joint development and allow "first mover"
advantage to Hong Kong service suppliers.4 For example, in legal services, residency
requirements and quantitative restrictions have been waived for Hong Kong law firms.5
The Agreement's provisions on trade in services are expansive and anticipate
progressively deeper liberalization. The CEPA provides preferential access to Hong
Kong SAR services suppliers to the Chinese economy earlier and wider than China's
commitments. The CEPA deepens market access for 27 services sectors. Commitments
are in the form of a positive list and are prescriptive.
The CEPA also address the environment for service industries. Article 13 of the
agreement commits the respective regulators to share information and deepen cooperation.
Article 16 addresses transparency and Article 17 speaks specifically to "transparency in
laws and regulations".6 Article 15 commits professional organization to establish a
means for mutual recognition of qualifications. Article 12 expands market access to
services firms of WTO members established in Hong Kong SAR and providing services.
The components of the Arrangement reaffirm the value of regulatory cooperation,
transparency, mutual recognition as well as the trade creating benefits of MFN and
national treatment. The implementation of the Arrangement will demonstrate how these
measures enhance growth across the economy. Table 14.17 captures tools to improve the
services economy and trade.
1 World Trade Organization (2007) Trade Policy Review Report by the Secretariat Hong Kong, China
2 World Trade Organization (2007) Trade Policy Review Report by the Secretariat Hong Kong, China
3 World Trade Organization (2007) Trade Policy Review Report by the Secretariat Hong Kong, China
4 Mainland and Hong Kong Closer Economic Partnership Arrangement (2004) Frequently Asked Questions
http://www.tid.gov.hk/english/cepa/ 5 Hong Kong Trade Development Council (2007) Legal Services http://professional.tdctrade.com
6 Mainland and Hong Kong Closer Economic Partnership Arrangement (2004)
http://www.tid.gov.hk/english/cepa/

160
Table 14.17 Examples of HKSAR Service Industry Policy Tools
Source: WTO1
1 World Trade Organization (2007) Trade Policy Review Report by the Secretariat Hong Kong, China
Hong Kong
Domestic
capacity
Competition
policy & IPR
Investment
Environmrnt
Trade in
services
Trade promotion Regulation Trade
arrangements
Services
were 86% of
employment
in 05‘
Focus on
education
Retraining &
skills
upgrading
Telecom
liberalization
began in 95'
fully
liberalized by
03'
Liberalizing
utilities
Competition
Policy Review
Committee
(CPRC)
urges attention to
anti-competitive
conduct
Legislative
amendments in
IPR renewed
focus on
protection and
enforcement
Preeminent in
openness &
ease
Disclosure
based
regulatory
regime in
financial
services
Undertaking
further
liberalization
of specific
services
sectors with
unilateral
actions in
banking, for
example
Dominated by
SMEs
Prominent
sectors: trade,
finance,
insurance,
transport,
storage,
communications
& tourism
Maintains commercial
officers abroad
Special attention to SMEs
that dominate the services
sector
Incentives: tax and
financing R&D, design &
innovation technology
upgrading HKSTPC
Insurance support: Export
Credit Insurance
Corporation
Maintains specific policies
in aircraft, freight
forwarding, hotel,
construction, professional,
testing, travel to promote
exports
Exceptional
regulatory
quality
Closer
Economic
Partnership
Arrangement
(CEPA)
Provides
greater market
access for 27
service sectors

161
Conclusion
Service industries have grown in economic importance in national economies and
international trade. Governments can improve services productivity by facilitating trade
and investment. They can ensure domestic institutions promote fair play in the
marketplace and provide an environment of transparency. Governments can institute
policies that support investment, competition, and innovation. They can facilitate a
services policy dialogue to stay abreast of the ever evolving issues in the services market.
China can use a variety of measures to strengthen service industries and facilitate trade in
services. Each country reviewed offers useful lessons for China. The European Union's
examination of service industry constraints among members drove the development of a
Services Directive that takes a pragmatic approach to reducing process and regulatory
barriers to services trade. The United States puts a heavy emphasis on the quality and
availability of market information to investors, citizens, and the government to draw
investment into service firms and inform policymaking. India's ability to free computer
and information services from the historically burdensome Indian regulatory regime has
made service exports an engine of growth and catalyst for reform in other service sectors.
In the last few years, the Republic of Korea, Singapore, Japan, and Hong Kong SAR,
revised government measures to strengthen key aspects of their respective service
economies. Together they represent a clear trend in the structuring and implementation
of competition policy and increased attention to intellectual property protection.
Subduing anti-competitive practices in services markets became a renewed priority for
these leaders in services trade due to comparatively high costs and inefficiencies in
services as well as lethargic incumbents.1 Many also recently relaxed FDI measures on a
variety of service sectors to build service sector productivity and renew growth across the
economy. Each economy offers valuable insight into how governments strengthen
services trade and the challenges inherent in building and maintaining a vibrant services
economy.
1 Simon Evenett, (2005) ―Lessons from the Six Country Analysis‖ Competition Policy and Development in
Asia Asian Development Bank

162
References
"Not Invented Here" (1 December, 2007) The Economist Vol. 385, Iss. 8557; p. 14
―India Turns a Corner‖ January (2007) Trade Finance
Andrew Morse, (10 December, 2007) ―Japan Moves to Improve Market Climate‖ Wall Street
Journal
Anna Fifield, (26 June, 2007) ―Seoul looks to echo London 'big bang'‖ Financial Times London
(UK): p. 10.
Asia-Pacific Telecommunity Yearbook 2006
Barry Bosworth, Susan M. Collins, (2007) Accounting for Growth: Comparing China and India
National Bureau of Economic Research
Blanke, (November 6, 2007) ―The Factors That Put the US on Top of the World Letter to the
Editor‖ Financial Times p. 10.
Bridget Rosewell, Consultant Chief Economist, GLA Economics (2007) "London As a World
Services Center: Factors for Success"
Bureau of Economic Analysis (2000) United States Statistics on Trade in Services
Burton Ong (2006) "The Origins, Objectives and Structure of Competition Law in Singapore"
World Competition Vol. 29(2), p. 269-284
Caroline Long (2006) "Singapore in Transition: from Technology to Culture Hub" Journal of
Knowledge Management Vol. 10, Iss. 5; p.79
Center for Applied Marketing, University of New South Wales for the Australian Trade
Commission Austrade (2002)"Exporting Australian Services: Case Studies of 17 Service
Exporters".
Commission of the European Communities (2007) Handbook on Implementation of the Services
Directive
D. Kaufmann, A. Kraay, M. Mastruzzi, (2007) Governance Matters Romans VI: Governance
Indicators for 1996-2006 The World Bank
European Commission (2005) Examples of Problems the Services Directive Would Help Solve.
http://ec.europa.eu
European Commission. (2005) Commission Non Paper for the FSC-Meeting
http://ec.europa.eu/internal_market
Geraldine Lamb, (January 1, 2008) ―Davos: Indian Capital Markets‖ The Banker
Gurcharan Das, July/August (2006) ―The India Model‖ Foreign Affairs

163
Guy Gellatly, Valerie Peeters (1999) Understanding the Innovation Process: Innovation and
Dynamic Service Industries Statistics Canada
Hong Kong Trade Development Council (2007) Legal Services http://professional.tdctrade.com
http://www.bis.org/
http://www.iaisweb.org/
http://www.iosco.org/
Indian Institutes of Technology Alumni ITT History http://www.iit.org
International Competition Network (2003) Capacity Building and Technical Assistance: Building
Credible Competition Authorities in Developing and Transition Economies
International Monetary Fund (2006) "Trends and Variation in Domestic Competition and Markup
Costs" Singapore: Selected Issues
International Monetary Fund (2006) ―Korea's Transition to a Knowledge-Based Economy:
Prospects and Challenges Ahead‖ Republic of Korea: Selected Issues
International Monetary Fund (2007) "Competitiveness: Trends and Prospects" People's Republic
of China-Hong Kong Special Administrative Region: Selected Issues.
International Monetary Fund (2007) Japan: Selected Issues
International Monetary Fund (2007) People's Republic of China-Hong Kong Special
Administrative Region: Selected Issues.
International Monetary Fund (2008) ―Inclusive Growth‖ India: Selected Issues
Interview (February, 2008) Retired AT&T Executive
Interview (January, 2008) Representative, US India Business Council
Janet Ceglowski (2006) "Does Gravity Matter in a Service Economy?" Review of World
Economics Vol.142, No. 2, p 307-329
Kelly Holman, (26 November, 2007) "Japan Holding Fast" Investment Dealers Digest: IDD New
York
Korea US Free Trade Agreement (2007) ―Chapter 12 Cross-Border Trade in Services‖
http://www.ustr.gov
Mainland and Hong Kong Closer Economic Partnership Arrangement (2004) Frequently Asked
Questions http://www.tid.gov.hk/english/cepa/
Mainland and Hong Kong Closer Economic Partnership Arrangement (2004)
http://www.tid.gov.hk/english/cepa/

164
Ministry of Economy, Trade and Industry (2002) Toward the Establishment of a Diversified,
Creative Work System Conforming to the Trend Toward a Service Economy
Ministry of Economy, Trade and Industry (2007) Towards Innovation and Productivity
Improvement in Service Industries
Ministry of Economy, Trade and Industry (2007) White Paper on International Economy and
Trade Japan's Trade Strategy on Improving Industrial Productivity and Accelerating Economic
Growth.
Nicholas Crafts, (2006) ―Regulation and Productivity Performance‖ Oxford Review of Economic
Policy Vol. 22 No. 2
Office of United States Trade Representative (2004) EU US Financial Markets Regulatory
Dialogue http://www.USTR.gov
Organization for Economic Cooperation and Development (2007) Economic Survey of India
2007: Removing Infrastructure Bottlenecks
Organization of Economic Cooperation and Development (2007) Korea: Progress in
Implementing Regulatory Reform.
Organization of Economic Cooperation and Development country statistical profiles 2007
http://stats.oecd.org
Palaniappan Chidambaram, Finance Minister of India, (September 25, 2007) ―Remarks on India's
Economic Growth and Outlook‖ before the Peterson Institute for International Economics
Paul Chow (2004) Implementation and Enforcement in Corporate Governance the Case of Hong
Kong OECD-6th Asian Roundtable on Corporate Governance http://www.oecd.org
S.P. Wood, (June 2005) ―United States Government Rulemaking Transparency, Participation,
Analysis, and Accountability‖ at
http://www.ustr.gov/assets/World_Regions/Europe_Middle_East/Europe/US_EU_Regulatory_Co
operation/asset_upload_file76_7145.pdf
Sanjay M. Nadkarni, (June 2005) "The Knowledge Economy in India" Asian Business &
Management Vol. 4, Iss. 2; p. 213
Simon Evenett, (2005) ―Lessons from the Six Country Analysis‖ Competition Policy and
Development in Asia Asian Development Bank
Somini Sengupta, (17 January, 2008) ―Education Push Yields Little for India's Poor‖ The New
York Times
Sundeep Tucker, (13 January, 2008) ―Reliance Can Do No Wrong in the Eyes of Indians‖
Financial Times
The Economist (25 October, 2007) "High-flyer"
International Telecommunication Union Economies by Broadband Penetration (2006)

165
http://www.itu.int
Transparency International (2007) Corruption Perceptions Index http://www.transparency.org
United Nations (2008) UN Human Development Report 2007/2008
United Nations Conference on Trade and Development (2007) World Investment Report
US Bureau of Economic Analysis (2006) US International Services Cross-Border Trade in 2005
and Sales through Affiliates in 2004
van Ark, (2004) ―The Measurement of Productivity: What Do the Numbers Mean?‖ in G. Gelauff,
L. Klomp, S. Raes, T. Roelandt Fostering Productivity. Patterns, Determinants and Policy
Implications, Contributions to Economic Analysis
van Ark, O'Mahony, Ypma, (2007) The EU KLEMS Productivity Report: An Overview of Results
from the EU KLEMS Growth and Productivity Accounts for the European Union, EU Member
States and Major Other Countries in the World
World Trade Organization (2004) Trade Policy Review Singapore Report by the Secretariat
World Trade Organization (2004) Trade Policy Review Republic of Korea Report by the
Secretariat
World Trade Organization (2005) A Handbook on the GATS Agreement
World Trade Organization (2005) Japan Revised Offer
World Trade Organization (2005) Republic of Korea Revised Offer on Services
World Trade Organization (2007) International Trade Statistics
World Trade Organization (2007) Trade Policy Review Report by the Secretariat India
World Trade Organization (2007) Trade Policy Review Report by the Secretariat Japan
World Trade Organization (2007) Trade Policy Review Report by the Secretariat Hong Kong,
China
World Trade Organization (2007) World Trade Report

166
15 Promoting Trade in Services: Case Studies
Introduction
This paper examines three global industries: information technology, transport, and
animation services. For each sector, leading exporters are identified, industry trends are
explored, and strategies China can use to improve market conditions are suggested.
China has significant competitors operating globally in each industry. Chinese
policymakers and industry leaders can improve prospects for Chinese firms with attention
to particular factors influencing global competition in each sector.
Information technology is a global industry with firms from around the world offering a
broad scope of information services in an intensely competitive environment. Innovation,
cost pressures, and more recently energy concerns are driving companies to create new
products that offer choice in software applications, hosting, and delivery. Firms across
industry sectors continue to offshore and outsource operations on a global basis.
Emerging markets are important providers of information technology services due to
market reforms and investment in communications and education. China can improve
the domestic environment for Chinese firms by increasing the expertise of its labor force
across many skill sets, improving access to venture capital, and strengthening the
intellectual property protection regime.
The transport industry ties sea freight, air freight, trucking, and rail together to facilitate
the movement of goods from point of origin to final destination. Across the transport
sector, firms are responding to important trends by lowering costs and enhancing
efficiency to remain competitive. Transport firms are also encountering increasing
congestion, heightened environmental requirements, and stringent security rules.
Industry leaders are focusing on technology to improve efficiency, protect the
environment, and meet security regulations. China can concentrate on technological
innovation and improve the domestic and international regulatory environment to better
position Chinese firms in the global transport market.
Many countries have a vibrant animation sector creating original content and operating in
a growing and intensely competitive market. Technology and labor costs influence the
structure of the value chain of the animation industry. The emergence of a multitude of
media platforms creates growing demand for animation. Chinese animation houses are
globally competitive and can adopt strategies used by leaders in the industry to capture a
greater share of the market. China can also adjust its domestic policy environment to
improve the competitive position of Chinese animation houses.
Although information technology, transport, and animation are very different industries
they share common industry trends. Each industry is experiencing exceptional trade
growth and emerging markets are significant providers in each sector. Deployment of
technological innovation can be a competitive advantage for firms operating in each

167
industry. Management's ability to respond to competition, orchestrate strategic alliances,
and anticipate challenges and opportunities on the horizon is also a determinant of export
success. Information technology and animation firms are particularly reliant on a vibrant
venture capital market and robust protection of intellectual property. Changing
regulations in transport require astute engagement by Chinese policymakers and
proactive leadership from industry captains. Firms from each sector also gain from
accessing quality and skilled professionals from around the world.
Information technology services
Information technology is a global industry with firms from around the world offering a
broad scope of information services in an intensely competitive environment. Innovation,
cost pressures, and more recently energy concerns drive companies to create new
products that offer choice in software applications, hosting, and delivery. Firms across
industry sectors continue to offshore and outsource operations on a global basis.
Emerging markets are important providers of information technology services due to
market reforms and investment in communications and education. China can adjust the
policy environment to capture a greater share of the global market estimated at $467
billion in 2006 with 6% growth prospects through 2011.1
Main services providers
In 2005 after the EU, India was the largest exporter of computer and information services,
followed by the US, Israel, Canada, China, and Japan as illustrated in the graph below.
Many emerging markets experienced exceptional export growth in the last few years.
Since 2003, the Russian Federation's information technology exports grew 60%,
Malaysia's exports increased 50%, and China's exports rose 40% annually from 2003.2
As emerging markets expand and deepen the expertise of their labor force they capture a
growing share of this dynamic industry in developed and emerging economies.
1 Standard & Poor's (March 15, 2008) Stock Report Wipro Limited
2 World Trade Organization (2007)

168
Figure 15.1 Major Exporters & Importers of Cmp. & Inf. Services, 2005
(million dollars)
0
10000
20000
30000
40000
50000
60000
70000
Eur
opea
nU
nion
(25
)
Ext
ra-E
U(2
5) e
xpor
ts
Indi
a a
Uni
ted
Sta
tes
Isra
el b
Can
ada
Chi
na
Japa
n
Nor
way
b
ExportsImports
Source: WTO (2007)1
Notes: "a" represents estimate by the WTO Secretariat, "b" represents computer services
Remarkable export growth from emerging economies reflects market reforms and
investment in communications infrastructure and education. The globalization of
enterprise, outsourcing of key business operations, and offshoring of computer services
boosted demand for information technology services from low-cost markets. India
exemplifies an economy that graduated from low-cost provider to global leader in the
provision of information technology services. China's investment in education and
communications infrastructure as well as significant market reforms has enabled Chinese
industry to compete in the global information technology market.
Table 15.1 Sample Factors Influencing Export of Computer and Information Services
Globalization growing cross-border flows of capital
increased foreign direct investment
expansion of trade in goods and services
Market reforms regulatory reform
lifting of FDI restrictions
Investment ICT infrastructure
technical, business, continuing education
physical infrastructure
Offshoring Firms are locating abroad through establishment,
joint venture, or subcontract to perform:
R&D
IT services
Outsourcing Manufacturing and service industries are
subcontracting non-core operations:
payroll
finance
data processing
supply chain logistics, etc.
1 World Trade Organization (2007)

169
Industry trends
Technological innovation shapes the information technology services market. Software
firms consistently spend as much as "10% to 20% of revenues" on research and
development (R&D).1 R & D focuses on applications as well as the means to deliver
software products. The exceptional growth of the Internet, global communications
systems, and broadband access promotes the evolution of different delivery mechanisms
for different types of information technology services on-site, remotely, and from abroad.
Software as a service, web-based software, and the commercialization of supercomputing are
transforming the industry.
Software as a service (SAAS). The introduction of software as a service reflects the
growing ability to provide software remotely using a combination of infrastructure. As a
service, vendors maintain greater interaction with their customers and consequently
refine products in the near term through constant feedback.
Remote provision has enabled firms to offer different sales models including:
on-demand software
subscription software
leased software
With SAAS firms can access state-of-the-art programs at lower cost. A firm can easily
obtain access to programs that provide security and firewalls as well as remote
monitoring. Firms can also migrate into additional business process outsourcing from
remote providers. These models offer greater flexibility, graduated payment terms, and
less risk associated with committing to one software product.
Web-based software. Web-based software programs are emerging as alternatives to
packaged products. Particularly in the consumer market, migration to web-based
applications is growing. E-mail, database services, video services, finance offerings,
payment services, and personalized portal offerings made available at no cost to the
consumer attracts buyers away from traditional packaged applications.2
The
extraordinary growth of Google, which was publicly listed in 2004, attests to the
favorable reception of web-based services.
The business model for offering web-based software to consumers is distinct from
traditional packaged products. Google has a unique program "AdWords" that creates
targeted opportunities to advertise products to Web users. Rather than charging the
consumer directly, Google relies on advertising for 99% of revenues. 3
The combination
of advertising revenue and data collection create distinct value for the firm.
1 Zaineb Bokhari (October 11, 2007) Standard & Poor's Industry Surveys Computers: Software
2 Standard & Poor's (February 23, 2008) Stock Report Google Inc.
3 Standard & Poor's (February 23, 2008)

170
In response to competition, software innovators are lowering costs and improving value.
Salesforce.com a "leading provider of on-demand customer relationship management
software,"1 which offers 575 applications attributes the evolution of the sector to a
progression from:
mainframe to client/server systems
rise of the PC
creation of the Internet
development of Web services & technologies
migration to service oriented architecture
software as a service2
Software as a service continues to evolve with access to supercomputing. Information
technology firms are offering combinations of computer infrastructure based on a usage
fee. Google, Microsoft, IBM, and Amazon are "networking large groups of servers"3 to
provide supercomputing services to academia, researchers, and the commercial market.
Industry clients continue to drive firms to deliver the best computing services at the
lowest cost. Companies working to control energy, personnel, and hardware costs are
moving to a fee-for-service model that enables them to access "a collection of resources -
- applications, platforms, raw computing power and storage, and managed services,"4 for
their IT needs.
Intense competition across industry sectors that use IT services has also boosted use of
open-source software.
Open source software. Industry analysts expect open source software to maintain a
distinct position in the market and put downward pressure on the price of packaged
software. A number of programs eschew proprietary code and make their code freely
available. Open source systems include:
Linux
Apache
JBoss
Online interactivity facilitates the dispersion and improvement of open source systems.
Firms such as Novell and Red Hat provide open source training, monitoring, security, and
updating support to open source users and have helped to bring the products into the
mainstream. 5
Academia's use and exercise of open source software as a teaching
1 Standard & Poor's (March 15, 2008) Stock Report Salesforce.com Inc.
2 Salesforce.com (March, 2008) "How We Got Here" http://www.salesforce.com
3 BusinessWeek (November 16, 2007) "IBM, Yahoo!, and Google Are All Putting the Power of Cloud
Computing to Work. Here Is a Short Primer on How the Technology Works."
http//www.businessweek.com 4 Bill Snyder (March 13, 2008) InfoWorld "Cloud Computing Begins to Emerge from the Haze" http://www.infoworld.com 5 Jessica Twentyman (March 19, 2008) Financial Times "Linux Tries Not to Be a Victim of Its Own Success" p.3

171
instrument has also created a large pool of users who are comfortable with open source
when they enter the business world. 1
As software users face increasing competition in their own industry, they seek to lower
costs and adopt alternatives that do not require licensing agreements. Open source
software that can operate on any system also provides "hardware independence" allowing
additional cost savings.2 Due to low cost, flexibility, and reliability, open source
software will continue to attract buyers away from packaged providers.
Offshoring. Firms continue to establish operations abroad to capture cost savings from
lower-cost labor markets and reduced tax liabilities. The table below provides average IT
salaries in specific countries for 2006. Rates are fluid and dependent on demand for IT
professionals in the home and external markets. "Labor costs have been rising in India,
as demand for workers increases, not only from domestic employers, such as Wipro, but
also from multinational corporations, which have opened bases of operation to take
advantage of the labor force."3 As more companies establish in low cost labor markets
and as domestic demand for IT professionals grow in those markets, wages rise and
compensation packages develop.
Table 15.2 Average Annual IT Salary in Dollars for Selected Countries, 2006
Country Average IT
salary
Country Average IT
salary
Switzerland 79630 China 21060
United States 73220 Malaysia 18130
United Kingdom 64590 Russia 17720
Canada 59180 Thailand 15870
Ireland 51470 Vietnam 14820
Mexico 26210 India 13910
Czech Republic 21110 Philippines 12420
Source: Standard & Poor's (2007)4
In addition to cost, the quality and skill of the labor pool influence information
technology productivity. Particular expertise enables professionals to contribute to the
overall productivity of the company. Software engineering skills are a priority, however,
soft skills that facilitate collaboration, problem solving, and innovation are also necessary
for the firm to remain competitive in the global market.5 Emerging markets that produce
a well educated, technically and professionally diverse workforce that can graduate from
basic IT to advanced information technology services are best positioned to compete
globally.
1 Jessica Twentyman (March 19, 2008) 2 Jessica Twentyman (March 19, 2008) 3 Standard & Poor's (March 15, 2008) Stock Report Wipro Limited 4 Dylan Cathars (November 1, 2007) Standard & Poor's Industry Surveys Computers: Commercial Services
5 Officer. Multinational Information Technology Services Firm. Interview. March 14, 2008

172
Table 15.3 Favorable Labor Pool Attributes for IT firms
Quality of university graduates
(In some countries new hires require 6-12 months of additional
training.)
Scope of labor pool
(Corporate operations require qualified developers, programmers,
middle managers, generalists, and support staff.)
Exposure to leading-edge technologies
Experience with global business practices
Multilingual capability
Interpersonal, collaboration, & problem solving skills
Multicultural sensitivity
Access to continuing education programs
Source: Interview1
Services Demand. On a global basis, the outsourcing market is expected to continue to
grow. Industries in developed and emerging markets are adopting outsourcing to reduce
costs. Exceptional growth is expected in horizontal business outsourcing of non-core
activities. Information services outsourcing will grow albeit to a lesser degree. Network
and desktop outsourcing, hosting infrastructure services, application management, and
hosted application management will grow at moderate rates. The line graph below
highlights anticipated growth in distinct segments of the market.
Figure 15.2 Worldwide Services Spending by Foundation Market
(billion dollars)
Source: IDC Research Inc. (April 2007)2
Spending on traditional IT services such as systems integration, network consulting and
integration, IT consulting, business consulting, and custom application development is
also expected to expand. The graph below illustrates the expectation that services
spending on systems integration will continue to be a priority.
1 Officer. Multinational Information Technology Services Firm. Interview. March 14, 2008
2 IDC Research Inc. (April 2007) Worldwide Services 2007-2011 Forecast: a Market in Transition
0
50
100
150
200
250
300
2006 2007 2008 2009 2010 2011
Information services outsourcing
Network and desktop outsourcing
Application management
Hosted application management
Hosting infrastructure services
Key horizontal business outsourcing

173
Figure 15.3 Worldwide Services Spending by Foundation Market
(billion dollars)
Source: IDC Research Inc. (April 2007)1
Demand by Industry. Export trends also reflect the growth in demand for computer and
information technology services by particular industries around the world. The industries
with the greatest expenditure as well as the largest expected growth are led by discrete
manufacturing, communications and media, banking, and process manufacturing.
Expenditures by government, academia, and consumers are expected to grow at a
compound annual growth rate of 6.1%, 3.9% and 4.3% respectively through 2011. 2
The
graph below indicates the anticipated growth in spending by specific industries.
Figure 15.4 Worldwide IT Spending by Vertical Market
(million dollars)
Source: IDC Research Inc. (April 2007)3
China vis-à-vis India, Eastern Europe, Ireland, and the Philippines
A snapshot of India, Eastern Europe, Ireland, and the Philippines identifies factors that
contribute to each markets success as an information technology services exporter.
1 IDC Research Inc. (April 2007)
2 IDC Research Inc. (April 2007)
3 IDC Research Inc. (April 2007)
0
20
40
60
80
100
120
2006 2007 2008 2009 2010 2011
Business consulting
IT consulting
Systems integration
Network consulting and integration
Custom application development
0
10000
20000
30000
40000
50000
60000
2006 2007 2008 2009 2010 2011
Banking
Communications & media
Discrete manufacturing
Insurance
Securities & investment services
Process manufacturing

174
Countries compete on tax rate, communication costs, quality of physical infrastructure,
labor costs, and most importantly the depth, scope, and quality of the work force. They
also benefit from language affinity and geographic proximity to wealthy markets. Intense
competition also rewards technological innovators.
i. India.
India is a mature provider of information technology and business process outsourcing
that has successfully built intellectual capital across several IT skill categories.1 In 2005
exports generated approximately 80% of software revenue and Indian firms captured
approximately "3% of the global IT market."2 Indian companies progressed from low-
cost IT service providers to higher value added services providers with foreign
establishment in North America, the Middle East, China and Eastern Europe and a track
record of corporate acquisitions as well as ADR3 listings.
Indian firms compete on cost, service, and innovation. Indian firm Wipro provides ―IT
consulting, custom application design, development, reengineering and maintenance,
systems integration, package implementation, technology infrastructure outsourcing,
BPO services, and research and development services in the areas of hardware and
software design.‖ 4
The firm exemplifies leading Indian companies providing services at
client facilities, from remote development centers, and from other operations around the
world.
Indian firms face intense global competition as well as the universal challenge of
adequate labor supply in terms of cost, quality, and scope. In India firms are
experiencing increasing wage rates, an appreciating currency, and competition in its
domestic markets from other information technology firms.5 These developments have
prompted the migration of Indian firms to China.
China has a clear advantage in labor costs vis-à-vis India. China can invest in education
and actively recruit from the global labor pool to match India's scope of IT and BPO
expertise. To achieve a comparable global reach, China can expand language capabilities
and promote innovation in non-voice BPO. According to industry analysts, China has a
more favorable broadband subscriber base of 7.2 per 100 people to India's 1 per 100
people. In 2007, China's domestic market also spent 30% more than India's on
information technology services.6
China's diverse domestic market represents an
1 NeoIT (September 2005) Offshore Insights Market Report Series: "Research Summary: Mapping
Offshore Markets Update 2005" Vol.3, Iss.8. 2 Economist Intelligence Unit Industry Wire Forecast (December 10, 2007) "India: Telecoms and
Technology Forecast" 3 American depository receipt
4 Standard & Poor's (March 15, 2008) Stock Report Wipro Limited
5 Standard & Poor's (March 15, 2008)
6 Economist Intelligence Unit Industry Wire Forecast (January 29, 2008) "China: Telecoms and Technology
Forecast"

175
important catalyst for Chinese information technology service firms to improve the scope
and quality of their products. 1
ii. Ireland
Ireland's emergence as a software provider originates from favorable investment
incentives, recruitment of foreign information technology experts, and investment in
infrastructure. Ireland attracted investment with exceptionally low corporate tax rates,
which stood at 12.5% in 2007.2
The Irish Software Association recognizes the
contribution of foreign technology workers to Irish firms in the light of falling numbers
of indigenous IT graduates.3
The "Celtic Tiger" was an early beneficiary of European Structural Funds that helped
build out infrastructure for its "well educated, highly literate, English-speaking labor
force."4 A concerted effort by specific institutions helped to develop the software
industry in Ireland including the:
National Software Directorate
Industrial Development Authority
National Informatics Directorate
Center for Software Engineering
Software Program for Advanced Technology
ICC Venture Capital Fund
Ireland developed an educational focus on business, engineering and computer science to
build its software industry. 5
Ireland is a mature provider of software services with
favorable proximity to the EU and the United States.
iii. Eastern Europe
Many software service firms migrated to Eastern Europe to take advantage of low labor
costs, multiple language capabilities, and excellent engineering skills. Firms have
matched outsourcing opportunities from Western Europe with language capabilities in a
variety of East European countries. "The region has an advantage over cheaper rivals
such as India, Russia, and the Philippines because it is closer in time zone, distance and
culture to customers in Western Europe."6 Engineers in the Czech Republic, Poland, and
Hungary are well regarded as are the professionals who support IT firms.7 "Hungary has
1 Economist Intelligence Unit Industry Wire Forecast (January 29, 2008)
2 Industrial Development Authority (December 2007) Ireland Vital Statistics
3 Irish Software Association (2006) Annual Review 2005-2006
4 William Birdthistle (February 23, 2008) "Books: Burning Bright; How the Celtic Tiger Proved the
Begrudgers Wrong" Wall Street Journal p. w. 8 5 Ciara Heavin, Brian Fitzgerald (2004) "Institutional Impact on the Development of an IT Industry: the
Irish Experience" Journal of Global Information Technology Management Vol.7, Iss. 4 6 Robert Anderson (December 15, 2006) "Skilled Workers Fuel Investment" Financial Times
http://www.ft.com 7 McKinsey Global Institute (June 2005) The Emerging Global Labor Market: Part II - The Supply of

176
the highest number of Field medal winners in mathematics, the equivalent of the Nobel
Prize."1
Universities are recognized for their strong mathematical and computer
engineering programs. Eastern Europe's proximity to Western Europe and membership
in the EU has made the region a magnet for IT firms.
The European market poses challenges for China. To provide information technology
services and business process outsourcing, Chinese firms must overcome language
obstacles, cultural distance, and geographic proximity. To capture market share in
Europe, Chinese firms can strategically recruit from the global pool of labor for technical
and language skills. They can adopt a global perspective and recruit selectively from
different countries for "onshore, nearshore, and offshore" operations.
iv. The Philippines
The Philippines has an expanding business process outsourcing industry with 90%
foreign- ownership. 2
Inbound and outbound voice operations services, software
development, and back office services are the leading revenue generators as indicated in
the table below. "Low labor costs, high linguistic and cultural compatibility with the US,
and the quality of telecommunication infrastructure are widely recognized factors at work
in the Philippines' favor, especially for voice related operations."3 The Philippines also
competes on location costs.4 In comparison to China, the Philippines has lower fixed
telecom costs, lower office rent, and a lower corporate tax rate. 5
Table 15.4 The Philippines BPO Industry Overview 2005/2006
BPO service 06‘ Service
providers
05‘ Revenue
(million $)
05‘ Employment
(thousand)
Contact center 114 1792 112
Back office 62 180 22.5
Medical
transcription
64 70 5.5
Legal
transcription
9 6 .45
Other data
transcription
-- 39 3
Software
development
300 204 12
Animation 42 40 4.5
Engineering
design
14 48 2.8
Digital content 11 7 .5
Total 616 2386 163.25
Offshore Talent in Services 1 K. Yatish Rajawat (December 4, 2004) "High Tech Companies Plug into Eastern Europe" Knight Rider
Tribune Business News 2 Asian Development Bank (March 2007) An Analysis of the Philippine Business Process Outsourcing
Industry 3 International Monetary Fund (March 2007) "Can a Shift to Services Set the Philippines on a Stronger
Growth Path?" IMF Country Report Philippines: Selected Issues 4 Asian Development Bank (March 2007)
5 Asian Development Bank (March 2007)

177
Source: Asian Development Bank (2007)1
India, Eastern Europe, Ireland, and the Philippines effectively compete in information
technology and business process outsourcing. India relies on skilled professionals to help
Indian firms capture IT and business process outsourcing. Ireland welcomes foreign
workers and maintains a low corporate tax rate. Education in mathematics, engineering,
and a broad scope of professional fields has enabled firms to excel not only in
information technology services but also in business process outsourcing. Geographic
proximity and language affinity with wealthy, mature, technology markets such as the
European Union, the United States, and Japan benefit firms from Eastern Europe, the
Philippines, India, and China. Eastern Europe and Ireland have the advantage of
favorable market access in terms of movement of people and convenient contact with
clients in Europe. As outsourcing of non-core business operations rise, opportunities in
finance, law, and research, will expand for economies with exceptional professionals.
Synthesis of China's industry in a global context & recommendations
China has a burgeoning information technology and outsourcing industry. Wuxi, China
is the selected site for a "cloud computing center" that will provide supercomputing to
small and medium-size enterprises.2 China has a presence in the business process
outsourcing market serving clients primarily from Japan in traditional and "non-voice
business process outsourcing."3 China has well established companies such as Ufida,
Neusoft, and Digital China serving the domestic and in some cases global clients and
working closely with foreign direct investors.
China's exceptional economic growth, low cost labor pool, and reliable infrastructure
attracted investment from information technology leaders such as Microsoft, IBM,
Hewlett-Packard, Tata Consultancy Services, Wipro, and Infosys.4 Tata Consultancy
Services expects the sizable Chinese workforce to enable the firm to expand operations
on a large scale over the long term to provide outsourcing to global clients. 5
Firms
established operations in China to serve outsource clients in neighboring markets, execute
low cost R&D, and establish a foothold in the expanding Chinese market.
Industry analysts suggest China needs to expand the scope and enhance the quality of
information technology professionals. The rapid emergence of the commercial economy
and exceptional demand for professionals has caused a skills shortage in China.6 Tata
Consultancy Services also found higher operating costs, language a challenge, and
significant "staff attrition."7 China can also build expertise in soft skills such as
1 Asian Development Bank (March 2007)
2 J. Bonasia (February 29, 2008) "Cloud Computing Initiatives Being Floated" Investor's Business Daily
3 Talasila Rao (July 3, 2005) "Inside the Chinese IT Services Business" Business Today p. 66
4 CFO (October 2003) "The China Syndrome: US Companies Are Beginning to Outsource Technology
R&D to India and China. Will a Meltdown in Tech Jobs Follow?" Vol. 19, Iss. 13; p. 74 5 Joel Leahy (April 17, 2007) ―TCS Pushes into China to Set up an Eastern Hub" Financial Times
http://www.ft.com 6 McKinsey Global Institute (October 2005) Addressing China's Looming Talent Shortage
7 Joel Leahy (April 17, 2007)

178
communication, teamwork, and problem solving, which facilitate efficient and productive
business operations.1
In China analysts suggest, "access to venture capital remains limited, intellectual property
protection is poor and the link between academia and industry are still relatively weak."2
China is well positioned to compete in the global market due to low labor costs and its
gradual progress into higher value added information technology services. Industry
analysts suggest, however, that as much as 90% of high-technology exports from China
can be attributed to foreign investors.3
China can improve intellectual property
protection to foster technological innovation at home.
Chinese firms can expand the scope and quality of professional skills to improve their
competitive position in information technology and business process outsourcing. The
information technology industry requires a variety of professionals with technical and
interpersonal skills that facilitate operations and contribute to effective service production
and delivery. Industry surveys4 also anticipate a skills shortage and increased demand for
the following technical categories:
coders
developers
general networking
operating systems
programmers
radio frequency mobile
security
wireless technology
Language skills are invaluable in attracting clients for information technology and
business process outsourcing from Asia, Europe, and North America. Although Chinese
firms are well established in non-voice business process outsourcing, expanding language
capability will enable Chinese firms to serve clients in a greater range of information
technology and business process outsourcing segments and on a broader geographical
scale.
To meet demands in language, technical, and business management skills, academia can
help provide in-house training and continuing education in technical and soft skill
development. Adult education can help build expertise for new graduates and those
already in the marketplace. Ministry officials, corporate leaders, and academia can
consider how to most effectively improve educational attainment and expansion.
1 Officer. Multinational Information Technology Services Firm. Interview. March 14, 2008
2 Mure Dickie (October 9, 2007) "Innovation: Research and Development Is Slow to Grow" Financial
Times http://www.ft.com 3 Economist Intelligence Unit IndustryWire Forecast (January 29, 2008) ―China: Telecoms and Technology
Forecast‖ 4 The Center for Strategy Research, Inc. (2007) Skills Gaps in the World's IT Workforce: A CompTIA
International Research Study

179
Chinese firms can also strategically recruit from the global workforce to strengthen key
positions within the enterprise.
China can improve the financial environment for information technology and business
process outsourcing enterprises. Rapid technological innovation is a consistent feature of
industry trends in software delivery, product development, and infrastructure. Academia,
corporate and public research and development facilities generate technological
innovations. However, within the global industry, new businesses or "startups" play an
important role creating and commercializing technological innovations.
New technology businesses in China have comparatively less access to venture capital
than "startups" from abroad. In China, according to industry analysts, "although the
private sector contributes 52% of GDP...it accounts for only 27% of outstanding loans
from the banking sector."1 Chinese majority state-owned banks provide "the vast
majority of funds to state owned enterprises."2 To compete on a global basis, Chinese
"startups" require comparable access to venture capital and a more robust financial
services industry.
China can strengthen its intellectual property protection regime. High piracy rates
depress software income. With an 82% piracy rate in China, owners of proprietary
software forgo income. This represents an opportunity cost for firms that could otherwise
invest such income in research and development, employee training, marketing, etc.
Piracy can be deterred through public education, enforcement of copyright treaties,
dedicated resources, and government practice. With the protection of intellectual
property, software firms can invest income, otherwise lost to piracy, in technological
innovation, new technical and language skills, and export strategy, for example, to
improve their position in an intensely competitive global software market.
Table 15.5 Percentage of Total Software Revenues Spent on Pirated Software, 2006
Country % Country %
Switzerland 26% China 82%
United States 21% Malaysia 60%
United Kingdom 27% Russia 80%
Ireland 36% India 71%
Czech Republic 39% Philippines 71%
Source: BSA and IDC (2006)3
Transport
1 Economist Intelligence Unit Industry Wire Forecast (January 29, 2008) "China: Financial Services
Forecast" 2 Economist Intelligence Unit Industry Wire Forecast (January 29, 2008)
3 Business Software Alliance (2006) Fourth Annual BSA and IDC Global Software Piracy Study
http://www.bsa.org/globalstudy

180
World exports of transport services grew on average 10% per year from 2000 to 2006.1
Demand for international sea freight, air freight, and auxiliary services reflects growth in
global trade. Transport firms are encountering increasing congestion, heightened
environmental requirements, and stringent security rules. Transport firms and
governments are working to counter congestion with infrastructure investment, increased
off-loading efficiency, improved rail and trucking services as well as route adjustments.
They are focusing on technology to improve efficiency, protect the environment, and
meet security regulations.
The leading exporters and importers of transportation services in 2006 were the European
Union (25), the United States, Japan, the Republic of Korea, Hong Kong China, and
China according to the WTO. The EU's share of exports grew from 42.2% in 2000 to
44.4% in 2006, the US share decreased from 14.5% in 2000 to 11.1% in 2006, Japan's
share also decreased from 7.3% in 2000 to 6% in 2006. 2
The Republic of Korea's share
grew from 3.9% in 2000 to 4.1% in 2006. Hong Kong China's share decreased from
3.7% in 2000 to 3.5% in 2006. 3
China's share of the total value of transport grew from
1.1% in 2000 to 3.3% in 2006.
Large trading economies receive a substantial proportion of transportation exports. Over
50% of EU exports went to other EU countries, 15% went to the United States, 3.4% to
Switzerland, and 2.5% to Japan. 4 For the US, 32.3% of exports went to the EU, 12.8% to
Japan, 9% to Canada, 4.8% to Mexico and 4% to Korea. 5
For Japan, 22.9% of exports
went to the EU, 21.4% to the US, 7.9% to Hong Kong China, 7.7% to China, and 6.7% to
Korea. 6
For Korea, 23.2% of exports went to the United States, 17.1% to China, 13.9%
to the EU, and 10.2% to Japan. 7 Hong Kong's exports to the United States were also
significant at 18.2%, 16% of exports went to China, and 15.4% went to the EU.8
The top two traders of transportation services have substantially different compositions of
trade. Sea freight is almost 50% of transportation services exports from the EU. While
air passengers represent the largest portion of the US transportation services exports.
Exports by sector are detailed in the charts below for the EU (25) and the US.
1 World Trade Organization (2007)
2 World Trade Organization (2007)
3 World Trade Organization (2007)
4 World Trade Organization (2007)
5 World Trade Organization (2007)
6 World Trade Organization (2007)
7 World Trade Organization (2007)
8 World Trade Organization (2007)

181
Figure 15.5 Structure of Transportation Services Exports Extra-EU (25), 2005
Source: WTO (2007)
Figure 15.6 Structure of Transportation Services Exports United States, 2005
Source: WTO (2007)
In terms of trade in transport services with China, the EU was the largest exporter
followed by the Republic of Korea, Hong Kong China, Japan, the United States, and
Singapore. The leading importers from China were the EU, the US, Hong Kong China,
Japan, the Republic of Korea, and Singapore. The value of trade is growing with each
economy. Japan in particular is increasing its imports of transport services from China.
The US is also increasing its imports however at a decreasing rate. The same dynamic is
true for Singapore and the European Union (EU) and to a lesser degree the Republic of
Korea. The chart below illustrates transport exports and imports from China in 2005.
6.1%
20.0%
8.6%
47.8%
1.0%
5.5%
10.8%
Air freight
Air passengers
Other air transport
Sea freight
Sea passengers
Other sea transport
Other transport
14.4%
32.8%
20.5%
8.0%
0.5%
18.7%
5.1% Air freight
Air passengers
Other air transport
Sea freight
Sea passengers
Other sea transport
Other transport

182
Figure 15.7 Trade in Transportation Services with China in 2005
(million dollars)
Source: WTO (2007)
Industry trends
Growth in international sea freight, air freight, and auxiliary services mirrors trade
expansion.
International seaborne trade reached 7.4 billion tons in 2006 (see chart below). The
growth trajectory according to UNCTAD is positively correlated with "world GDP and
merchandise trade."1 In addition, "about 90% of world trade is seaborne, and both the
EU and China are major participants in maritime affairs.‖2 At the same time, rates for
seaborne services continue to decline in part due to rising capacity.3 In October of 2007,
many carriers found that they were facing significant cost pressures and that "current rate
levels [were] unsustainable."4 Despite increasing demand and significant market entry
barriers, competition is intensifying in seaborne trade.
1 For a thorough review of seaborne trade in crude oil and petroleum products see: United Nations
Conference on Trade and Development (2007) Review of Maritime Transport 2 BBC Monitoring Asia Pacific (February 28, 2008) "China-EU Shipping Pact to Take Effect 1 March" p.1
3 Organization of Economic Cooperation and Development (August, 2001) Regulatory Issues in
International Maritime Transport 4 Logistics Today (October 2007) "Transpacific Growth Sustainable, Rates Aren't." Vol. 48, Iss. 10. p.14
0
500 1000 1500 2000 2500 3000 3500 4000 4500 5000
European Union
(25)
Korea, Republic
of
Hong
Kong,
China
Japan United States
Singapore
Exports to China Imports from China

183
Figure 15.8 Development of Intl. Seaborne Trade, Selected Years
(millions of tons)
Source: UNCTAD (2007)
The air freight market is expected to expand at a rate of "6.1% per year"1 as a reflection
of increased global trade. Generally air freight costs "7-10 times that of ocean
transport."2
This relatively "high-value" segment of the transportation market is
dominated by firms such as Federal Express Corp., United Parcel Service Inc., and DHL
Worldwide. "International shipments, particularly in Asia, have recently been climbing
at annual rates near 20%.‖3 Bilateral arrangements govern landing rights for the air
freight industry; consequently, governments are engaging counterparts in fast-growing
economies to secure market access.
The trucking sector is also experiencing a boom. In the US "imports from Asia surged
from 7.8 million TEUs to 13.6 million TEUs between 2000 and 2005, an average
increase of 11.7%."4 Many governments are aggressively regulating "noxious emissions
from the trucks that move containers between marine terminals and local distribution
centers and railheads."5 Increased demand for rail in Asia, Europe, and the US is
prompting infrastructure investment. In the short term, networks are using "double
tracking and increasing side length" to accommodate volume.6 Over the long term,
governments are using tax incentives, public private partnerships, and privatization to
renew and build out rail infrastructure.
Time-to-market. The transport industry ties sea freight, air freight, trucking, and rail
together to facilitate the movement of goods from point of origin to final destination.
Across the transport sector, firms are responding to important trends by lowering costs
and enhancing efficiency to remain competitive.
1 Boeing (2007) Current Market Outlook http://www.boeing.com/
2 Logistics Today (September 2006) "How Much Does Port Congestion Costs? Bottlenecks add Costs That
Can Scuttle Any Companies Sourcing Strategy" Vol. 47, Iss. 9; p.10 3 Kevin Kirkeby (December 27, 2007) Standard & Poor's Industry Surveys Transportation: Commercial
4 Note the standard measure of container size is 20 foot equivalent units or TEUs John Gallagher (March 12,
2007) ―Leveraging China" Traffic World p.1 5 Peter Tirschwell (March 10, 2008) "Why Trucks May Sink Trade" Journal of Commerce p.1
6 Kevin Kirkeby (December 27, 2007)
0
1000
2000
3000
4000
5000
6000
7000
8000
1970 1980 1990 2000 2006
tanker cargo
dry cargo
main bulks
total (all cargo)

184
Shippers are increasingly focused on time-to-market to ensure the profitability of new
and unique retail products. Consequently, firms are developing express services to meet
this demand. "JB Hunt Transport Services is teaming with Matson Navigation Company
to launch an expedited freight service...[that will] guarantee transit times and deliveries of
container shipments."1 Tight deadlines are forcing firms to move to a combination of sea
and air freight particularly in the face of transport bottlenecks. "As much as half the air
freight from China to the US could be upgraded ocean freight that's flying to ensure
schedule integrity."2 Industrial manufacturers are contracting with one or two large firms
rather than several to obtain "faster service".3 The influence of time-to-market on
profitability, particularly in the retail sector, will continue to motivate transport firms to
improve the speed of transport services.
Efficiency. Firms are squeezing efficiency out of every aspect of door-to-door transport
to manage the costs of the total supply chain. They are combining less than container
load into single containers and shooting for "‗fantastic‘ capacity utilization of 99%."4
They are "targeting efficiency improvements where land and water meet."5 At the Port of
Los Angeles, trucks use "barcoded routing passes and optical character recognition
cameras"6
to quickly transit the terminal. In rail, companies are adopting lean
management techniques to improve efficiency. Companies are assessing total
distribution costs and looking for cost savings in transport and inventory-related
expenditures. To remain competitive in the industry, firms consistently focus on driving
down costs.
Information technology integration. IT firms and logistics firms are integrating to
improve efficiency and security. Firms are using innovative technology to consolidate,
synchronize, and disperse loads quickly and respond to security concerns. The
development of bar coding, radio frequency, sensor technology, as well as real time
tracking, exemplify innovations now viewed as necessities due to efficiency and security
needs.7 With the successful deployment of these technologies, regulatory entities are
adopting technological innovations as requirements. For example, radio frequency
identification (RFID) truck tags are now standard requirements in Los Angeles and Long
Beach.8
Security certifications are also helping to facilitate business.9
Effective
1 John Gallagher (March 12, 2007) "Leveraging China" Traffic World p.1
2 Logistics Today (September 2006) "How Much Does Port Congestion Costs? Bottlenecks add Costs That
Can Scuttle Any Companies Sourcing Strategy" Vol. 47 Iss. 9; p.10 3 Katherine Yung (August 21, 2005) ―Chinese Trade Strains Port System" Knight Rider Tribune Business
News 4 Jillian Hunter (July 2007) "Going Green on Land and Sea: What Is the European Industry Doing to Cope
with Rising Transport Energy Costs and Demands for Sustainability? Transport Vol. 49, Iss. 7; p. 34 5 Katherine Yung (August 21, 2005)
6 Katherine Yung (August 21, 2005)
7 Larry Greenemeier (September 20, 2005) "IBM Launches Wireless Shipping Security" InformationWeek
http://www.informationweek.com 8 Logistics Today (October 2007) "Los Angeles/Long Beach Require Truck Tags"
http://www.logisticstoday.com 9 Certifications under the US Customs-Trade Partnership Against Terrorism (C-TPAT) and the EU‘s more
recent Authorized Economic Operator (AEO) are necessities for easily conducting business. Bernie Hart
(January 2008) "Opportunities or Adversity for Global Supply Chains in 2008?" Logistics Today

185
technology adopters stand to gain from successful implementation of efficiency and
security innovations. Firms are using relationships with technology companies to
develop and deploy innovative solutions to meet efficiency and security demands.
Outsourcing. Surveys of shippers found that they are inclined to outsource more of their
logistics business to reliable firms.1 Manufacturers continue to expand their use of
external transport companies to reduce costs and capture new technologies. Transport
firms are therefore working to provide a portfolio of IT enhanced transport services that
tackle administrative and security issues. Competition for the outsource market is intense
and studies have shown that contracts for such services are growing in length of time.2
Furthermore, factors in addition to cost influence the outsourcing relationship.
Companies consider the level of trust, confidence, reliability, and consistent quality of
service, when engaging a partner. 3
Rising fuel costs . The principal determinants of cost in the transportation industry are
fuel, weather, labor, and equipment.4 To respond to rising fuel costs shippers are
examining alternative modes of transport. For example in Europe, rail is sought as a
substitute for trucking. "Rotterdam's newly opened Betuwelijn rail line...[will] eventually
double the height of trains to…allow optimal fuel efficiency."5 In the trucking industry,
firms are working to achieve driving techniques that slow fuel consumption. Firms are
also experimenting with different fuel mixtures, synthetic diesel, and biofuels to reduce
emissions. 6
With the expectation of higher environmental standards, "some shipping
companies have already announced voluntary conversion to cleaner fuel." 7
To conserve
fuel and reduce emissions, carriers are "plugging into shore side electrical power…rather
than burning diesel fuel while at berth."8
Industry alliances. Within the industry there is an increasing number of alliances and
cross modal deals. Firms in the transportation industry are entering into cooperative
arrangements to offer efficient and fast service. Maersk will "enter a trans-Pacific vessel
sharing agreement… to cut costs and maintain or expand service while still competing on
price and service."9 Schneider Logistics (Tianjin) "purchased a port consolidator and an
air freight forwarder,"10
to control efficiencies and ensure delivery times. Firms are
integrating across modes to adapt to the changing composition of trade. China is
http://www.logisticstoday.com 1 Bill Dibenedetto (October 29, 2007) "Gaining Ground" Journal of Commerce p. 1
2 Yuko Aoyama, Samuel J. Ratick (April 2007) "Trust, Transactions, and Information Technologies in the
US Logistics Industry" Economic Geography Vol. 83, Iss. 2. 3 Yuko Aoyama, Samuel J. Ratick (April 2007)
4 Kevin Kirkeby (December 27, 2007) Standard & Poor's Industry Surveys Transportation: Commercial
5 Joanne Hunter (July 2007) "Going Green on Land and Sea: What Is the European Industry Doing to Cope
with Rising Transport Energy Costs and Demands for Sustainability?‖ Transport Vol. 49, Iss. 7; p. 32 6 Joanne Hunter (July 2007)
7 South Florida Sun Sentinel (February 15, 2008) "US Seeks to Cut Pollution from Foreign Ships" p. a. 9.
8 World Trade (March 2006) "What Business Leaders Need to Know about Pacific Maritime: As Trade
Volumes Hit New Highs, West Coast Ports add Capacity and Pay More Attention to the Environment" Vol.
19, Iss. 3; p. 40 9 Joseph Bonniy (March 10, 2008) "Follow the Leader" Journal of Commerce
10 John Gallagher (March 12, 2007) "Leveraging China" Traffic World p.1

186
producing more industrial equipment such as car and machine parts, ocean carriers and
trucking companies are coming together to offer services to these "longer industrial
supply chains."1 Intermodal conveyance is helping to carry industrial goods in a more
seamless manner from point-to-point.
Rules & Regulations. A complex set of rules govern international shipping including
"legal, technical and economic regulations."2 Multilateral institutions set standards and
address rights and obligations as well as regulations. Governments are taking steps to
open the market in shipping and tightening environmental and security requirements.
Bilateral agreements on maritime are on the rise with the intent of easing trade via
provisions on port access, establishment, and national treatment. The conference system
is also experiencing a shift to discussion agreements. The regulatory environment for
carriers is changing.
The principle governing body in international shipping is the United Nations and its
subsidiary entity the International Maritime Organization (IMO). The UN Convention on
the Law of the Sea (UNCLOS) is the seminal legal instrument that sets out rights and
obligations of member states with regard to their vessels. The United Nations also
established conventions on: liner conferences, carriage of goods by sea, maritime liens
and mortgages, multimodal transport of goods, and conditions for registration of ships,
which have various contracting states.3
The IMO‘s 158 members have agreed numerous conventions and are responding to
environmental and security concerns. The conventions address:
load lines,
oil pollution,
civil liability,
prevention of collisions,
container safety,
safety of life at sea (SOLAS),
professional standards,
safety management (ISM Code),
double hulls,
removal of wrecks
Security concerns prompted the IMO to adopt the International Ship and Port Security
Code (ISPS), which took effect in 2004. The IMO's Maritime Safety Committee (MSC)
circulates guidance to members on security developments. IMO members are considering
a convention on ship recycling due to environmental concerns.
1 Paul Page (March 12, 2007) "Reliable Service" Traffic World p.1
2 Bill Dibenedetto (October 29, 2007) "Gaining Ground" Journal of Commerce p.1
3 The status of these conventions can be found at http://www.UN.org/law/

187
The World Customs Organization (WCO) has 144 members and helps to facilitate trade.
Due to security concerns, the WCO adopted the Framework of Standards to Secure and
Facilitate Global Trade in 2005. The Framework emphasizes customs-to-customs and
customs-to-business coordination.1
In 2006, the International Labor Organization (ILO) adopted the Maritime Labor
Convention in 2006 encompassing "65 international labor standards related to seafarers"
from the past eight decades. 2
International maritime laws and conventions are extensive and have been divided into
two groups by the OECD.
OECD Index of Regulations:
Regulations related to the rights and obligations of states and to safety and the protection
of the environment:
the Law of the Sea - rights and obligations of flags states;
international safety and environment regulations;
national environmental and safety regulations;
flag state and port state inspections;
international labor regulations.
Regulations related to commercial operations and practices:
shipping specific economic policy regulations;
ship registration conditions;
cargo reservation/cargo sharing provisions;
cabotage laws;
cargo liability regimes;
national security measures;
competition legislation. 3
In terms of the impact on industry, it is important to examine those regulations that are in
flux and have a direct impact on cost, technological investment, and market access.
National regulations
At the national level, a number of governments are revisiting competition policy and
foreign direct investment with regard to shipping, port services, and logistics. In Korea,
1 United Nations Conference on Trade and Development (2007) Review of Maritime Transport
2 United Nations Conference on Trade and Development (2007)
3 The OECD's review of regulatory issues in international maritime transport provides a comprehensive and
detailed review of individual rules and regulations. The report can be found on the SourceOECD database.
Organization of Economic Cooperation and Development (August, 2001) Regulatory Issues in International
Maritime Transport

188
the government has granted parity for international carriers to move commodities
nationally. The government has eased the licensing requirements for foreign branch
establishments and allows "foreign ownership of Korean vessels."1
To lower
transportation costs "foreign flagged vessels are allowed to use Korean ports subject to
the same conditions as Korean flagged vessels." To expand port infrastructure, the
Korean government is welcoming foreign investment and offering build-operate-transfer
concessions. They are also allowing private investment to expand container terminals.
Singapore maintains a relatively open market with minimal restrictions on "foreign
participation in the shipping industry"2 including for port services. In the air freight
sector, Japan privatized its postal services creating four new entities including Japan Post
Service company. The company has entered into a joint venture "to provide international
logistics services, focusing on China and the rest of Asia."3 Japan is also using bilateral
agreements to provide market access for air freight carriers.4 Establishment opportunities
in Japan allow transport firms to fortify their operations and extend services into the
entire region.
The European Union established regulatory priorities for the maritime industry for
environmental protection, security, and strategic industrial issues. The EU is in the early
process of establishing rules for the "reduction of CO2 emissions and pollution by
shipping"5 and reducing exhaust from ships at port with tax incentives for "shore-side
electricity." 6
From a security standpoint, the EU intends to strengthen surveillance
systems to ensure "the safety of navigation, marine pollution, law enforcement, and
overall security." The European Commission amended the Community Customs Code in
2006 with measures to ensure security.7
The EU intends to strengthen international regulations governing air and ballast
discharges and will seek stronger "enforcement of international maritime law." The EU
will promote shipping as an alternative to trucking, which is less energy efficient. To
facilitate shipping the EU will simplify the "administrative and customs formalities for
intra-EU maritime services." 8
The EU intends to bring scientists, industry, decision-
makers together to consider measures to attain "competitive, safe and secure shipping,
ports and related sectors." As one of China's largest trading partners, these policy
priorities will bear on the operation and pollution controls of Chinese carriers.
1 World Trade Organization (2004) Trade Policy Review Republic of Korea Report by the Secretariat
2 World Trade Organization (2004) Trade Policy Review Singapore Report by the Secretariat
3 Journal of Commerce (February 27, 2008) "Japan Post to Set up International Logistics Firm" p.1
4 Logistics Today (October 2007) "Air Freight: UPS and Polar Two Expands Japanese Air Operations"
http://www.logisticstoday.com 5 Commission of the European Communities (October 10, 2007) Communication from the Commission to
the European Parliament, the Council, the European Economic and Social Committee and the Committee
of the Regions: an Integrated Maritime Policy for the European Union 6 Commission of the European Communities (October 10, 2007)
7 United Nations Conference on Trade and Development (2007)
8 Commission of the European Communities (October 10, 2007)

189
The United States has set priorities for stronger environmental and security policies.
Congressional representatives are investigating the pollution created from ships at port in
the United States. They are considering legislation in advance of the proposed agreement
under consideration in the UN International Maritime Organization to reduce pollution
from shipping.1 The US imposed security regulations that, for example, require advance
submission of documentation 24 hours before ―cargo is laden on board a vessel in a
foreign port bound for the US or before cargo is laden on a vessel in a US port."2
At the international level, the conference system for carriers is changing. There is a shift
away from conferences to "consortia, strategic alliances, capacity accords and discussion
agreements."3 These cooperative mechanisms are designed to provide stability in the
industry with agreements on freight rates, allocated sailings, and door-to-door services
for example. The UN Convention on a Code of Conduct for Liner Conferences ("UN
Liner Code") sets out standards and obligations.
As restrictions on competition, such agreements are coming under increased scrutiny. A
number of governments are considering the impact of national antitrust immunity
exemptions on the larger economy. The European Commission, US Department of
Justice, and South Korean competition authority are reevaluating liner arrangements.4
Revisions to EU regulations, for example, are expected to allow for information sharing
and prohibit price-fixing and collusion.5 The practical effect of such changes will be
more intense competition in the industry and potentially lower profit margins.
Cabotage: coastal shipping
Cabotage restrictions remain firmly in place in many countries. A few countries have
taken steps to ease restrictions. For example, New Zealand lifts cabotage requirements in
instances where "specialist" ships are required. The European Commission's Regulation
3577/92 eased rules for intra-EU trade. The Jones Act remains securely intact in the
United States. Such restrictions according to the OECD raise costs for domestic shippers.
6
Recommendations for China
1 South Florida Sun Sentinel (February 15, 2008) "US Seeks to Cut Pollution from Foreign Ships" p. a. 9
2 Purchasing (October 9, 2003) "Ocean Shipping Industry Weather Is a Sea Change" Vol. 132, Iss. 5; p. 49
3 The OECD's review of regulatory issues in international maritime transport provides a comprehensive and
detailed review of individual rules and regulations. The report can be found on the SourceOECD database.
Organization of Economic Cooperation and Development (August, 2001) Regulatory Issues in International
Maritime Transport 4 Perry Trunick (May 2006) ―Maritime's Antitrust Immunity Is Coming to an End" Logistics Today Vol. 47,
Iss. 5; p.1 5 Peter Leach, (September 10, 2007) "End of the Line" Journal of Commerce p. 1
6 The OECD's review of regulatory issues in international maritime transport provides a comprehensive and
detailed review of individual rules and regulations. The report can be found on the SourceOECD database.
Organization of Economic Cooperation and Development (August, 2001) Regulatory Issues in International
Maritime Transport

190
Many trends in the transport industry originate from the emergence of China as a leading
exporter and importer. Moving goods in and out of China has reshaped shipping routes
and is gradually bringing the global industry into the mainland. "The Chinese logistics
market generated revenue of $7.38 trillion in 2006" and is expected to grow to $28.78
trillion by 2013."1
China can improve the domestic and international regulatory
environment and firms can concentrate on technological innovation and strategic
alliances to compete in the global transport market.
A complex set of rules govern international shipping including "legal, technical and
economic regulations."2 Multilateral institutions set standards and address rights and
obligations as well as regulations. Governments are taking steps to open the market in
shipping and tightening environmental and security requirements. Bilateral agreements
on maritime are on the rise with the intent of easing trade via provisions on port access,
establishment, and national treatment. The conference system is also experiencing a shift
to discussion agreements. Chinese engagement multilaterally and bilaterally can help
reduce obstacles for Chinese firms.
China can expand its significant engagement in the International Maritime Organization,
World Customs Organization, and the International Labor Organization. From an
industry standpoint, increasing international and national concerns about the environment
and security will have an impact on how carriers operate at home and abroad. More
stringent rules will influence industry investment decisions, routes, and day-to-day
operations. As a prominent participant in the transport industry, China's experience
grappling with pollution, safety, and life at sea is important in shaping the global
regulatory environment for the transport industry.
China can foster technological innovation in the transport industry. Technological
innovation can help Chinese firms grapple with rising energy costs, infrastructure
constraints, and environmentally damaging levels of pollution from air, ground, and sea
transport. Firms that are able to reduce energy consumption, improve carrying capacity
and inter-modal transfers, and reduce pollution will be better positioned to compete
globally. China can focus on technological innovation to enable firms to effectively
operate in a global regulatory environment that at the international and national level will
implement more stringent environmental and security regulations on carriers.
In China regional regulatory differences, infrastructure shortcomings, and bottlenecks
contribute to comparatively high domestic logistics costs.3
Different rules and
regulations at the regional and local levels are a primary challenge. "Complex licensing
processes…[and] unnecessary unloading and uploading cause delays and add to
excessive costs"4 Underdeveloped financial services, particularly in the bonding market
1 Business Wire (December 6, 2007) "Increasing Government Support for Transportation Infrastructure Aid
the Growth Of the Logistics Industry in China‖ 2 Bill Dibenedetto (October 29, 2007) "Gaining Ground" Journal of Commerce p.1
3 Peter Tirschwell (June 11, 2007) "China's New Mantra: Rail‖ Journal of Commerce p.1
4 Business Wire (December 6, 2007)

191
also constrain transport firms. These matters influence the overall cost of conducting
international business, delivery times, and quality of service.
To improve the position of Chinese firms in the global transport market, China can
improve and harmonize transport rules and regulations and their administration at home
at the provincial and city level. The Chinese government does intend to "streamline
administration" in transport with consolidation of responsibilities in super ministries.1
China can foster cooperation among city and provincial administrators with information
sharing, exchange of technical experts, and electronic government.
With mobile and broadband technology, transport officials at each level of government
can gather virtually to share their regulatory experiences with the transport industry.
They can cooperatively establish procedural transparency and make available online rules
and regulations to facilitate industry‘s understanding of administrative and licensing
procedures and implementation. They can explain how they have worked to address
environmental and security concerns. Regulatory officials can describe practical
approaches that improve administrative efficiency in trucking, rail, and maritime trade.
China can also promote this degree of cooperation at the multilateral level.
In summary, policymakers can be attuned to and engage in multilateral and bilateral
discussions on:
changes in national competition policies and foreign direct investment in
shipping, port services, and logistics
increasing international and national environmental standards and security
requirements for air, ground, and ocean carriers
domestically, the government can foster regulatory cooperation across
provinces with electronic government to ease costs for Chinese firms
operating globally
Firms can:
anticipate more stringent rules on air, ground, and water pollution
develop and deploy technology to lower emissions and improve energy
efficiency of carriers in operation as a competitive strategy
use relationships with technology companies to consolidate, synchronize, and
disperse loads quickly to meet efficiency demands
use industry alliances to build efficient and fast service across modes from
point of origin to point of destination
recognize that firms outsourcing transport and logistics services consider, in
addition to cost, the level of trust, confidence, and consistent quality of service
when engaging a partner
1 Financial Times (March 4, 2008) "China to Merge Ministries in Government Revamp" http://www.ft.com

192
Animation
Animation is a global industry with participants around the world engaging in a variety of
production components and market segments. Many countries have a vibrant animation
sector creating original content and operating in a growing and intensely competitive
market. The emergence of a multitude of media platforms creates growing demand for
animation. Labor costs and technology also influence the structure and the development
of the animation industry. Intellectual property protection is an important determinant of
profitability for animation houses and venture capital influences their growth. Firms in
the animation industry use a variety of methods to sustain profits and compete in a
dynamic global market.
Animation is an important part of the audiovisual, broadcasting, advertising, and
multimedia sectors. In 2006, four of the top 10 grossing movies of the year worldwide
were animated and special effects were used in all of the other six.1 In broadcasting,
animators experience increasing demand from television, cable, and broadband channels
dedicated to children and animation, for example, "Nickelodeon (1.33 million
subscribers), Cartoon Network (5.2 million subscribers),"2
as well as the website
Aniboom.3
Commercial advertisements, educational programs, and medical videos
provide a steady stream of revenue and creative projects for many animators. Web
content, the gaming industry, and mobile phones are also expanding markets for
animators. In 2008, the size of the global animation market was estimated at $100
billion.4
Examining trade in audiovisual services provides insight into trade in animation related to
motion pictures and television programs. In 2005, the United States was the number one
exporter of audiovisual services at $10,379 million. The European Union (25) was
second at $9,223 million, Canada exported $1,896 million, followed by Mexico, Hong
Kong, Norway, Argentina, China, and the Republic of Korea. The principal importers
were the European Union (25), followed by Canada, the US, Japan, Australia, the
Russian Federation, Norway, Brazil, and Mexico. Over 60% of US exports go to the
European Union (25), 9% to Japan, 7% to Canada, 3.8% to Australia, and 2.4% to
Mexico followed by Brazil at 2.3%. Over 50% of EU exports go to other EU countries,
20% go to the United States, 6.7% to Switzerland, 6% to Japan, .9% to Brazil.
1 Tuna Amobi, William Donald (September 20, 2007) "Industry Surveys Movies & Home Entertainment"
Standard & Poor's 2 Television Asia (December 2006) ―Anime Expands its Horizons‖ Vol. 13, Iss. 10; p. 86
3 http://www.aniboom.com/
4 Kathleen Kingsbury (February 11, 2008) "Fantasy League" Time Vol. 171, Iss. 6; p. 1.

193
Figure 15.9 Destination of 05‘ US Exports of Audiovisual & Related Services
(million dollars)
Source: WTO (2007)1
Animation around the world
Animation houses are well established in China. "Chinese animated films have been
winning international awards since the 1950s."2 According to Animation Magazine,
China hosts 5,473 animation studios, produced 1,400 hours of animation, with industry
revenues of $336 million, in 2006. 3
The 2005 release of "Thru The Mobius Strip" a
three-dimensional (3-D) animated feature film produced at the Institute of Digital Media
Technology in Shenzhen demonstrates the growing production and business acumen of
Chinese animation houses. The film uses a storyline originating from France, was
underwritten by Hong Kong investors, and was created for domestic and international
distribution with merchandising and downloadable offerings.4
Animation houses thrive in: Japan, Korea, the Philippines, India, Thailand, Hong Kong
SAR, Singapore, Malaysia, and Australia and New Zealand. These countries have
successful animation houses and audiences with unique tastes. For example, Japanese
animation offers a unique genre of "anime," originating from "manga" (comic books),
which has grown in global popularity through "cartoon, film, TV, video, video games and
digital formats." 5
In 2006, Japan hosted 630 animation houses and had a market size of
$2 billion. The Japanese animation industry produces original content and consistently
engages in co-production arrangements with other firms from the region and in the West.
1 World Trade Organization (2007)
2 Mary Farquhar (May 2002) "Animation in Asia and the Pacific" The Journal of Asian Studies Vol. 61, No.
2; p. 678 3 Claire Webb, (April 2007) "The Asian Connection: Facts & Figures" Animation Magazine Vol. 21, No. 4;
p. 20 4 Bizchina China Daily (May 4, 2006) "HK Could Boost Mainland in the Nation Industry" see
http://www.chinadaily.com.cn 5 Mary Farquhar (May 2002)
European Union
(25), 6630
Japan, 938
Canada, 726
Australia, 397
Mexico, 244 Brazil, 239
Others, 527

194
The Korean industry is also well developed. In 2006, Korea hosted 300 animation houses
with exports of $76 million.1 Korea has a reputation for "meticulous cartoon-drawing
skill based on storyboards provided by European and American studios,"2 Korean
animation houses create proprietary content. For example, Korean firms Ocon and Iconix
co-produced the cartoon series "Pororo the Little Penguin" for worldwide broadcast and
online distribution.3 The Japanese and Korean industries are noteworthy due to their
ability to create original, commercially valuable animation productions. Firms in each
country also use co-production arrangements to effectively produce, distribute, market,
and merchandise their animation fare globally.
Animation houses in India, the Philippines, and Thailand originated primarily as
outsourcing bases and are now moving into the creation of original content to capture
higher value-added returns. In 2006, revenues totaled $354 million for the Indian
animation industry,4 and entrepreneurs are rapidly creating original productions. The
Philippines had over 20 animation studios in 2006,5 and was one of the original locations
for cartoon outsourcing in the region. The Philippine government is investing in the
animation industry and supporting technical schools as well as international animation
festivals to recapture the market lost to lower-cost producers. Thailand's Monk Studio
produced "Kankluai" a 3-D animated feature recognized at international film festivals in
Toronto and Madrid.6 In 2007, Thailand's animation industry was estimated at $380
million.
European animation houses are well established and produce a significant share of
animated films. In 2005, Europe produced 32 animated films, the US produced 34, and
18 were from other countries.7 From the perspective of the European DVD animation
market, France is the leader with the greatest share at 19.4%, followed by Germany at
11.7%, Italy at 14%, Spain at 8.5%, and the UK at 6.9% in 2007.8 Firms in these
countries maintain an international perspective in investment and production. For
example, the "Galician Audiovisual Consortium [based in Spain] is looking toward
second-phase expansion: deepening international R&D, honing an exportable product,
[and] diversification."9 Animation houses around the world are part of an increasingly
integrated global market.
1 Sarah Gurman (April 2006) "By the Numbers" Animation Magazine Vol. 20, No. 4.
http://www.animationmagazine.net 2 Yonhap (January 4, 2006) "South Korea to Inject Huge Funds into Animation Industry"
http://www.yonhapnews.net/engservices 3 Hollywood Reporter (January 14, 2007) "Drawing Attention: Seven Companies Leading the Way in
International Animation" Vol. 397, Iss. 43; p. 20 4 Ritesh Gupta (October 1, 2007) "India Rising" Asia Image http://www.onscreenasia.com/article-927-
indiarising-onscreenasia.html 5 Claire Webb (April 2007)
6 Harry Maurer, Cristina Linblad (November 26, 2007) "Animation Nation" Business Week Iss. 4060; p. 10
7 Screen Digest (July 2006) "Banner Year for European Animation: a Huge Chunk Out Of the Hitherto
Hollywood Dominated Market" Vol. 234 http://www.screendigest.com/ 8 Screen Digest (February 2007) "Animation Migrates from VHS to DVD: Slow Transition from Analog to
Digital Holds Lessons for Hi-def." Vol. 39 http://www.screendigest.com/ 9 Variety (September 25, 2006) "Media Locals Think Global" Vol. 404, Iss. 6; p.23

195
Global industry
The global industry is largely networked through commercial arrangements across the
industry's value chain. A critical aspect of the industry is the life cycle of an animated
production. The return on investment for the initial components of the lifecycle, for
example, from planning to post-production to theater, generally amounts to a breakeven
point.1 Profitability for animation productions is dependent on the latter stages of the life
cycle involving, for example, DVD sales, licensing, and syndication returns. Therefore
profitable animation houses effectively manage their intellectual property. Firms work
together using a variety of commercial agreements to designate production and
distribution responsibilities as well as ownership of intellectual property rights.
Table 15.6 Sample Industry Value Chain
Planning Pre-
production
Production Post-
productio
n
Distribution Platforms
Initiation of feature
film, cartoon,
commercial, special
effects production
Artwork Clay modeling Color
correction
Film festivals (Market
for animation
productions)
Broadban
d
Financing: maybe
sole or cooperative
financing from a
variety of sources
Character
development
Computer Generated
Imagery (CGI):
software includes
maya, after effects,
soft image, side
effects, flash,
lightwave, toonboom
Editing Franchising (cereal
boxes, clothes,
coloring books, toys,,
etc.)
Broadcast
Partnerships:
agreements across the
value chain
Color
selection
Drawing or cel
animation
Musical
score
IPR intermediaries DVDs
Scripting Motion capture
technology
Sound
design
Licensing (syndication
of broadcasts)
Film
Storyboardin
g
Machinima
(originating from the
gaming community)
Marketing (activities
to create public
awareness of the
forthcoming
production)
Gaming
devices
Voice
recording
Online animation tools
(Aniboom)
Wireless
platforms
Source: Interview2
The commercial leaders in the global industry are media conglomerates such as Disney
Company, News Corp., Sony Corp, and Viacom. These conglomerates invest in a broad
scope of industry segments, for example, animation software producers, independent
proprietary production houses, animation outsource service providers, as well as ancillary
media firms that provide distribution, marketing, merchandising, and licensing expertise.
Conglomerates have also moved quickly into new media. The table below illustrates
these investments.
1 Animator. Los Angeles-based production company. Interview. March 3, 2008
2 Animator. Los Angeles-based production company. Interview. March 3, 2008

196
Table 15.7 Sample Internet Interests of Conglomerates
Disney News Corp. Sony Corp. Viacom
ClubPenguin.com MySpace I Beam
Broadcasting
i Film
Jetix.tv IGN.com Gametrailers.com
Video.com Indya.com Nickelodeon
online
Source: Standard & Poor‘s (2007)1
At the heart of industry are production houses, for example, Aardman Animation,
DreamWorks Animation, Pixar, Lucasfilm, Sony Pictures Digital, and Wild Brain, which
operate as independent firms or subsidiaries to media conglomerates. Production houses
create feature films, cartoons, commercials, instructional videos, special effects, and
downloadable content for diverse communication platforms. These production houses
are noteworthy for their creative talent and proprietary software that generates unique
productions. Animated feature films identified in the table below experienced
commercial success globally.
Table 15.8 Sample Animated Feature Filmsure Films
Pixar Aardman Animation Sony Pictures Digital
Cars Wallace and Gromit Stuart Little
Finding Nemo Chicken Run Surf's Up
Toy Story Creature Comforts The Water Horse
Sources: http://www.pixar.com, http://www.aardman.com, http://www.sonypictures.com
Industry trends
The animation industry is increasingly competitive with more players in the market.
Labor costs are decreasing, technological innovation continues to move forward at a
rapid pace, and creativity remains a pivotal production factor for animation houses.
Animation houses develop animation products with merchandising, franchising, and
cross-platform distribution in mind. Firms are using a variety of strategies to compete,
for example, targeting market segments, concentrating on quality and turnaround time,
expanding into new distribution platforms, and seeking out new audiences abroad. Co-
production agreements continue to be an important means of entering new markets and
reaching new audiences. These strategies in conjunction with contemporary marketing
methods remain viable in today's global market.
Competition. Animation is an intensely competitive industry with low entry barriers due
to a profusion of animation technologies including off-the-shelf software and programs
hosted online. Low-cost labor supplies are expanding in emerging markets and reducing
production costs as well as outsourcing margins. Government subsidies in Canada,
Europe, the Philippines, the Republic of Korea, Malaysia, and Japan, increase the number
of animation houses operating in the global market. The threat of substitute products is
high, as an entertainment product, consumers can choose many other substitutes such as
1 Tuna Amobi, William Donald (September 20, 2007) Standard & Poor's Industry Surveys Movies & Home
Entertainment

197
sports, the performing arts, or consumer created entertainment posted on "YouTube".
New communication mediums are giving rise to new animation markets. Web-based
industries and mobile mediums offer new revenue streams in addition to traditional
motion picture, broadcast, and advertising purchasers. "The problem is the pie is getting
bigger, but the slices are getting smaller."1 Intense competition motivates firms to master
those aspects of the industry that influence success.
Labor costs, technology, and creativity are some of the main drivers in terms of cost,
structure, and profitability in the industry.
Labor. Animation is traditionally labor intensive. This element of the art propelled many
production companies to outsource labor intensive components of the production process
to low-cost labor markets. "More than 90% of animation for American films and
television shows is processed in Asia, mainly in Japan and South Korea."2 The firm IDT
Entertainment, for example, undertakes scripting and storyboarding in Los Angeles and
outsources "the laborious frame by frame execution of the animation itself."3 Another
firm handles the early creative work such as character development and story line and
uses animators in China, India, and South Korea to animate cartoons.
Establishment abroad. Animation houses are opening offices abroad to take advantage
of lower-cost production and flowering talent. For example, Lucasfilm established a
production studio in Singapore.4 With the growth of the Internet and emerging pools of
animation talent, firms are networking the production process with multiple houses in
multiple countries. "There is a growing pool of high-quality animators around the
world,"5 this combined with government incentives is reducing production costs and
outsourcing margins. The digital nature of much of the art allows a fluid process of
production that flows across many continents.
Technological innovation. Production technology has a substantial influence on the
industry in terms of cost, entertainment value, and visual acuity. A range of methods are
used to create animation from traditional drawing and cel animation to computer-
generated imagery (CGI) and motion capture technology. Off the shelf software
packages lower costs and help to level the playing field by reducing initial capital
investment. At the same time, successful animation houses do use laborious clay
animation and stop motion puppetry with interesting storylines to great effect.
There is a continuous drive for technological innovation in the industry to create new
animation spectacles. For example, Pixar developed proprietary software evolving with
each film in conjunction with an exceptional creative team to resounding success.6 As
another example, Digital Dream Studios has a "state-of-the-art pipeline for 3-D animation
1 Chris Grove (November 2005) "Bigger Pie, Smaller Slices" Animation Magazine Vol. 19, Iss. 11; p.34
2 Kathleen Kingsbury (February 11, 2008) "Fantasy League" Time Vol. 171, Iss. 6; p. 1.
3 Alan Deutschman, (December, 2005) "Attack of the Baby Pixar's" Fast Company No. 101 60-5
4 Kathleen Kingsbury (February 11, 2008)
5 Alan Deutschman (December 2005)
6 Standard & Poor's (February, 2008) Company Profile of The Walt Disney Company

198
production" using computer graphic imagery (CGI) and continuously develops
proprietary animation software.1
Animation houses use innovation in technology,
combinations of animation methods, in conjunction with exceptional talent to attract
audiences.
Creativity. Creativity in character and content remains a central aspect of animated
entertainment, "Strong stories and enduring characters are what make hits."2 Sony
Pictures ImageWorks identified "character animation as an essential component" of their
business according to their spokesperson. 3
Originality in character, storyline, and
animation techniques helps firms secure market share. Production studios are
commissioning original music scores and mixing animation methods to create original
productions that appeal to audiences.4 Animation houses that formerly relied on service
work are changing their strategies and concentrating on developing proprietary characters,
shows, and brands. Animation houses concentrate on creativity as a strategy to compete.
Original content. Animation houses face the challenge of creating and maintaining value
in an art that is becoming increasingly commoditized. Many emerging market firms are
turning away from a narrow business model focused on outsourcing to a model that
produces original content. With lower profit margins, animation houses work to maintain
control of their intellectual property rather than sharing exploitation rights with
broadcasters or investors. "You build the business by having rights, and not just for
primary, but for secondary and tertiary exploitation - the selling cycle can go on for a
long time." 5
Merchandising and licensing, for example, extends the profitability of the
original content. Animation houses consider how proprietary products can be licensed
for toys, games, clothes and additional entertainment vehicles, for example, live theater
productions.
Business value of intellectual property protection. Animation houses operating in
markets with intellectual property protection are able to create and sustain value from
their work. With intellectual property protection firms are able to secure long-term
income from their original productions as well as derivative products. "Licensing does
not simply generate income in a narrow sense in terms of royalties, but in most cases
increases the value of the IPR,"6 and subsidiary products. In addition, animation
production companies establishing abroad look for markets with an effective intellectual
property regime. Lucasfilm Animation "chose to operate in Singapore because of the
country's strict copyright laws and advanced legal system."7 IPR protection is important
to initial and long-term profitability of animation houses.
1 Business Korea (February 2001) "Box Report" Vol. 18, No. 2; p. 42.
2 Animation Magazine (February 2008) "Trend Spotting with Toon Execs" Vol. 22, No 2; p. 37
3 Animation Magazine (January 2007) "Company Town" Vol. 21, No. 1; p. 62-72
4 Claire Webb (January 2007) "Ain't Nothing like a Hound Dog!" Animation Magazine Vol. 21, No. 1 ; p.
42 5 Mark Solomons (May 1, 2001) "British Animation" Financial Times p. 8
6 Managing Intellectual Property (December 2002) "Rich Licensor, Poor Licensor" S 83
7 Kathleen Kingsbury (February 11, 2008)

199
Evolving income streams. Animation houses are paying close attention to evolving
revenue streams. For example, firms "license content to Internet sites [and] provide
content on a pay for download basis" via handheld devices.1 This is a burgeoning market
attracting a comprehensive distribution approach. "A key licensing trend…is that
properties are increasingly developed with more than one media sector in mind (licensing,
animation, online, mobile, etc.)"2 Creating content across several disciplines such as
feature films, TV animation, and video games is "the new world order in entertainment."3
Sample animation revenue streams:
character licensing
children's books
DVD sales
educational products
live theater production
medical illustrations
merchandise licensing for games, toys, clothes, etc.
mobile character downloads, wallpaper, clips, ring tones, interactive games
print comics
television cartoons
Co-production agreements. Animation houses use co-production arrangements to reach
export markets and expand into different market segments. For example, "Toei
Animation, Japan's oldest and largest animation house…signed a co-production
agreement with Walt Disney Television International" for an anime television series.4
DreamWorks Animation Inc. a leader in computer-generated images (CGI) animation is
collaborating with Activision a video games publisher.5 The Philippine Animation
Studio Inc. (Pasi) assigns co-production deals to the creative director who intentionally
includes senior artists at the outset of discussions to strengthen in-house capabilities and
absorb the most benefit from the international arrangement.6 Co-production agreements
are an important vehicle for exposing animation firms to different aspects of the market.
Attention to consumer segments. To remain competitive some animation houses focus
on consumer segments. For example, the main character of the cartoon "Atomic Betty"
appeals to girls 6-11 while keeping the attention of boys with two "strong boy sidekicks".
The story line also balances themes interesting to girls with those interesting to boys.7 As
another example, animators will appeal to a local taste for humor and story line "jokes
1 Tuna Amobi, William Donald (September 20, 2007) Standard & Poor's Industry Surveys Movies & Home
Entertainment 2 Karen Raugust (April 2006) "Crossing Borders" Animation Magazine Vol. 20, No. 4; p. 40
3 Kathleen Kingsbury (February 11, 2008)
4 Television Asia (December 2006) "Anime Expands Its Horizons" Vol. 13, Iss. 10; p. 86
5 Standard & Poor's (February, 2008) Company Profile of DreamWorks Animation Inc.
6 Christopher Harz (April 2002) "Playing with Pasi: a Studio with Heart" Animation Magazine Vol. 16, No.
4; p. 34 7 Chris Grove (November 2005)

200
that are funny in Canada may be met by a bemused smile in Hydrabad." 1
Therefore deft
knowledge of a local market's entertainment tastes and preferences can give a firm a
competitive advantage. Firms also concentrate on quality and turnaround time
particularly for those market segments, such as TV animation, which adhere to tight
schedules.2
Animation houses may cater to animation buyers, for example, pharmaceutical
manufacturers using animation to advertise their products. Animation houses offer
content to education companies. Heewon Entertainment, a Korean firm, created
"Element Hunter" the "show's characters are on a mission to find elements in the periodic
table and put them together into compounds."3 Animators may concentrate on special
effects for motion picture production or wallpaper and character downloads for mobile
phones. Concentrating on a market niche is one way of staying ahead in a fiercely
competitive market.
Regional styles. To attract global audiences, animation houses are using successful
animation approaches from different regions of the world. "DreamWorks Animation's
'Kung Fu Panda' embraces many Asian anime techniques, including held poses in action
sequences - instead of moving slowly, characters seem to freeze when punching or
kicking."4 "Kappa Mikey is the kind of show that supports our mandate to deliver our
global audience the best compelling entertainment available."5 The Chairman of Foothill
Entertainment asserts "we are finding good stories from a lot of different countries --
things have become very multicultural."6 Animation houses working to appeal to a
global audience incorporate popular styles from around the world.
Lessons from successful animation exporters
China has an emerging animation industry that is attentive to the primary aspects of the
market. For example, Chinese animation houses serve as low-cost leaders in animation
outsourcing. They compete with houses in the Philippines, India, and South Korea for
the outsource market. To attain a competitive edge in this intensely competitive
outsourcing market, Chinese animation houses can work to meet high standards of
quality, execution and timely delivery. They can avoid inconsistency in product and
missed deadlines. They can attain proficiency in a variety of animation techniques and
adapt to new technologies. Chinese animation houses can build a reputation as adept,
cost-efficient outsourcing houses.
Chinese animation houses also engage extensively in international co-production
arrangements "and are producing original programming for the international
1 Chris Grove (November 2005)
2 Kate Calder (January 2008) "Canadian Animation Studios Face Off Against Dollar Parity" KidScreen p. 8
3 Jocelyn Christie (October 2007) "KOCCA's 2007 Stars Shining Bright" KidScreen p. 48.
4 Jeremy Smith (May 29-June 4, 2006) "Anime Gives Kick in the Art" Variety Vol. 403, No. 2; p. A10
5 Ramin Zahed (April 2006) "A Sushi Out Of Water" Animation Magazine Vol. 20, No. 4; p. 37
6 Animation Magazine (February 2008) "Trend Spotting with Toon Execs" Vol. 22, No 2; p. 37

201
marketplace."1 The government allows private investment in the animation sector and
established 3 cartoon channels and 30 kids channels.2 Ensuring the benefits of an
effective intellectual property regime for creative and knowledge industries remains the
Achilles heel in the domestic market. Piracy rates in the DVD market are estimated at
95%.3 Such piracy rates in the domestic market inhibit the profitability of animation
firms. Recognition of the value of IPR to the growth and development of creative and
other knowledge-based industries in conjunction with public education may help lower
piracy rates.
The Japanese market offers Chinese firms an example of current labor issues in the
animation industry. In Japan, the animation industry lost many animators to the gaming
industry. Animators found more attractive salaries, rapid advancement, and better
apprenticeship opportunities in the gaming industry.4 As a result, Japanese animation
houses are now paying greater attention to the professional development of their labor
force. They are exposing staff to a variety of animation techniques, giving them
experience in pre-production activities, and ensuring a quality apprenticeship where new
skills are learned and mastered.5
Animation leaders offer Chinese firms examples of how to foster creativity. Firms
promote creativity by allowing animators to work on a variety of projects. Aardman
Animations based in the UK encourages animators to work on TV programming,
commercial production, and web and mobile film, "commercials feed the fire of talent,
and we encourage people to cross over between the divisions to keep things fresh"6 The
firm also encourages experimentation in all animation forms of "traditional clay, CGI,
and 2-D and 3-D media." 7
"Good writers, directors, and producers need time and access
to good projects to develop their skills," as well as opportunities to collaborate with a
talented pool of animators.8 In some markets training programs in animation separate
instruction in technical skills from instruction in creative skills resulting in competent
rather than creative animators. Animators can develop creativity by exposure to different
media and projects, collaborating with others skilled professionals, and unified education
programs.
The US market offers Chinese firms insight into management priorities. The commercial
success of animation houses is in part attributable to the management of the enterprise.
The leadership must in some instances secure financing, seek out partnership agreements,
determine appropriate derivative products and develop revenue streams. From an
1 Harvey Deneroff (November 2000) "East Asian Service Studios Hard-Hit by Downturn in US Production Due to Anime” Animation
Magazine Vol. 14, No. 10; p. 18 2 Television Asia (October 22, 2006) "Numbers Talk" Vol. 13, Iss. 8; p. 22
3 In-Store (April 12, 2007) "International News: Pirates Profit in China DVD Boom" Vol. 15
4 Japan Ministry of Economy, Trade and Industry (2005) "Japan Animation Industry Trends‖ Japan
Economic Monthly 5 Leo Lewis (March 1, 2007) "Companies International: Japanese Animation Produces Kamikaze
Cartoonists" Financial Times 6 Emma Hall (August 27, 2007) "A British Empire of Animation" Advertising Age Vol. 78, Iss. 34; p. 9
7 Emma Hall (August 27, 2007)
8 Asia Image (November 22, 2004) "A Work in Progress" Vol. 9, Iss. 10; p. 22

202
aesthetic perspective, management must foster a creative environment. Management
must also ensure continuing investment in technology, as proprietary software represents
a pivotal factor in the success of animation productions. Closing the "management gap"
with increased educational opportunities and internships with corporate partners is a high
priority.
Leaders of animation houses watch the industry's horizon. The leadership in the industry
tenaciously pursues opportunities with new communication platforms. Management also
attends to the scope of its audience. From a very early stage, animation houses in the US
maintained a global perspective on animation audience with regard to content and
distribution. ―Thirty-five of the top 50 movies in 2006 derived 50% or more of their
worldwide grosses from overseas attendance."1
Animation industry leaders also
determine how to manage each aspect of the business, particularly marketing and
intellectual property rights, which bear on the success of the animation production.
The major media conglomerates offer Chinese firms examples of contemporary
marketing methods. Disney is known for permeating retail and leisure outlets with
animated character toys, clothes, and games just before the release of a major production.
Entrepreneurial houses are using the Internet and specifically community groups to get
the word out about their productions. Awards ceremonies also offer an opportunity to
introduce audiences to exceptional productions. Animation houses in China can absorb
marketing techniques through their commercial agreements with leaders in the marketing
field.
Global leaders in the industry offer Chinese firms strategies to compete globally. In the
early phases of production, management contemplates financing vehicles, partnership
arrangements, as well as marketing strategies. They do consider the variety of
communication platforms and how to best leverage those for marketing, distribution, as
well as licensing. From a creative standpoint, leaders in the industry foster creativity and
technical skill by exposing animators to different technical tools and animation
productions. They keep in mind a global audience and rising popularity of regional styles.
They also consider the evolving preferences of distinct consumer markets for cartoons,
commercials, special effects, and feature films for example.
Global leaders have responded to competition with technological innovation and
penetration into the new mediums. Firms have taken opportunities to lower their labor
costs but at the same time recognized the need to properly reward and retain creative and
skilled animators. Leaders in the market also aggressively protect their intellectual
property and make use of merchandising and licensing to increase and extend IPR value.
Leaders in the industry pay close attention to evolving revenue streams from new media.
They exercise a number of strategies to collaborate with different players in the market
across the production chain.
1 Tuna Amobi, William Donald (September 20, 2007) Standard & Poor's Industry Surveys Movies & Home
Entertainment

203
The global animation industry is on the cusp of convergence of "content, technology and
services." The premier firm in the industry Walt Disney Co. which owns Pixar has
identified a corporate strategy to compete in the rapidly changing market. Walt Disney
Co.'s "top strategic priorities include creativity and innovation, international expansion,
and leveraging new technology applications...management [is] aggressively exploring
new avenues to offer its branded contents, characters and entertainment franchises across
emerging digital platforms such as a broadband and wireless, while making further
investments in other areas such as video games."1 Chinese firms can expand their
position in the market with improved management practices, increased creativity, greater
technological innovation, attention to professional development, and a strengthened
intellectual property protection regime.
1 Standard & Poor's (February, 2008) Company Profile of The Walt Disney Co.

204
Refereces Alan Deutschman, (December, 2005) "Attack of the Baby Pixar's" Fast Company No. 101 60-5
Animation Magazine (February 2008) "Trend Spotting with Toon Execs" Vol. 22, No 2; p. 37
Animation Magazine (January 2007) "Company Town" Vol. 21, No. 1; p. 62-72
Animator. Los Angeles-based production company. Interview. March 3, 2008
Asia Image (November 22, 2004) "A Work in Progress" Vol. 9, Iss. 10; p. 22
Asian Development Bank (March 2007) An Analysis of the Philippine Business Process Outsourcing
Industry
BBC Monitoring Asia Pacific (February 28, 2008) "China-EU Shipping Pact to Take Effect 1 March" p.1
Bernie Hart (January 2008) "Opportunities or Adversity for Global Supply Chains in 2008?" Logistics
Today http://www.logisticstoday.com
Bill Dibenedetto (October 29, 2007) "Gaining Ground" Journal of Commerce p. 1
Bill Snyder (March 13, 2008) InfoWorld "Cloud Computing Begins to Emerge from the Haze"
http://www.infoworld.com
Bizchina China Daily (May 4, 2006) "HK Could Boost Mainland in the Nation Industry" see
http://www.chinadaily.com.cn
Boeing (2007) Current Market Outlook http://www.boeing.com/
Business Korea (February 2001) "Box Report" Vol. 18, No. 2; p. 42.
Business Software Alliance (2006) Fourth Annual BSA and IDC Global Software Piracy Study
http://www.bsa.org/globalstudy
Business Wire (December 6, 2007) "Increasing Government Support for Transportation Infrastructure Aid
the Growth Of the Logistics Industry in China‖
BusinessWeek (November 16, 2007) "IBM, Yahoo!, and Google Are All Putting the Power of Cloud
Computing to Work. Here Is a Short Primer on How the Technology Works."
http//www.businessweek.com
CFO (October 2003) "The China Syndrome: US Companies Are Beginning to Outsource Technology R&D
to India and China. Will a Meltdown in Tech Jobs Follow?" Vol. 19, Iss. 13; p. 74
Chris Grove (November 2005) "Bigger Pie, Smaller Slices" Animation Magazine Vol. 19, Iss. 11; p.34
Christopher Harz (April 2002) "Playing with Pasi: a Studio with Heart" Animation Magazine Vol. 16, No. 4;
p. 34
Ciara Heavin, Brian Fitzgerald (2004) "Institutional Impact on the Development of an IT Industry: the Irish
Experience" Journal of Global Information Technology Management Vol.7, Iss. 4
Claire Webb (January 2007) "Ain't Nothing like a Hound Dog!" Animation Magazine Vol. 21, No. 1 ; p. 42
Claire Webb, (April 2007) "The Asian Connection: Facts & Figures" Animation Magazine Vol. 21, No. 4;

205
p. 20
Commission of the European Communities (October 10, 2007) Communication from the Commission to
the European Parliament, the Council, the European Economic and Social Committee and the Committee
of the Regions: an Integrated Maritime Policy for the European Union
Dylan Cathars (November 1, 2007) Standard & Poor's Industry Surveys Computers: Commercial Services
Economist Intelligence Unit Industry Wire Forecast (December 10, 2007) "India: Telecoms and Technology
Forecast"
Economist Intelligence Unit Industry Wire Forecast (January 29, 2008) "China: Telecoms and Technology
Forecast"
Emma Hall (August 27, 2007) "A British Empire of Animation" Advertising Age Vol. 78, Iss. 34; p. 9
Financial Times (March 4, 2008) "China to Merge Ministries in Government Revamp" http://www.ft.com
Harry Maurer, Cristina Linblad (November 26, 2007) "Animation Nation" Business Week Iss. 4060; p. 10
Harvey Deneroff (November 2000) "East Asian Service Studios Hard-Hit by Downturn in US Production
Due to Anime‖ Animation Magazine Vol. 14, No. 10; p. 18
Hollywood Reporter (January 14, 2007) "Drawing Attention: Seven Companies Leading the Way in
International Animation" Vol. 397, Iss. 43; p. 20
http://www.aniboom.com/
http://www.UN.org/law/
IDC Research Inc. (April 2007) Worldwide Services 2007-2011 Forecast: a Market in Transition
Industrial Development Authority (December 2007) Ireland Vital Statistics
In-Store (April 12, 2007) "International News: Pirates Profit in China DVD Boom" Vol. 15
International Monetary Fund (March 2007) "Can a Shift to Services Set the Philippines on a Stronger
Growth Path?" IMF Country Report Philippines: Selected Issues
Irish Software Association (2006) Annual Review 2005-2006
J. Bonasia (February 29, 2008) "Cloud Computing Initiatives Being Floated" Investor's Business Daily
Japan Ministry of Economy, Trade and Industry (2005) "Japan Animation Industry Trends‖ Japan
Economic Monthly
Jeremy Smith (May 29-June 4, 2006) "Anime Gives Kick in the Art" Variety Vol. 403, No. 2; p. A10
Jessica Twentyman (March 19, 2008) Financial Times "Linux Tries Not to Be a Victim of Its Own Success"
p.3
Jillian Hunter (July 2007) "Going Green on Land and Sea: What Is the European Industry Doing to Cope
with Rising Transport Energy Costs and Demands for Sustainability? Transport Vol. 49, Iss. 7; p. 34
Jocelyn Christie (October 2007) "KOCCA's 2007 Stars Shining Bright" KidScreen p. 48.
Joel Leahy (April 17, 2007) ―TCS Pushes into China to Set up an Eastern Hub" Financial Times

206
http://www.ft.com
John Gallagher (March 12, 2007) "Leveraging China" Traffic World p.1
Joseph Bonniy (March 10, 2008) "Follow the Leader" Journal of Commerce
Journal of Commerce (February 27, 2008) "Japan Post to Set up International Logistics Firm" p.1
K. Yatish Rajawat (December 4, 2004) "High Tech Companies Plug into Eastern Europe" Knight Rider
Tribune Business News
Karen Raugust (April 2006) "Crossing Borders" Animation Magazine Vol. 20, No. 4; p. 40
Kate Calder (January 2008) "Canadian Animation Studios Face Off Against Dollar Parity" KidScreen p. 8
Katherine Yung (August 21, 2005) ―Chinese Trade Strains Port System" Knight Rider Tribune Business
News
Kathleen Kingsbury (February 11, 2008) "Fantasy League" Time Vol. 171, Iss. 6; p. 1.
Kevin Kirkeby (December 27, 2007) Standard & Poor's Industry Surveys Transportation: Commercial
Larry Greenemeier (September 20, 2005) "IBM Launches Wireless Shipping Security" InformationWeek
http://www.informationweek.com
Leo Lewis (March 1, 2007) "Companies International: Japanese Animation Produces Kamikaze
Cartoonists" Financial Times
Logistics Today (October 2007) "Air Freight: UPS and Polar Two Expands Japanese Air Operations"
http://www.logisticstoday.com
Logistics Today (October 2007) "Los Angeles/Long Beach Require Truck Tags"
http://www.logisticstoday.com
Logistics Today (October 2007) "Transpacific Growth Sustainable, Rates Aren't." Vol. 48, Iss. 10. p.14
Logistics Today (September 2006) "How Much Does Port Congestion Costs? Bottlenecks add Costs That
Can Scuttle Any Companies Sourcing Strategy" Vol. 47, Iss. 9; p.10
Managing Intellectual Property (December 2002) "Rich Licensor, Poor Licensor" S 83
Mark Solomons (May 1, 2001) "British Animation" Financial Times p. 8
Mary Farquhar (May 2002) "Animation in Asia and the Pacific" The Journal of Asian Studies Vol. 61, No.
2; p. 678
McKinsey Global Institute (June 2005) The Emerging Global Labor Market: Part II - The Supply of
Offshore Talent in Services
McKinsey Global Institute (October 2005) Addressing China's Looming Talent Shortage
Mure Dickie (October 9, 2007) "Innovation: Research and Development Is Slow to Grow" Financial Times
http://www.ft.com
NeoIT (September 2005) Offshore Insights Market Report Series: "Research Summary: Mapping Offshore
Markets Update 2005" Vol.3, Iss.8.

207
Officer. Multinational Information Technology Services Firm. Interview. March 14, 2008
Organization of Economic Cooperation and Development (August, 2001) Regulatory Issues in International
Maritime Transport
Paul Page (March 12, 2007) "Reliable Service" Traffic World p.1
Perry Trunick (May 2006) ―Maritime's Antitrust Immunity Is Coming to an End" Logistics Today Vol. 47,
Iss. 5; p.1
Peter Leach, (September 10, 2007) "End of the Line" Journal of Commerce p. 1
Peter Tirschwell (June 11, 2007) "China's New Mantra: Rail‖ Journal of Commerce p.1
Peter Tirschwell (March 10, 2008) "Why Trucks May Sink Trade" Journal of Commerce p.1
Purchasing (October 9, 2003) "Ocean Shipping Industry Weather Is a Sea Change" Vol. 132, Iss. 5; p. 49
Ramin Zahed (April 2006) "A Sushi Out Of Water" Animation Magazine Vol. 20, No. 4; p. 37
Ritesh Gupta (October 1, 2007) "India Rising" Asia Image http://www.onscreenasia.com/article-927-
indiarising-onscreenasia.html
Robert Anderson (December 15, 2006) "Skilled Workers Fuel Investment" Financial Times
http://www.ft.com
Salesforce.com (March, 2008) "How We Got Here" http://www.salesforce.com
Sarah Gurman (April 2006) "By the Numbers" Animation Magazine Vol. 20, No. 4.
http://www.animationmagazine.net
Screen Digest (February 2007) "Animation Migrates from VHS to DVD: Slow Transition from Analog to
Digital Holds Lessons for Hi-def." Vol. 39 http://www.screendigest.com/
Screen Digest (July 2006) "Banner Year for European Animation: a Huge Chunk Out Of the Hitherto
Hollywood Dominated Market" Vol. 234 http://www.screendigest.com/
South Florida Sun Sentinel (February 15, 2008) "US Seeks to Cut Pollution from Foreign Ships" p. a. 9.
Standard & Poor's (February 23, 2008) Stock Report Google Inc.
Standard & Poor's (February, 2008) Company Profile of DreamWorks Animation Inc.
Standard & Poor's (February, 2008) Company Profile of The Walt Disney Company
Standard & Poor's (March 15, 2008) Stock Report Salesforce.com Inc.
Standard & Poor's (March 15, 2008) Stock Report Wipro Limited
Talasila Rao (July 3, 2005) "Inside the Chinese IT Services Business" Business Today p. 66
Television Asia (December 2006) ―Anime Expands its Horizons‖ Vol. 13, Iss. 10; p. 86
Television Asia (October 22, 2006) "Numbers Talk" Vol. 13, Iss. 8; p. 22

208
The Center for Strategy Research, Inc. (2007) Skills Gaps in the World's IT Workforce: A CompTIA
International Research Study
Tuna Amobi, William Donald (September 20, 2007) Standard & Poor's "Industry Surveys Movies & Home
Entertainment"
United Nations Conference on Trade and Development (2007) Review of Maritime Transport
Variety (September 25, 2006) "Media Locals Think Global" Vol. 404, Iss. 6; p.23
William Birdthistle (February 23, 2008) "Books: Burning Bright; How the Celtic Tiger Proved the
Begrudgers Wrong" Wall Street Journal p. w. 8
World Trade (March 2006) "What Business Leaders Need to Know about Pacific Maritime: As Trade
Volumes Hit New Highs, West Coast Ports add Capacity and Pay More Attention to the Environment" Vol.
19, Iss. 3; p. 40
World Trade Organization (2004) Trade Policy Review Republic of Korea Report by the Secretariat
World Trade Organization (2004) Trade Policy Review Singapore Report by the Secretariat
World Trade Organization (2007) International Trade Statistics
Yonhap (January 4, 2006) "South Korea to Inject Huge Funds into Animation Industry"
http://www.yonhapnews.net/engservices
Yuko Aoyama, Samuel J. Ratick (April 2007) "Trust, Transactions, and Information
Technologies in the US Logistics Industry" Economic Geography Vol. 83, Iss. 2.
Zaineb Bokhari (October 11, 2007) Standard & Poor's Industry Surveys Computers: Software

209
wb228215
N:\EU\AAA\FY09\China in Regional Trade Agreements (EW-P115366-ESW-BB)\trade book\trade book-en-90909.doc 9/11/2009 11:32:00 AM